Embed Size (px)
Citation preview

Svensk Kärnbränslehantering ABSwedish Nuclear Fueland Waste Management Co
Box 250, SE-101 24 Stockholm Phone +46 8 459 84 00
R-14-17
Site Engineering Report – SER – Projekt SFR utbyggnad
Anders Carlsson, Carlsson GeoEngineering AB
Derek Martin, University of Alberta
Rolf Christiansson, Svensk Kärnbränslehantering AB
October 2014

Tänd ett lager: P, R eller TR.
Site Engineering Report – SER – Projekt SFR utbyggnad
Anders Carlsson, Carlsson GeoEngineering AB
Derek Martin, University of Alberta
Rolf Christiansson, Svensk Kärnbränslehantering AB
October 2014
ISSN 1402-3091
SKB R-14-17
ID 1365267
A pdf version of this document can be downloaded from www.skb.se.

SKB R-14-17 3
Summary
SKB is designing the extension of the SFR and will apply the European standard for construction, Eurocode, and in particular the standard for geotechnical design, Section 2.7 in Eurocode SS-EN 1997-1:2005. The design strategy is steered by requirements related to nuclear safety and radiation protection, environmental impact, workers safety and industrial welfare and quality, flexibility and cost efficiency. In situations where calculation models are not available or not necessary, prescriptive measures may be used as the basis for design. These involve conventional and generally conservative empirical design rules, and attention to specification and control of materials, workmanship, protection and maintenance procedures.
This Site Engineering Report (SER) synthesises the geo-scientific information contained in the Site Descriptive Model (SDM-PSU) with previous construction experiences from the Forsmark Power Plant and the existing SFR facilities. The major objectives of the Site Engineering Report are to: (1) present an engineering description of the rock mass for the design of the underground openings and repository layout, (2) establish engineering parameters for the rock mass that should be used in the repository design and layout, and (3) highlight issues that require special attention during the repository design and layout.
The design of the SFR layout should consider the following:
• The new facility should occupy as minimum a footprint area as practical and be located as close to the existing SFR as feasible.
• The alignment of the new caverns axis shall be consistent with the alignment of the caverns in the existing facility.
• The depth of the roof of the highest cavern in the repository is set at around –120 m.
• The width of the pillars separating the caverns shall be kept to a practical minimum.
• It is not possible to eliminate the risk for encountering water bearing fractures. The Designer should be aware of this risk and ensure that the design addresses this issue.
• The access tunnel will intersect the Singö Deformation Zone at about the same spatial location as the two existing SFR access tunnels, but slightly deeper. The Designer should review and evaluate the excavation and support methodology used in the existing access tunnels, and incorporate modern construction, support and grouting techniques.
In all underground design and construction, uncertainties with regard to site conditions must be anticipated. The uncertainties that will influence the final layout are the spatial location and the variability of the geological setting and the rock mass response to excavation, rock support and grouting measures. These uncertainties and the scale of the repository volume emphasize that the methodology used to adapt the final layout of the facility to the site conditions must be integrated with the construction activities required to develop the layout of the new SFR facility. The methodol-ogy that SKB will use for adapting the layout of the facility to the site conditions is based on the Observational Method.

SKB R-14-17 5
Sammanfattning
SKB projekterar en utbyggnad av SFR och kommer att tillämpa den europeiska standarden för byggande, Eurocode, och i synnerhet standarden för geoteknisk design, avsnitt 2.7 i Eurokod SS-EN 1997-1:2005. Designstrategin styrs av krav i samband med kärnsäkerhet, strålskydd, miljöpåverkan, arbetsmiljön och industriell välfärd och kvalitet, flexibilitet och kostnadseffektivitet. I situationer där beräkningsmodeller inte är tillgängliga eller inte bedöms nödvändiga kan hävdvunna metoder användas som grund för designen. Detta omfattar konventionell och allmänt konservativ design och speciellt beaktande av specifikationer, och kontroll av material, utförande, skydd och underhåll.
Denna Site Engineering Report (SER) syntetiserar den geovetenskapliga informationen i den platsbeskrivande modellen (SDM-PSU) med erfarenheter från tidigare byggverksamhet i området, Forsmarks kraftstation och den befintliga SFR-anläggningen. Syftet med SER-rapporten är att: (1) presentera en bergteknisk beskrivning av bergmassan för utformingen av bergutrymmena och förvarets layout, (2) fastställa tekniska parametrar för bergmassan som bör användas i förvarets design och layout, och (3) lyfta fram frågor som kräver särskild uppmärksamhet under förvarets design och layout.
Utformningen av SFR-layouten bör överväga följande:
• Den nya anläggningen bör ha minsta möjliga anläggningsyta och placeras så nära det befintliga SFR som möjligt.
• Orienteringen av bergrummen skall vara densamma som orienteringen av bergrummen i den befintliga anläggningen.
• Ur byggnadsteknisk synpunkt har anläggningsdjupet satts till ca 120 m (från taket på det högst liggande bergrummet).
• Bredden på pelarna som separerar bergrummen skall hållas på ett praktiskt minimum.
• Det är inte möjligt att eliminera risken för att påträffa vattenförande sprickor. Designern skall vara medveten om denna risk och försäkra sig om att denna fråga kommer att ingå i designen.
• Tillfartstunneln kommer att skära Singö deformationszon vid ungefär samma rumsliga läge som de två befintliga tillfartstunnlarna, men något djupare. Designern skall se över och utvärdera berguttags- och förstärkningsmetodik, som använts i de befintliga tillfartstunnlarna och införliva modern bygg- förstärknings- och injekteringsmetoder.
I all design- och byggverksamhet måste osäkerheter förväntas, när det gäller lokala förhållanden. De osäkerheter som kommer att påverka den slutliga layouten är rumslig lokaliseringen och variationen i geologiska egenskaper och bergmassans respons på berguttag, bergförstärkning och injektering. Dessa osäkerheter och omfattningen av förvarets volym betonar att den metodik som använts för att anpassa den slutliga layouten till platsens förhållanden måste integreras med de bygg-aktiviteter som krävs för att bygga den nya SFR-anläggningen. Den metodik som SKB kommer att använda för att anpassa anläggningens layout till platsförhållandena bygger på observationsmetoden.

SKB R-14-17 7
Contents
1 Introduction 91.1 Proposed SFR Extension 91.2 Existing SFR 91.3 Objectives 101.4 Data used for this report 111.5 Terminology 13
2 Design strategy 152.1 Methods 15
2.1.1 Design by calculations 152.1.2 Design by prescriptive methods 162.1.3 Observational method 16
2.2 Design milestones 16
3 Tentative Layout of SFR Extension 17
4 General rock mass conditions 194.1 Intact rock 20
4.1.1 Rock types 204.1.2 Alteration 224.1.3 Strength and mechanical properties 24
4.2 Discrete fracture properties 254.3 Rock mass characteristics 25
4.3.1 Ductile deformation 254.3.2 Brittle deformation 27
4.4 Deformation zones 284.4.1 Within the Central Block 294.4.2 Singö Deformation Zone 304.4.3 Mechanical properties 32
4.5 In situ stress 324.6 Hydraulic properties and fracture flow 32
4.6.1 Transmissivity distribution along boreholes 324.6.2 Shallow Bedrock Aquifer (SBA) 334.6.3 Repository level HRD (between –60 and –200) 354.6.4 Hydraulic conditions encountered in the existing SFR 38
4.7 Groundwater composition 394.8 Inflow observations and transmissivities during the construction of the
existing SFR 40
5 Ground types: Behaviour, rock support and grouting 495.1 General 495.2 Ground types 505.3 Ground behaviour 545.4 Support types 545.5 Grouting Types 555.6 Variability and uncertainty in key parameters 55
6 Design constraints 576.1 Geotechnical design 57
6.1.1 Design methodology 576.1.2 Detailed design 576.1.3 Observational Method 57
6.2 Siting 586.2.1 Central Block 586.2.2 Repository Depth 58

8 SKB R-14-17
6.3 Access tunnel 596.3.1 Singö Deformation Zone 59
6.4 Repository area 596.4.1 General Conditions 596.4.2 Cavern-pillar width 606.4.3 Cavern Alignment 61
6.5 Monitoring and documenting the performance of underground excavations 616.6 Permanent ground support 62
7 References 63
Appendix A Tunnelling through the Singö Deformation Zone 65
Appendix B Hydraulic conditions in the existing SFR 73

SKB R-14-17 9
1 Introduction
1.1 Proposed SFR Extension SKB is currently carrying out an assessment of the future extension of the final repository for low and intermediate level radioactive waste, SFR (Figure 1-1). SKB has started the work for the permit application of an extension of the SFR implying that SFR will constitute a final repository for both operation and decommissioned waste. The extent of the extension depends on the size of waste volumes to be disposed in the final repository. The decisive elements are (1) the amount of radioactive operation waste to be delivered to SFR, and (2) the amount and degree of processing of the radioactive waste which arises during the dismantling of the nuclear power plants.
The extension of the SFR is planned to be built over approximately 5 years. While excavation works are performed, the ordinary operations of the SFR continue, although at a reduced rate. When SFR extension is completed, it will be fully incorporated with the existing facility and the facility will work as one unit with merged systems. Designed lifetime with normal operating and maintenance work is 100 years.
1.2 Existing SFRIn 1980, SKB started the planning of the SFR in 1981. In June 1983, the Swedish Government granted the Swedish Nuclear Fuel and Waste Management Company (SKB) a license to build and operate a facility to be known as the SFR for the final disposal of low and intermediate level reactor waste from all the Swedish nuclear power plants. SKB commissioned the Swedish State Power Board (Vattenfall) to plan, design and build SFR. The underground excavation works started in October 1983, and was finalised in May 1986. The repository was designed and built for an exten-sion, if that would be needed.
Figure 1‑1. View of the existing SFR (grey shades) and the planned extension (blue shades). Reference layout L1.5 The regional deformation zones, Singö Deformation Zone ZFMWNW001) and Zone 8 (ZFMNW0805A) are faintly outlined in the figure (cf. Figure 4‑13).

10 SKB R-14-17
The total time for completion of the first phase of the SFR – i.e. the time from the start of the planning and design work until disposal of the waste could begin – was seven years. The first phase of the SFR was commissioned in 1988. Work on a detailed testing programme and safety studies was being carried out concurrently with the construction and excavation work. The total cost of the first phase of the SFR amounted to about 740 MSEK of which 75% represents the cost for civil works (rock excavation 24%, other civil works 26%, installation and vehicles 29% and management, supervision etc. 21%). The costs are quoted at 1988 prices.
The SFR rock caverns are built under the sea, about 1,000 m from Forsmark harbour. The rock cover is approximately 60 to 65 m from the top of the caverns to the seabed. The lowest level of the repository comprising the bottom of the silo and a rock drainage basin is located about 140 m below seabed. The two parallel, about 1,000 and 1,200 m long access tunnels run at an inclination of 1:10 (except for the first 300 m), beginning at the open cut at Österblänkarna and ending about 50 below the sea bed. The theoretical cross-sectional areas of the tunnels are 48 m2 (construction tunnel) and 64 m2 (operation tunnel). The various rock caverns in the repository are linked to each other by a tunnel system (Figure 1-1). The cross-sectional area of these tunnels varies from 50 to 80 m2. Four rock caverns were excavated in the first construction phase. Each is 160 m long and varies in width from 14 to 20 m; and in height, from 10 to 19 m. The cross-sectional area of the largest cavern is approximately 320 m2. The silo has a height of 69 m and a diameter of 30 m. The layout of the facil-ity has proved to be successful by giving a logical and a well-arranged plant with a good possibility for extension.
The design of the rock caverns and the silo was generally kept unmodified with only minor modi-fications during the planning and the construction phases, and this lead to a smooth and relatively speedy detailed design. The siting in level of the repository caverns was, however, adjusted to the results of the supplementary drilling investigations. The length and the cross-sections of the rock caverns were somewhat adjusted, mainly with respect to the equipment for handling of the waste packages, but the layout of the silo was kept unmodified. In spite of the fact that the access tunnels became shorter in length, the repository area could be lowered and the rock cover was thereby increased, resulting in better rock quality and most probably less water inflow. The lowering was limited to 6 m (a lowering up to 20 m was possible) depending on an expected sub-horizontal zone (zone H2) with inferior rock quality below the bottom of the silo. When the zone was encountered in the lower rock drainage basin and in the gable of the lower construction tunnel, heavy water inflow occurred. The dip direction of the zone did not influence the silo at all. The result of exploratory drillings showed that the zone was situated at a safe distance below the bottom of the silo, and in addition it decreased rapidly in thickness to finally disappear below the centre of the silo. Detailed information on construction experiences from SFR is given in Carlsson and Christiansson (2007).
1.3 ObjectivesThe main purpose of this Site Engineering Report (SER) is to provide an overall framework for the Designers responsible for the underground design and layout of the SFR Extension Project that meets the operational requirements for such an underground facility.
The Site Engineering Report (SER) builds on the investigations carried out at the Forsmark site and the interpretation and evaluation of these data that are given in the Site Descriptive Model (SDM-PSU) (SKB 2011). This report (SER) synthesises the geo-scientific information contained in the SDM with previous construction experiences from the Forsmark Power Plant and the existing SFR Facilities. The major objectives of the Site Engineering report are to:
1. Present an engineering description of the rock mass for the design of the underground openings associated with the repository.
2. Establish geological engineering parameters for the rock mass that should be considered in the repository design and layout.
3. Highlight design and layout issues that require special attention.

SKB R-14-17 11
1.4 Data used for this reportThe open cut excavations and the underground excavations for the three units of the Forsmark Power Plant and for the existing SFR were carried between 1972 and 1986. The construction area of the facilities is about 8 km2 (Figure 1-2). In total, about 1.2 million cubic meters of rock were excavated of which about 775,000 m3 refer to underground excavations. The total length of tunnels is approximately 11,000 m of which about 4,000 m is assigned to the existing SFR. The underground excavations at Forsmark are located between 50–140 m below sea bottom. Carlsson and Christiansson (2007) compiled the excavation, grouting and support experiences from the underground works carried out at Forsmark.
Figure 1‑2. Overview plan of the construction area at Forsmark showing the locations of the nuclear power units, the two sub‑marine discharge tunnels and the existing SFR.
0 500 1 000250 meter
G:\skb\gis\S
FR\A
rcprojekt\forsmark_sit-plan_tunnlar_20121030_0900.m
xd
Base maps © LantmäterietSKB/swecoub 2012-10-30 10:41
SFR
Tunnels
Öregrundsgrepen
Forsmark nuclear power plant

12 SKB R-14-17
The Site Descriptive Model (SKB 2011) is based on information compiled from three different investigations.
1. Investigations prior to and during the construction of the existing SFR facility, from 1980 to 1986, and the following monitoring programme of geo-scientific parameters. This includes investigations for the construction of discharge tunnels from unit 1–2 and unit 3 of the Forsmark nuclear power plant. During the initial investigation phases, during 1980 to 1983, surface boreholes were drilled from offshore platforms, ice-cover, and land. During the SFR construction phase, from 1983 to 1986, subsurface boreholes were drilled from underground openings and access tunnels. In addition, there are extensive geological information from the SFR access tunnels and underground openings (Christiansson and Bolvede 1987).
2. The site investigation at Forsmark for the Final repository for spent fuel, which was undertaken from January 2002 to March 2007, along with associated monitoring of geo-scientific parameters and ecological objects.
3. Pre-investigations for the planned SFR extension were carried out from April 2008 to January 2010.
Totally, 60 cored boreholes were drilled, including the recent pre-investigations. Figure 1-3 shows the locations of the boreholes from the different stages. All the boreholes drilled during the site investigations for the existing SFR are sealed, while the boreholes drilled for the SFR extension are part of a monitoring programme.
Figure 1‑3. Map visualising the borehole coverage within the model area showing the horizontal component of inclined boreholes. Boreholes are colour coded after investigation project/period. Cored boreholes (KFRXX) are solid colour; percussion (HFRXX) boreholes have black dots. (SKB 2011, Figure 2‑1).
!!
!! !!
!!
!!
!!!!!!!!
!!
!!
!!
!!
!!
!!
!!
!!
!! !!!!!!
!!
!!
!!!!
!!!!
!!
!!!!
!!
!!
!!
!!
!!
!!
!!
!!
!! !!
!!
!!
!!!!
!!
!!
!!!!
!!
!!
!!
!!
!!
!!
!!
!!
!!
!!
!!
!!
!!
!!
!!
!!
!!
!!
!!
!!!!
!!
!!!!
KFR105
KFR104
KFR102A
KFR1
01
HFR106
HFR1
05
KFR
103
KFR
106
KFR102B
HFR101
KFR27HFR102
KFM11A
HFM
35
HFM
34
720 m
0 250 500125 MeterExisting SFR, surface investigations (1980-1983)
Existing SFR, underground constructions (1983-1986)
SDM-Site Forsmark, surface investigations (2006)
SFR extension, surface investigations (2008-2009)
SFR extension, underground investigations (2009)
Low-magnetic lineament
G:\skb\gis\SFR
\Arcprojekt\forsmark_m
odellomr_borrhal_lineam
ent_20110531_1900.mxd
Bakgrundskartor © LantmäterietSKB/swecoub 2011-12-05 11:04

SKB R-14-17 13
1.5 TerminologyThe site descriptive model may use terms that are not generally used in underground engineering or have restricted definitions. A brief summary of these terms, taken from Section 1.6 of SDM-PSU Forsmark, is provided below.
Fracture (broken, unbroken, sealed, open and partly open)
A natural break in the rock. In drill cores, there are broken and unbroken fractures, depending on whether the core is split or not. Broken fractures include both open fractures and originally sealed fractures which were broken during the drilling or the following treatment of the drill core.
Crush zone Shattered rock with a very high frequency of open fractures.Sealed fracture network
In drill cores, a length interval where the intensity of sealed fractures is too high and/or where the fractures are too irregular to allow mapping of individual fractures.
Deformation zone Deformation zone is a general term that refers to an essentially 2D structure along which there is a concentration of brittle, ductile or combined brittle and ductile deformation. Brittle deformation zones generally consist of one or several zones of crushed and/or intensely fractured material (core zones) surrounded by zones of fractured and/or hydrothermally altered rock (damage zones). Deformation zones at Forsmark are denoted ZFM followed by two to eight letters or digits. An indication of the orientation of the zone is included in the identification code (e.g. ZFMNNW1209).
Possible deformation zone
Possible deformation zone (often labelled PDZ) is a term used by SKB to designate structures observed in boreholes which possess deformation-zone-type properties and thus may represent deformation zones in 3D. classes: high, medium and low.
Tunnel deformation zone
A tunnel deformation zones (often labelled tDZ) refer to structures with a concentration of brittle deformation (i.e. fracture zones) that are presented in drawing −103 by Christiansson and Bolvede (1987).
Rock unit A rock unit is defined in single-hole interpretation on the basis of the composition, grain size and inferred relative age of the dominant rock type.
Rock domain A rock domain refers to a rock volume in which rock units that show specifically similar composition, grain size, degree of bedrock homogeneity, and, to some extent, degree and style of ductile deformation have been combined and distinguished from each other. Different rock domains in the SFR local model volume are referred to as RFRxxx.
Southern boundary belt
A group of deformation zones including the regionally dominant Singö deformation zone (ZFMWNW0001) that define the southern boundary of the SFR Central Block. The belt consists of ZFMWNW0001 along with ZFMWNW0813, ZFMWNW3259, ZFMNW0002 and, to a lesser extent, ZFMWNW1035. In the SFR area, these zones merge to comprise a complex broad deformation “belt” of concentrated ductile and brittle deformation. The belt has an overall thickness of c. 200–400 m and a length of over 30 km.
Northern boundary belt
Deformation zone ZFMNW0805A and a smaller splay ZFMNW0805B that can be said to define the northern boundary of the SFR Central Block. It has a similar orientation and character as the Southern boundary belt, but is much smaller with a length of between 3 and 4 km and a thickness of c. 50–100 m. On a larger regional scale, it is probably a splay from the main Singö deformation zone. It has the same sequence of ductile deformation followed by brittle reactivation that is seen in the Southern boundary belt.
Central block A tectonic block that is bounded to the northeast and southwest by two broad belts of concentrated ductile and brittle deformation. The Central block is less affected by deformation than the bounding belts.

SKB R-14-17 15
2 Design strategy
SKB plans to carry out the design process for the extension of SFR in agreement with the European standard for construction, Eurocode, and in particular the standard for geotechnical design, Section 2.7 in SS-EN 1997-1:2005.
The following laws with underlying regulations shall in particular be considered in the design, construction and continuous operation of the facility:
• Nuclear Activities Act, KTL (SFS 1984:3).
• Radiation Protection Act, SSL (SFS 1988:220).
• Swedish Environmental Law, MB (SFS 1998:808).
• Planning and Building Act, PBL (SFS 2010:900).
• The Work Environment Act, SFS (1991:677).
The design strategy is steered by requirements related to nuclear safety and radiation protection, environmental impact, workers safety and industrial welfare and quality, flexibility and cost efficiency. The geo-scientific results from the site investigations together with other nearby under-ground experiences, in particular the existing SFR facility, are the prime input for the design tasks. These results are concluded in this Site Engineering Report (SER).
2.1 MethodsThe SER has a structure that follows the principles of the National Annex to SS-EN 1997-1:2005, Geotechnical Design, Documentation, Design Memorandum (IEG 2008).
2.1.1 Design by calculations While much of the design can be completed using prescriptive methods and/or Observational Method, in some situations the design will need to be verified by calculations. The design for the passing of the Singö fault zone will likely require calculations.
Design by calculation shall be in accordance with the fundamental requirements of EN 1990:2002 and with the particular rules of this standard. Design by calculation involves:
• Actions, which may be either imposed loads or imposed displacements, e.g. from ground movements.
• Properties of soil, rocks and other material.
• Geometrical data.
• Limiting values of deformations, crack widths, vibrations etc.
• Calculation models.
The calculation model shall describe the assumed behaviour of the ground for the limit state under consideration. If an empirical relationship is used in the analysis, it shall be clearly established that it is relevant for the prevailing ground conditions. In problems of ground-structure interaction, analyses should use stress-strain relationships for ground and structural materials and stress states in the ground that are sufficiently representative, for the limit state considered, to give a safe result.

16 SKB R-14-17
2.1.2 Design by prescriptive methodsIn design situations where calculation models are not available or not necessary, exceeding limit states may be avoided by the use of prescriptive measures. These involve conventional and generally conservative rules in the design, and attention to specification and control of materials, workman-ship, protection and maintenance procedures. Design by prescriptive measures may be used where comparable experience1 makes design calculations unnecessary. It may also be used to ensure durability e.g. against chemical attack, for which direct calculations are not generally appropriate.
2.1.3 Observational methodIn all underground design and construction, uncertainties with regard to site conditions must be anticipated. The uncertainties that will influence the final layout are the spatial location and the variability of the geological setting and the rock mass response to excavation, rock support and grouting measures. These uncertainties and the scale of the repository volume emphasize that the methodology used to adapt the final layout of the facility to the site conditions must
be integrated with the construction activities required to develop the new SFR facility. The method-ology that SKB will use for adapting the layout of the facility to the site conditions is based on the Observational Method (OM) (Peck 1969).
The scope of the design tasks will be primarily limited to the following five requirements of the Observational Method stated in SS-EN 1997-1:2005, Section 2.7:
1. Acceptable limits of behaviour shall be established2. The range of possible behaviour shall be assessed and it shall be shown that there is an acceptable
probability that the actual behaviour will be within the acceptable limits.3. A plan for monitoring the behaviour shall be devised, which will reveal whether the actual
behaviour lies within the acceptable limits. The monitoring shall make this clear at a sufficiently early stage, and with sufficiently short intervals to allow contingency actions to be undertaken successfully.
4. The response time of the monitoring and the procedures for analysing the results shall be sufficiently rapid in relation to the possible evolution of the system.
5. A plan of contingency actions shall be devised which may be adopted if the monitoring reveals behaviour outside acceptable limits.
The Observational Method has several caveats. One must be able to define an action plan for every possible adverse condition based on current site understanding. The method cannot be used if a predictive model for the behaviour cannot be developed, i.e., one must be able to establish a model that can calculate the parameters that will subsequently be monitored during construction. This is not a trivial problem as often we can measure what we cannot calculate and vice versa. This means that the monitoring plan must be chosen very carefully with a good understanding of the significance to the problem.
2.2 Design milestonesThe design process is divided into three main stages: (1) Feasibility stage, (2) System design stage, and (3) Detailed design stage. The work during the system design is done stepwise with the mile-stones layout L0, L1 and L2. The system design is finalized when the complete documentation of layout L2 is delivered, whereas layout L0 and Ll represents increasing degrees of maturity during the system design phase.
Layout 2 forms a part of the documentation to be included in the permit application (according to the Swedish Environmental Code and the Nuclear Activities Act).
1 Documented or other clearly established information related to the ground being considered in design, involving the same types of rock and for which similar geotechnical behaviour is expected, and involving similar structures. Information gained locally is considered to be particularly relevant.

SKB R-14-17 17
3 Tentative Layout of SFR Extension
The extension of the SFR will be constructed west of the existing SFR at a depth of approximately –120 m (c.f. Figure 3-1). The risk of interference on the existing facility, by construction activities, has been preliminary evaluated. There is however a need for updating such risk assessment during the detailed design phase with respect to installations such as electrical supply, monitoring and ventilation systems. The need for physical separation between construction works and the operation of the existing facility will be defined in a later stage. Any constraints related to the existing facility, e.g. vibrations, risk for deformations shall be defined in the detailed design phase.
For the transport of reactor vessels down to the new rock cavern for storage, a new open cut is to be made on the Stora Asphällan from where a new approximately 1.1 km long tunnel will be excavated, parallel to the existing construction tunnel. The new tunnel will be used as a transport route for the extension work in addition to the reactor vessel transport. The rock excavation work of the SFR extension will comprise five rock caverns for low-level waste, one rock cavern for intermediate-level short-lived waste, and one rock cavern for storage of all reactor tanks. In addition to this, transport tunnels and a separate tunnel for technical installations, electrical and ventilation will be constructed.
The rock caverns for waste storage have access from both ends in the same way as the existing facility. Overall, the design of the extension is logistically similar to the existing facility. The main differences are the design of tunnels and rock cavern required for the reactor vessels. Preliminary and approximate cross sections, lengths and rock volumes are given in Table 3-1. The area of the rock mass where the rock caverns with waste will be placed, is expected to have an area of about 200 m × 300 m . An intermediate storage of excavated rock masses is planned to be carried out on the mainland in coordination with the construction of the Final Repository for Spent Fuel.
Table 3‑1. Approximate rock volumes (cubic solid) of the various rock openings in layout stage L1.5 (cf. Figure 3‑1).
Tunnels Volume (m3) Cross section (m2) Length (m)
1RTT Transport tunnel – reactor vessels 188,344 102 1,6802DT Operation tunnel 2 75,915 90 8552BST Rock cavern tunnel 2 21,600 90 2402TT Cross tunnel 2 17,630 77 2291TIT Technical installation tunnel 25,650 90 2851–6UT Escape tunnel 1 to 6 5,640 40 1411–6IN Access tunnel 1 to 6 (1–2,958) + 5,100 (1–102) + 68 (1–29) + 752NDB Lower drainage basin 2 (at entrance 255)
+ 3,220(at entrance 85 m) + 161
(at entrance 3 m) + 20
3NDB Lower drainage basin 3 (at entrance 255) + 3,220
(at entrance 85 m) + 161
(at entrance 3 m) + 20
2ÖDB Upper drainage basin 2 24 8 32FS Junction shaft 2 504 24 213FS Junction shaft 3 1,677 39 434–10GS Cut off 4 to 10 7,102 (not valid at shaft) 67 106
Buildings1RKB Radiology control building 7,011 171 412EB Transforming building 2,040 102 204VB Ventilation building 4,325 173 255VB Ventilation building 5 4,325 173 25
Repository openings1BRT Rock cavern for reactor vessels 1 38,640 184 2102BMA Rock cavern for medium short-lived waste 2 79,980 + 5,644 310 + 332 258 + 172BLA Rock cavern for low level waste 2 60,742 + 5,904 242 + 246 251 + 243BLA Rock cavern for low level waste 3 60,742 + 5,904 242 + 246 251 + 244BLA Rock cavern for low level waste 4 60,742 + 5,904 242 + 246 251 + 245BLA Rock cavern for low level waste 5 60,742 + 5,904 242 + 246 251 + 24Total rock volume (cubic solid) 767,643

18 SKB R-14-17
Figure 3‑2. The SFR extension showing the designations of the various rock caverns in the repository areas. See also Table 3‑1.
Figure 3‑1. SFR extension. Layout stage L1.5.
SKB R-14-17 19
4 General rock mass conditions
The detailed characteristics of the rock mass are provided in the Site Descriptive Model (SDM) (SKB 2011). In this section a brief summary of those characteristics are given and the observations and experience gained from the constructing of the existing SFR are provided for reference and comparison.
Four rock domains (RFR01–RFR04) have been recognised in the SDM local SFR model volume (Figure 4-1). These rock domains have been established using the criteria summarised in Table 4-1. The concept of rock domains provided in the SDM was not employed during the construction of the existing SFR. Nonetheless the rock domains used in the SDM provides a means of associating the characteristics of the rock mass in the site descriptive model to a spatial volume.
Figure 4‑1. Three dimensional model view from east showing the boundaries between the four rock domains within the local SFR model volume relative to the borehole geology and the geometry of the SFR underground facility. The colour choice is only for legibility, where boundary RFR01–RFR02 is pinkish brown, RFR02–RFR03 violet and RFR03–RFR04 yellow. (SKB 2011, Figure 5‑11).

20 SKB R-14-17
Table 4‑2. Major rock groups and the character of individual rock types in the SFR model volume (SKB 2011, Table 5‑1).
Rock groups Rock types
SKB code Composition, grain‑size and occurrence
All rocks are affected by brittle deformation. The fractures generally cut the contacts between different rock types, though the ductile structural character excerts strong control on the fracture pattern in certain rocks.
Group D Majority affected by deformation and metamorphism.111058 Fine- to medium-grained granite, with a general low content of ferromagnesian minerals
(< 5 vol.%). A spatial association with pegmatitic granite is noted locally. Typically weakly developed linear mineral fabric, and locally a planar mineral fabric. However, there are occurrences that are strongly discordant to the structural trend in their older host rocks.
101061 Pegmatite and pegmatitic granite, generally highly variable grain-size. The rocks occur as segregation veins or pods, irregular bodies and dykes, with highly variable relationship to the ductile deformation. Some occurrences are tightly folded and concordant to the structural trend in their older host rocks, whereas others are distinctly discordant. Most exposed bod-ies of pegmatitic granite have been affected at least to some degree by ductile deformation.
Group C Affected by penetrative ductile deformation under lower amphibolite‑facies metamorphism.101051 Fine- to medium-grained granodiorite, tonalite and subordinate granite. Scarce in the model
volumes. Intruded after some ductile deformation in the older rock groups.
Group B Affected by penetrative ductile deformation under amphibolite‑facies metamorphism.101057 Fine- to medium-grained metagranodiorite (to granite) with a moderately to strongly
developed planar, and to some extent linear, mineral fabric. Characterised by a texture of stretched, monomineralic domains and content of ferromagnesian minerals ranging up to 10 vol.%.
102017 Amphibolite, forming irregular shaped occurrences as well as dyke-like bodies that are elon-gate following the the structural trend of the host rocks. The majority are fine-grained and the rock type includes virtually all mafic rocks in the SFR area, regardless of their structural and textural character. Minor occurrences and the margins of larger bodies display a distinct mineral fabric, whereas the more central parts of larger bodies are typically massive.
Group A Affected by penetrative ductile deformation under amphibolite‑facies metamorphism.103076 Felsic to intermediate metavolcanic rock, locally with a compositional banding. Since the
rock is affected by intense ductile deformation and recrystallization, it is distinguished from the spatially associated metagranodiorite (to granite) by the grain-size, higher content of ferromagnesian minerals and banding, rather than by volcanic structures or textures.
Table 4‑1.Summary of criteria used to distinguish the four rock domains in the SFR local model volume (SKB 2011, Table 5‑2).
Rock domain Borehole data Tunnel data Magnetic total field Comment
RFR01 Rock units dominated by pegmatite, pegmatitic granite.
Sections dominated by pegmatite, pegmatitic granite.
Continuous area of low magnetic intensity.
–
RFR02 Rock units of varying compo-sition, but with a dominance of meta-granodiorite (to gran-ite) and metavolcanic rock.
Heterogeneous sections dominated by bedrock coded as ‘unspecified orthogneiss’.
Continuous area of high, but variable magnetic intensity.
–
RFR03 – – Continuous area of low magnetic intensity.
Modelled to avoid borehole and tunnel intersections.
RFR04 – – Continuous area of moderate magnetic intensity.
Structural trend inferred from magnetic intensity differs from that of RFR02.
4.1 Intact rock4.1.1 Rock typesFour major groups of rock types (A to D) were distinguished in the Forsmark site investigation area on the basis of their relative age, whereas individual rock types were distinguished on the basis of their modal composition, grain-size and relative age (Stephens et al. 2007). The character of these rock groups and individual rock types in the SFR model volumes are summarised in Table 4-2.

SKB R-14-17 21
Separate histograms showing the proportions of the major rock types from the new cored boreholes and the cored boreholes from the construction of the existing SFR are presented in Figure 4-2. Compared with the Forsmark tectonic lens further south, the SFR area is highly variable and hetero-geneous in terms of the distribution of different rock types. This heterogeneity is evident in the rock type colour coded drawings of Christiansson and Bolvede (1987) (Figure 4-3) and is supported by the borehole results.
A quantitative estimate of the proportion of different rock types in domain RFR01 and RFR02 is presented in Figure 4-4.
Figure 4‑3. Rock type colour coded drawings from Christiansson and Bolvede (1987), illustrating the litho‑logical heterogeneity of the SFR underground facility. The term ‘orthogneiss, unspecified’ (121057) include both felsic to intermediate metavolcanic rock (103076) and metagranodiorite (to granite) (101057). Note that the tunnel walls are unfolded and presented horizontally along with the roof (SKB 2011, Figure 5‑5).
Figure 4‑2. Histograms showing the proportions of the major rock types in (a) the cored boreholes from the recent SFR drilling campaign and (b) old cored boreholes from the construction of SFR. Only data from the local SFR model volume as well as KFR106 outside are included. (SKB 2011, Figure 5‑4).

22 SKB R-14-17
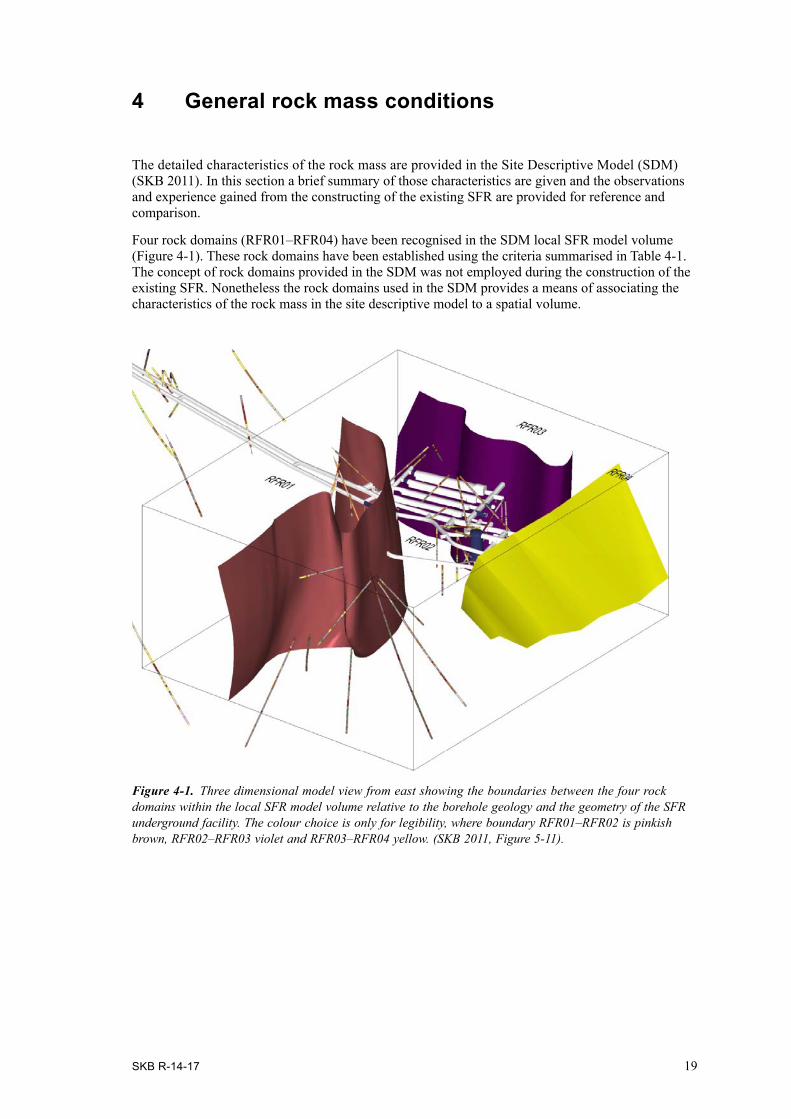
4.1.2 AlterationAn assessment has been made by investigating the proportion of the bedrock affected by each type of alteration, both inside and outside modelled deformation zones (ZFM). The results are presented as proportions of the borehole lengths in Figure 4-5 (Curtis et al. 2011). Hematite dissemination is by far the most abundant type of alteration within the boreholes. The second most frequent alteration type is muscovitization. All alteration types, except sericitization and albitization are related to the modelled deformation zones, see Figure 4-6. Sericitization and chloritization are primarily related to sealed fractures, see Section 4.3.2 and Figure 4-7. Quartz dissolution is one of the more spectacular alteration phenomena in the SFR boreholes. The most extensive occurrences are found in KFR27 and KFR102A, where the total affected borehole length amounts to 20.8 and 11.5 m, respectively. The consequence of this phenomenon is commented in Section 4.6.1.
Figure 4‑4. Quantitative estimates in volume % of the proportion of different rock types in rock domains a) RFR01 and b) RFR02 (SKB 2011, Figure 5‑13).
Figure 4‑5. Histogram showing the proportion of borehole length affected by different alteration types inside/outside modelled deformation zones in the regional SFR model volume. From Curtis et al. (2011, Figure 4‑5).
SKB R-14-17 23
Figure 4‑6. Mineral infillings in the dominant fracture sets (based on Curtis et al. 2011, Figure 5‑8, Figure 5‑17, Figure 5‑21 and Figure 5‑24).

24 SKB R-14-17
4.1.3 Strength and mechanical propertiesSKB (2008) summarizes the intact rock properties for the rock types found in the Forsmark Tectonic lens during the site investigations for the Final repository for spent fuel. These are summarised in Table 4-3 and represent the range in values from a much larger testing programme than that carried out for the SFR. The intact rock strength for all samples is rated as Very Strong (R5) to Extremely Strong (R6) according to the ISRM Suggested Method (Brown 1981)
Table 4‑3. Laboratory properties for intact rock in the SFR. From SKB (2011, Table 6‑3).
Rock Code* Mean/StDev Min–Max**
101057 101061 111058 103076 102017
Uniaxial compressive strength (MPa) 226/50 126–326
183/45 90–270
280/45 210–350
139/45 100–200
142/45 60–230
Crack initiation stress (MPa) 116/26 64–168
114/22 64–166
148/22 104–192
– –
Indirect tensile strength (MPa) 13/2 10–18
12/3 8–16
16/2 12–20
9/2 5–13
9/2 5–13
Young’s modulus (GPa) 75/3 69–81
74/4 66–82
74/2.5 70–79
99***/3 93–105
81/4 73–89
Poisson’s ratio 0.23/0.04 0.14–0.30
0.30/0.03 0.26–0.35
0.28/0.03 0.22–0.32
0.35***/0.03 0.29–0.41
0.22/0.04
* 101057 – Granite to granodiorite, 101061 – Pegmatite, pegmatitic granite, 111058 – Fine to medium-grained granite, 103076 – Felsic to intermediate metavulcanic rock, 102017 – Amphibolite.** Parameters are described as normal distribution with truncations at the given Min–Max values. The most likely parameter value is the mean value.*** Only 2 tested samples.
Figure 4‑7. A vertical fracture surface of the northern shaft wall of the surge basin at Forsmark unit 3 showing continuous chloritization, intersected by a horizontal fracture with sediment infillings. From Carlsson (1979).

SKB R-14-17 25
4.3 Rock mass characteristics4.3.1 Ductile deformationA structural variability characterises the ductile structural data from the SFR underground facility, though in general terms, the planar structures, which primarily comprise foliation, but locally also tectonic banding and gneissosity, are steeply to vertically dipping, except north of and in close proximity to the silo, where it becomes more moderately dipping (60–70°) towards south-west, locally down to 15° under the silo (cf. Christiansson and Bolvede 1987, Berglund 2008). From the entrance of the access tunnels, through the Singö Deformation Zone and towards the SFR deposition area with the rock vaults, the strike of the foliation shifts from 135–150° to 145–160°. Within the deposition area, on the other hand, it ranges between 120 and 140°. The fold axes are typically oriented parallel or, more rarely, perpendicular to the foliation with gentle to moderate plunges towards south-east or north-east (Christiansson and Bolvede 1987, Berglund 2008).
The ductile structures registered during the geological mapping of the boreholes comprise tectonic foliation and mineral stretching lineation, as well as ductile and brittle-ductile shear zones and mylonite. The general pattern of NBT (Lower construction tunnel) and all boreholes, as shown in Figure 4-8, is that the tectonic foliation has a WNW – ESE strike and a highly variable dip, whereas the mineral lineation data are rather few and of variable orientation, but mostly moderately plunging towards north-east to south-east (SKB 2011).
The tunnel drawings of Christiansson and Bolvede (1987) reveal scattered measurements of fold axes, but no other ductile structural data. The fold axes are typically oriented parallel or, more rarely, perpendicular to the foliation with gentle to moderate plunges towards the south-east or north-east (Christiansson and Bolvede 1987). The ductile structural data from the updated geological mapping of NBT (lower construction tunnel) by Berglund (2008) includes mainly measurements of tectonic foliation and banding, together with a few orientations for fold axes and gneissosity. A structural variability characterize the data set, though it agrees largely with the general picture presented by Christiansson and Bolvede (1987), where planar structures are NW-SE trending with steep dips, but tend to dip more gently in the lower levels of NBT, close to the silo (Figure 4-9).
Table 4‑4. Suggested propertied for discrete fractures. From SKB (2011, Table 6‑6).
Parameter Sub‑horizontal (Dip 0–20°) fractures with a depth (z) 0–50 m
All other fractures depth 0–150 m and subhorizontal > 50 m
Effective normal stress, σn’ [MPa] σn’ = ρgh – u Normal stiffness, Kn [MPa/mm] Kn = 10 × σn’ Kn = 10 × σn’ Shear stiffness, Ks [MPa/mm] Ks = Kn / 3 Ks = Kn / 20Friction angle, φ1 [°] for normal stress range 0–0.5 MPa 66° 48°Friction angle, φ2 [°] for normal stress range 0.5–1.5 MPa
32° 35°
Apparent cohesion for normal stress range 0.5–1.5 MPa
0.4 0.4
Dilitancy 15° 15°
4.2 Discrete fracture propertiesIn Table 4-4, the properties are described differently for two groups of fractures, the sub-horizontal to gently dipping shallow fractures down to –60 m elevation and all other fractures, irrespective of orientation. Given values are estimated most likely values, and the variation between fractures is expected to be great. Note that these properties are only predicted for the rock volume of the SFR extension (0–150 m depth) and should not be used for fractures at depth where normal stresses are high.

26 SKB R-14-17
Figure 4‑8. Orientation of ductile structures from the updated geological mapping of NBT and in all cored boreholes from latest SFR drilling campaign (i.e. KFR27, KFR101, KFR102A, KFR102B, KFR103, KFR104, KFR105 and KFR106. Linear data and poles to planar structures have been plotted on the lower hemisphere of equal-area stereographic projections (SKB 2011, Figure 5-6).
Figure 4‑9. Fold axes and poles to planar structural data from the updated geological mapping of NBT plotted on the lower hemisphere of an equal-area stereographic projection. The data are divided into three separate stereograms to enhance the change in orientation along the tunnel. Note that all but one of the poles to the unspecified banding is hidden behind foliation poles with identical orientations. Moreover, three of the foliation poles are hidden behind gneissosity poles. Data from Berglund (2008). (Curtis et al. 2011, Figure 4-9).

SKB R-14-17 27
4.3.2 Brittle deformationThere is a clear difference in intensity of the orientation patterns between open and sealed fractures in the rock mass. Taking the rock mass as a whole, the horizontal orientation group dominates the open fractures, whereas sealed fractures are predominantly sub-vertical to steeply dipping and strike WNW – ESE to NE – SW (Figure 4-10). The blocky fracture pattern was also observed by Carlsson and Christiansson (1987) in the mapping of the existing SFR tunnels (Figure 4-11).
A comparison of the mean fracture frequency obtained from borehole data outside modelled deformation zones in RFR01 and RFR02, is provided in Table 4-5. The open fracture frequency is essentially the same in both rock domains: 3.6/m in RFR01 and 3.8/m in RFR02. Sealed fractures occur with varying frequency. Oxidation and chloritization are commonly found in association to the sealed fractures (Figure 4-6). These sealed fractures often formed overbreaks in the existing SFR facility (Figure 4-12).
Figure 4‑10. Fracture orientation clustering based on data from KFM11A and the cored boreholes KFR27, KFR101, KFR102A, KFR102B, KFR103, KFR104, KFR105 and KFR106. (SKB 2011, Figure 5‑8).
Figure 4‑11. Lower hemisphere equal angle stereo‑nets for fractures mapped in the foundation of Forsmark Unit 3 (left stereo‑net) and for fractures compiled from tunnel mapping in two 100‑m‑long orthogonal tunnels from the SFR facility at a depth between 50 and 70 m (right stereo‑net). From Carlsson and Christiansson (1987).

28 SKB R-14-17
4.4 Deformation zonesThere are four distinctive sets of deformation zones in the area:
• The oldest discrete structures in the area are the steeply dipping, WNW-ENE and NWSE zones (e.g. Singö Deformation Zone), generally referred to as the WNW to NW set. Together with the broader structural belts with the same orientation, which developed earlier under higher-grade metamorphic conditions, they account for a pronounced structural anisotropy in the bedrock.
• Vertical to steeply dipping fracture zones that strike ENE-WSW (NE-SW) and NNE-SSW, generally referred to as the ENE to NNE set including ENE (NE) and NNE sub-sets.
• Vertical and steeply dipping fracture zones that strike NNW-SSE, generally referred to as the NNW set.
• Gentlydipping(≤45°)fracturezonesthat,relativetoalltheothersets,containahigherfrequency of open fractures and non-cohesive fault rocks (SKB 2011).
Figure 4‑12. Sealed fractures with slight alteration and mainly laumontite infilling in the existing SFR. The fractures are steep in a small angle to the tunnel wall and often formed overbreaks.
Table 4‑5. Summary of mean fracture frequencies per metre of mapped drill core for rock domains RFR01 and RFR02 outside modelled deformation zones (modified from SKB 2011, Table 5‑3).
Rock domain
Open Partly open
Crush equivalent
Total open
RFR01 3.32 0.24 0.01 3.57RFR02 3.44 0.33 0.05 3.82

SKB R-14-17 29
4.4.1 Within the Central BlockThe existing SFR facility and the rock volume directly to the south-east, proposed for the new facility extension, lies within a tectonic block that is bounded to the north-east and south-west by two broad belts, the Northern boundary belt and the Southern boundary belt, respectively, of concentrated ductile and brittle deformation (Figure 4-13). Within the Central Block, in the rock volume for the planned extension, a series of WNW-NW trending deformation zones are included in the local model. These are much smaller than the bounding belts and were initiated at a later stage in a brittle regime. Even smaller zones with the same general strike and character, below the current model resolution, are inferred to permeate the entire rock volume. A NE to ENE striking set of brittle deformation zones is also present. Compared with the WNW-NW set they are generally thinner and shorter, due to termination against the broad WNW-NW trending deformation belts. No new significant gently dipping deformation zone was identified in the rock volume for the new extension.
Table 4-6 shows the geometry of deformation zones present inside the local model volume.
Table 4‑6. Geometry of deformation zones present inside the local model volume. Modified after SKB (2011, Table 5‑4).
DZ Name Confidence level*
Strike (°)
Dip (°)
Thickness (m)
Length (m) at ground surface
Lower cut off depth (–masl)
Gently dipping deformation zonesZFM871 (H2) H 074 19 20 – –
Steeply dipping deformation zones NNE to ENE setZFMNNE0869 H 201 86 60 898 1,100ZFMNNE3264 M 031 90 10 1,128 1,100ZFMNNE3265 M 032 90 10 1,103 1,100ZFMNNE3266 M 034 90 10 1,015 1,100ZFMNE0870 H 232 76 16 559 750ZFMNE3112 H 233 89 10 474 500ZFMNE3118 H 044 84 8 743 750ZFMNE3134 M 041 90 5 370 500ZFMNE3137 H 230 90 5 672 750ZFMENE3115 H 236 84 28 793 1,100ZFMENE3135 M 081 90 5 368 750ZFMENE3151 M 074 90 5 421 500ZFMENE8031 M 063 90 5 537 750
Steeply dipping deformation zones WNW to NW setZFMWNW0835 H 118 88 21 1,044 1,100ZFMWNW0836 M 117 90 50 4,868 1,100ZFMWNW3262 H 116 86 2 610 750ZFMWNW3267 H 122 90 18 698 750ZFMWNW3268 M 109 90 5 861 750ZFMWNW8042 H 116 89 5 524 750ZFMWNW8043 M 124 90 10 775 750ZFMNW0805A H 312 82 60 3,643 1,100ZFMNW0805B H 315 75 30 1,181 1,100
Steeply deformation zones NNW to NS setZFMNNW0999 M 170 90 5 692 750ZFMNNW1034 H 337 78 17 883 750ZFMNNW1209 H 151 83 18 341 500ZFMNNW3113 M 173 90 5 376 500ZFMNS3154 M 180 90 10 757 750
H = High confidence. M = Medium confidence.

30 SKB R-14-17
4.4.2 Singö Deformation ZoneThe Singö Deformation Zone can be described as a “classic” deformation zone with a central core consisting of breccia and gouge surrounded by a halo of increased fracture intensity. The thickness of the deformation zone, particularly the central core spatially varies. Consequently the tunnelling conditions when intersecting the Singö Deformation Zone can also vary significantly. Appendix A summarizes the challenges of tunnelling through the Singö Deformation Zone.
A rock fall occurred in Forsmark 3 discharge tunnel when it encountered the Singö Deformation Zone. It is likely this would have been contained or completely prevented if pre-fabricated steel arches had been available as a contingency measure. About two weeks elapsed from the time that arching started to the time the steel arches were in position. The stand-up time that occurred is prob-ably the single and primary explanation of the size of the rock fall. Another construction procedure utilizing shortened excavation rounds may also have reduced the problems. Figure 4-15 illustrates the difference in rock mass conditions within the Singö Deformation Zone.
A working method statement for tunnelling through the Singö zone in the SFR tunnels was based on the site investigations of the zone and on the experiences gained from the driving through the Singö Deformation Zone in the Forsmark 1, 2 and 3 tunnels (Carlsson and Christiansson 2007). By applying appropriate working and support methods tunnelling through the zone was accomplished without incident.
Figure 4‑13. Intersection at the current ground surface of deformation zone traces of all sizes inside the regional model area, i.e. a combined model version. The regional deformation zones ZFMWNW0001 (the Singö Deformation Zone) and ZFMNW0805A (also referred to as zone 8), along with their major splays, form the general southern and northern boundaries of the central SFR tectonic block. Confidence in existence: high=red, medium=green (SKB 2011, Figure 5‑1).

SKB R-14-17 31
Figure 4‑14. Definition of deformation zone. Within the Central Block the core of the deformation zones do not contain fault gouge while the Singö Deformation Zone does contain and extensive core and transition zone. Modified from Munier et al. (2003).
Figure 4‑15. Illustration of the difference in rock mass conditions within the Singö Deformation Zone between Forsmark 1 and 2 tunnel (upper pictures) and the Forsmark 3 tunnel (lower pictures). (Carlsson and Christiansson 2007, Figure 9‑1).

32 SKB R-14-17
4.4.3 Mechanical propertiesA deformation zone may have two distinct sections: (1) central core and (2) a transition zone adja-cent to the host rock (Munier et al. 2003). Both the central core and transition zone were encountered when tunnelling through the Singö Deformation Zone. Glamheden et al. (2007) back analysed displacement data recorded during tunnel construction to estimate the average properties of the central core, transition zone and the host rock. The parameters from those back analyses are provided in Table 4-7 but should be treated cautiously. Back-calculated parameters are seldom unique, as there are likely other parameters that could provide a reasonable fit to the measured deformations. Hence the parameters in Table 4-7should be treated as “suggested parameters” for predicting deformations. Engineering stability analyses may require adjusting these parameters, e.g., reducing the tensile strength and cohesion to zero. Tunnelling experience from Forsmark and elsewhere suggests that these deformation zones may vary significantly in thickness and properties.
Table 4‑7. Summary of geomechanical parameters for Singö Deformation Zone back‑calculated to fit measured deformations. Data from Glamheden et al. (2007).
Property Host Rock Transition Zone Core
Deformation Modulus (GPa) 45 32 2.7Poisson’s ratio 0.36 0.43 0.43Tensile strength (MPa) 0.3 0.1 0.1Cohesion (MPa) 5 4 2Friction angle (°) 65 51 37
4.5 In situ stressThe state of stress at the Forsmark site is based on the historic data from Forsmark and Finnsjön (Table 4-8). The orientation for the maximum horizontal stress was estimated to 134° ± 15°. There were no stress-induced problems experienced during the construction of SFR. In the upper part of the lower construction tunnel when the tunnels were driven in the direction close to the orientation of the maximum horizontal stress, loosening up of the tunnel face was experienced for several rounds. The tunnelling went through a body of pegmatite in that area (Carlsson and Christiansson 2007).
Table 4‑8. In situ stress gradients for Forsmark SFR (SKB 2011).
All rock domains Major horizontal stress. Depth z = 0–250 m
Minor horizontal stress. Depth z = 0–250 m
Vertical stress Depth z = 0–250 m
Magnitude [MPa} 5 + 0.07z 0.07z 0.027zOrientation [Trend from north] 142° 55° vertical
4.6 Hydraulic properties and fracture flow4.6.1 Transmissivity distribution along boreholesFracture data in cored boreholes have been classified as open, partly open, or sealed. Open and partly open fractures are regarded as “potentially flowing fractures”, whereas sealed fractures are regarded as impervious (SKB 2011). There is a clear difference in orientation patterns between open and sealed fractures in the hydraulic rock domain (HRD); horizontal fractures tend to be open, whereas steeply dipping fractures are predominantly sealed.
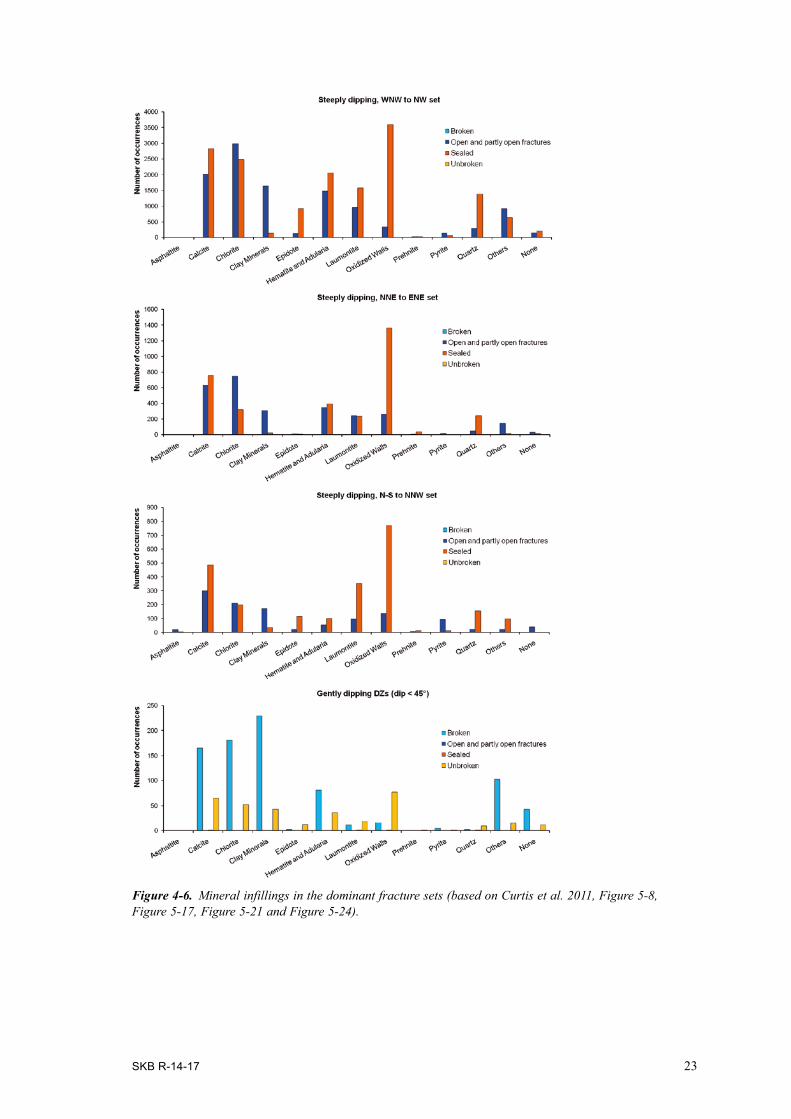
The hydraulic data set collected during the investigations for the SDM follows SKB’s current quality standards and requirements in terms of traceability. Further, the new hydraulic data set provides orientations of discrete flowing fractures detected with the Posiva Flow Log (PFL-f). The majority ofPFL-fdataabove−200m,particularlythelargesttransmissivities(T>10−6 m2/s), are associated with horizontal or gently dipping structures (Figure 4-16).
SKB R-14-17 33
The occurrence of quartz dissolution is found in association to some DZ, see Section 4.1.2. It could be expected that such conditions may cause locally high transmissivity due to the high porosity.
In order to account for structural differences while comparing the data acquired in the SFR extension investigation to the Forsmark SDM depth dependency trend model, data were divided into three sub-groups: the Southern belt data set (a in Figure 4-17), the old hydraulic data set acquired in proximity of the existing SFR (b in Figure 4-17), and the new hydraulic data set acquired to the south-east of the existing SFR (c in Figure 4-17) (SKB 2011).
Data of the Southern belt HCD intercepts (a in Figure 4-17) are obtained from SDM-Site Forsmark as well as older data from the construction of the existing SFR. The shallow intercept transmissivi-ties obtained from SDM-site are extremely high (THCD>10−4 m2/s). This type of extremely high transmissivity values at shallow depths have not been found north of the Southern belt within the SFR regional model area (b in Figure 4-17 and c in Figure 4-17).
4.6.2 Shallow Bedrock Aquifer (SBA)In SDM-Site Forsmark, the term shallow bedrock aquifer (SBA) was introduced to describe the lateral hydraulic connectivity and hydraulic responses identified within the Shallow and Repository level HRDs. These eight SBA structures and shown here in Figure 4-18 . SBA1-6 is connected to the Northern boundary belt and ZFMNNW1034, whereas SBA7 and SBA8 occur in the proximity of the existing SFR facility. Although modelled as single features it is emphasised that each SBA structure is believed to represent a “stairway of interconnected sub-horizontal and steeply dipping fractures” rather than a single fracture. It is also noted that the certainty regarding the postulated extension of each SBA structure varies. In some cases the interpreted sizes are primarily based on similarities in geometrical and hydraulic data in individual boreholes and in other cases additional data are avail-able such as cross-hole hydraulic interferences (see Öhman et al. 2012, Appendix H for details).
Figure 4‑16. Borehole coverage and PFL‑f transmissivity with depth; a) total core length of PFL‑f logging binned by elevation and borehole, b) core length of PFL‑f logging outside deterministically modelled deformation zones (ZFM) binned by elevation and borehole, c) PFL‑f data divided by ZFM, PDZ and HRD, and d) PFL‑f data outside ZFM divided by fracture set. Note that the sub‑horizontal underground borehole KFR105 has a large contribution to PFL‑f logged core length in the interval –105 to –157 m RHB70 (orange bars). (SKB 2011, Figure 7‑25).
0 5 10 15
0-5
0-1
00-1
50-2
00-2
50-3
00-3
50-4
00-4
50-5
00El
evat
ion
(m, R
HB
70)
KFR106KFR27KFR101KFR102AKFR102BKFR103KFR104KFR105
Total PFL-f logged core length (m/m)
a)
0 5 10 15
0-5
0-1
00-1
50-2
00-2
50-3
00-3
50-4
00-4
50-5
00
PFL-f logged core length in HRD (m/m)
b)
-500
-450
-400
-350
-300
-250
-200
-150
-100
-50
0
-9 -8 -7 -6 -5 -4Transmissivity, log T
ZFM PDZ HRD
c)
-500
-450
-400
-350
-300
-250
-200
-150
-100
-50
0
-9 -8 -7 -6 -5 -4Transmissivity in HRD, log T
EW NW NE Hz Gd
No HRD coverage
d)

34 SKB R-14-17
Figure 4‑17. The sum of transmissivity values inside the bounds of each HCD intercepts are here plotted for the interval 0 to –700 m elevation; a) Southern belt intercepts, b) old data, and c) new data set. The depth trend model from SDM‑Site Forsmark, k = 232.5 m, has been fitted to the maximum values of each data set. Transmissivity below detection limit is shown as 10–10 m2/s. (SKB 2011, Figure 7‑26).
-700
-650
-600
-550
-500
-450
-400
-350
-300
-250
-200
-150
-100
-50
0
1E-101E-9 1E-8 1E-7 1E-6 1E-5 1E-4 1E-3
Ele
vatio
n (m
, RH
B 7
0)
Total transmissivity (m2/s)
WNW to NW setNNE to ENE setGently dippingUnresolved PDZStress-rel. struc.
b)
-700
-650
-600
-550
-500
-450
-400
-350
-300
-250
-200
-150
-100
-50
0
1E-101E-9 1E-8 1E-7 1E-6 1E-5 1E-4 1E-3
Ele
vatio
n (m
, RH
B 7
0)
Total transmissivity (m2/s)
Southern belt
WNW0001 (KFM11A)
WNW3259 (KFM11A)
a)
WNW0813 (KFM11A)
NW0002(KFM11A)
WNW1035 (KFM11A)
-700
-650
-600
-550
-500
-450
-400
-350
-300
-250
-200
-150
-100
-50
0
1E-101E-9 1E-8 1E-7 1E-6 1E-5 1E-4 1E-3
Ele
vatio
n (m
, RH
B 7
0)
Total transmissivity (m2/s)
WNW to NW setN-S to NNW setNNE to ENE setUnresolved PDZ
WNW0835 (KFR27)
ENE3115 (KFR102A)
c)
Figure 4‑18. Visualisation of the eight SBA structures and deformation zone ZFM871 relative to a preliminary layout of the extended SFR facility: a) top view, b) side view looking towards the northeast. The structures are coloured according to transmissivity interpolated from the transmissivity of the borehole intercepts. (SKB 2011, Figure 9‑13).

SKB R-14-17 35
In summary, the spacing between SBA structures, where present, probably varies within the SFR local model domain. The spacing between SBA structures can be estimated in different ways depend-ing on how their supporting strands of evidence are handled. The minimum spacing is estimated to be approximately 30–40 m and the maximum spacing is estimated to be approximately 120–130 m.
Figure 4-19 shows the hydraulic data acquired inside the Central block closest to the area of the planned extension. Figure 4-19 suggests that the interval between 100–150 m contains fewer high-transmissive fractures than the interval between 50–100 m. SBA6 is the most certain of the six SBA structures, and the data shown in Figure 4-18 reveals that the transmissivities of SBA6 are of the same magnitude as the transmissivities of ZFM871 at comparable depths.
4.6.3 Repository level HRD (between –60 and –200)Figure 4-20 shows a preliminary layout of the SFR extension relative to the existing facility and the local model area together with the Forsmark site investigation boreholes and the boreholes from the SFR extension drilling campaign. In the figure, boreholes HFR101, KFR104 and KFR105 are referred to as Group 1 and boreholes HFR106, KFR101, –102A, 102B, –103, and –106 are referred to as Group 2.
Figure 4‑19. a) Borehole coverage (total core length) inside the Central block closest to the area of the planned extension, and b) PFL‑f and PSS transmissivity data outside ZFM from the associated boreholes divided by fracture set. The interval between 100–150m contains fewer high‑transmissive fractures than the interval between 50–100m (SKB 2011, Figure 9‑14).
0 5 10 15
0-5
0-1
00-1
50-2
00-2
50-3
00
Elev
atio
n (m
, RH
B70
)
KFR27 (coarse)
KFR27
KFR102A
KFR104
KFR105
Shallow
Repository
Deep
a)
-9 -8 -7 -6 -5 -4
Transmissivity, log T
Interval
Nw
Gd
Hz
NE
EW
SBA1 1
SBA2 1
SBA6 1
b)
PFL-f logged core length outside ZFM, binned by elevation (m/m)

36 SKB R-14-17
The lateral contrasts in transmissivity between the Central block data set (Group 1) and the data set closest to ZFMNNW1034 and the Northern boundary belt (Group 2) are compared in Figure 4-21. The difference between the two data sets is striking and clearly more pronounced than the contrast between HCD transmissivity and HRD transmissivity for each tectonic unit alone. As shown in Figure 4-22, the suggested modelling of SBA structures and unresolved PDZs along ZFMNNW1034 and the Northern boundary belt have a profound impact on the data set for HRD modelling (SKB 2011).
Figure 4-23a) shows the Terzaghi weighted flowing fracture intensity distribution outside the deterministically modelled deformation zones (HCDs) in the interval –60 m to –200 m RHB 70. Figure 4-23b) shows the practical detection limit for the transmissivity measurements in each bore-hole. Since only PFL-f data are used for stochastic HRD modelling, Figure 4-24a) and Figure 4-24b) are compiled to show the effect of excluding all transmissivity data associated with percussion-drilled boreholes and all PFL-f transmissivity data associated with conditioned unresolved PDZs and SBA structures. The transmissivity data in the two groups representing HRD data alone do not need to be distinguished from one another. That is, once all PFL-f data associated with unresolved PDZs are excluded, the PFL-f data in the two groups could be assumed to be statistically homogeneous (SKB 2011).
!(
!( !(
!(
!(
!(!(!(!(
!(
!(
!(
!(
!(
!(
SFR1
SFR extension
1BM
A 1Silo
1BLA
2BLA2B
MA
2BTF
1BTF
1BRT
3BLA
4BLA
5BLA
6BLA
KFM11A
HFM35
HFM34
KFR104
KFR102AKFR101
KFR103HFR106
KFR106
KFR102B
HFR101
HFR105
HFR102 KFR27
KFR105
0 200 400100 MeterLocal model area
Cored borehole
Percussion borehole
Cored borehole from tunnel
G:\skb\gis\S
FR\A
rcprojekt\forsmark_layout_S
FR_borrhal_20111116_0900.m
xd
Bakgrundskartor © LantmäterietSKB/swecoub 2011-11-16 08:58
Figure 4‑20. Preliminary layout of the SFR extension relative to the existing SFR I and the local model area together with the Forsmark site investigation boreholes and the boreholes from the SFR extension drilling campaign (SKB 2011, Figure 7‑28).

SKB R-14-17 37
Figure 4‑22. Comparison of PFL‑f orientations at the Repository level HRD (–60 to –200 m) between a modified Group 1 and Group 2; i.e. the data used for modelling of SBA structures and conditioned unresolved PDZs are separated from the HRD data and plotted together with the HCD data. Poles are coloured and scaled by PFL‑f transmissivity. (SKB 2011, Figure 7‑30).
Figure 4‑21. Comparison of PFL‑f orientations at the Repository level HRD (–60 to –200 m) between Group 1 (KFR104 and KFR105) and Group 2 (KFR101, –102A, –102B, –103, and –106). Poles are coloured and scaled by PFL‑f transmissivity. (SKB 2011, Figure 7‑29).
38 SKB R-14-17
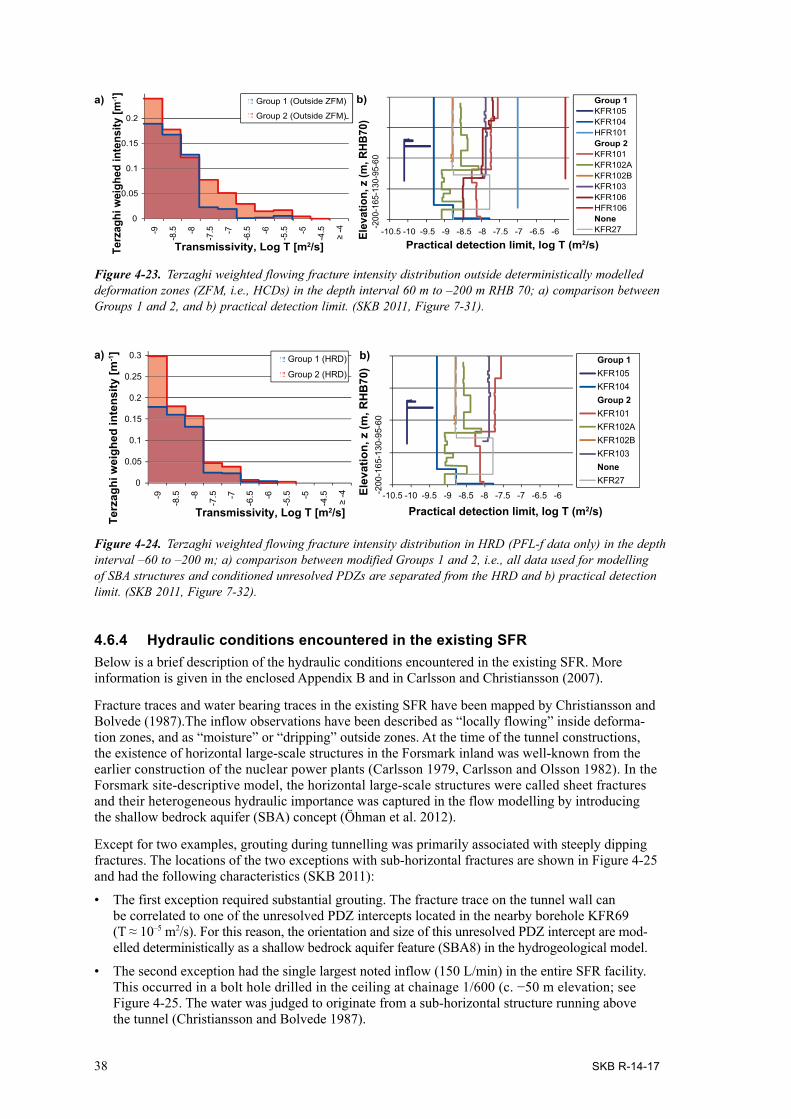
Figure 4‑23. Terzaghi weighted flowing fracture intensity distribution outside deterministically modelled deformation zones (ZFM, i.e., HCDs) in the depth interval 60 m to –200 m RHB 70; a) comparison between Groups 1 and 2, and b) practical detection limit. (SKB 2011, Figure 7‑31).
Figure 4‑24. Terzaghi weighted flowing fracture intensity distribution in HRD (PFL‑f data only) in the depth interval –60 to –200 m; a) comparison between modified Groups 1 and 2, i.e., all data used for modelling of SBA structures and conditioned unresolved PDZs are separated from the HRD and b) practical detection limit. (SKB 2011, Figure 7‑32).
-200
-165
-130
-95-
60
-10.5Elev
atio
n, z
(m, R
HB70
)
Practical detection limit, log T (m2/s)
Group 1KFR105KFR104HFR101Group 2KFR101KFR102AKFR102BKFR103KFR106HFR106NoneKFR27
b)
0
0.05
0.1
0.15
0.2
-9
-8.5 -8
-7.5 -7
-6.5 -6
-5.5 -5
-4.5
≥ -4
Terz
aghi
wei
ghed
inte
nsity
[m-1]
Transmissivity, Log T [m2/s]
Group 1 (Outside ZFM)
Group 2 (Outside ZFM)
a)
-6-6.5-7-7.5-8-8.5-9-9.5-10
0
0.05
0.1
0.15
0.2
0.25
0.3
-9
-8.5 -8
-7.5 -7
-6.5 -6
-5.5 -5
-4.5
≥ -4
Terz
aghi
wei
ghed
inte
nsity
[m-1]
Transmissivity, Log T [m2/s]
Group 1 (HRD)
Group 2 (HRD)
a)
-200
-165
-130
-95-
60El
evat
ion,
z (m
, RH
B70
)
Practical detection limit, log T (m2/s)
Group 1KFR105KFR104Group 2KFR101KFR102AKFR102BKFR103NoneKFR27
b)
-10.5 -6-6.5-7-7.5-8-8.5-9-9.5-10
4.6.4 Hydraulic conditions encountered in the existing SFRBelow is a brief description of the hydraulic conditions encountered in the existing SFR. More information is given in the enclosed Appendix B and in Carlsson and Christiansson (2007).
Fracture traces and water bearing traces in the existing SFR have been mapped by Christiansson and Bolvede (1987).The inflow observations have been described as “locally flowing” inside deforma-tion zones, and as “moisture” or “dripping” outside zones. At the time of the tunnel constructions, the existence of horizontal large-scale structures in the Forsmark inland was well-known from the earlier construction of the nuclear power plants (Carlsson 1979, Carlsson and Olsson 1982). In the Forsmark site-descriptive model, the horizontal large-scale structures were called sheet fractures and their heterogeneous hydraulic importance was captured in the flow modelling by introducing the shallow bedrock aquifer (SBA) concept (Öhman et al. 2012).
Except for two examples, grouting during tunnelling was primarily associated with steeply dipping fractures. The locations of the two exceptions with sub-horizontal fractures are shown in Figure 4-25 and had the following characteristics (SKB 2011):
• The first exception required substantial grouting. The fracture trace on the tunnel wall can be correlated to one of the unresolved PDZ intercepts located in the nearby borehole KFR69 (T≈10–5 m2/s). For this reason, the orientation and size of this unresolved PDZ intercept are mod-elled deterministically as a shallow bedrock aquifer feature (SBA8) in the hydrogeological model.
• The second exception had the single largest noted inflow (150 L/min) in the entire SFR facility. Thisoccurredinaboltholedrilledintheceilingatchainage1/600(c.−50melevation;seeFigure 4-25. The water was judged to originate from a sub-horizontal structure running above the tunnel (Christiansson and Bolvede 1987).

SKB R-14-17 39
Two distinct head sinks may be observed in the monitoring data in the existing SFR. Today, the sinks are judged to be: 1) the intersection of the access tunnels BT (construction tunnel) and DT (operation tunnel) through the Singö Deformation Zone, and 2) the intersection of NDB/NBT (lower operation tunnel/lower construction tunnel) and ZFM871. There is also a long diffuse line-sink along the intersection between tunnel BT and ZFMNE0870 (Figure 4-25) (SKB 2011).
Measurements of the inflow to the SFR facility have been carried out regularly since January 1988 (Carlsson and Christiansson 2007). The total inflow year 1988 was about 720 L/min. Since then there has been a decreasing trend of inflow that has been relatively steady for the last 15 years; the total inflow has decreased to about 285 L/min (average value for year 2010), which corresponds to a 61% decrease since the initial measurements (Figure 4-26). Alternative reasons for decreased inflow are discussed in SKB (2011).
4.7 Groundwater compositionThe general picture from hydro-geochemical interpretations is that water flows from the Baltic Sea to the existing SFR via the steeply dipping ZFMWNW0001, ZFMNNE0869, and ZFMNW0805A and then via horizontal features towards SFR. However, the existing SFR seems to have a channelized hydraulic contact with ZFMNW0805A and B (Northern belt) and poor contact with ZFMNNE0869 as considerable portions of older water (Littorina and Brackish glacial types) are still present in the gently dipping ZFM871.
The dataset of the SFR groundwater shows some characteristic features:
1. The range in chloride concentration of the SFR groundwater is small (1,500 to 5,500 mg/L Cl) comparedwiththeForsmarksiteinvestigationarea(50–16,000mg/LCl),buttheδ18O values show similar variation (–15.5 to –7.5‰ V-SMOW) as at Forsmark (–16 to –8‰ V-SMOW).
2. The SFR data set covers depths down to about –250 m with one single sampling location at –400 m elevation.
3. Fresh meteoric water components of present precipitation type are suggested to be minor.4. Marine indicators, such as Mg/Cl, K/Cl and Br/Cl ratios, show relatively large variations, especially
considering the limited salinity range and the shallow depth of sampling, and it can be suspected that components of both the more saline Littorina Seawater and the more diluted present Baltic Seawater are present.
Figure 4‑25. Illustration showing structures consisting of closely spaced, sub‑horizontal parallel fractures (dip <15º) digitized from sketch #103 in Christiansson and Bolvede (1987). Only two of these structures required grouting; b) Illustration showing the lower level of the NDB tunnel, which intersects the gently dipping deformation zone ZFM871. This intersection required 67.5 m3 of grout. (SKB 2011, Figure 7‑5).
a)
b)
Grouted150 l/min

40 SKB R-14-17
4.8 Inflow observations and transmissivities during the construction of the existing SFR
There is a significant amount of probe-hole data from the construction of the existing SFR (Christiansson and Bolvede 1987). Probe holes were drilled roughly every 20 m as a basis for decision if pre-grouting were needed, or not. The number of probe holes was originally decided to be three from beginning of the tunnelling. This was more or less systematic through and beyond the Singö fault zone. But as tunnelling proceeded towards the deposition area, the ambitions in probing decreased as the rock mass also became generally drier. The coverage of probe holes are not 100% in some of the rock caverns. The probe-hole data was grouped in accordance to Table 4-9.
Within each domain the data was sorted in three ways:
1. Water inflow for a probe-hole section (average 20 m).
2. Distribution of water inflow to individual boreholes in each zone.
3. Estimated transmissivity, assuming that all water in probe holes origins from one fracture, and a mean hydraulic head for the zone.
Figure 4‑26. Top: Inflow of groundwater to the existing SFR facility between 1988 and 2011. Curves marked UB and NDB refer to drainage to the pump pits in the operation area and in the lower construction tunnel. Bottom: The location of the two pumping pits, UB and NDB (SKB 2011, Figure 7‑6).
0
100
200
300
400
500
600
700
-88 -89 -90 -91 -92 -93 -94 -95 -96 -97 -98 -99 -00 -01 -02 -03 -04 -05 -06 -07 -08 -09 -10 -11
Tunn
el in
flow
(L/m
in)
Total
NDB
UB
Rev. measuring programme
Installation of water meters
Alteration of water meters
Suspected error, Dec. 2007
Calibra�on of water meters

SKB R-14-17 41
The resolution on the old data is estimated to be fair. The lowest measured inflow to a probe-hole is 0.1 l/min. However, inflow to a probe-hole was measured without considering the flow from nearby holes. Today the approach is to measure the flow from individual holes, having a packer sealing off the other probe holes.
As illustrated in Figure 4-32 and Figure 4-33, only a few probe holes in the deposition area ( Zone 5, at depth roughly 70 m) and access down to the lower level (Zone 6, at 140 m depth) had inflow of several tens of litre per minute. The majority of the probe holes were dry. As a comparison, hydraulic testing by pressure built up tests and interference tests during the later phase of the construction of the SFR resulted in estimated hydraulic conductivities of 10–6 to 10–9 m/s in minor deformation zones and 10–9 to 10–12 m/s in the bedrock between the deformation zones (Christiansson and Magnusson 1985).
Table 4‑9. Summary of probe‑hole drilling from construction of the existing SFR.
Zone No.
Description/ Figure No.
Water inflow to probe section
Distribution of inflow to individual probe‑holes
Max trans missivity values (m2/s)
Nos. of probe sections
Nos. of probe holes
Dry sections (%)
Nos of sections > 3 l/min
Dry holes (%)
Nos of holes > 3 l/min
1 Tunnel portal to Singö fault zone Figure 4-28
46 1 50 1 3×10⁻⁶ 26 32
2 Singö fault zone, brittle section Figure 4-29
0 3 16 7 2×10⁻⁵ 4 11
3 Singö fault zone, mixed geology Figure 4-30
0 24 23 30 3×10⁻⁵ 32 85
4 Access tunnels down to operational area Figure 4-31
43 8 54 12 1.5×10⁻⁵ 39 65
5 Operational area incl. disposal rooms Figure 4-32
60 6 69 6 1.5×10⁻⁵ 66 109
6 Access down to lower level (excluding gently dipping def. zone H2) Figure 4-33
40 4 38 6 4.8X10⁻⁶ 10 21
Silo dome – – 53 0 1.2×10⁻⁷ 3 17
Figure 4‑27. Location of probe hole zones described in Table 4‑11.

42 SKB R-14-17
Figure 4‑28. ZONE 1, portal to Singö fault zone.
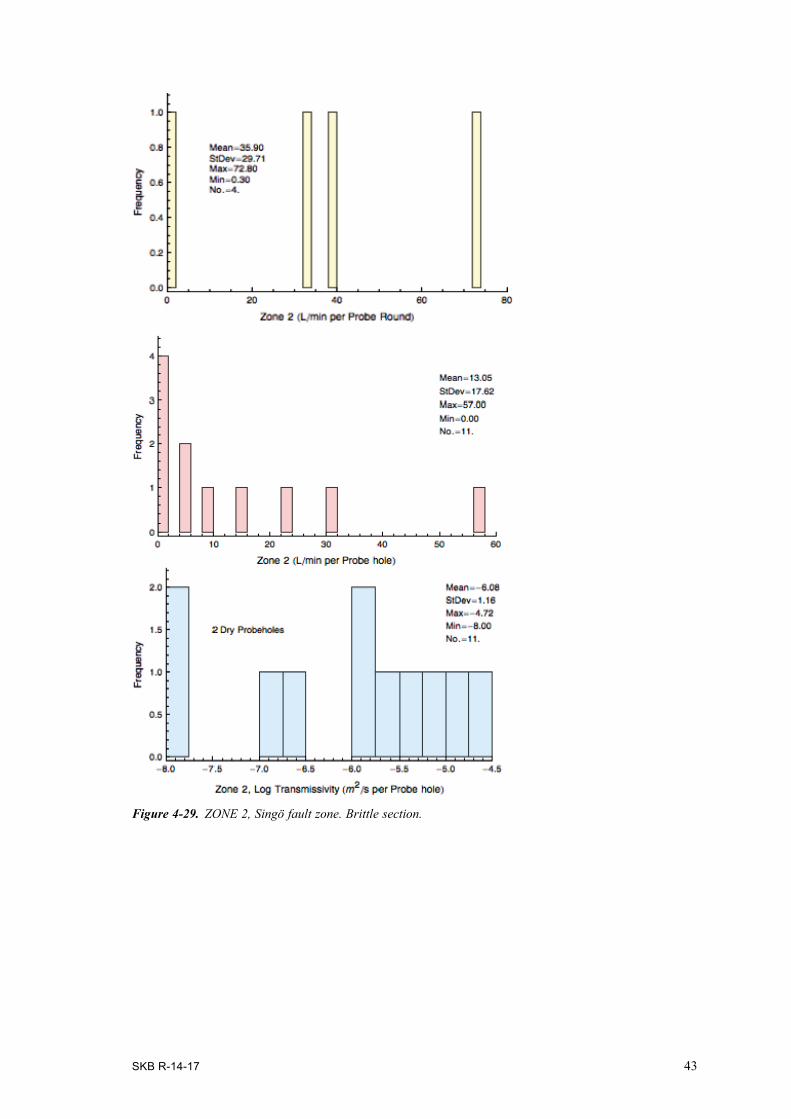
SKB R-14-17 43
Figure 4‑29. ZONE 2, Singö fault zone. Brittle section.

44 SKB R-14-17
Figure 4‑30. ZONE 3, Singö fault zone. mixed geology.

SKB R-14-17 45
Figure 4‑31. ZONE 4 Access tunnels down to operation area.

46 SKB R-14-17
Figure 4‑32. ZONE 5 operation area.

SKB R-14-17 47
Figure 4‑33. Zone 6 Access down to lower level (excluding gently dipping def. zone H2).

SKB R-14-17 49
5 Ground types: Behaviour, rock support and grouting
5.1 GeneralThe stability of an underground opening depends on the ground behaviour. The various types of behaviour require different design approaches. Therefore, it is necessary to understand the actual type of ground behaviour, as a pre-requisite for rock support and other evaluations. In this section we follow the design approach given in Schubert et al. (2001). The design steps are:
Step 1: Identify type(s) of ground (rock mass) as defined by lithology, laboratory tests and field observation data (Table 5-1).
Step2: Identify the potential Ground behaviours considering each Ground Type and local influenc-ing factors, including in-situ stress, orientation of discontinuities related to the tunnel axis, and the influence of groundwater, as well as the shape and size of the planned opening. The potential Ground Behaviour Types are listed in Table 5-2. The Ground behaviour has to be evaluated for the full cross sectional area without considering any modifications including the excavation method or sequence and support or other auxiliary measures.
Step 3: Establish the excavation, grouting and support based on the project specific Ground Behaviour Types, different excavation and support measures are evaluated and acceptable methods are determined. The system behaviour (SB) is a result of the interaction between the ground behaviour and the selected excavation and support schemes. The evaluated system behaviour has to be compatible with the project objectives.
In design stage L2 the ground types (GT) and anticipated ground behaviour (GB) must be defined. In addition to the ground types and behaviour, design stage L2 will also require an estimate of ground support and grouting quantities.
Support types (ST) are based on the extensive underground construction experience in the Forsmark area, documented in the Construction Experience Report (Carlsson and Christiansson 2007) and modern day construction experience in the Scandinavian Shield. Likewise, grouting types (GRT) are also defined based on the construction experience at Forsmark and elsewhere. Because grouting technology has advanced significantly since the construction of the existing Forsmark facilities, the grouting types have been modified to incorporate those changes. The descriptions in this chapter shall be used by the Designer for design stage L2.
Table 5‑1. Definitions used in design steps.
Description
Ground Type (GT) Ground with similar mechanical and hydraulic propertiesGround Behaviour (GB) Reaction of the ground to the excavation of the full profile without consideration of
sequential excavation and supportBehaviour Type (BT) General categories describing similar Ground Behaviours with respect to failure
modes or other characteristicsSystem Behaviour (SB) Behaviour resulting from the interaction between ground, excavation, and support.

50 SKB R-14-17
5.2 Ground typesThe division of the rock mass into ground types starts with a description of the basic geology and proceeds by defining key geotechnical parameters for each ground type. The key parameters values and distributions are based on the data provided in the Site Descriptive Model, the actual experience from the existing SFR and the authors engineering judgment. Table 5-3 summarises the four Ground Types (GT) that have been defined for design stage L2 and the properties for these ground types are given in the forms that follow (SKB 2009).
A summary of the engineering-geological conditions is given as the observed variability within a block with the approximately dimensions: L = B = 250 m, H = 150 m.
Comparison of the description of the intact rock and rock mass in the SDM in the vicinity of the SFR extension with the descriptions provided for the existing SFR, suggests that the ground types are identical.
Table 5‑2. General Ground Behaviour Types and general description of the associated ground behaviour, modified from Schubert et al. (2001) and Palmström and Stille (2007).
Behaviour Type Ground Behaviour: Description of potential failure modes/mechanisms during excavation of the unsupported rock mass
1 Stable Stable rock mass
Gravity induced Ground Behaviour 2 Discontinuity controlled block fall Discontinuity controlled, gravity induced falling and sliding
of blocks3 Collapse Sudden near face collapse of large volume of blocky ground,
usually has zero stand-up time4 Running ground Potential for excessive over-break with the development of
chimney type failure.
Stress‑induced Ground Behaviour5 Buckling failure Buckling of rock slabs into tunnel with a narrowly spaced
discontinuity set6 Spalling Thin slabs form in regions of boundary hoop stress concentra-
tion. Usually found in sparsely fractured rock7 Strain/Rock burst Sudden and violent failure of the rock mass, caused by highly
stressed brittle rocks and the rapid release of accumulated strain energy
8 Squeezing Time dependent deformation, essentially associated with creep caused by overstressing. Deformations may terminate during construction or continue over a long period
Water influenced Ground Behaviour9 Slaking ground Ground breaks into flakes/pieces after being exposed to
moisture 10 Flowing ground Flow of intensely fractured rocks or soil with high water content11 Swelling Time dependent volume increase of the rock mass caused by
physical-chemical reaction of rock and water in combination with stress relief, leading to inward movement of the tunnel perimeter
12 Frequently changing behaviour Rapid variations of stresses and deformations, caused by heterogeneous rock mass conditions or block-in-matrix rock situation of a tectonic melange (brittle fault zone)
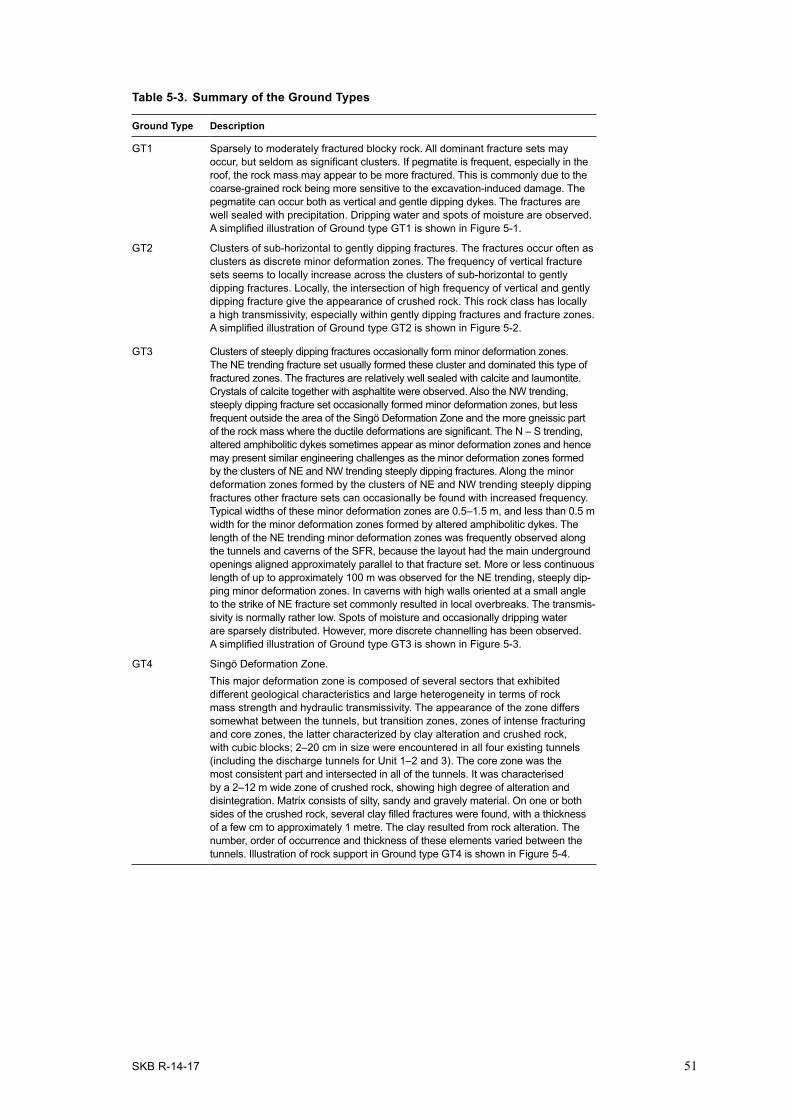
SKB R-14-17 51
Table 5‑3. Summary of the Ground Types
Ground Type Description
GT1 Sparsely to moderately fractured blocky rock. All dominant fracture sets may occur, but seldom as significant clusters. If pegmatite is frequent, especially in the roof, the rock mass may appear to be more fractured. This is commonly due to the coarse-grained rock being more sensitive to the excavation-induced damage. The pegmatite can occur both as vertical and gentle dipping dykes. The fractures are well sealed with precipitation. Dripping water and spots of moisture are observed. A simplified illustration of Ground type GT1 is shown in Figure 5-1.
GT2 Clusters of sub-horizontal to gently dipping fractures. The fractures occur often as clusters as discrete minor deformation zones. The frequency of vertical fracture sets seems to locally increase across the clusters of sub-horizontal to gently dipping fractures. Locally, the intersection of high frequency of vertical and gently dipping fracture give the appearance of crushed rock. This rock class has locally a high transmissivity, especially within gently dipping fractures and fracture zones. A simplified illustration of Ground type GT2 is shown in Figure 5-2.
GT3 Clusters of steeply dipping fractures occasionally form minor deformation zones. The NE trending fracture set usually formed these cluster and dominated this type of fractured zones. The fractures are relatively well sealed with calcite and laumontite. Crystals of calcite together with asphaltite were observed. Also the NW trending, steeply dipping fracture set occasionally formed minor deformation zones, but less frequent outside the area of the Singö Deformation Zone and the more gneissic part of the rock mass where the ductile deformations are significant. The N – S trending, altered amphibolitic dykes sometimes appear as minor deformation zones and hence may present similar engineering challenges as the minor deformation zones formed by the clusters of NE and NW trending steeply dipping fractures. Along the minor deformation zones formed by the clusters of NE and NW trending steeply dipping fractures other fracture sets can occasionally be found with increased frequency. Typical widths of these minor deformation zones are 0.5–1.5 m, and less than 0.5 m width for the minor deformation zones formed by altered amphibolitic dykes. The length of the NE trending minor deformation zones was frequently observed along the tunnels and caverns of the SFR, because the layout had the main underground openings aligned approximately parallel to that fracture set. More or less continuous length of up to approximately 100 m was observed for the NE trending, steeply dip-ping minor deformation zones. In caverns with high walls oriented at a small angle to the strike of NE fracture set commonly resulted in local overbreaks. The transmis-sivity is normally rather low. Spots of moisture and occasionally dripping water are sparsely distributed. However, more discrete channelling has been observed. A simplified illustration of Ground type GT3 is shown in Figure 5-3.
GT4 Singö Deformation Zone. This major deformation zone is composed of several sectors that exhibited different geological characteristics and large heterogeneity in terms of rock mass strength and hydraulic transmissivity. The appearance of the zone differs somewhat between the tunnels, but transition zones, zones of intense fracturing and core zones, the latter characterized by clay alteration and crushed rock, with cubic blocks; 2–20 cm in size were encountered in all four existing tunnels (including the discharge tunnels for Unit 1–2 and 3). The core zone was the most consistent part and intersected in all of the tunnels. It was characterised by a 2–12 m wide zone of crushed rock, showing high degree of alteration and disintegration. Matrix consists of silty, sandy and gravely material. On one or both sides of the crushed rock, several clay filled fractures were found, with a thickness of a few cm to approximately 1 metre. The clay resulted from rock alteration. The number, order of occurrence and thickness of these elements varied between the tunnels. Illustration of rock support in Ground type GT4 is shown in Figure 5-4.

52 SKB R-14-17
Figure 5‑1. Simplified illustration of a 10×10×10 m block of the rock mass in Ground Type GT1and applied support measures. (Carlsson and Christiansson 2007, Figure 7‑5).
Figure 5‑2. Simplified illustration of a 10×10×10 m block of the rock mass in Ground Type GT2and applied support measures. (Carlsson and Christiansson 2007, Figure 7‑7).

SKB R-14-17 53
Figure 5‑3. Simplified illustration of a 10×10×10 m block of the rock mass in Ground Type GT3 and applied support measures. (Carlsson and Christiansson 2007, Figure 7‑9).
Figure 5‑4. Rock support in Ground Type GT4. The wire mesh was later covered by shotcrete, Forsmark 1 and 2 discharge tunnel. (Carlsson and Christiansson 2007, Figure 7‑10).

54 SKB R-14-17
5.3 Ground behaviourThe categories of expected ground behaviour interpreted from the Site Descriptive Model are provided in Table 5‑4. These should be used to assess the system behaviour.
Table 5‑4. General categories for Ground Behaviour (GB). (Adapted from Table 5‑2).
Ground Behaviour
Description
GB1 Gravity driven, mostly discontinuity controlled failures (block falls), where pre-existing blocks in the roof and sidewalls become free to move once the excavation is made.
GB2 Gravity driven, mostly discontinuity controlled failures (block falls), where pre-existing blocks in the roof and sidewalls become free to move once the excavation is made.Water may also influence block falls, as it may lower the shear strength of unfavourable fracture surfaces, especially those with a soft filling or coating.
GB3 Frequently changing behaviourRapid variations of stresses and deformations, caused by heterogeneous rock mass conditions, such as brittle fault zones like SingöWater pressure is an important load to consider in design especially in heterogeneous rock conditions
GB4 Stress-induced Spalling. Should spalling occur the energy associated with it will be very minor. Experience from the existing SFR indicates this behaviour was occasionally observed in the pegmatite.
5.4 Support typesTo facilitate estimates for the ground support, support types (ST) are defined. These support types are based on the extensive underground construction experience in the Forsmark area, documented in the Construction Experience Report (Carlsson and Christiansson 2007) and modern day construction experience in the Scandinavian Shield. For design stage L2, three tunnel support types (ST1 through ST3) and one cavern support type (STC) are provided (Table 5‑5). The bolt type, spacing and length, and shotcrete thickness are not provided as part of the support types. That decision remains with the Designer when all the functional requirements and influence factors are considered.
Table 5‑5. Summary of support types to be used in design stage L2.
Support type Description
ST1 Systematic bolting, Example Ground Types 1 and 2 Example: Ground Behaviour 1 and Ground behaviour 2A
ST2 Systematic bolting plus fibre-reinforced shotcrete Example: Ground Types 1, 2 and 3Example: Ground Behaviour 1 and 2B
ST3 Steel arches, such as lattice girders, including invert support
Example: Ground Type 4Example: Ground Behaviour 3
STC Caverns Systematic bolting plus fibre-reinforced shotcrete All ground types suitable for cavernsExample: Ground Behaviour 1 and 2

SKB R-14-17 55
5.5 Grouting TypesLikewise, grouting types (GRT) are also defined based on the construction experience at Forsmark and elsewhere. Because grouting technology has advanced significantly since the construction of the Forsmark facilities, the grouting types have been modified to incorporate those changes.
The need for construction grouting at Forsmark will vary significantly as the hydraulic properties of the rock mass varies from large volumes of intact rock to that of discrete open fractures connected to a constant head (Baltic Sea). These were also the conditions encountered during the construction of the underground excavation associated with the Forsmark nuclear power plants and SFR Facility (Carlsson and Christiansson 2007).
For the current design stage L2, three grouting types (GRT1 through GRT3) are provided and this number is considered sufficient to meet the design requirements (Table 5-6). The parameters that define each grouting type, e.g. number of holes, spacing, number of stages, and the type of grouting material are not provided. Those parameters must be chosen by the Designer to meet the grouting criteria specified in Table 5-6 and site specific conditions (transmissivities and hydraulic head). Based on this information the Designer must evaluate if the predicted inflows exceeds the seepage requirements. If grouting must be carried out, the Designer must specify the parameters for the grout type that will achieve the required seepage. The Designer shall define seepage limit values required for the application to the Environmental Act. The methodology that shall be used to estimate the grout quantities required to meet the seepage limits is given by e.g. Emmelin et al. (2007).
The grout-hole lengths, number of holes, spacing, pressures, and grouting material are not provided as part of the grouting types. That decision remains with the Designer when all the functional requirements and influence factors are considered. It is anticipated that the execution of grouting works will be carried out using the Observational Method.
Table 5‑6. Summary of grouting types to be used in design stage L2.
Grouting type Description
GRT1 Discrete fracture groutingGRT2 Systematic tunnel groutingGRT3 Control of large inflows
5.6 Variability and uncertainty in key parametersTo assess the system behaviour, if design by prescriptive measures can’t be applied, values must be assigned to key parameters that will be used in this assessment. There is no doubt that uncertainty and spatial variability exists in these values. The values assigned to each parameter are primarily based on the data provided in Chapter 4 of this report. To establish the system behaviour the Designer is provided with what is judged to be the most likely value and a deterministic design based on this value may be adequate in most cases. However, in keeping with the philosophy of risk management for underground excavations embedded in the Observational Method, a range of values that represent conceivable best and worst case conditions may also be provided. The range in values is provided when it is judged that a change in this value may significantly impact the design. For example, the heterogeneity in the Singö Deformation Zone might influence the construction of the new access tunnel. For such situations a probability-based approach or engineering judgement may be required to explore the likely outcome. Probability functions are usually not known for many of the design parameters and for such cases a triangular distribution may be assumed, truncated by a minimum and maximum value (SKB 2009).

SKB R-14-17 57
6 Design constraints
6.1 Geotechnical design Geotechnical category (GK) guides the extent of investigations, dimensioning, control and follow-up. The selection of geotechnical category for rock tunnels in Sweden follows the categories shown below (IEG 2010):
GK1: Not applicable for rock tunnels.
GK2: Applicable when general practical experience of similar rock structures exists. Dimensioning and design can be done using generally accepted methods.
GK3: Requires details plans for those tunnelling conditions that fall outside the limits of GK2.
It is suggested that geotechnical category GK2 be applied to the repository caverns and tunnels. Where the access tunnel intersects the Singö Deformation Zone, geotechnical category GK3 shall apply. In addition, design and excavation close to or connected to the existing SFR may need special attention, and consequently geotechnical category GK3 shall apply in tunnel sections where excava-tion works are deemed to influence the existing SFR.
6.1.1 Design methodologyThe SER has extracted the relevant data from the SDM that pertains to the design of the new under ground openings of SFR and integrated it with the construction experiences from the nearby Forsmark facilities. For design stage L2, the Designer should consider the design approach provided by Schubert et al. (2001) that evaluates System Behaviour (see Section 5.1). The results from this approach should be checked against the local practices provided in the Construction Experience Compilation Report (Carlsson and Christiansson 2007) and other reports such as Christiansson (1986) and Christiansson and Bolvede (1987) for the existing Forsmark facilities (see Section 2.1.1). The analysis of the system behaviour shall assess the range of possible behaviour and show that there is an acceptable probability that the actual behaviour will be within the acceptable limits in terms of:
• Stability of underground openings.
• Repository design requirements.
• Acceptable seepage limits.
All analyses used to assess the system behaviour should be documented in a way that is traceable and auditable.
6.1.2 Detailed designThe outcome of design stage L2 will provide input to detail design, where construction issues will be addressed in more detail, and the requirement to develop excavation classes, site construction plan and tender documents. The excavation classes are defined based on the evaluation of the sup-port, excavation and grouting requirements. The distribution of the expected ground behaviour and the excavation classes in the repository provides the basis for establishing the construction plan and tender documents. This stage of the design is not described in this SER and would take place during the detailed design stage.
6.1.3 Observational MethodThe Observational Method may be required for some aspects of the design. Those aspects that are amenable to the requirements of the Observational Method should be highlighted during the detailed design.

58 SKB R-14-17
a) b)a)
0 5 10 15
0-5
0-1
00-1
50-2
00-2
50-3
00-3
50-4
00-4
50-5
00
PF-f logged core lengthin HRD (m/m)L
b)
-9 -8 -7 -6 -5 -4Transmissivity, log T
ZFMPDZHRD
0 5 10 15
0-5
0-1
00-1
50-2
00-2
50-3
00
PFL-f logged core length outsideZFM, binned by elevation (m/m)
Elev
atio
n (m
, RH
B70
)
Elev
atio
n (m
, RH
B70
)
KFR27 (coarse)KFR27KFR102AKFR104KFR105
-9 -8 -7 -6 -5 -4Transmissivity, log T
IntervalNwGdHzNEEW
SBA1
SBA2
SBA6
KFR106KFR27KFR101KFR102AKFR102BKFR103KFR104KFR105
6.2 Siting6.2.1 Central BlockThe target site for the extension of SFR (Central Block) is bordering but is also partly situated within the construction area of the existing SFR. Consequently, the detailed geological, hydrogeological and rock mechanical information collected and evaluated during the construction of the existing SFR (and not at least engineering implications) gives a unique data base for utilisation in the design and construction of the new facility. The results from the SDM-PSU Forsmark (SKB 2011) indicate that the rock mass conditions for the SFR extension are comparable with the rock conditions found at the existing SFR. The siting of the SFR should consider the following:• The new facility should occupy as minimum a footprint area as practical and be located as close
to the existing SFR as feasible.• The width of the pillars separating the caverns shall range from a width to height ratio from
0.75 to 1 or kept to a practical minimum.• The depth of the roof of the highest cavern in the repository is set at around –120 m. • It is not possible to select a depth that will eliminate the risk for encountering water bearing fractures.
The Designer should be aware of this risk and ensure that subsequent design steps address this issue.
6.2.2 Repository DepthThe depth of the existing SFR Facility is –70 m (depth of the highest cavern roof). The hydrogeology model in the Site Descriptive Model (SDM), indicate that at this –70 m depth the Shallow Bedrock Aquifers (SBA) 1 and SBA 2 will intersect the repository (cf. Figure 6-1).
KFR105 is a gentle dipping borehole. When flushing KFR105, high pressure responses were obtained in borehole KFR27 within sections where horizontal/sub-horizontal SBA structures with high T-values had been modelled (SBA1 and SBA2). This indicates that there is hydraulic contact between gentle dipping structures at the depth of the existing SFR. The depth interval between SBA1 and SBA2 exhibits more high transmissivities than the interval between SBA2 and SBA6 in spite of less number of drill metres than in the upper interval.
From a construction and logistics perspective it is preferred to construct the SFR extension at the same depth as the existing SFR caverns. It is however recommended to consider that the caverns for the extension be lowered to avoid SBA1 and SBA2. A depth around –120 m would place the repository below SBA2, but above SBA6. Experience from the underground works of the existing repository area involves construction between –70 m (depth of the highest cavern roof) and –140 m (depth of the bottom level of the silo). Hence, relevant experience is available for excavation at the proposed depth of the SFR extension (cf. Figure 6-2).
Figure 6‑1. The left part of the figure shows all boreholes and all PFL‑data within the investigated area. The right part represents boreholes adjacent to the planned extension area (the central area) and data from PFL as well as injection tests.

SKB R-14-17 59
6.3 Access tunnelThe access tunnel will likely intersect gently dipping structures in the uppermost part of the tunnel. This fracturing is generally referred to as stress release fracturing. No such structures were observed below the passage of the Singö Deformation Zone in the existing SFR tunnels.
6.3.1 Singö Deformation Zone• The access tunnel will intersect the Singö Deformation Zone at about the same location as the
two existing SFR access tunnels, but slightly deeper.
• The Designer should, in design stage L2, review and evaluate the excavation and support methodology used in the existing access tunnels, and incorporate modern construction, support and grouting techniques, such as use of lattice girders, pipe umbrellas, shorter rounds etc.
6.4 Repository area6.4.1 General Conditions• The rock mass hydraulic conditions in the repository area are judged to be comparable with the
conditions of the existing SFR. This statement is based on Forsmark experience and on the new data, presented by the SDM-PSU Forsmark (SKB 2011).
• The rock mass mechanical conditions in the repository area are judged to be comparable with the conditions of the existing SFR. This statement is based on Forsmark experience and on the new data, presented by the SDM-PSU Forsmark (SKB 2011).
• The alignment of the caverns axis in layout stage L1.5 shall be 30 degrees East of North. This alignment is consistent with the alignment of the existing facility. This orientation will intersect the steeply dipping water bearing fractures at a large angle, which will facilitate grouting if required. This orientation is also preferred for the grouting of gently dipping fractures, if required.
Figure 6‑2. View of the SFR extension showing elevations according to RHB 70.
Sea bottom -2,3m
Rock surface -5,8mLoading zone 1BMA -68m Silo dome -64m
2NDB -143m 3NDB -144m
2BLA -137m
2BMA -117m
Silo bottom-133m
Lower drainage basin-143m
Sea levelElevation reference
RHB 70
-70m
0m
-120m
-140m
JettySea bottom -2,3m
Rock surface -5,8mLoading zone 1BMA -68m Silo dome -64m
2NDB -143m 3NDB -144m
2BLA -137m
2BMA -117m
Silo bottom-133m
Lower drainage basin-143m
Sea levelElevation reference
RHB 70
-70m
0m
-120m
-140m
Jetty

60 SKB R-14-17
6.4.2 Cavern‑pillar widthOne of the design constraints is the width of the pillar separating the caverns. In order to minimize the foot print area, the cavern pillar width should be kept to a minimum. The stresses in a pillar will increase as the pillar width decreases. The relationship between pillar width and average pillar stress is given by Brady and Brown (2004). A cross section through a series of long caverns and rib pillars, of uniform thickness is shown in Figure 6-3. According to Brady and Brown (2004), the average stresses (sp) in the rib pillars are given by:
sp = sv (wo + wp)/wp
where sv is the vertical stress and the cavern spans and pillar spans are wo and wp, respectively.
Using a cavern width of 15.5 m for the BLA Caverns, the average pillar stresses become a function of the cavern depth and the pillar width. Figure 6-4 shows the average pillar stresses for 50 m and 150 m depths for the BLA Caverns with a width of 15.5 m. Experience has shown that pillars become overstressed when the average pillar stresses exceed approximately 1/3 of the laboratory uniaxial compressive strength (UCS) (Martin and Maybee 2000). Using a laboratory UCS value of 200 MPa for the Forsmark granite, the pillar stress for a 10 m wide pillar at a depth of 120 m is approximately 8.3 MPa, i.e., 0.04UCS. Hence there is no risk of overstressing the pillars for any of the depths and pillar widths shown in Figure 6-4.
Figure 6‑3. A cross section through a series of long caverns and rib pillars.
wo wp
Figure 6‑4. Average pillar stress for 60 m and 100 m depth assuming a width of 15.5 m for the BLA Caverns.
6 8 10 12 14 16 18 20
Pillar width (m)
Aver
age
pilla
r stre
ss (M
Pa)
Cavern width = 15.5 m
Depth = 150 m
Depth = 50 m
0
5
10
15
20

SKB R-14-17 61
6.4.3 Cavern AlignmentThe alignment of the caverns must balance:
1. The orientation of the caverns relative to the orientation of the maximum horizontal stress. Because of the shallow depth the stress magnitudes on the cavern boundary relative to the rock strength is so low that any cavern orientation can be used.
2. Orientation of the caverns relative to steeply dipping water bearing deformation zones. The caverns should be either parallel to the deformation zones or intersect them at 90 degrees. The steeply dipping deformation zones at Forsmark are not considered to be significant water bearing structures and have been identified primarily using magnetic geophysics and lineament studies. It is judged that the orientation of these deformation zones should not affect the layout, stability or construction of the caverns.
3. Orientation of the caverns relative to steeply dipping water bearing discrete fractures. To facilitate the grouting of these fractures the caverns should be aligned at a large angle to the orientation of the fractures, i.e., approximately perpendicular.
The construction of the existing SFR Caverns did not reveal new information that suggested the caverns should have been aligned in a different orientation. The orientation of the steeply dipping water conductive discrete fractures (PFL) in the SDM-PSU is shown in Figure 6-5. Also shown in Figure 6-5 is the orientation of the long-axis of the existing SFR Caverns. The results from the SDM-PSU suggest that the orientation of the existing caverns is also appropriate for planned extension.
6.5 Monitoring and documenting the performance of underground excavations
In Section 2.1.3 it was noted that the Observational Method shall be used as a key component in the design of the underground excavations. As listed in Section 2.1.3, one of the steps in the Observational Method is to develop a monitoring plan that can be used to assess whether the actual ground system behaviour lies within the acceptable limits of the predicted behaviour.
By monitoring the key elements of the system, the observed system behaviour during construction can be compared with the predicted system behaviour. In order to make this assessment a monitoring and documentation plan will be required. The basic elements of that monitoring/documenting plan are focused on providing the Designers with sufficient information to make the assessment. For design stage L2, the Designer shall propose a monitoring plan for the access tunnel and the reposi-tory area. These plans should address the uncertainty in the design assumptions, particularly where the consequences of this uncertainty may significantly impact the design and/or performance of the project. Prior to the start of any excavation an assessment will be made of the adequacy of available geological and geotechnical information to predict the underground system behaviour.
Figure 6‑5. Orientation of the steeply dipping water conductive fractures (PFL). Also shown is the orientation of the long‑axis of the existing SFR Caverns.

62 SKB R-14-17
6.6 Permanent ground supportIn the existing SFR access tunnels support was provided, in some areas, using spot-bolts. This resulted in the SFR operations being responsible for ensuring scaling of tunnel loose which develops with time. Because of the long operational period (generations), spot bolting and scaling is not considered a long-term solution for permanent tunnel support. It is however not possible to select a ground support system that entirely eliminate the need of maintenance measures. The Designer should therefore explore the various options that could be used to provide a ground support system that requires a minimum of maintenance.

SKB R-14-17 63
7 References
SKB’s (Svensk Kärnbränslehantering AB) publications can be found at www.skb.se/publications.
Berglund J, 2008. Site investigation SFR. Geological mapping and laser scanning of the lower construction tunnel. SKB P-09-74, Svensk Kärnbränslehantering AB.
Brady B H G, Brown ET, 2004. Rock mechanics for underground mining. 3rd ed. London: Chapman & Hall.
Brown E T (ed), 1981. Rock characterization, testing and monitoring. ISRM Suggested Methods. Oxford: Pergamon Press.
Carlsson A, 1979. Characteristic features of a superficial rock mass in Southern central Sweden: horizontal and sub-horizontal fractures and filling material. Uppsala: Societas Upsaliensis pro geologia quaternaria. (Striae 11)
Carlsson A, Christiansson R, 1987. Geology and tectonics at Forsmark, Sweden. SKB SFR 87-04, Svensk Kärnbränslehantering AB.
Carlsson A, Christiansson R, 1988. Site investigations for the Swedish undersea repository for reactor waste. In Romana M (ed). Rock mechanics and power plants: proceedings of ISRM Symposium, Madrid, 12–16 September 1988. Rotterdam: Balkema.
Carlsson A, Christiansson R, 2007. Construction experiences from underground works at Forsmark. Compilation report. SKB R-07-10, Svensk Kärnbränslehantering AB.
Carlsson A, Hedman T, 1986. Tunnelling of the Swedish undersea repository for low and interme-diate reactor waste. Tunnelling and Underground Space Technology 1, 243–250.
Carlsson A, Olsson T, 1977. Water leakage in the Forsmark tunnel, Uppland, Sweden. Uppsala: SGU. (Sveriges geologiska undersökning, Serie C 734)
Carlsson A, Olsson T, 1982. High rock stresses as a consequence of glaciations. Nature 298, 739–742.
Carlsson A, Olsson T, Stille H, 1985. Submarine tunnelling in poor rock. Tunnels & Tunnelling 17, 21–25.
Carlsson A, Lintu Y, Olsson T, 1987. Undersökningar av utförda injekteringsarbeten i slutförvar för reaktoravfall (SFR), Forsmark. FUD-rapport U (B) 1987/41, Vattenfall, Sweden.
Christiansson R, 1986. Geologisk beskrivning av zoner kring slutförvaret. SKB SFR 86-02, Svensk Kärnbränslehantering AB. (In Swedish.)
Christiansson R, Bolvede P, 1987. Byggnadsgeologisk uppföljning. Slutrapport. SKB SFR 87-03, Svensk Kärnbränslehantering AB. (In Swedish.)
Christiansson R, Magnusson K-Å, 1985. Geologisk miljö kring Silo 1. SKB SFR 85-07, Svensk Kärnbränslehantering AB. (In Swedish.)
Curtis P, Markström I, Petersson J, Triumf C-A, Isaksson H, Mattsson H, 2011. Site investigation SFR. Bedrock geology. SKB R-10-49, Svensk Kärnbränslehantering AB.
EN 1990:2002. Eurocode: Basis of structural design. Brussels: European Committee for Standardization.
Emmelin A, Brantberger M, Eriksson M, Gustafson G, Stille H, 2007. Rock grouting. Current competence and development for the final repository. SKB R-07-30, Svensk Kärnbränslehantering AB.
Follin S, Johansson P-O, Hartley L, Jackson P, Roberts D, Marsic N, 2007. Hydrogeological conceptual model development and numerical modelling using ConnectFlow, Forsmark modelling stage 2.2. SKB R-07-49, Svensk Kärnbränslehantering AB.
Glamheden R, Mærsk Hansen L, Fredriksson A, Bergkvist L, Markström I, Elfström M, 2007. Mechanical modelling of the Singö deformation zone. Site descriptive modelling Forsmark stage 2.1. SKB R-07-06, Svensk Kärnbränslehantering AB.

64 SKB R-14-17
IEG, 2008. Tillämpningsdokument – Dokumenthantering. IEG rapport 4:2008, Implementeringskommission för Europastandarder inom Geoteknik. (In swedish.)
IEG, 2010. Tillämpningsdokument Bergtunnel och Bergrum. IEG rapport 5:2010, Implementeringskommission för Europastandarder inom Geoteknik. (In swedish.)
Martin C D, Maybee W G, 2000. The strength of hard-rock pillars. International Journal of Rock Mechanics and Mining Sciences 37, 1239–1246.
Munier R, Stenberg L, Stanfors R, Milnes A G, Hermanson J, Triumf C-A, 2003. Geological Site Descriptive Model. A strategy for the model development during site investigations. SKB R-03-07, Svensk Kärnbränslehantering AB.
Palmström A, Stille H, 2007. Ground behaviour and rock engineering tools for underground excavations. Tunnelling and Underground Space Technology 22, 363–376.
Peck R B, 1969. Advantages and limitations of the observational method in applied soil mechanics. Géotechnique 19, 171–187.
Schubert W, Goricki A, Button E A, Riedmüller G, Pölser P, Steindorfer A F, Vanek R, 2001. Consistent excavation and support determination for the design and construction of tunnels. Felsbau 19, 85–92.
SKB, 2008. Site description at Forsmark at completion of the site investigation phase. SDM-Site Forsmark. SKB TR-08-05, Svensk Kärnbränslehantering AB.
SKB, 2009. Site engineering report Forsmark. Guidelines for underground design, Step D2. SKB R-08-83, Svensk Kärnbränslehantering AB.
SKB, 2011. Site description of the SFR area at Forsmark at completion of the site investigation phase. SDM-PSU Forsmark. SKB TR-11-04, Svensk Kärnbränslehantering AB.
SS-EN 1997-1:2005. Eurocode 7: Geotechnical design – Part 1: General rules. Stockholm: Swedish Standards Institute.
Stephens M B, Fox A, La Pointe P, Simenov A, Isaksson H, Hermanson J, Öhman J, 2007. Geology Forsmark. Site descriptive modelling Forsmark stage 2.2. SKB R-07-45, Svensk Kärnbränslehantering AB.
Öhman J, Bockgård N, Follin S, 2012. Bedrock hydrogeology. Site investigation SFR. SKB R-11-03, Svensk Kärnbränslehantering AB.

SKB R-14-17 65
Appendix A
Tunnelling through the Singö Deformation ZoneFour tunnels were excavated through the Singö Deformation Zone: the discharge tunnels of Forsmark units 1 and 2, unit 3 and the access tunnels of the SFR. Carlsson and Christiansson (2007) have summarized the construction experience from Forsmark nuclear power plant and the SFR Facility. Valuable information on the SFR rock mass conditions is also presented in Christiansson (1986) and Christiansson and Bolvede (1987).While the construction experience is restricted to depths between 0 and 140 m depth, it is indicative of the construction conditions that could be encountered when excavating the access tunnel for the SFR extension.
A1 Forsmark unit 1 and 2 discharge tunnel The problems that occurred within the Singö Deformation Zone in the discharge tunnel unit 1 and 2, which comprises brecciated metagranite of aplitic type, resulted in minor weathering and water inflows along rock contacts. There were also a few sub-vertical clay-filled fractures with fracture openings of up to 500 mm (Figure A-1). These fractures were supported with dental treatment and reinforced shotcrete arches; i.e. weak material was excavated for full width of zone to firm material or to depth equal to width of zone. The zone was backfilled with shotcrete extended approximately 1 m of either side of the clay-filled zone on to sound rock, where after permanent mesh/shotcrete layers were applied. The frequency of open fractures within the brecciated zone showed an increase within a 50 m long section, while the fractures are mainly sealed in the remaining part of the zone (Figure A-2). The water inflow within the Singö Deformation Zone (about 200 m) was 3.9 l/min m.
Figure A‑1. Clay‑filled fracture in brecciated metagranite within the Singö Deformation Zone, Forsmark 1 and 2 tunnel (Carlsson and Olsson 1977, Carlsson and Christiansson 2007, Figure 4‑3).

66 SKB R-14-17
A2 Forsmark unit 3 discharge tunnelIn the unit 3 discharge tunnel, the Singö Deformation Zone consists mainly of reddish metavolcanics and aplitic metagranite, which has been brecciated and partly altered to clay. The average frequency of fractures was estimated at 10 per metre. In section 2/515–2/530, the rock was characterized as fragments of fresh rock separated by layers of altered, crushed and disintegrated rock, and in section 2/530–2/545, large amounts of rock had been transformed into clay. Nine samples of clay were taken and analysed by means of X-ray diffraction, showing the minerals hydro-mica, chlorite, hematite-stained plagioclase feldspar, and quartz, but no swelling clay minerals were identified.
After a round had been blasted at section 2/545, there was a tendency for rock to break away above the theoretical roof of the tunnel, so an approximately 2 m wide, singly reinforced arch of shotcrete was constructed and singly reinforced shotcrete was also placed back up the tunnel, over a distance of about 10 metres from the arch, to protect those working in the area. Rock ahead of the face was investigated by drilling a 23 m long pilot- hole collared just above the bottom of the tunnel. On the basis of the observations made from the pilot hole, a decision was taken to blast a new, 4.5 m deep round. The holes for the round were located one metre inside the theoretical contour of the tunnel section and the size of the charge was reduced.
After the round had been blasted, the drilled holes (half pipes) could be seen clearly, but the rock started to give away after about three hours. Rock falls started at the tunnel face, then from the roof and finally from the walls. All surfaces were shotcreted, but rock falls continued and arching started. A decision was then taken to manufacture steel arches. Shotcreting was then carried out on three shifts while the arches were being made and the arch was stabilized after a time. Further rock falls were observed, however, and before the steel arches were placed in position, cleaning work was carried out and the bottom slab for the arches was cast.
Figure A‑2. Brecciated metagranite within the Singö Deformation Zone with numerous veins of quartz and calcite, Forsmark 1 and 2 tunnel (Carlsson and Olsson 1977, Carlsson and Christiansson 2007, Figure 4‑4).

SKB R-14-17 67
One 4 m section of steel shuttering was erected and casting could be started. But new rock falls occurred during casting, of which the largest fall involved 200 m3 of rock from the face and the left-hand side of the tunnel. The shuttering was cleaned and filling the arch with concrete prevented fur-ther rock falls. At the worst point, the arch extended to 7.5 m above the theoretical roof of the tunnel. The total cover of rock (to the sea bottom) at this section amounted to about 58 m (cf. Figure A-3). The method used to support this section is briefly described below and illustrated in Figure A-4.
Figure A‑3. The steel arch placed in position within the over‑break area in section 2/545 in the Singö Deformation Zone, Forsmark 3 tunnel. b. Further rock fall occurred after the erection of the steel arch; section 2/545 in the Singö Deformation Zone, Forsmark 3 tunnel. (Carlsson and Christiansson 2007, Figure 4‑11).

68 SKB R-14-17
The area ahead of the steel shutter was filled to the upper edge of the shutter with rock, and wooden stop ends were constructed between the steel shutter and the arch of shotcrete at the roof of the tunnel. Several concreting pipes were introduced into the arch and it was filled with concrete. Supporting work was carried out about 7 m ahead of the steel shutter, with reinforced shotcrete on the roof and walls, down to the bottom of the tunnel.
Holes were drilled to the top of the arch and the top surface of the concrete was checked. Excavation was performed to release the shutter and the shotcrete support was continued down to the bottom of the tunnel. The steel shutter was removed and blocks of rock projecting into the cast concrete were chiselled out and the holes were repaired with shotcrete. Excavation was started in stages, alternated with shotcreting between section 2/538 and the tunnel face.
The concrete inside the section of the shutter was removed by careful blasting. Bolts were fixed in a radial form from the face of the tunnel at an upward angle of 45 degrees from the horizontal. Three 25 m long pilot holes were drilled, of which two were in the sides and one in the middle of the tunnel. The shotcreting unit was in position and a new steel shutter was ready before driving was continued.
The next round was blasted with careful blasting, the steel shutter was erected and a 400 mm, un-reinforced concrete arch was cast immediately. The remaining driving through the Singö Deformation Zone was achieved without noteworthy problems (Carlsson et al. 1985, Carlsson and Hedman 1986).
The rock support applied within the Singö Deformation Zone in the two cooling water discharge tunnels is given in Table A-1
Figure A‑4. The method used to support section 2/545 in the Singö Deformation Zone, Forsmark unit 3 tunnel. (Carlsson and Christiansson 2007, Figure 4‑13).

SKB R-14-17 69
Table A‑1. Supported tunnel length as percentage of total length of Singö Deformation Zone (200 m) in the tunnels of Units 1, 2 and 3 respectively (Carlsson et al. 1985). cf. Table A‑2.
Type of support Permanent rock Bolts* %
Shotcrete % Shotcrete % Shotcrete arches %
In situ cast concrete arches** %
Grouting %
Description ø 25; L: 4 m Un-reinforced; T: 100–200 mm
T: 80–90 mm; # ø 6 c 150
T: 80–90 mm # ø 6 c 150 alternatively T: 200 mm # ø 12 c 150
Unit 1 and unit 2 tunnel (top- heading)
67 65 4 16 – 10
Unit 3 tunnel 66 36 24 17 17 13
* Number of permanent bolts: 460; 1bolt/ 8 m2.** Steel shuttering.Note: Temporary bolts, normally 1 bolt/ 13 m2.
A3 SFR access tunnelsThe Singö Deformation Zone intersected in the SFR access tunnels was dominated by foliated metasediments/metavolcanics with pegmatite, and mylonitic structure. To avoid problems such as those encountered in the unit 3 tunnel, unusually large allowances were made for the driving of the SFR access tunnels. Based on earlier experience, an operational schedule was established. The schedule comprised a lowering of the tunnel elevation at its intersection with the Singö Deformation Zone from 15 m down to 23 m below the seabed, exploratory drilling, pre-grouting, pre-bolting, reduced advance of driving per round, systematic bolting and reinforced arches of shotcrete, and the performance of deformation measurements.
When the tunnelling was approaching the critical area, two horizontal diamond drill holes, 100 and 120 m in length, respectively, were drilled ahead of the tunnel faces. In addition, pilot drilling with the jumbos was carried out continuously with three 20 m long holes into the roof and walls. The water inflow into the pilot holes was measured in such a way that at least one round (4.7 m) overlapped previous pilot holes.
Based on information from the pilot drilling, pre-grouting was carried out from the tunnel face, with a double curtain at the crown and a single curtain at the bottom. Pre-grouting was performed when the quantity of water inflow exceeded 3–4 l per min from a 20-m borehole. The maximum water inflow in one single borehole amounted to 170 l/min and pre-grouting was carried out at 15 points along the deformation zone. The length of the boreholes was approximately 15 m and the grouting was carried out as campaign grouting for 2 hours, with a final pressure of 1.5–2 MPa. About 1 T of rapid hardening cement was used for each round of grouting, on average.
The steady-state water inflow within the Singö Deformation Zone after excavation amounted to approximately 60 l/min in the two tunnels, and the leakage was concentrated in a 12 m long section.
An evaluation of the performed grouting works in the Singö Deformation Zone, SFR was carried out by Carlsson et al. (1987). They concluded that the grouting was effective, and normally more than a 75% reduction of the rock mass permeability was achieved. The study also showed that when the grouting was performed both from the construction tunnel and from the operation tunnel, a much more improved result was obtained due to variations in cut angles between grout-holes and water-bearing fractures. When grouting from the two tunnels, the grout penetrated two to three times more water-bearing fractures.
Pre-bolting of the next round was carried out regularly, using approximately eight 5-m long cement grouted bolts. The pre-bolting proved to be very successful, so that even in areas of clay-mineralized and weathered rock, the contour of the roof was good. On one occasion when pre-bolting was omit-ted, some stability problems occurred. However, no problems were encountered in the connection with the next round of corresponding rock mass quality when pre-bolting was employed.
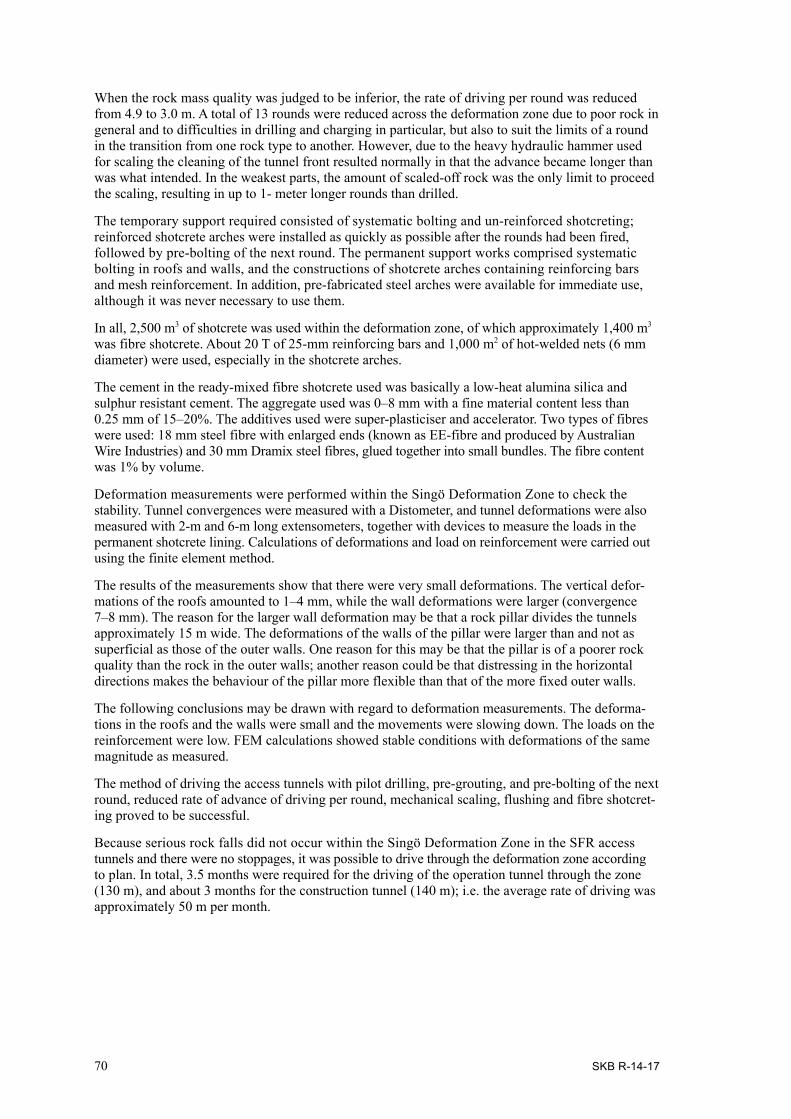
70 SKB R-14-17
When the rock mass quality was judged to be inferior, the rate of driving per round was reduced from 4.9 to 3.0 m. A total of 13 rounds were reduced across the deformation zone due to poor rock in general and to difficulties in drilling and charging in particular, but also to suit the limits of a round in the transition from one rock type to another. However, due to the heavy hydraulic hammer used for scaling the cleaning of the tunnel front resulted normally in that the advance became longer than was what intended. In the weakest parts, the amount of scaled-off rock was the only limit to proceed the scaling, resulting in up to 1- meter longer rounds than drilled.
The temporary support required consisted of systematic bolting and un-reinforced shotcreting; reinforced shotcrete arches were installed as quickly as possible after the rounds had been fired, followed by pre-bolting of the next round. The permanent support works comprised systematic bolting in roofs and walls, and the constructions of shotcrete arches containing reinforcing bars and mesh reinforcement. In addition, pre-fabricated steel arches were available for immediate use, although it was never necessary to use them.
In all, 2,500 m3 of shotcrete was used within the deformation zone, of which approximately 1,400 m3 was fibre shotcrete. About 20 T of 25-mm reinforcing bars and 1,000 m2 of hot-welded nets (6 mm diameter) were used, especially in the shotcrete arches.
The cement in the ready-mixed fibre shotcrete used was basically a low-heat alumina silica and sulphur resistant cement. The aggregate used was 0–8 mm with a fine material content less than 0.25 mm of 15–20%. The additives used were super-plasticiser and accelerator. Two types of fibres were used: 18 mm steel fibre with enlarged ends (known as EE-fibre and produced by Australian Wire Industries) and 30 mm Dramix steel fibres, glued together into small bundles. The fibre content was 1% by volume.
Deformation measurements were performed within the Singö Deformation Zone to check the stability. Tunnel convergences were measured with a Distometer, and tunnel deformations were also measured with 2-m and 6-m long extensometers, together with devices to measure the loads in the permanent shotcrete lining. Calculations of deformations and load on reinforcement were carried out using the finite element method.
The results of the measurements show that there were very small deformations. The vertical defor-mations of the roofs amounted to 1–4 mm, while the wall deformations were larger (convergence 7–8 mm). The reason for the larger wall deformation may be that a rock pillar divides the tunnels approximately 15 m wide. The deformations of the walls of the pillar were larger than and not as superficial as those of the outer walls. One reason for this may be that the pillar is of a poorer rock quality than the rock in the outer walls; another reason could be that distressing in the horizontal directions makes the behaviour of the pillar more flexible than that of the more fixed outer walls.
The following conclusions may be drawn with regard to deformation measurements. The deforma-tions in the roofs and the walls were small and the movements were slowing down. The loads on the reinforcement were low. FEM calculations showed stable conditions with deformations of the same magnitude as measured.
The method of driving the access tunnels with pilot drilling, pre-grouting, and pre-bolting of the next round, reduced rate of advance of driving per round, mechanical scaling, flushing and fibre shotcret-ing proved to be successful.
Because serious rock falls did not occur within the Singö Deformation Zone in the SFR access tunnels and there were no stoppages, it was possible to drive through the deformation zone according to plan. In total, 3.5 months were required for the driving of the operation tunnel through the zone (130 m), and about 3 months for the construction tunnel (140 m); i.e. the average rate of driving was approximately 50 m per month.
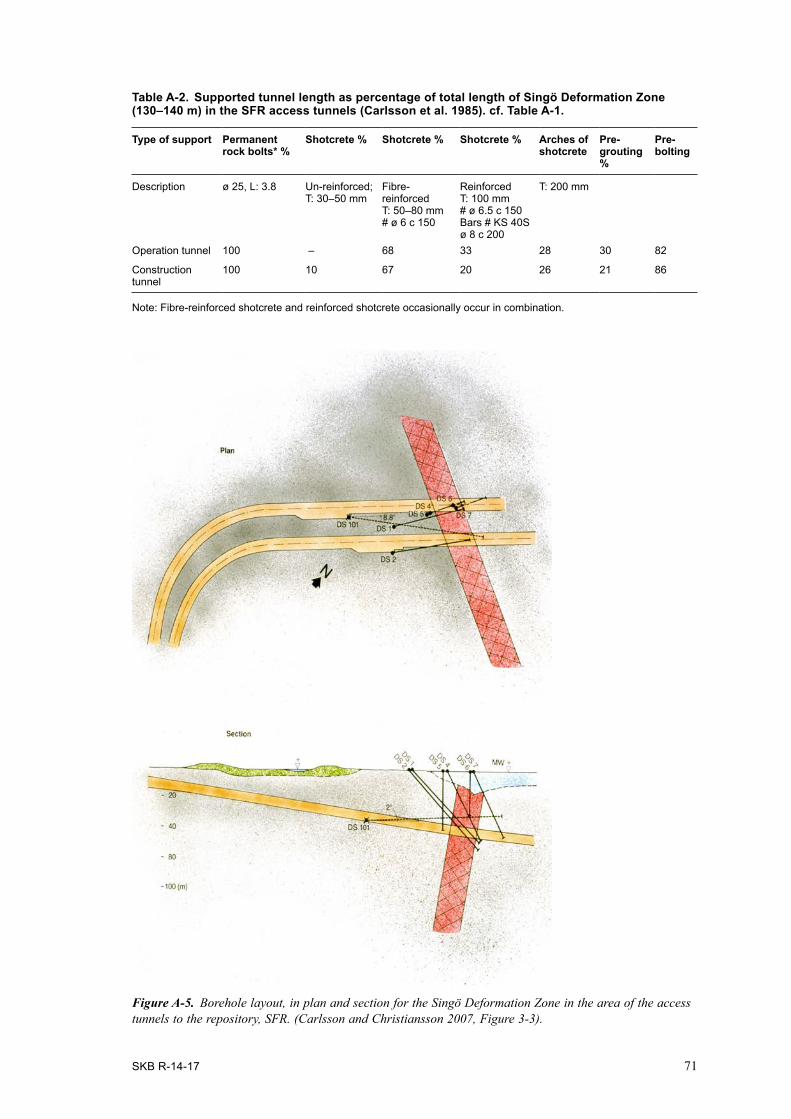
SKB R-14-17 71
Figure A‑5. Borehole layout, in plan and section for the Singö Deformation Zone in the area of the access tunnels to the repository, SFR. (Carlsson and Christiansson 2007, Figure 3‑3).
Table A‑2. Supported tunnel length as percentage of total length of Singö Deformation Zone (130–140 m) in the SFR access tunnels (Carlsson et al. 1985). cf. Table A‑1.
Type of support Permanent rock bolts* %
Shotcrete % Shotcrete % Shotcrete % Arches of shotcrete
Pre‑grouting %
Pre‑bolting
Description ø 25, L: 3.8 Un-reinforced; T: 30–50 mm
Fibre-reinforced T: 50–80 mm # ø 6 c 150
Reinforced T: 100 mm # ø 6.5 c 150 Bars # KS 40S ø 8 c 200
T: 200 mm
Operation tunnel 100 – 68 33 28 30 82
Construction tunnel
100 10 67 20 26 21 86
Note: Fibre-reinforced shotcrete and reinforced shotcrete occasionally occur in combination.

SKB R-14-17 73
Appendix B
Hydraulic conditions in the existing SFRB1 Highly transmissive and gently dipping fracture zonesThe occurrence of gentle dipping fractures in the superficial rock mass has been described by Carlsson (1979). This fracturing is to a large extent stress release fracturing closest to the surface. Some of these fractures are filled with sediments of glacial origin.
In addition, significantly transmissive gently dipping deformation zones were met in the lower construction tunnel of the SFR. These structures were intersected at a depth (below sea level) of 65 m in unit 1 and 140 m in unit 2. In addition, the site investigations for the SFR drilled through a similar structure at approximately 40 m depth. The geological structure (fracture zone) at the bottom of the SFR has been described by Carlsson and Christiansson (1987). The horizontal fractures dip 10–15° and occur locally with very high frequency as a ‘swarm or cluster’. Locally, vertical fractures also increase in frequency where these sub-horizontal “clusters” are intersected. The fracturing was locally rather high, displaying lenses with more or less crushed rock approximately 0.3–0.5 m thick and some meters in length. These lenses of crushed rock occurred step-wise being the irregular core of a deformation zone dipping approximately 25° towards SE. The nature of this kind of gently dipping deformation zone indicates an origin not related to the sub-horizontal stress release fracturing commonly found in the superficial rock mass at the Forsmark area. The extension of these gentle dipping deformation zones with depth is uncertain. Exploration drilling during construction of the SFR could not define the location of the lower deformation zone, maybe due to the possible heterogeneity of the structure, or simply because its extension with depth was limited.
The tunnelling through the gentle dipping fracture zones in the SFR required a significant grouting program. At the SFR approximately 9,000 kg of cement was required for grouting approximately 40 m length of tunnel. This area is the part of the SFR facility that has the highest seepage even today. This is due to several reasons:
• There was no requirement to completely seal this part of the construction area, which is located below all operational areas.
• The significant difficulty associated with sealing a gently dipping fractured zone by pre-grouting from the tunnel
• The complex layout at this lower part of the SFR with auxiliary tunnels for the drainage under the silo, a cavern for the deepest pump station and vertical shaft for the discharge of drained water and other installations.
The rock mass encountered, outside the major deformation zones, was blocky with vertical fracture sets trending NW – SE and NE – SW, and a sub-horizontal set (see Figure B-1). In addition, a minor set dipping some 40–50° towards S – SE was observed occasionally. The fracture frequency was found to be relatively low in the tunnels, but in places not evenly distributed. The fractures within the dominant three sets often occur in clusters, forming minor deformation zones. Because of the extensive mineral precipitation in most of the fractures these minor structures were not considered significant for the construction of stable tunnels. There are two situations that generally required systematic bolting:
1. The occurrence of sub-horizontal fractures in the roof normally required systematic bolting. Overbreak in the crown and towards the abutments was commonly observed in this situation. The extension of the more pronounced cluster of sub-horizontal fractures was observed for exampleintheaccesstunnelstotheSFRtohavealengthof>30–40m.
2. Tunnel walls aligned parallel to the NE trending fracture set also displayed overbreaks up to the abutment. This occurs also if there is a 5–20° difference in the trend of the tunnel wall and the fracturing, indicating that the resistance of the strength of the fracture is low to the stresses caused by the tunnelling. This fracture set often displays calcite and laumontite infillings. Dripping water occurred only occasionally. The extension of these NE trending minor deformation zones could be followed for up to some 100 m in the deposition area of the SFR.

74 SKB R-14-17
B2 Distribution of water bearing fracturesOutside the major deformation zones, the tunnel construction at the Forsmark site encountered rather dry, even at shallow depth, tunnelling conditions. In the upper 30–40 m of the superficial rock mass the gentle dipping stress release fracturing contributed significantly to the seepage encountered. At larger depth all dominant fractures contributing to the seepage, especially when they form “clusters”, could be defined as “minor deformation zones.
The distribution of all seeping fractures in the deposition and operation area of the SFR was evaluated, Figure B-2 (Carlsson and Christiansson 1988). The data included roughly 10,000 observed fractures in roofs and walls. Of the total population 6% was seeping water, the smallest observation was defined as “a spot of moisture, some dm2 in area”. In the largest seepage (2.5 l/min) originates from the minor deformation zone that cross-cuts all rock caverns and the operational tunnel, but not the construction tunnel. Selective grouting on that structure was done in one of the caverns. This was the only grouting carried out in the whole deposition and operation area of SFR. This measure probably had very little influence on overall distribution of seepage into the deposition and operation area of the SFR.
The measured inflows into the silo illustrate the low permeability of the rock mass – even at this relatively shallow depth. This cavern has a diameter of 30 m and a height of 69 m with an excavated volume of 45,000 m3. After excavation was completed, a total inflow of 1.4 l/min was measured at a temporary weir where the water coming into the silo discharged in to the lower construction tunnel. In addition, by measuring the humidity in the ventilation air going into and out of the silo it was estimated that the ventilation evacuated approximately 0.6 l/min, giving a total inflow of approximately 2 l/min.
Figure B‑1. Lower hemisphere equal angle stereo‑nets for fractures mapped in the foundation of Forsmark Unit 3 (left stereo‑net) and for fractures compiled from tunnel mapping in two 100‑m‑long orthogonal tunnels from the SFR facility at a depth between 50 and 70 m (right stereo‑net). From Carlsson and Christiansson (1987).

SKB R-14-17 75
The water seeping into the SFR outside the major deformation zones occurred primarily as spots of moisture and locally dripping water. The most predominant structures for seepage was:
• Areas where cluster of NE trending vertical fractures occurs. This may be defined as minor deformation zones. The longest such structure was observed in the access tunnel to the silo roof, along the roof of the silo and further into the cavern for handling of the waste packages. The total observed length was 100 m, even though the fracture frequency was irregular over the observed distance. Spots of moisture and dripping water occurred.
• Areas where cluster of NW trending fractures occur. These cross most of the tunnels and caverns at high angles, so the length is difficult to estimate. But because these structures seldom could be traced from one rock cavern to another they are probably limited in length. The water occurred mainly as spots of moisture.
• Amphibolic dykes that were schistose and had been strongly deformed. These dykes occur more or less as minor deformation zones. These dykes were limited to 10–20 mm in width and seldom exceeded 100 m in length. Water occurred as moisture/dripping along large stretches of the areas where the structure was intersected. These structures are sub-vertical and trend N – S to NW – SE in the SFR.
The improvement of air quality during the operation of the SFR facility has included measures to decrease the humidity underground. This may be one of the reasons for decreased total seepage into the facility (Figure B-3).
Examination of the wet spots and seepage locations in the SFR today shows the type of structures that contributed to most of the seepage during construction. In other words the seepage locations at the end of construction are still visible today even though the total inflow is decreasing.
Figure B‑2. Distribution of the seepage from individual fractures in the repository area measured during construction of the SFR Facility. From Carlsson and Christiansson (1988).

76 SKB R-14-17
Figure B‑3. Top: Inflow of groundwater to the existing SFR facility between 1988 and 2011. Curves marked UB and NDB refer to drainage to the pump pits in the operation area and in the lower construction tunnel. Bottom: The location of the two pumping pits, UB and NDB (SKB 2011, Figure 6‑3).
0
100
200
300
400
500
600
700
-88 -89 -90 -91 -92 -93 -94 -95 -96 -97 -98 -99 -00 -01 -02 -03 -04 -05 -06 -07 -08 -09 -10 -11
Tunn
el in
flow
(L/m
in)
Total
NDB
UB
Rev. measuring programme
Installation of water meters
Alteration of water meters
Suspected error, Dec. 2007
Calibra�on of water meters