Embed Size (px)
Citation preview
SITE BLOCKING EFFECTS ON ADSORBEDPOLYACRYLAMIDE CONFORMATION
A ThesisPresented to
The Academic Faculty
by
Brett A. Brotherson
In Partial Fulfillmentof the Requirements for the Degree
Doctor of Philosophy in theSchool of Chemical and Biomolecular Engineering
Georgia Institute of TechnologyDecember 2007
SITE BLOCKING EFFECTS ON ADSORBEDPOLYACRYLAMIDE CONFORMATION
Approved by:
Yulin Deng, PhD, AdvisorSchool of Chemical and BiomolecularEngineering/IPSTGeorgia Institute of Technology
James Frederick, PhDSchool of Chemical and BiomolecularEngineering/IPSTGeorgia Institute of Technology
Peter Ludovice, PhD, Co-AdvisorSchool of Chemical and BiomolecularEngineeringGeorgia Institute of Technology
Preet Singh, PhDSchool of Materials ScienceEngineering/IPSTGeorgia Institute of Technology
Lawrence Bottomley, PhDSchool of Chemistry and BiochemistryGeorgia Institute of Technology
Date Approved: November 2, 2007

“Get your facts first, then you can distort them as you please.”
Mark Twain
ACKNOWLEDGEMENTS
Throughout my work on this research project, I have been fortunate to have been
helped by many people making the completion of this research possible. Of these
people, the first I would like to thank are my advisors, Dr. Yulin Deng and Dr.
Peter Ludovice. Dr. Deng gave me the flexibility in selecting any topic which I was
interested in, allowing me to pick the fundamental project I have spent the last 4
years working on. Both Dr. Deng and Dr. Ludovice provided me with many thought
provoking discussions which allowed me to remain on a feasible course throughout
my work. I would like to thank Dr. Ludovice for helping to arrange for me to get
help in my modeling work, an area I will readily admit is not my specialty. Secondly,
I would like to thank all of my committee members, Dr. Lawrence Bottomley, Dr.
James Frederick, and Dr. Preet Singh, who helped guide me when I needed extra
assistance. I would like to thank Dr. Bottomley for many hours of thought provoking
conversations which have helped me to develop a good fundamental approach towards
solving problems and basic research involving scanning probe techniques. These con-
versations kept me thinking and never let me settle for anything short of the best
work possible.
I owe many thanks to the following companies, who helped me accomplish this
research. Ciba Specialty Chemicals synthesized the cationic polyacrylamide I used
for my AFM work. MikroMasch performed the focused ion beam milling of my AFM
cantilevers, which allowed this work to continue. SNF synthesized a cationic poly-
acrylamide, similar to that produced by Ciba, for use in the dynamic light scattering
experiments. Asylum Research was extremely helpful in their suggestions, assistance,
and provisions of code for working with their AFM.
iv

I have been fortunate to have had enormous help from my friends and colleagues
here at Georgia Tech. My group members from both advisors have been extremely
helpful in assisting me with my work and providing suggestions. Se-Young Yoon,
Zhaohui Tong, Ying Wang, Kim Nelson, Hongta Yang, Dr. Qunhui Sun, Dr. Yulin
Zhao, Dr. Myung-Chul Park, and the rest of Dr. Deng’s group have all helped me
with my research here. Andrew Swann and John Melnyczuk were extremely helpful
in writing my dissipative particle dynamics code and troubleshooting it throughout
my time here. Without their help I would most likely still be attempting to write
the code for this work. Kane Barker and Karen Meloy of Dr. Bottomley’s group
were very helpful in providing me with insight into my research, helping me with a
couple of procedures, and allowing me to use their ozone cleaner on a regular basis.
Kit Carson was very helpful in his assistance drawing the glass and mica structures.
I would like to thank all of my friends who have made my time here very enjoyable:
Andy Demaio, Rob Lowe, Cam Thomson, Fran and Matt Walsh, Stef Asher, Liz and
Frank Hill, Laura Draucker, Anne Ruffing, and Paul Wissmann. Of course, I must
thank Major White for always keeping me company and providing great conversation
in the afternoons and evenings here at IPST.
My family have provided me with unconditional support and advice which have
made my completion of this work possible. I thank my parents for their support and
seemingly endless editing help. My wife, Erin, has helped me extensively with my
lab work, data analysis, and maintaining sanity. Without her, I would undoubtably
still be at work completing this project.
Thank you all for all of your help and friendship.
v
TABLE OF CONTENTS
ACKNOWLEDGEMENTS . . . . . . . . . . . . . . . . . . . . . . . . . . . . iv
LIST OF TABLES . . . . . . . . . . . . . . . . . . . . . . . . . . . . . . . . . ix
LIST OF FIGURES . . . . . . . . . . . . . . . . . . . . . . . . . . . . . . . . x
SUMMARY . . . . . . . . . . . . . . . . . . . . . . . . . . . . . . . . . . . . . xiv
I INTRODUCTION . . . . . . . . . . . . . . . . . . . . . . . . . . . . . . 1
II LITERATURE REVIEW . . . . . . . . . . . . . . . . . . . . . . . . . . 3
2.1 Flocculation . . . . . . . . . . . . . . . . . . . . . . . . . . . . . . . 3
2.2 Polymer Adsorption . . . . . . . . . . . . . . . . . . . . . . . . . . 8
2.2.1 Background . . . . . . . . . . . . . . . . . . . . . . . . . . . 8
2.2.2 Movement . . . . . . . . . . . . . . . . . . . . . . . . . . . . 10
2.3 Adsorbed Polymer Conformation . . . . . . . . . . . . . . . . . . . 12
2.3.1 Theoretical Models . . . . . . . . . . . . . . . . . . . . . . . 16
2.4 Methods of Measurement . . . . . . . . . . . . . . . . . . . . . . . 20
2.4.1 Atomic Force Microscopy . . . . . . . . . . . . . . . . . . . 25
2.5 Salt Effect . . . . . . . . . . . . . . . . . . . . . . . . . . . . . . . . 33
2.6 Site Blocking . . . . . . . . . . . . . . . . . . . . . . . . . . . . . . 36
III THESIS OBJECTIVES . . . . . . . . . . . . . . . . . . . . . . . . . . . 40
IV EXPERIMENTAL METHODS AND PROCEDURES . . . . . . . . . . 41
4.1 Experimental Overview . . . . . . . . . . . . . . . . . . . . . . . . 41
4.2 Dynamic Light Scattering . . . . . . . . . . . . . . . . . . . . . . . 42
4.2.1 Dynamic Light Scattering Background Information . . . . . 42
4.2.2 Dynamic Light Scattering Materials . . . . . . . . . . . . . 42
4.2.3 Dynamic Light Scattering Methods . . . . . . . . . . . . . . 44
4.3 Atomic Force Microscopy . . . . . . . . . . . . . . . . . . . . . . . 47
4.3.1 Atomic Force Microscopy Background Information . . . . . 47
vi
4.3.2 Atomic Force Microscopy Materials . . . . . . . . . . . . . . 50
4.3.3 Atomic Force Microscopy Methods . . . . . . . . . . . . . . 52
4.4 Computer Simulation using Dissipative Particle Dynamics . . . . . 67
4.4.1 Dissipative Particle Dynamics Materials . . . . . . . . . . . 72
4.4.2 Verification of DPD Code . . . . . . . . . . . . . . . . . . . 74
V ADSORBED POLYMER CONFORMATION . . . . . . . . . . . . . . . 77
5.1 Overview . . . . . . . . . . . . . . . . . . . . . . . . . . . . . . . . 77
5.2 Dynamic Light Scattering to Measure Adsorbed Polymer Conforma-tion . . . . . . . . . . . . . . . . . . . . . . . . . . . . . . . . . . . 77
5.3 Atomic Force Microscopy to Measure Adsorbed Polymer Conformation 79
5.3.1 Comparison with Theory . . . . . . . . . . . . . . . . . . . 88
5.3.2 Movement on Surface . . . . . . . . . . . . . . . . . . . . . 90
5.4 Conclusions . . . . . . . . . . . . . . . . . . . . . . . . . . . . . . . 93
VI SALT EFFECT ON ADSORBED POLYMER CONFORMATION . . . 96
6.1 Overview . . . . . . . . . . . . . . . . . . . . . . . . . . . . . . . . 96
6.2 Dynamic Light Scattering to Determine the Salt Effect on AdsorbedPolymer Conformation . . . . . . . . . . . . . . . . . . . . . . . . . 96
6.3 Atomic Force Microscopy to Determine the Salt Effect on AdsorbedPolymer Conformation . . . . . . . . . . . . . . . . . . . . . . . . . 99
6.3.1 Number of Polymer Attachment Points . . . . . . . . . . . . 99
6.3.2 Polymer Tail Length . . . . . . . . . . . . . . . . . . . . . . 105
6.3.3 Polymer Loop Length . . . . . . . . . . . . . . . . . . . . . 112
6.3.4 Strength of Polymer Attachment . . . . . . . . . . . . . . . 116
6.4 Conclusions . . . . . . . . . . . . . . . . . . . . . . . . . . . . . . . 118
VII SITE BLOCKING EFFECT ON ADSORBED POLYMER CONFORMA-TION . . . . . . . . . . . . . . . . . . . . . . . . . . . . . . . . . . . . . 120
7.1 Overview . . . . . . . . . . . . . . . . . . . . . . . . . . . . . . . . 120
7.2 Dynamic Light Scattering to Determine the Effect Site Blocking onAdsorbed Polymer Conformation . . . . . . . . . . . . . . . . . . . 120
7.2.1 PDADMAC . . . . . . . . . . . . . . . . . . . . . . . . . . . 120
vii
7.2.2 Cationic Nanosilica . . . . . . . . . . . . . . . . . . . . . . . 121
7.3 Atomic Force Microscopy to Determine the Effect Site Blocking onAdsorbed Polymer Conformation . . . . . . . . . . . . . . . . . . . 122
7.3.1 PDADMAC . . . . . . . . . . . . . . . . . . . . . . . . . . . 123
7.3.2 Cationic Nanosilica . . . . . . . . . . . . . . . . . . . . . . . 127
7.4 Conclusions . . . . . . . . . . . . . . . . . . . . . . . . . . . . . . . 134
VIII COMPUTER SIMULATION WITH DISSIPATIVE PARTICLE DYNAM-ICS . . . . . . . . . . . . . . . . . . . . . . . . . . . . . . . . . . . . . . 136
8.1 Polymer Simulations . . . . . . . . . . . . . . . . . . . . . . . . . . 137
8.2 Conclusions . . . . . . . . . . . . . . . . . . . . . . . . . . . . . . . 143
IX OVERALL CONCLUSIONS AND RECOMMENDATIONS . . . . . . . 146
9.1 Recommendations For Future Work . . . . . . . . . . . . . . . . . . 148
APPENDIX A DPD SVL CODE . . . . . . . . . . . . . . . . . . . . . . . 151
REFERENCES . . . . . . . . . . . . . . . . . . . . . . . . . . . . . . . . . . . 160
viii
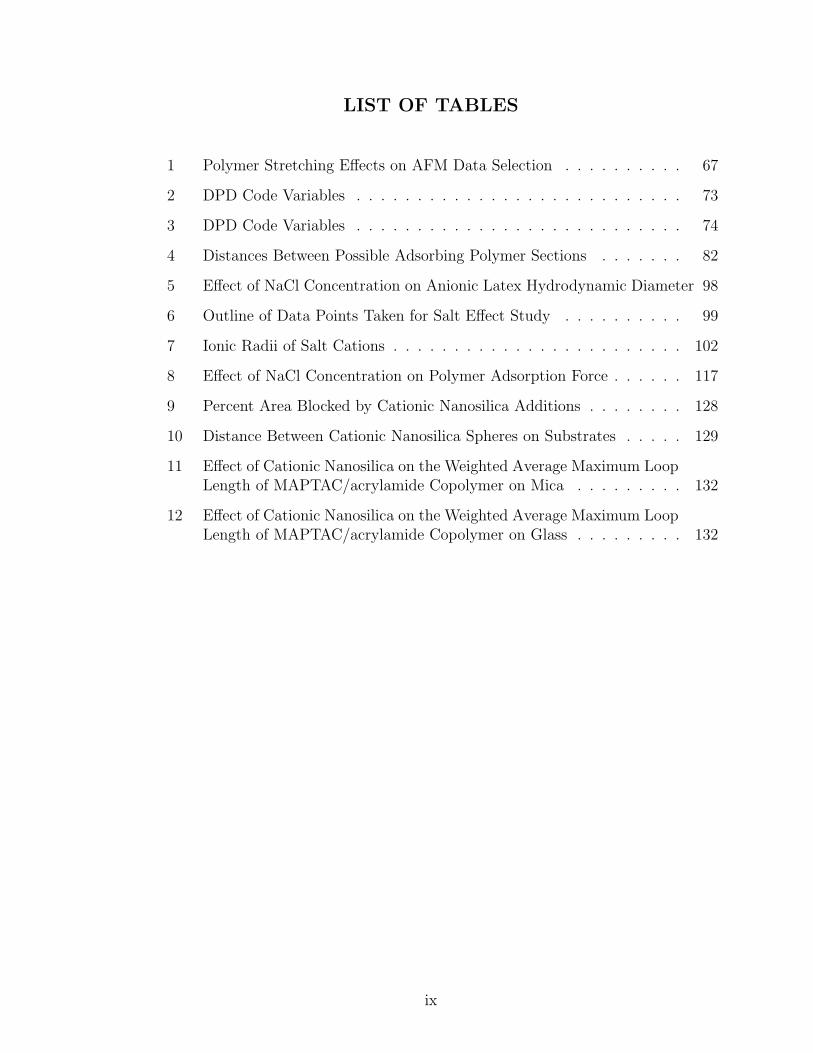
LIST OF TABLES
1 Polymer Stretching Effects on AFM Data Selection . . . . . . . . . . 67
2 DPD Code Variables . . . . . . . . . . . . . . . . . . . . . . . . . . . 73
3 DPD Code Variables . . . . . . . . . . . . . . . . . . . . . . . . . . . 74
4 Distances Between Possible Adsorbing Polymer Sections . . . . . . . 82
5 Effect of NaCl Concentration on Anionic Latex Hydrodynamic Diameter 98
6 Outline of Data Points Taken for Salt Effect Study . . . . . . . . . . 99
7 Ionic Radii of Salt Cations . . . . . . . . . . . . . . . . . . . . . . . . 102
8 Effect of NaCl Concentration on Polymer Adsorption Force . . . . . . 117
9 Percent Area Blocked by Cationic Nanosilica Additions . . . . . . . . 128
10 Distance Between Cationic Nanosilica Spheres on Substrates . . . . . 129
11 Effect of Cationic Nanosilica on the Weighted Average Maximum LoopLength of MAPTAC/acrylamide Copolymer on Mica . . . . . . . . . 132
12 Effect of Cationic Nanosilica on the Weighted Average Maximum LoopLength of MAPTAC/acrylamide Copolymer on Glass . . . . . . . . . 132
ix
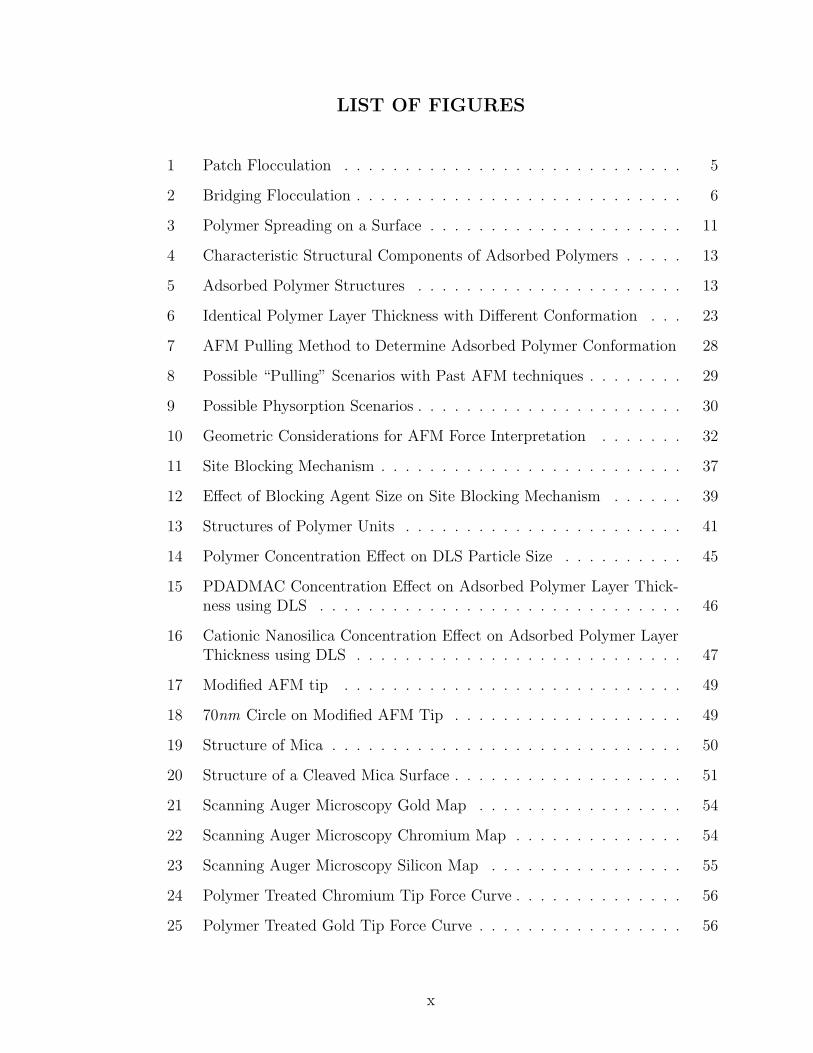
LIST OF FIGURES
1 Patch Flocculation . . . . . . . . . . . . . . . . . . . . . . . . . . . . 5
2 Bridging Flocculation . . . . . . . . . . . . . . . . . . . . . . . . . . . 6
3 Polymer Spreading on a Surface . . . . . . . . . . . . . . . . . . . . . 11
4 Characteristic Structural Components of Adsorbed Polymers . . . . . 13
5 Adsorbed Polymer Structures . . . . . . . . . . . . . . . . . . . . . . 13
6 Identical Polymer Layer Thickness with Different Conformation . . . 23
7 AFM Pulling Method to Determine Adsorbed Polymer Conformation 28
8 Possible “Pulling” Scenarios with Past AFM techniques . . . . . . . . 29
9 Possible Physorption Scenarios . . . . . . . . . . . . . . . . . . . . . . 30
10 Geometric Considerations for AFM Force Interpretation . . . . . . . 32
11 Site Blocking Mechanism . . . . . . . . . . . . . . . . . . . . . . . . . 37
12 Effect of Blocking Agent Size on Site Blocking Mechanism . . . . . . 39
13 Structures of Polymer Units . . . . . . . . . . . . . . . . . . . . . . . 41
14 Polymer Concentration Effect on DLS Particle Size . . . . . . . . . . 45
15 PDADMAC Concentration Effect on Adsorbed Polymer Layer Thick-ness using DLS . . . . . . . . . . . . . . . . . . . . . . . . . . . . . . 46
16 Cationic Nanosilica Concentration Effect on Adsorbed Polymer LayerThickness using DLS . . . . . . . . . . . . . . . . . . . . . . . . . . . 47
17 Modified AFM tip . . . . . . . . . . . . . . . . . . . . . . . . . . . . 49
18 70nm Circle on Modified AFM Tip . . . . . . . . . . . . . . . . . . . 49
19 Structure of Mica . . . . . . . . . . . . . . . . . . . . . . . . . . . . . 50
20 Structure of a Cleaved Mica Surface . . . . . . . . . . . . . . . . . . . 51
21 Scanning Auger Microscopy Gold Map . . . . . . . . . . . . . . . . . 54
22 Scanning Auger Microscopy Chromium Map . . . . . . . . . . . . . . 54
23 Scanning Auger Microscopy Silicon Map . . . . . . . . . . . . . . . . 55
24 Polymer Treated Chromium Tip Force Curve . . . . . . . . . . . . . . 56
25 Polymer Treated Gold Tip Force Curve . . . . . . . . . . . . . . . . . 56
x
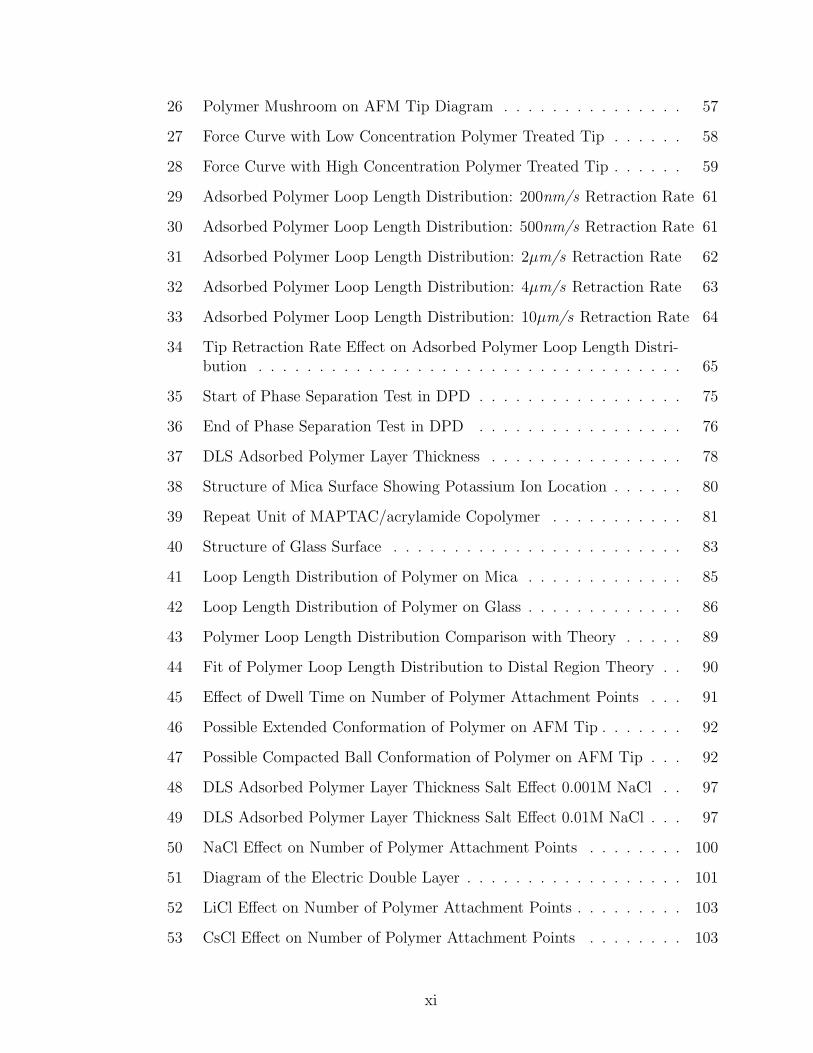
26 Polymer Mushroom on AFM Tip Diagram . . . . . . . . . . . . . . . 57
27 Force Curve with Low Concentration Polymer Treated Tip . . . . . . 58
28 Force Curve with High Concentration Polymer Treated Tip . . . . . . 59
29 Adsorbed Polymer Loop Length Distribution: 200nm/s Retraction Rate 61
30 Adsorbed Polymer Loop Length Distribution: 500nm/s Retraction Rate 61
31 Adsorbed Polymer Loop Length Distribution: 2µm/s Retraction Rate 62
32 Adsorbed Polymer Loop Length Distribution: 4µm/s Retraction Rate 63
33 Adsorbed Polymer Loop Length Distribution: 10µm/s Retraction Rate 64
34 Tip Retraction Rate Effect on Adsorbed Polymer Loop Length Distri-bution . . . . . . . . . . . . . . . . . . . . . . . . . . . . . . . . . . . 65
35 Start of Phase Separation Test in DPD . . . . . . . . . . . . . . . . . 75
36 End of Phase Separation Test in DPD . . . . . . . . . . . . . . . . . 76
37 DLS Adsorbed Polymer Layer Thickness . . . . . . . . . . . . . . . . 78
38 Structure of Mica Surface Showing Potassium Ion Location . . . . . . 80
39 Repeat Unit of MAPTAC/acrylamide Copolymer . . . . . . . . . . . 81
40 Structure of Glass Surface . . . . . . . . . . . . . . . . . . . . . . . . 83
41 Loop Length Distribution of Polymer on Mica . . . . . . . . . . . . . 85
42 Loop Length Distribution of Polymer on Glass . . . . . . . . . . . . . 86
43 Polymer Loop Length Distribution Comparison with Theory . . . . . 89
44 Fit of Polymer Loop Length Distribution to Distal Region Theory . . 90
45 Effect of Dwell Time on Number of Polymer Attachment Points . . . 91
46 Possible Extended Conformation of Polymer on AFM Tip . . . . . . . 92
47 Possible Compacted Ball Conformation of Polymer on AFM Tip . . . 92
48 DLS Adsorbed Polymer Layer Thickness Salt Effect 0.001M NaCl . . 97
49 DLS Adsorbed Polymer Layer Thickness Salt Effect 0.01M NaCl . . . 97
50 NaCl Effect on Number of Polymer Attachment Points . . . . . . . . 100
51 Diagram of the Electric Double Layer . . . . . . . . . . . . . . . . . . 101
52 LiCl Effect on Number of Polymer Attachment Points . . . . . . . . . 103
53 CsCl Effect on Number of Polymer Attachment Points . . . . . . . . 103
xi
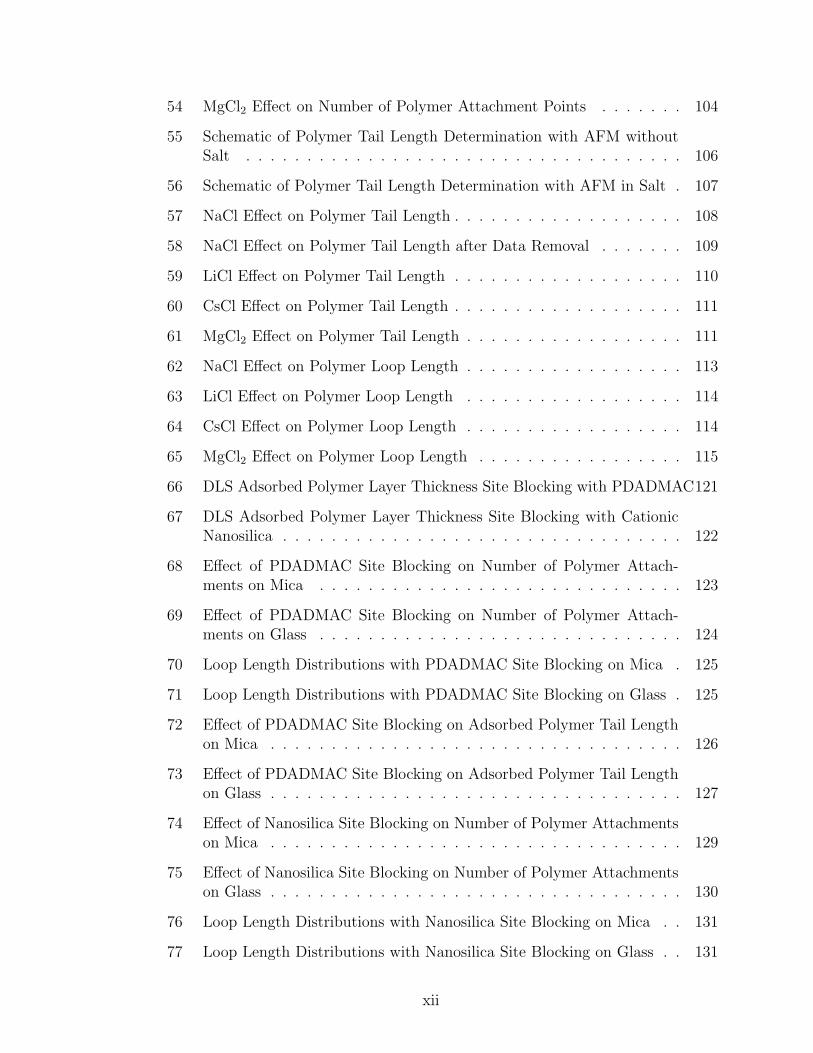
54 MgCl2 Effect on Number of Polymer Attachment Points . . . . . . . 104
55 Schematic of Polymer Tail Length Determination with AFM withoutSalt . . . . . . . . . . . . . . . . . . . . . . . . . . . . . . . . . . . . 106
56 Schematic of Polymer Tail Length Determination with AFM in Salt . 107
57 NaCl Effect on Polymer Tail Length . . . . . . . . . . . . . . . . . . . 108
58 NaCl Effect on Polymer Tail Length after Data Removal . . . . . . . 109
59 LiCl Effect on Polymer Tail Length . . . . . . . . . . . . . . . . . . . 110
60 CsCl Effect on Polymer Tail Length . . . . . . . . . . . . . . . . . . . 111
61 MgCl2 Effect on Polymer Tail Length . . . . . . . . . . . . . . . . . . 111
62 NaCl Effect on Polymer Loop Length . . . . . . . . . . . . . . . . . . 113
63 LiCl Effect on Polymer Loop Length . . . . . . . . . . . . . . . . . . 114
64 CsCl Effect on Polymer Loop Length . . . . . . . . . . . . . . . . . . 114
65 MgCl2 Effect on Polymer Loop Length . . . . . . . . . . . . . . . . . 115
66 DLS Adsorbed Polymer Layer Thickness Site Blocking with PDADMAC121
67 DLS Adsorbed Polymer Layer Thickness Site Blocking with CationicNanosilica . . . . . . . . . . . . . . . . . . . . . . . . . . . . . . . . . 122
68 Effect of PDADMAC Site Blocking on Number of Polymer Attach-ments on Mica . . . . . . . . . . . . . . . . . . . . . . . . . . . . . . 123
69 Effect of PDADMAC Site Blocking on Number of Polymer Attach-ments on Glass . . . . . . . . . . . . . . . . . . . . . . . . . . . . . . 124
70 Loop Length Distributions with PDADMAC Site Blocking on Mica . 125
71 Loop Length Distributions with PDADMAC Site Blocking on Glass . 125
72 Effect of PDADMAC Site Blocking on Adsorbed Polymer Tail Lengthon Mica . . . . . . . . . . . . . . . . . . . . . . . . . . . . . . . . . . 126
73 Effect of PDADMAC Site Blocking on Adsorbed Polymer Tail Lengthon Glass . . . . . . . . . . . . . . . . . . . . . . . . . . . . . . . . . . 127
74 Effect of Nanosilica Site Blocking on Number of Polymer Attachmentson Mica . . . . . . . . . . . . . . . . . . . . . . . . . . . . . . . . . . 129
75 Effect of Nanosilica Site Blocking on Number of Polymer Attachmentson Glass . . . . . . . . . . . . . . . . . . . . . . . . . . . . . . . . . . 130
76 Loop Length Distributions with Nanosilica Site Blocking on Mica . . 131
77 Loop Length Distributions with Nanosilica Site Blocking on Glass . . 131
xii
78 Effect of Nanosilica Site Blocking on Adsorbed Polymer Tail Lengthon Mica . . . . . . . . . . . . . . . . . . . . . . . . . . . . . . . . . . 133
79 Effect of Nanosilica Site Blocking on Adsorbed Polymer Tail Lengthon Glass . . . . . . . . . . . . . . . . . . . . . . . . . . . . . . . . . . 133
80 Possible Polymer Conformations with Nanosilica Site Blocking . . . . 135
81 DPD Polymer Simulation: Bond Length 0.001rc . . . . . . . . . . . . 138
82 DPD Polymer Simulation: Bond Length 0.5rc . . . . . . . . . . . . . 139
83 DPD Polymer Simulation: Bond Length 10rc . . . . . . . . . . . . . . 139
84 MAPTAC/acrylamide Copolymer Configuration, k=5 . . . . . . . . . 142
85 MAPTAC/acrylamide Copolymer Configuration,aii=45 . . . . . . . . 142
86 Multiple MAPTAC/acrylamide Copolymer Configurations . . . . . . 143
xiii
SUMMARY
The use of polymers as flocculating additives is a common practice in many
manufacturing environments. However, exactly how these polymers interact with sur-
faces is relatively unknown. One specific topic which is thought to be very important
to flocculation is an adsorbed polymer’s conformation. Substantial amounts of pre-
vious work, mainly using simulations, have been performed to elucidate the theory
surrounding adsorbed polymer conformations. Yet, there is little experimental work
which directly verifies current theory. In order to optimize the use of polymer floc-
culants in industrial applications, a better understanding of an adsorbed polymer’s
conformation on a surface beyond theoretical simulations is necessary. This work
looks specifically at site blocking, which has a broad impact on flocculation, adsorp-
tion, and surface modification, and investigated its effects on the resulting adsorbed
polymer conformation.
Experimental methods which would allow direct determination of adsorbed poly-
mer conformational details and be comparable with previous experimental results
were first determined or developed. Characterization of an adsorbed polymer’s con-
formation was then evaluated using dynamic light scattering, a currently accepted
experimental technique to examine this. This commonly used technique was per-
formed to allow the comparison of this works results with past literature. Next, a
new technique using atomic force microscopy was developed, building on previous
experimental techniques, to allow the direct determination of an adsorbed polymer’s
loop lengths. This method also was able to quantify changes in the length of ad-
sorbed polymer tails. Finally, mesoscopic simulation was attempted using dissipative
particle dynamics.
xiv
In order to determine more information about an adsorbed polymer’s conforma-
tion, three different environmental factors were analyzed: an adsorbed polymer on a
surface in water, an adsorbed polymer on a surface in aqueous solutions of varying
ionic strength, and an adsorbed polymer on a surface functionalized with site block-
ing additives. This work investigated these scenarios using a low charge density high
molecular weight cationic polyacrylamide. Three different substrates, for polymer
adsorption were analyzed: mica, anionic latex, and glass.
It was determined that, similar to previous studies, the adsorbed polymer layer
thickness in water is relatively small even for high molecular weight polymers, on
the order of tens of nanometers. The loop length distribution of a single polymer,
experimentally verified for the first time, revealed a broad span of loop lengths as high
as 1.5µm. However, the bulk of the distribution was found between 40 and 260nm.
For the first time, previous theoretical predictions regarding the salt effect on ad-
sorbed polymer conformation were confirmed experimentally. It was determined that
the adsorbed polymer layer thickness expanded with increasing ionic strength of the
solvent. Using atomic force microscopy, it was determined that the adsorbed polymer
loop lengths and tail lengths increased with increasing ionic strength, supporting the
results found using dynamic light scattering.
The effect of the addition of site blocking additives on a single polymer’s confor-
mation was investigated for the first time. It was determined that the addition of
site blocking additives caused strikingly similar results as the addition of salt to the
medium. The changes in adsorbed polymer loop lengths was found to be inconsistent
and minimal. However, the changes in an adsorbed polymer’s free tail length was
found to increase with increasing site blocking additive levels. These results were
obtained using either PDADMAC or cationic nanosilica as site blocking additives.
xv
CHAPTER I
INTRODUCTION
Polymers, adsorbed on surfaces, are used in numerous applications for many dif-
ferent purposes including: colloid stabilization, flocculation, lubrication, adhesion,
electrical properties, and other surface modifications[89, 133]. Although the effects
of these processes, such as the effects of dispersants, have been observed throughout
history, it was not until 1974 that these attributes were formally related to the adsorp-
tion of polymers on surfaces[156]. Due to the wide use of polymer modified surfaces
in many industries, it is important to understand the interactions between polymers
and surfaces and the interactions of polymer modified surfaces. With a better under-
standing of these interactions, the properties and use of polymer modified surfaces
can be optimized and extended. This work will concentrate on how polymer modified
surfaces can assist or hinder flocculation. However, the information discussed can
easily be applied to other surface and colloid phenomena.
This thesis aims to provide a better understanding of adsorbed polymer confor-
mation. This directly affects how well an adsorbed polymer can flocculate particles
in a suspension. This project also investigated two factors that are commonly en-
countered in many industrial settings. These where how electrolytes in solution will
affect adsorbed polymer conformation and the effect of site blocking additives on
adsorbed polymer conformation. Chapter II reviews the literature on aspects of floc-
culation, polymer conformation and its measurement, previous studies on the salt
effect, and the currently available literature on site blocking. Chapter III outlines
the objectives of this research project. Next, Chapter IV outlines the experimental
techniques used to complete this research. Following this the results of this project
1
will be discussed. Chapter V reports the findings on adsorbed polymer conformation.
Chapter VI presents the effects of electrolyte in solution on an adsorbed polymers
conformation. Chapter VII, for the first time, reports on the effects of site block-
ing additives on adsorbed polymer conformation. Chapters VIII and IX will discuss
the results of the computational modeling and the overall summary, conclusions, and
recommendations from this research project.
2
CHAPTER II
LITERATURE REVIEW
Chapter I introduced the use of polymers for modifying surfaces. This literature
review will summarize the conformation of polymers as they adsorb on surfaces and
how the conformation will affect the flocculation properties of the polymer modi-
fied surface. First, a brief review of flocculation, from a papermaking perspective,
will be discussed. Next, background information on polymer adsorption and move-
ment on surfaces will be addressed. Following this, the characteristic structures of
adsorbed polymer conformations, theoretical understanding of these conformations,
and the different available methods, experimental and theoretical, to determine ad-
sorbed polymer conformation will be reviewed. The final two sections of this literature
review will investigate the effect of salts, or electrolytes, and site blocking additives
on adsorbed polymer conformations.
2.1 Flocculation
Flocculation refers to the aggregation of small particles into a larger “floc” or
agglomerate. Polymer induced flocculation is a commonly used technique in many
industries such as water treatment, oil recovery, mining, papermaking, and food pro-
cessing. In this phenomena, polymers adsorbing on surfaces can help bring small
particles together using a variety of different mechanisms. How these mechanisms
work is dependent on the type of interactions between the polymer, the surface,
and the medium. These interactions can include electrostatic interaction, hydrogen
bonding, hydrophobic interactions, covalent bonding, and van der Waals’ forces[21].
Polymer adsorption on a surface can be due to more than one of these interactions.
3
Many manufacturing environments, such as the wet end of a paper machine, con-
tain charged components which can either attract or repulse each other. In papermak-
ing these include: fibers, fines, chemical additive, and fillers. In these manufacturing
environments, charged polymers, or polyelectrolytes, can be used to modify the parti-
cles in the system allowing flocculation to occur. In these systems, polymer molecular
weight, conformation, and charge density can all affect the mechanism through which
flocculation occurs[178, 98].
Modern papermaking furnishes are combinations of many different components,
one of which is fillers. Many furnishes contain different fillers added to improve the
optical and printing properties of the sheet. Most of these fillers have particle sizes
ranging from 100nm to 10µm[178]. In order to retain these fillers, as the furnish is
dewatered on the wire, different polymer based retention aids are used. These polymer
based retention aids attach or entrap fillers, in flocs or individually, onto fibers in the
furnish. The mechanisms these retention aids use include charge neutralization, patch
flocculation, bridging, and multicomponent flocculation[178, 98].
Most of the papermaking furnish components have an anionic charge. This charge
results in electrostatic repulsion as these components approach each other. Charge
neutralization works to reduce the net charges of the components as close to neutral
as possible[237, 98, 178]. This allows van der Waals forces to agglomerate the par-
ticles. Cationic polymers with a high charge density and low molecular weight are
usually used for this retention mechanism due to their ability to decrease the charge
of the components while not extending beyond the electric double layer[178]. This
mechanism of flocculation is very weak because van der Waals forces are not as strong
as the forces involved in some of the mechanisms described below. This means that
the flocs will not be very resistant to shear forces and will redisperse. However, after
dispersion they should reflocculate due to the van der Waals forces. Van de Ven has
proposed that charge neutralization is not the actual cause of flocculation[267]. He
4
contends some particles’ charges are reversed, causing them to be attracted to each
other electrostatically[267].
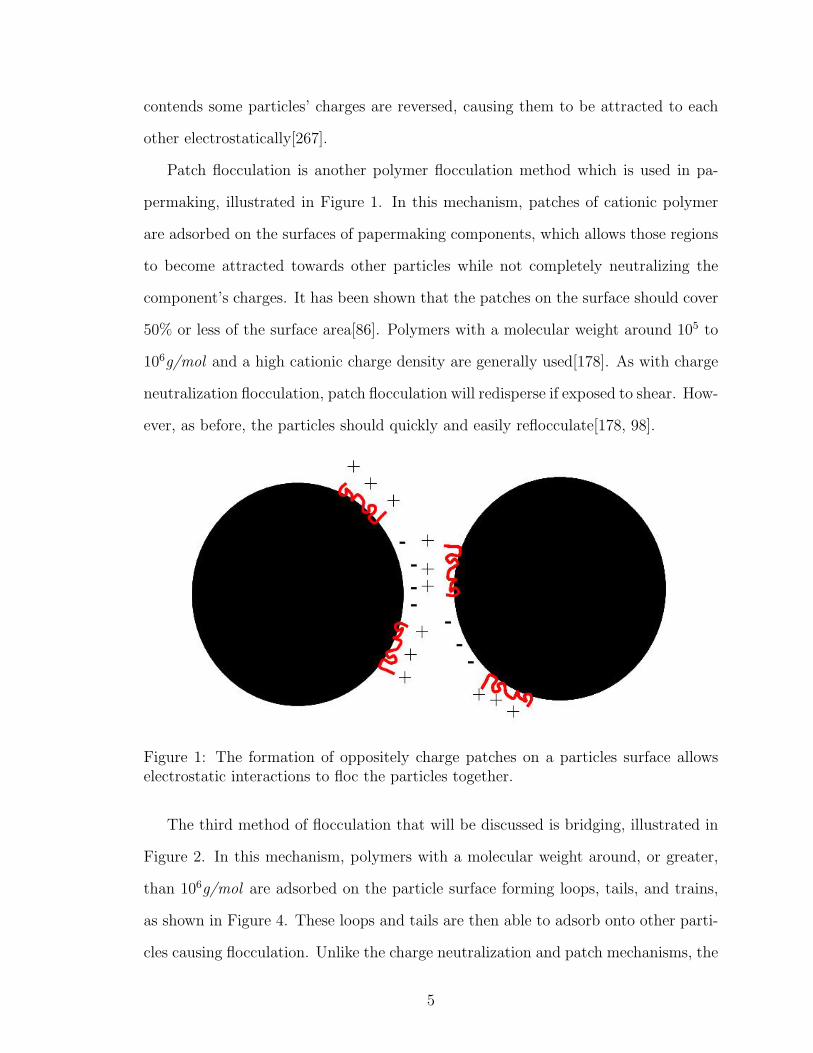
Patch flocculation is another polymer flocculation method which is used in pa-
permaking, illustrated in Figure 1. In this mechanism, patches of cationic polymer
are adsorbed on the surfaces of papermaking components, which allows those regions
to become attracted towards other particles while not completely neutralizing the
component’s charges. It has been shown that the patches on the surface should cover
50% or less of the surface area[86]. Polymers with a molecular weight around 105 to
106g/mol and a high cationic charge density are generally used[178]. As with charge
neutralization flocculation, patch flocculation will redisperse if exposed to shear. How-
ever, as before, the particles should quickly and easily reflocculate[178, 98].
Figure 1: The formation of oppositely charge patches on a particles surface allowselectrostatic interactions to floc the particles together.
The third method of flocculation that will be discussed is bridging, illustrated in
Figure 2. In this mechanism, polymers with a molecular weight around, or greater,
than 106g/mol are adsorbed on the particle surface forming loops, tails, and trains,
as shown in Figure 4. These loops and tails are then able to adsorb onto other parti-
cles causing flocculation. Unlike the charge neutralization and patch mechanisms, the
5
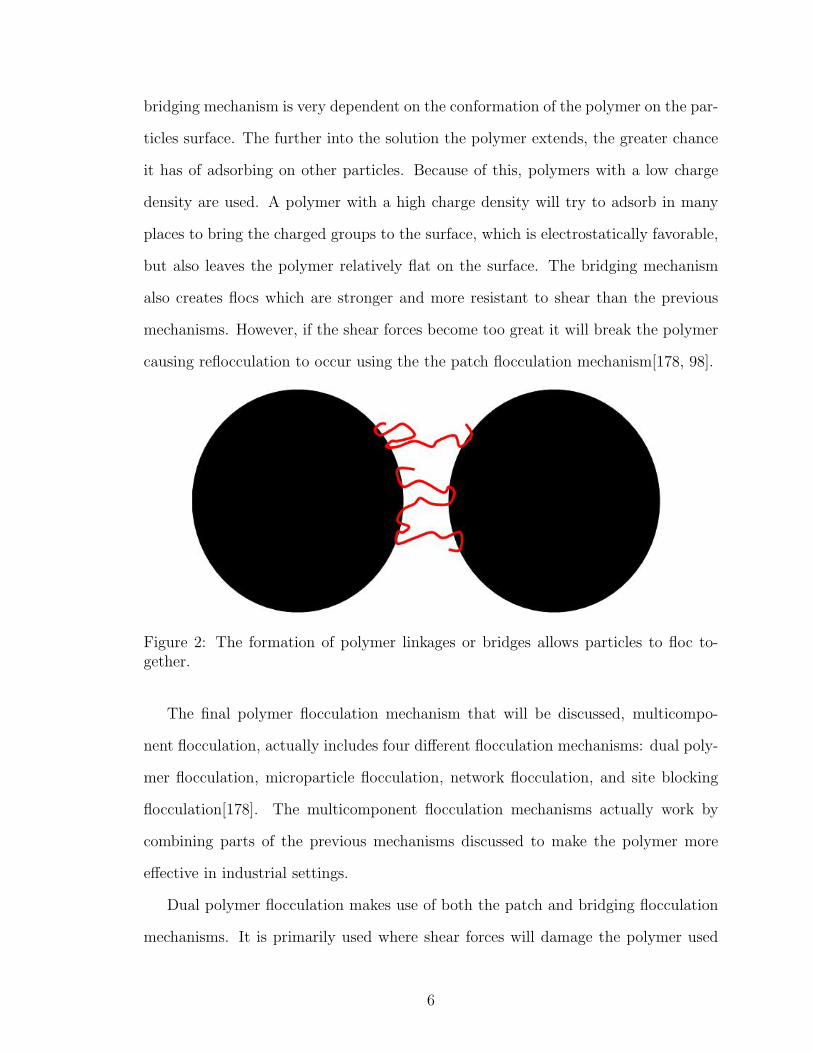
bridging mechanism is very dependent on the conformation of the polymer on the par-
ticles surface. The further into the solution the polymer extends, the greater chance
it has of adsorbing on other particles. Because of this, polymers with a low charge
density are used. A polymer with a high charge density will try to adsorb in many
places to bring the charged groups to the surface, which is electrostatically favorable,
but also leaves the polymer relatively flat on the surface. The bridging mechanism
also creates flocs which are stronger and more resistant to shear than the previous
mechanisms. However, if the shear forces become too great it will break the polymer
causing reflocculation to occur using the the patch flocculation mechanism[178, 98].
Figure 2: The formation of polymer linkages or bridges allows particles to floc to-gether.
The final polymer flocculation mechanism that will be discussed, multicompo-
nent flocculation, actually includes four different flocculation mechanisms: dual poly-
mer flocculation, microparticle flocculation, network flocculation, and site blocking
flocculation[178]. The multicomponent flocculation mechanisms actually work by
combining parts of the previous mechanisms discussed to make the polymer more
effective in industrial settings.
Dual polymer flocculation makes use of both the patch and bridging flocculation
mechanisms. It is primarily used where shear forces will damage the polymer used
6
in bridging flocculation. First, a cationic low molecular weight polymer is added to
flocculate anionic components in a suspension, this uses the patch flocculation mech-
anism. Following this the suspension is exposed to shear somewhere in the manufac-
turing process. These shear forces separate the tightly held patch flocs. Immediately
following this a high molecular weight low charge density anionic polymer is added.
This polymer can bridge between the cationic patches of the other polymer on the
surface resulting in a more loosely held floc.
Another multicomponent flocculation mechanism is microparticle flocculation. In
this mechanism, a high molecular weight low charge density polymer is added to a
suspension. This results in flocculation using the bridging mechanism. As with the
dual polymer mechanism, this mechanism works well when the suspension to be floc-
culated will be exposed to shear forces. Next, the bridged flocs are exposed to shear
forces which redisperse the components of the suspension. Following this, anionic
microparticles are added to the suspension. These particles attach to the cationic
polymer fragments on the components of the suspension allowing the formation of a
tightly held resilient floc[257].
The third multicomponent flocculation mechanism is network flocculation. The
manner in which this mechanism works has yet to be fully validated[255]. It is known
that, in most of the currently used network flocculation systems, hydrogen bonding is
the main mechanism for polymer adsorption[178]. This attribute allows network floc-
culation to be used in suspensions with high amounts of electrolytes or contaminants,
which would interfere with electrostatic interactions[178]. Network flocculation starts
with the additions of small particles such as phenolic resins or montmorillonite clays
which adsorb on the components of a suspension[178]. These components then form
colloidal polymer complexes, following the addition of a polymer, which grow in size
until they are able to bridge with larger components in the suspension[178].
The final multicomponent flocculation mechanism to be discussed is site blocking,
7
or enhanced bridging flocculation. This mechanism is the focus of this work. A
description of site blocking and its mechanism of flocculation will be discussed in a
following section.
2.2 Polymer Adsorption
2.2.1 Background
In order for polymers to modify surfaces, they must adsorb or connect to the
surface. The method behind this adsorption is dependent on the polymer, surfaces,
and the surrounding medium. The different methods in which a polymer can adsorb
are generally grouped into two large mechanisms: chemisorption and physisorption.
Chemisorption refers to the formation of chemical bond between the polymer and a
surface such as covalent bonding[89, 191]. Physisorption refers to methods which are
held more weakly than chemisorbed molecules. Examples of these methods include:
hydrogen bonding, hydrophobic interactions, van der Waals forces, and electrostatic
interactions[89, 191, 96]. Although hydrogen bonding is considered a chemical bond,
its strength is significantly smaller than that of covalent and ionic bonds. This causes
it to be placed in the physisorption category. Hydrophobic interactions, in most
cases, use a polymer’s preferential attraction to certain groups on a surface in lieu
of the solvent medium to allow adsorption. Van der Waals force induced adsorption
applies to systems in which the attractive portion, or minimum in the Lennard-Jones
potential, is just enough close to a surface, to hold a polymer in place against the
action of thermal and hydrodynamic forces. Electrostatic interactions, which are
the focus for much of this work, involve the pairing of cationic and anionic groups
between a surface and a polymer to satisfy electroneutrality. This is the same method
used by hydrogen bonding. However, hydrogen bonding is much weaker than most
electrostatic interactions. It is possible for adsorbed polymers on a surface to be
attached by different mechanisms. Cationic polyacrylamide adsorbing on an anionic
8
surface can adsorb by both hydrogen bonding and electrostatic interactions. Which
of these mechanisms is the most prevalent depends on many factors including the
medium, polymer, and surface.
The strength of a polymer attachment to a surface is not the only difference be-
tween physisorption and chemisorption. O’Shaughnessy and Vavylonis have reported
that physisorption occurs much more rapidly than chemisorption due to the large acti-
vation barrier which must be overcome to form a chemical bond[192, 190, 189, 188, 59].
Both of these broad mechanisms are used in industry to adsorb polymers on
different surfaces. However, it is important to realize that adsorbed polymers are
not required to stay adsorbed on a surface regardless of the adsorption mechanism.
It is always possible for the energy of the polymer molecule to exceed that of the
attachment to the surface causing the polymer to desorb[39]. While the mechanism
of adsorption does not prohibit desorption it is important to note that desorption rates
in chemisorbed polymers are usually very small and in most cases are ignored[192].
In this regard, the energy of attraction between the individual monomer units and
a surface are of extreme importance to polymer adsorption and the stability of the
adsorbed polymers[270, 271, 48]. The interactions of the specific monomer which
will adsorb and the surface are extremely important to the adsorption stability of a
polymer on a surface, but the size of the monomer units in the polymer chain also
can affect the adsorption energy[271]. Polymers with less bulky side groups tend to
have stronger adsorption energies and have a higher stability when adsorbed on a
surface[271].
Another important factor, in the ability of a polymer to desorb from a surface is the
molecular weight, or length of the polymer. With higher molecular weights, a polymer
is more likely to have multiple attachment points to a surface. This decreases the
chances of complete desorption from the surface[281]. As individual attachment points
desorb from a surface others will be forming. The maximum number of adsorption
9
points increases with increasing polymer molecular weight.
Cosgrove found that, overall, the rate of polymer desorption is much lower than
the rate of polymer adsorption[56]. This is most likely due to the fact that adsorbed
polymers in many cases have multiple attachment points and the results of Wang et
al. are illustrated[281]. However, for polymer adsorption only one attachment point
must be made.
The factors influencing polymer desorption above deal primarily with the prop-
erties of the surface and polymer. However, the medium in which the polymer and
surface are immersed, also plays an important role in the adsorption and desorption
of a polymer on a surface. Factors such as mechanical and thermal energy will in-
crease the rate at which polymers desorb from a surface[39, 281]. However, other
species present in the medium will also affect the rate of polymer desorption. The
effects of electrolytes have been extensively studied and found to have very signif-
icant effects on polymer adsorption and desorption[202, 245, 244]. This topic will
be investigated more thoroughly in a later section. Just as with electrolytes, other
molecules and polymers present in the medium can also directly affect the adsorption
and desorption of polymers from a surface[270, 271, 89].
2.2.2 Movement
Adsorbed polymers on surfaces retain a dynamic character as they move to-
wards a low energy conformation on the surface. This is done by rearrangement, or
movement, on the surface to achieve the lowest energy state possible. Both poly-
mer adsorption and desorption, regardless of the mechanism of attachment, are af-
fected by the movement or relaxation of a polymer on a surface. A large amount
of work has been performed both experimentally and theoretically to show this
behavior[200, 201, 38, 2, 280, 291, 298, 8, 193, 194, 195, 1, 274, 273, 199, 87, 236, 47,
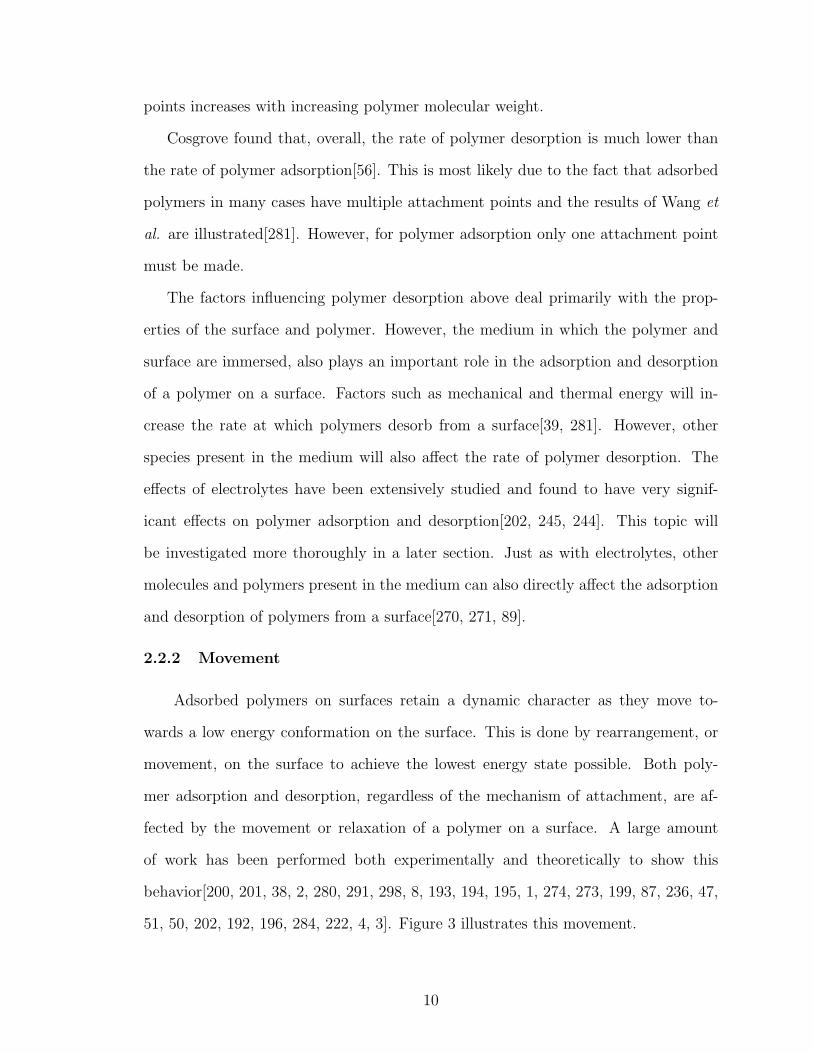
51, 50, 202, 192, 196, 284, 222, 4, 3]. Figure 3 illustrates this movement.
10
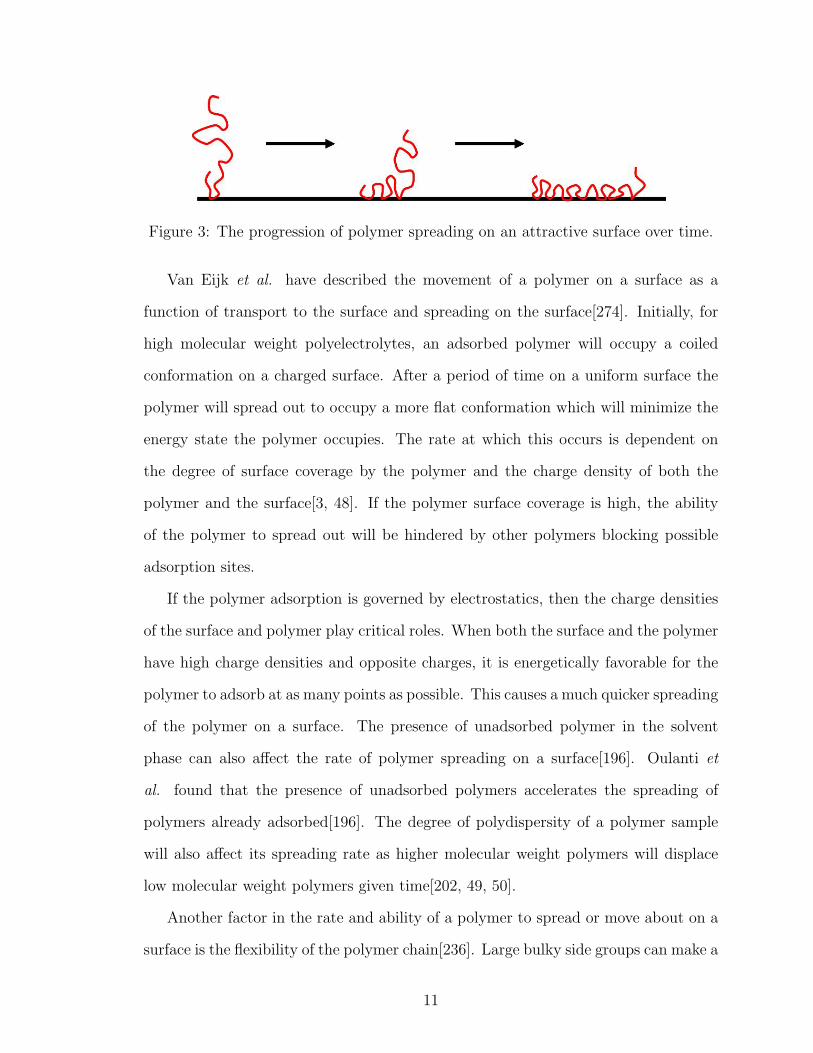
Figure 3: The progression of polymer spreading on an attractive surface over time.
Van Eijk et al. have described the movement of a polymer on a surface as a
function of transport to the surface and spreading on the surface[274]. Initially, for
high molecular weight polyelectrolytes, an adsorbed polymer will occupy a coiled
conformation on a charged surface. After a period of time on a uniform surface the
polymer will spread out to occupy a more flat conformation which will minimize the
energy state the polymer occupies. The rate at which this occurs is dependent on
the degree of surface coverage by the polymer and the charge density of both the
polymer and the surface[3, 48]. If the polymer surface coverage is high, the ability
of the polymer to spread out will be hindered by other polymers blocking possible
adsorption sites.
If the polymer adsorption is governed by electrostatics, then the charge densities
of the surface and polymer play critical roles. When both the surface and the polymer
have high charge densities and opposite charges, it is energetically favorable for the
polymer to adsorb at as many points as possible. This causes a much quicker spreading
of the polymer on a surface. The presence of unadsorbed polymer in the solvent
phase can also affect the rate of polymer spreading on a surface[196]. Oulanti et
al. found that the presence of unadsorbed polymers accelerates the spreading of
polymers already adsorbed[196]. The degree of polydispersity of a polymer sample
will also affect its spreading rate as higher molecular weight polymers will displace
low molecular weight polymers given time[202, 49, 50].
Another factor in the rate and ability of a polymer to spread or move about on a
surface is the flexibility of the polymer chain[236]. Large bulky side groups can make a
11
polymer less flexible and less able to attach to a surface. This will inhibit the ability of
the chain to flatten out. Previously, the effect of polymer concentration in the solution
on spreading on a surface was described. The properties of the entire system can also
play a role in the rate of spreading. At low temperatures, the energy available to
each polymer molecule is diminished. This results in a much slower rate of spreading
or relaxation[298, 38]. Chakraborty and Adriani have shown, via simulations, that
polymer spreading rates exhibit a non-Arrhenius temperature dependence[38].
The times necessary for polymer spreading to reach an equilibrium vary depending
on the polymer, surface, and medium. These have been reported as short as 25seconds
to as long as several hours[3, 222]. These times are for polyelectrolytes adsorbing on
oppositely charged surfaces by electrostatic interactions. As was mentioned in the
previous section the time and energy necessary for a chemisorbed polymer is much
greater[2].
2.3 Adsorbed Polymer Conformation
In the previous section, the adsorption of polymers on surfaces was explained as
a method to lower the energy state of the polymer. The movement of a polymer on
a surface was an extension of this idea. However, no details were given as to what
the polymer’s structure on the surface is after it has adsorbed. As in the previous
section, the energetics of the system will dictate what an adsorbed polymers structure
is. Past researchers have described the structural features of an adsorbed polymer as
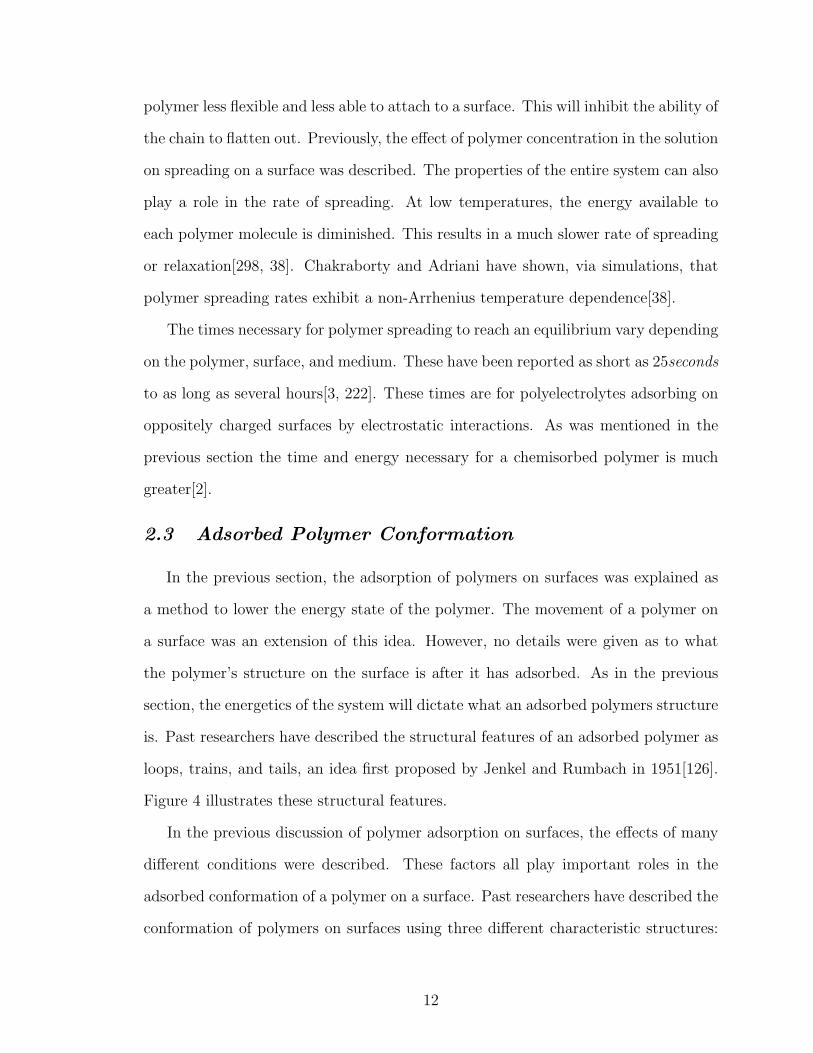
loops, trains, and tails, an idea first proposed by Jenkel and Rumbach in 1951[126].
Figure 4 illustrates these structural features.
In the previous discussion of polymer adsorption on surfaces, the effects of many
different conditions were described. These factors all play important roles in the
adsorbed conformation of a polymer on a surface. Past researchers have described the
conformation of polymers on surfaces using three different characteristic structures:
12
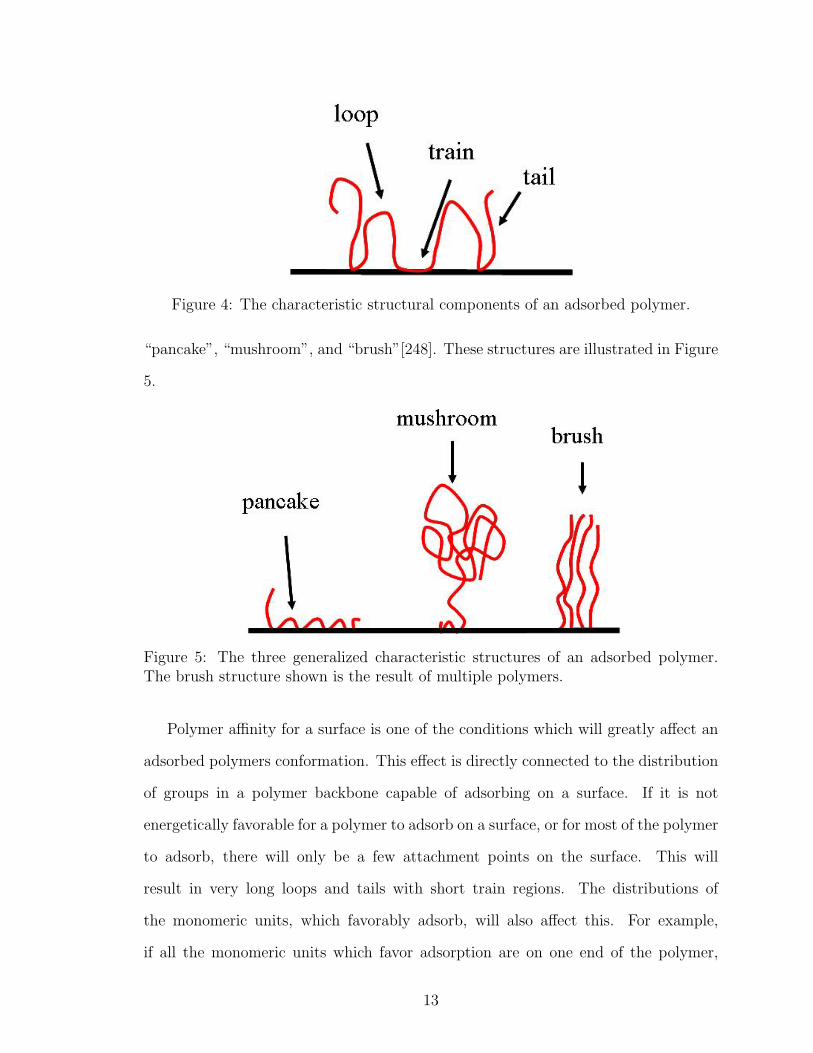
Figure 4: The characteristic structural components of an adsorbed polymer.
“pancake”, “mushroom”, and “brush”[248]. These structures are illustrated in Figure
5.
Figure 5: The three generalized characteristic structures of an adsorbed polymer.The brush structure shown is the result of multiple polymers.
Polymer affinity for a surface is one of the conditions which will greatly affect an
adsorbed polymers conformation. This effect is directly connected to the distribution
of groups in a polymer backbone capable of adsorbing on a surface. If it is not
energetically favorable for a polymer to adsorb on a surface, or for most of the polymer
to adsorb, there will only be a few attachment points on the surface. This will
result in very long loops and tails with short train regions. The distributions of
the monomeric units, which favorably adsorb, will also affect this. For example,
if all the monomeric units which favor adsorption are on one end of the polymer,
13
there will be a train followed by a tail. The length of these features is directly
dependent on the amount of each monomeric unit in the polymer chain. Similar to
this condition, the charge density of polyelectrolytes and surfaces will directly affect
the resulting polymer conformation and structure. If the polymer and surface have
opposite charges and high charge densities, it is likely that the resulting structure
would be a “pancake” due to the ability of the polymer to minimize its energy state
by adsorbing on the surface. If the charge density of the polymer is lower, a structure
with larger loops and tails would be expected. The size of the monomeric units in
the polymer backbone will also affect the structure of an adsorbed polymer. Bulky
side groups on the polymer backbone can make multiple adsorption points less likely
resulting in large loops and tails, or conformational structures which appear to have
a single attachment and a straight chain.
The concentration of polymers adsorbed on a surface will also affect the conforma-
tional structure of adsorbed polymers. As the concentration of polymers on a surface
increases, competition for available adsorption sites increases. Combined with this,
steric hindrance and electrostatic hindrance, in the case of polyelectrolytes, will pro-
hibit the polymers from getting too close to each other. This will move structure from
a “pancake” at low concentrations, to a “mushroom” at higher concentrations as hin-
drance pushes the polymer away from the surface, and finally to a “brush” where the
surface is nearly saturated by adsorbed polymers and the hindrance between them
causing an upright relatively straight conformation.
The molecular weight of a polymer will also affect the structure of its adsorbed
conformation. Cohen Stuart et al. showed a relationship between the molecular
weight of a polymer and its adsorbed conformation[52]. As the molecular weight of
the polymer increases it is less likely that the polymer will reside in a “pancake”
conformation. This is due to not only the steric constraints from the chain, but also
due to reducing the polymer’s entropy by tightly adsorbing it to a surface. Cohen
14
Stuart et al. were also able to relate the adsorbed polymer structure to the radius of
gyration for a free polymer in dilute solution as a function of the molecular weight
of the polymer[52]. They found that for low molecular weight polymers the adsorbed
polymer structure had a thickness less than its radius of gyration. However, as the
molecular weight of the polymer increased the adsorbed polymer structure thickness
was found to be similar to twice the radius of gyration.
The properties of the surrounding environment will also affect the adsorbed poly-
mer structure. Previously, it was mentioned that temperature will affect polymer
adsorption, desorption, and movement on a surface. As the temperature of the sur-
rounding environment of an adsorbed polymer increases, the structure of the polymer
will move more from a “pancake” conformation towards an extended “mushroom” or
“brush” conformation[41]. This is due to the increased energy in the polymer, which
allows it to move around and extend more than a less energetic polymer. Chibowski
et al. also found a adsorbed structure dependence on pH[41]. They found that for
polyacrylic acid adsorbed on zirconium oxide, increasing the pH caused an extension
of the adsorbed polymer conformation[41]. They attributed this to the increased
dissociation of carboxylic acid groups on the polymer chain leading to a negatively
charged chain[41]. This, coupled with the increasing negative charge of the zirconium
oxide surface, as the pH increased, resulted in electrostatic repulsion causing the chain
to extend away from the surface[41].
Another property of the surrounding medium is the concentration of electrolytes
in solution. The effects of electrolytes has been extensively studied and found to have
very significant effects on adsorbed polymer conformation[202, 245, 244]. This topic
will be investigated more thoroughly in a later section. The effects of other polymers
and electrolytes can cause changes in adsorbed polymer conformation depending on
the specific interactions[270, 271, 89].
15
2.3.1 Theoretical Models
Not all information necessary to completely understand why a polymer adopts
a particular conformation can be obtained experimentally. To assist in the under-
standing of polymer adsorption, movement, and conformation on a surface, several
different theoretical models have been developed. Fleer et al. divided these models
into two different groups: models which track chain conformation statistics, and those
which model the concentration profile of a polymer on a surface[89].
Those models which track a polymer chain’s conformation based on conformation
statistics can be divided into models which use an exact enumeration technique, the
Monte Carlo method, self-consistent mean field theory, or models which explicitly
account for loops, tails, and trains[89]. By following the random walk procedure,
the exact enumeration technique calculates every possible conformation a polymer
can have on a surface without occupying the same space. Many researchers have
used this method to gain insight into adsorbed conformation and how this may affect
other properties[171, 55, 246, 282, 140, 138, 139, 265]. Using this technique, the
location where a polymer is attached to a surface and its resulting conformation can
be determined[265]. In most exact enumeration models, the effects of the solvent is not
accounted for[89]. However, Lax discovered that this oversight can cause considerable
conformational changes in the resulting structures[138]. This problem aside, the main
reason exact enumeration is not used very often for polymer conformation studies is
due to its high computational cost[89]. The longest polymer chains modeled were
only 24 units long and this required a large amount of processing time[89].
The second modeling technique is the Monte Carlo method. This method starts
with an initial conformation of a polymer, on or off the surface, and randomly moves
the chain. After this movement, the energy of the chain is calculated and if it in-
creases beyond a reasonable amount the conformation is discarded and the original
16
conformation is used again. Using this method, the number of steps and conforma-
tions evaluated is significantly reduced lowering the computational expense of the
model[89]. This method has been used to not only predict possible adsorbed poly-
mer conformations, but also to investigate the conformation of polymer chains in
solutions[45, 129, 213, 238, 210, 101, 42]. Although faster than the exact enumer-
ation technique, the Monte Carlo method does not, however, solve the problem of
accommodating large polymers with a reasonable amount of computation time[89].
It also is calculated on a time scale of picoseconds to nanoseconds, making its appli-
cability to actual systems difficult[89].
The self-consistent mean field lattice method reduces the number of calculations
of the previous two methods. This is done by dividing up the space a polymer
can occupy into a lattice. Using just this division of space, many early researchers
were able to cut significant amounts of time from the simulations of small molecules
and oligomers[23, 160, 9, 89]. However, in order to model larger polymers further
steps needed to be taken. Many researchers have confronted this task and come up
with reasonable approach to reduce the computational time[81, 223, 82]. To save
time, the polymer only remembers where it was in the previous step. This allows a
polymer to fold back on itself and occupy the same lattice site every two steps. These
researchers also biased the lattice so polymers near an attractive surface had weighted
surface layers[89]. These two enhancements accelerate the process by constraining the
polymer slightly. In the previously mentioned studies, a polymer was not allowed to
interact with itself or other polymers, only the surface[89]. It should also be noted,
this case is not applicable for systems such as polyelectrolytes. Scheutjens and Fleer
extended these models to account for interacting chains[232, 233]. In these models the
weighting of interactions did not only occur relative to the surface, they extended in
all directions allowing interactions with other molecules to be accounted for[89]. This
method has been widely used to theoretically model adsorbed interacting polymer’s
17
conformations[84, 249, 143, 69, 131, 152, 292, 137, 165, 289, 70, 299].
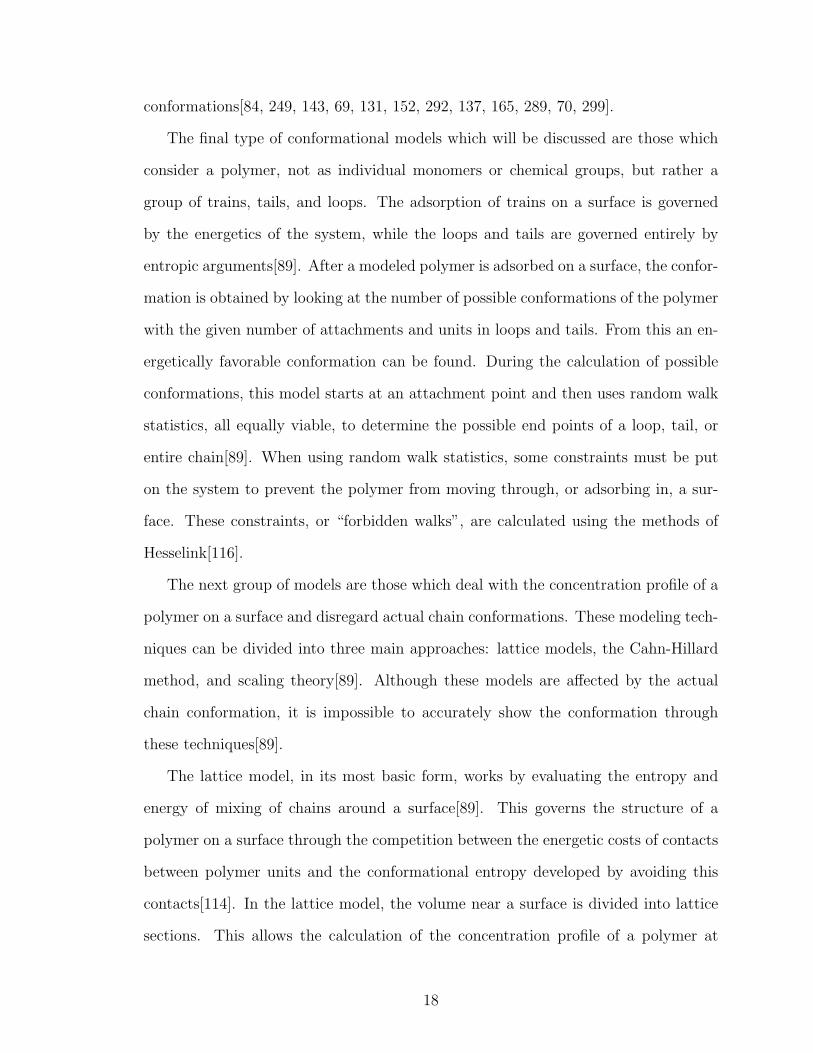
The final type of conformational models which will be discussed are those which
consider a polymer, not as individual monomers or chemical groups, but rather a
group of trains, tails, and loops. The adsorption of trains on a surface is governed
by the energetics of the system, while the loops and tails are governed entirely by
entropic arguments[89]. After a modeled polymer is adsorbed on a surface, the confor-
mation is obtained by looking at the number of possible conformations of the polymer
with the given number of attachments and units in loops and tails. From this an en-
ergetically favorable conformation can be found. During the calculation of possible
conformations, this model starts at an attachment point and then uses random walk
statistics, all equally viable, to determine the possible end points of a loop, tail, or
entire chain[89]. When using random walk statistics, some constraints must be put
on the system to prevent the polymer from moving through, or adsorbing in, a sur-
face. These constraints, or “forbidden walks”, are calculated using the methods of
Hesselink[116].
The next group of models are those which deal with the concentration profile of a
polymer on a surface and disregard actual chain conformations. These modeling tech-
niques can be divided into three main approaches: lattice models, the Cahn-Hillard
method, and scaling theory[89]. Although these models are affected by the actual
chain conformation, it is impossible to accurately show the conformation through
these techniques[89].
The lattice model, in its most basic form, works by evaluating the entropy and
energy of mixing of chains around a surface[89]. This governs the structure of a
polymer on a surface through the competition between the energetic costs of contacts
between polymer units and the conformational entropy developed by avoiding this
contacts[114]. In the lattice model, the volume near a surface is divided into lattice
sections. This allows the calculation of the concentration profile of a polymer at
18
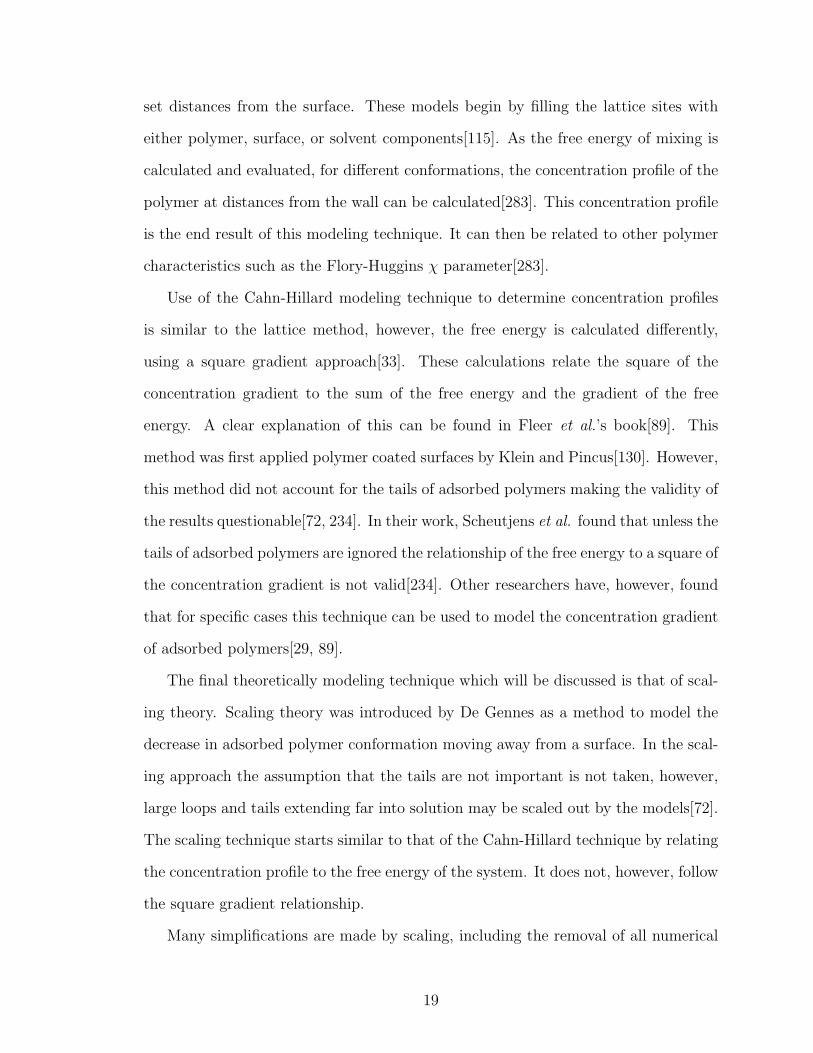
set distances from the surface. These models begin by filling the lattice sites with
either polymer, surface, or solvent components[115]. As the free energy of mixing is
calculated and evaluated, for different conformations, the concentration profile of the
polymer at distances from the wall can be calculated[283]. This concentration profile
is the end result of this modeling technique. It can then be related to other polymer
characteristics such as the Flory-Huggins χ parameter[283].
Use of the Cahn-Hillard modeling technique to determine concentration profiles
is similar to the lattice method, however, the free energy is calculated differently,
using a square gradient approach[33]. These calculations relate the square of the
concentration gradient to the sum of the free energy and the gradient of the free
energy. A clear explanation of this can be found in Fleer et al.’s book[89]. This
method was first applied polymer coated surfaces by Klein and Pincus[130]. However,
this method did not account for the tails of adsorbed polymers making the validity of
the results questionable[72, 234]. In their work, Scheutjens et al. found that unless the
tails of adsorbed polymers are ignored the relationship of the free energy to a square of
the concentration gradient is not valid[234]. Other researchers have, however, found
that for specific cases this technique can be used to model the concentration gradient
of adsorbed polymers[29, 89].
The final theoretically modeling technique which will be discussed is that of scal-
ing theory. Scaling theory was introduced by De Gennes as a method to model the
decrease in adsorbed polymer conformation moving away from a surface. In the scal-
ing approach the assumption that the tails are not important is not taken, however,
large loops and tails extending far into solution may be scaled out by the models[72].
The scaling technique starts similar to that of the Cahn-Hillard technique by relating
the concentration profile to the free energy of the system. It does not, however, follow
the square gradient relationship.
Many simplifications are made by scaling, including the removal of all numerical
19
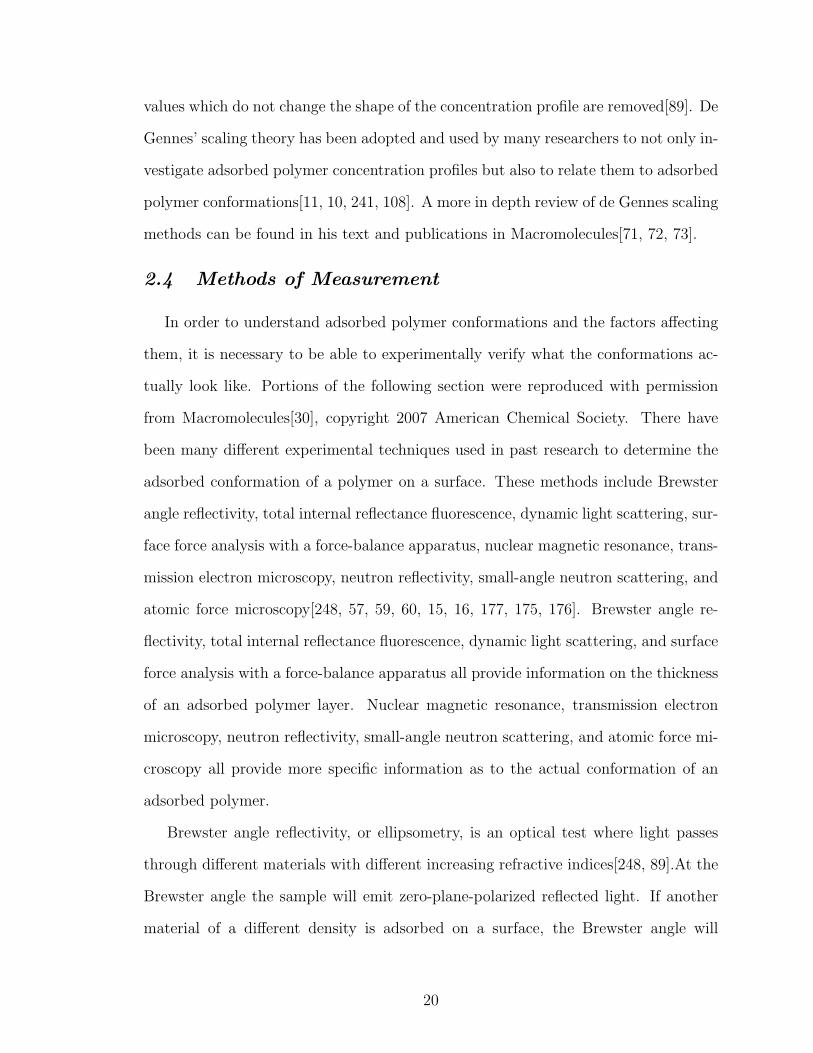
values which do not change the shape of the concentration profile are removed[89]. De
Gennes’ scaling theory has been adopted and used by many researchers to not only in-
vestigate adsorbed polymer concentration profiles but also to relate them to adsorbed
polymer conformations[11, 10, 241, 108]. A more in depth review of de Gennes scaling
methods can be found in his text and publications in Macromolecules[71, 72, 73].
2.4 Methods of Measurement
In order to understand adsorbed polymer conformations and the factors affecting
them, it is necessary to be able to experimentally verify what the conformations ac-
tually look like. Portions of the following section were reproduced with permission
from Macromolecules[30], copyright 2007 American Chemical Society. There have
been many different experimental techniques used in past research to determine the
adsorbed conformation of a polymer on a surface. These methods include Brewster
angle reflectivity, total internal reflectance fluorescence, dynamic light scattering, sur-
face force analysis with a force-balance apparatus, nuclear magnetic resonance, trans-
mission electron microscopy, neutron reflectivity, small-angle neutron scattering, and
atomic force microscopy[248, 57, 59, 60, 15, 16, 177, 175, 176]. Brewster angle re-
flectivity, total internal reflectance fluorescence, dynamic light scattering, and surface
force analysis with a force-balance apparatus all provide information on the thickness
of an adsorbed polymer layer. Nuclear magnetic resonance, transmission electron
microscopy, neutron reflectivity, small-angle neutron scattering, and atomic force mi-
croscopy all provide more specific information as to the actual conformation of an
adsorbed polymer.
Brewster angle reflectivity, or ellipsometry, is an optical test where light passes
through different materials with different increasing refractive indices[248, 89].At the
Brewster angle the sample will emit zero-plane-polarized reflected light. If another
material of a different density is adsorbed on a surface, the Brewster angle will
20
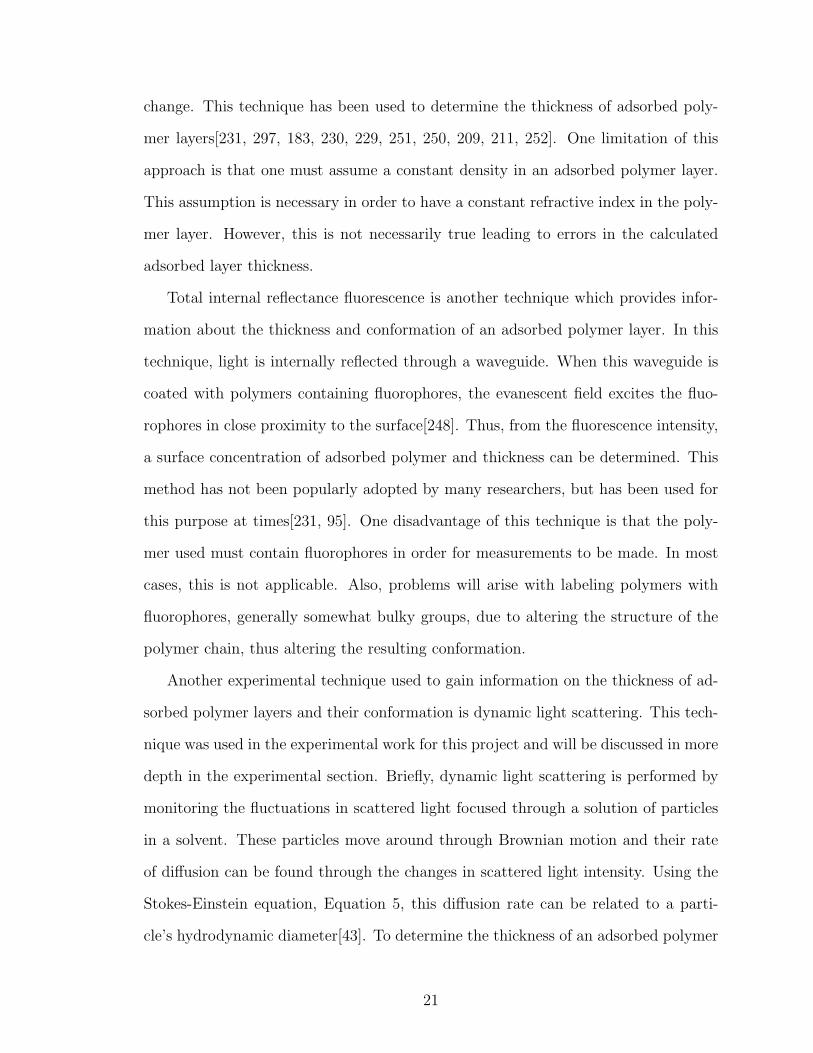
change. This technique has been used to determine the thickness of adsorbed poly-
mer layers[231, 297, 183, 230, 229, 251, 250, 209, 211, 252]. One limitation of this
approach is that one must assume a constant density in an adsorbed polymer layer.
This assumption is necessary in order to have a constant refractive index in the poly-
mer layer. However, this is not necessarily true leading to errors in the calculated
adsorbed layer thickness.
Total internal reflectance fluorescence is another technique which provides infor-
mation about the thickness and conformation of an adsorbed polymer layer. In this
technique, light is internally reflected through a waveguide. When this waveguide is
coated with polymers containing fluorophores, the evanescent field excites the fluo-
rophores in close proximity to the surface[248]. Thus, from the fluorescence intensity,
a surface concentration of adsorbed polymer and thickness can be determined. This
method has not been popularly adopted by many researchers, but has been used for
this purpose at times[231, 95]. One disadvantage of this technique is that the poly-
mer used must contain fluorophores in order for measurements to be made. In most
cases, this is not applicable. Also, problems will arise with labeling polymers with
fluorophores, generally somewhat bulky groups, due to altering the structure of the
polymer chain, thus altering the resulting conformation.
Another experimental technique used to gain information on the thickness of ad-
sorbed polymer layers and their conformation is dynamic light scattering. This tech-
nique was used in the experimental work for this project and will be discussed in more
depth in the experimental section. Briefly, dynamic light scattering is performed by
monitoring the fluctuations in scattered light focused through a solution of particles
in a solvent. These particles move around through Brownian motion and their rate
of diffusion can be found through the changes in scattered light intensity. Using the
Stokes-Einstein equation, Equation 5, this diffusion rate can be related to a parti-
cle’s hydrodynamic diameter[43]. To determine the thickness of an adsorbed polymer
21
layer, polymer is added to the solution of particles. As the polymers adsorb on the
particles their rate of diffusion will slow down which can then be related to a larger hy-
drodynamic diameter. The difference of these two diameters divided by two is the ad-
sorbed layer thickness. This technique has been used by many researchers to gain in-
formation on adsorbed polymer conformations, flocculation rates, and adsorbed layer
thicknesses[267, 179, 169, 185, 276, 286, 119, 167, 296, 207, 128, 75, 268, 105, 136, 66].
One problem with all of the experimental techniques discussed to this point is the
issue of how small polymer particles scatter light. With dynamic light scattering, it
is generally assumed that the hydrodynamic radius relates to the outermost points
of the polymer layer. This is assumed following the work of Nelson and Cosgrove,
who reported that the tail region of an adsorbed polymer has the largest effect on
the hydrodynamic diameter in dynamic light scattering[179]. However, this is not a
uniform layer and the scattered light and may be affected by the large amount of
void volumes in the adsorbed polymer layer. Also, the diffusion rate is calculated
assuming spherical geometry. The porosity and structure of the adsorbed polymer
layer can result in different flow characteristics altering the reported hydrodynamic
diameter[198].
Dynamic light scattering hydrodynamic diameters are also subject to changes in
polymer conformation due to the concentration of polymer on a particle surface. It is
assumed that the polymer layer on a particle is uniform in dynamic light scattering,
however, this is not the case. In order to have the most uniform polymer layer, the
structure of the adsorbed polymers must be that of a dense “brush”. To do this the
adsorbed polymer conformation has already been altered. In the cases of polymers
of a “mushroom” or “pancake” structure it is difficult to describe the polymer layer
as uniform.
The final experimental method to measure a polymers adsorbed layer thickness
is surface force analysis using a force-balance apparatus. A force-balance apparatus
22
contains two surfaces which can be brought together mechanically. As these surfaces
are brought together or moved past each other the force between the surfaces is
measured using variable stiffness force-measuring springs[248]. These experiments can
be run in both aqueous and vapor environments. The resolution for this apparatus is
0.1nm and is sensitive to forces as small as 10−8N [123]. Taunton et al. have adsorbed
polymers on the surfaces used in this apparatus and measured the distance at which
they first begin to feel the other surface[263, 262, 261, 26, 63]. Using this method,
the adsorbed polymer layer thickness can be determined.
Similar to the use of polymer concentration profiles, in polymer adsorption the-
ory, to determine adsorbed polymer conformation, the use of adsorbed polymer layer
thickness can not give actual polymer conformation data. This adsorbed layer thick-
ness in most experimental techniques is representative of the outermost adsorbed
polymer distances. However, what that polymer’s conformation is like within this
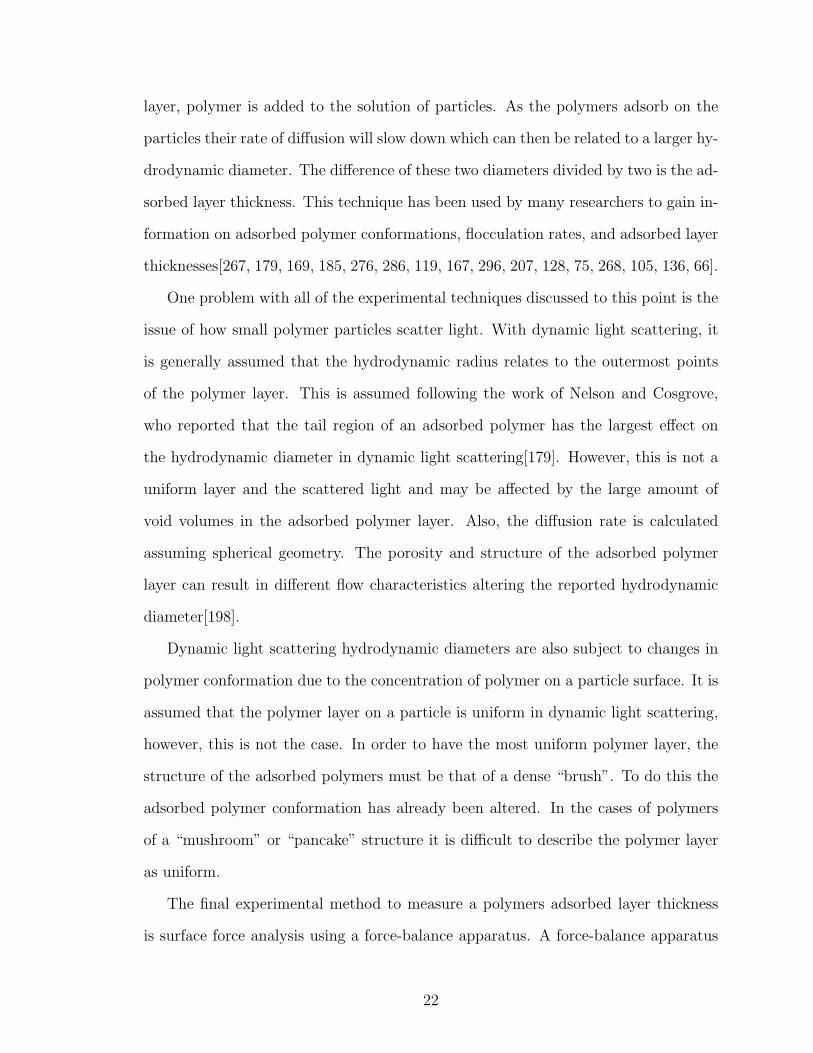
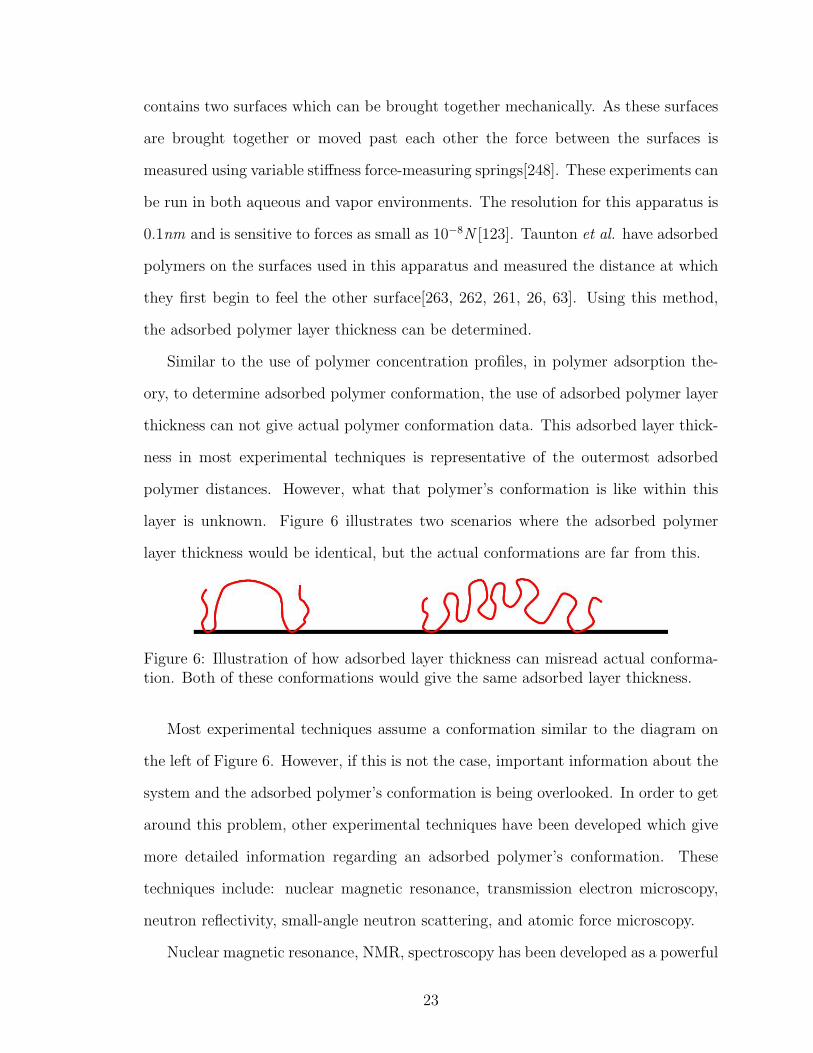
layer is unknown. Figure 6 illustrates two scenarios where the adsorbed polymer
layer thickness would be identical, but the actual conformations are far from this.
Figure 6: Illustration of how adsorbed layer thickness can misread actual conforma-tion. Both of these conformations would give the same adsorbed layer thickness.
Most experimental techniques assume a conformation similar to the diagram on
the left of Figure 6. However, if this is not the case, important information about the
system and the adsorbed polymer’s conformation is being overlooked. In order to get
around this problem, other experimental techniques have been developed which give
more detailed information regarding an adsorbed polymer’s conformation. These
techniques include: nuclear magnetic resonance, transmission electron microscopy,
neutron reflectivity, small-angle neutron scattering, and atomic force microscopy.
Nuclear magnetic resonance, NMR, spectroscopy has been developed as a powerful
23
tool for determining the fraction of a polymer which is adsorbed on a surface[89]. In
high resolution NMR of multiphase systems, many of the filters which the signal runs
through will only allow mobile, or liquid like, components to be detected[89]. In this
system, when polymers adsorb on a surface part of their signal becomes invisible
because it is bound to a solid phase. By comparing this new signal with that of a
well characterized control system, the amount of bound polymer can be quantified[89].
This has been applied to adsorbed polymers by different groups of researchers[172, 79].
Using NMR there are two other experimental techniques which can be used to
determine adsorbed polymer bound fractions: pulsed NMR studies, and solvent
relaxation[89]. Both of these techniques have been explored extensively by Cosgrove
and fellow researchers[15, 16, 58, 64, 65, 57, 269, 60, 61, 168, 180, 90, 91]. In each, the
decay, or relaxation, of the spin of the system is analyzed. In solvent relaxation, only
the that of the mobile solvent phase is considered. In the pulsed NMR technique, the
decay of the solvent and solid states must be deconvoluted and analyzed[89]. These
NMR techniques provide a quantitative amount of polymer bound fractions. How-
ever, it is impossible to determine how many polymers are being analyzed and if the
entire polymer is being analyzed.
The use of transmission electron microscopy to elucidate adsorbed polymer confor-
mation was recently developed by Nanko et al.[177, 175, 176]. Most polymers are not
conductive, which makes imaging them with electron microscopy nontrivial[272]. To
get around this problem, Nanko labeled the polymers with gold nanoparticles[177].
This allows the researcher to locate the nanoparticles and therefore get an idea of
where the polymer could be. This method has a couple significant barriers towards
its use: the sample must be dry and run under vacuum, and the polymer must be
labeled with gold nanoparticles. The dry state required Nanko et al. to remove water
with paper towels prior to placing the sample in a transmission electron microscope.
As the water is drawn away it will move the adsorbed polymer in the direction of the
24
flow. Nanko et al. interpreted this to mean the polymers always stick out in nearly
straight lines. However, this is not supported by any other experiments or current
theory on adsorbed polymer conformation. The second requirement of labeling the
polymer with gold nanoparticles will greatly affect the polymer conformation. The
gold particles can be considered bulky side groups which will cause great steric hin-
drance and also interact with both the substrate and the solvent phase. Therefore,
this technique has not been widely adopted.
The next experimental techniques, neutron reflectivity and small-angle neutron
scattering, are able to give density profiles of polymers adsorbed on a surface in
the direction perpendicular to the surface. This technique can be used to gain very
specific information about an adsorbed polymer’s conformation. Similar to light
scattering, small-angle neutron scattering detects the intensity of scattered neutrons
to image objects. With respect to polymers adsorbed on a surface, neutron reflection
is used[117, 217, 93, 100, 181, 63, 62, 57, 80]. Most of these studies are done by either
labeling the polymer with hydrogen isotopes, such as deuterium, or performing the
experiments in heavy water[117]. Unlike other methods of labeling polymers, this
should add no additional size to the polymer or restrict its movements in any way.
These techniques, however, are very sensitive to the amount of liquid the neutrons
must travel through and the reflection that can occur from the solid surface which
the polymer adsorbs on[117]. It is also impossible to determine how many polymers
are being visualized and if the complete polymer is being visualized. All that being
said, the most formidable barrier is the relatively inaccessibility of this equipment to
most researchers.
2.4.1 Atomic Force Microscopy
The last experimental method which will be discussed is the use of atomic force
microscopy, AFM, to determine adsorbed polymer conformation. There are two AFM
25
techniques which have been used to determine information about an adsorbed poly-
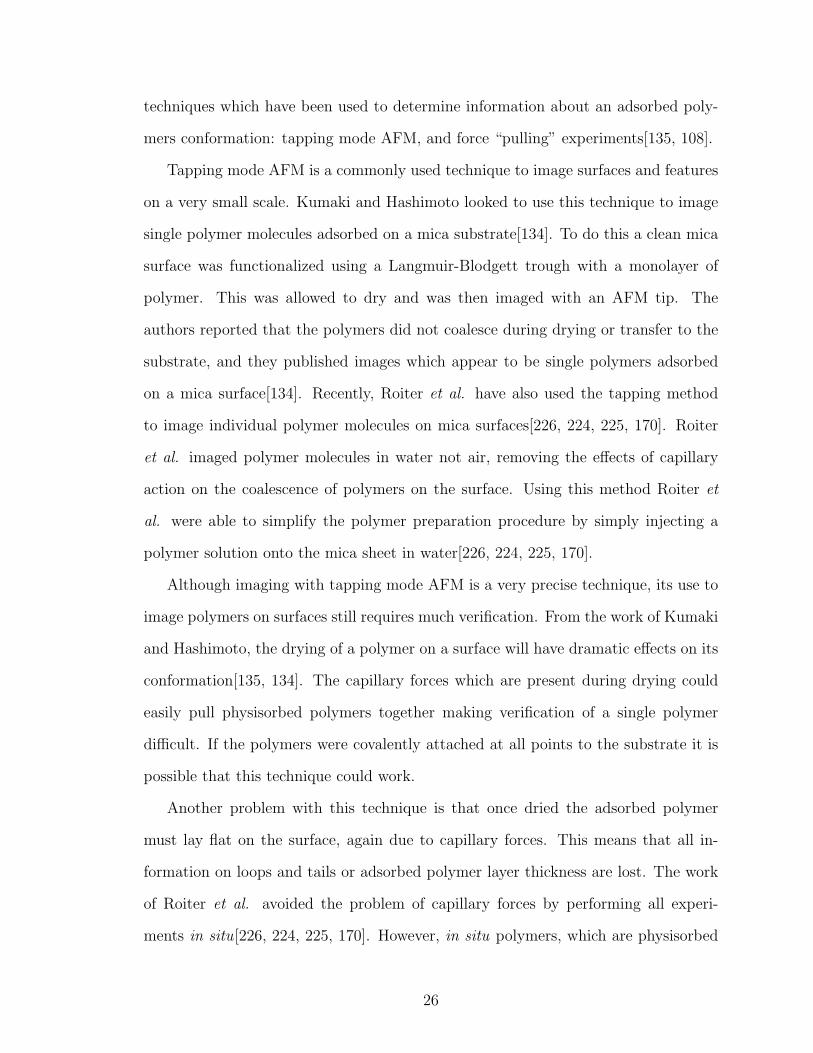
mers conformation: tapping mode AFM, and force “pulling” experiments[135, 108].
Tapping mode AFM is a commonly used technique to image surfaces and features
on a very small scale. Kumaki and Hashimoto looked to use this technique to image
single polymer molecules adsorbed on a mica substrate[134]. To do this a clean mica
surface was functionalized using a Langmuir-Blodgett trough with a monolayer of
polymer. This was allowed to dry and was then imaged with an AFM tip. The
authors reported that the polymers did not coalesce during drying or transfer to the
substrate, and they published images which appear to be single polymers adsorbed
on a mica surface[134]. Recently, Roiter et al. have also used the tapping method
to image individual polymer molecules on mica surfaces[226, 224, 225, 170]. Roiter
et al. imaged polymer molecules in water not air, removing the effects of capillary
action on the coalescence of polymers on the surface. Using this method Roiter et
al. were able to simplify the polymer preparation procedure by simply injecting a
polymer solution onto the mica sheet in water[226, 224, 225, 170].
Although imaging with tapping mode AFM is a very precise technique, its use to
image polymers on surfaces still requires much verification. From the work of Kumaki
and Hashimoto, the drying of a polymer on a surface will have dramatic effects on its
conformation[135, 134]. The capillary forces which are present during drying could
easily pull physisorbed polymers together making verification of a single polymer
difficult. If the polymers were covalently attached at all points to the substrate it is
possible that this technique could work.
Another problem with this technique is that once dried the adsorbed polymer
must lay flat on the surface, again due to capillary forces. This means that all in-
formation on loops and tails or adsorbed polymer layer thickness are lost. The work
of Roiter et al. avoided the problem of capillary forces by performing all experi-
ments in situ[226, 224, 225, 170]. However, in situ polymers, which are physisorbed
26
to surfaces, will constantly be in motion and adsorption points will change as the
adsorption/desorption process occurs. With tapping mode imaging, the tip will hit
the surface which allows the polymer to be pushed and pulled around the surface by
the AFM tip. This will change the adsorbed conformation of the polymer which is
being imaged. There is also the possibility that the polymer will physisorb to the tip
and be moved around. Similar to the Kumaki method, this method also is unable to
reveal information on the number of attachments, the length of loops or tails.
Unlike imaging polymers with tapping mode AFM, force “pulling” experiments,
or force spectroscopy, do not raster a tip across a surface preventing the tip from
dragging polymers around on the surface while being imaged. In this technique, an
AFM tip is pulled from a surface, or polymer, and the force-distance curve is evaluated
to determine a number of different properties. This technique was initially used on
polymers by Gaub et al.[221, 294]. In force spectroscopy, an AFM tip is brought into
contact with a surface and the lever is deflected. The tip is then retracted from the
surface and the deflection of the lever is monitored. From the change in deflection of
the tip as it is pulled from the surface, the interaction force and the elasticity of the
molecule or bond can be calculated based on the spring constant of the cantilever.
This technique has been used to evaluate the adsorption force and interaction forces
of many polymer systems[294, 142, 278, 67, 287, 239, 5, 46, 125, 295, 288, 32, 293,
54, 150, 253, 37, 149, 240, 102, 107, 187, 151, 221, 203, 92, 141, 141, 147].
Another technique using force spectroscopy is the analysis of adsorbed polymer
loop lengths using AFM. In this technique, the distance between quick deflections
of the lever, representing the desorption of polymer attachments, is measured giving
the straight chain length of the polymer loop. This method has been used by many
researchers to gain information about adsorbed polymer conformations[240, 241, 5, 6,
24, 53, 107, 108, 109, 146, 148, 220, 36, 184, 215, 121, 40, 145, 144]. However, the ex-
perimental techniques used in many cases make the interpretation of the data difficult
27
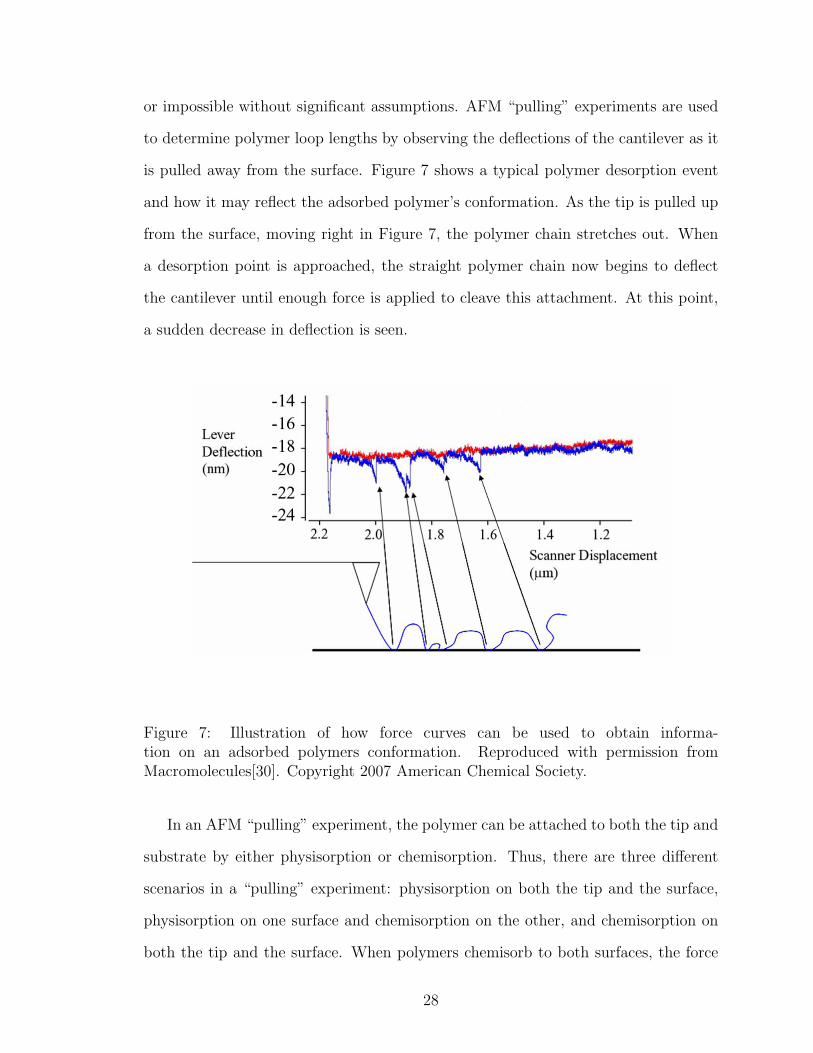
or impossible without significant assumptions. AFM “pulling” experiments are used
to determine polymer loop lengths by observing the deflections of the cantilever as it
is pulled away from the surface. Figure 7 shows a typical polymer desorption event
and how it may reflect the adsorbed polymer’s conformation. As the tip is pulled up
from the surface, moving right in Figure 7, the polymer chain stretches out. When
a desorption point is approached, the straight polymer chain now begins to deflect
the cantilever until enough force is applied to cleave this attachment. At this point,
a sudden decrease in deflection is seen.
Figure 7: Illustration of how force curves can be used to obtain informa-tion on an adsorbed polymers conformation. Reproduced with permission fromMacromolecules[30]. Copyright 2007 American Chemical Society.
In an AFM “pulling” experiment, the polymer can be attached to both the tip and
substrate by either physisorption or chemisorption. Thus, there are three different
scenarios in a “pulling” experiment: physisorption on both the tip and the surface,
physisorption on one surface and chemisorption on the other, and chemisorption on
both the tip and the surface. When polymers chemisorb to both surfaces, the force
28
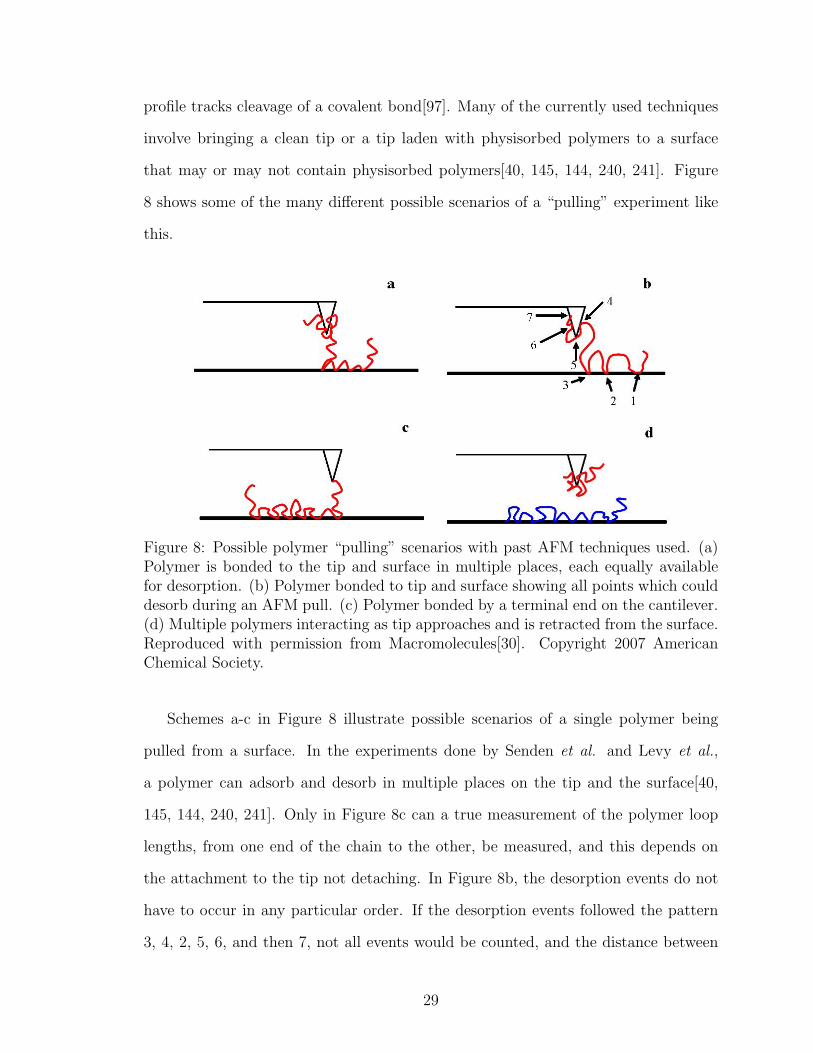
profile tracks cleavage of a covalent bond[97]. Many of the currently used techniques
involve bringing a clean tip or a tip laden with physisorbed polymers to a surface
that may or may not contain physisorbed polymers[40, 145, 144, 240, 241]. Figure
8 shows some of the many different possible scenarios of a “pulling” experiment like
this.
Figure 8: Possible polymer “pulling” scenarios with past AFM techniques used. (a)Polymer is bonded to the tip and surface in multiple places, each equally availablefor desorption. (b) Polymer bonded to tip and surface showing all points which coulddesorb during an AFM pull. (c) Polymer bonded by a terminal end on the cantilever.(d) Multiple polymers interacting as tip approaches and is retracted from the surface.Reproduced with permission from Macromolecules[30]. Copyright 2007 AmericanChemical Society.
Schemes a-c in Figure 8 illustrate possible scenarios of a single polymer being
pulled from a surface. In the experiments done by Senden et al. and Levy et al.,
a polymer can adsorb and desorb in multiple places on the tip and the surface[40,
145, 144, 240, 241]. Only in Figure 8c can a true measurement of the polymer loop
lengths, from one end of the chain to the other, be measured, and this depends on
the attachment to the tip not detaching. In Figure 8b, the desorption events do not
have to occur in any particular order. If the desorption events followed the pattern
3, 4, 2, 5, 6, and then 7, not all events would be counted, and the distance between
29
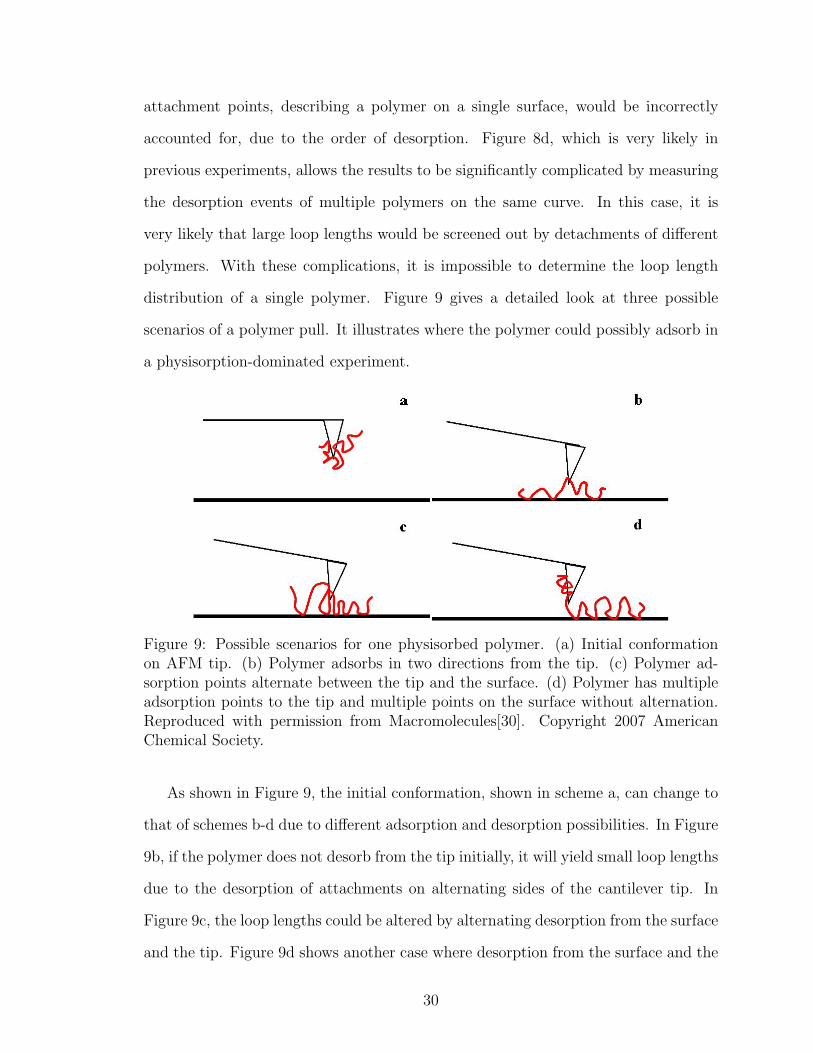
attachment points, describing a polymer on a single surface, would be incorrectly
accounted for, due to the order of desorption. Figure 8d, which is very likely in
previous experiments, allows the results to be significantly complicated by measuring
the desorption events of multiple polymers on the same curve. In this case, it is
very likely that large loop lengths would be screened out by detachments of different
polymers. With these complications, it is impossible to determine the loop length
distribution of a single polymer. Figure 9 gives a detailed look at three possible
scenarios of a polymer pull. It illustrates where the polymer could possibly adsorb in
a physisorption-dominated experiment.
Figure 9: Possible scenarios for one physisorbed polymer. (a) Initial conformationon AFM tip. (b) Polymer adsorbs in two directions from the tip. (c) Polymer ad-sorption points alternate between the tip and the surface. (d) Polymer has multipleadsorption points to the tip and multiple points on the surface without alternation.Reproduced with permission from Macromolecules[30]. Copyright 2007 AmericanChemical Society.
As shown in Figure 9, the initial conformation, shown in scheme a, can change to
that of schemes b-d due to different adsorption and desorption possibilities. In Figure
9b, if the polymer does not desorb from the tip initially, it will yield small loop lengths
due to the desorption of attachments on alternating sides of the cantilever tip. In
Figure 9c, the loop lengths could be altered by alternating desorption from the surface
and the tip. Figure 9d shows another case where desorption from the surface and the
30
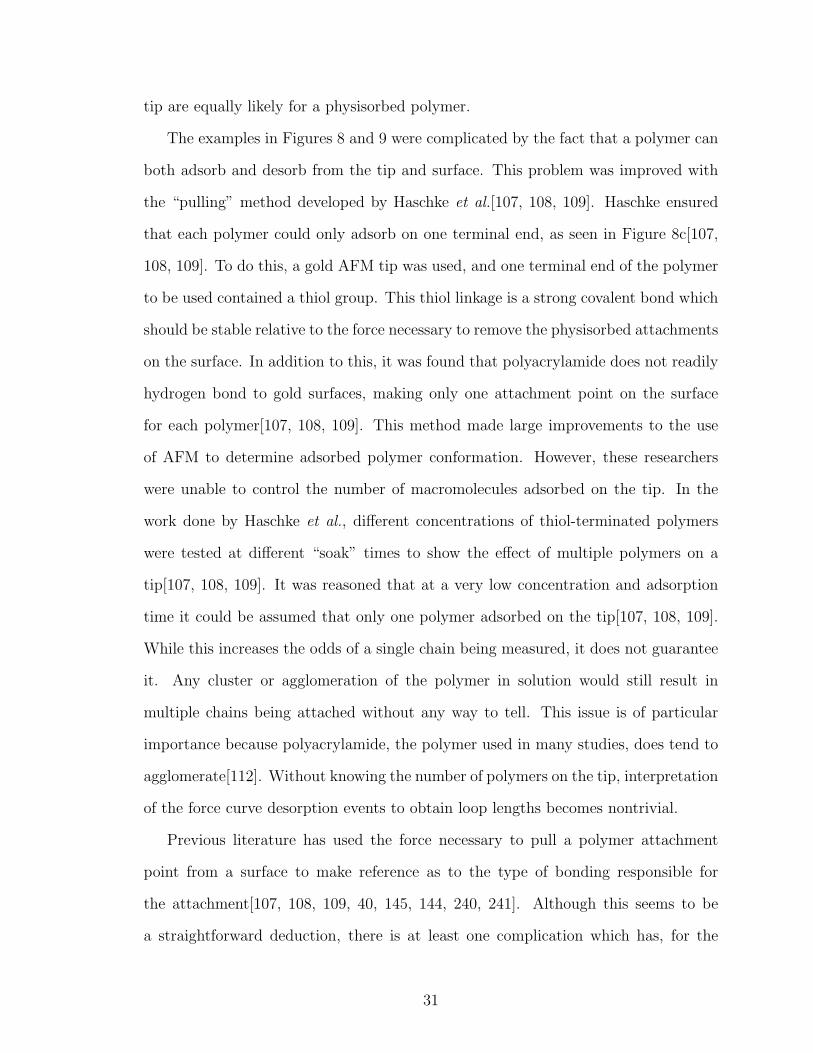
tip are equally likely for a physisorbed polymer.
The examples in Figures 8 and 9 were complicated by the fact that a polymer can
both adsorb and desorb from the tip and surface. This problem was improved with
the “pulling” method developed by Haschke et al.[107, 108, 109]. Haschke ensured
that each polymer could only adsorb on one terminal end, as seen in Figure 8c[107,
108, 109]. To do this, a gold AFM tip was used, and one terminal end of the polymer
to be used contained a thiol group. This thiol linkage is a strong covalent bond which
should be stable relative to the force necessary to remove the physisorbed attachments
on the surface. In addition to this, it was found that polyacrylamide does not readily
hydrogen bond to gold surfaces, making only one attachment point on the surface
for each polymer[107, 108, 109]. This method made large improvements to the use
of AFM to determine adsorbed polymer conformation. However, these researchers
were unable to control the number of macromolecules adsorbed on the tip. In the
work done by Haschke et al., different concentrations of thiol-terminated polymers
were tested at different “soak” times to show the effect of multiple polymers on a
tip[107, 108, 109]. It was reasoned that at a very low concentration and adsorption
time it could be assumed that only one polymer adsorbed on the tip[107, 108, 109].
While this increases the odds of a single chain being measured, it does not guarantee
it. Any cluster or agglomeration of the polymer in solution would still result in
multiple chains being attached without any way to tell. This issue is of particular
importance because polyacrylamide, the polymer used in many studies, does tend to
agglomerate[112]. Without knowing the number of polymers on the tip, interpretation
of the force curve desorption events to obtain loop lengths becomes nontrivial.
Previous literature has used the force necessary to pull a polymer attachment
point from a surface to make reference as to the type of bonding responsible for
the attachment[107, 108, 109, 40, 145, 144, 240, 241]. Although this seems to be
a straightforward deduction, there is at least one complication which has, for the
31
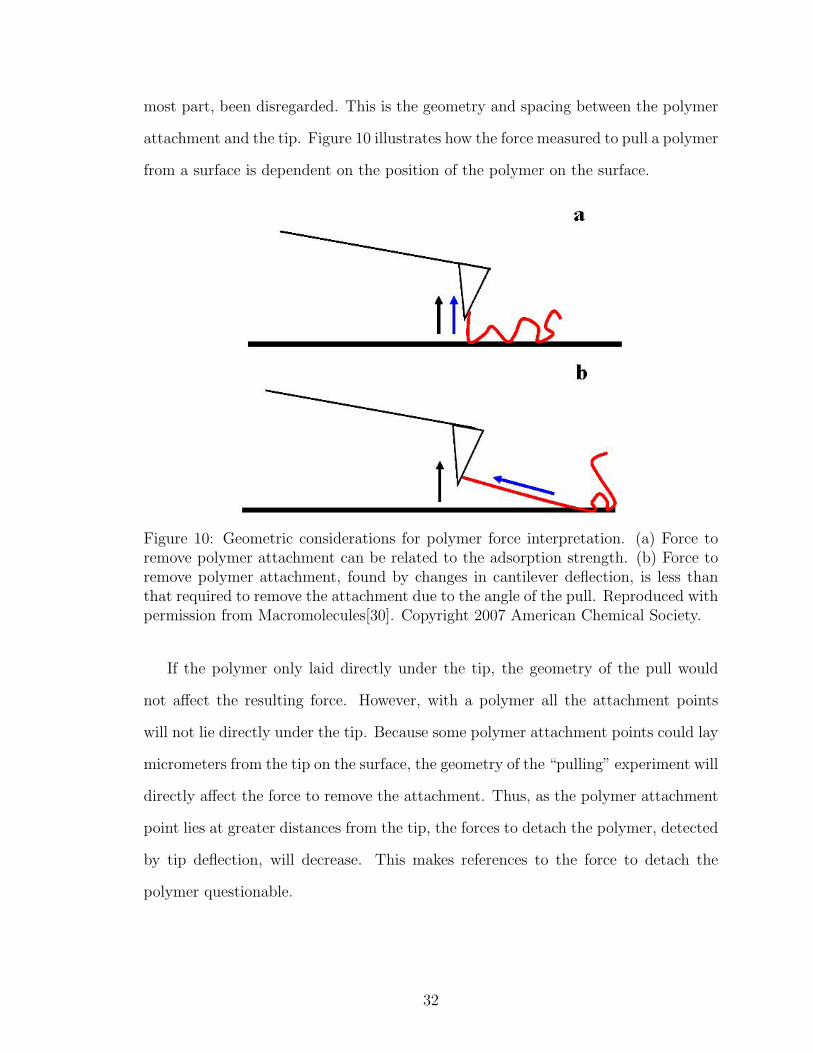
most part, been disregarded. This is the geometry and spacing between the polymer
attachment and the tip. Figure 10 illustrates how the force measured to pull a polymer
from a surface is dependent on the position of the polymer on the surface.
Figure 10: Geometric considerations for polymer force interpretation. (a) Force toremove polymer attachment can be related to the adsorption strength. (b) Force toremove polymer attachment, found by changes in cantilever deflection, is less thanthat required to remove the attachment due to the angle of the pull. Reproduced withpermission from Macromolecules[30]. Copyright 2007 American Chemical Society.
If the polymer only laid directly under the tip, the geometry of the pull would
not affect the resulting force. However, with a polymer all the attachment points
will not lie directly under the tip. Because some polymer attachment points could lay
micrometers from the tip on the surface, the geometry of the “pulling” experiment will
directly affect the force to remove the attachment. Thus, as the polymer attachment
point lies at greater distances from the tip, the forces to detach the polymer, detected
by tip deflection, will decrease. This makes references to the force to detach the
polymer questionable.
32
2.5 Salt Effect
The effects of electrolytes, or salts, on adsorbed polymers have been a study of great
interest over the past decades[89, 245, 244, 279, 118, 35, 90, 83, 84, 277, 227, 28, 68,
155, 159, 111, 216, 18, 78, 254, 243, 229, 242, 107, 109]. Much of this interest is due to
the presence of salts in most industrial applications where polymers are used. Salts
can affect the adsorbed conformation and adsorption amounts of polyelectrolytes and
nonionic polymers[89]. According to Shubin and Linse, this can be done in three
different ways: screening of electrostatic attractions between the polymer and surface
and electrostatic repulsion between similarly charged groups, competition between
electrolyte ions and polymers for space near the charged surface, and competition for
adsorption sites between the electrolyte and the polymer[245]. It is expected that
the effects of electrolytes would be the most pronounced on polyelectrolytes due to
the screening effects they have on interactions between polyelectrolytes[122]. Fleer et
al. outlined four possible scenarios for the salt effect on polymer adsorption: charged
polymer/uncharged surface, uncharged polymer/charged surface, similarly charged
polymer and surface, and oppositely charged polymer and surface[89]. For uncharged
polymers and charged surfaces, the salt effect is expected to be weak[89]. For charged
polymers and uncharged surfaces and similarly charged polymers and surfaces, the
addition of salt is expected to increase the amount of polymer adsorbed[89]. In the
final case of a charged polymer and an oppositely charged surface, the addition of
salt is expected to decrease the amount of polymer adsorbed unless the polymer has
non-electrostatic adsorptive properties[89]. This section of the literature review will
investigate previous work dealing with the salt effect on nonionic polymers, the salt
effect on ionic polymers, and the salt effect on adsorbed polymer conformation.
Flood et al. investigated the effects of electrolytes on adsorbed layers of a nonionic
polymer, polyethylene oxide[90]. They found that the adsorption amount increased
and the adsorbed polymer layer thickness, found using dynamic light scattering, also
33
increased with increasing salt concentrations[90]. Fleer et al. predicted that the salt
effect on nonionic polymers adsorbing on charged substrates would be very weak[89].
However, Flood et al.’s results seem contrary. Flood et al. explained the increased
adsorption and increased adsorbed polymer layer thickness to a decrease in solubility
of the polymer in the salt solutions[90]. The more salt present the more the polymer
will want to adsorb. The final result, of interest, from this study was that monovalent
salts did not have a noticeable effect on the proportion of trains in the adsorbed poly-
mer conformation[90]. However, with increasing valency competition for adsorption
sites became noticeable[90]. Karlstrom et al. recorded the same decrease in polymer
solubility at increasing salt concentrations[127]. Avranas and Iliou have also observed
similar effects of salts on different nonionic polymers[12].
Electrolytes in solution have the ability to affect polyelectrolytes in different ways
depending on the polymer’s properties. As was mentioned previously, electrolytes
have the ability to screen electrostatic interactions and also compete for electrostatic
adsorption sites. If a polyelectrolyte has a high charge density, there will be a large
amount of repulsion between charged groups of the polymer. This will cause the
polymer to spread out and take up a large area. When this polymer adsorbs on
a surface, only a few polymers will be able to adsorb in a small area due to the
electrostatic repulsion. However, when salt is added to the solution these electrostatic
forces are screened allowing the polymers to move closer to one another and the
adsorbed amount on the surface will actually increase[245].
The competition for adsorption sites is not as important, in this situation, as the
multiple charged sites on the polymer allow most groups on the polymer backbone to
adsorb. Van de Steeg et al. showed, through simulations, that salt ions are also able
to displace highly charged polymers[266]. This illustration of the opposite case points
to the effect slight differences in experimental settings can have on the results. For the
case of low charge density polymers, adsorption to a surface is based on the interaction
34
of a few charged groups with the oppositely charged surface. Here the competition
for adsorption sites can interfere with polymer adsorption resulting in decreased ad-
sorption with increasing salt concentration[245]. Much of this effect has been shown
through different modeling techniques. Dobrynin et al. used scaling theory to predict
the effect of salt concentration on adsorbed amount of different polyelectrolytes[83].
Hoda and Kumar used Brownian dynamics, which is an intermediate coarse grained
simulation technique[118]. Carrillo and Dobrynin used molecular dynamics simula-
tions to analyze this situation[35]. Scheutjens and Fleer’s self-consistent mean field
theory was used by Shubin and Linse[245].
Much of the work done, modeling and experimental, on the salt effect on ad-
sorbed polyelectrolytes has been focused on the adsorption amount. Very little work
has been done to investigate the salt effect on the actual adsorbed polymer conforma-
tion. Most of the work that has been done deals with adsorbed polymer layer thick-
nesses which, as stated earlier, can not be used to reveal the details of an adsorbed
polymer’s conformation[279, 259, 166]. Both Wang and Audebert and Meadows et
al. found that as the salt concentration was increased, the hydrodynamic thickness
decreased[279, 166]. However, Takahashi and Shubin and Linse found that the oppo-
site was true and the adsorbed layer thickness actually increased with increasing salt
concentration[259, 245]. Both of these scenarios can be reasonably explained with the
current understanding of these processes. For the case of Wang and Audebert and
Meadows et al., the increase in salt concentration screens out the electrostatic attrac-
tion of the polymer to the surface and the repulsion between the charged groups on
the polymer. Both groups attributed the smaller thickness to the loops and tails being
able to move much closer to each other in the electrolyte screened system[279, 166].
Takahasi and Shubin counter that as competition for surface adsorption sites increases
the polymer will extend away from the surface[259, 245]. The only experimental work
35
which has been done and gives a direct measurement of parts of an adsorbed poly-
mer’s conformation was done by Flood et al.[90, 91]. This work showed the effect of
salt concentration on the train portion of adsorbed polymers. However, this was done
on nonionic polymers[90, 91].
In 1995, Shubin and Linse looked to experimentally and theoretically model the
conformation of an adsorbed polyelectrolyte on a surface and evaluate the effect of
electrolytes on the resulting conformations. As was mentioned previously, they found,
using ellipsometry, that with increasing electrolyte concentration the adsorbed layer
thickness increased. After performing self-consistent mean field theory modeling, they
proposed, for the first time, that the increase in layer thickness was due to larger loops
and tails[245]. The larger loops were explained to be due to the competition with
electrolyte ions for surface adsorption cites, resulting in fewer adsorption site meaning
larger loops and tails[245]. Over the past 12 years this work has been cited 77 times,
according to SciFinder Scholar. No researcher, to date, has been able to verify,
experimentally, the effect of electrolytes on adsorbed polyelectrolyte conformation.
2.6 Site Blocking
Site blocking flocculation, or enhanced bridging flocculation, uses additives which
occupy possible polymer adsorption sites causing the polymer to have fewer attach-
ments to the surface which is thought to result in longer loops and tails[178, 153, 251,
275, 174, 21, 19, 186, 20, 164, 173]. The critical component of this system is the ability
of the blocking additive to adsorb on the possible particle surface sites to which the
polymer flocculant can adsorb. This in turn, decreases the surface area to which the
polymer flocculant can adsorb. In order for this to happen, it is important to know
what properties the polymer flocculant has and how it bonds to a particle’s surface.
Behl et al. noted that polymers can adsorb to a surface through chemical bonding,
hydrogen bonding, hydrophobic interactions, electrostatic interactions, and van der
36
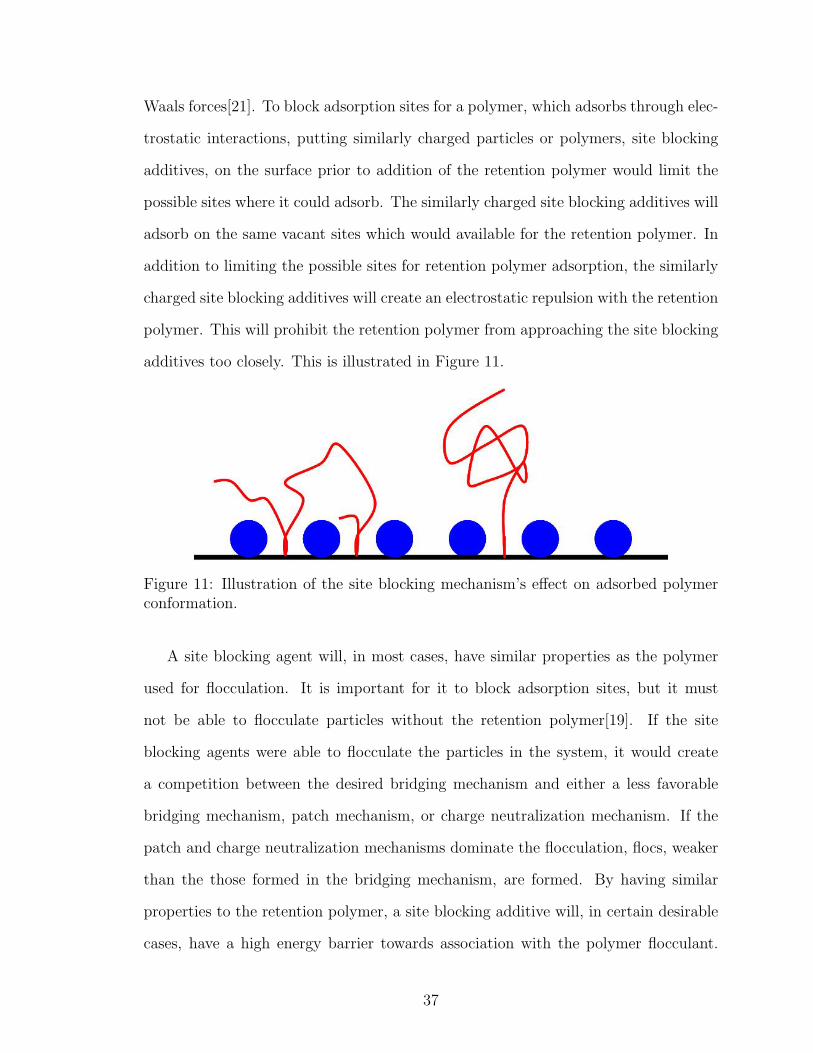
Waals forces[21]. To block adsorption sites for a polymer, which adsorbs through elec-
trostatic interactions, putting similarly charged particles or polymers, site blocking
additives, on the surface prior to addition of the retention polymer would limit the
possible sites where it could adsorb. The similarly charged site blocking additives will
adsorb on the same vacant sites which would available for the retention polymer. In
addition to limiting the possible sites for retention polymer adsorption, the similarly
charged site blocking additives will create an electrostatic repulsion with the retention
polymer. This will prohibit the retention polymer from approaching the site blocking
additives too closely. This is illustrated in Figure 11.
Figure 11: Illustration of the site blocking mechanism’s effect on adsorbed polymerconformation.
A site blocking agent will, in most cases, have similar properties as the polymer
used for flocculation. It is important for it to block adsorption sites, but it must
not be able to flocculate particles without the retention polymer[19]. If the site
blocking agents were able to flocculate the particles in the system, it would create
a competition between the desired bridging mechanism and either a less favorable
bridging mechanism, patch mechanism, or charge neutralization mechanism. If the
patch and charge neutralization mechanisms dominate the flocculation, flocs, weaker
than the those formed in the bridging mechanism, are formed. By having similar
properties to the retention polymer, a site blocking additive will, in certain desirable
cases, have a high energy barrier towards association with the polymer flocculant.
37
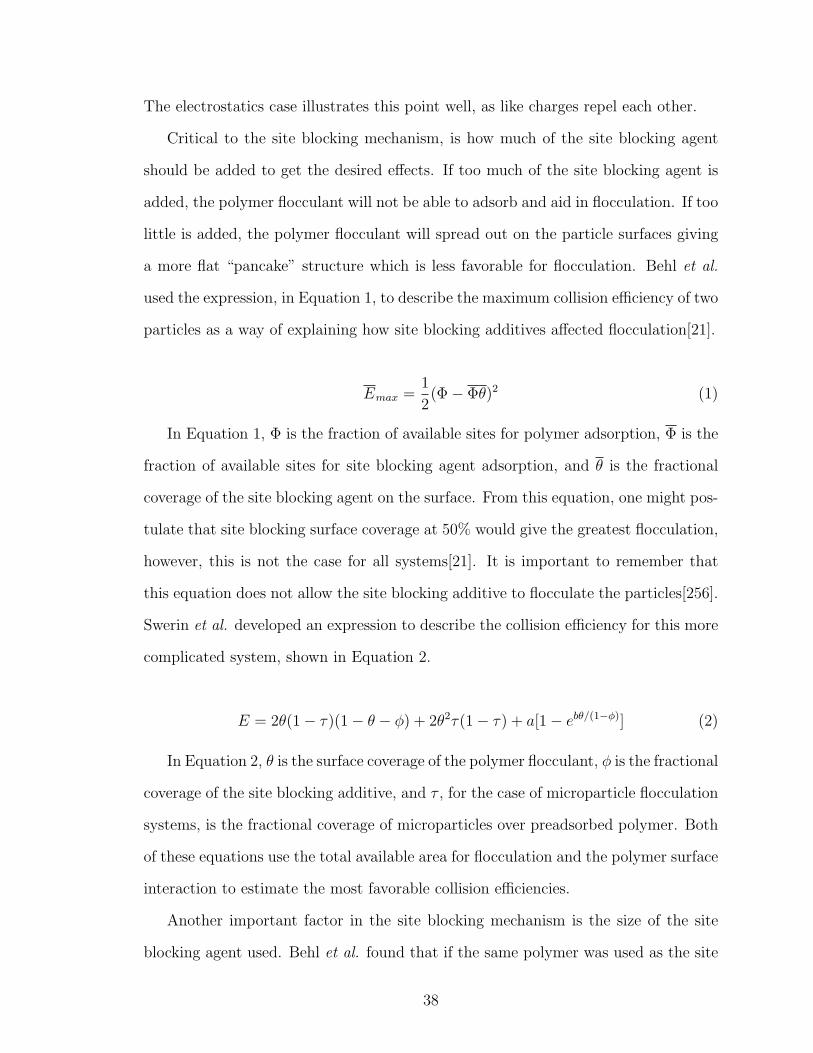
The electrostatics case illustrates this point well, as like charges repel each other.
Critical to the site blocking mechanism, is how much of the site blocking agent
should be added to get the desired effects. If too much of the site blocking agent is
added, the polymer flocculant will not be able to adsorb and aid in flocculation. If too
little is added, the polymer flocculant will spread out on the particle surfaces giving
a more flat “pancake” structure which is less favorable for flocculation. Behl et al.
used the expression, in Equation 1, to describe the maximum collision efficiency of two
particles as a way of explaining how site blocking additives affected flocculation[21].
Emax =1
2(Φ − Φθ)2 (1)
In Equation 1, Φ is the fraction of available sites for polymer adsorption, Φ is the
fraction of available sites for site blocking agent adsorption, and θ is the fractional
coverage of the site blocking agent on the surface. From this equation, one might pos-
tulate that site blocking surface coverage at 50% would give the greatest flocculation,
however, this is not the case for all systems[21]. It is important to remember that
this equation does not allow the site blocking additive to flocculate the particles[256].
Swerin et al. developed an expression to describe the collision efficiency for this more
complicated system, shown in Equation 2.
E = 2θ(1 − τ)(1 − θ − φ) + 2θ2τ(1 − τ) + a[1 − ebθ/(1−φ)] (2)
In Equation 2, θ is the surface coverage of the polymer flocculant, φ is the fractional
coverage of the site blocking additive, and τ , for the case of microparticle flocculation
systems, is the fractional coverage of microparticles over preadsorbed polymer. Both
of these equations use the total available area for flocculation and the polymer surface
interaction to estimate the most favorable collision efficiencies.
Another important factor in the site blocking mechanism is the size of the site
blocking agent used. Behl et al. found that if the same polymer was used as the site
38
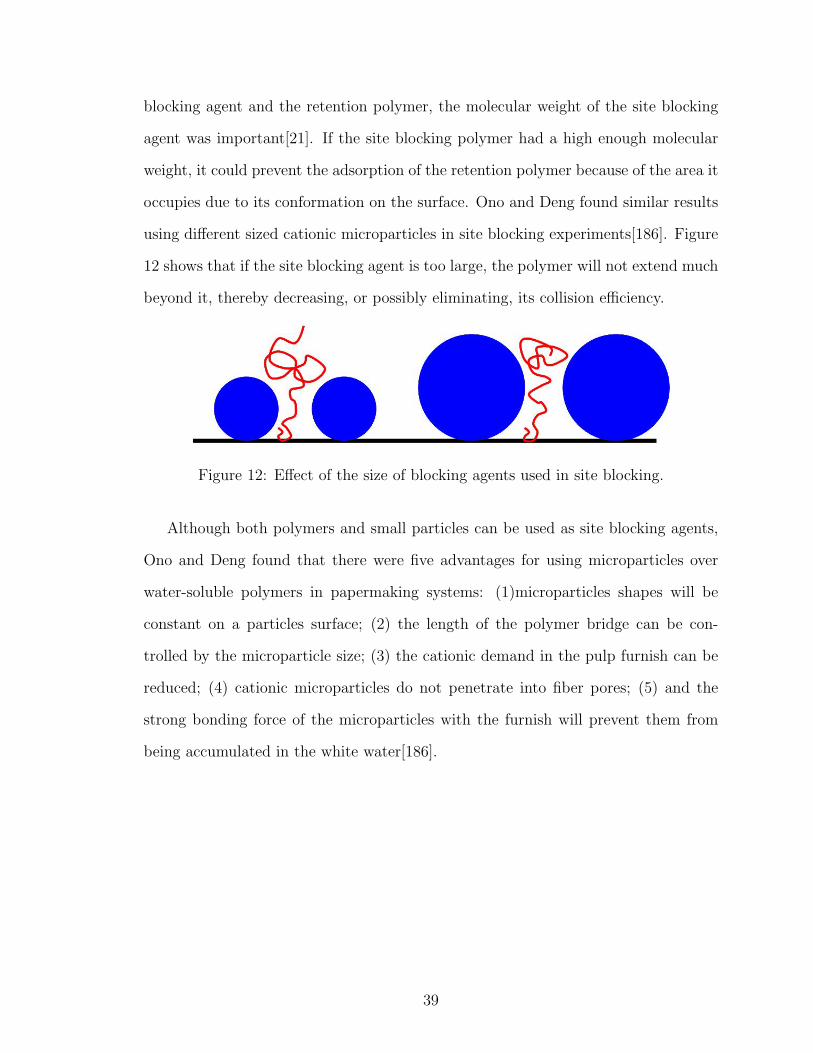
blocking agent and the retention polymer, the molecular weight of the site blocking
agent was important[21]. If the site blocking polymer had a high enough molecular
weight, it could prevent the adsorption of the retention polymer because of the area it
occupies due to its conformation on the surface. Ono and Deng found similar results
using different sized cationic microparticles in site blocking experiments[186]. Figure
12 shows that if the site blocking agent is too large, the polymer will not extend much
beyond it, thereby decreasing, or possibly eliminating, its collision efficiency.
Figure 12: Effect of the size of blocking agents used in site blocking.
Although both polymers and small particles can be used as site blocking agents,
Ono and Deng found that there were five advantages for using microparticles over
water-soluble polymers in papermaking systems: (1)microparticles shapes will be
constant on a particles surface; (2) the length of the polymer bridge can be con-
trolled by the microparticle size; (3) the cationic demand in the pulp furnish can be
reduced; (4) cationic microparticles do not penetrate into fiber pores; (5) and the
strong bonding force of the microparticles with the furnish will prevent them from
being accumulated in the white water[186].
39
CHAPTER III
THESIS OBJECTIVES
The goal of this research was to provide a better understanding of the conformation
of an adsorbed polymer and some of the conditions which affect it. To do this, both
experimental methods and computer simulation were used to directly determine the
increase in the adsorbed polymer layer thickness.
The first experimental method used was dynamic light scattering. The second
experimental method, developed for this research, directly measured the length of
an adsorbed polymer’s loops and inferred changes in tail lengths using atomic force
microscopy. Computer simulation of this system was performed using dissipative par-
ticle dynamics which uses the equations of motion to model the movement of a chain
of beads representing a polymer. Using these methods, this research investigated the
effects of cationic polymeric and inorganic site blocking systems on cationic polyacry-
lamide. Work was also completed to gain insight into the effect of inorganic salts on
adsorbed polymer conformation.
The specific objectives of this thesis are to determine and clarify explanations
concerning:
1. Develop AFM technique to analyze a single polymer molecule
2. Adsorbed polymer conformation
3. Salt effect on adsorbed polymer conformation
4. Site blocking effect on adsorbed polymer conformation
40
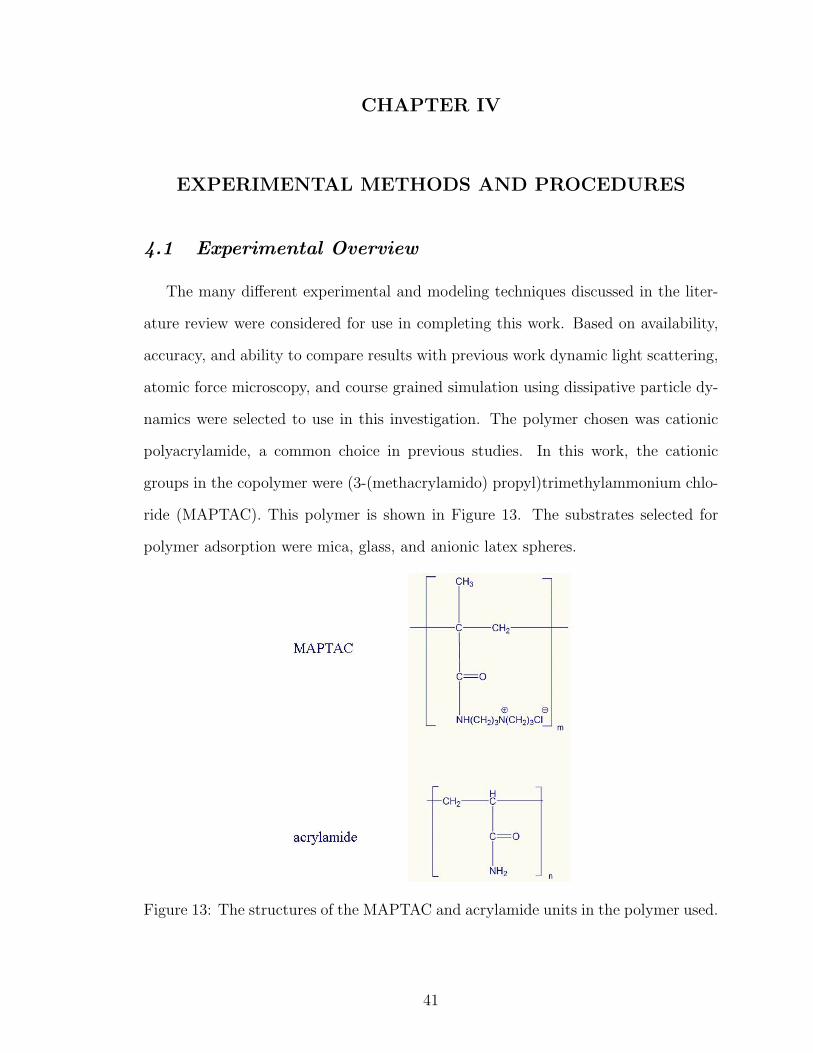
CHAPTER IV
EXPERIMENTAL METHODS AND PROCEDURES
4.1 Experimental Overview
The many different experimental and modeling techniques discussed in the liter-
ature review were considered for use in completing this work. Based on availability,
accuracy, and ability to compare results with previous work dynamic light scattering,
atomic force microscopy, and course grained simulation using dissipative particle dy-
namics were selected to use in this investigation. The polymer chosen was cationic
polyacrylamide, a common choice in previous studies. In this work, the cationic
groups in the copolymer were (3-(methacrylamido) propyl)trimethylammonium chlo-
ride (MAPTAC). This polymer is shown in Figure 13. The substrates selected for
polymer adsorption were mica, glass, and anionic latex spheres.
Figure 13: The structures of the MAPTAC and acrylamide units in the polymer used.
41
4.2 Dynamic Light Scattering
4.2.1 Dynamic Light Scattering Background Information
Dynamic light scattering(DLS) is a commonly used technique to find the particle
size of small particles[43]. DLS measures the changes in scattered light intensity from
a sample as its particles move around by Brownian motion. From these changes in
intensity, the self diffusion coefficient can be found by Equations 3 and 4[169].
g(2)(τ) =〈I(τ)I(0)〉〈I(0)〉2
= 1 + c[g(1)(τ)]2 (3)
g(1)(τ) = exp(−D0q2τ) (4)
In the above equations, I is the intensity, τ is the time difference between mea-
surements, c is an instrument constant, D0 is the self diffusion coefficient, q is the
magnitude of the scattering wave vector, g (1)(τ) is the normalized electric field cor-
relation function, and g (2)(τ) is the intensity autocorrelation function. Using this
diffusion coefficient, the Stokes-Einstein equation, Equation 5 , can be used to find
the hydrodynamic radius of the particle, assuming a spherical geometry[169].
RH =kbT
6πηD0
(5)
In the Stokes-Einstein equation, kb is Boltzmann’s constant, T is the temperature,
η is the fluids viscosity, and D0 is the self diffusion coefficient. It is important to
note, with regard to the experimental method used, that the self diffusion coefficient
is calculated assuming infinite dilution. In accordance with past publications, the
thickness from DLS was considered to be that of the average outermost points.
4.2.2 Dynamic Light Scattering Materials
For this study, anionic latex spheres, as supplied by Interfacial Dynamics Corpora-
tion, were used as an adsorption site for the cationic polyacrylamide polymers. These
42
particles have mean diameter of 0.24µm with a standard deviation of 0.010µm as de-
termined by transmission electron microscopy. The anionic charge content, from con-
ductometric titration, and surface charge density are 3.8µEq/g and 1.5µC/cm2 respec-
tively. The polymer, a polyacrylamide/(3-(methacrylamido)propyl)trimethylammonium
chloride (MAPTAC) copolymer, was made by SNF. This polymer has a molecular
weight and polydispersity similar to that made by Ciba Specialty Chemicals, which
was used for the atomic force microscopy, AFM, testing in this work. The SNF
copolymer contained 15 weight% MAPTAC groups. Gel permeation chromatogra-
phy, GPC, testing here at Georgia Tech gave the SNF polymer a number average
molecular weight of 86,554g/mol. The number average molecular weight of the Ciba
Specialty Chemicals polymer, done by GPC at Ciba, was 1,040,000g/mol. Testing
of the Ciba polymer here at Georgia Tech gave a number average molecular weight
of 192,788g/mol. The differences in these values are most likely due to the use of
a polyethylene oxide calibration standard here at Georgia Tech and the practice of
filtering the polymer solution prior to testing. The polyethylene oxide standard does
not contain charged groups as the polymer used for this research does, which can
alter the values reported. Filtering the polymer solution can pull out higher molecu-
lar weight polymers reducing the values found using GPC. The molecular weight of
the SNF polymer used for light scattering, although smaller, is of a similar order of
magnitude to that used for the AFM portion of this work.
Sodium chloride was used to evaluate the salt effect on adsorbed polymer confor-
mation. To evaluate the effect of site blocking, two different blocking additives were
used: poly-diallyldimethylammonium chloride, PDADMAC, and cationic nanosil-
ica particles. A low molecular weight, 100,000g/mol - 200,000g/mol, PDADMAC,
from Aldrich Chemicals, was used as a polymeric site blocking additive. Ludox-CL,
12nm cationic nanosilica particles, obtained from Sigma-Aldrich, were used as a non-
polymeric blocking additive.
43
4.2.3 Dynamic Light Scattering Methods
DLS measurements were performed on a Brookhaven Instruments BI-200SM Go-
niometer with a 632.3nm helium neon laser. The detector was positioned at an angle
of 90◦ from the laser to minimize the effects of noise as much as possible. It was
determined that using a latex sphere concentration of 5.4726x10⁷particles/mL, in a
10mL sample, gave noticeable polymer layer thickness increases with the least possi-
bility of flocculation. The lowest concentration of particles which gave a high enough
signal was chosen to ensure this. All data sets obtained began with 5 measurements
of the latex spheres without the addition of any blocking additives or polymer to get
the average size of the particles. The measurements were run for a duration of 5 min-
utes and the CONTIN, non-negatively constrained least squares: regularized, data
analysis values are recorded. For experiments in which only the adsorbed polymer
layer is desired, a set amount of cationic polyacrylamide was added to the vial and
immediately put back in the goniometer. Five measurements of 5 minutes each were
performed. For the analysis of the effects of site blocking, the site blocking additive
was added to the vial and allowed to sit for 30 seconds. Following this, the set amount
of cationic polyacrylamide was added to the vial and measurements were started.
All polymer layer thickness measurements were obtained by subtracting the av-
erage latex sphere diameter from the hydrodynamic diameter after treatment. The
reported overall average thickness increase was the average of all thickness changes for
that data set. The cleaning of the glass vials used for DLS was a simple soap washing
followed by 10 warm tap water rinses. After this, an extensive set of 10 Barnstead
deionized water rinses and a 4 minute soak in fresh Barnstead deionized water was
performed.
The amount of the SNF cationic polyacrylamide polymer to be added was de-
termined by checking the change in hydrodynamic diameter against the amount of
polymer added. Figure 14, below, shows this plot.
44
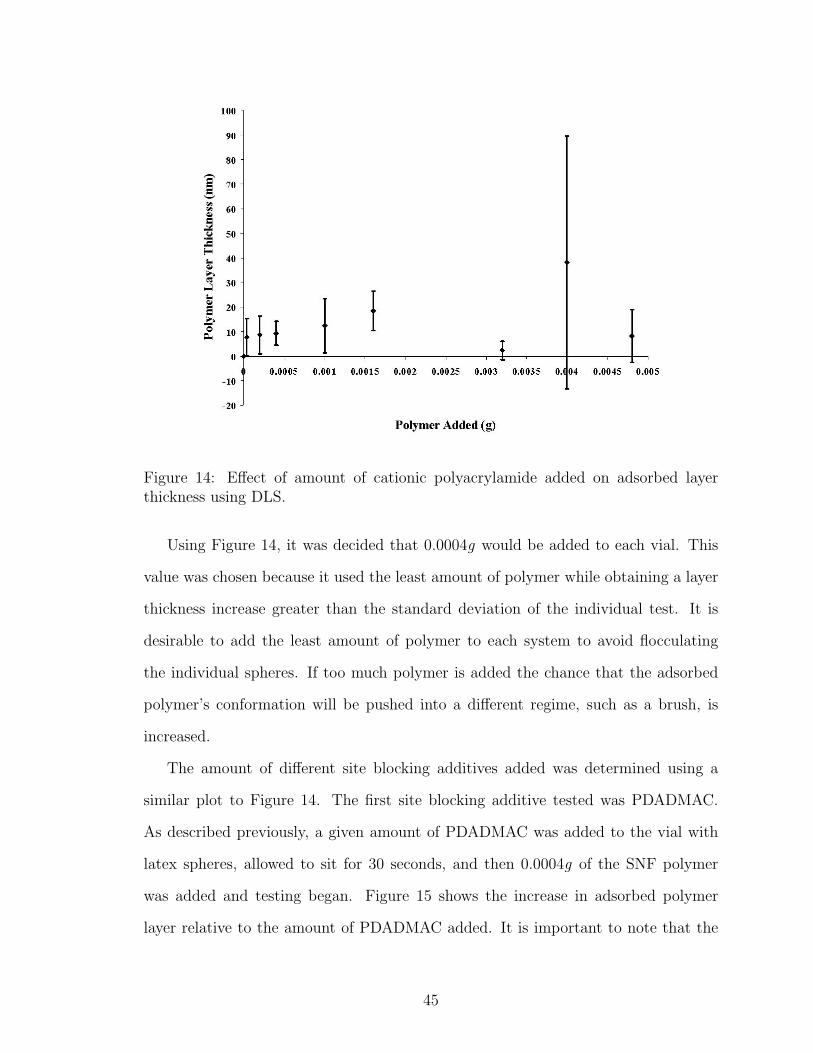
Figure 14: Effect of amount of cationic polyacrylamide added on adsorbed layerthickness using DLS.
Using Figure 14, it was decided that 0.0004g would be added to each vial. This
value was chosen because it used the least amount of polymer while obtaining a layer
thickness increase greater than the standard deviation of the individual test. It is
desirable to add the least amount of polymer to each system to avoid flocculating
the individual spheres. If too much polymer is added the chance that the adsorbed
polymer’s conformation will be pushed into a different regime, such as a brush, is
increased.
The amount of different site blocking additives added was determined using a
similar plot to Figure 14. The first site blocking additive tested was PDADMAC.
As described previously, a given amount of PDADMAC was added to the vial with
latex spheres, allowed to sit for 30 seconds, and then 0.0004g of the SNF polymer
was added and testing began. Figure 15 shows the increase in adsorbed polymer
layer relative to the amount of PDADMAC added. It is important to note that the
45
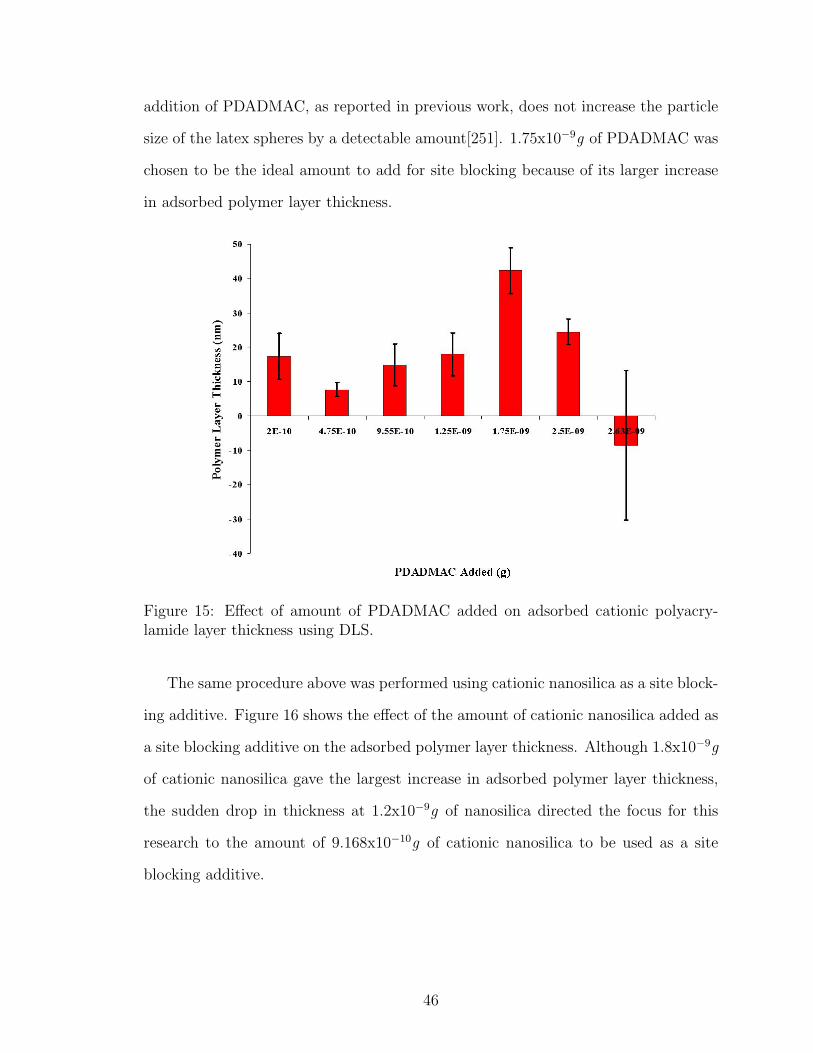
addition of PDADMAC, as reported in previous work, does not increase the particle
size of the latex spheres by a detectable amount[251]. 1.75x10⁻⁹g of PDADMAC was
chosen to be the ideal amount to add for site blocking because of its larger increase
in adsorbed polymer layer thickness.
Figure 15: Effect of amount of PDADMAC added on adsorbed cationic polyacry-lamide layer thickness using DLS.
The same procedure above was performed using cationic nanosilica as a site block-
ing additive. Figure 16 shows the effect of the amount of cationic nanosilica added as
a site blocking additive on the adsorbed polymer layer thickness. Although 1.8x10⁻⁹g
of cationic nanosilica gave the largest increase in adsorbed polymer layer thickness,
the sudden drop in thickness at 1.2x10⁻⁹g of nanosilica directed the focus for this
research to the amount of 9.168x10⁻¹⁰g of cationic nanosilica to be used as a site
blocking additive.
46
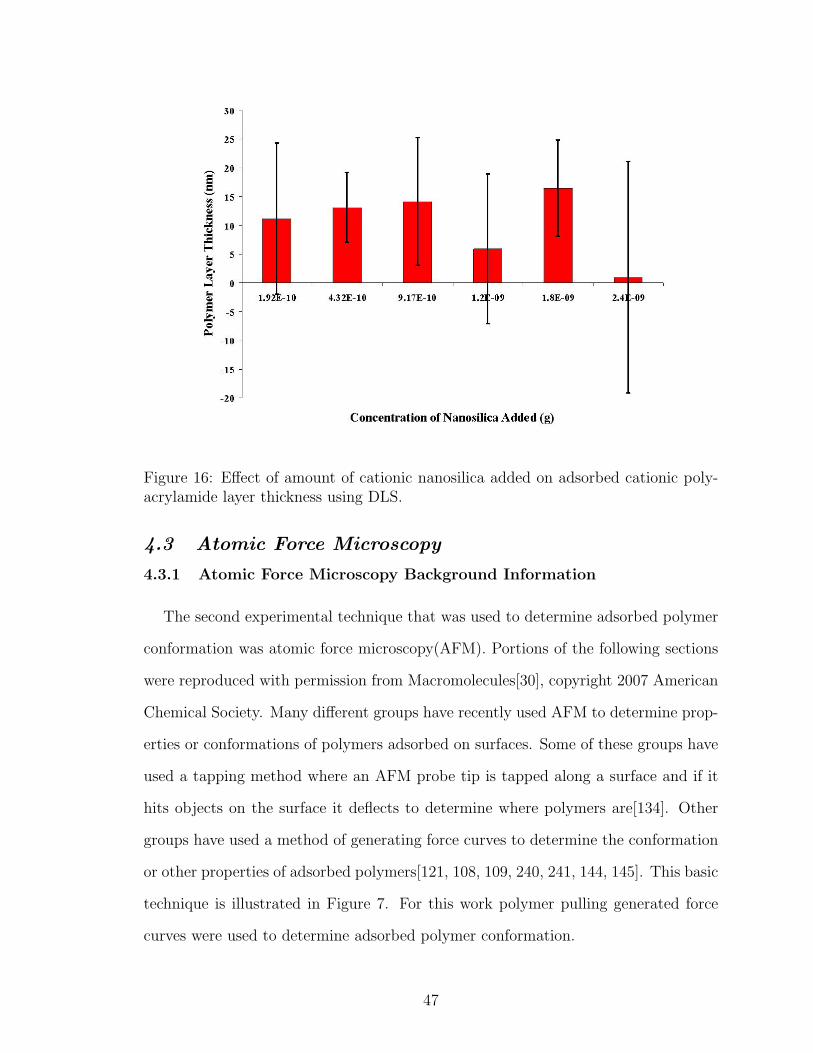
Figure 16: Effect of amount of cationic nanosilica added on adsorbed cationic poly-acrylamide layer thickness using DLS.
4.3 Atomic Force Microscopy
4.3.1 Atomic Force Microscopy Background Information
The second experimental technique that was used to determine adsorbed polymer
conformation was atomic force microscopy(AFM). Portions of the following sections
were reproduced with permission from Macromolecules[30], copyright 2007 American
Chemical Society. Many different groups have recently used AFM to determine prop-
erties or conformations of polymers adsorbed on surfaces. Some of these groups have
used a tapping method where an AFM probe tip is tapped along a surface and if it
hits objects on the surface it deflects to determine where polymers are[134]. Other
groups have used a method of generating force curves to determine the conformation
or other properties of adsorbed polymers[121, 108, 109, 240, 241, 144, 145]. This basic
technique is illustrated in Figure 7. For this work polymer pulling generated force
curves were used to determine adsorbed polymer conformation.
47
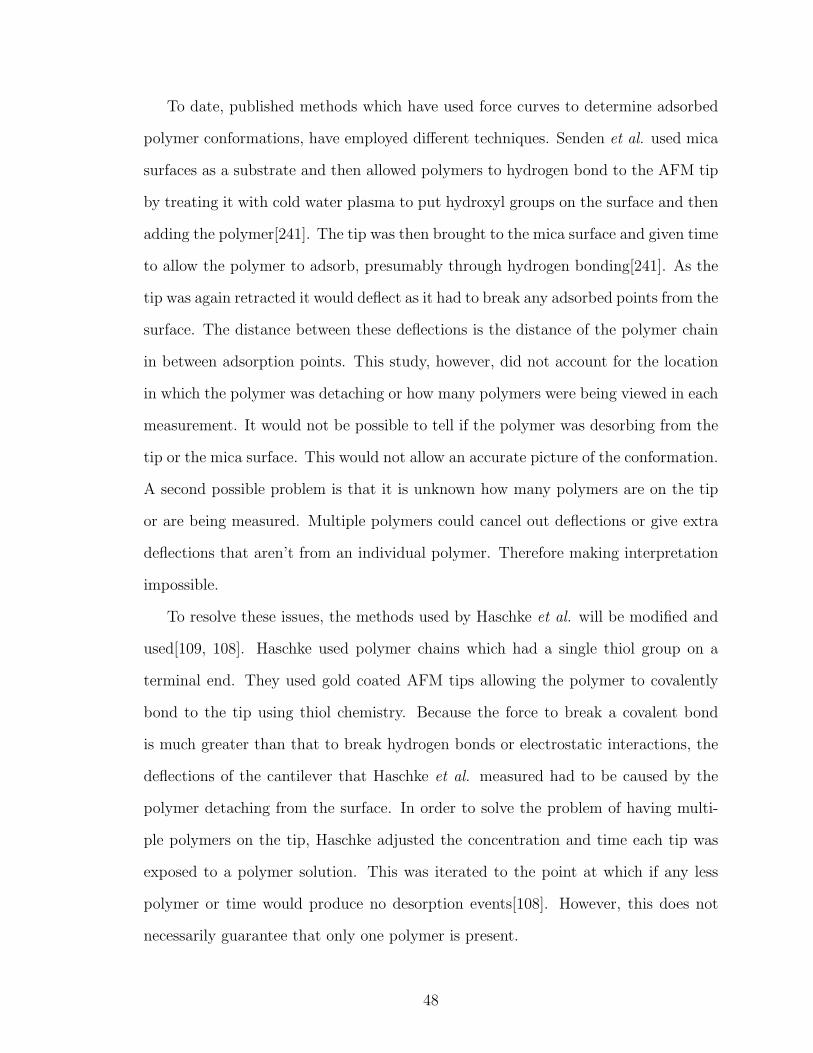
To date, published methods which have used force curves to determine adsorbed
polymer conformations, have employed different techniques. Senden et al. used mica
surfaces as a substrate and then allowed polymers to hydrogen bond to the AFM tip
by treating it with cold water plasma to put hydroxyl groups on the surface and then
adding the polymer[241]. The tip was then brought to the mica surface and given time
to allow the polymer to adsorb, presumably through hydrogen bonding[241]. As the
tip was again retracted it would deflect as it had to break any adsorbed points from the
surface. The distance between these deflections is the distance of the polymer chain
in between adsorption points. This study, however, did not account for the location
in which the polymer was detaching or how many polymers were being viewed in each
measurement. It would not be possible to tell if the polymer was desorbing from the
tip or the mica surface. This would not allow an accurate picture of the conformation.
A second possible problem is that it is unknown how many polymers are on the tip
or are being measured. Multiple polymers could cancel out deflections or give extra
deflections that aren’t from an individual polymer. Therefore making interpretation
impossible.
To resolve these issues, the methods used by Haschke et al. will be modified and
used[109, 108]. Haschke used polymer chains which had a single thiol group on a
terminal end. They used gold coated AFM tips allowing the polymer to covalently
bond to the tip using thiol chemistry. Because the force to break a covalent bond
is much greater than that to break hydrogen bonds or electrostatic interactions, the
deflections of the cantilever that Haschke et al. measured had to be caused by the
polymer detaching from the surface. In order to solve the problem of having multi-
ple polymers on the tip, Haschke adjusted the concentration and time each tip was
exposed to a polymer solution. This was iterated to the point at which if any less
polymer or time would produce no desorption events[108]. However, this does not
necessarily guarantee that only one polymer is present.
48
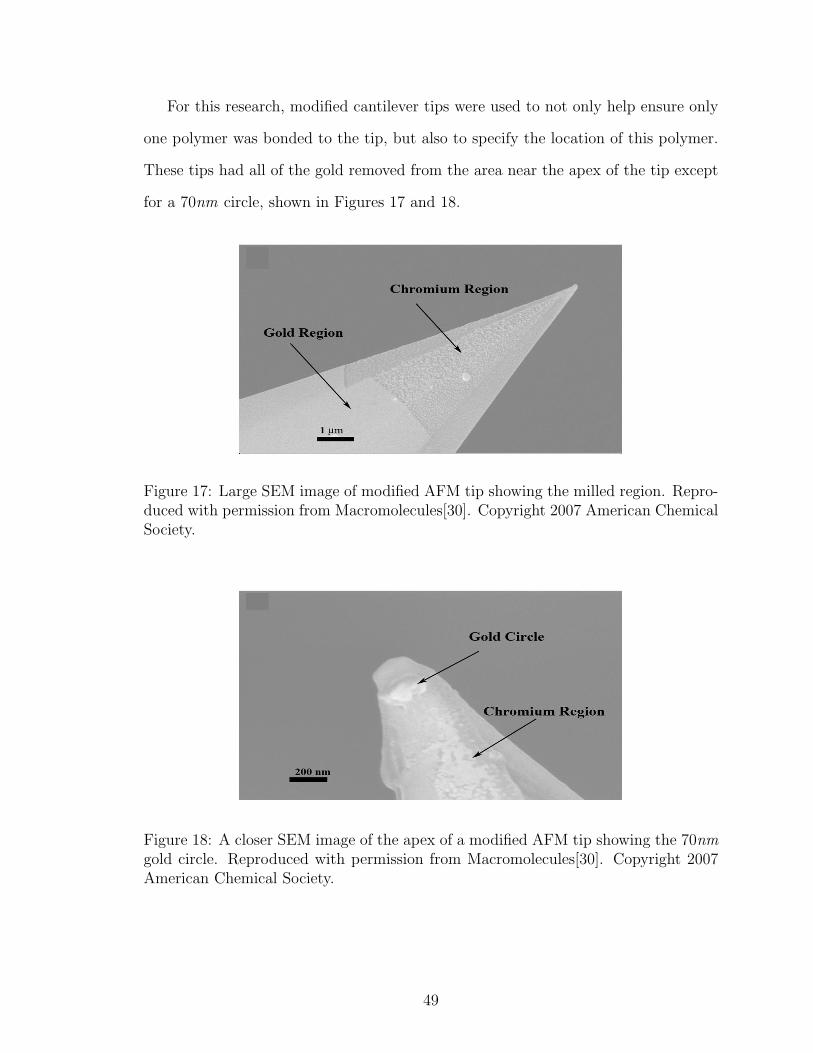
For this research, modified cantilever tips were used to not only help ensure only
one polymer was bonded to the tip, but also to specify the location of this polymer.
These tips had all of the gold removed from the area near the apex of the tip except
for a 70nm circle, shown in Figures 17 and 18.
Figure 17: Large SEM image of modified AFM tip showing the milled region. Repro-duced with permission from Macromolecules[30]. Copyright 2007 American ChemicalSociety.
Figure 18: A closer SEM image of the apex of a modified AFM tip showing the 70nmgold circle. Reproduced with permission from Macromolecules[30]. Copyright 2007American Chemical Society.
49
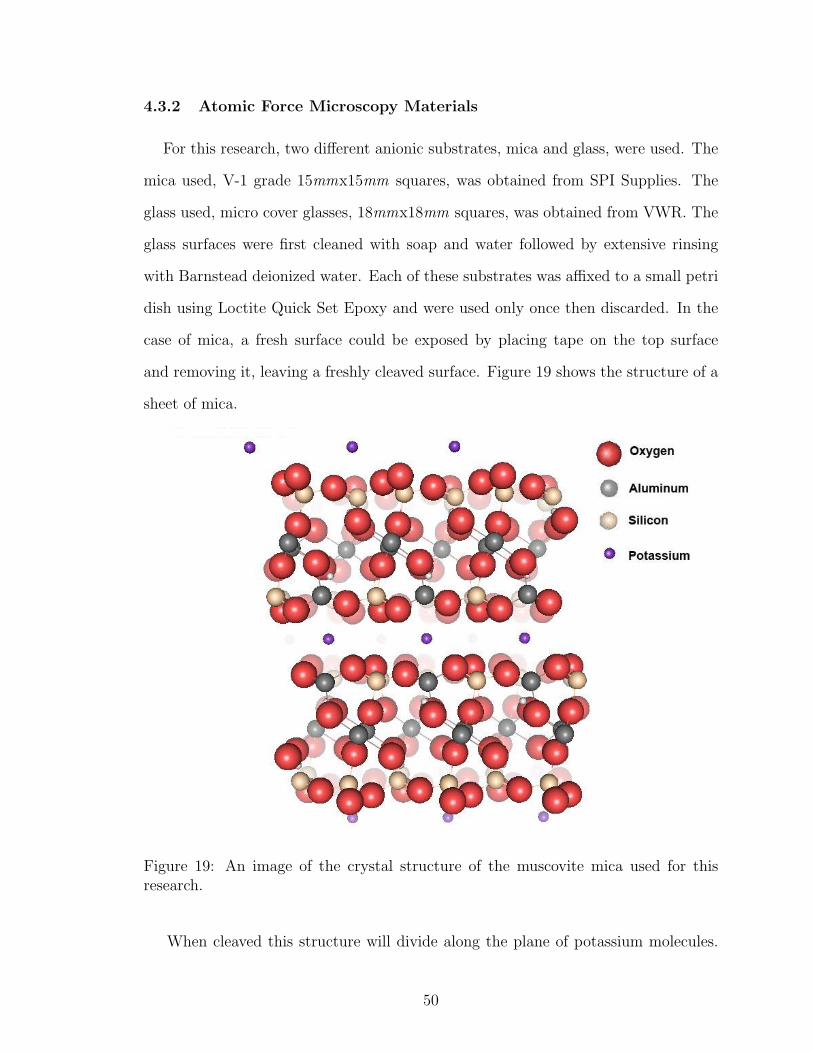
4.3.2 Atomic Force Microscopy Materials
For this research, two different anionic substrates, mica and glass, were used. The
mica used, V-1 grade 15mmx15mm squares, was obtained from SPI Supplies. The
glass used, micro cover glasses, 18mmx18mm squares, was obtained from VWR. The
glass surfaces were first cleaned with soap and water followed by extensive rinsing
with Barnstead deionized water. Each of these substrates was affixed to a small petri
dish using Loctite Quick Set Epoxy and were used only once then discarded. In the
case of mica, a fresh surface could be exposed by placing tape on the top surface
and removing it, leaving a freshly cleaved surface. Figure 19 shows the structure of a
sheet of mica.
Figure 19: An image of the crystal structure of the muscovite mica used for thisresearch.
When cleaved this structure will divide along the plane of potassium molecules.
50
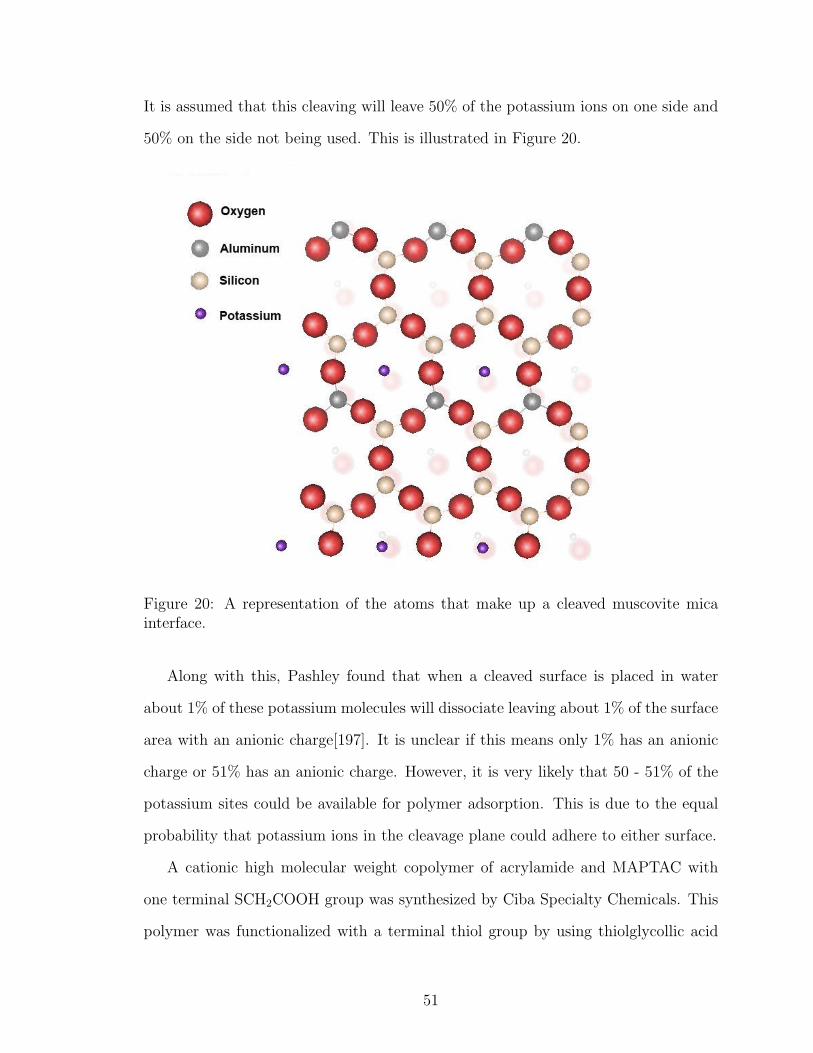
It is assumed that this cleaving will leave 50% of the potassium ions on one side and
50% on the side not being used. This is illustrated in Figure 20.
Figure 20: A representation of the atoms that make up a cleaved muscovite micainterface.
Along with this, Pashley found that when a cleaved surface is placed in water
about 1% of these potassium molecules will dissociate leaving about 1% of the surface
area with an anionic charge[197]. It is unclear if this means only 1% has an anionic
charge or 51% has an anionic charge. However, it is very likely that 50 - 51% of the
potassium sites could be available for polymer adsorption. This is due to the equal
probability that potassium ions in the cleavage plane could adhere to either surface.
A cationic high molecular weight copolymer of acrylamide and MAPTAC with
one terminal SCH2COOH group was synthesized by Ciba Specialty Chemicals. This
polymer was functionalized with a terminal thiol group by using thiolglycollic acid
51
as a chain transfer agent that left a single thiolglycollic acid group at one end of the
polymer. The molecular weight as given by Ciba was 1.04x10⁶g/mol (determined by
GPC), and the Rg was found to be 151.3nm (determined by static light scattering)
at the tip functionalization conditions.
MikroMasch CSC17/Cr-Au AFM cantilevers were modified, by MicroMasch, using
focused ion beam milling. The spring constants for these levers was between 0.05N/m
and 0.3N/m. Focused ion beam milling of the gold surface of these cantilevers was
done to remove the gold layer except for a 70nm circle about 40nm from the apex
of the leading edge of the tip. This left a small gold circle on an exposed chromium
sublayer. The gold coating was removed about 6µm up the tip surface to ensure
any polymer adsorbed on the top of the cantilever tip can’t influence the results. A
modified tip is shown in Figures 17 and 18.
4.3.3 Atomic Force Microscopy Methods
Polymer-modified AFM tips were prepared for testing by first soaking them in
a 9.074x10⁻⁶g/mol solution of polymer in water for 1 minute. The tips were then
rinsed in Barnstead deionized water and mounted for testing. It was then lowered
down to the surface at a rate of 2µm/s until the deflection of the lever was 10nm.
At this point, the tip was allowed to dwell on the surface for 5 minutes and then was
retracted. To ensure clean and accurate force plots, the data acquisition rate used was
50kHz. All retractions were extended the full range of the z piezo to ensure complete
polymer desorption from the surface. For site blocking experiments, the blocking
additive was added to the bubble of water on the surface being tested. It was allowed
to sit for approximately 5 minutes as the tip was again lowered to the surface. After
this, testing began again. Following testing the cantilevers were cleaned using an
ultraviolet ozone cleaner, UVO-Cleaner Model No. 42, from Jelight Company, Inc.
for 50 minutes. When not in use, the cantilevers were stored in a sealed plastic bag
52
to avoid contamination of the tip surfaces.
4.3.3.1 Verification of Methodology
In Figures 17 and 18, it is shown that the gold layer, except for the 70nm gold circle,
was removed leaving only the chromium sublayer. The composition of the AFM tip
surface was confirmed, by the Advanced Materials Processing and Analysis Center
at the University of Central Florida, using scanning Auger microscopy. Figures 21,
22, and 23 show an area near the apex of the tip. It is important to note that no
gold regions can be seen, not even the 70nm gold circle, due to the poor resolution
of scanning Auger microscopy. But, it does show that no more than a small portion
of the surface is gold.
The silicon map was performed to confirm that no silicon regions of the tip had
been exposed. If this occurred it would be possible for the polymer used to adsorb to
these regions via hydrogen bonding. There are regions of excited silicon Auger elec-
trons which were detected. However, these same regions also show excited chromium
Auger electrons. This is because the chromium layer was thin enough that the excited
silicon Auger electrons were able to pass through the chromium layer. Although the
chromium layer was thin, it was still present and confirms that the silicon layer is not
exposed on the surface.
Following the verification of the surface composition of the modified tips, any in-
teractions of the chromium regions of the modified tips with the polymer needed to be
accounted for. To do this a chromium tip and a gold tip were tested following treat-
ment in low and high concentration polymer solutions (0g/ml, and 6.98x10⁻⁴g/ml).
Figures 24 and 25 show the force curves of both the chromium and gold tips after a
treatment time of 1 minute in the high concentration polymer solution followed by
rinsing in Barnstead deionized water. The tests clearly indicated that the polymer
will only attach to the gold surfaces on our modified tips. This can be determined by
53
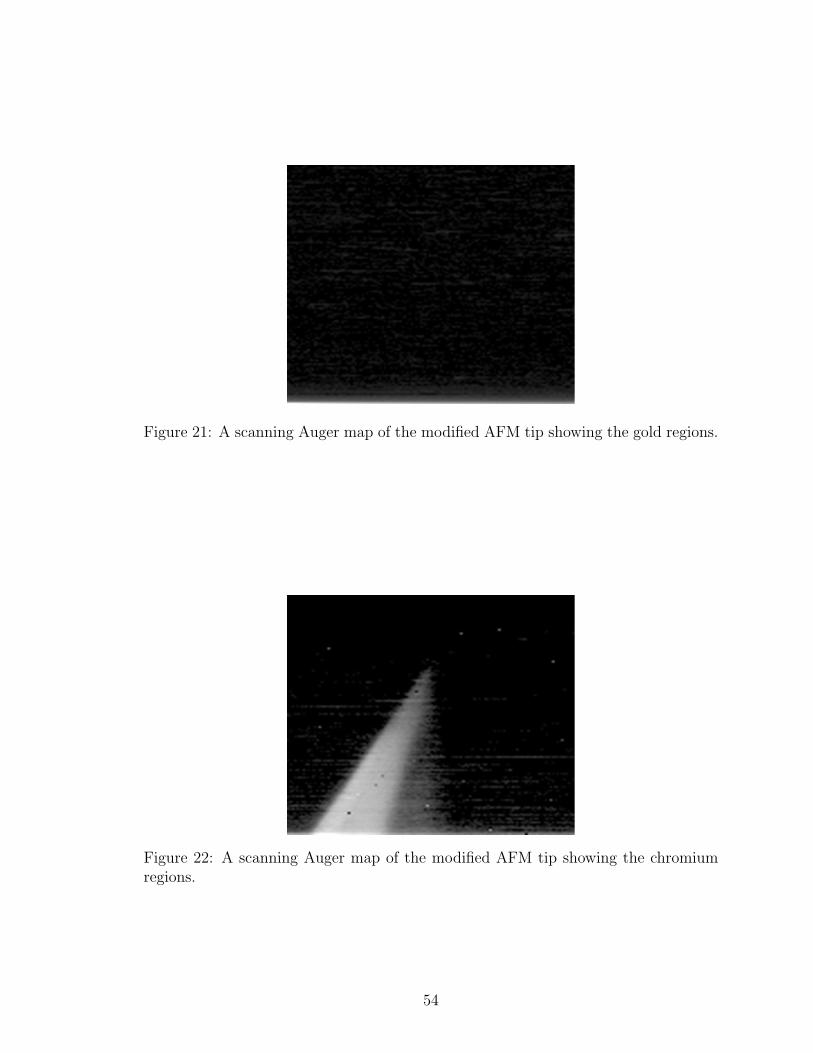
Figure 21: A scanning Auger map of the modified AFM tip showing the gold regions.
Figure 22: A scanning Auger map of the modified AFM tip showing the chromiumregions.
54
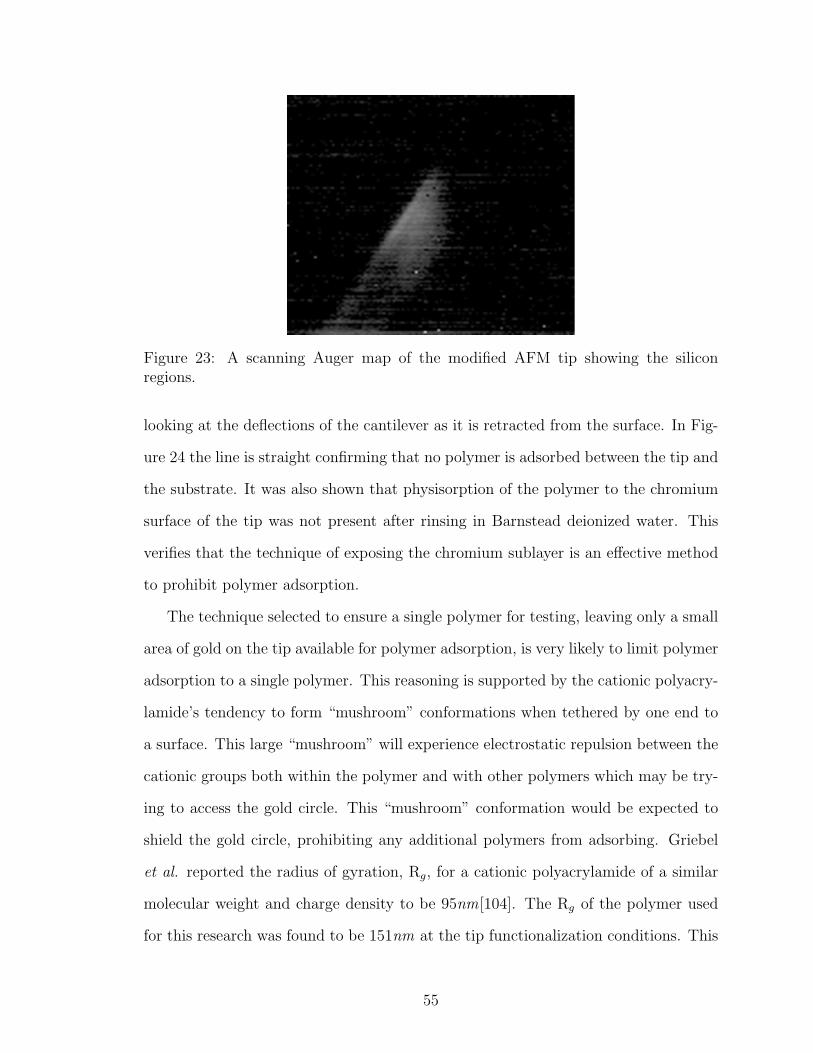
Figure 23: A scanning Auger map of the modified AFM tip showing the siliconregions.
looking at the deflections of the cantilever as it is retracted from the surface. In Fig-
ure 24 the line is straight confirming that no polymer is adsorbed between the tip and
the substrate. It was also shown that physisorption of the polymer to the chromium
surface of the tip was not present after rinsing in Barnstead deionized water. This
verifies that the technique of exposing the chromium sublayer is an effective method
to prohibit polymer adsorption.
The technique selected to ensure a single polymer for testing, leaving only a small
area of gold on the tip available for polymer adsorption, is very likely to limit polymer
adsorption to a single polymer. This reasoning is supported by the cationic polyacry-
lamide’s tendency to form “mushroom” conformations when tethered by one end to
a surface. This large “mushroom” will experience electrostatic repulsion between the
cationic groups both within the polymer and with other polymers which may be try-
ing to access the gold circle. This “mushroom” conformation would be expected to
shield the gold circle, prohibiting any additional polymers from adsorbing. Griebel
et al. reported the radius of gyration, Rg, for a cationic polyacrylamide of a similar
molecular weight and charge density to be 95nm[104]. The Rg of the polymer used
for this research was found to be 151nm at the tip functionalization conditions. This
55
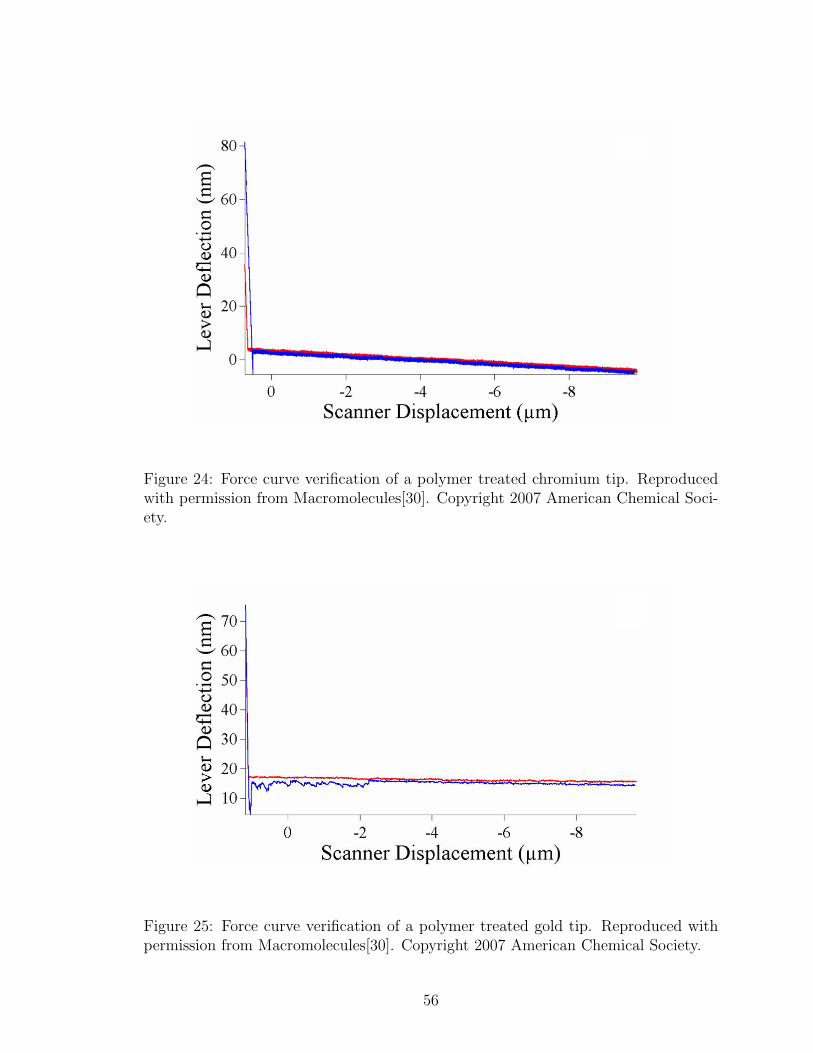
Figure 24: Force curve verification of a polymer treated chromium tip. Reproducedwith permission from Macromolecules[30]. Copyright 2007 American Chemical Soci-ety.
Figure 25: Force curve verification of a polymer treated gold tip. Reproduced withpermission from Macromolecules[30]. Copyright 2007 American Chemical Society.
56
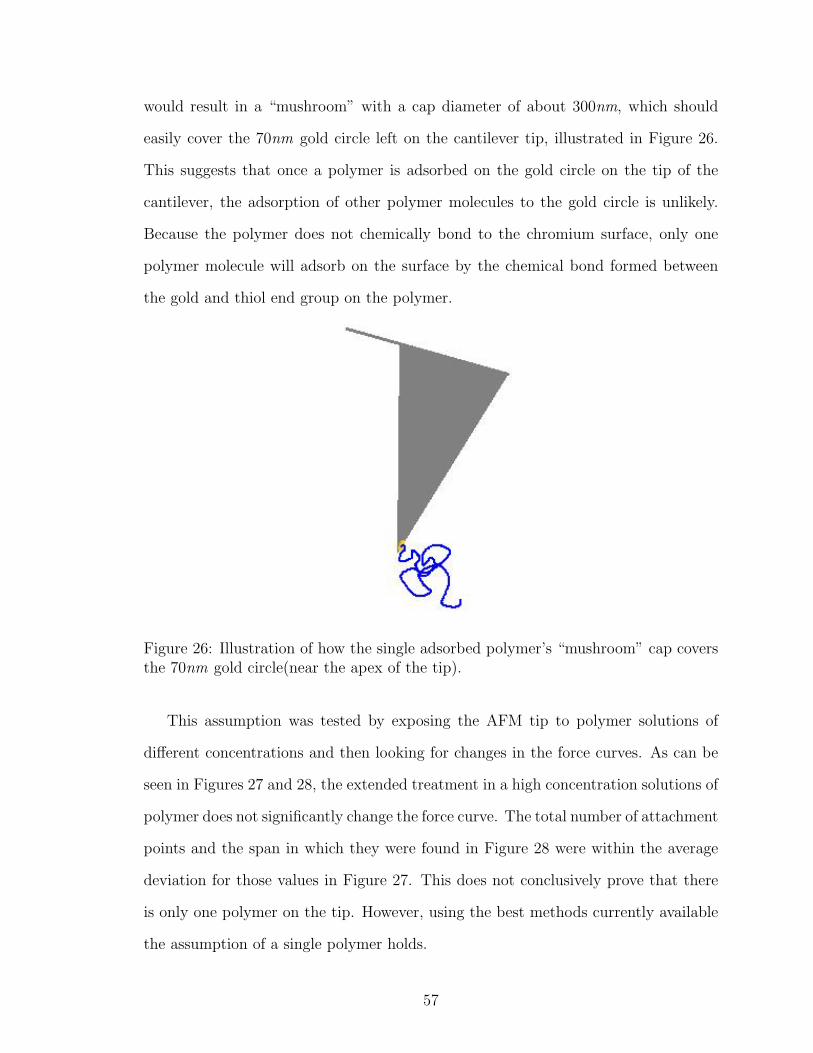
would result in a “mushroom” with a cap diameter of about 300nm, which should
easily cover the 70nm gold circle left on the cantilever tip, illustrated in Figure 26.
This suggests that once a polymer is adsorbed on the gold circle on the tip of the
cantilever, the adsorption of other polymer molecules to the gold circle is unlikely.
Because the polymer does not chemically bond to the chromium surface, only one
polymer molecule will adsorb on the surface by the chemical bond formed between
the gold and thiol end group on the polymer.
Figure 26: Illustration of how the single adsorbed polymer’s “mushroom” cap coversthe 70nm gold circle(near the apex of the tip).
This assumption was tested by exposing the AFM tip to polymer solutions of
different concentrations and then looking for changes in the force curves. As can be
seen in Figures 27 and 28, the extended treatment in a high concentration solutions of
polymer does not significantly change the force curve. The total number of attachment
points and the span in which they were found in Figure 28 were within the average
deviation for those values in Figure 27. This does not conclusively prove that there
is only one polymer on the tip. However, using the best methods currently available
the assumption of a single polymer holds.
57
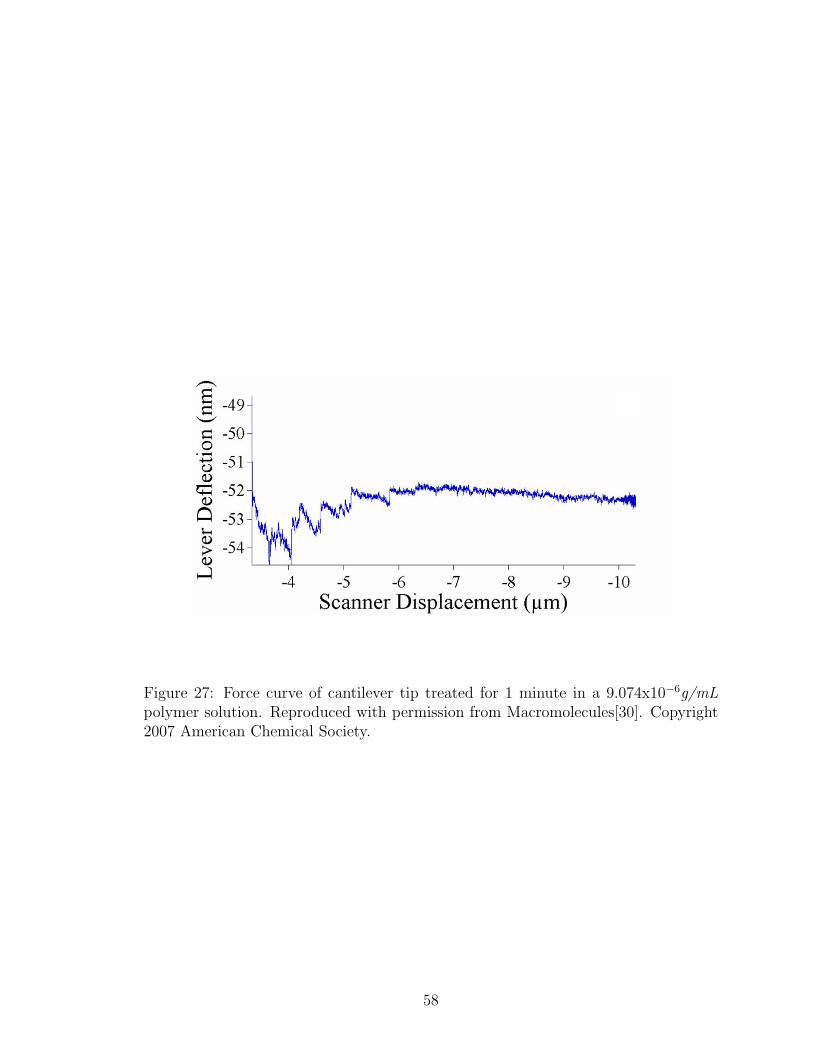
Figure 27: Force curve of cantilever tip treated for 1 minute in a 9.074x10⁻⁶g/mLpolymer solution. Reproduced with permission from Macromolecules[30]. Copyright2007 American Chemical Society.
58
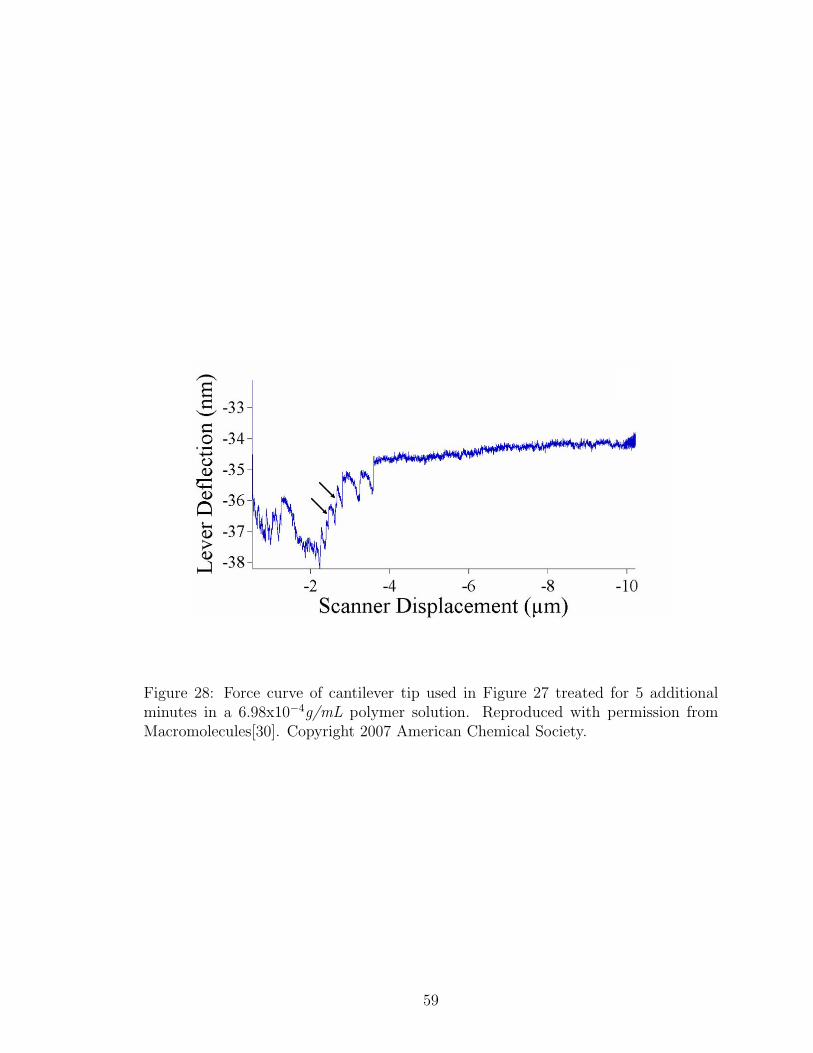
Figure 28: Force curve of cantilever tip used in Figure 27 treated for 5 additionalminutes in a 6.98x10⁻⁴g/mL polymer solution. Reproduced with permission fromMacromolecules[30]. Copyright 2007 American Chemical Society.
59
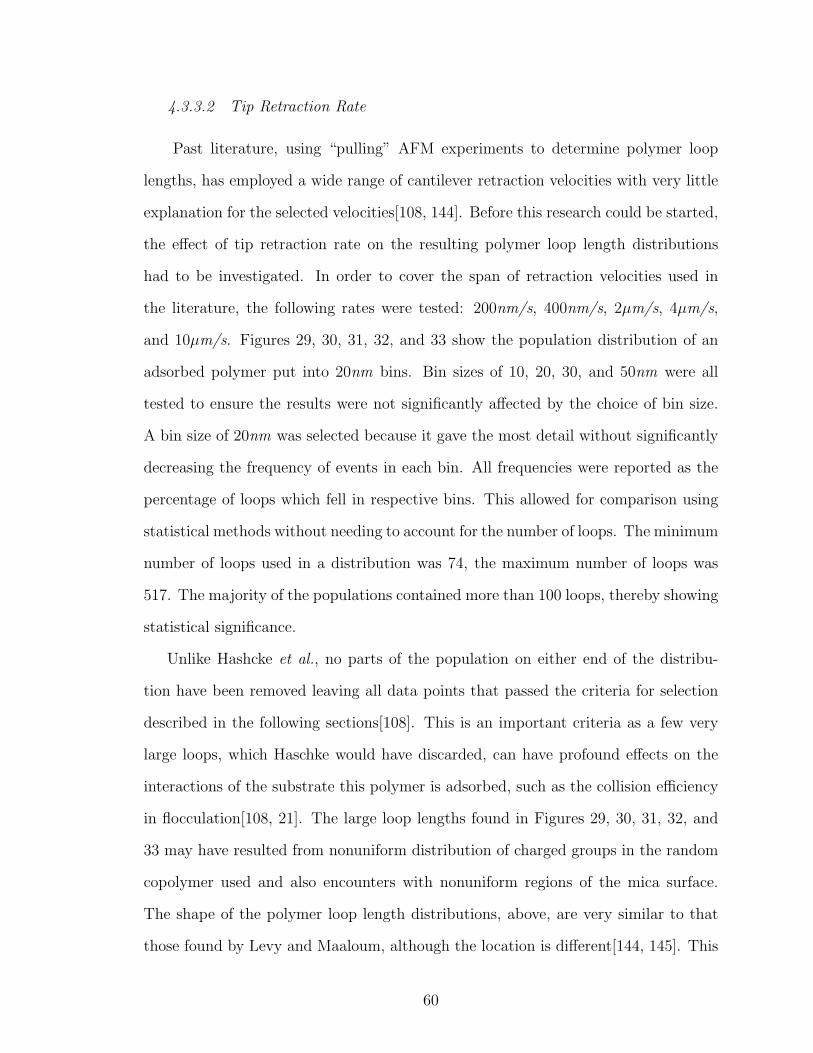
4.3.3.2 Tip Retraction Rate
Past literature, using “pulling” AFM experiments to determine polymer loop
lengths, has employed a wide range of cantilever retraction velocities with very little
explanation for the selected velocities[108, 144]. Before this research could be started,
the effect of tip retraction rate on the resulting polymer loop length distributions
had to be investigated. In order to cover the span of retraction velocities used in
the literature, the following rates were tested: 200nm/s, 400nm/s, 2µm/s, 4µm/s,
and 10µm/s. Figures 29, 30, 31, 32, and 33 show the population distribution of an
adsorbed polymer put into 20nm bins. Bin sizes of 10, 20, 30, and 50nm were all
tested to ensure the results were not significantly affected by the choice of bin size.
A bin size of 20nm was selected because it gave the most detail without significantly
decreasing the frequency of events in each bin. All frequencies were reported as the
percentage of loops which fell in respective bins. This allowed for comparison using
statistical methods without needing to account for the number of loops. The minimum
number of loops used in a distribution was 74, the maximum number of loops was
517. The majority of the populations contained more than 100 loops, thereby showing
statistical significance.
Unlike Hashcke et al., no parts of the population on either end of the distribu-
tion have been removed leaving all data points that passed the criteria for selection
described in the following sections[108]. This is an important criteria as a few very
large loops, which Haschke would have discarded, can have profound effects on the
interactions of the substrate this polymer is adsorbed, such as the collision efficiency
in flocculation[108, 21]. The large loop lengths found in Figures 29, 30, 31, 32, and
33 may have resulted from nonuniform distribution of charged groups in the random
copolymer used and also encounters with nonuniform regions of the mica surface.
The shape of the polymer loop length distributions, above, are very similar to that
those found by Levy and Maaloum, although the location is different[144, 145]. This
60
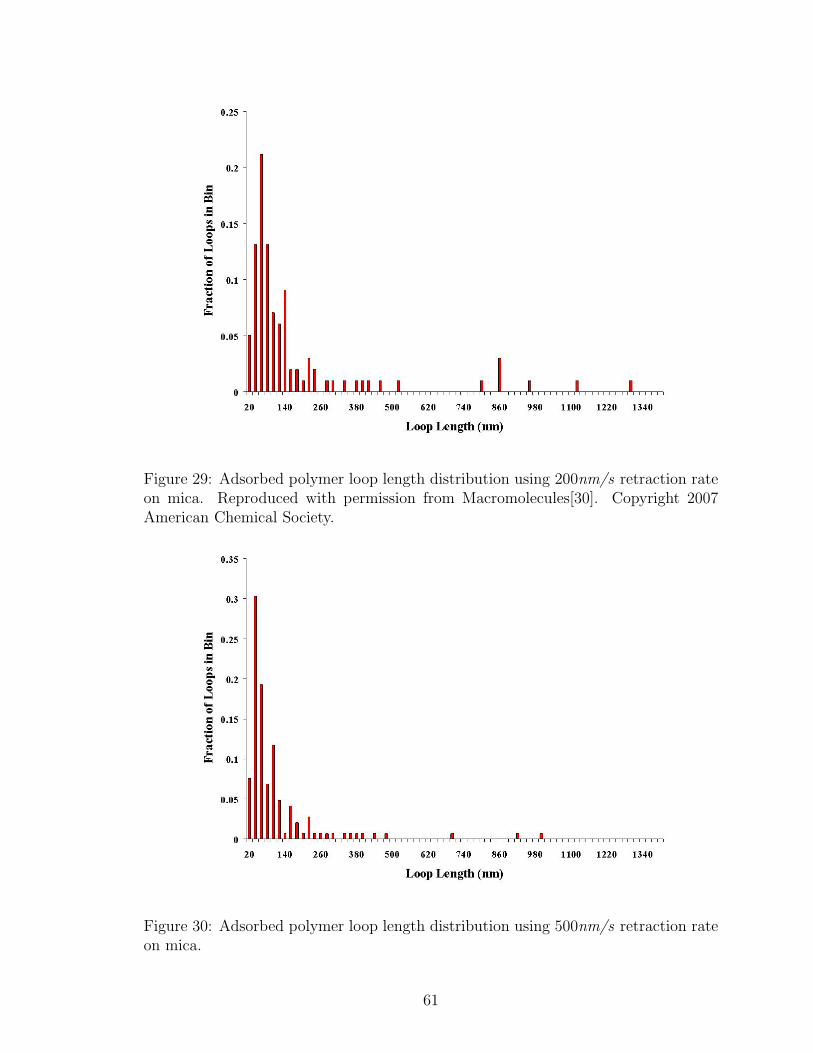
Figure 29: Adsorbed polymer loop length distribution using 200nm/s retraction rateon mica. Reproduced with permission from Macromolecules[30]. Copyright 2007American Chemical Society.
Figure 30: Adsorbed polymer loop length distribution using 500nm/s retraction rateon mica.
61
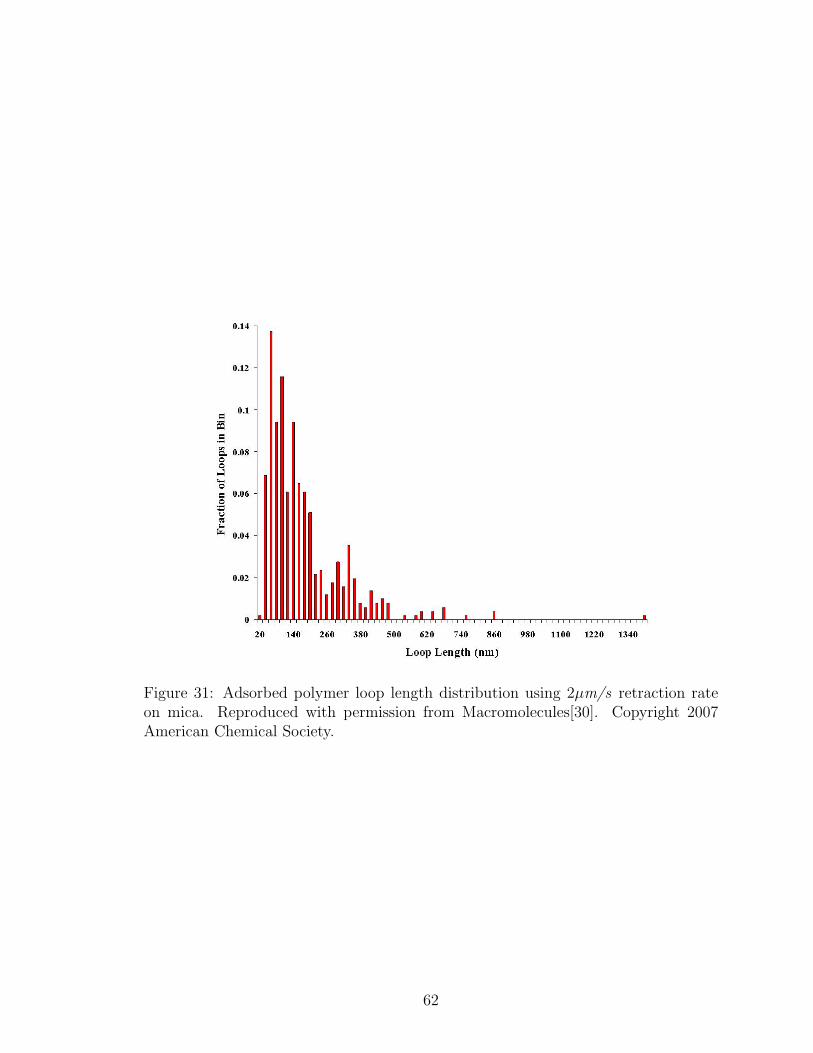
Figure 31: Adsorbed polymer loop length distribution using 2µm/s retraction rateon mica. Reproduced with permission from Macromolecules[30]. Copyright 2007American Chemical Society.
62
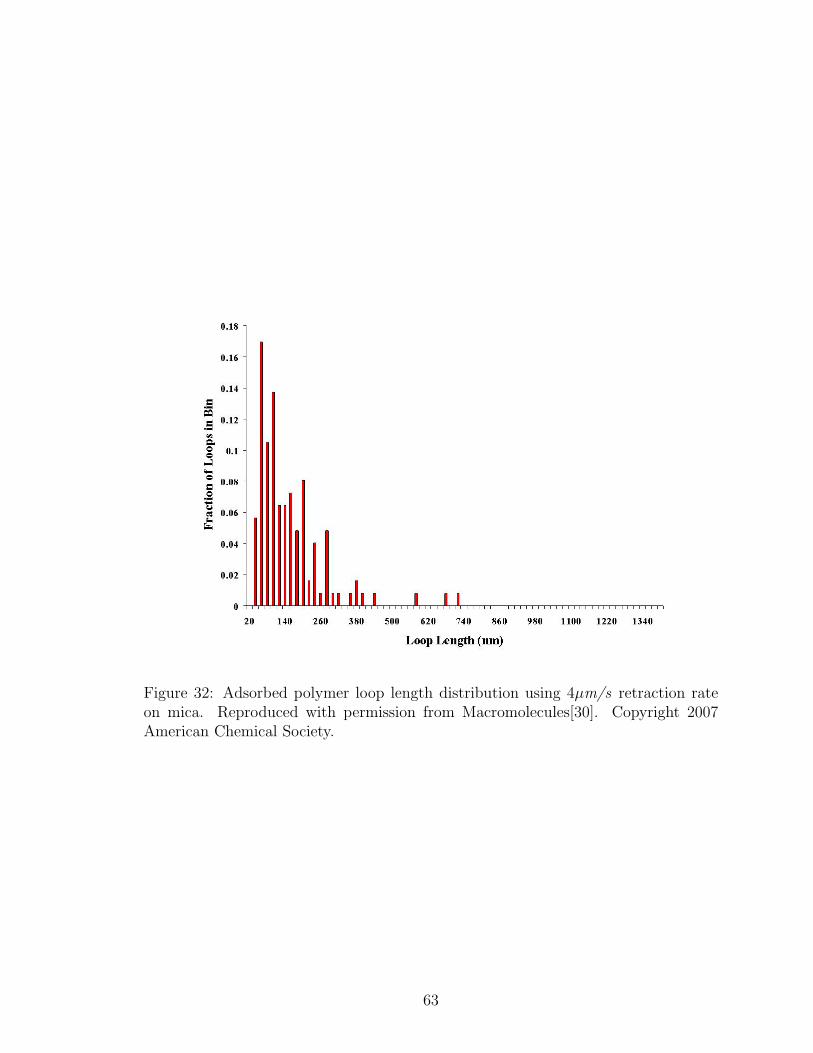
Figure 32: Adsorbed polymer loop length distribution using 4µm/s retraction rateon mica. Reproduced with permission from Macromolecules[30]. Copyright 2007American Chemical Society.
63
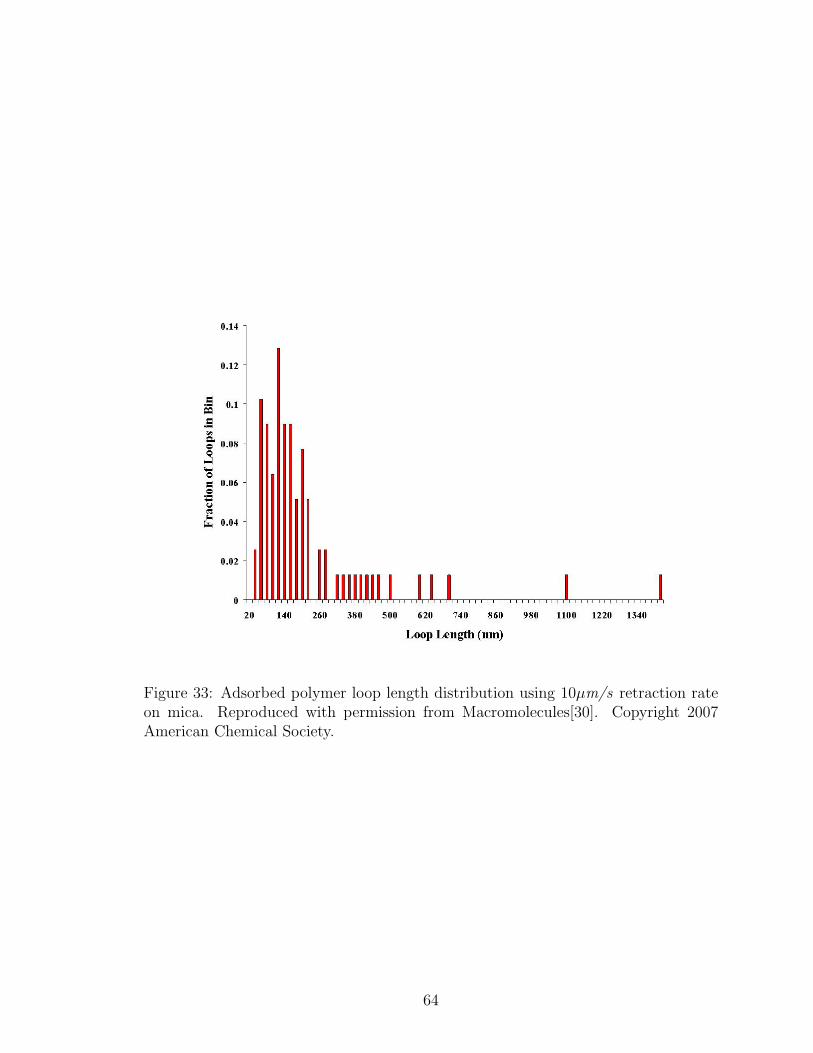
Figure 33: Adsorbed polymer loop length distribution using 10µm/s retraction rateon mica. Reproduced with permission from Macromolecules[30]. Copyright 2007American Chemical Society.
64
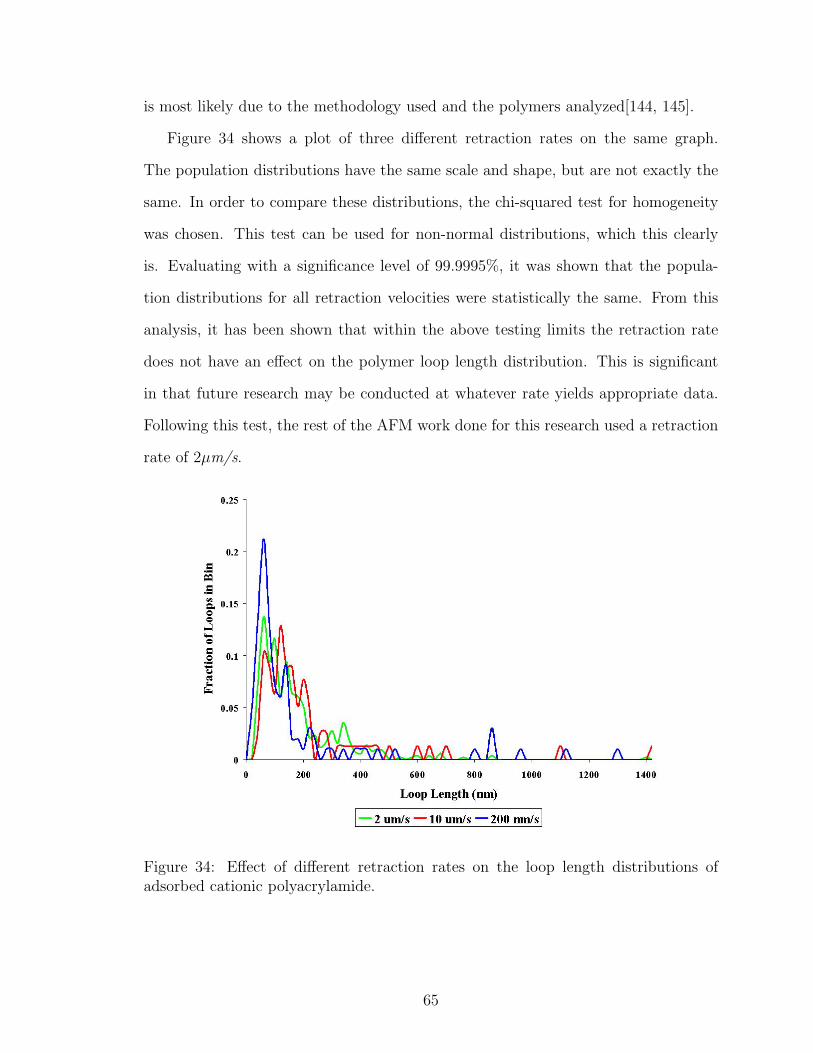
is most likely due to the methodology used and the polymers analyzed[144, 145].
Figure 34 shows a plot of three different retraction rates on the same graph.
The population distributions have the same scale and shape, but are not exactly the
same. In order to compare these distributions, the chi-squared test for homogeneity
was chosen. This test can be used for non-normal distributions, which this clearly
is. Evaluating with a significance level of 99.9995%, it was shown that the popula-
tion distributions for all retraction velocities were statistically the same. From this
analysis, it has been shown that within the above testing limits the retraction rate
does not have an effect on the polymer loop length distribution. This is significant
in that future research may be conducted at whatever rate yields appropriate data.
Following this test, the rest of the AFM work done for this research used a retraction
rate of 2µm/s.
Figure 34: Effect of different retraction rates on the loop length distributions ofadsorbed cationic polyacrylamide.
65
4.3.3.3 Data Selection
To analyze the polymer conformation and lengths of polymer loops, a method that
can correctly determine the desorption points from a force curve must be developed.
Much of the past work simply states that only “clear desorption events” are selected,
which show a stretching of the polymer chain followed by a sharp detachment, as
shown in each of the peaks selected in Figure 7. However, it is, in practice, difficult
to determine the “clear desorption events”. First, the minimum magnitude of the
deflection necessary to make a point must be determined. Second, the number of
data points required to be present to make up the stretching portion of an event
should be determined. Levy and Maaloum wrote an algorithm to automatically pick
out desorption events based on the magnitude of the detachment relative to the noise
of the freely vibrating chain[145]. By doing this, they have set criteria to select
points and limited the number of false events which could be selected. Levy and
Maaloum required the deflection to be greater than the mean-squared deviation of
the freely vibrating cantilever after the last desorption event[145]. For this research,
this standard was taken a step further. It was required that the deflection of the lever
must be greater than 3 times the average standard deviation of a freely vibrating
lever and chain. This adds to the confidence that the deflections seen are not due to
noise in the cantilever vibration. An investigation into the effects of the requirements
on the stretching of the polymer chain relative to point selection was also performed.
Table 1 shows how the selection of desorption events is altered by requiring different
stretching lengths for acceptance.
Table 1 shows the effects of requirements on polymer stretching relative to des-
orption event selection. For this research, a minimum of 200 data points leading to
a desorption event was required. This, in combination with the requirement on the
magnitude of desorption events, will significantly reduce the chance of counting false
desorption events. If the stretching criteria was increased to 1000 data points, events
66
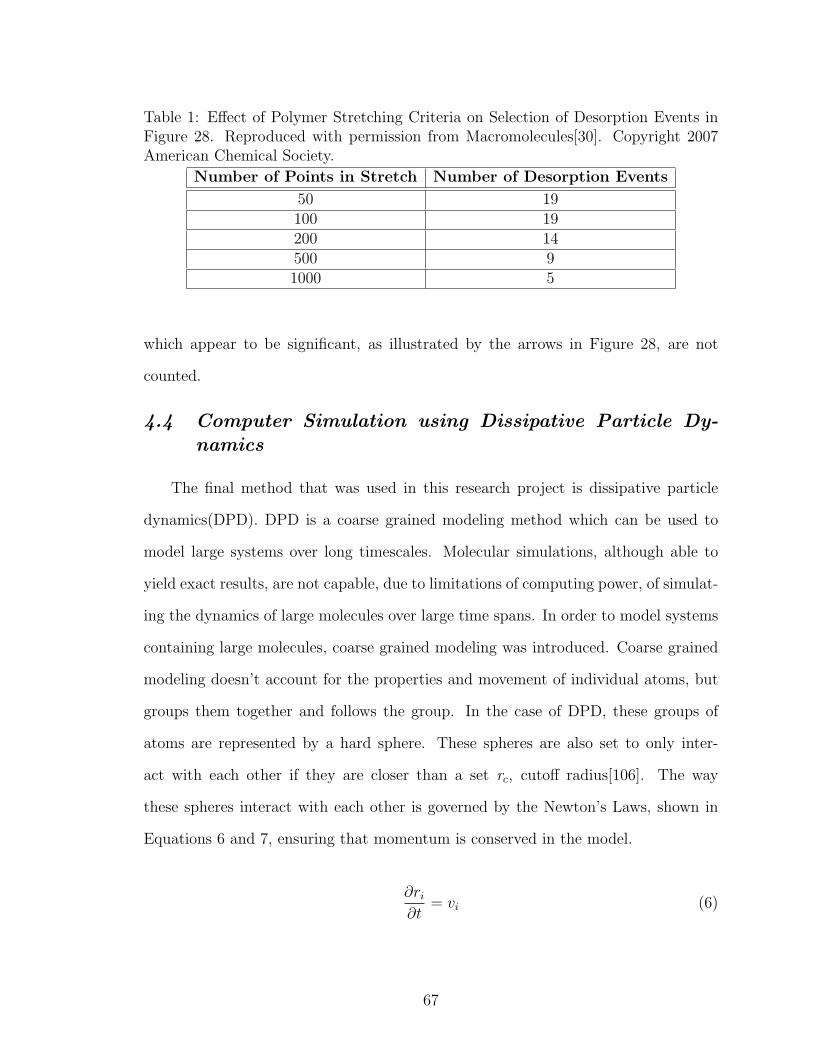
Table 1: Effect of Polymer Stretching Criteria on Selection of Desorption Events inFigure 28. Reproduced with permission from Macromolecules[30]. Copyright 2007American Chemical Society.
Number of Points in Stretch Number of Desorption Events
50 19100 19200 14500 91000 5
which appear to be significant, as illustrated by the arrows in Figure 28, are not
counted.
4.4 Computer Simulation using Dissipative Particle Dy-namics
The final method that was used in this research project is dissipative particle
dynamics(DPD). DPD is a coarse grained modeling method which can be used to
model large systems over long timescales. Molecular simulations, although able to
yield exact results, are not capable, due to limitations of computing power, of simulat-
ing the dynamics of large molecules over large time spans. In order to model systems
containing large molecules, coarse grained modeling was introduced. Coarse grained
modeling doesn’t account for the properties and movement of individual atoms, but
groups them together and follows the group. In the case of DPD, these groups of
atoms are represented by a hard sphere. These spheres are also set to only inter-
act with each other if they are closer than a set rc, cutoff radius[106]. The way
these spheres interact with each other is governed by the Newton’s Laws, shown in
Equations 6 and 7, ensuring that momentum is conserved in the model.
∂ri
∂t= vi (6)
67
mi∂vi
∂t= fi (7)
In DPD, the force term in Newton’s Second Law is divided into three parts: (1)con-
servative force (2)dissipative force (3)random force[94]. This is shown in Equation
8.
fi =∑j 6=i
[fC(rij) + fD(rij, vij) + fR(rij)] (8)
The components of this force are a conservative force,fC , a dissipative force, fD, and
a random force, fR. The conservative force corresponds to the interactions between
spheres due to their affinity for each other. This can be seen in Equation 9[94].
fC(rij) = aij(1 − rij)rij (9)
In Equation 9, aij refers to the repulsive interaction parameter between two par-
ticular spheres. The next force component in DPD is the dissipative force given by
Equation 10[94]. The dissipative force slows the movement in the system down, acting
as a drag force.
fD(rij, vij) = −γωD(rij)(vij · rij)rij (10)
γ is a variable which controls the strength of the drag force in the system, rij is
a unit vector in the direction of rij, and ωD relates to how the drag between spheres
changes with distance from each other[94]. The final force component used in DPD
is the random force. Equation 11 shows how the random force is determined[94].
fR(rij) = σωR(rij)ξij rij (11)
σ, used in the random force calculation, gives the magnitude of the random pair
forces between different spheres, ξ is a random variable, and ωR relates to the effect of
68
distance on the random force[94]. The random force is added to conserve momentum
in the system by adding speed to the system to counteract the dissipative force. The
two forces are directly related to each other through Equations 12 and 13[94].
ωD(rij) = [ωR(rij)]2 (12)
σ2 = 2kBTγ (13)
The previous group of equations can be used to find the forces acting on individual
spheres in the system. In order to solve these equations simultaneously, the velocity-
Verlet algorithm was used[106]. The only other parameters needed in this model
to make it applicable to this project’s scope were a wall, to which the polymer can
adsorb, and a method to connect beads to form a polymer. Walls for use in DPD
can be created using two different methods: creation of an actual wall or creation of
a virtual wall[218].
First we will consider the technique of creating a physical wall composed of
“frozen” beads. In this technique beads are frozen in place preventing the mobile
phase of beads from moving through the wall. This technique has been popular with
many researchers[218, 161, 205, 27, 99, 132]. This system also allows the mobile
phase of the simulation to interact with the wall through the bead/bead interactions
parameters, aij. One disadvantage of this wall technique is that it requires the pa-
rameterization of a physical wall[218]. To get around this disadvantage, the creation
of virtual walls for certain systems can be helpful.
There is very little research published, which clearly discusses, using virtual walls
in DPD simulations[27]. Boek et al. modified the boundary conditions of their system
to allow it to accurately represent shear flow in their system[27]. As stated in the
previous paragraph, this allows the physical interactions of the wall beads to be
disregarded and modeled theoretically only. For this work, due to the size of the
69
system which will be modeled, the virtual wall was chosen to be the best method
to model polymer adsorption on a surface. In order to create an impenetrable wall
thousands of beads would be necessary. This would severely increase the computation
time as the interactions between all beads in the system must be calculated each time
step. Because the beads in the wall must be close enough that no other beads may
pass through many of the wall beads will be within the cutoff radius for the force
calculations.
In order to simulate a wall, which a polymer can adsorb on, a hypothesis for the
mechanism of adsorption needed to be assumed. Because this work deals with systems
of cationic polymers adsorbing on anionic substrates an assumption of electrostatics
as the mechanism of adsorption is reasonable. This is not the only adsorption theory
which has been used. The Langmuir equation has been used to simulate molecular
adsorption on substrates[113]. However, this equation does a poor job simulating
polymer adsorption[113].
For this project, the assumption of electrostatics dominated adsorption led to the
use of the Poisson-Boltzmann equation, Equation 14[25].
∇2 νeψ
kBT= κ2sinh
νeψ
kBT(14)
In Equation 14, e is the electronic charge, kBis Boltzmann’s constant, ν is the
charge number, ψ is the surface potential, T is the temperature, and κ is the inverse
Debye screening length. Because this form of the Poisson-Boltzmann equation is
nonlinear it is difficult to use. The linearized Poisson-Boltzmann equation, Equation
15, is a commonly used solution to this problem[25].
∇2 νeψ
kBT= κ2 νeψ
kBT(15)
The use of the linearized Poisson-Boltzmann equation to determine the energy be-
tween two charged surfaces has been shown in the literature[219, 122, 25]. The original
70
derivations of this equation for use between two infinite flat plates was performed by
Gregory[103]. Since then, derivations have been extended to include interactions be-
tween similar spheres and also interactions between a sphere and a flat plate[34, 25].
In the DPD system which is being modeled, all particles are spherical beads. Because
of this, the derivation by Bhattacharjee and Elimelech between a sphere and flat plate
will be used. This energy derivation is shown in Equation 16.
E = πε0εra
(kBT
νe
)2
(Ψ2s + Ψ2
p)
[2Ψ2
sΨ2p
Ψ2s + Ψ2
p
ln
(1 + e−κD
1 − e−κD
)+ ln(1 − e−2κD)
](16)
Equation 16 gives an interaction energy between a sphere and a plate. In this
equation a is the radius of the sphere and D is the distance between the sphere and
the plate. DPD, however, requires the use of forces. To do this, the force can be
calculated as the first derivative of energy with respect to distance[14]. The force
obtained with the derivative of Equation 16 is used on all the beads in the system in
the direction perpendicular to the wall. The surface potential of the wall is considered
constant making this approach reasonable.
To use DPD to model a polymer’s movement, individual spheres in the system
need to be connected to form a polymer. The same methods of solving movement of
the polymer apply here as well except the individual beads will be held together by
a defined spring constant. This technique has been used by many researchers using
dissipative particle dynamics[124, 235, 258]. For this work, Equation 17 describes the
force holding the polymer beads together.
F = kpolymerbond(L−D)(rij) (17)
In Equation 17, kpolymerbond is the spring constant of the bond, L is the equilibrium
bond length, D is the actual bond length, and rij is the unit vector this force is applied
along. Most computer simulations of polymer conformation are done using atomistic
71
models and small polymers[247, 157, 162, 290, 214]. Other simulations modeled poly-
mer adsorption on surfaces and its adsorbed conformation using molecular dynamics
simulations and Monte Carlo simulations[88, 204, 76, 158, 264, 274, 110, 44]. Groot
and Warren simulated a polymers conformation in solution using DPD[106]. This
work attempted to use this approach to model polymer adsorption on a surface under
the same conditions which were evaluated in the two experimental methods of this
project.
4.4.1 Dissipative Particle Dynamics Materials
All simulations for this research were carried out using Molecular Operating
Environment software from the Chemical Computing Group. Because this software
does not have dissipative particle dynamics code, it was necessary to develop that
code. This was done by Andrew Swann and John Melnyczuk. The developed code
can be found in Appendix A.
Table 2 lists the variables which can be modified in the code. In the DPD code,
used for this research, all of the variables are scaled based on certain parameters of
the system. This leaves them dimensionless and this approach is always used in DPD
simulations[124, 235, 94, 163, 13, 258, 120]. Scaling eliminates the need to convert
units in the DPD code.
The dissipative particle dynamics code developed also included the use of a peri-
odic box to describe the system. This allows beads or polymers which pass through
limits of the box to be placed back on the other side conserving their momentum and
direction. This is a commonly used technique in modeling to allow the simulation
of large systems without modeling the entire system[7]. The modeling done in this
research, also, does not simulate the solvent phase of the systems. This was done to
reduce the number of beads in the system. Interactions between the polymer and sol-
vent can be accounted for by adjusting the aii, ajj, and aij parameters. Solvent effects
72
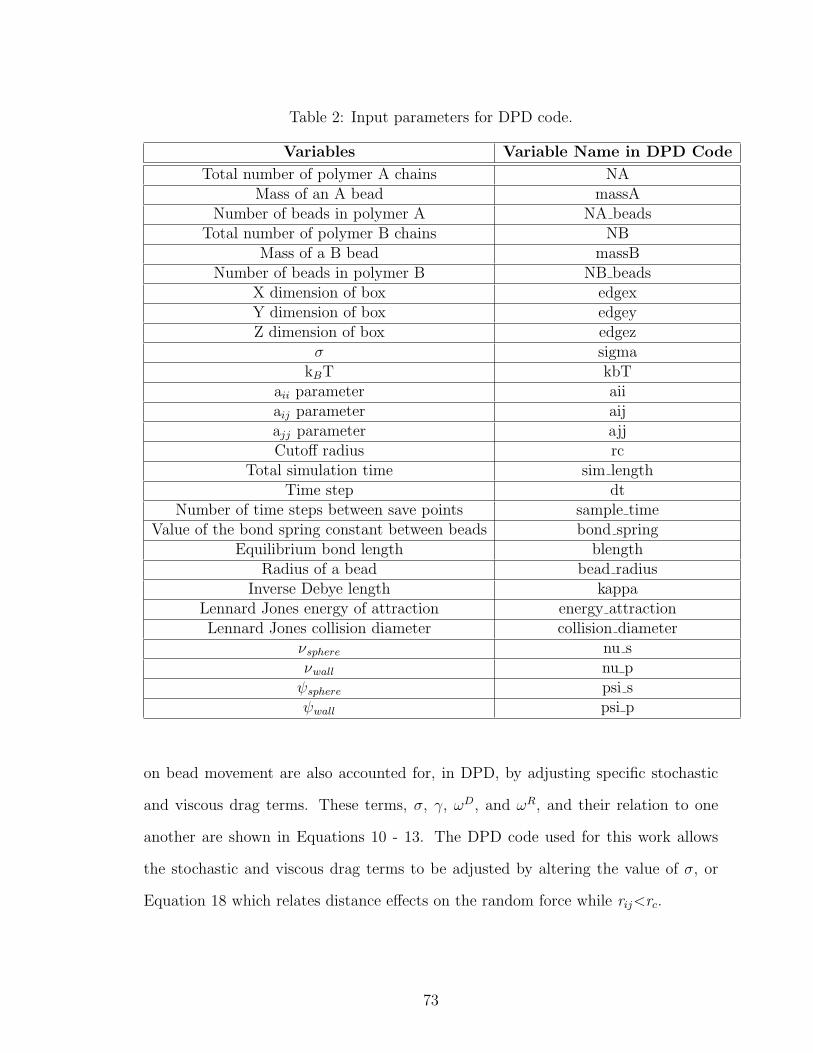
Table 2: Input parameters for DPD code.
Variables Variable Name in DPD Code
Total number of polymer A chains NAMass of an A bead massA
Number of beads in polymer A NA beadsTotal number of polymer B chains NB
Mass of a B bead massBNumber of beads in polymer B NB beads
X dimension of box edgexY dimension of box edgeyZ dimension of box edgez
σ sigmakBT kbT
aii parameter aiiaij parameter aijajj parameter ajjCutoff radius rc
Total simulation time sim lengthTime step dt
Number of time steps between save points sample timeValue of the bond spring constant between beads bond spring
Equilibrium bond length blengthRadius of a bead bead radius
Inverse Debye length kappaLennard Jones energy of attraction energy attractionLennard Jones collision diameter collision diameter
νsphere nu sνwall nu pψsphere psi sψwall psi p
on bead movement are also accounted for, in DPD, by adjusting specific stochastic
and viscous drag terms. These terms, σ, γ, ωD, and ωR, and their relation to one
another are shown in Equations 10 - 13. The DPD code used for this work allows
the stochastic and viscous drag terms to be adjusted by altering the value of σ, or
Equation 18 which relates distance effects on the random force while rij<rc.
73
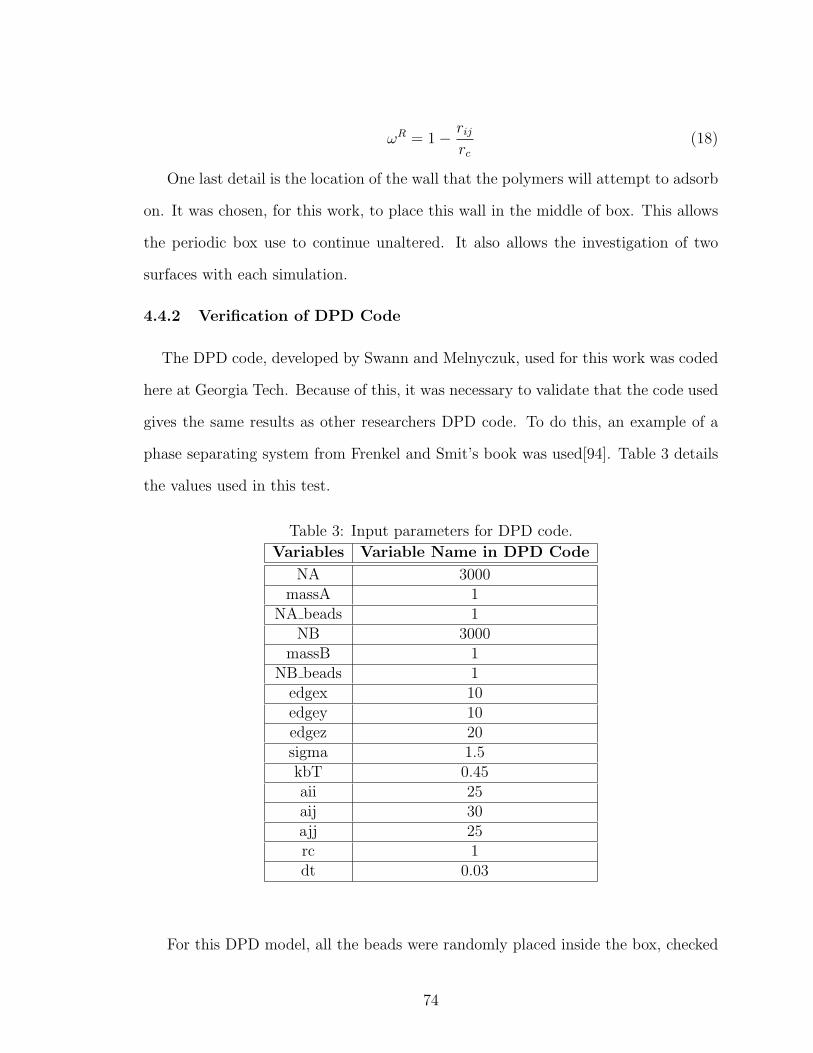
ωR = 1 − rij
rc
(18)
One last detail is the location of the wall that the polymers will attempt to adsorb
on. It was chosen, for this work, to place this wall in the middle of box. This allows
the periodic box use to continue unaltered. It also allows the investigation of two
surfaces with each simulation.
4.4.2 Verification of DPD Code
The DPD code, developed by Swann and Melnyczuk, used for this work was coded
here at Georgia Tech. Because of this, it was necessary to validate that the code used
gives the same results as other researchers DPD code. To do this, an example of a
phase separating system from Frenkel and Smit’s book was used[94]. Table 3 details
the values used in this test.
Table 3: Input parameters for DPD code.
Variables Variable Name in DPD Code
NA 3000massA 1
NA beads 1NB 3000
massB 1NB beads 1
edgex 10edgey 10edgez 20sigma 1.5kbT 0.45aii 25aij 30ajj 25rc 1dt 0.03
For this DPD model, all the beads were randomly placed inside the box, checked
74
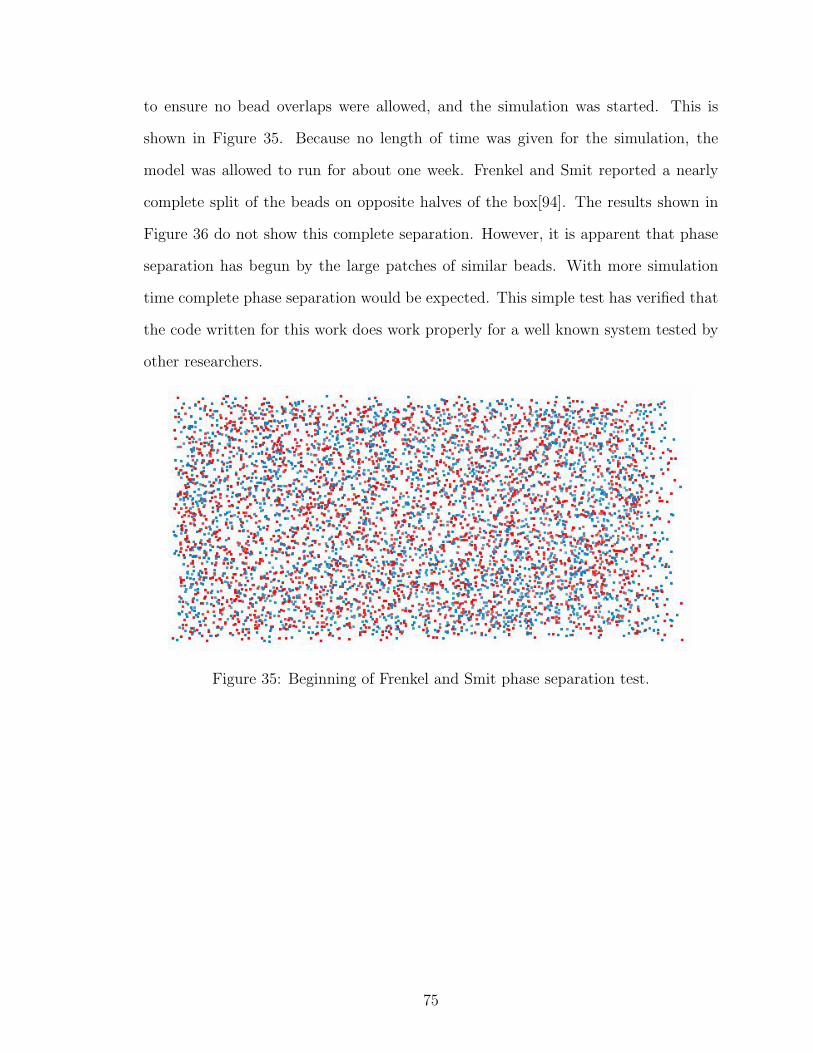
to ensure no bead overlaps were allowed, and the simulation was started. This is
shown in Figure 35. Because no length of time was given for the simulation, the
model was allowed to run for about one week. Frenkel and Smit reported a nearly
complete split of the beads on opposite halves of the box[94]. The results shown in
Figure 36 do not show this complete separation. However, it is apparent that phase
separation has begun by the large patches of similar beads. With more simulation
time complete phase separation would be expected. This simple test has verified that
the code written for this work does work properly for a well known system tested by
other researchers.
Figure 35: Beginning of Frenkel and Smit phase separation test.
75
Figure 36: End of Frenkel and Smit phase separation test.
76
CHAPTER V
ADSORBED POLYMER CONFORMATION
5.1 Overview
In order to understand how site blocking and other factors affect adsorbed polymer
conformations, an initial study of what an adsorbed polymer’s conformation actually
is must be performed. Using the experimental methods outlined in Chapter IV, this
chapter will evaluate how the MAPTAC/acrylamide copolymer’s conformation can
be described.
5.2 Dynamic Light Scattering to Measure Adsorbed Poly-mer Conformation
Dynamic light scattering has been used extensively in the literature to determine
the thickness of adsorbed polymer layers on surfaces[267, 179, 169, 185, 276, 286, 119,
167, 296, 207, 128, 75, 268, 105, 136, 66]. With the addition of a MAPTAC/acrylamide
copolymer, it was expected that the hydrodynamic radius of the latex spheres, used
for this research, would increase. This was shown in Figure 14. As explained in
the experimental portion of this thesis, a low concentration of MAPTAC/acrylamide
copolymer was chosen and added for these studies. The thickness of the adsorbed
polymer layer found is illustrated in Figure 37.
Figure 37 reports an average thickness, of an adsorbed polymer layer, to be
9.45nm. The small increase in hydrodynamic diameter, after addition of the polymer,
was of the same order of magnitude as the results found by previous researchers[128].
From this average thickness, it was possible to propose possible scenarios about the
adsorbed polymers conformation. For example, it is known that the polymer used
for this research is around 2 to 3µm in length. From this, a 10nm adsorbed layer
77
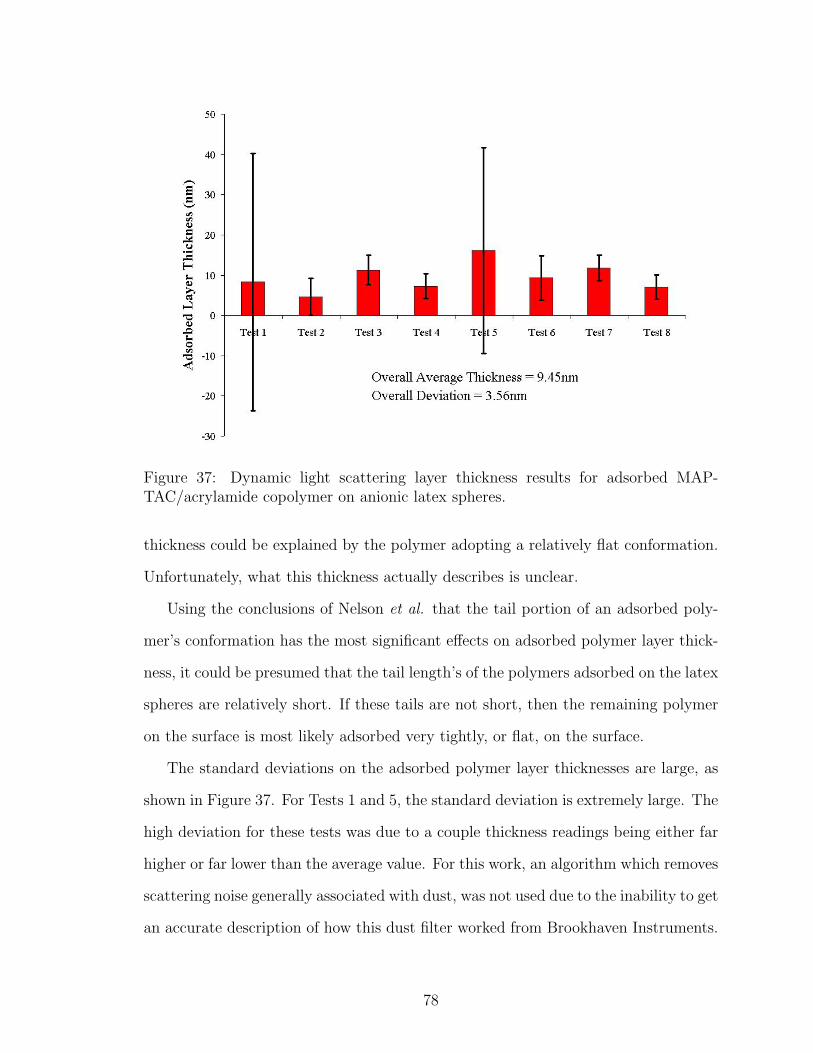
Figure 37: Dynamic light scattering layer thickness results for adsorbed MAP-TAC/acrylamide copolymer on anionic latex spheres.
thickness could be explained by the polymer adopting a relatively flat conformation.
Unfortunately, what this thickness actually describes is unclear.
Using the conclusions of Nelson et al. that the tail portion of an adsorbed poly-
mer’s conformation has the most significant effects on adsorbed polymer layer thick-
ness, it could be presumed that the tail length’s of the polymers adsorbed on the latex
spheres are relatively short. If these tails are not short, then the remaining polymer
on the surface is most likely adsorbed very tightly, or flat, on the surface.
The standard deviations on the adsorbed polymer layer thicknesses are large, as
shown in Figure 37. For Tests 1 and 5, the standard deviation is extremely large. The
high deviation for these tests was due to a couple thickness readings being either far
higher or far lower than the average value. For this work, an algorithm which removes
scattering noise generally associated with dust, was not used due to the inability to get
an accurate description of how this dust filter worked from Brookhaven Instruments.
78
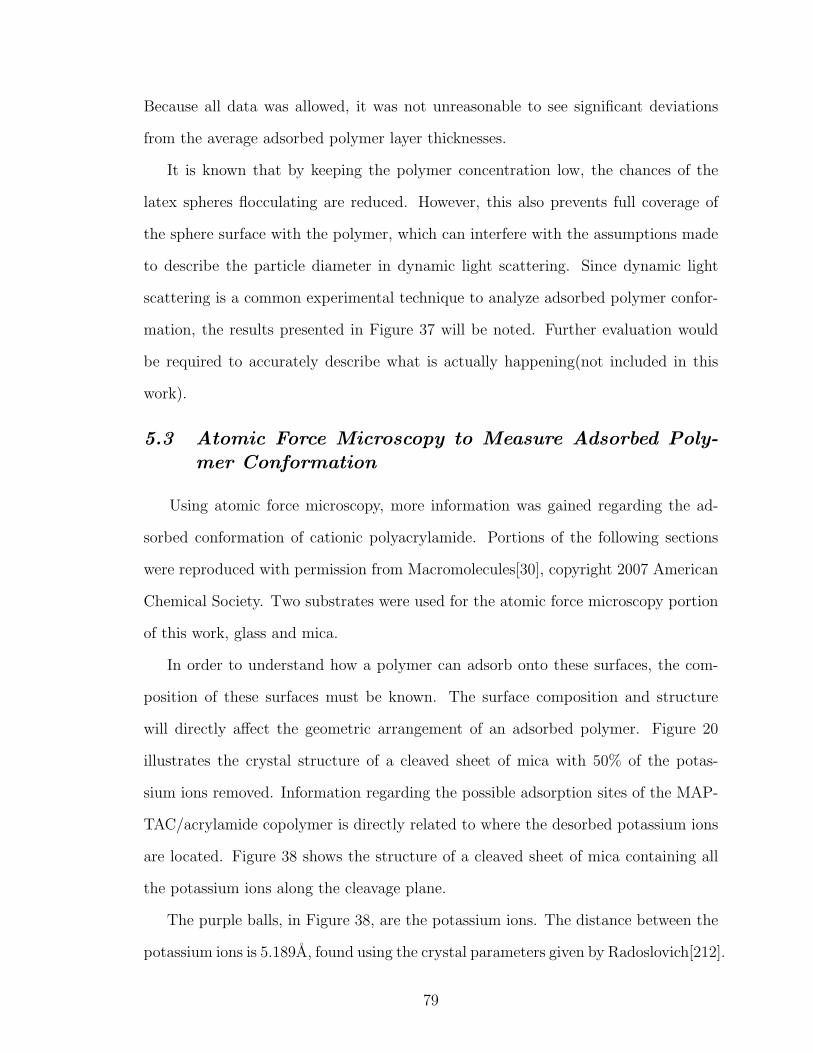
Because all data was allowed, it was not unreasonable to see significant deviations
from the average adsorbed polymer layer thicknesses.
It is known that by keeping the polymer concentration low, the chances of the
latex spheres flocculating are reduced. However, this also prevents full coverage of
the sphere surface with the polymer, which can interfere with the assumptions made
to describe the particle diameter in dynamic light scattering. Since dynamic light
scattering is a common experimental technique to analyze adsorbed polymer confor-
mation, the results presented in Figure 37 will be noted. Further evaluation would
be required to accurately describe what is actually happening(not included in this
work).
5.3 Atomic Force Microscopy to Measure Adsorbed Poly-mer Conformation
Using atomic force microscopy, more information was gained regarding the ad-
sorbed conformation of cationic polyacrylamide. Portions of the following sections
were reproduced with permission from Macromolecules[30], copyright 2007 American
Chemical Society. Two substrates were used for the atomic force microscopy portion
of this work, glass and mica.
In order to understand how a polymer can adsorb onto these surfaces, the com-
position of these surfaces must be known. The surface composition and structure
will directly affect the geometric arrangement of an adsorbed polymer. Figure 20
illustrates the crystal structure of a cleaved sheet of mica with 50% of the potas-
sium ions removed. Information regarding the possible adsorption sites of the MAP-
TAC/acrylamide copolymer is directly related to where the desorbed potassium ions
are located. Figure 38 shows the structure of a cleaved sheet of mica containing all
the potassium ions along the cleavage plane.
The purple balls, in Figure 38, are the potassium ions. The distance between the
potassium ions is 5.189A, found using the crystal parameters given by Radoslovich[212].
79
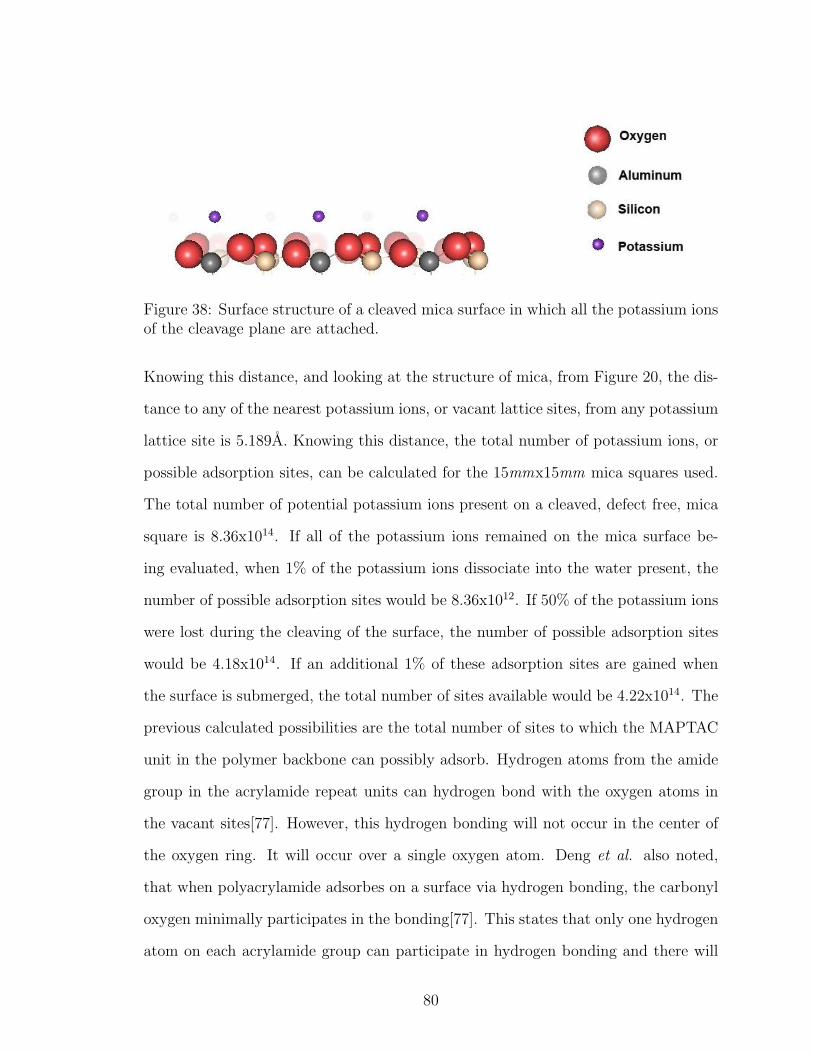
Figure 38: Surface structure of a cleaved mica surface in which all the potassium ionsof the cleavage plane are attached.
Knowing this distance, and looking at the structure of mica, from Figure 20, the dis-
tance to any of the nearest potassium ions, or vacant lattice sites, from any potassium
lattice site is 5.189A. Knowing this distance, the total number of potassium ions, or
possible adsorption sites, can be calculated for the 15mmx15mm mica squares used.
The total number of potential potassium ions present on a cleaved, defect free, mica
square is 8.36x10¹⁴. If all of the potassium ions remained on the mica surface be-
ing evaluated, when 1% of the potassium ions dissociate into the water present, the
number of possible adsorption sites would be 8.36x10¹². If 50% of the potassium ions
were lost during the cleaving of the surface, the number of possible adsorption sites
would be 4.18x10¹⁴. If an additional 1% of these adsorption sites are gained when
the surface is submerged, the total number of sites available would be 4.22x10¹⁴. The
previous calculated possibilities are the total number of sites to which the MAPTAC
unit in the polymer backbone can possibly adsorb. Hydrogen atoms from the amide
group in the acrylamide repeat units can hydrogen bond with the oxygen atoms in
the vacant sites[77]. However, this hydrogen bonding will not occur in the center of
the oxygen ring. It will occur over a single oxygen atom. Deng et al. also noted,
that when polyacrylamide adsorbes on a surface via hydrogen bonding, the carbonyl
oxygen minimally participates in the bonding[77]. This states that only one hydrogen
atom on each acrylamide group can participate in hydrogen bonding and there will
80
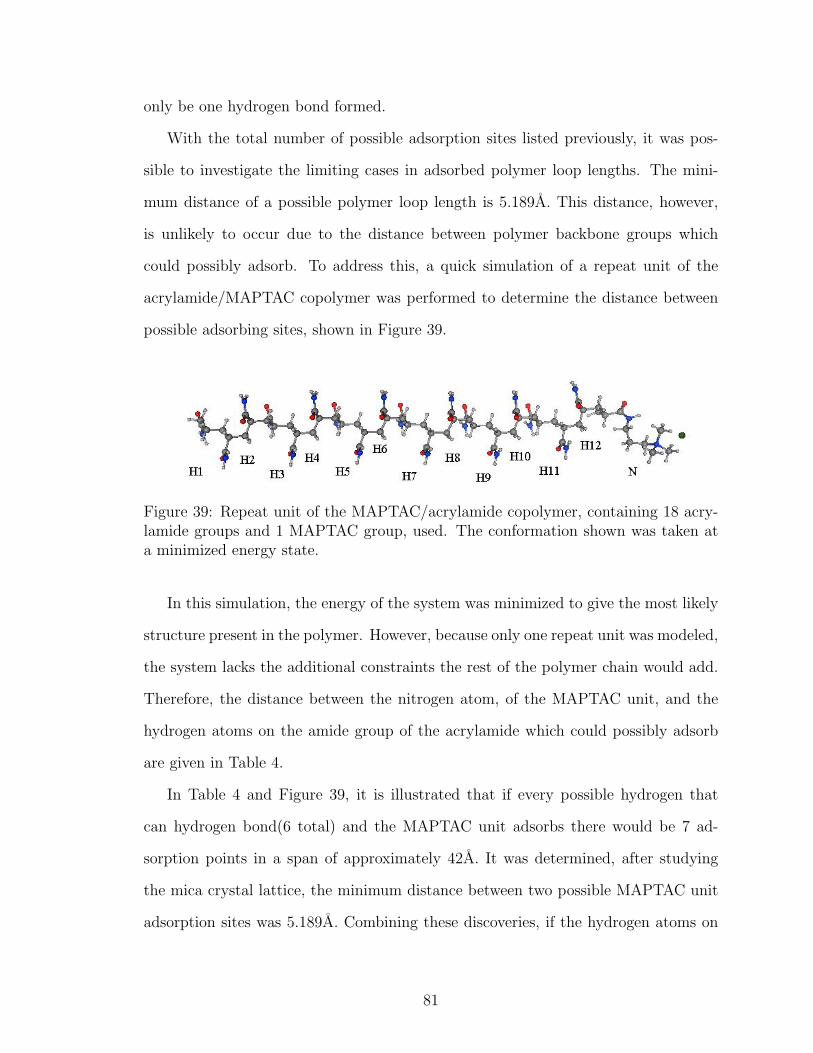
only be one hydrogen bond formed.
With the total number of possible adsorption sites listed previously, it was pos-
sible to investigate the limiting cases in adsorbed polymer loop lengths. The mini-
mum distance of a possible polymer loop length is 5.189A. This distance, however,
is unlikely to occur due to the distance between polymer backbone groups which
could possibly adsorb. To address this, a quick simulation of a repeat unit of the
acrylamide/MAPTAC copolymer was performed to determine the distance between
possible adsorbing sites, shown in Figure 39.
Figure 39: Repeat unit of the MAPTAC/acrylamide copolymer, containing 18 acry-lamide groups and 1 MAPTAC group, used. The conformation shown was taken ata minimized energy state.
In this simulation, the energy of the system was minimized to give the most likely
structure present in the polymer. However, because only one repeat unit was modeled,
the system lacks the additional constraints the rest of the polymer chain would add.
Therefore, the distance between the nitrogen atom, of the MAPTAC unit, and the
hydrogen atoms on the amide group of the acrylamide which could possibly adsorb
are given in Table 4.
In Table 4 and Figure 39, it is illustrated that if every possible hydrogen that
can hydrogen bond(6 total) and the MAPTAC unit adsorbs there would be 7 ad-
sorption points in a span of approximately 42A. It was determined, after studying
the mica crystal lattice, the minimum distance between two possible MAPTAC unit
adsorption sites was 5.189A. Combining these discoveries, if the hydrogen atoms on
81
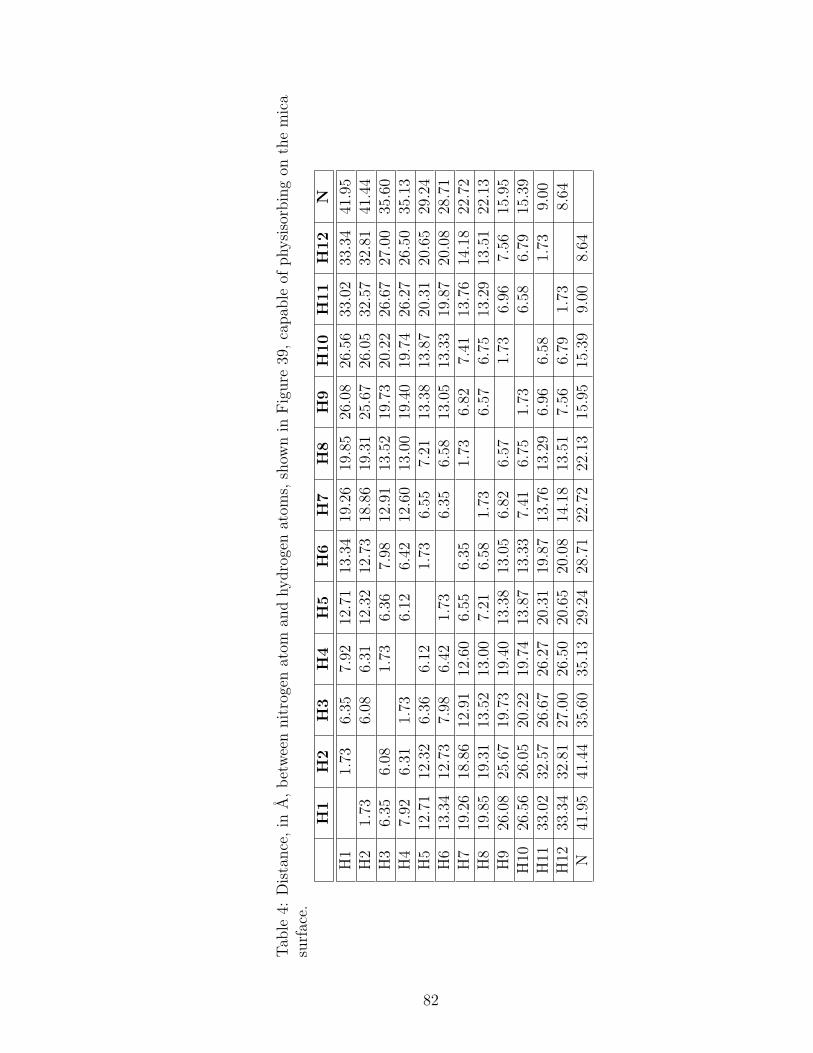
Tab
le4:
Dis
tance
,in
A,bet
wee
nnit
roge
nat
oman
dhydro
gen
atom
s,sh
own
inFig
ure
39,ca
pab
leof
physi
sorb
ing
onth
em
ica
surf
ace.
H1
H2
H3
H4
H5
H6
H7
H8
H9
H10
H11
H12
N
H1
1.73
6.35
7.92
12.7
113
.34
19.2
619
.85
26.0
826
.56
33.0
233
.34
41.9
5H
21.
736.
086.
3112
.32
12.7
318
.86
19.3
125
.67
26.0
532
.57
32.8
141
.44
H3
6.35
6.08
1.73
6.36
7.98
12.9
113
.52
19.7
320
.22
26.6
727
.00
35.6
0H
47.
926.
311.
736.
126.
4212
.60
13.0
019
.40
19.7
426
.27
26.5
035
.13
H5
12.7
112
.32
6.36
6.12
1.73
6.55
7.21
13.3
813
.87
20.3
120
.65
29.2
4H
613
.34
12.7
37.
986.
421.
736.
356.
5813
.05
13.3
319
.87
20.0
828
.71
H7
19.2
618
.86
12.9
112
.60
6.55
6.35
1.73
6.82
7.41
13.7
614
.18
22.7
2H
819
.85
19.3
113
.52
13.0
07.
216.
581.
736.
576.
7513
.29
13.5
122
.13
H9
26.0
825
.67
19.7
319
.40
13.3
813
.05
6.82
6.57
1.73
6.96
7.56
15.9
5H
1026
.56
26.0
520
.22
19.7
413
.87
13.3
37.
416.
751.
736.
586.
7915
.39
H11
33.0
232
.57
26.6
726
.27
20.3
119
.87
13.7
613
.29
6.96
6.58
1.73
9.00
H12
33.3
432
.81
27.0
026
.50
20.6
520
.08
14.1
813
.51
7.56
6.79
1.73
8.64
N41
.95
41.4
435
.60
35.1
329
.24
28.7
122
.72
22.1
315
.95
15.3
99.
008.
64
82
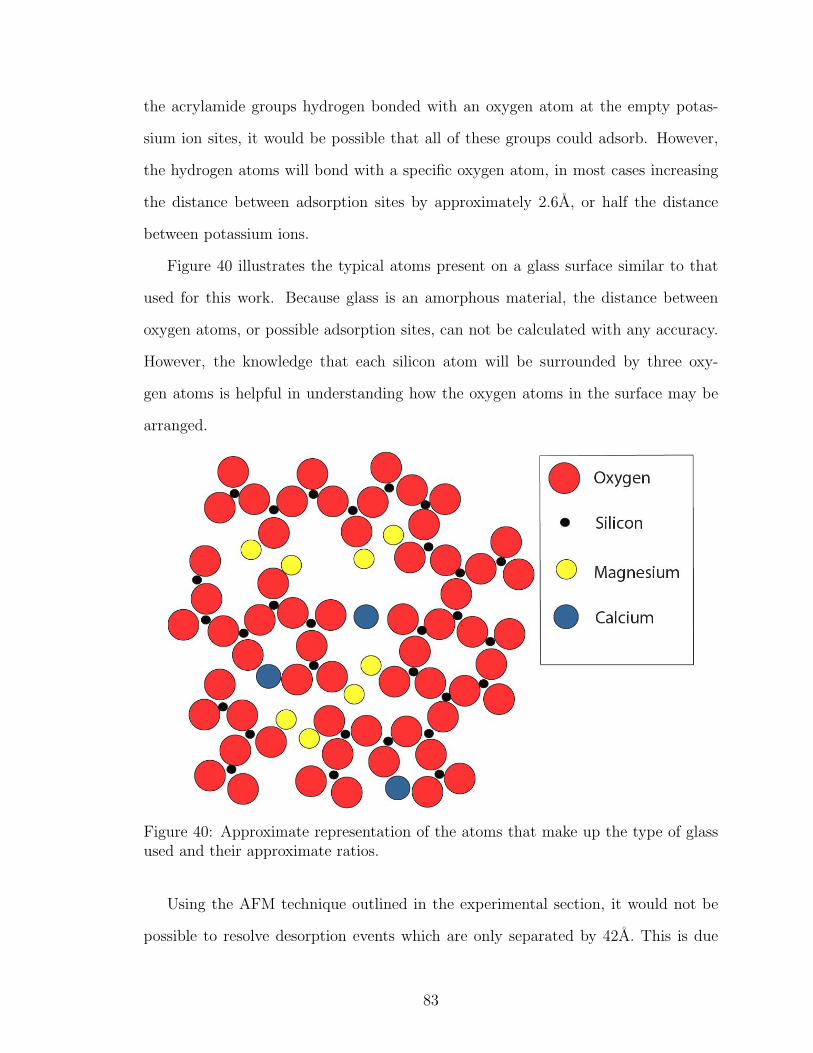
the acrylamide groups hydrogen bonded with an oxygen atom at the empty potas-
sium ion sites, it would be possible that all of these groups could adsorb. However,
the hydrogen atoms will bond with a specific oxygen atom, in most cases increasing
the distance between adsorption sites by approximately 2.6A, or half the distance
between potassium ions.
Figure 40 illustrates the typical atoms present on a glass surface similar to that
used for this work. Because glass is an amorphous material, the distance between
oxygen atoms, or possible adsorption sites, can not be calculated with any accuracy.
However, the knowledge that each silicon atom will be surrounded by three oxy-
gen atoms is helpful in understanding how the oxygen atoms in the surface may be
arranged.
Figure 40: Approximate representation of the atoms that make up the type of glassused and their approximate ratios.
Using the AFM technique outlined in the experimental section, it would not be
possible to resolve desorption events which are only separated by 42A. This is due
83
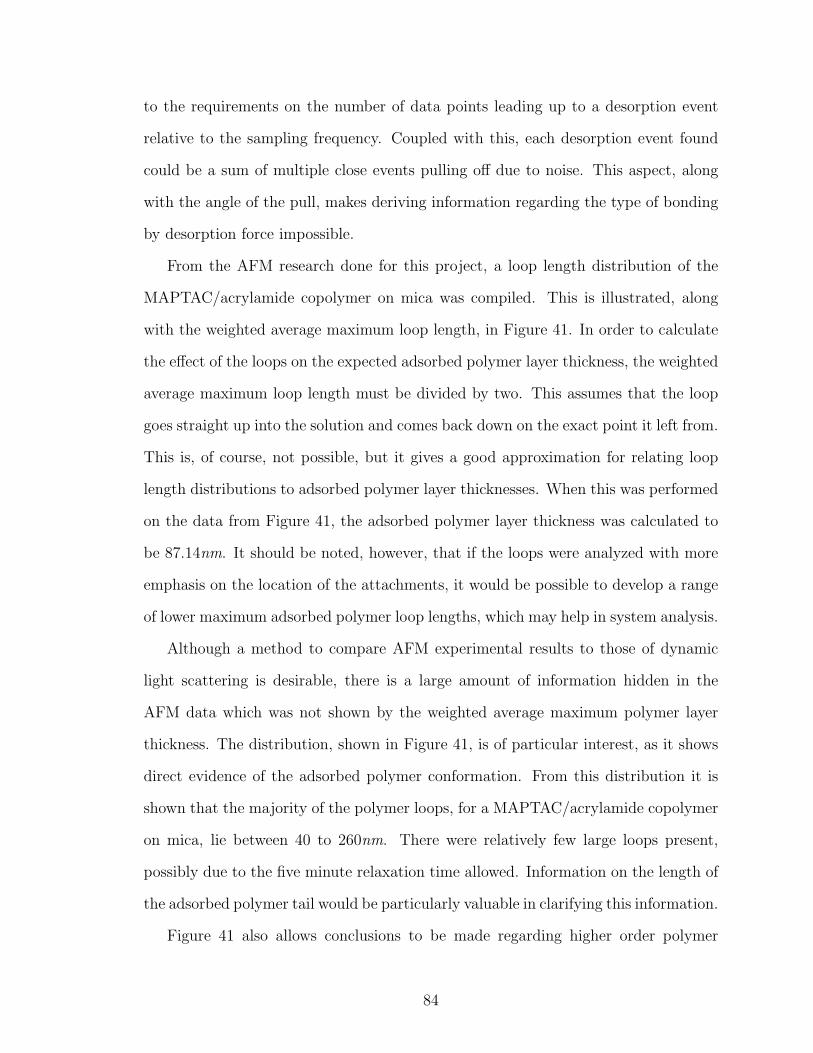
to the requirements on the number of data points leading up to a desorption event
relative to the sampling frequency. Coupled with this, each desorption event found
could be a sum of multiple close events pulling off due to noise. This aspect, along
with the angle of the pull, makes deriving information regarding the type of bonding
by desorption force impossible.
From the AFM research done for this project, a loop length distribution of the
MAPTAC/acrylamide copolymer on mica was compiled. This is illustrated, along
with the weighted average maximum loop length, in Figure 41. In order to calculate
the effect of the loops on the expected adsorbed polymer layer thickness, the weighted
average maximum loop length must be divided by two. This assumes that the loop
goes straight up into the solution and comes back down on the exact point it left from.
This is, of course, not possible, but it gives a good approximation for relating loop
length distributions to adsorbed polymer layer thicknesses. When this was performed
on the data from Figure 41, the adsorbed polymer layer thickness was calculated to
be 87.14nm. It should be noted, however, that if the loops were analyzed with more
emphasis on the location of the attachments, it would be possible to develop a range
of lower maximum adsorbed polymer loop lengths, which may help in system analysis.
Although a method to compare AFM experimental results to those of dynamic
light scattering is desirable, there is a large amount of information hidden in the
AFM data which was not shown by the weighted average maximum polymer layer
thickness. The distribution, shown in Figure 41, is of particular interest, as it shows
direct evidence of the adsorbed polymer conformation. From this distribution it is
shown that the majority of the polymer loops, for a MAPTAC/acrylamide copolymer
on mica, lie between 40 to 260nm. There were relatively few large loops present,
possibly due to the five minute relaxation time allowed. Information on the length of
the adsorbed polymer tail would be particularly valuable in clarifying this information.
Figure 41 also allows conclusions to be made regarding higher order polymer
84
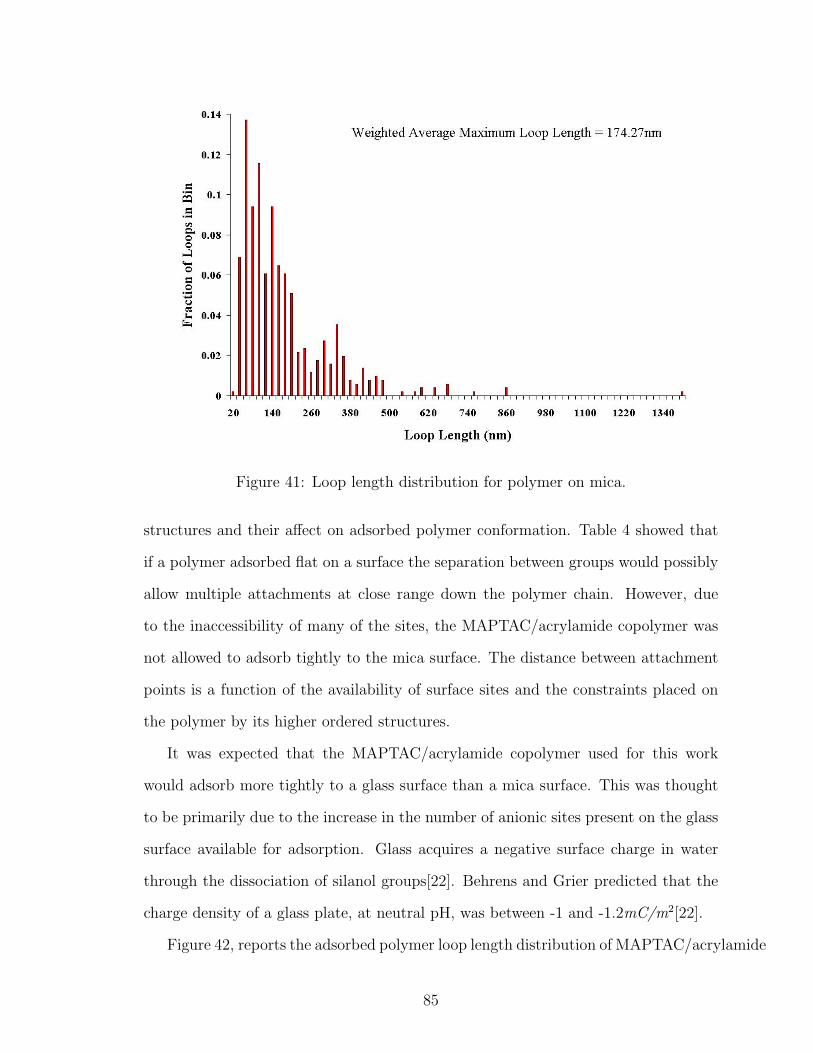
Figure 41: Loop length distribution for polymer on mica.
structures and their affect on adsorbed polymer conformation. Table 4 showed that
if a polymer adsorbed flat on a surface the separation between groups would possibly
allow multiple attachments at close range down the polymer chain. However, due
to the inaccessibility of many of the sites, the MAPTAC/acrylamide copolymer was
not allowed to adsorb tightly to the mica surface. The distance between attachment
points is a function of the availability of surface sites and the constraints placed on
the polymer by its higher ordered structures.
It was expected that the MAPTAC/acrylamide copolymer used for this work
would adsorb more tightly to a glass surface than a mica surface. This was thought
to be primarily due to the increase in the number of anionic sites present on the glass
surface available for adsorption. Glass acquires a negative surface charge in water
through the dissociation of silanol groups[22]. Behrens and Grier predicted that the
charge density of a glass plate, at neutral pH, was between -1 and -1.2mC/m2[22].
Figure 42, reports the adsorbed polymer loop length distribution of MAPTAC/acrylamide
85
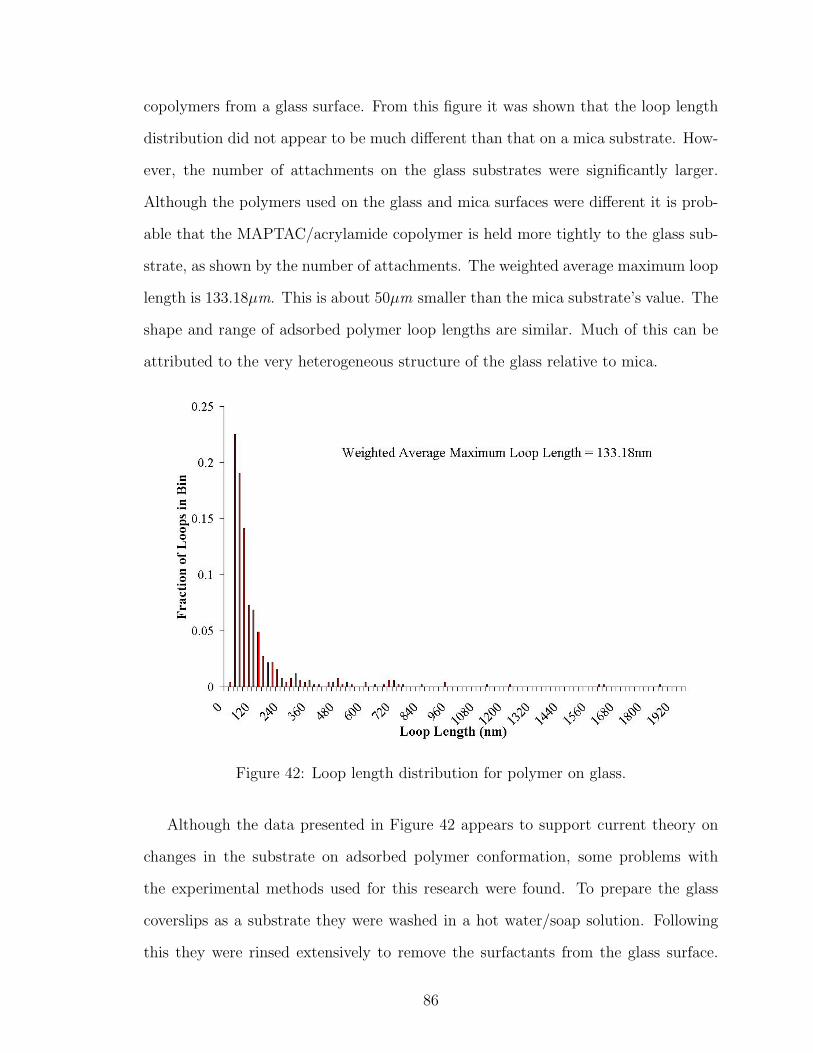
copolymers from a glass surface. From this figure it was shown that the loop length
distribution did not appear to be much different than that on a mica substrate. How-
ever, the number of attachments on the glass substrates were significantly larger.
Although the polymers used on the glass and mica surfaces were different it is prob-
able that the MAPTAC/acrylamide copolymer is held more tightly to the glass sub-
strate, as shown by the number of attachments. The weighted average maximum loop
length is 133.18µm. This is about 50µm smaller than the mica substrate’s value. The
shape and range of adsorbed polymer loop lengths are similar. Much of this can be
attributed to the very heterogeneous structure of the glass relative to mica.
Figure 42: Loop length distribution for polymer on glass.
Although the data presented in Figure 42 appears to support current theory on
changes in the substrate on adsorbed polymer conformation, some problems with
the experimental methods used for this research were found. To prepare the glass
coverslips as a substrate they were washed in a hot water/soap solution. Following
this they were rinsed extensively to remove the surfactants from the glass surface.
86
However, it is possible that some of the surfactants could have remained on the
glass surface following the rinsing allowing for contamination of the AFM results. A
couple experiments had unexpected AFM results which would relate to a polymer
being over 10µm long. It is possible that these results were due to an association of
the surfactant and the cationic copolymer resulting in a multiple polymer pull. The
results reported above are thought to be acceptable. However, there is no way to
verify this. Therefore, the glass results will be reported and discussed but caution
should be used when applying this data.
A common trend to this work and all other AFM “pulling” experiments, is shown
in Figures 27 and 28. In these figures, it appeared that the majority of the polymer
attachment points are present in the beginning of the pull, the left side. One possible
explanation for this assumes that the method of polymer adsorption is electrostatics.
Although the MAPTAC/acrylamide copolymer used is thought to have a random
distribution of MAPTAC units throughout the polymer chain, this may not be the
actual situation. Tanaka found that the rate of polymerization of acrylamide is greater
than that of MAPTAC[260]. This means that the acrylamide in solution will add to
the growing chain faster than the MAPTAC units. In the polymerization method
used to make this polymer with a terminal thiol group, the polymerization starts at
the terminal end without the thiol group. As the polymer chain grows, initially, more
acrylamide groups could add to the chain. However, once there is a concentration
gradient in the polymerization solution then the MAPTAC units will have a higher
probability of reacting with the growing chain. Finally, the thiol group will sit at
the other terminal end of the polymer. This may cause more MAPTAC units to be
closer to the thiol terminal end of the polymers, or the region closest to the AFM
tip. If this is the case, and electrostatics dominates adsorption, it would be expected
that the majority of the adsorption points would be relatively close to the AFM tip.
Coupled with this the fact that the AFM tip confines a the polymer near the surface
87
will also cause more adsorption points to occur, as the polymer is not attracted to
the tip and is forced near the surface.
5.3.1 Comparison with Theory
A considerable amount of work has been performed in the past to theoretically
model adsorbed polymer conformations[233, 10, 11, 72, 71, 89]. With the development
of atomic force microscopy testing techniques, researchers are now able to determine
what the loop length distribution for an adsorbed polymer actually is. It has been
shown that the distribution of polymer concentration at different lengths from the
surface decays at different rates[74]. The central region, where most of the polymer’s
concentration lies, decays following a power law, but the distal region follows an
exponential decay[74]. Previous work done by Senden et al. and Haschke et al. has
looked to fit the obtained loop length distributions to the scaling models developed
by Aubouy et al.[108, 241, 11, 10]. Aubouy et al. showed that the number of loops in
a distribution with exactly n monomers scaled with n−11/5 in the dilute regime and
good solvent[11]. To compare the power law distribution of polymer loop lengths, the
data were plotted on a log/log scale and the slope of the distribution was found, as
shown in Figure 43.
The short-dashed trend line in Figure 43 shows that when all points in the dis-
tribution are included, the power law does not fit very well. Past researchers have
discarded small and large loop lengths to fit the central region of the distribution[108].
When this is done, the slope and fit of the power law distribution fit much better.
The effect of this change is illustrated in the solid trend line in Figure 43, which shows
that the central region of the polymer distribution does not fall in the dilute regime
with a good solvent. This has been explained by Haschke et al. through confinement
of the polymer between the tip and the surface, resulting in a transfer to the semidi-
lute regime which would scale to n−3/2[108]. The data found in this work agrees with
88
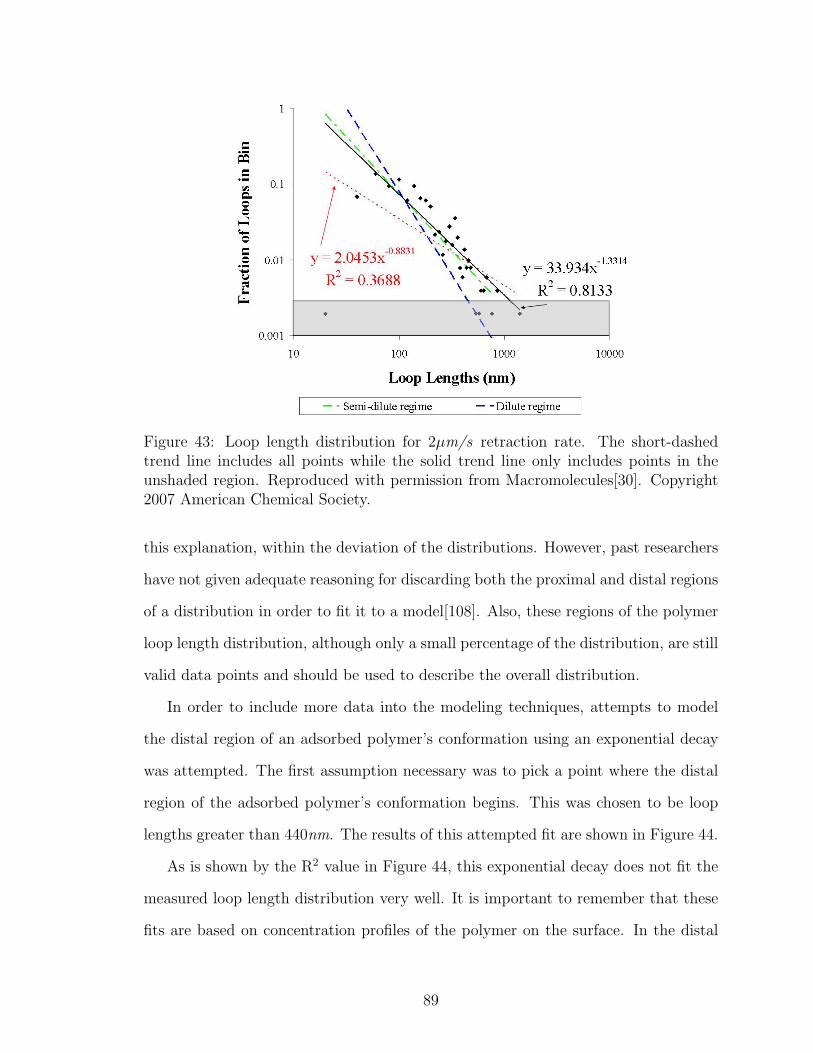
Figure 43: Loop length distribution for 2µm/s retraction rate. The short-dashedtrend line includes all points while the solid trend line only includes points in theunshaded region. Reproduced with permission from Macromolecules[30]. Copyright2007 American Chemical Society.
this explanation, within the deviation of the distributions. However, past researchers
have not given adequate reasoning for discarding both the proximal and distal regions
of a distribution in order to fit it to a model[108]. Also, these regions of the polymer
loop length distribution, although only a small percentage of the distribution, are still
valid data points and should be used to describe the overall distribution.
In order to include more data into the modeling techniques, attempts to model
the distal region of an adsorbed polymer’s conformation using an exponential decay
was attempted. The first assumption necessary was to pick a point where the distal
region of the adsorbed polymer’s conformation begins. This was chosen to be loop
lengths greater than 440nm. The results of this attempted fit are shown in Figure 44.
As is shown by the R2 value in Figure 44, this exponential decay does not fit the
measured loop length distribution very well. It is important to remember that these
fits are based on concentration profiles of the polymer on the surface. In the distal
89
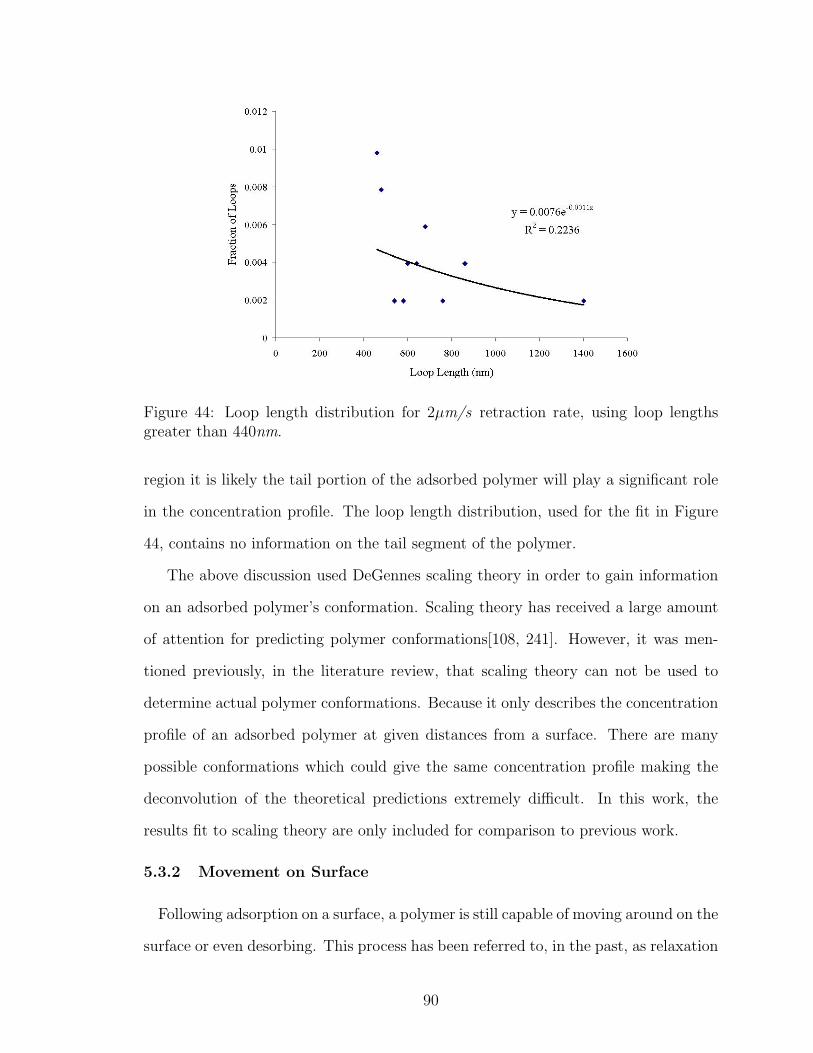
Figure 44: Loop length distribution for 2µm/s retraction rate, using loop lengthsgreater than 440nm.
region it is likely the tail portion of the adsorbed polymer will play a significant role
in the concentration profile. The loop length distribution, used for the fit in Figure
44, contains no information on the tail segment of the polymer.
The above discussion used DeGennes scaling theory in order to gain information
on an adsorbed polymer’s conformation. Scaling theory has received a large amount
of attention for predicting polymer conformations[108, 241]. However, it was men-
tioned previously, in the literature review, that scaling theory can not be used to
determine actual polymer conformations. Because it only describes the concentration
profile of an adsorbed polymer at given distances from a surface. There are many
possible conformations which could give the same concentration profile making the
deconvolution of the theoretical predictions extremely difficult. In this work, the
results fit to scaling theory are only included for comparison to previous work.
5.3.2 Movement on Surface
Following adsorption on a surface, a polymer is still capable of moving around on the
surface or even desorbing. This process has been referred to, in the past, as relaxation
90
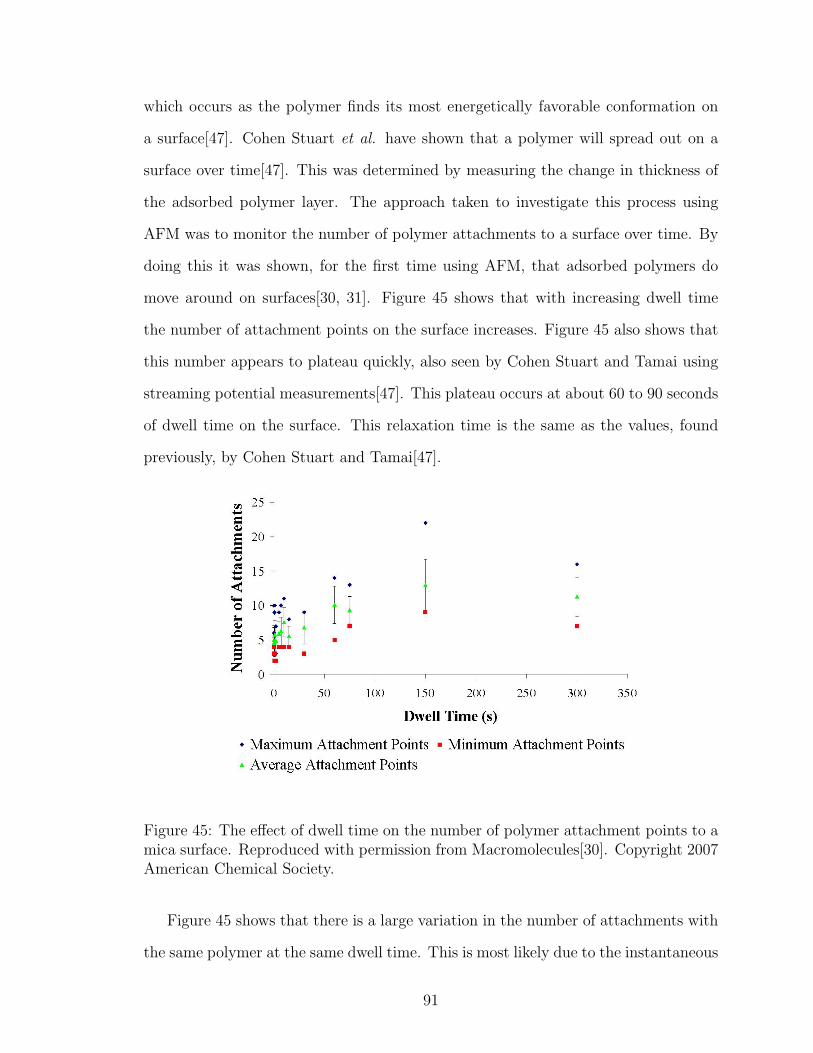
which occurs as the polymer finds its most energetically favorable conformation on
a surface[47]. Cohen Stuart et al. have shown that a polymer will spread out on a
surface over time[47]. This was determined by measuring the change in thickness of
the adsorbed polymer layer. The approach taken to investigate this process using
AFM was to monitor the number of polymer attachments to a surface over time. By
doing this it was shown, for the first time using AFM, that adsorbed polymers do
move around on surfaces[30, 31]. Figure 45 shows that with increasing dwell time
the number of attachment points on the surface increases. Figure 45 also shows that
this number appears to plateau quickly, also seen by Cohen Stuart and Tamai using
streaming potential measurements[47]. This plateau occurs at about 60 to 90 seconds
of dwell time on the surface. This relaxation time is the same as the values, found
previously, by Cohen Stuart and Tamai[47].
Figure 45: The effect of dwell time on the number of polymer attachment points to amica surface. Reproduced with permission from Macromolecules[30]. Copyright 2007American Chemical Society.
Figure 45 shows that there is a large variation in the number of attachments with
the same polymer at the same dwell time. This is most likely due to the instantaneous
91
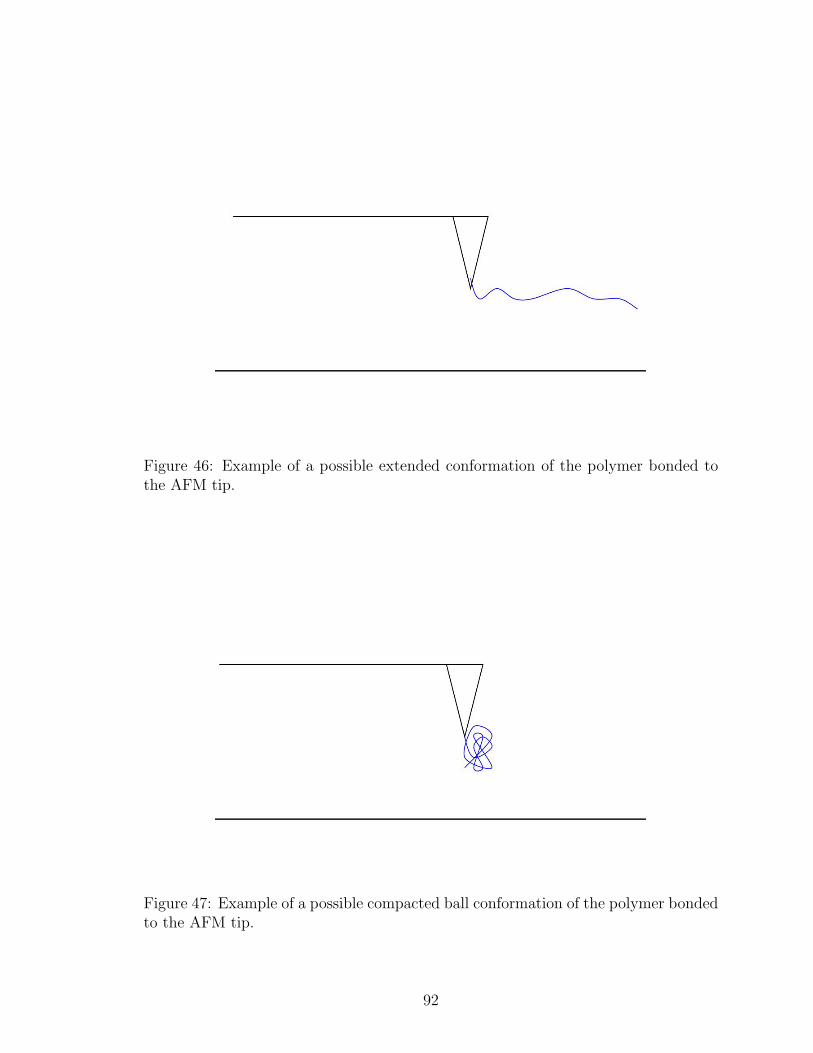
Figure 46: Example of a possible extended conformation of the polymer bonded tothe AFM tip.
Figure 47: Example of a possible compacted ball conformation of the polymer bondedto the AFM tip.
92
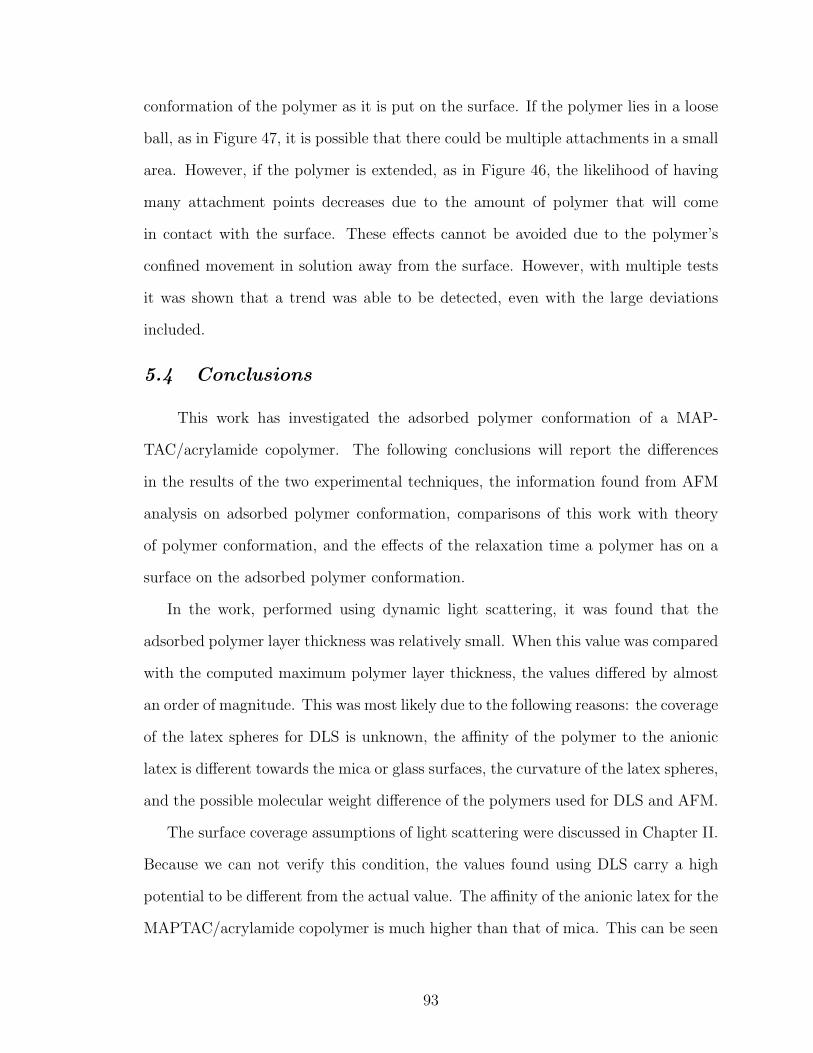
conformation of the polymer as it is put on the surface. If the polymer lies in a loose
ball, as in Figure 47, it is possible that there could be multiple attachments in a small
area. However, if the polymer is extended, as in Figure 46, the likelihood of having
many attachment points decreases due to the amount of polymer that will come
in contact with the surface. These effects cannot be avoided due to the polymer’s
confined movement in solution away from the surface. However, with multiple tests
it was shown that a trend was able to be detected, even with the large deviations
included.
5.4 Conclusions
This work has investigated the adsorbed polymer conformation of a MAP-
TAC/acrylamide copolymer. The following conclusions will report the differences
in the results of the two experimental techniques, the information found from AFM
analysis on adsorbed polymer conformation, comparisons of this work with theory
of polymer conformation, and the effects of the relaxation time a polymer has on a
surface on the adsorbed polymer conformation.
In the work, performed using dynamic light scattering, it was found that the
adsorbed polymer layer thickness was relatively small. When this value was compared
with the computed maximum polymer layer thickness, the values differed by almost
an order of magnitude. This was most likely due to the following reasons: the coverage
of the latex spheres for DLS is unknown, the affinity of the polymer to the anionic
latex is different towards the mica or glass surfaces, the curvature of the latex spheres,
and the possible molecular weight difference of the polymers used for DLS and AFM.
The surface coverage assumptions of light scattering were discussed in Chapter II.
Because we can not verify this condition, the values found using DLS carry a high
potential to be different from the actual value. The affinity of the anionic latex for the
MAPTAC/acrylamide copolymer is much higher than that of mica. This can be seen
93
in the higher charge density of the latex surface. This would cause the polymer to
attempt to be attached more closely to the latex than on the lower charge density mica
surface. The effects of curvature of the latex spheres could play a possible role in the
adsorbed polymer conformation. If the curvature is too high, the adsorbed polymers
will be forced to adsorb with fewer attachment points due to the geometry and steric
constraints in the polymer. This could cause changes in the surface coverage and
adsorbed layer thickness.
The final difference, from the two experimental methods, is that of the molecular
weight of the polymers used. It was shown, using GPC, that the DLS polymer is
about half the size of the AFM polymer. However, it was noticed that during AFM
measurements there were very few “short” polymers found during testing. Most of
the polymers tested had minimum chain distances of around 2 or 3µm. The average
calculated chain length was around 4µm, based on the molecular weight. Although
not proved, this work suggests that the longer polymers adsorb preferentially on the
AFM tips. This, as compared with the large variety of polymer sizes in the DLS
polymer, could have an effect.
The use of AFM to determine adsorbed polymer loop lengths, allowed many con-
formational details of an adsorbed polymer’s structure to be used for characteriza-
tion. This study has shown that for a high molecular weight low charge density
MAPTAC/acrylamide copolymer the majority of the loops, from the loop length dis-
tribution, have lengths between 40 and 260nm. However, it is common, although not
statistically abundant, to see much larger loops in the distributions. Because of the
polymer’s random structure, no inference as to the effects of order in the monomeric
units relative to the adsorbed polymer conformation could be drawn. It was found
that there is a significant deviation in loop lengths and the number of attachment
points with the same polymer. This work concludes that this was most likely due
to the ability of the polymer to move freely in solution, while the resulting adsorbed
94
polymer conformation was taken from an instantaneous conformation in solution fol-
lowed by relaxation on the surface.
The relaxation of a single polymer on a surface was, for the first time, proven using
AFM. By analyzing the number of polymer attachment points it was shown that the
polymer attachment points rapidly increase in number until around 60 to 90s. At this
point, the changes in the number of attachments plateaus. The polymer was most
likely still moving around on the surface, but due to energetic and conformational
constraints, it was not expected that the number of attachments should increase.
95
CHAPTER VI
SALT EFFECT ON ADSORBED POLYMER
CONFORMATION
6.1 Overview
The methods of dynamic light scattering and atomic force microscopy will be
used to evaluate how electrolytes, or salt, in solution affects an adsorbed polymer’s
conformation. These experimental results were compared with those found in Chapter
V to verify the conclusions made. This chapter describes many novel techniques to
evaluate adsorbed polymer conformations.
6.2 Dynamic Light Scattering to Determine the Salt Effecton Adsorbed Polymer Conformation
Past literature has shown that increases in the salt concentration, in the medium
surrounding an adsorbed polymer, can increase its hydrodynamic diameter[17, 285].
For this work, this effect was tested using dynamic light scattering. In Chapter
V, it was shown that the average adsorbed MAPTAC/acrylamide copolymer layer
thickness increase was 9.45nm with a standard deviation of 3.56nm. To investigate
the salt effect the same tests were performed in different NaCl solutions. The results
are shown in Figures 48 and 49.
With increasing salt concentration, the adsorbed layer thickness increased to
19.35nm, at 0.001M NaCl, and then to 43.07nm, at 0.01M NaCl. The standard de-
viations of these average values show that these increases are statistically significant,
when all data is averaged. However, as with the previous chapter’s light scattering
results, the variation between test runs was very large, as shown by the standard
deviation bars in Figures 48 and 49. In addition to this variation, the hydrodynamic
96
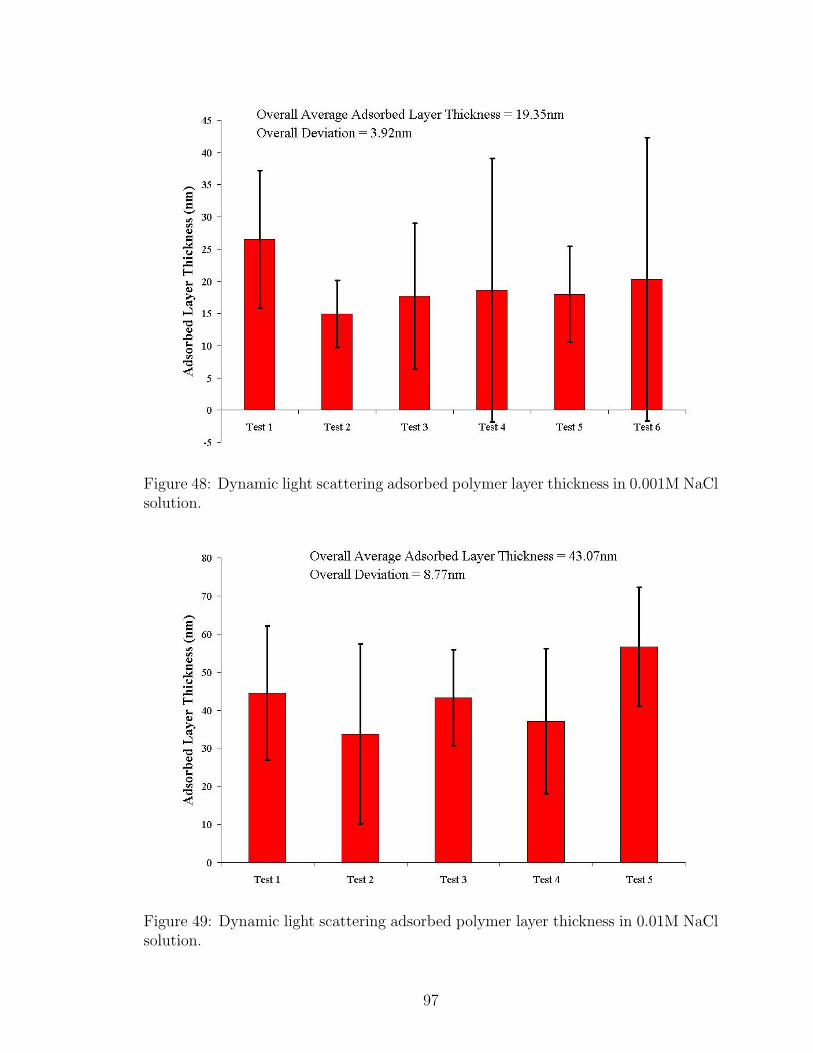
Figure 48: Dynamic light scattering adsorbed polymer layer thickness in 0.001M NaClsolution.
Figure 49: Dynamic light scattering adsorbed polymer layer thickness in 0.01M NaClsolution.
97
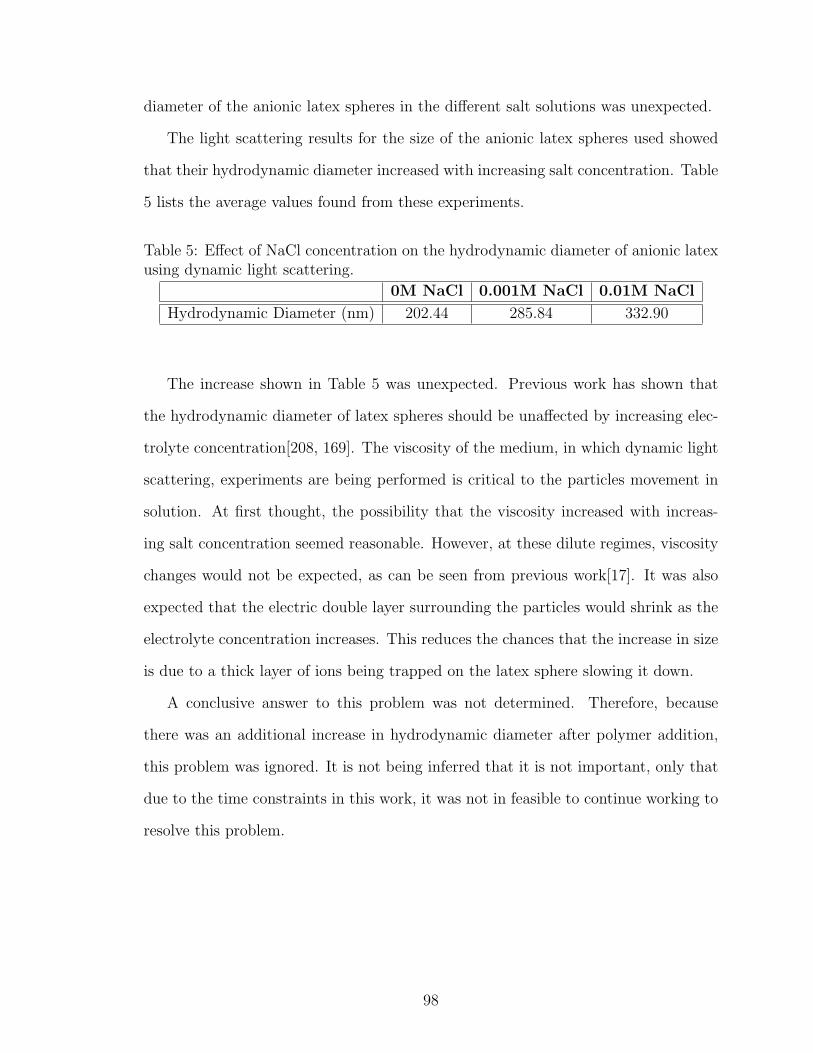
diameter of the anionic latex spheres in the different salt solutions was unexpected.
The light scattering results for the size of the anionic latex spheres used showed
that their hydrodynamic diameter increased with increasing salt concentration. Table
5 lists the average values found from these experiments.
Table 5: Effect of NaCl concentration on the hydrodynamic diameter of anionic latexusing dynamic light scattering.
0M NaCl 0.001M NaCl 0.01M NaCl
Hydrodynamic Diameter (nm) 202.44 285.84 332.90
The increase shown in Table 5 was unexpected. Previous work has shown that
the hydrodynamic diameter of latex spheres should be unaffected by increasing elec-
trolyte concentration[208, 169]. The viscosity of the medium, in which dynamic light
scattering, experiments are being performed is critical to the particles movement in
solution. At first thought, the possibility that the viscosity increased with increas-
ing salt concentration seemed reasonable. However, at these dilute regimes, viscosity
changes would not be expected, as can be seen from previous work[17]. It was also
expected that the electric double layer surrounding the particles would shrink as the
electrolyte concentration increases. This reduces the chances that the increase in size
is due to a thick layer of ions being trapped on the latex sphere slowing it down.
A conclusive answer to this problem was not determined. Therefore, because
there was an additional increase in hydrodynamic diameter after polymer addition,
this problem was ignored. It is not being inferred that it is not important, only that
due to the time constraints in this work, it was not in feasible to continue working to
resolve this problem.
98
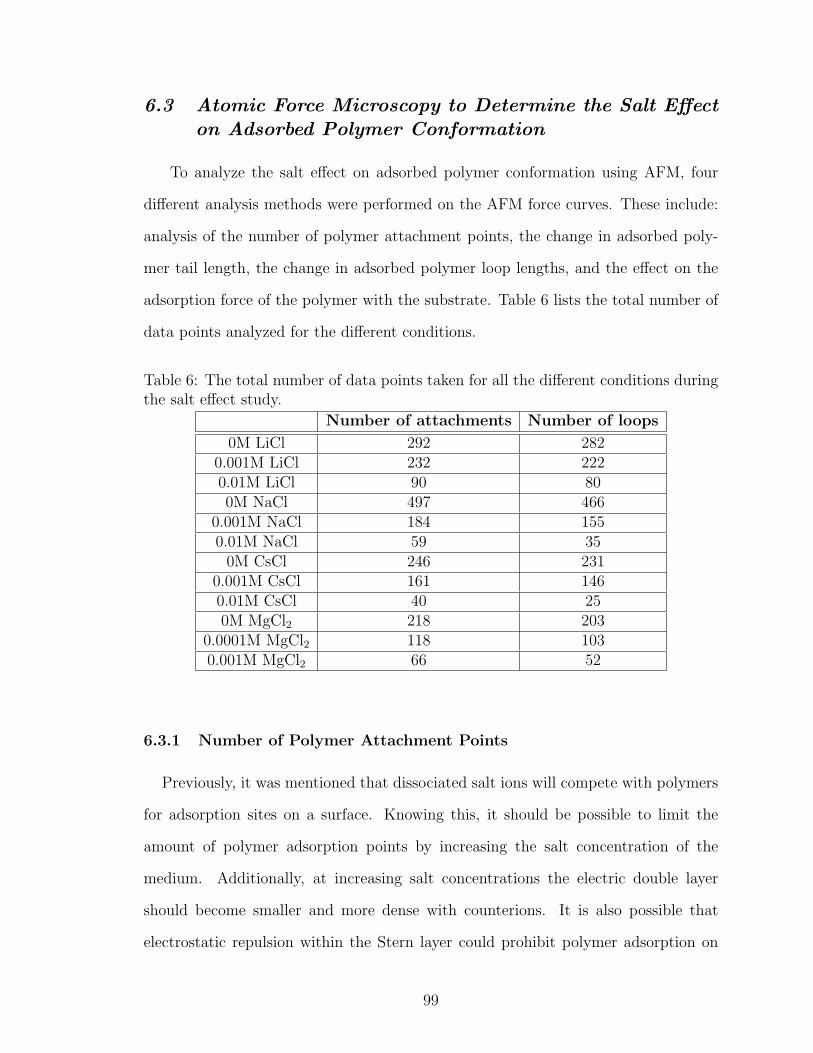
6.3 Atomic Force Microscopy to Determine the Salt Effecton Adsorbed Polymer Conformation
To analyze the salt effect on adsorbed polymer conformation using AFM, four
different analysis methods were performed on the AFM force curves. These include:
analysis of the number of polymer attachment points, the change in adsorbed poly-
mer tail length, the change in adsorbed polymer loop lengths, and the effect on the
adsorption force of the polymer with the substrate. Table 6 lists the total number of
data points analyzed for the different conditions.
Table 6: The total number of data points taken for all the different conditions duringthe salt effect study.
Number of attachments Number of loops
0M LiCl 292 2820.001M LiCl 232 2220.01M LiCl 90 800M NaCl 497 466
0.001M NaCl 184 1550.01M NaCl 59 35
0M CsCl 246 2310.001M CsCl 161 1460.01M CsCl 40 250M MgCl2 218 203
0.0001M MgCl2 118 1030.001M MgCl2 66 52
6.3.1 Number of Polymer Attachment Points
Previously, it was mentioned that dissociated salt ions will compete with polymers
for adsorption sites on a surface. Knowing this, it should be possible to limit the
amount of polymer adsorption points by increasing the salt concentration of the
medium. Additionally, at increasing salt concentrations the electric double layer
should become smaller and more dense with counterions. It is also possible that
electrostatic repulsion within the Stern layer could prohibit polymer adsorption on
99
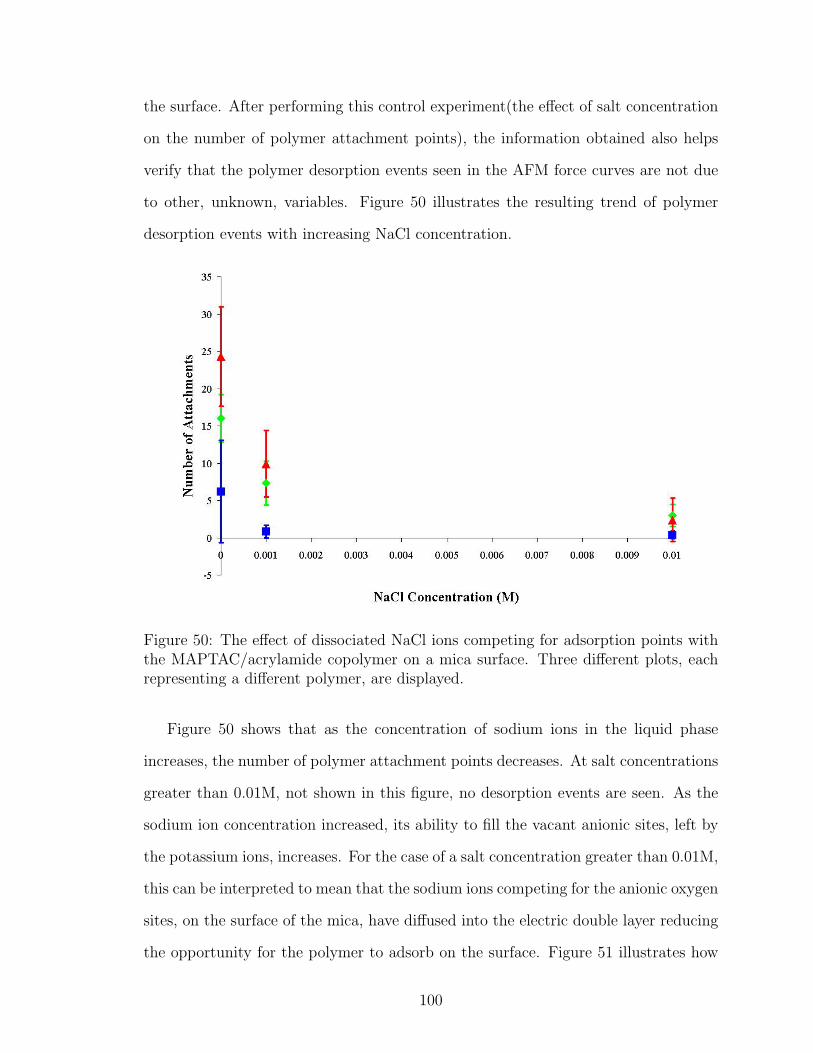
the surface. After performing this control experiment(the effect of salt concentration
on the number of polymer attachment points), the information obtained also helps
verify that the polymer desorption events seen in the AFM force curves are not due
to other, unknown, variables. Figure 50 illustrates the resulting trend of polymer
desorption events with increasing NaCl concentration.
Figure 50: The effect of dissociated NaCl ions competing for adsorption points withthe MAPTAC/acrylamide copolymer on a mica surface. Three different plots, eachrepresenting a different polymer, are displayed.
Figure 50 shows that as the concentration of sodium ions in the liquid phase
increases, the number of polymer attachment points decreases. At salt concentrations
greater than 0.01M, not shown in this figure, no desorption events are seen. As the
sodium ion concentration increased, its ability to fill the vacant anionic sites, left by
the potassium ions, increases. For the case of a salt concentration greater than 0.01M,
this can be interpreted to mean that the sodium ions competing for the anionic oxygen
sites, on the surface of the mica, have diffused into the electric double layer reducing
the opportunity for the polymer to adsorb on the surface. Figure 51 illustrates how
100
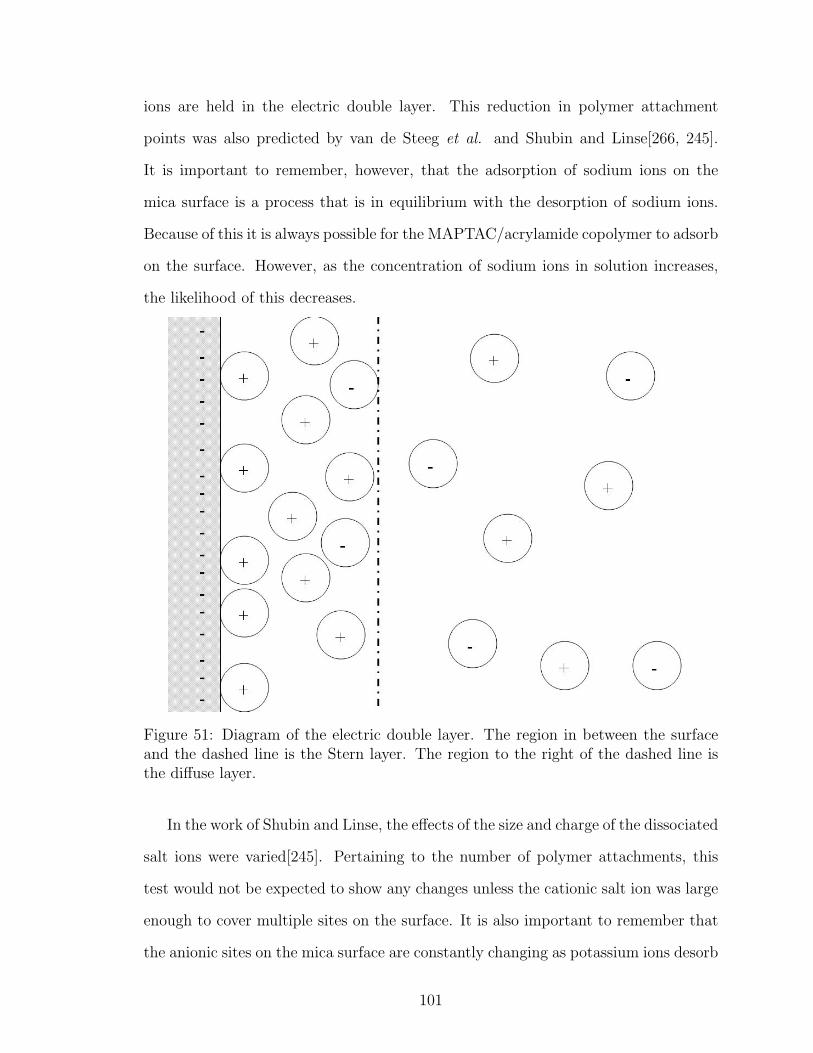
ions are held in the electric double layer. This reduction in polymer attachment
points was also predicted by van de Steeg et al. and Shubin and Linse[266, 245].
It is important to remember, however, that the adsorption of sodium ions on the
mica surface is a process that is in equilibrium with the desorption of sodium ions.
Because of this it is always possible for the MAPTAC/acrylamide copolymer to adsorb
on the surface. However, as the concentration of sodium ions in solution increases,
the likelihood of this decreases.
Figure 51: Diagram of the electric double layer. The region in between the surfaceand the dashed line is the Stern layer. The region to the right of the dashed line isthe diffuse layer.
In the work of Shubin and Linse, the effects of the size and charge of the dissociated
salt ions were varied[245]. Pertaining to the number of polymer attachments, this
test would not be expected to show any changes unless the cationic salt ion was large
enough to cover multiple sites on the surface. It is also important to remember that
the anionic sites on the mica surface are constantly changing as potassium ions desorb
101
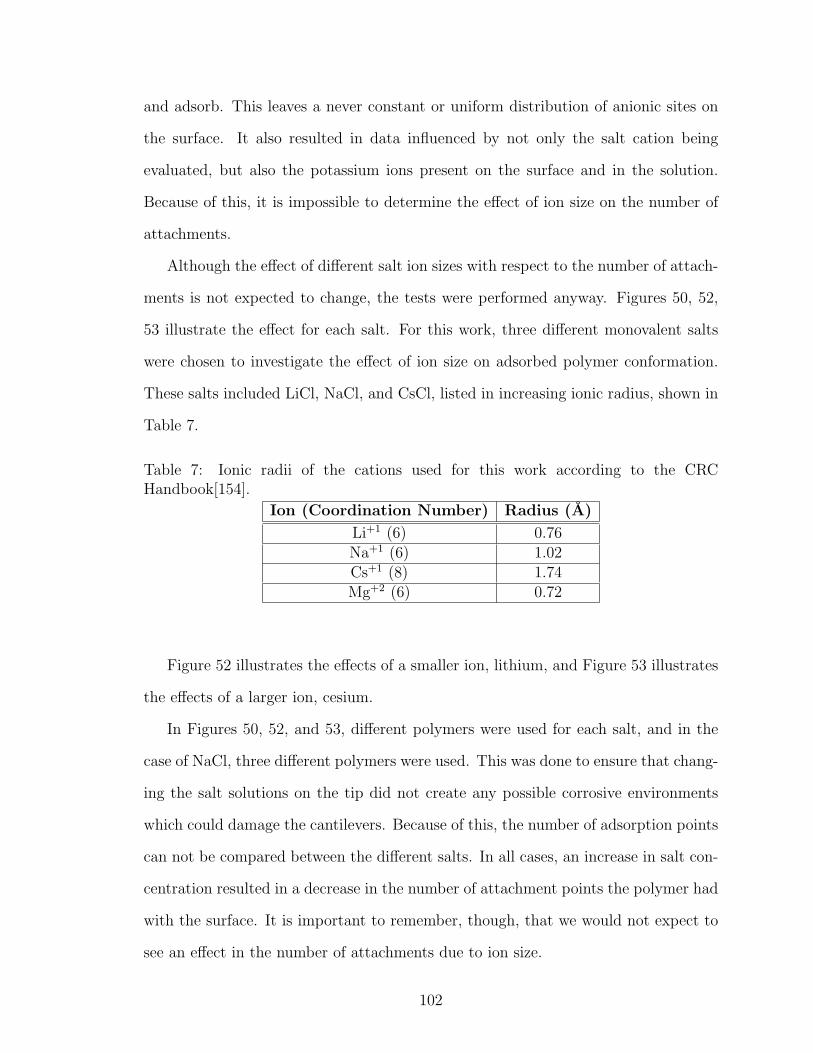
and adsorb. This leaves a never constant or uniform distribution of anionic sites on
the surface. It also resulted in data influenced by not only the salt cation being
evaluated, but also the potassium ions present on the surface and in the solution.
Because of this, it is impossible to determine the effect of ion size on the number of
attachments.
Although the effect of different salt ion sizes with respect to the number of attach-
ments is not expected to change, the tests were performed anyway. Figures 50, 52,
53 illustrate the effect for each salt. For this work, three different monovalent salts
were chosen to investigate the effect of ion size on adsorbed polymer conformation.
These salts included LiCl, NaCl, and CsCl, listed in increasing ionic radius, shown in
Table 7.
Table 7: Ionic radii of the cations used for this work according to the CRCHandbook[154].
Ion (Coordination Number) Radius (A)
Li+1 (6) 0.76Na+1 (6) 1.02Cs+1 (8) 1.74Mg+2 (6) 0.72
Figure 52 illustrates the effects of a smaller ion, lithium, and Figure 53 illustrates
the effects of a larger ion, cesium.
In Figures 50, 52, and 53, different polymers were used for each salt, and in the
case of NaCl, three different polymers were used. This was done to ensure that chang-
ing the salt solutions on the tip did not create any possible corrosive environments
which could damage the cantilevers. Because of this, the number of adsorption points
can not be compared between the different salts. In all cases, an increase in salt con-
centration resulted in a decrease in the number of attachment points the polymer had
with the surface. It is important to remember, though, that we would not expect to
see an effect in the number of attachments due to ion size.
102
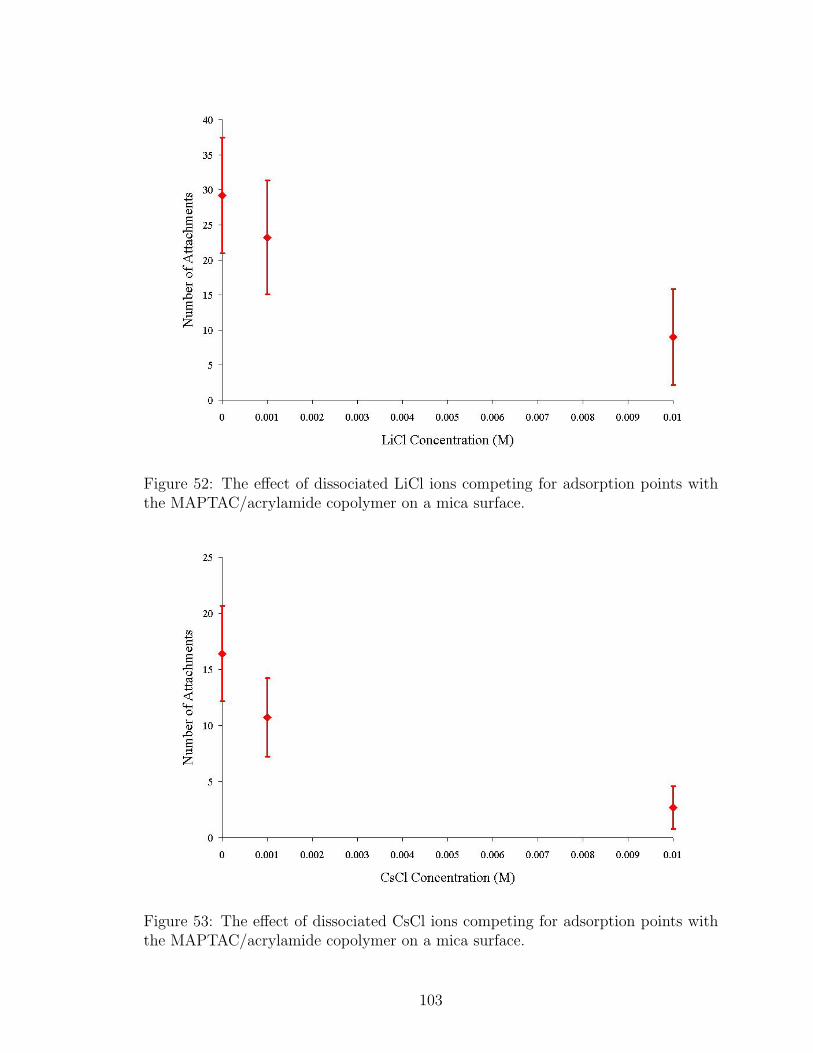
Figure 52: The effect of dissociated LiCl ions competing for adsorption points withthe MAPTAC/acrylamide copolymer on a mica surface.
Figure 53: The effect of dissociated CsCl ions competing for adsorption points withthe MAPTAC/acrylamide copolymer on a mica surface.
103
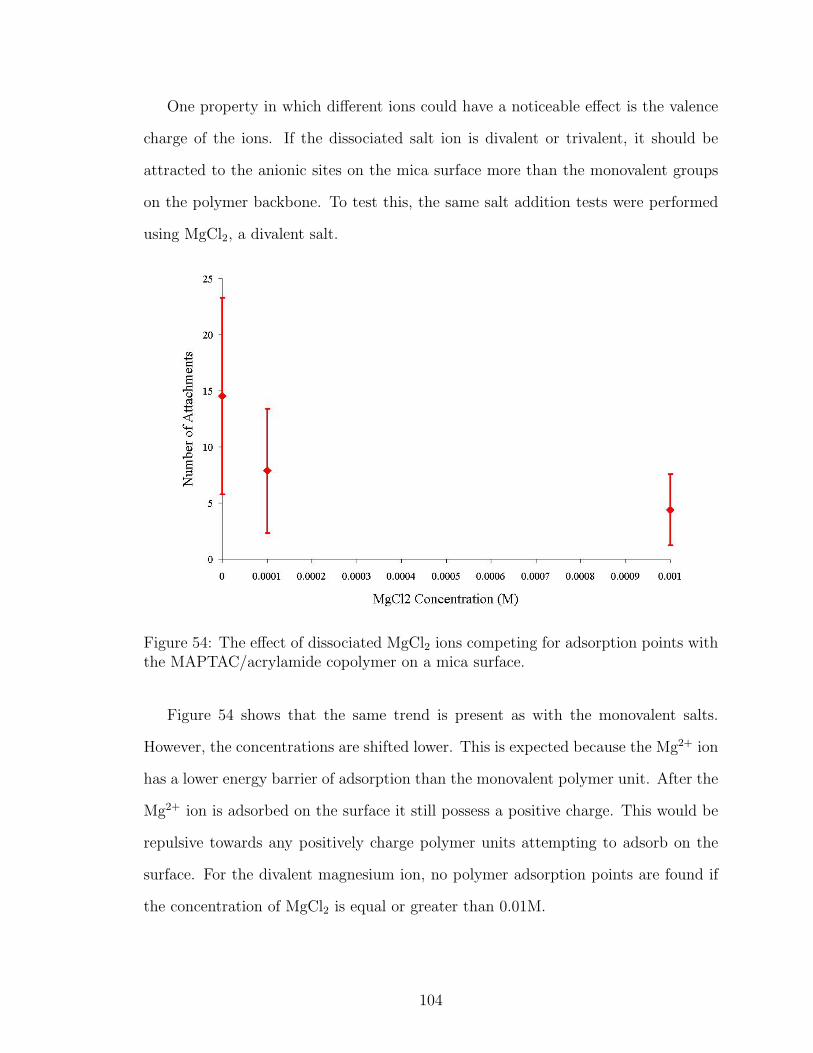
One property in which different ions could have a noticeable effect is the valence
charge of the ions. If the dissociated salt ion is divalent or trivalent, it should be
attracted to the anionic sites on the mica surface more than the monovalent groups
on the polymer backbone. To test this, the same salt addition tests were performed
using MgCl2, a divalent salt.
Figure 54: The effect of dissociated MgCl2 ions competing for adsorption points withthe MAPTAC/acrylamide copolymer on a mica surface.
Figure 54 shows that the same trend is present as with the monovalent salts.
However, the concentrations are shifted lower. This is expected because the Mg2+ ion
has a lower energy barrier of adsorption than the monovalent polymer unit. After the
Mg2+ ion is adsorbed on the surface it still possess a positive charge. This would be
repulsive towards any positively charge polymer units attempting to adsorb on the
surface. For the divalent magnesium ion, no polymer adsorption points are found if
the concentration of MgCl2 is equal or greater than 0.01M.
104
6.3.2 Polymer Tail Length
The second aspect of adsorbed polymer conformation which will be analyzed,
relative to salt concentration, is the change in adsorbed polymer tail length. Shubin
and Linse predicted that increases in salt concentration would also increase the length
of adsorbed polymer tails[245]. The work of Bauer et al., under the assumption
of Nelson et al., supports this theory that the tail length increases with increasing
salt concentration[17, 179]. However, no research, to date, has been able to infer
information on the length of adsorbed polymer tails, not to mention the effect of salt
concentration on this, using atomic force microscopy.
Due to the design of many AFM “pulling” experiments, there is no method to
determine the exact length of the tail portion of the polymer, not attached to the tip.
This research, for the first time, has shown that even without a direct measurement
of a polymer’s tail length, conclusive information regarding the length of the free tail
portion of a polymer can be determined. Because the AFM method used for this work
has been shown to most likely leave a single adsorbed polymer on an AFM tip, it is
possible to investigate changes in the free tail portion of the polymer in its adsorbed
conformation. The other advantage of this technique is the knowledge that only one
terminal end of the polymer being analyzed is attached to the tip and the rest of the
polymer is free.
By testing the same polymer on an AFM tip under different conditions on the same
substrate, this research could directly measure changes in the adsorbed polymer’s
free tail length. Because of the aspects of this experimental technique, mentioned
previously, the distance from the point where the tip is removed from the surface
during retraction and the last desorption point on the AFM force curves obtained,
represents the straight chain length of the polymer that is involved in all of the loops
on the surface plus the constrained tail covalently bonded to the tip. Figures 55 and
56 illustrate how this could be done.
105
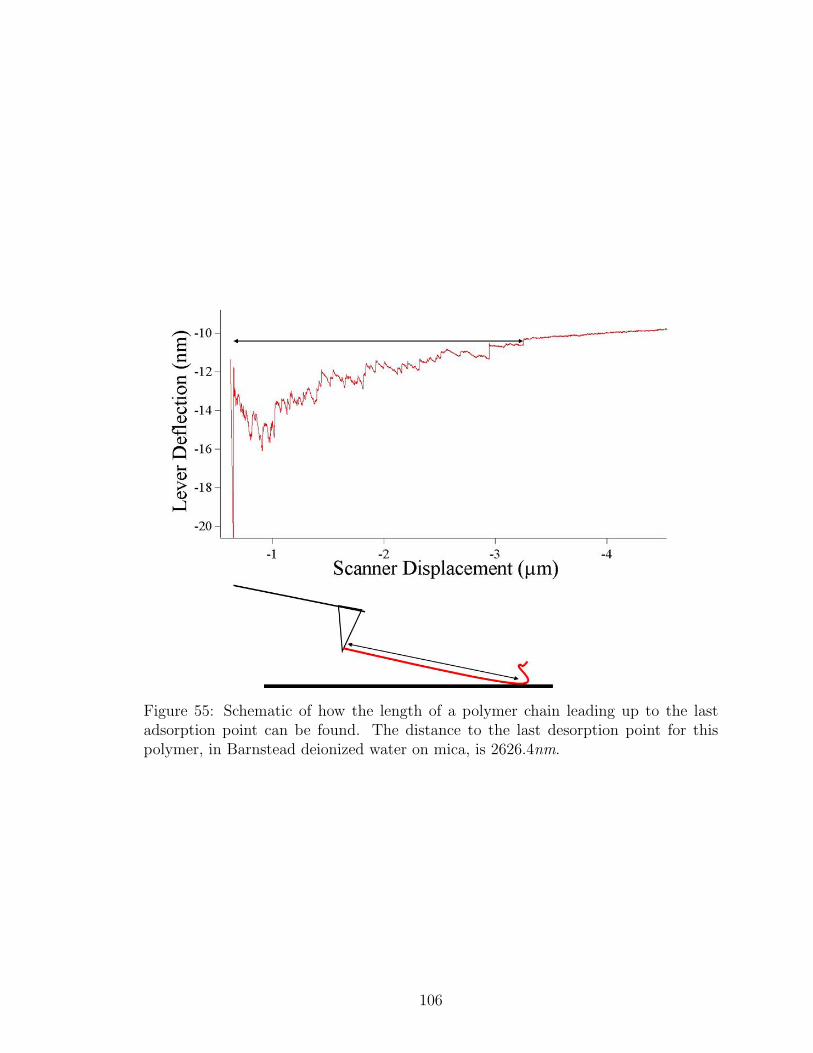
Figure 55: Schematic of how the length of a polymer chain leading up to the lastadsorption point can be found. The distance to the last desorption point for thispolymer, in Barnstead deionized water on mica, is 2626.4nm.
106
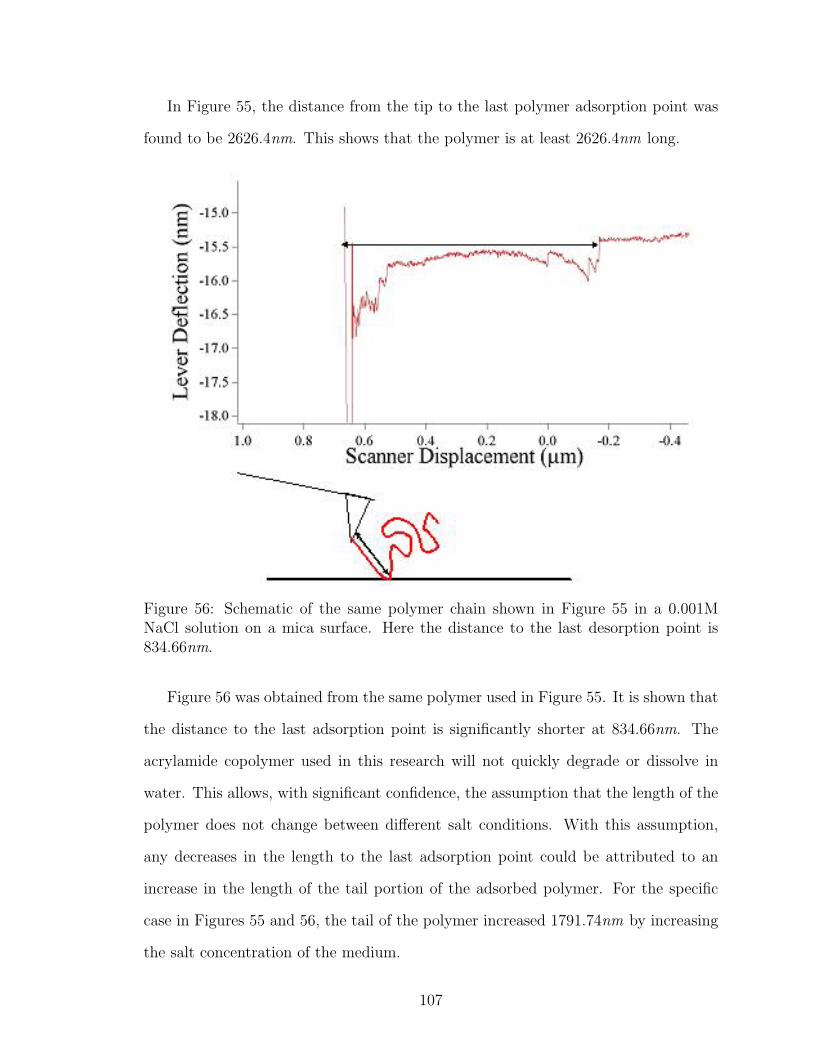
In Figure 55, the distance from the tip to the last polymer adsorption point was
found to be 2626.4nm. This shows that the polymer is at least 2626.4nm long.
Figure 56: Schematic of the same polymer chain shown in Figure 55 in a 0.001MNaCl solution on a mica surface. Here the distance to the last desorption point is834.66nm.
Figure 56 was obtained from the same polymer used in Figure 55. It is shown that
the distance to the last adsorption point is significantly shorter at 834.66nm. The
acrylamide copolymer used in this research will not quickly degrade or dissolve in
water. This allows, with significant confidence, the assumption that the length of the
polymer does not change between different salt conditions. With this assumption,
any decreases in the length to the last adsorption point could be attributed to an
increase in the length of the tail portion of the adsorbed polymer. For the specific
case in Figures 55 and 56, the tail of the polymer increased 1791.74nm by increasing
the salt concentration of the medium.
107
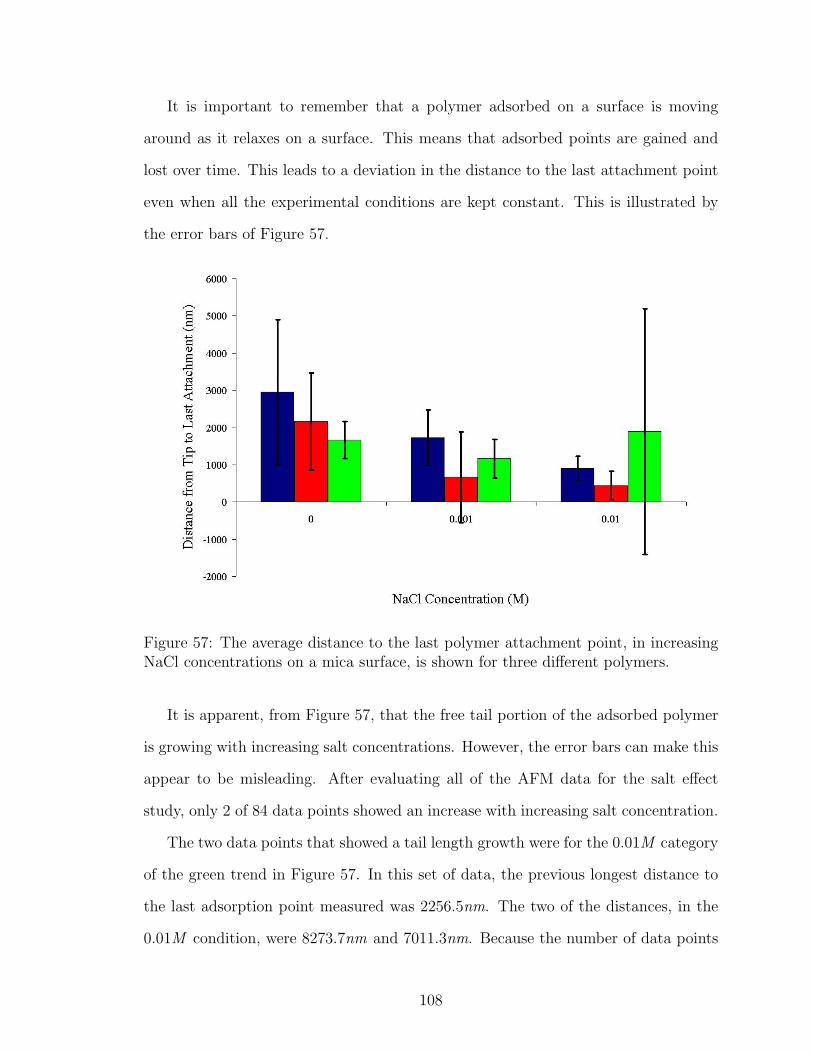
It is important to remember that a polymer adsorbed on a surface is moving
around as it relaxes on a surface. This means that adsorbed points are gained and
lost over time. This leads to a deviation in the distance to the last attachment point
even when all the experimental conditions are kept constant. This is illustrated by
the error bars of Figure 57.
Figure 57: The average distance to the last polymer attachment point, in increasingNaCl concentrations on a mica surface, is shown for three different polymers.
It is apparent, from Figure 57, that the free tail portion of the adsorbed polymer
is growing with increasing salt concentrations. However, the error bars can make this
appear to be misleading. After evaluating all of the AFM data for the salt effect
study, only 2 of 84 data points showed an increase with increasing salt concentration.
The two data points that showed a tail length growth were for the 0.01M category
of the green trend in Figure 57. In this set of data, the previous longest distance to
the last adsorption point measured was 2256.5nm. The two of the distances, in the
0.01M condition, were 8273.7nm and 7011.3nm. Because the number of data points
108
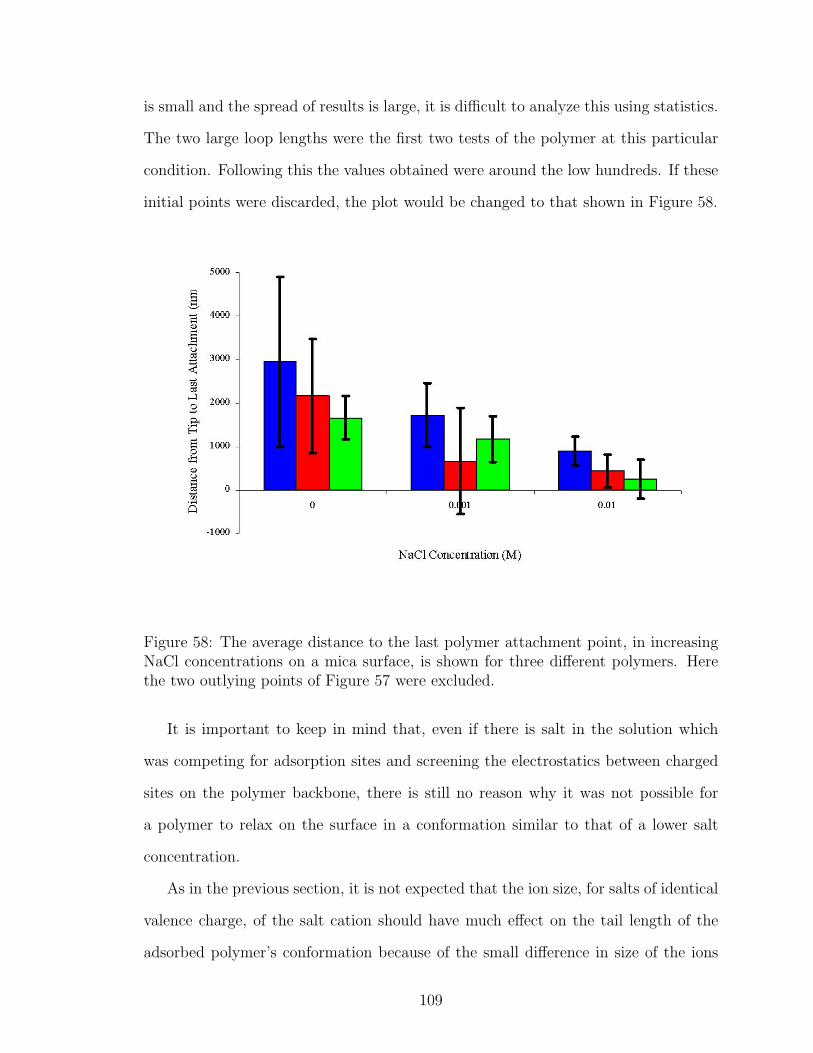
is small and the spread of results is large, it is difficult to analyze this using statistics.
The two large loop lengths were the first two tests of the polymer at this particular
condition. Following this the values obtained were around the low hundreds. If these
initial points were discarded, the plot would be changed to that shown in Figure 58.
Figure 58: The average distance to the last polymer attachment point, in increasingNaCl concentrations on a mica surface, is shown for three different polymers. Herethe two outlying points of Figure 57 were excluded.
It is important to keep in mind that, even if there is salt in the solution which
was competing for adsorption sites and screening the electrostatics between charged
sites on the polymer backbone, there is still no reason why it was not possible for
a polymer to relax on the surface in a conformation similar to that of a lower salt
concentration.
As in the previous section, it is not expected that the ion size, for salts of identical
valence charge, of the salt cation should have much effect on the tail length of the
adsorbed polymer’s conformation because of the small difference in size of the ions
109
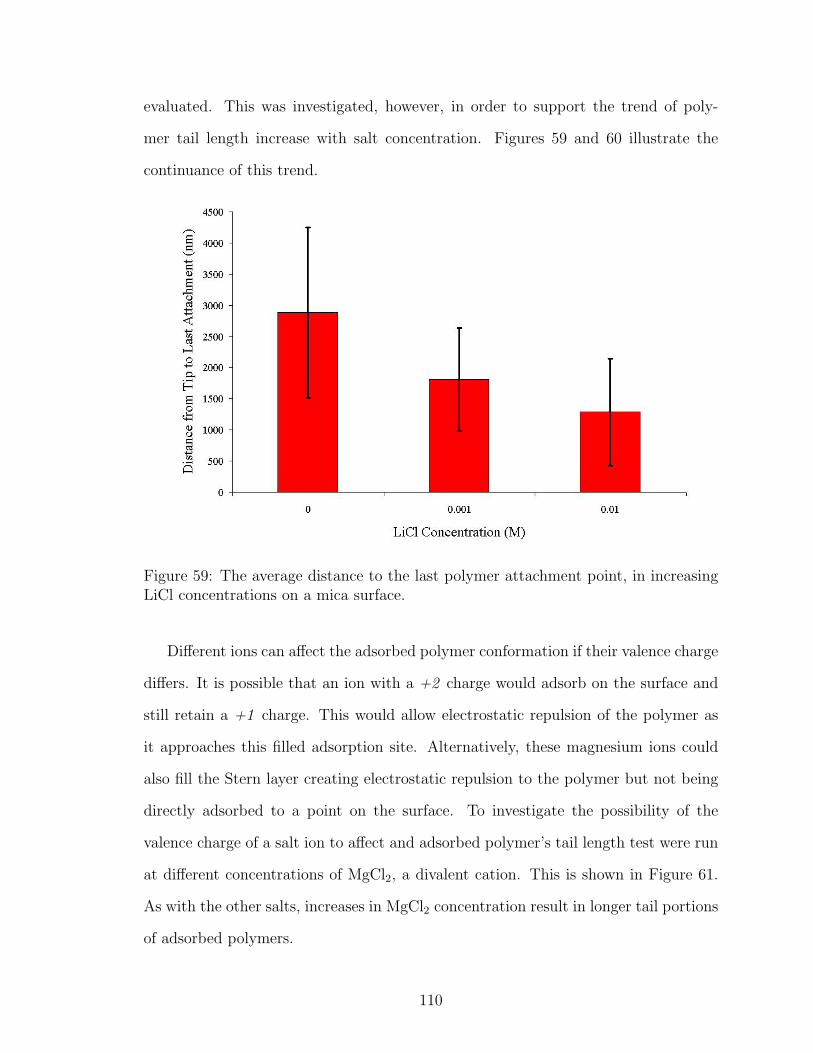
evaluated. This was investigated, however, in order to support the trend of poly-
mer tail length increase with salt concentration. Figures 59 and 60 illustrate the
continuance of this trend.
Figure 59: The average distance to the last polymer attachment point, in increasingLiCl concentrations on a mica surface.
Different ions can affect the adsorbed polymer conformation if their valence charge
differs. It is possible that an ion with a +2 charge would adsorb on the surface and
still retain a +1 charge. This would allow electrostatic repulsion of the polymer as
it approaches this filled adsorption site. Alternatively, these magnesium ions could
also fill the Stern layer creating electrostatic repulsion to the polymer but not being
directly adsorbed to a point on the surface. To investigate the possibility of the
valence charge of a salt ion to affect and adsorbed polymer’s tail length test were run
at different concentrations of MgCl2, a divalent cation. This is shown in Figure 61.
As with the other salts, increases in MgCl2 concentration result in longer tail portions
of adsorbed polymers.
110
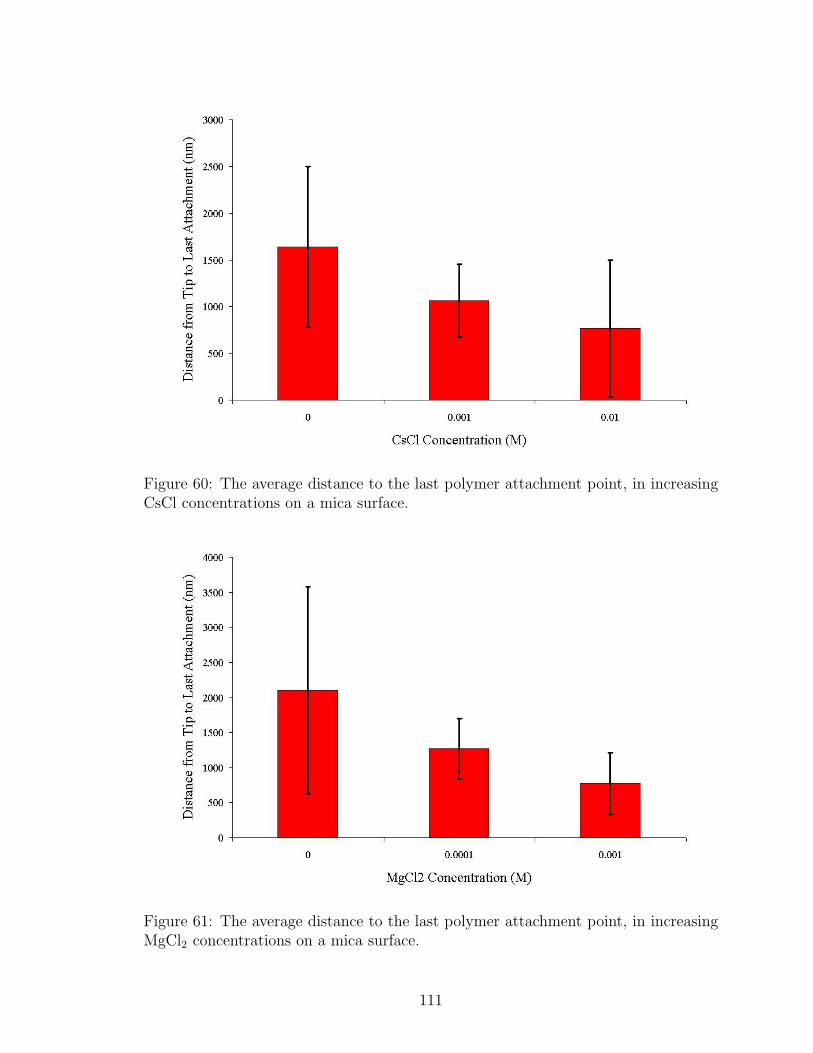
Figure 60: The average distance to the last polymer attachment point, in increasingCsCl concentrations on a mica surface.
Figure 61: The average distance to the last polymer attachment point, in increasingMgCl2 concentrations on a mica surface.
111
The figures, in this section, show that the average tail length of an adsorbed
polymer does increase with increasing salt concentration. However, without the use
of a single polymer, controlled surface, and a preponderance of force curves, an average
tail length growth percentage is meaningless. As cations adsorb and desorb from the
surface, the locations of specific adsorption sites change. As the AFM tip is retracted
and brought back to the surface, the polymer can move through endless conformation
changes, similar to those shown in Figures 46 and 47, thus affecting the adsorbed
polymer conformation. In addition to the conformation of the polymer on the tip,
Douglas et al. have discussed the heterogeneity of the conformations of adsorbed
polymer layers[85]. They have shown that as a polymer adsorbs from solution, it will
constantly change, thereby not allowing the use of equilibrium states for comparison
of conformations[85]. Another problem with using average tail lengths is that the
distribution is predicted to be very broad[234]. While the inability to predict an
average tail length increase is present, the value of these results is still very high.
Prior to this work, no other research has been able to experimentally confirm that
the tail length of an adsorbed polymer increases with increasing salt concentration.
6.3.3 Polymer Loop Length
Adsorbed polymer loop lengths are an important component of an adsorbed
polymer’s conformation. Most theory deals with this portion of an adsorbed poly-
mer’s conformation. However, very little direct evidence of an adsorbed polymer’s
loop lengths has been developed. When analyzing the effect of salt concentration on
adsorbed polymer loop lengths, no direct experimental evidence has been reported.
As in Chapter V, the loop lengths of adsorbed polymers will be compared by in-
vestigating their distribution and the weighted average loop length for each condition.
It is important to note, in these results only the distributions of the same polymer on
the same substrate will be compared due to the possible effects variance in polymer
112
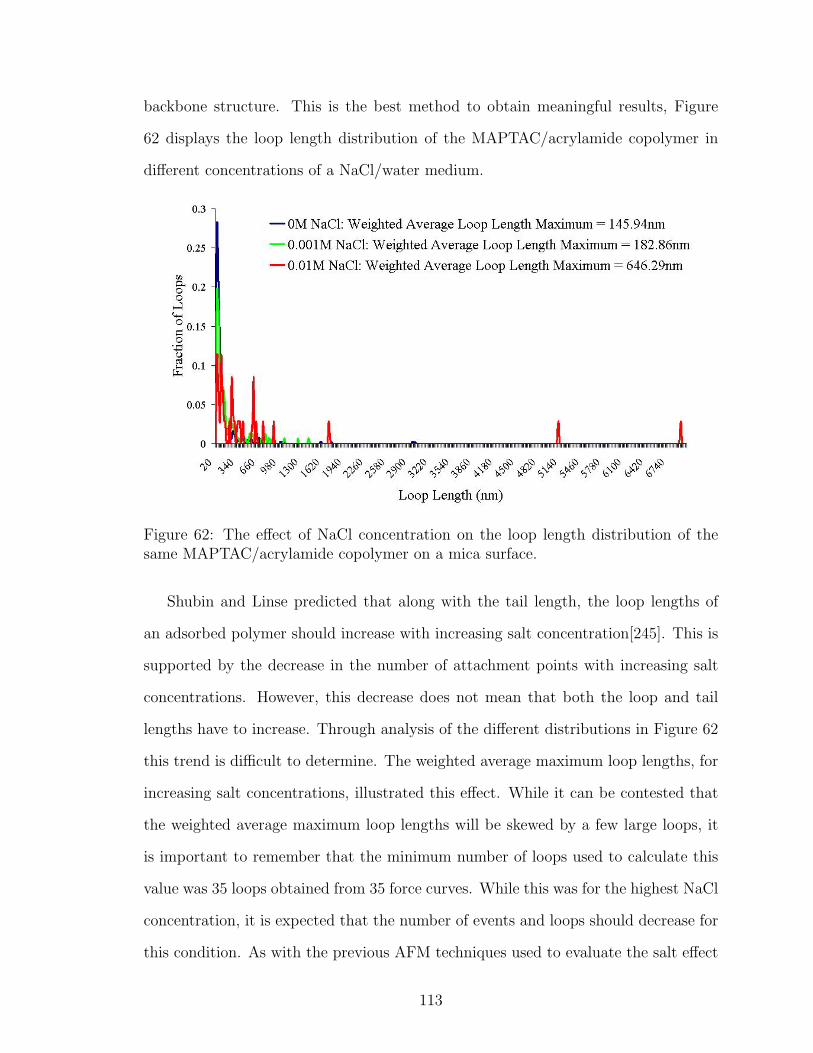
backbone structure. This is the best method to obtain meaningful results, Figure
62 displays the loop length distribution of the MAPTAC/acrylamide copolymer in
different concentrations of a NaCl/water medium.
Figure 62: The effect of NaCl concentration on the loop length distribution of thesame MAPTAC/acrylamide copolymer on a mica surface.
Shubin and Linse predicted that along with the tail length, the loop lengths of
an adsorbed polymer should increase with increasing salt concentration[245]. This is
supported by the decrease in the number of attachment points with increasing salt
concentrations. However, this decrease does not mean that both the loop and tail
lengths have to increase. Through analysis of the different distributions in Figure 62
this trend is difficult to determine. The weighted average maximum loop lengths, for
increasing salt concentrations, illustrated this effect. While it can be contested that
the weighted average maximum loop lengths will be skewed by a few large loops, it
is important to remember that the minimum number of loops used to calculate this
value was 35 loops obtained from 35 force curves. While this was for the highest NaCl
concentration, it is expected that the number of events and loops should decrease for
this condition. As with the previous AFM techniques used to evaluate the salt effect
113
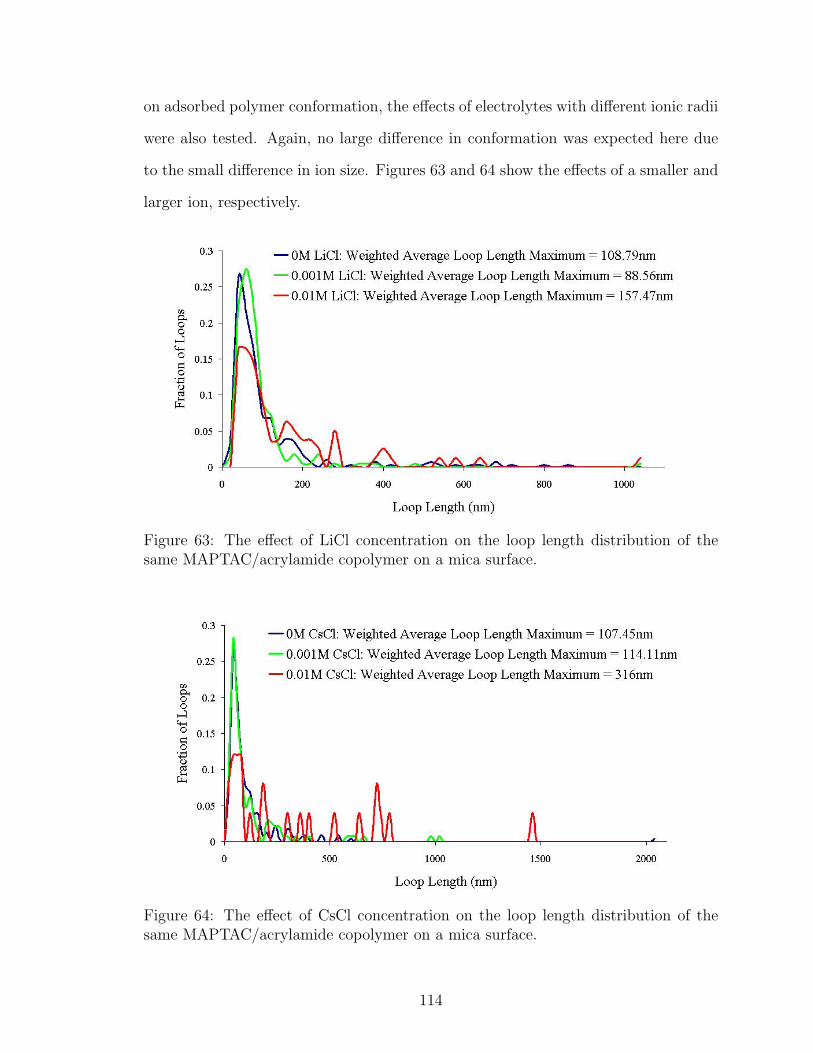
on adsorbed polymer conformation, the effects of electrolytes with different ionic radii
were also tested. Again, no large difference in conformation was expected here due
to the small difference in ion size. Figures 63 and 64 show the effects of a smaller and
larger ion, respectively.
Figure 63: The effect of LiCl concentration on the loop length distribution of thesame MAPTAC/acrylamide copolymer on a mica surface.
Figure 64: The effect of CsCl concentration on the loop length distribution of thesame MAPTAC/acrylamide copolymer on a mica surface.
114
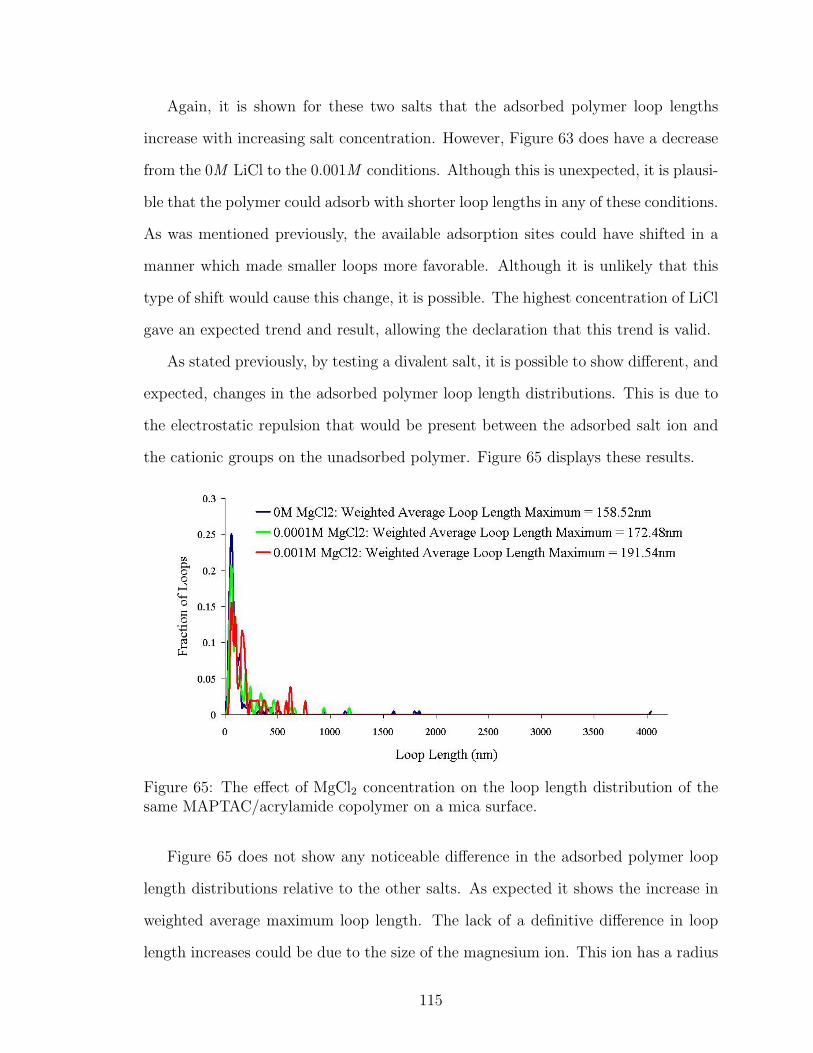
Again, it is shown for these two salts that the adsorbed polymer loop lengths
increase with increasing salt concentration. However, Figure 63 does have a decrease
from the 0M LiCl to the 0.001M conditions. Although this is unexpected, it is plausi-
ble that the polymer could adsorb with shorter loop lengths in any of these conditions.
As was mentioned previously, the available adsorption sites could have shifted in a
manner which made smaller loops more favorable. Although it is unlikely that this
type of shift would cause this change, it is possible. The highest concentration of LiCl
gave an expected trend and result, allowing the declaration that this trend is valid.
As stated previously, by testing a divalent salt, it is possible to show different, and
expected, changes in the adsorbed polymer loop length distributions. This is due to
the electrostatic repulsion that would be present between the adsorbed salt ion and
the cationic groups on the unadsorbed polymer. Figure 65 displays these results.
Figure 65: The effect of MgCl2 concentration on the loop length distribution of thesame MAPTAC/acrylamide copolymer on a mica surface.
Figure 65 does not show any noticeable difference in the adsorbed polymer loop
length distributions relative to the other salts. As expected it shows the increase in
weighted average maximum loop length. The lack of a definitive difference in loop
length increases could be due to the size of the magnesium ion. This ion has a radius
115
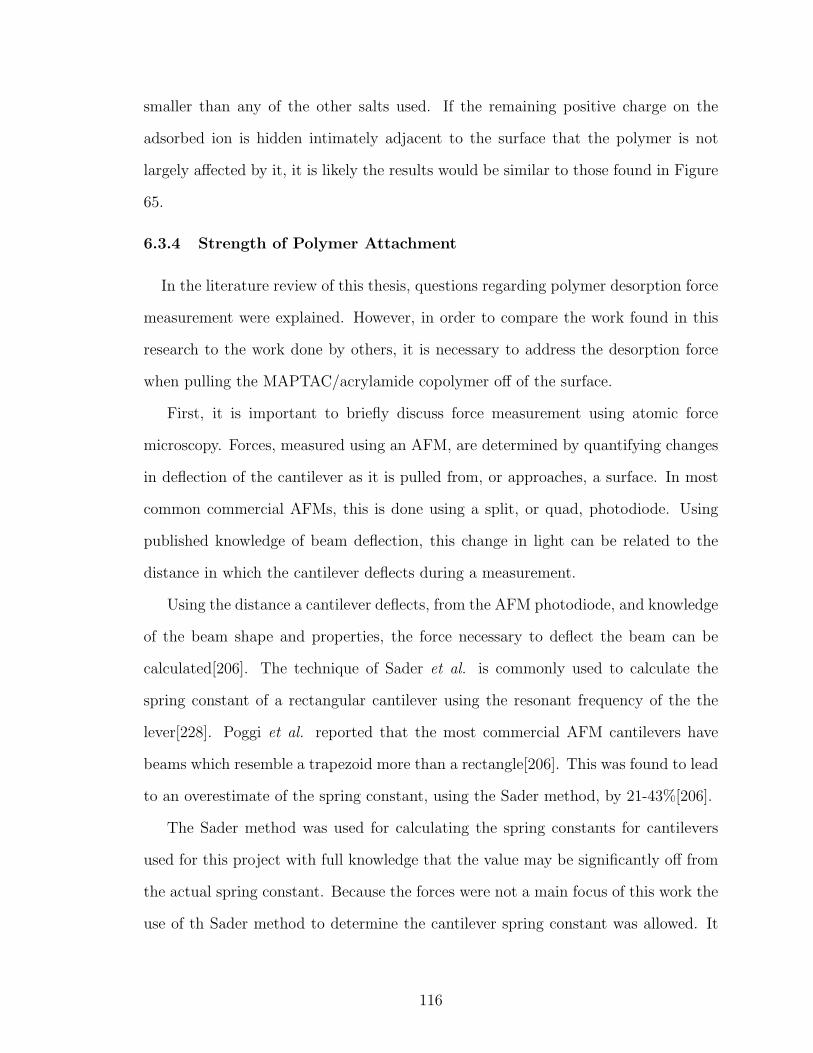
smaller than any of the other salts used. If the remaining positive charge on the
adsorbed ion is hidden intimately adjacent to the surface that the polymer is not
largely affected by it, it is likely the results would be similar to those found in Figure
65.
6.3.4 Strength of Polymer Attachment
In the literature review of this thesis, questions regarding polymer desorption force
measurement were explained. However, in order to compare the work found in this
research to the work done by others, it is necessary to address the desorption force
when pulling the MAPTAC/acrylamide copolymer off of the surface.
First, it is important to briefly discuss force measurement using atomic force
microscopy. Forces, measured using an AFM, are determined by quantifying changes
in deflection of the cantilever as it is pulled from, or approaches, a surface. In most
common commercial AFMs, this is done using a split, or quad, photodiode. Using
published knowledge of beam deflection, this change in light can be related to the
distance in which the cantilever deflects during a measurement.
Using the distance a cantilever deflects, from the AFM photodiode, and knowledge
of the beam shape and properties, the force necessary to deflect the beam can be
calculated[206]. The technique of Sader et al. is commonly used to calculate the
spring constant of a rectangular cantilever using the resonant frequency of the the
lever[228]. Poggi et al. reported that the most commercial AFM cantilevers have
beams which resemble a trapezoid more than a rectangle[206]. This was found to lead
to an overestimate of the spring constant, using the Sader method, by 21-43%[206].
The Sader method was used for calculating the spring constants for cantilevers
used for this project with full knowledge that the value may be significantly off from
the actual spring constant. Because the forces were not a main focus of this work the
use of th Sader method to determine the cantilever spring constant was allowed. It
116
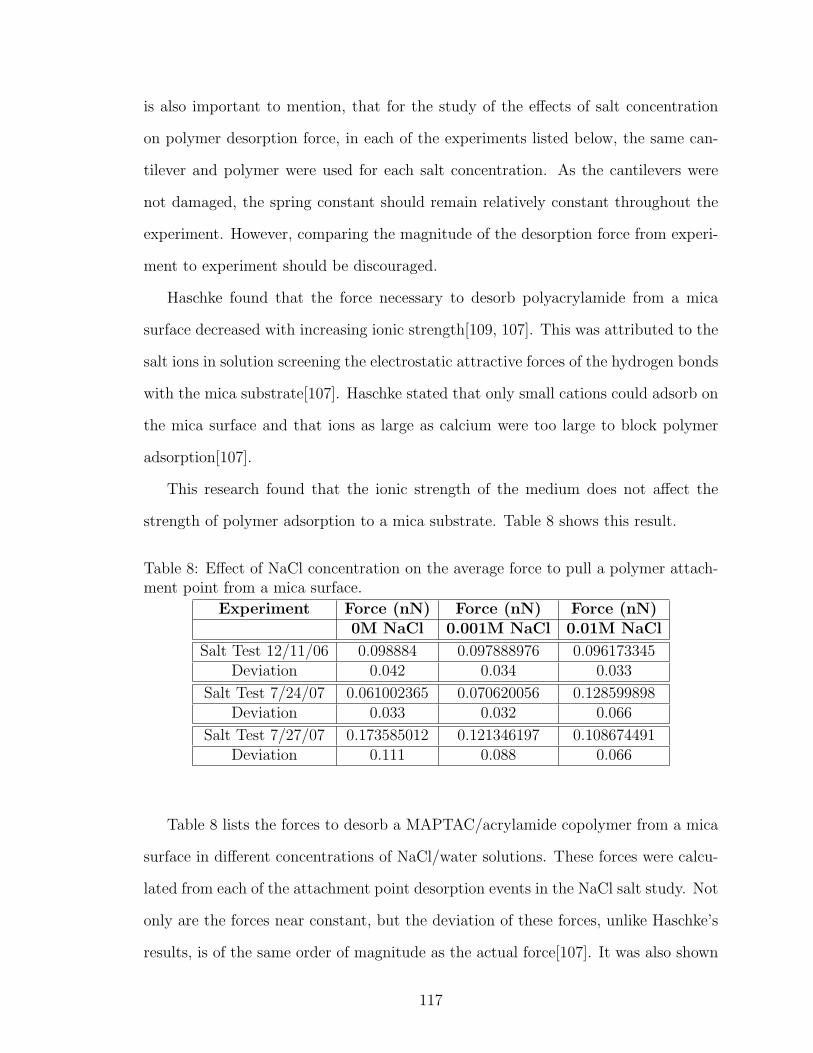
is also important to mention, that for the study of the effects of salt concentration
on polymer desorption force, in each of the experiments listed below, the same can-
tilever and polymer were used for each salt concentration. As the cantilevers were
not damaged, the spring constant should remain relatively constant throughout the
experiment. However, comparing the magnitude of the desorption force from experi-
ment to experiment should be discouraged.
Haschke found that the force necessary to desorb polyacrylamide from a mica
surface decreased with increasing ionic strength[109, 107]. This was attributed to the
salt ions in solution screening the electrostatic attractive forces of the hydrogen bonds
with the mica substrate[107]. Haschke stated that only small cations could adsorb on
the mica surface and that ions as large as calcium were too large to block polymer
adsorption[107].
This research found that the ionic strength of the medium does not affect the
strength of polymer adsorption to a mica substrate. Table 8 shows this result.
Table 8: Effect of NaCl concentration on the average force to pull a polymer attach-ment point from a mica surface.
Experiment Force (nN) Force (nN) Force (nN)0M NaCl 0.001M NaCl 0.01M NaCl
Salt Test 12/11/06 0.098884 0.097888976 0.096173345Deviation 0.042 0.034 0.033
Salt Test 7/24/07 0.061002365 0.070620056 0.128599898Deviation 0.033 0.032 0.066
Salt Test 7/27/07 0.173585012 0.121346197 0.108674491Deviation 0.111 0.088 0.066
Table 8 lists the forces to desorb a MAPTAC/acrylamide copolymer from a mica
surface in different concentrations of NaCl/water solutions. These forces were calcu-
lated from each of the attachment point desorption events in the NaCl salt study. Not
only are the forces near constant, but the deviation of these forces, unlike Haschke’s
results, is of the same order of magnitude as the actual force[107]. It was also shown
117
that the radius of the salt cation did not have an effect on its ability to screen inter-
actions with the mica surface.
The deviation of the results, in Table 8, is most likely due to the angle which the
polymer is being pulled at from the tip, as described in the literature review. These
results show that in these experiments, no evidence of electrostatic screening of the
adsorption force of the MAPTAC/acrylamide copolymer was detected.
6.4 Conclusions
The effect of electrolyte concentration on a low charge density MAPTAC/acrylamide
copolymer has been validated. In the following conclusions, the effect of salt concen-
tration on the number of polymer attachment points, changes in adsorbed polymer
tail length, changes in adsorbed polymer loop lengths, and the effect on adsorbed
polymer attachment force will be discussed.
Similar to much of the published literature, it was found in this study that in-
creasing salt concentration will decrease the number of attachment points a polymer
has with a surface. Although this does not directly correlate to the adsorbed amount
relations found in other research, it does follow the same trend. If more salt is added
to the medium, the dissociated cations will compete with the polymer in solution for
available surface sites. This increased competition will not only decrease the number
of polymers which can be adsorbed, but will also decrease the number of attachment
points each polymer has. In this research project, for the first time, this effect was
seen on a single polymer.
The work of Shubin and Linse proposed a theory for adsorbed polymer confor-
mation, predicting longer loop and tail lengths in increasing salt concentrations[245].
This prediction has never before been directly proven, experimentally. The results de-
scribed above, illustrate a clear trend of increasing adsorbed polymer tail lengths with
increasing salt concentration. Although there is a significant deviation around each
118
average value, this would be expected for the same reasons described in the previous
chapter, and the results show what would be expected if an increase in tail length
occurred. This information is extremely important for polymers used in industrial
settings in which high salt concentrations are present. Using this information, the
design of polymers can be tailored to give the best results in high electrolyte settings.
Similar to the evidence of increasing adsorbed polymer tail lengths, these AFM
tests also confirmed an increase in the average loop lengths of an adsorbed polymer
with increasing salt concentration. This again, was the first experimental proof of
this theory. It was shown that neither the size of the salt cation or the valency of
its charge have a significant effect on the loop length distribution. Divalent salts, as
expected, show the same results as monovalent salts at lower salt concentrations. It
is important to note, the increases in adsorbed polymer layer thickness appear to be
due primarily to the increase in adsorbed polymer tail length, not the slight increase
in the average loop lengths.
Contrary to previous AFM results, this research found no change in the force of
desorption for an adsorbed polymer chain with increasing salt concentration. This
is proposed to be mainly due to the geometric constraints put on the force mea-
surements. However, this research has shown no reason to believe that the salt con-
centration would affect the strength of adsorption points. The problems associated
with force spectroscopy are likely to have resulted in the changes in force found by
Haschke[107].
119
CHAPTER VII
SITE BLOCKING EFFECT ON ADSORBED POLYMER
CONFORMATION
7.1 Overview
For this work, two blocking additives were investigated: PDADMAC and cationic
nanosilica. The effect of these additives on the hydrodynamic diameter, adsorbed
polymer loop lengths, and adsorbed polymer tail length are discussed in the following
sections.
7.2 Dynamic Light Scattering to Determine the Effect SiteBlocking on Adsorbed Polymer Conformation
Dynamic light scattering was used to determine increases in the hydrodynamic
diameter of particles in the small amount of previous literature which investigated
the effect of site blocking additives on adsorbed polymer conformation[19, 20]. For
this work, the same approach was taken and the results are presented below, divided
by blocking additive.
7.2.1 PDADMAC
PDADMAC, a commonly used site blocking additive, is a high charge density
cationic polymer. It is expected that this polymer will adsorb on the anionic latex
surfaces in small patches. These patches should hinder the MAPTAC/acrylamide
copolymer from adsorbing on top of, or intimately adjacent to, the PDADMAC
patches. This effect is then expected to increase the adsorbed polymer layer thickness
more than the increase from just adding a polymer. These results were found and
illustrated in Figure 66.
120
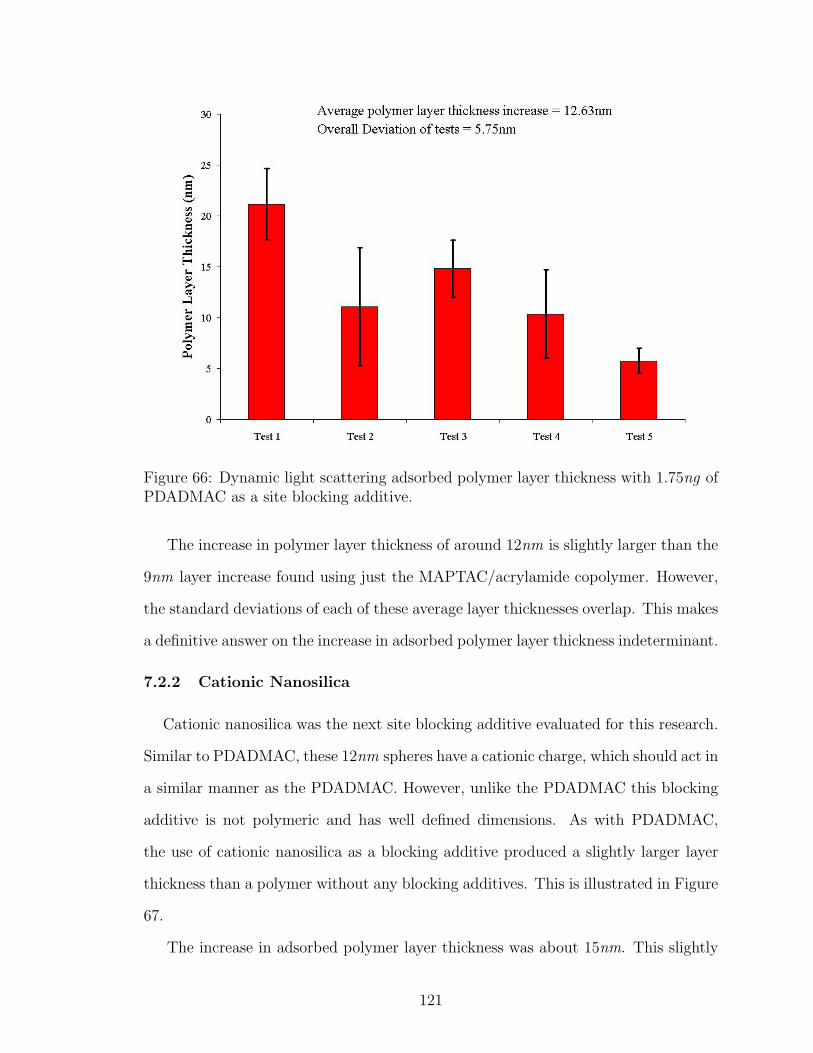
Figure 66: Dynamic light scattering adsorbed polymer layer thickness with 1.75ng ofPDADMAC as a site blocking additive.
The increase in polymer layer thickness of around 12nm is slightly larger than the
9nm layer increase found using just the MAPTAC/acrylamide copolymer. However,
the standard deviations of each of these average layer thicknesses overlap. This makes
a definitive answer on the increase in adsorbed polymer layer thickness indeterminant.
7.2.2 Cationic Nanosilica
Cationic nanosilica was the next site blocking additive evaluated for this research.
Similar to PDADMAC, these 12nm spheres have a cationic charge, which should act in
a similar manner as the PDADMAC. However, unlike the PDADMAC this blocking
additive is not polymeric and has well defined dimensions. As with PDADMAC,
the use of cationic nanosilica as a blocking additive produced a slightly larger layer
thickness than a polymer without any blocking additives. This is illustrated in Figure
67.
The increase in adsorbed polymer layer thickness was about 15nm. This slightly
121
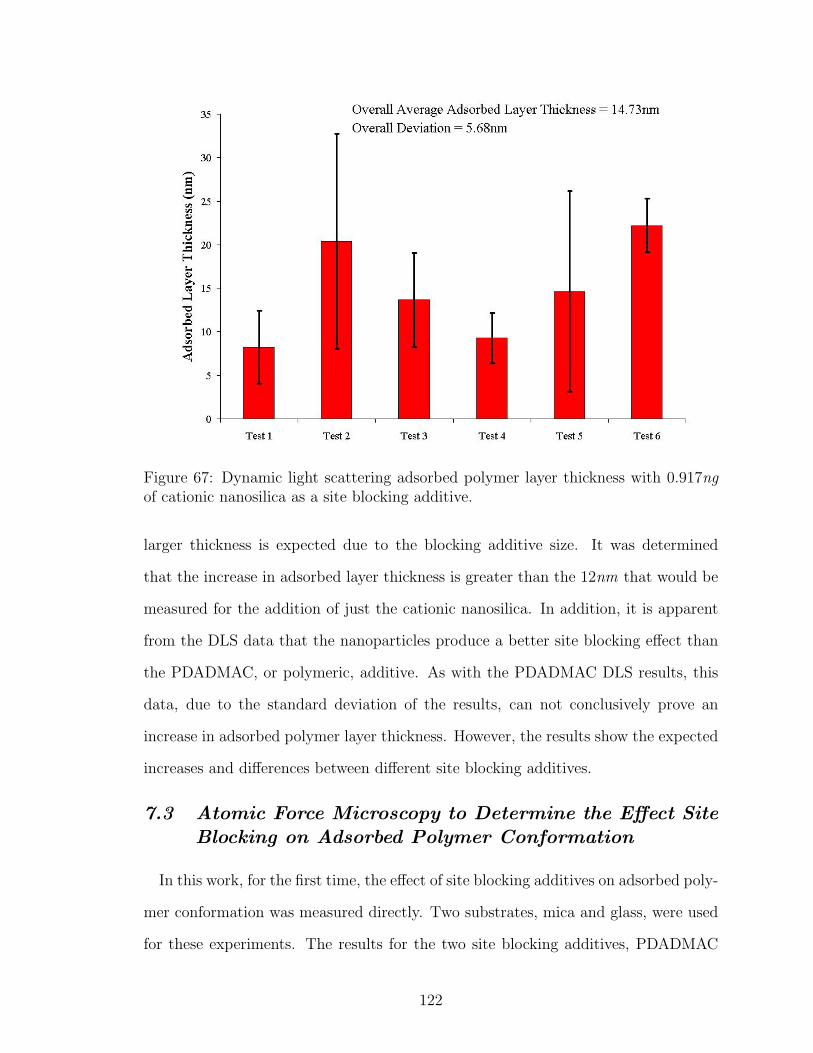
Figure 67: Dynamic light scattering adsorbed polymer layer thickness with 0.917ngof cationic nanosilica as a site blocking additive.
larger thickness is expected due to the blocking additive size. It was determined
that the increase in adsorbed layer thickness is greater than the 12nm that would be
measured for the addition of just the cationic nanosilica. In addition, it is apparent
from the DLS data that the nanoparticles produce a better site blocking effect than
the PDADMAC, or polymeric, additive. As with the PDADMAC DLS results, this
data, due to the standard deviation of the results, can not conclusively prove an
increase in adsorbed polymer layer thickness. However, the results show the expected
increases and differences between different site blocking additives.
7.3 Atomic Force Microscopy to Determine the Effect SiteBlocking on Adsorbed Polymer Conformation
In this work, for the first time, the effect of site blocking additives on adsorbed poly-
mer conformation was measured directly. Two substrates, mica and glass, were used
for these experiments. The results for the two site blocking additives, PDADMAC
122
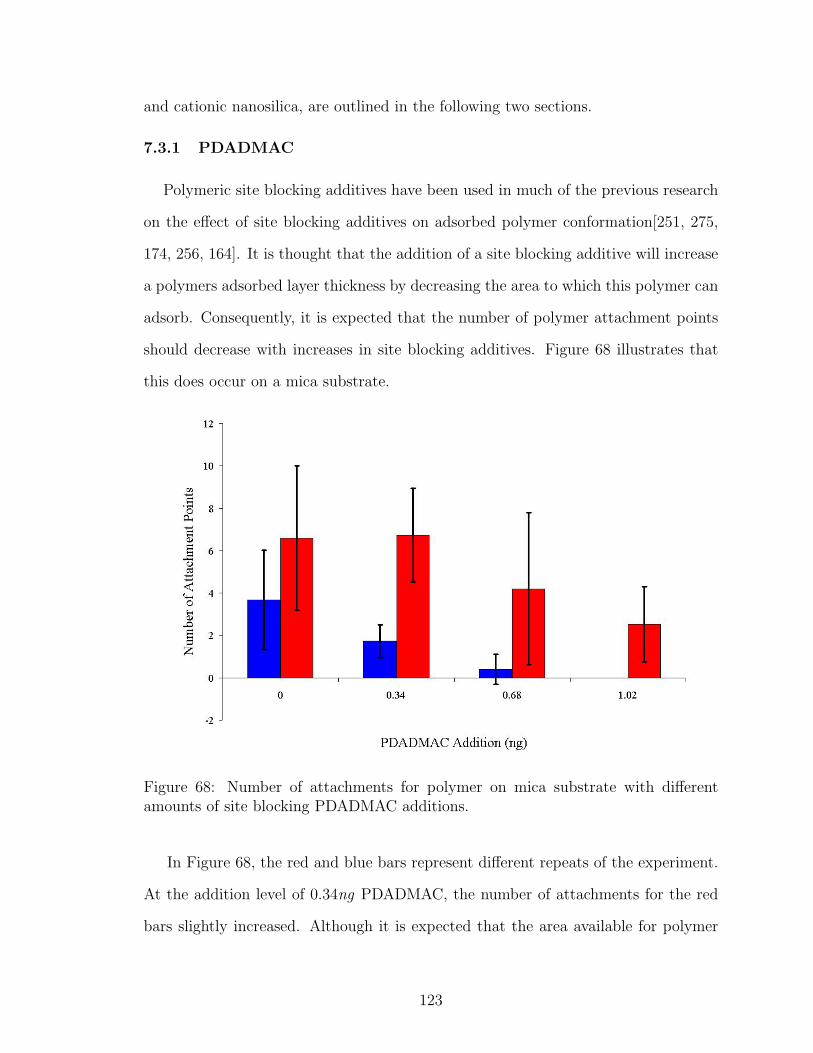
and cationic nanosilica, are outlined in the following two sections.
7.3.1 PDADMAC
Polymeric site blocking additives have been used in much of the previous research
on the effect of site blocking additives on adsorbed polymer conformation[251, 275,
174, 256, 164]. It is thought that the addition of a site blocking additive will increase
a polymers adsorbed layer thickness by decreasing the area to which this polymer can
adsorb. Consequently, it is expected that the number of polymer attachment points
should decrease with increases in site blocking additives. Figure 68 illustrates that
this does occur on a mica substrate.
Figure 68: Number of attachments for polymer on mica substrate with differentamounts of site blocking PDADMAC additions.
In Figure 68, the red and blue bars represent different repeats of the experiment.
At the addition level of 0.34ng PDADMAC, the number of attachments for the red
bars slightly increased. Although it is expected that the area available for polymer
123
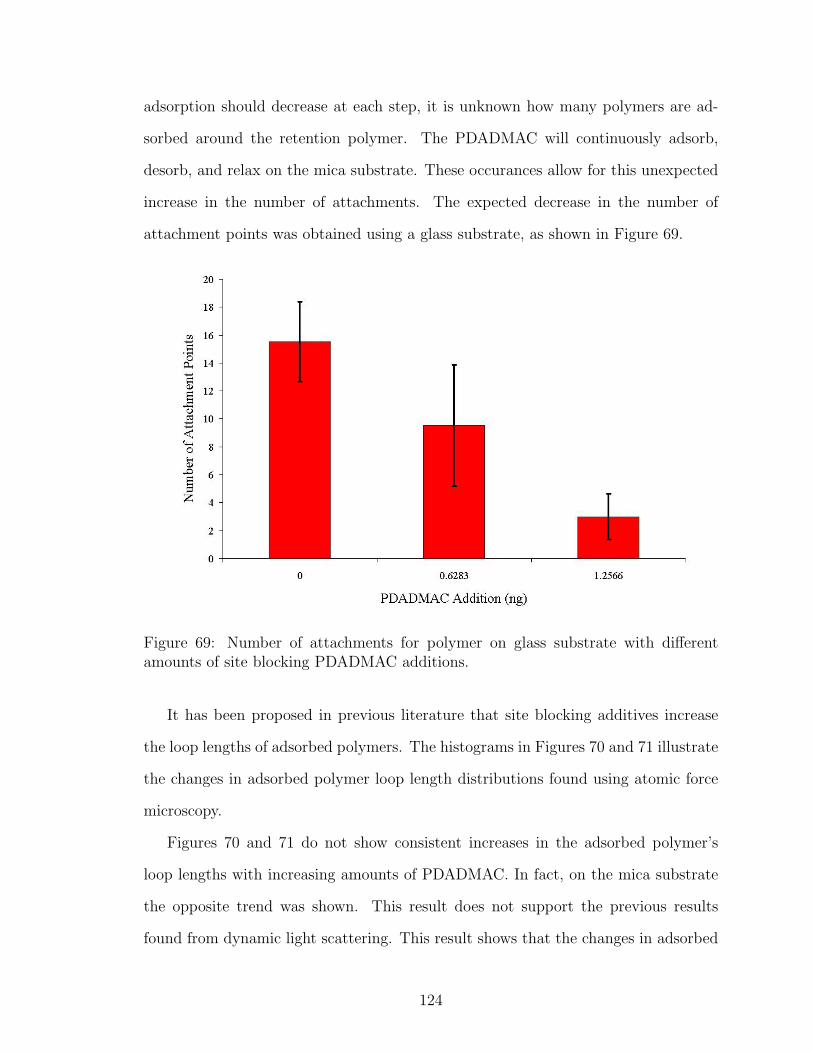
adsorption should decrease at each step, it is unknown how many polymers are ad-
sorbed around the retention polymer. The PDADMAC will continuously adsorb,
desorb, and relax on the mica substrate. These occurances allow for this unexpected
increase in the number of attachments. The expected decrease in the number of
attachment points was obtained using a glass substrate, as shown in Figure 69.
Figure 69: Number of attachments for polymer on glass substrate with differentamounts of site blocking PDADMAC additions.
It has been proposed in previous literature that site blocking additives increase
the loop lengths of adsorbed polymers. The histograms in Figures 70 and 71 illustrate
the changes in adsorbed polymer loop length distributions found using atomic force
microscopy.
Figures 70 and 71 do not show consistent increases in the adsorbed polymer’s
loop lengths with increasing amounts of PDADMAC. In fact, on the mica substrate
the opposite trend was shown. This result does not support the previous results
found from dynamic light scattering. This result shows that the changes in adsorbed
124
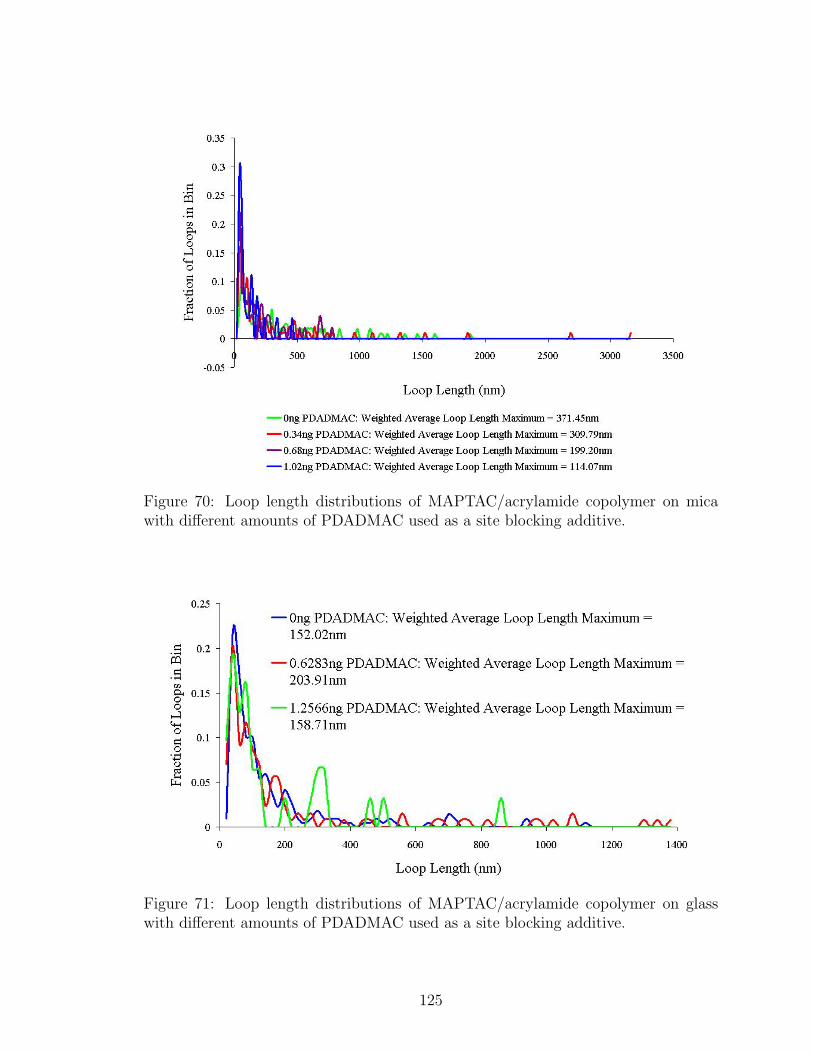
Figure 70: Loop length distributions of MAPTAC/acrylamide copolymer on micawith different amounts of PDADMAC used as a site blocking additive.
Figure 71: Loop length distributions of MAPTAC/acrylamide copolymer on glasswith different amounts of PDADMAC used as a site blocking additive.
125
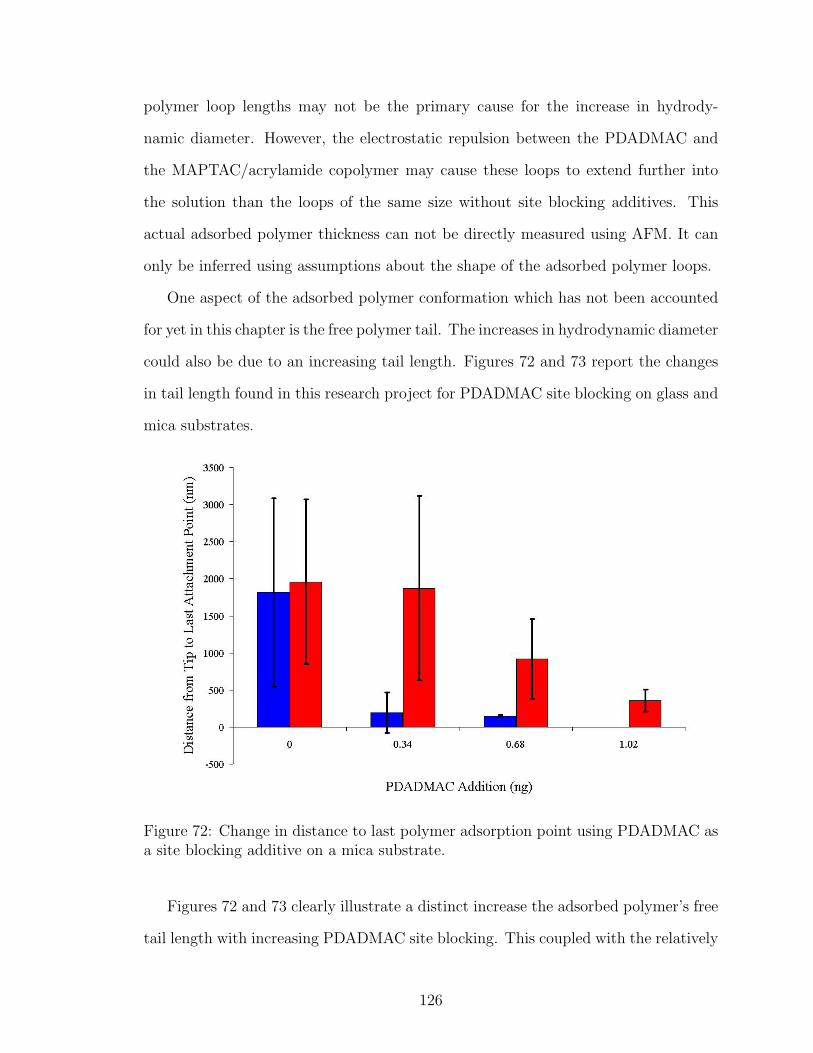
polymer loop lengths may not be the primary cause for the increase in hydrody-
namic diameter. However, the electrostatic repulsion between the PDADMAC and
the MAPTAC/acrylamide copolymer may cause these loops to extend further into
the solution than the loops of the same size without site blocking additives. This
actual adsorbed polymer thickness can not be directly measured using AFM. It can
only be inferred using assumptions about the shape of the adsorbed polymer loops.
One aspect of the adsorbed polymer conformation which has not been accounted
for yet in this chapter is the free polymer tail. The increases in hydrodynamic diameter
could also be due to an increasing tail length. Figures 72 and 73 report the changes
in tail length found in this research project for PDADMAC site blocking on glass and
mica substrates.
Figure 72: Change in distance to last polymer adsorption point using PDADMAC asa site blocking additive on a mica substrate.
Figures 72 and 73 clearly illustrate a distinct increase the adsorbed polymer’s free
tail length with increasing PDADMAC site blocking. This coupled with the relatively
126
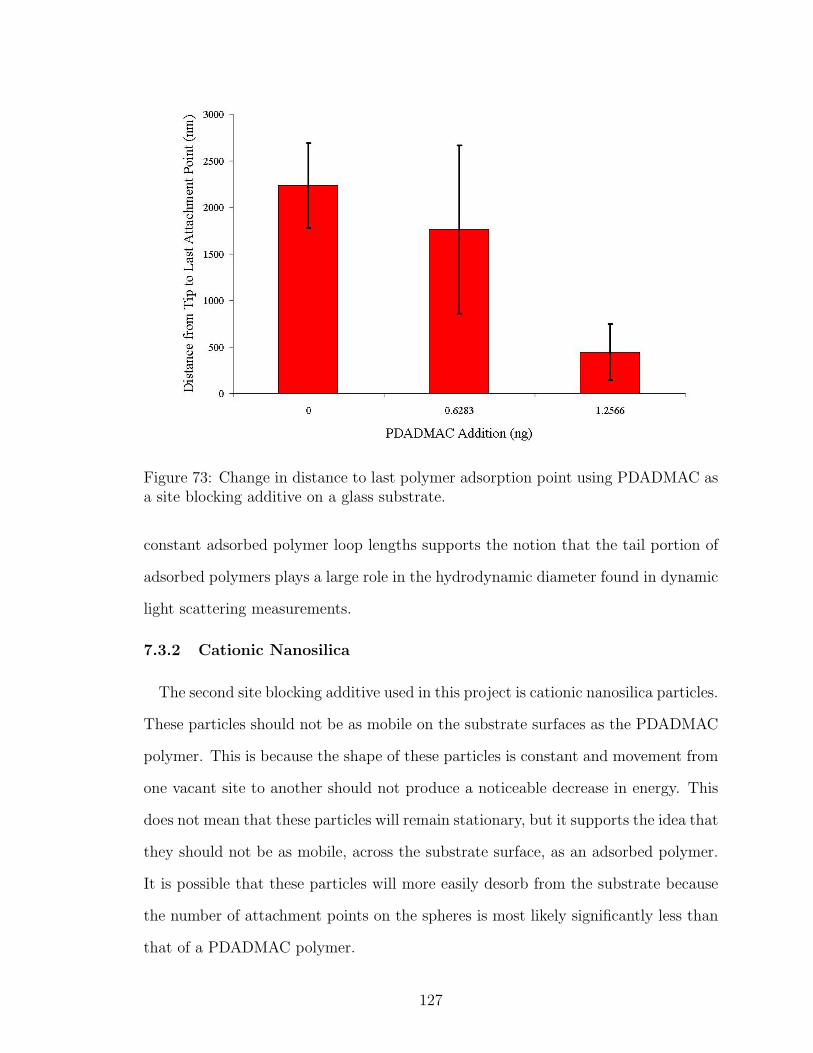
Figure 73: Change in distance to last polymer adsorption point using PDADMAC asa site blocking additive on a glass substrate.
constant adsorbed polymer loop lengths supports the notion that the tail portion of
adsorbed polymers plays a large role in the hydrodynamic diameter found in dynamic
light scattering measurements.
7.3.2 Cationic Nanosilica
The second site blocking additive used in this project is cationic nanosilica particles.
These particles should not be as mobile on the substrate surfaces as the PDADMAC
polymer. This is because the shape of these particles is constant and movement from
one vacant site to another should not produce a noticeable decrease in energy. This
does not mean that these particles will remain stationary, but it supports the idea that
they should not be as mobile, across the substrate surface, as an adsorbed polymer.
It is possible that these particles will more easily desorb from the substrate because
the number of attachment points on the spheres is most likely significantly less than
that of a PDADMAC polymer.
127
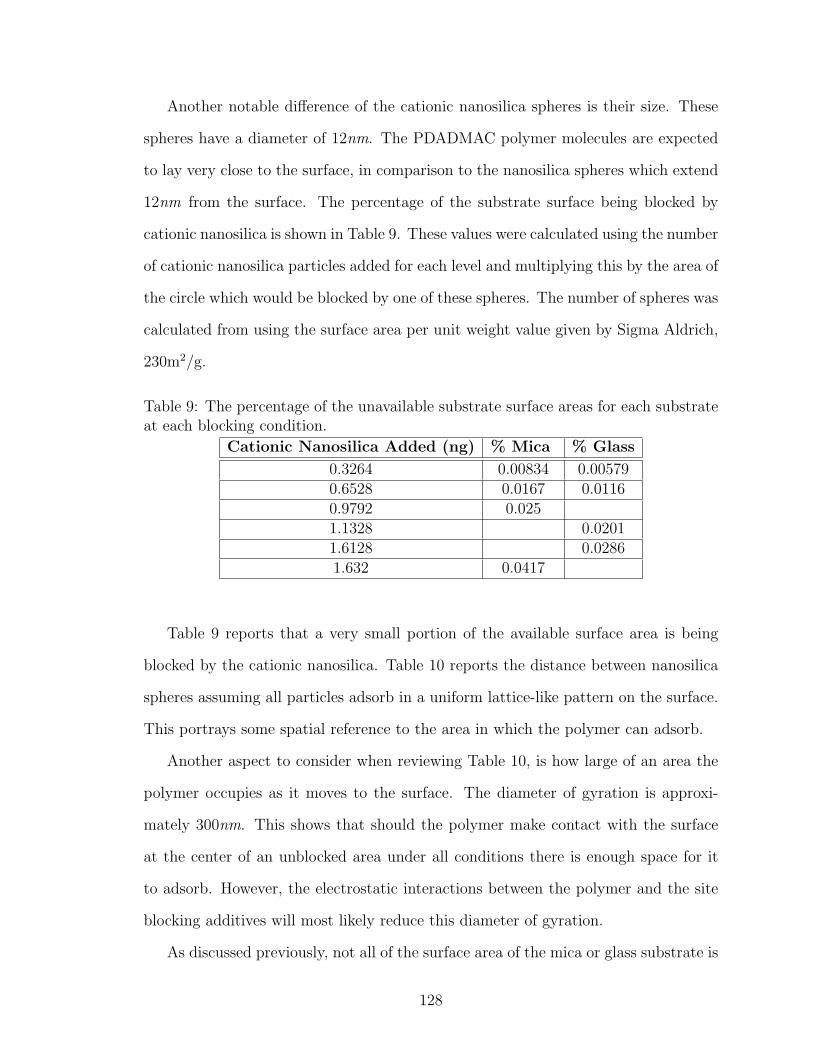
Another notable difference of the cationic nanosilica spheres is their size. These
spheres have a diameter of 12nm. The PDADMAC polymer molecules are expected
to lay very close to the surface, in comparison to the nanosilica spheres which extend
12nm from the surface. The percentage of the substrate surface being blocked by
cationic nanosilica is shown in Table 9. These values were calculated using the number
of cationic nanosilica particles added for each level and multiplying this by the area of
the circle which would be blocked by one of these spheres. The number of spheres was
calculated from using the surface area per unit weight value given by Sigma Aldrich,
230m2/g.
Table 9: The percentage of the unavailable substrate surface areas for each substrateat each blocking condition.
Cationic Nanosilica Added (ng) % Mica % Glass
0.3264 0.00834 0.005790.6528 0.0167 0.01160.9792 0.0251.1328 0.02011.6128 0.02861.632 0.0417
Table 9 reports that a very small portion of the available surface area is being
blocked by the cationic nanosilica. Table 10 reports the distance between nanosilica
spheres assuming all particles adsorb in a uniform lattice-like pattern on the surface.
This portrays some spatial reference to the area in which the polymer can adsorb.
Another aspect to consider when reviewing Table 10, is how large of an area the
polymer occupies as it moves to the surface. The diameter of gyration is approxi-
mately 300nm. This shows that should the polymer make contact with the surface
at the center of an unblocked area under all conditions there is enough space for it
to adsorb. However, the electrostatic interactions between the polymer and the site
blocking additives will most likely reduce this diameter of gyration.
As discussed previously, not all of the surface area of the mica or glass substrate is
128
Table 10: The distance between adsorbed cationic nanosilica spheres at differentaddition levels.
Cationic Nanosilica Added (ng) Mica (nm) Glass (nm)
0.3264 1152.12 1384.950.6528 811.16 975.790.9792 660.111.1328 737.861.6128 616.441.632 508.61
available for polymer adsorption. This is illustrated by analyzing the effect of cationic
nanosilica particles on the number of retention polymer attachment points. Figures
74 and 75 illustrate these results for mica and glass, respectively.
Figure 74: Number of attachments for polymer on mica substrate with differentamounts of site blocking cationic nanosilica additions.
The decline in the number of attachment points as the cationic nanosilica concen-
tration increases is shown in Figures 74 and 75. However, at the highest concentration
of cationic nanosilica addition there is a small increase in the number of attachment
129
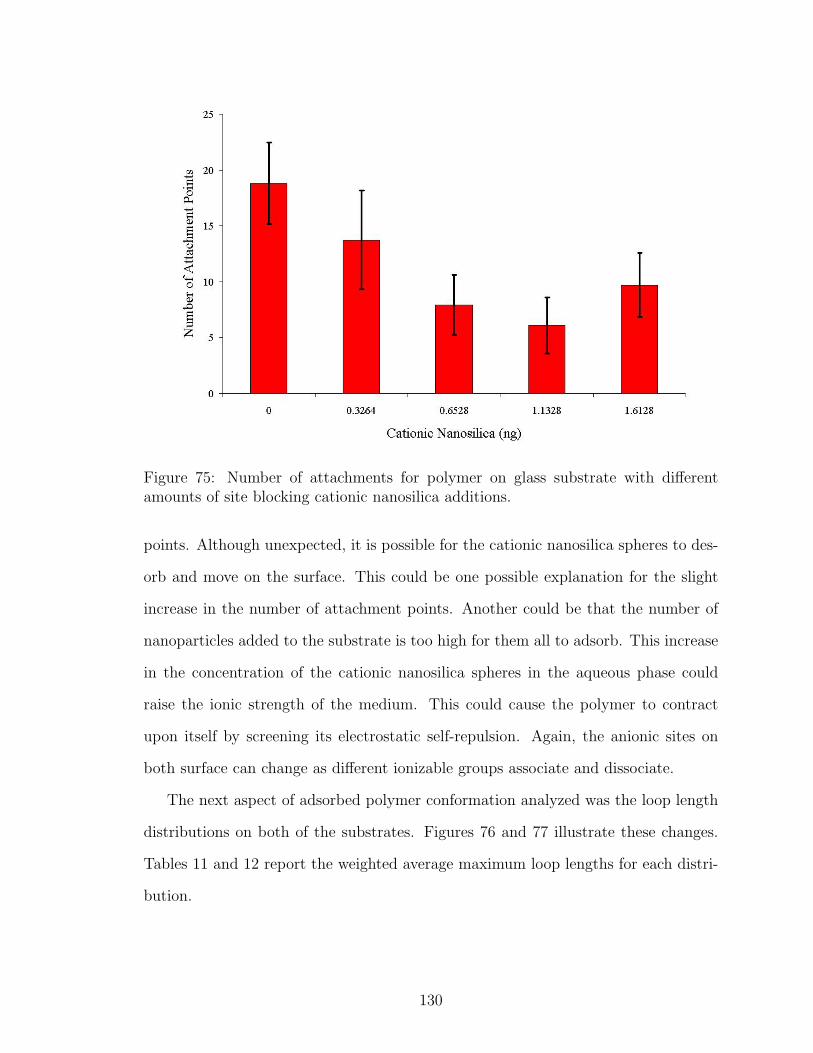
Figure 75: Number of attachments for polymer on glass substrate with differentamounts of site blocking cationic nanosilica additions.
points. Although unexpected, it is possible for the cationic nanosilica spheres to des-
orb and move on the surface. This could be one possible explanation for the slight
increase in the number of attachment points. Another could be that the number of
nanoparticles added to the substrate is too high for them all to adsorb. This increase
in the concentration of the cationic nanosilica spheres in the aqueous phase could
raise the ionic strength of the medium. This could cause the polymer to contract
upon itself by screening its electrostatic self-repulsion. Again, the anionic sites on
both surface can change as different ionizable groups associate and dissociate.
The next aspect of adsorbed polymer conformation analyzed was the loop length
distributions on both of the substrates. Figures 76 and 77 illustrate these changes.
Tables 11 and 12 report the weighted average maximum loop lengths for each distri-
bution.
130
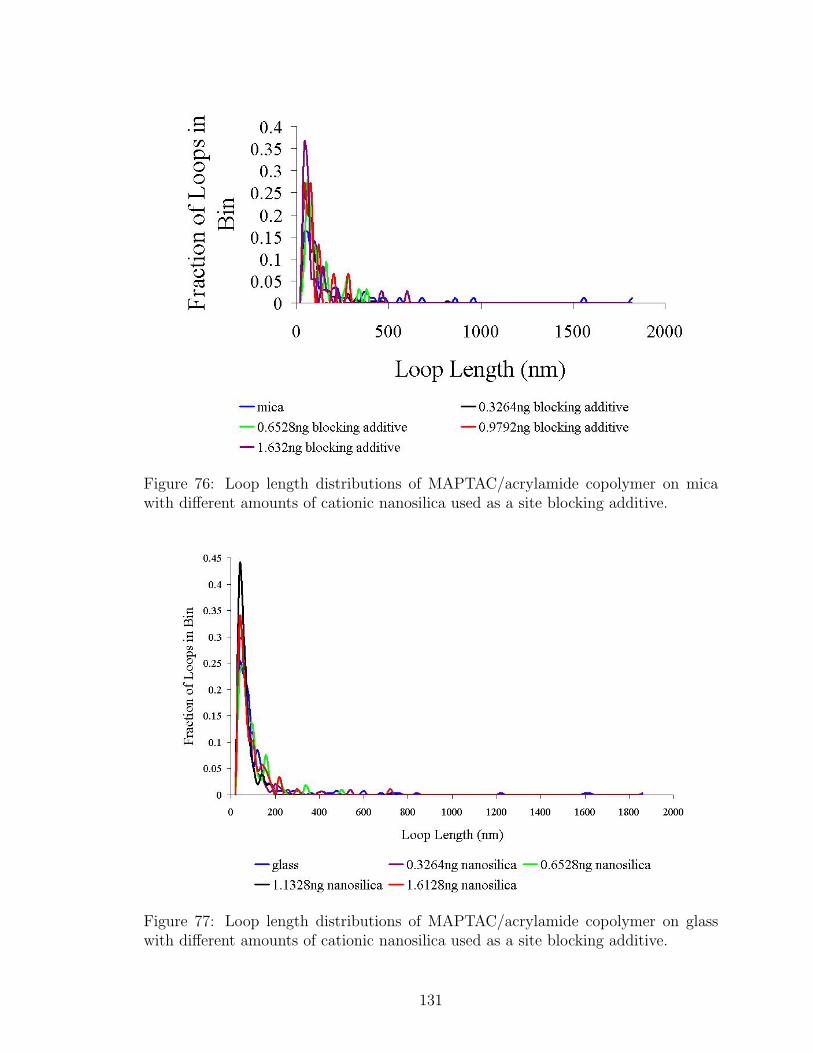
Figure 76: Loop length distributions of MAPTAC/acrylamide copolymer on micawith different amounts of cationic nanosilica used as a site blocking additive.
Figure 77: Loop length distributions of MAPTAC/acrylamide copolymer on glasswith different amounts of cationic nanosilica used as a site blocking additive.
131
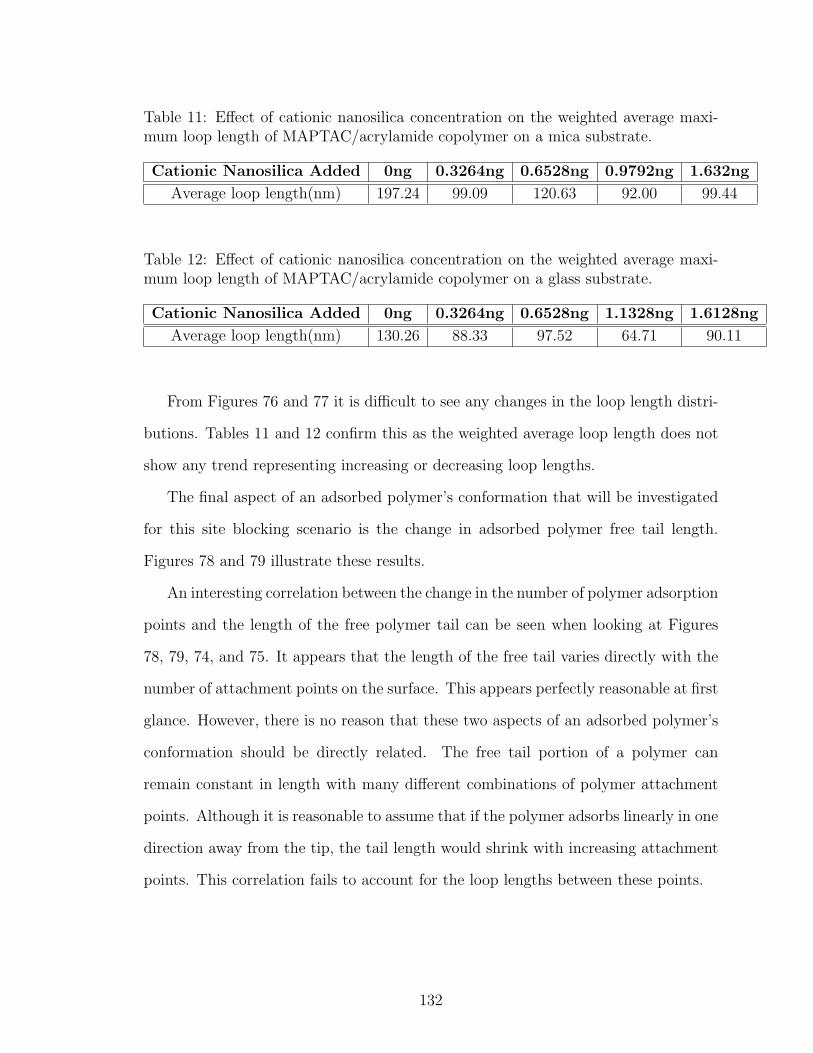
Table 11: Effect of cationic nanosilica concentration on the weighted average maxi-mum loop length of MAPTAC/acrylamide copolymer on a mica substrate.
Cationic Nanosilica Added 0ng 0.3264ng 0.6528ng 0.9792ng 1.632ng
Average loop length(nm) 197.24 99.09 120.63 92.00 99.44
Table 12: Effect of cationic nanosilica concentration on the weighted average maxi-mum loop length of MAPTAC/acrylamide copolymer on a glass substrate.
Cationic Nanosilica Added 0ng 0.3264ng 0.6528ng 1.1328ng 1.6128ng
Average loop length(nm) 130.26 88.33 97.52 64.71 90.11
From Figures 76 and 77 it is difficult to see any changes in the loop length distri-
butions. Tables 11 and 12 confirm this as the weighted average loop length does not
show any trend representing increasing or decreasing loop lengths.
The final aspect of an adsorbed polymer’s conformation that will be investigated
for this site blocking scenario is the change in adsorbed polymer free tail length.
Figures 78 and 79 illustrate these results.
An interesting correlation between the change in the number of polymer adsorption
points and the length of the free polymer tail can be seen when looking at Figures
78, 79, 74, and 75. It appears that the length of the free tail varies directly with the
number of attachment points on the surface. This appears perfectly reasonable at first
glance. However, there is no reason that these two aspects of an adsorbed polymer’s
conformation should be directly related. The free tail portion of a polymer can
remain constant in length with many different combinations of polymer attachment
points. Although it is reasonable to assume that if the polymer adsorbs linearly in one
direction away from the tip, the tail length would shrink with increasing attachment
points. This correlation fails to account for the loop lengths between these points.
132
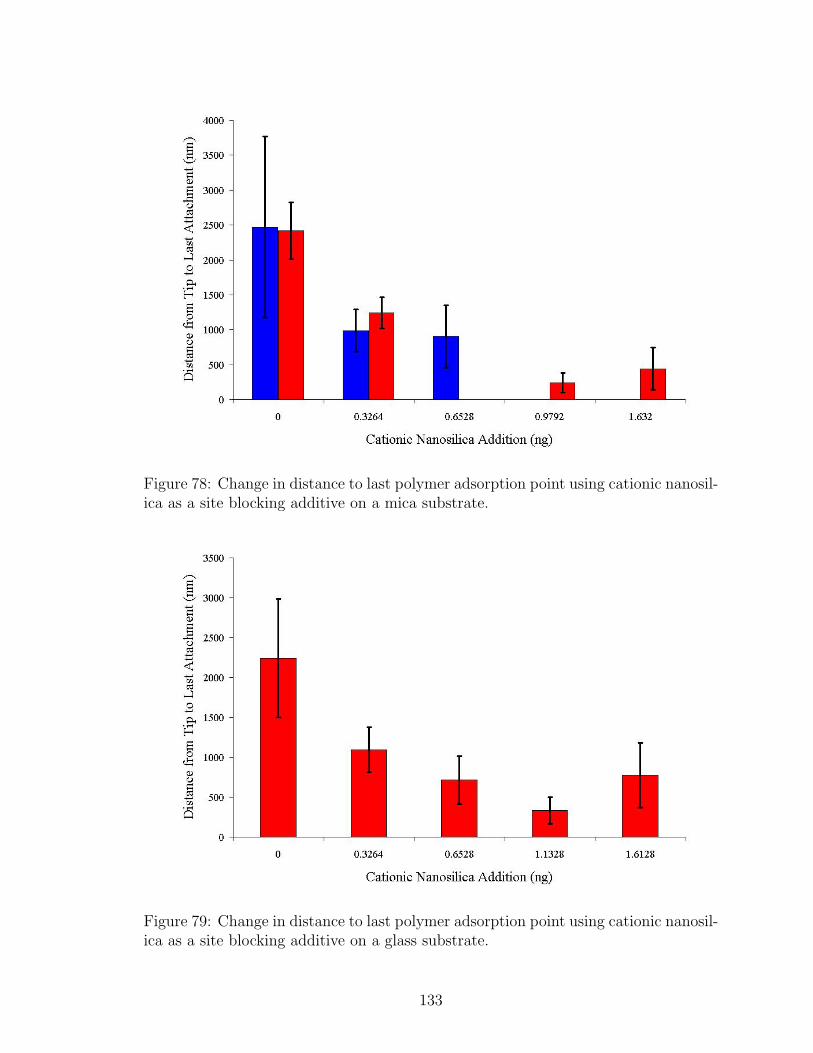
Figure 78: Change in distance to last polymer adsorption point using cationic nanosil-ica as a site blocking additive on a mica substrate.
Figure 79: Change in distance to last polymer adsorption point using cationic nanosil-ica as a site blocking additive on a glass substrate.
133
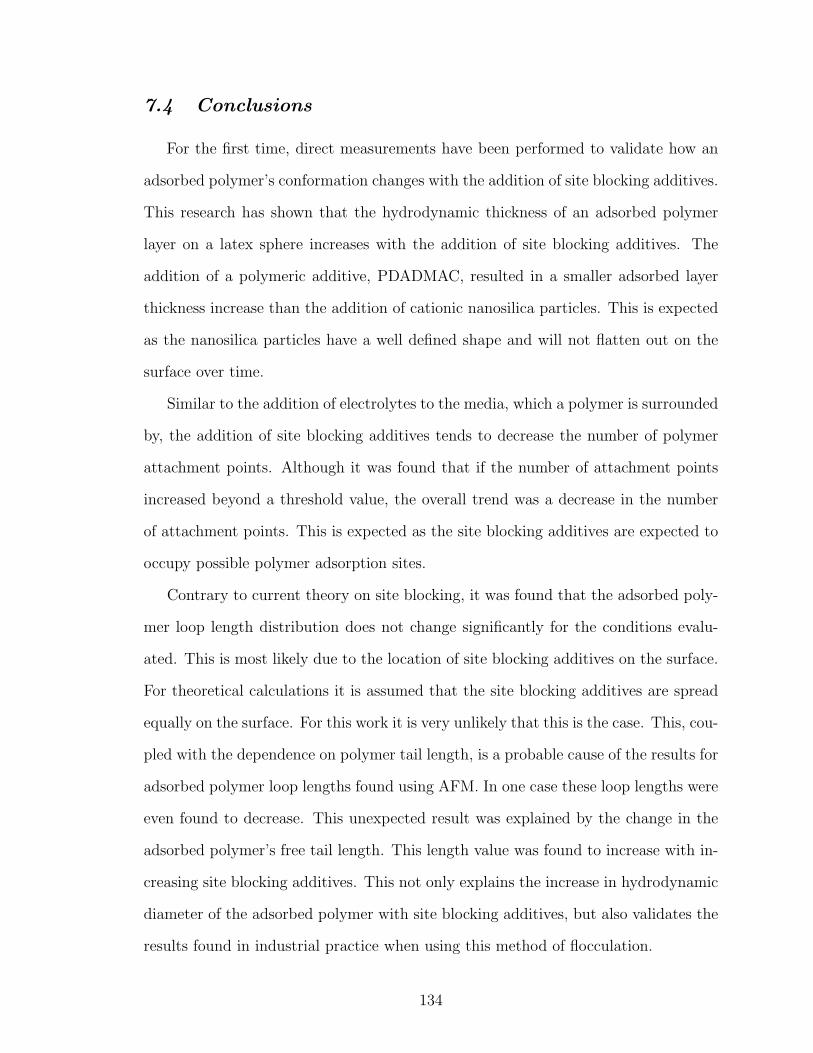
7.4 Conclusions
For the first time, direct measurements have been performed to validate how an
adsorbed polymer’s conformation changes with the addition of site blocking additives.
This research has shown that the hydrodynamic thickness of an adsorbed polymer
layer on a latex sphere increases with the addition of site blocking additives. The
addition of a polymeric additive, PDADMAC, resulted in a smaller adsorbed layer
thickness increase than the addition of cationic nanosilica particles. This is expected
as the nanosilica particles have a well defined shape and will not flatten out on the
surface over time.
Similar to the addition of electrolytes to the media, which a polymer is surrounded
by, the addition of site blocking additives tends to decrease the number of polymer
attachment points. Although it was found that if the number of attachment points
increased beyond a threshold value, the overall trend was a decrease in the number
of attachment points. This is expected as the site blocking additives are expected to
occupy possible polymer adsorption sites.
Contrary to current theory on site blocking, it was found that the adsorbed poly-
mer loop length distribution does not change significantly for the conditions evalu-
ated. This is most likely due to the location of site blocking additives on the surface.
For theoretical calculations it is assumed that the site blocking additives are spread
equally on the surface. For this work it is very unlikely that this is the case. This, cou-
pled with the dependence on polymer tail length, is a probable cause of the results for
adsorbed polymer loop lengths found using AFM. In one case these loop lengths were
even found to decrease. This unexpected result was explained by the change in the
adsorbed polymer’s free tail length. This length value was found to increase with in-
creasing site blocking additives. This not only explains the increase in hydrodynamic
diameter of the adsorbed polymer with site blocking additives, but also validates the
results found in industrial practice when using this method of flocculation.
134
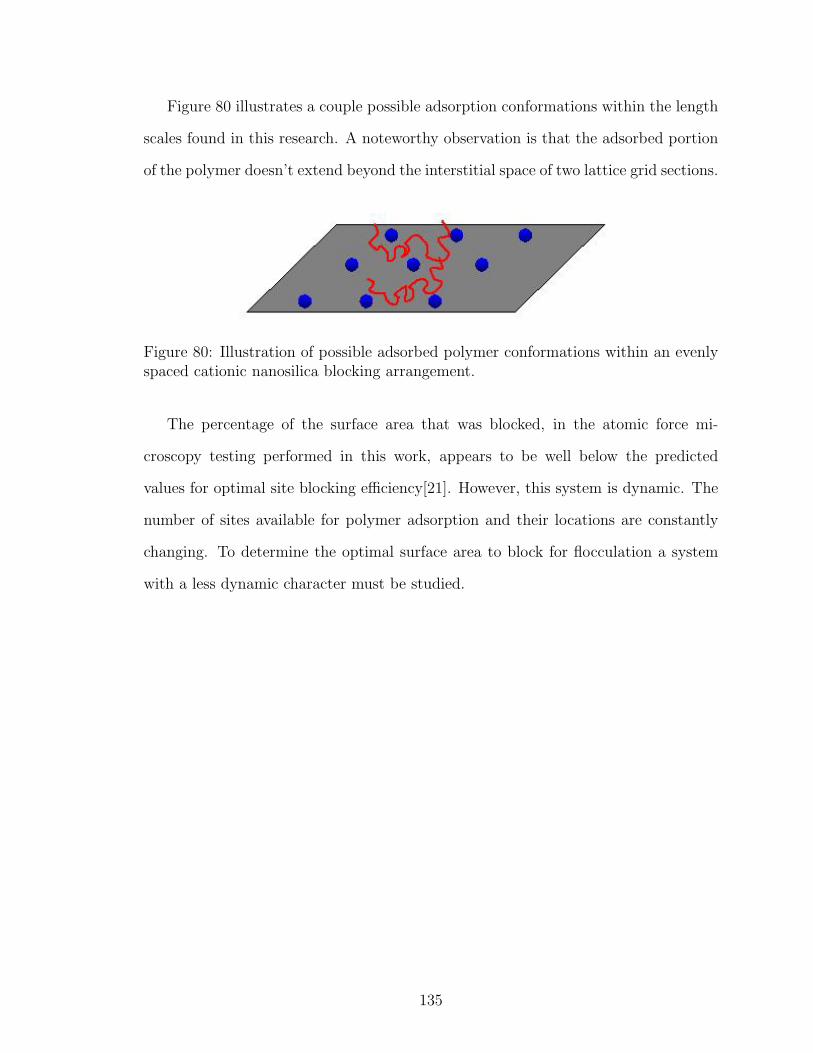
Figure 80 illustrates a couple possible adsorption conformations within the length
scales found in this research. A noteworthy observation is that the adsorbed portion
of the polymer doesn’t extend beyond the interstitial space of two lattice grid sections.
Figure 80: Illustration of possible adsorbed polymer conformations within an evenlyspaced cationic nanosilica blocking arrangement.
The percentage of the surface area that was blocked, in the atomic force mi-
croscopy testing performed in this work, appears to be well below the predicted
values for optimal site blocking efficiency[21]. However, this system is dynamic. The
number of sites available for polymer adsorption and their locations are constantly
changing. To determine the optimal surface area to block for flocculation a system
with a less dynamic character must be studied.
135
CHAPTER VIII
COMPUTER SIMULATION WITH DISSIPATIVE
PARTICLE DYNAMICS
The attempts, associated with this work, at using dissipative particle dynamics
have been met with substantial difficulty. The use of dissipative particle dynamics,
although not that new, to model experimental or industrial phenomena is still rela-
tively unverified. Most of the work done, to date, deals with making empirical changes
to the variable in order to match experimental results. Although information regard-
ing the use of DPD parameterization can be obtained, a fundamental explanation of
the application of DPD to actual phenomena has yet to be proposed. The approach
of this project was to build, on fundamentally sound theory, a code which can give
meaningful information on the conformation of adsorbed polymers. This type of work
has only been performed by a few researchers, including Manke et al., in the past[99].
However, this past work leaves many questions unanswered, including how polymer
adsorption was simulated. For this project, unfortunately, simulations of adsorbed
polymer conformation and the effects of site blocking on adsorbed polymer conforma-
tion were unable to be completed. This was due to the inability to parameterize the
electrostatic values to describe the interactions of the MAPTAC/acrylamide copoly-
mer with an anionic wall. With more time, however, the parameterization of the wall
could be completed. This attempt to describe polymer adsorption on a wall using
electrostatic interactions provides an excellent starting point for fitting DPD simula-
tions to experimental and industrial phenomena. This chapter will report the results
of the work done towards simulating the systems investigated experimentally for this
project. These results involve the work done to simulate a polymer in solution and
136
what model parameters are reasonable for such a simulation.
8.1 Polymer Simulations
The dissipative particle dynamics model used in this work was parameterized
to properly simulate a polymer’s movement. The code written uses four main pa-
rameters to describe the constraints which will create a polymer: the cutoff radius,
the bead/bead interaction parameter, aii, the spring constant of the bond holding
beads together, and the equilibrium bond length between beads. In the code used,
the aii parameter is not applied to directly bonded beads because the interaction is
accounted for by a separate quadratic potential. However, this parameter is applied
to non-neighboring beads. To begin these simulations, an aii parameter of 25, the
same as used in verification of the DPD code, was used. Although this interaction
parameter may not be accurate, aii is an assigned value to allow reproduction of ex-
perimental results and, by varying other variables, many reasonable values could be
used. The cutoff radius, rc, was always set equal to 1 to scale all distances in the
simulation. This left only two parameters for adjusting the simulation of a polymer:
the spring constant of the bond holding adjacent beads together and the equilib-
rium bond length between beads. Although these two parameters can be combined
in many different ways to give acceptable results, the bond spring constant was set
to 5. Nikunen et al. selected a bond length and then related the aii parameter to
the spring constant by simply setting aii to one half the spring constant[182]. The
spring constant values used by Nikunen et al. were two orders of magnitude greater
than the value selected for this work. Again, this is acceptable because the weaker
spring constant is accounted for by removing the conservative force between adjacent
bonded beads. Equilibrium bond lengths of 0.001rc, 0.05rc, 0.1rc, 0.5rc, and 10rc
were evaluated for 100 bead polymers. All of these simulations displayed movement
that would be expected for a polymer random coil in solution. However, the final
137
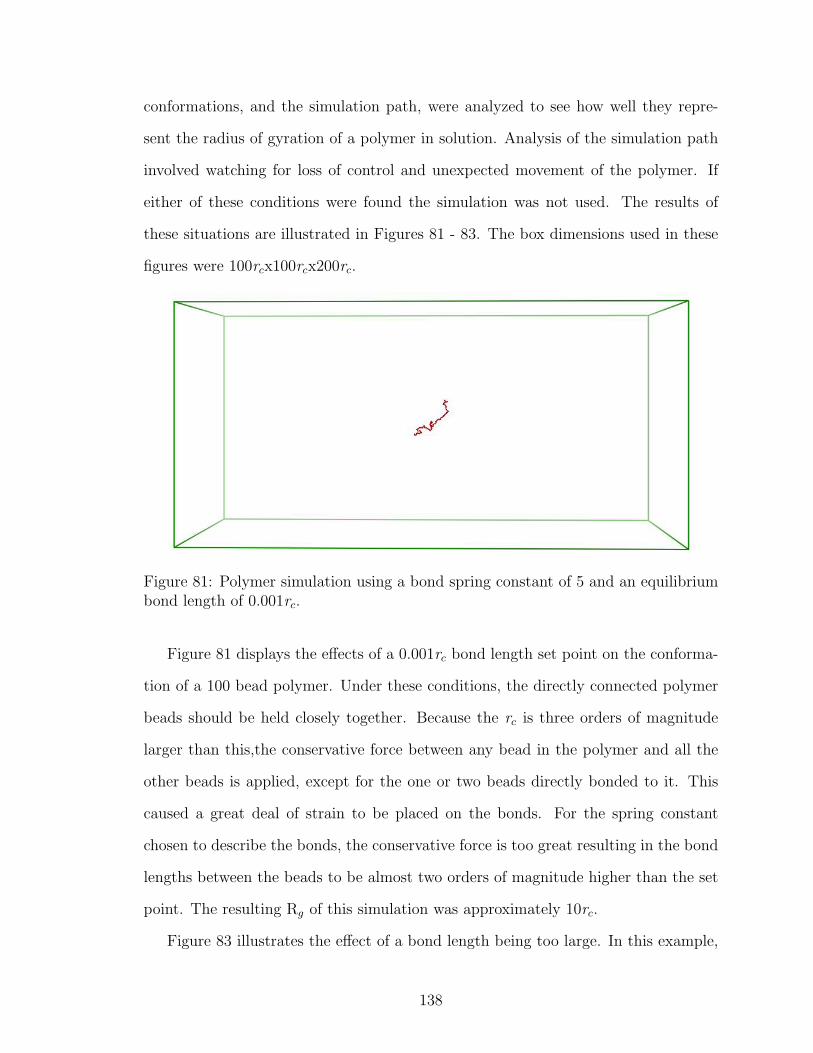
conformations, and the simulation path, were analyzed to see how well they repre-
sent the radius of gyration of a polymer in solution. Analysis of the simulation path
involved watching for loss of control and unexpected movement of the polymer. If
either of these conditions were found the simulation was not used. The results of
these situations are illustrated in Figures 81 - 83. The box dimensions used in these
figures were 100rcx100rcx200rc.
Figure 81: Polymer simulation using a bond spring constant of 5 and an equilibriumbond length of 0.001rc.
Figure 81 displays the effects of a 0.001rc bond length set point on the conforma-
tion of a 100 bead polymer. Under these conditions, the directly connected polymer
beads should be held closely together. Because the rc is three orders of magnitude
larger than this,the conservative force between any bead in the polymer and all the
other beads is applied, except for the one or two beads directly bonded to it. This
caused a great deal of strain to be placed on the bonds. For the spring constant
chosen to describe the bonds, the conservative force is too great resulting in the bond
lengths between the beads to be almost two orders of magnitude higher than the set
point. The resulting Rg of this simulation was approximately 10rc.
Figure 83 illustrates the effect of a bond length being too large. In this example,
138
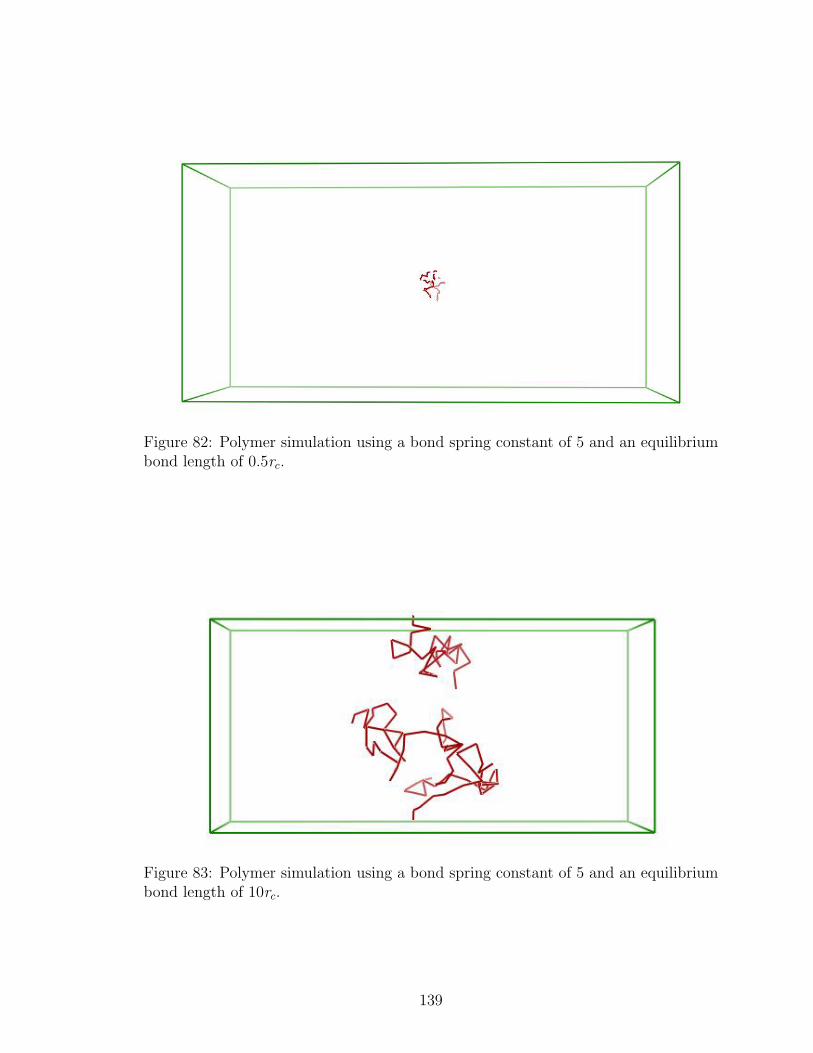
Figure 82: Polymer simulation using a bond spring constant of 5 and an equilibriumbond length of 0.5rc.
Figure 83: Polymer simulation using a bond spring constant of 5 and an equilibriumbond length of 10rc.
139
the conservative force is only applied in areas where the polymer has folded back near
itself. Here the bond lengths are between 1rc and 10rc. At distances greater than
10rc the polymer spring constant pulled the beads back together. This large bond
length resulted in an approximate Rg of 65rc.
The previous two bond length choices resulted in undesirable modeling situations.
The choices of bond lengths of 0.05rc, 0.1rc, and 0.5rc were designed to help pick
an optimum bond length to use for this work. A bond length of 0.05rc simulated a
polymer with an approximate Rg of 4.5rc. As the bond length was increased to 0.1rc
the approximate Rg increased to 5rc and the average bond length, found from the
simulation, was around 0.75rc.
Figure 82 shows the effect of setting the bond length to 0.5rc. For this simu-
lation, the closest match between the set point bond length(0.5rc) and the actual
bond length(0.65rc) were found. The consistency of the calculated bond length and
the bond length set point is essential to obtaining fundamentally sound simulations.
Without this consistency the bonded beads in the simulated polymer will move well
beyond reasonable distances from one another eliminating the ability of the simu-
lation to be compared to experimental phenomena. The Rg of this simulation was
shown to expand slightly to approximately 6.5rc. Because of this, the equilibrium
bond length was chosen to be 0.5rc for this work.
Now that an equilibrium bond length had been chosen, it was possible to de-
termine the appropriate aii parameter of the polymer to allow reproduction of the
experimentally determined Rg, 151nm, of the MAPTAC/acrylamide copolymer. The
first step in this process was to determine the number of beads necessary to represent
the copolymer used for the AFM and DLS experimental studies. Assuming each bead
to be two MAPTAC/acrylamide repeat unit this number was calculated to be 346
beads.
Because DPD code does not require a diameter of the beads used in simulations, a
140
method to relate the distances between beads and actual polymer length was required
to extract information from these models. All lengths in DPD are scaled with the
cutoff radius, rc. This radius is the maximum distance from a bead which will produce
interaction forces with other beads. It is unreasonable to assume that this rc value
could be used to directly quantify a beads size. If this was done the bead, or polymer
repeat unit, would not feel any interactions with other beads unless they were in
direct contact. It is well known that the electrostatic forces which most likely play an
important role in a MAPTAC/acrylamide copolymer’s configuration in solution, will
extend large distances from the actual bead. To account for this, the beads diameter
was set to 13
the rc value. While this assignment could be far from accurate when
attempting to account for electrostatics it was a reasonable starting point for this
work.
With the bead diameter, 11.7nm, set to 13
the rc value, the length of rc was calcu-
lated to be 35.1nm. Figure 84 shows the configuration of the MAPTAC/acrylamide
copolymer after a simulation of 1000ps.
The Rg for the copolymer, simulated in Figure 84, was calculated to be 65.46nm.
A repeat of this simulation resulted in a Rg value of 61.78nm. These values of Rg
are about three times too small for the value obtained from static light scattering
experiments performed. To help fit these simulations to the experimental results,
the previously constant aii parameter was increased to assert more repulsion between
beads. After increasing the aii parameter to 45, the radius of gyration was calculated
to be 164.71nm. This polymer configuration is shown in Figure 85.
Although the radius of gyration for a single polymer approximately matching the
experimental results is good, that simulation and the experimental conditions are
very different. In order to attempt to reproduce the correct Rg under experimental
conditions, a simulation was done with six polymers in a smaller box. Figure 86 shows
these results.
141
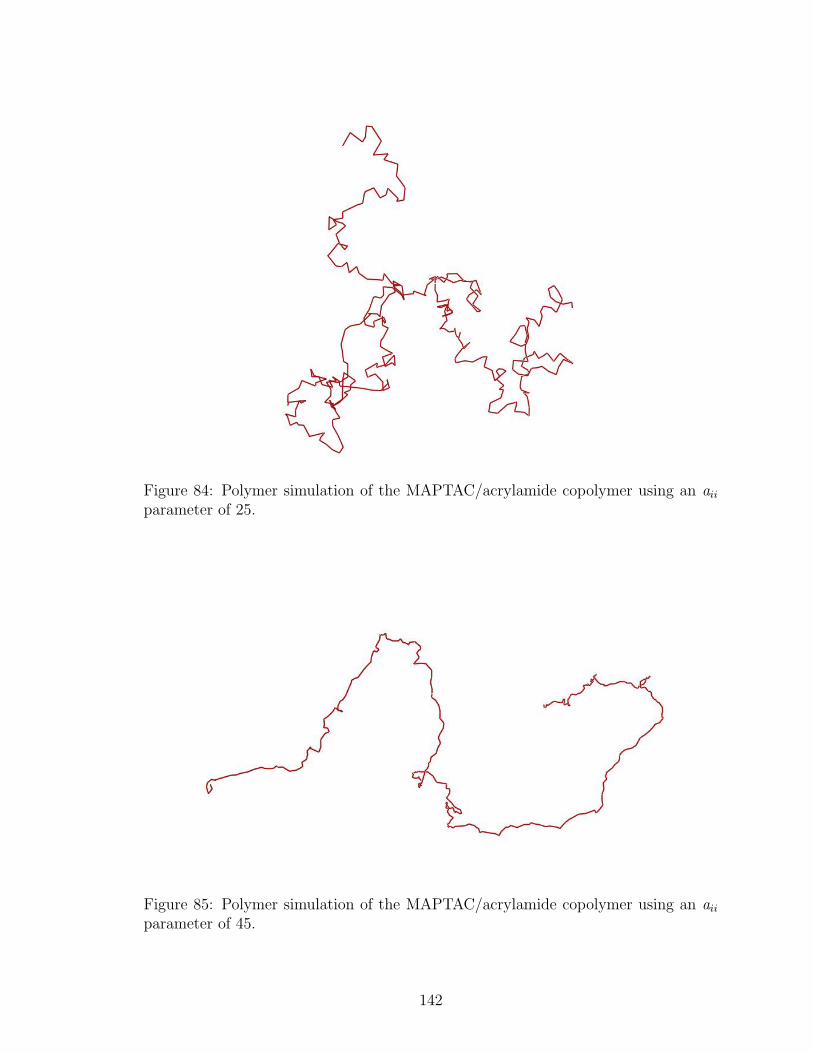
Figure 84: Polymer simulation of the MAPTAC/acrylamide copolymer using an aii
parameter of 25.
Figure 85: Polymer simulation of the MAPTAC/acrylamide copolymer using an aii
parameter of 45.
142
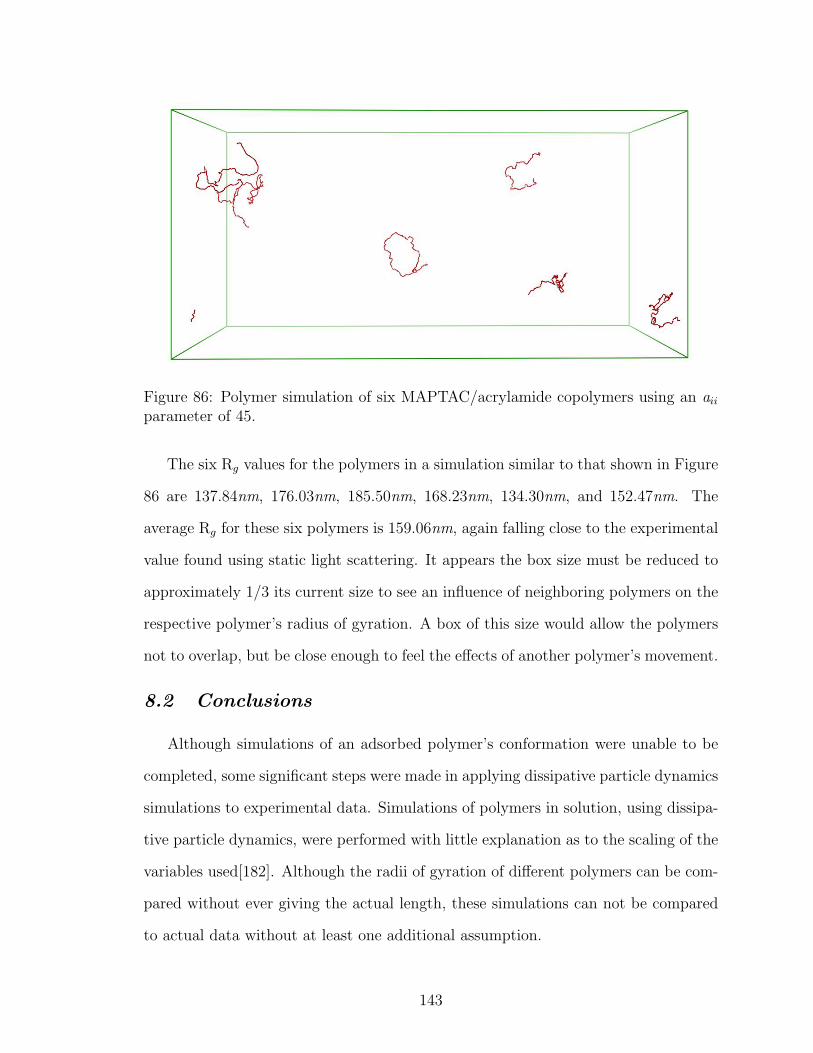
Figure 86: Polymer simulation of six MAPTAC/acrylamide copolymers using an aii
parameter of 45.
The six Rg values for the polymers in a simulation similar to that shown in Figure
86 are 137.84nm, 176.03nm, 185.50nm, 168.23nm, 134.30nm, and 152.47nm. The
average Rg for these six polymers is 159.06nm, again falling close to the experimental
value found using static light scattering. It appears the box size must be reduced to
approximately 1/3 its current size to see an influence of neighboring polymers on the
respective polymer’s radius of gyration. A box of this size would allow the polymers
not to overlap, but be close enough to feel the effects of another polymer’s movement.
8.2 Conclusions
Although simulations of an adsorbed polymer’s conformation were unable to be
completed, some significant steps were made in applying dissipative particle dynamics
simulations to experimental data. Simulations of polymers in solution, using dissipa-
tive particle dynamics, were performed with little explanation as to the scaling of the
variables used[182]. Although the radii of gyration of different polymers can be com-
pared without ever giving the actual length, these simulations can not be compared
to actual data without at least one additional assumption.
143
All length or distance values in the DPD simulations are scaled to rc. However,
without assigning a length to rc the lengths in simulation can not be compared with
experimental work. In this work, a closer look at what rc actually signifies was taken.
It is known that rc is the distance from a bead in which it will feel interactions from
other beads. For the MAPTAC/acrylamide copolymer, it is likely that electrostatics
play a large role in the polymer’s radius of gyration. It is also known that electrostatics
act over fairly long distances. Because of this, it was assumed that the rc value must
be greater than the repeat unit diameter. For these simulations, as described in the
previous section, it was assumed that rc was three times the diameter of a bead. The
diameter of a bead was roughly calculated knowing the straight chain length of the
carbon/carbon bonds in the repeat unit backbone. With this information, it was
possible to relate the DPD simulations to actual radius of gyration values obtained
experimentally for the MAPTAC/acrylamide copolymer.
One aspect of DPD simulations which was not investigated, but should be, is
the effect of the variation of the stochastic and viscous drag forces of the solvent as
polymer is add to it. For this work these forces were kept at setpoints used by Frenkel
and Smit[94]. Given more time, it should be possible to evaluate the effects of changes
in these variables on the movement of a polymer in solution. However, this work has
provided a reasonable starting point from which these effects can be investigated.
An important note to the methodology described above is that when altering the
aii parameter to obtain the correct Rg value for the MAPTAC/acrylamide copolymer
the equilibrium bond lengths change for the simulated polymer. With more time,
it would have been important to again optimize the bond lengths by adjusting the
spring constant of the polymer to account for the additional repulsive conservative
force between beads.
The results presented in this chapter have shown reasonable values of the DPD pa-
rameters to simulate the conformation of a high molecular weight MAPTAC/acrylamide
144

copolymer in water. By using these values, further investigation of the effects of other
DPD parameters can be analyzed and related to one another.
145
CHAPTER IX
OVERALL CONCLUSIONS AND RECOMMENDATIONS
This dissertation performed a fundamental analysis of an adsorbed polymers
conformation on a surface. Using a well developed experimental method, dynamic
light scattering, and developing a new experimental technique, using atomic force mi-
croscopy, specific information on adsorbed polymer conformation was reported. The
verification of this new atomic force microscopy method opens up many possibilities
for evaluating single adsorbed polymer properties. Many of these results were shown
experimentally for the first time in this work.
Adsorbed MAPTAC/acrylamide copolymer conformations on different anionic
substrates were analyzed. The dynamic light scattering results showed an increase in
hydrodynamic radius, after the addition of the copolymer, most likely pertaining to
an adsorbed polymer layer being deposited. Atomic force microscopy gave a direct
measurement of an adsorbed polymer’s loop lengths to determine its conformation. It
was found through multiple tests that the average loop length of an adsorbed MAP-
TAC/acrylamide copolymer, with a molecular weight around 1x10⁶g/mol, was around
174nm. The loop length distribution showed the majority of the loops lengths were
between 40 and 260nm. These results could be manipulated to fit scaling predictions
for adsorbed polymer conformations. However, these fits fail to illustrate the unique
characteristics of an adsorbed polymer’s conformation on a surface. For the first time,
an adsorbed polymer’s relaxation was shown using atomic force microscopy.
The second portion of this work examined the salt effect on adsorbed polymer
conformations. Dynamic light scattering results showed increases in the adsorbed
polymer layer thickness with increasing ionic strengths of the liquid medium. It was
146
verified that the addition of electrolytes to the liquid medium decreased the number
of polymer attachment points to a surface. This is presumably due to a filling,
or blocking, of available adsorption sites by salt counterions. Shubin and Linse’s
predictions for the salt effect on adsorbed polymer conformations was, for the first
time, verified using this atomic force microscopy technique. It was shown that there
may be a slight increase in loop length sizes with increasing ionic strength. However,
the largest change in adsorbed polymer conformation is related to the increasing in
the free tail length of an adsorbed polymer.
The final section of this work dealt with the effect of site blocking additives on
adsorbed polymer conformation. Similar to past research, it was found that the use
of site blocking additives increased the adsorbed polymer layer thickness on a surface.
The dynamic light scattering results from this work showed a slightly greater increase
in layer thickness when cationic nanosilica particles were used as a blocking additive
compared with the use of PDADMAC as a blocking additive. The use of atomic
force microscopy revealed surprising results regarding the actual adsorbed polymer
conformation. Contrary to expected results, the adsorbed polymer loop length did
not increase with increasing amounts of site blocking additives.
As was expected the number of attachment points did decrease with increasing
amounts of site blocking additives. The free tail portion of an adsorbed polymer’s
conformation was found to increase with increasing site blocking additive concentra-
tions. Due to the analysis of a single and different polymer, comparisons between the
PDADMAC and cationic nanosilica blocking additives were not performed.
An interesting result from this work is the strikingly similar behavior between
the addition of electrolytes and the addition of site blocking additives. Increasing
amounts of both of these components decreases the number of polymer attachment
points on the substrate. This supports the point that the salt ions are competing for
adsorption points just as the site blocking additives are, and are actually blocking
147
possible adsorption points for the polymer on the substrate. Both of these components
have only a slight effect, if any, on the adsorbed polymer’s loop length distribution.
This could be due to the truly random nature of polymer adsorption on a substrate.
And finally the increase in the adsorbed polymer’s free tail length with increasing
concentrations of these components is very interesting.
The increase in adsorbed polymer tail length could have profound effects on the
understanding of flocculation. It is known that the addition of site blocking additives
increases the amount of flocculation with smaller additions of retention polymers.
This could signify that the free tail portion of the adsorbed polymer’s conformation
plays the dominant role in flocculation. If true, this gives a new tool to retention
polymer manufacturers to tailor their molecules to capitalize on this phenomena.
Overall, this research project has resulted in the development of a novel atomic
force microscopy technique which allows the investigation of the properties of a single
adsorbed polymer. Information regarding an adsorbed polymers conformation has
been detailed. The effects of salt concentration and site blocking additives on a single
adsorbed polymer’s conformation were, for the first time, reported and analyzed.
With future work these methods and findings may help researchers develop a better
understanding of how polymers interact with surfaces and the factors influencing this.
9.1 Recommendations For Future Work
This work has added key pieces of experimental evidence to support predictions for
adsorbed polymer conformation. This thesis provides an introduction for new tech-
niques to characterize polymer’s conformations, with these techniques it is possible
to now investigate more complex polymer phenomena. The following areas, listed
below, are some of the many possible paths this research can be continued on:
• Further verification of the single molecule assumption made for the
AFM portion of this work. Although significant steps were taken to ensure
148
a single polymer was being analyzed, no direct proof was ever provided. It is
possible that by placing a fluorescent or luminescent tag on the other terminal
end of the polymer being tested, the assumption of a single polymer could
be proven. One method for this is possibly attaching a quantum dot to the
other terminal end of the polymer. This could be seen with currently available
microscopy systems coupled with the AFM.
• Removal of the variance in the substrate adsorption site location and
number. The use of a well characterized, stable, substrate could allow more
information on how exactly an adsorbed polymer is adsorbing on a surface
relative to the available number of adsorption sites. Using a substrate, such as
silicon, which can be cleaved to give a known number and spacing of charged
sites would help take some of the ambiguity out of the data obtained.
• Testing on well characterized, constant, structured polymers. By eval-
uating block copolymers with known repeat units and molecular weights, the
factors of polymer structure which affect adsorbed polymer conformation can
be investigated. This work used a random copolymer with a substantial poly-
dispersity complicating conclusions on adsorbed polymer conformation and tail
length.
• Study of site blocking additive’s size, surface affinity, and structure
effects on adsorbed polymer conformation. This study of the site block-
ing effect of two additives has raised questions into what actually happens with
other changes in the site blocking additive’s properties. By using different block-
ing additives of different sizes and surface affinities more information, regarding
this system, can be obtained.
• Analysis of the fundamentals of flocculation. Very little is known on how
flocculation actually occurs. By using the results of this study and some of the
149
paths described previously, it is possible to outline an experimental plan aimed
at determining the actual mechanism of flocculation and the role of different
types of polymers in this process.
• Further development of dissipative particle dynamics program. With
this work a reasonable approach to applying DPD to a real system was devel-
oped. By continuing this work it is likely that polymer adsorption on a wall
can be simulated. This would allow the use of simulations to aid in the design
of new polymer modified surfaces.
150
APPENDIX A
DPD SVL CODE
#svl
#set main DPD
// Write data to database
local function WriteDB [mdb, time, kbT, acc, vel, init]
local molsys = mol Extract Atoms[];
// setup data and write to database local data = [time:time, mol:molsys,
kbT:kbT, accx:acc(1), accy:acc(2), accz:acc(3), velx:vel(1), vely:vel(2), velz:vel(3),
init:init];
db Write [mdb, 0, data];
db Flush mdb;
endfunction
// DPD Force solves the force equations for DPD. Returns the total force.
local function DPD Force [n, pos, box, vel, rc, gamma, sigma, aij, element,
bond, bond spring, blength, inv sqrt dt, es]
local k, i, j, rij, rijmag, eij, vij, wr, wd, a; local fci, fdi, fri, fwi; local
bond rij, bond rijmag, bond eij, fsi; local y, sgny, ekd;
local f = rep[[0,0,0], n];
// loop over all beads for i = 1, n loop
for j = i+1, n-1 loop
// get distance between beads for pair interactions rij = pos(i) - pos(j);
// Minimum Image Convention rij = rij - box * round ( rij * invz box);
// magnitude of bead distance (rij) rijmag = sqrt add sqr rij;
151
// random, dissipative, and conservative forces are only calculated // if they
are within rc
if rc > rijmag then
// make unit vector for rij eij = rij * invz rijmag;
// determine the interaction parameter for conservative force a = select [ se-
lect[aij.aii, aij.ajj, element(i)==’Ar’], aij.aij, element(i) == element(j) ];
// calculate velocity difference for dissipative force vij = vel(i) - vel(j);
// calculate omega r and omega d used in f r and f d wr = 1 - rijmag * invz rc;
wd = sqr wr;
// conservative force fci = a * (1 - rijmag) * eij;
// dissipative force fdi = - gamma * wd * add (vij*eij) * eij;
//random force fri = sigma * wr * randN(1) * eij * inv sqrt dt;
// add up the forces and assign properly to the force vector f(i) = f(i) + ( fci +
fdi + fri ); f(j) = f(j) - ( fci + fdi + fri );
endif
endloop
endloop
// spring (bond) force calculations (f s)
bond rij = pos[bond.i] - pos[bond.j]; bond rij = bond rij - [box] * round (
bond rij * invz [box]); bond rijmag = sqrt app add sqr bond rij; bond eij =
bond rij * invz bond rijmag;
fsi = bond spring * (blength - bond rijmag) * bond eij; f[bond.i] = f[bond.i]
+ fsi; f[bond.j] = f[bond.j] - fsi;
// force due to electrostatic attraction to the wall (f w)
y = (tr pos)(2); sgny = sign y; y = abs y; ekd = exp(-es.kr*y); fwi =
tr [ 0, (-1.04765e-4*es.br*es.kr*invz sqr es.ns * es.P2P2) * ( es.SPP2P2*(-ekd * invz
(1-ekd) * invz (1+ekd)) + sqr ekd *invz (1-sqr ekd) ) - es.ea * // LJ (12 * pow[es.cd
152
/ y, 12] / y), // repulsive 0 ]; fwi = fwi * sgny; f = f + fwi;
return f;
endfunction
// This function places the molecule (Ar, He = A, B) in a periodic // cube
in a random position
local function placemolecules3d [NA, NA beads, NB, NB beads, box, rc, blength]
local chainsA, polyA, atomsA, posA, chainsB, polyB, atomsB, posB; local
k, new pos, rho, theta, phi, new chains; local poly chains, pos, x mask, y mask,
z mask, y, new y;
// Center the original coordinates and then place randomly next to an atom
// get Ar atom keys and places the first atom by changing the atom name, // the
mass, and the color based on element color. Does the same with He.
atomsA = app sm Build rep[’[Ar]’,NA]; aSetName [atomsA, tok cat [’A’,totok
((igen NA - 1) * NA beads + 1)] ]; posA = tr (randU rep [box, NA] - rep
[box/2,NA]); aSetPos [atomsA, posA]; polyA = atomsA; chainsA = aChain
atomsA;
atomsB = app sm Build rep[’[He]’,NB]; aSetName [atomsB, tok cat [’B’,totok
((igen NB - 1) * NB beads + 1)] ]; posB = tr (randU rep [box, NB] - rep [box/2,NB]);
aSetPos [atomsB, posB]; polyB = atomsB; chainsB = aChain atomsB;
// make the polymer. The previous loops put all of the atoms in the box for
// the first bead in a polymer. These loops finish the polymers
for k=2, NA beads loop
rho = blength * (1 + randU rep[0.2,NA] - 0.1); theta = randU rep[2*PI,NA]; phi
= randU rep[2*PI,NA]; new pos = [ rho * cos theta * sin phi, rho * sin theta
* sin phi, rho * cos phi ]; posA = new pos + posA;
atomsA = app sm Build rep[’[Ar]’,NA]; aSetName [atomsA, tok cat [’A’,totok
((igen NA - 1) * NA beads + k)]]; aSetPos [atomsA, posA]; Bond [polyA, atomsA];
153
polyA = atomsA; new chains = aChain atomsA; oReparent [aResidue atomsA,chainsA];
oDestroy new chains;
endloop
for k=2, NB beads loop
rho = blength * (1 + randU rep[0.2,NB] - 0.1); theta = randU rep[2*PI,NB]; phi
= randU rep[2*PI,NB]; new pos = [ rho * cos theta * sin phi, rho * sin theta
* sin phi, rho * cos phi ]; posB = new pos + posB;
atomsB = app sm Build rep[’[He]’,NB]; aSetName [atomsB, tok cat [’B’,totok
((igen NB - 1) * NB beads + k)]]; aSetPos [atomsB, posB]; Bond [polyB, atomsB];
polyB = atomsB; new chains = aChain atomsB; oReparent [aResidue atomsB,chainsB];
oDestroy new chains;
endloop
// Move any chains that cross the y axis to above/below the y axis //
(whichever is closest). Used so that polymers cannot cross the wall
poly chains = Chains[] |app length oChildren Chains[] > 1; pos = cat app
aPos cAtoms poly chains; x mask = cat rep[[1,0,0],(length pos)/3]; y mask =
cat rep[[0,1,0],(length pos)/3]; z mask = cat rep[[0,0,1],(length pos)/3]; y = pos
|y mask; new y = cat select [y, select[y + abs app min y + 1, y - abs app max
y - 1, abs app max y > abs app min y], sign app max y == sign app min y];
aSetPos [cat cAtoms polychains, [cat (pos|x mask), new y, cat (pos|z mask)]];
endfunction
// The setup function makes commonly used variables and sets up the system.
// It adds the periodic cell and colors the atoms. // Variables that are returned:
// i and j (pair interaction indices for all atoms) // mass (vector of masses) //
a (stores interaction parameters aii, ajj, and aij) // bond (stores bond indices for
bonded atoms with tags i and j) // es (stores all electrostatics parameters)
154
local function setup [massA, massB, box, aii, aij, ajj, energy attraction, colli-
sion diameter, ns, np, ps, pp, kappa, bead radius]
local n, atoms, element, I, J, mass, a, A, B, bond, es;
// enable the box CellParameters[’P1’, box, [90,90,90]]; CellEnable 1;
// get total number of beads n = length Atoms[]; atoms = Atoms[];
element = aElement atoms;
// Color the atoms aSetColorBy [atoms,’rgb’]; aSetRGB [atoms,
select[0x990000,0x999999,element==’Ar’]];
// Create the mass vector mass = select [massA, massB, element==’Ar’];
// make a vector of interaction parameters aij = [aii:aii, ajj:ajj, aij:aij];
// create a vector to collect bond information // dummy variables are used
first, then assigned to the tagged bond variable if add aBondCount atoms > 0 then
A = cat apt rep [x id atoms, aBondCount atoms]; B = indexof [cat aBonds atoms,
atoms]; [A,B] = [A,B] ||[A and B and A ¡ B]; bond.i = A; bond.j = B; endif
// setup electrostatic parameters es.ea = energy attraction; es.cd = col-
lision diameter; es.P2P2 = sqr ns * sqr ps + sqr np * sqr pp; es.ns = ns;
es.SPP2P2 = 2*ns*np*ps*pp * invz es.P2P2; es.kr = kappa * bead radius; es.br
= bead radius;
return [element, mass, aij, bond, es];
endfunction
// MD integration function
local function MD [mdb, vel, acc, mass, sigma, kbT, rc, box, iter, dt, sam-
ple time, sim length, bond spring, blength, element, aij, bond, init, es]
local pos, n, gamma, inv sqrt dt, total steps; local time, trvel, kT;
// initialize necessary values pos = tr aPos Atoms[]; n = length Atoms[];
gamma = sqr sigma / (2 * kbT); inv sqrt dt = inv sqrt dt;
// total number of iterations total steps = int ceil (sim length / dt);
155
loop
// VV from Groot and Warren, which is VV since using lambda = 0.5 pos = pos
+ vel * dt + 0.5 * sqr dt * acc;
// Periodic Boundary Conditions pos = pos - [box] * round (pos * invz [box]);
aSetPos [Atoms[], tr pos];
vel = vel + 0.5 * dt * acc;
acc = DPD Force [n, pos, box, vel, rc, gamma, sigma, aij, element, bond, bond spring,
blength, inv sqrt dt, es] / mass;
vel = vel + 0.5 * dt * acc;
time = (iter = iter + 1) * dt;
if mod [iter, sample time] == 0 then trvel = tr vel; kT = add (mass * add
sqr trvel) / (3 * n - 3); WriteDB [mdb, time, kT, tr acc, trvel, init]; endif
until iter > total steps endloop
db Close mdb;
endfunction
// GetDPDSystem pulls a database entry from a given database and inserts
// it into the MOE window for viewing
global function GetDPDSystem [dbname, entry index]
local mdb, values, chains;
mdb = db Open tok cat[dbname,’.mdb’]; values = db Read [mdb, (db Entries
mdb)(entry index), [’mol’,’init’]];
local [massA, massB, edgex, edgey, edgez, sigma, kbT, aii, aij, ajj, rc, sim length,
dt, sample time, bond spring, blength, bead radius, kappa, energy attraction, col-
lision diameter, ns, ps, np, pp] = values.init;
// Load current system into the MOE window chains = mol Create
values.mol;
// Set colors for the atom types aSetColorBy [Atoms[],’rgb’]; aSetRGB
156
[Atoms[], select[0x990000,0x999999,aElement Atoms[] == ’Ar’]];
//Creates the box CellParameters [’P1’, [edgex,edgey,edgez], [90,90,90]];
CellEnable 1;
db Close mdb;
endfunction
// DPD restart restarts a simulation that was ended prematurely
global function DPD restart [dbname]
local mdb, last entry, values, chains, box, vel, acc, iter;
mdb = db Open [tok cat[dbname,’.mdb’], ’read-write’];
last entry = last db Entries mdb;
// reads in values from the last entry values = db Read [mdb, last entry,
[’mol’, ’time’, ’accx’, ’accy’, ’accz’, ’velx’, ’vely’, ’velz’, ’init’] ];
local [massA, massB, edgex, edgey, edgez, sigma, kbT, aii, aij, ajj, rc, sim length,
dt, sample time, bond spring, blength, bead radius, kappa, energy attraction, col-
lision diameter, ns, ps, np, pp] = values.init;
// Load current system into the MOE window chains = mol Create
values.mol;
// set up the system box = [edgex, edgey, edgez];
local [element, mass, a, bond, es] = setup [massA, massB, box, aii, aij, ajj,
energy attraction, collision diameter, ns, np, ps, pp, kappa, bead radius];
vel = tr [values.velx, values.vely, values.velz]; acc = tr [values.accx, val-
ues.accy, values.accz];
iter = int (values.time / dt);
MD [mdb, vel, acc, mass, sigma, kbT, rc, box, iter, dt, sample time, sim length,
bond spring, blength, element, a, bond, values.init, es];
endfunction
// Main Function
157
global function DPD [dbname, NA, massA, NA beads, NB, massB, NB beads,
edgex, edgey, edgez, sigma, kbT, aii, aij, ajj, rc, sim length, dt, sample time, bond spring,
blength, bead radius, kappa, energy attraction, collision diameter, ns, ps, np, pp]
// KBOLTZ = 0.00198722 kcal/K*mol // dbname = Database name as
token (-.mdb extension) // NA = total number of A chains // massA = mass of
an A bead (dimensionless mass units, generally 1) // NA beads = the number of
A beads in each A chain // NB = total number of B polymers // massB = mass
of a B bead (dimensionless mass units) // NB beads = the number of B beads in
each B chain // edgex = the x dimension of the box (dimensionless units of Rc)
// edgey = the y dimension of the box (dimensionless units of Rc) // edgez = the
z dimension of the box (dimensionless units of Rc) // sigma = dimensionless value
for sigma used in DPD force calculation // sigma**2 = 2*gamma*kbT (larger
values of sigma = faster equilibration) // kbT = dimensionless value for energy.
Should be assigned 1, where // E* = E/kbT // aii = interaction parameter
of A-A Interactions (dimensionless E units) // aij = interaction parameter of
A-B Interactions (dimensionless E units) // aij = interaction parameter of B-B
Interactions (dimensionless E units) // rc = cutoff radius (dimensionless about
3*bead radius) // sim length = total simulation time (dimensionless time units)
// dt = time step (dimensionless units) // sample time = number of time steps
between samples // bond spring = dimensionless value of the bond spring constant
// blength = dimensionless equilibrium bond length // bead radius = radius of
a bead (assumes A & B beads are the same size) // (dimensionless units of Rc)
// kappa = inverse debeye length (dimensionless units of Rc) // energy attraction
= // collision diameter = // ns = nu s, // ps = psi s, // np = nu p,
// pp = psi p,
local box, init, mdb, fields, n, pos, vel, inv sqrt dt, gamma, acc, kT, iter;
box = [edgex,edgey,edgez]; init = [massA, massB, edgex, edgey, edgez,
158
sigma, kbT, aii, aij, ajj, rc, sim length, dt, sample time, bond spring, blength,
bead radius, kappa, energy attraction, collision diameter, ns, ps, np, pp];
// Creates the Data base mdb = db Open [tok cat[dbname,’.mdb’],’create’];
db EnsureField[mdb, ’mol’, ’molecule’];
fields = [’time’,’kbT’,’accx’,’accy’,’accz’,’velx’,’vely’,’velz’,’init’]; apt db EnsureField[mdb,
fields, ’float’];
//calls the random placement of atoms placemolecules3d [NA, NA beads,
NB, NB beads, box, rc, blength];
//setup the system local [element, mass, a, bond, es] = setup [massA,
massB, box, aii, aij, ajj, energy attraction, collision diameter, ns, np, ps, pp, kappa,
bead radius];
n = length Atoms[]; pos = tr aPos Atoms[];
// initial guess for the velocities (also removes linear momentum) vel =
randN rep[sqrt (kbT/mass), 3]; vel = vel - app add (vel * [mass]) / add mass;
vel = tr ( vel * sqrt ( (3 * n - 3) * kbT / add (mass * add sqr vel) ) );
// get variables needed for first force calculation inv sqrt dt = inv sqrt dt;
gamma = sqr sigma / (2 * kbT);
acc = DPD Force [n, pos, box, vel, rc, gamma, sigma, a, element, bond,
bond spring, blength, inv sqrt dt, es] / mass;
kT = add (mass * add sqr tr vel) / (3 * n - 3);
//output to database WriteDB [mdb, 0, kT, tr acc, tr vel, init];
iter = 0;
MD [mdb, vel, acc, mass, sigma, kbT, rc, box, iter, dt, sample time, sim length,
bond spring, blength, element, a, bond, init, es];
endfunction
159
REFERENCES
[1] Adachi, Y. and Wada, T., “Initial stage dynamics of bridging flocculationof polystyrene latex spheres with polyethylene oxide,” Journal of Colloid andInterface Science, vol. 229, pp. 148–154, 2000.
[2] Adriani, P. and Chakraborty, A., “Dynamics of relaxation at stronglyinteracting polymer-solid interfaces: Effects of chain architecture,” Journal ofChemical Physics, vol. 95, pp. 4263–4274, 1993.
[3] Aksberg, R., Einarson, M., Berg, J., and Odberg, L., “Adlayer thick-ness of two cationic polyacrylamides adsorbed onto polystyrene latices,” Lang-muir, vol. 7, pp. 43–45, 1991.
[4] Aksberg, R. and Odberg, L., “Adsorption of an anionic polyacrylamide oncellulosic fibers with pre-adsorbed cationic polyelectrolytes,” Nordic Pulp andPaper Research Journal, vol. 5, no. 4, pp. 168–171, 1990.
[5] Al-Maawali, S., Bemis, J., Akhremitchev, B., Leecharoen, R.,Janesko, B., and Walker, G., “Study of the polydispersity of graftedpoly(dimethylsiloxane) surfaces using single-molecule atomic force microscopy,”Journal of Physical Chemistry B, vol. 105, pp. 3965–3971, 2001.
[6] Al-Maawali, S., Bemis, J., Akhremitchev, B., Liu, H., and Walker,G., “Single-molecule afm study of polystyrene grafted at gold surfaces,” Journalof Adhesion, vol. 81, pp. 999–1016, 2005.
[7] Allen, M. and Tildesley, D., Computer Simulation of Liquids. OxfordScience Publications, 1989.
[8] Arita, T., Kanda, Y., and Higashitani, K., “In situ observation of sin-gle polymers adsorbed onto mica surfaces in water,” Journal of Colloid andInterface Science, vol. 273, pp. 102–105, 2004.
[9] Ash, S., Everett, D., and Findenegg, G., “Multilayer theory for adsorp-tion from solution,” Transactions of the Faraday Society, vol. 66, pp. 708–722,1970.
[10] Aubouy, M., “Organization of polymers at interfaces,” Physical Review E: Sta-tistical Physics, Plasmas, Fluids, and Related Interdisciplinary Topics, vol. 56,pp. 3370–3377, 1997.
[11] Aubouy, M., Guiselin, O., and Raphael, E., “Scaling description of poly-mer interfaces: Flat layers,” Macromolecules, vol. 29, pp. 7261–7268, 1996.
160
[12] Avranas, A. and Iliou, P., “Interaction between hydroxypropylmethylcel-lulose and the anionic surfactants hexane-, octane-, and decanesulfonic acidsodium salts, as studied by dynamic surface tension measurments,” Journal ofColloid and Interface Science, vol. 258, pp. 102–109, 2003.
[13] Backer, J., Lowe, C., Hoefsloot, H., and Iedema, P., “Combined lengthscales in dissipative particle dynamics,” Journal of Chemical Physics, vol. 123,pp. 114905–1–114905–10, 2005.
[14] Baldwin, J. and Dempsey, B., “Effects of brownian motion and structuredwater on aggregation of charged particles,” Colloids and Surfaces A: Physico-chemical and Engineering Aspects, vol. 177, pp. 111–122, 2001.
[15] Barnett, K., Cosgrove, T., Vincent, B., Burgess, A., Crowley, T.,King, T., Turner, J., and Tadros, T., “Neutron scattering, nuclear mag-netic resonance, and photon correlation studies of polymers adsorbed at thesolid-solution interface,” Polymer, vol. 22, pp. 283–285, 1981.
[16] Barnett, K., Cosgrove, T., Vincent, B., Sissons, D., and Cohen Stu-art, M., “The measurement of the polymer-bound fraction at the solid-liquid interface by pulsed nuclear magnetic resonance,” Macromolecules, vol. 14,pp. 1018–1020, 1981.
[17] Bauer, D., Buchhammer, H., Fuchs, A., Jaeger, W., Killmann, E.,Lunkwitz, K., Rehmet, R., and Schwarz, S., “Stability of colloidal sil-ica, sikron and polystyrene latex influenced by the adsorption of polycations ofdifferent charge density,” Colloids and Surfaces A: Physicochemical and Engi-neering Aspects, vol. 156, pp. 291–305, 1999.
[18] Bauer, D., Killmann, E., and Jaeger, W., “Adsorption of poly(diallyl-dimethyl-ammoniumchloride)(pdadmac)and copolymers of dadmac with n-methyl-n-vinyl-acetamide(nmva) on colloidal silica,” Progress in Colloid andPolymer Science, vol. 109, pp. 161–169, 1998.
[19] Behl, S. and Moudgil, B. M., “Control of active sites in selective floccula-tion: Ii. role of site blocking agents,” Journal of Colloid and Interface Science,vol. 161, pp. 422 – 429, 1993.
[20] Behl, S. and Moudgil, B. M., “Control of active sites in selective floccula-tion: Iii. mechanism of site blocking,” Journal of Colloid and Interface Science,vol. 161, pp. 430 – 436, 1993.
[21] Behl, S., Moudgil, B., and Prakash, T., “Control of active sites in se-lective flocculation: I. mathematical model,” Journal of Colloid and InterfaceScience, vol. 161, pp. 414 – 421, 1993.
[22] Behrens, S. H. and Grier, D. G., “The charge of glass and silica surfaces,”Journal of Chemical Physics, vol. 115, pp. 6716–6721, 2001.
161
[23] Bellemans, A., “Statistical mechanics of chain molecules at an interface,”Journal of Colloid and Interface Science, vol. 58, pp. 521–527, 1977.
[24] Bemis, J., Akhremitchev, B., and Walker, G., “Single polymer chainelongation by atomic force microscopy,” Langmuir, vol. 15, pp. 2799–2805, 1999.
[25] Bhattacharjee, S. and Elimelech, M., “Surface element integration: Anovel technique for evaluation of dlvo interaction between a particle and a flatplate,” Journal of Colloid and Interface Science, vol. 193, pp. 273–285, 1997.
[26] Biggs, S. and Proud, A., “Forces between silica surfaces in aqueous solutionsof a weak polyelectrolyte,” Langmuir, vol. 13, pp. 7202–7210, 1997.
[27] Boek, E., Coveney, P., Lekkerkerker, H., and van der Schoot, P.,“Simulating the rheology of dense colloidal suspensions using dissipative particledynamics,” Physical Review E: Statistical Physics, Plasmas, Fluids, and RelatedInterdisciplinary Topics, vol. 55, pp. 3124–3133, 1997.
[28] Bohmer, M., Evers, O., and Scheutjens, J., “Weak polyelectrolytes be-tween two surfaces: Adsorption and stabilization,” Macromolecules, vol. 23,pp. 2288–2301, 1990.
[29] Broseta, D., “Molecular weight and polydispersity effects at polymer-polymerinterfaces,” Macromolecules, vol. 23, pp. 132–139, 1990.
[30] Brotherson, B., Bottomley, L., Ludovice, P., and Deng, Y., “Cationicpolyacrylamide conformation on mica studied by single molecule ”pulling” withscanning probe microscopy,” Macromolecules, vol. 40, pp. 4561–4567, 2007.
[31] Brotherson, B., Bottomley, L., Ludovice, P., and Deng, Y., “Obser-vation of a single adsorbed polymers conformation on mica with scanning probemicroscopy: effects of retraction rate and dwell time,” in 233rd ACS NationalMeeting, Chicago, IL, March 25-29, 2007, 2007.
[32] Bustamante, C., Smith, S., Liphardt, J., and Smith, D., “Single-molecule studies of dna mechanics,” Current Opinion in Structural Biology,vol. 10, pp. 279–285, 2000.
[33] Cahn, J. and Hilliard, J., “Free energy of a nonuniform system. 1. interfacialfree energy,” Journal of Chemical Physics, vol. 28, pp. 258–267, 1958.
[34] Carnie, S. and Chan, D., “Interaction free energy between identical spher-ical colloidal particles: The linearized poisson-boltzmann theory,” Journal ofColloid and Interface Science, vol. 155, pp. 297–312, 1993.
[35] Carrillo, J.-M. and Dobrynin, A., “Molecular dynamics simulations ofpolyelectrolyte adsorption,” Langmuir, vol. 23, pp. 2472–2482, 2007.
162
[36] Carrion-Vazquez, M., Marszalek, P., Oberhauser, A., and Fernan-dez, J., “Atomic force microscopy captures length phenotypes in single pro-teins,” Proceedings of the National Academy of Science USA, vol. 96, pp. 11288–11292, 1999.
[37] Carrion-Vazquez, M., Oberhauser, A., Fowler, S., Marszalek, P.,Broedel, S., Clarke, J., and Fernandez, J., “Mechanical and chemi-cal unfolding of a single protein: A comparison,” Proceedings of the NationalAcademy of Science USA, vol. 96, pp. 3694–3699, 1999.
[38] Chakraborty, A. and Adriani, P., “Glassy relaxation at polymer-solidinterfaces,” Macromolecules, vol. 25, pp. 2470–2473, 1992.
[39] Chang, S. and Chung, I., “Effect of shear flow on polymer desorption andlatex dispersion stability in the presence of adsorbed polymer,” Macromolecules,vol. 24, pp. 567–571, 1991.
[40] Chatellier, X., Senden, T., Joanny, J.-F., and Di Meglio, J.-M.,“Detachment of a single polyelectrolyte chain adsorbed on a charged surface,”Eurphysics Letters, vol. 41, pp. 303–308, 1998.
[41] Chibowski, S., Wiceniewska, M., and Opala Mazur, E., “The effectof temperature on the adsorption and conformation of polyacrylic acid macro-molecules at the zro2-polymer solution interface,” Powder Technology, vol. 141,pp. 12–19, 2004.
[42] Chowdanowski, P. and Stoll, S., “Polyelectrolyte adsorption on chargedparticles: Ionic concentration and particle size effects-a monte carlo approach,”Journal of Chemical Physics, vol. 115, pp. 4951–4960, 2001.
[43] Chu, B., Laser Light Scattering. Academic Press, Inc., 1974.
[44] Clancy, T. and Webber, S., “Controlling adsorption of polymers atpolymer-modified surfaces,” Macromolecules, vol. 30, pp. 1340–1346, 1997.
[45] Clark, A. and Lal, M., “Monte carlo approach to the evaluation of theconfigurational free energy of chains,” Journal of Physics A: Mathematics andGeneral, vol. 11, pp. L11–L15, 1978.
[46] Clausen-Schaumann, H., Seitz, M., Krautbauer, R., and Gaub, H.,“Force spectroscopy with single bio-molecules,” Current Opinion in ChemicalBiology, vol. 4, pp. 524–530, 2000.
[47] Cohen Stuart, M. A. and Tamai, H., “Dynamics of adsorbed polymers.1. thickness relaxation of poly(vinylpyrrolidone) on glass,” Macromolecules,vol. 21, pp. 1863–1866, 1988.
163
[48] Cohen Stuart, M., Fleer, G., and Scheutjens, J., “Displacement ofpolymers. 1. theory. segmental adsorption energy from polymer desorption inbinary solvents,” Journal of Colloid and Interface Science, vol. 97, pp. 515–525,1984.
[49] Cohen Stuart, M., Scheutjens, J., and Fleer, G., “Polydispersity effectsand the interpretation of polymer adsorption isotherms,” Journal of PolymerScience, Polymer Physics Edition, vol. 18, pp. 559–573, 1980.
[50] Cohen Stuart, M. and Tamai, H., “Dynamics of adsorbed polymers. 2.thickness relaxation of poly(ethylene oxide) on glass as a function of segmentalbinding energy,” Langmuir, vol. 4, pp. 1184–1188, 1988.
[51] Cohen Stuart, M. and Tamai, H., “A novel method to study polymerinterfacial dynamics,” Colloids and Surfaces, vol. 31, p. 265, 1988.
[52] Cohen Stuart, M., Waajen, F., Cosgrove, T., Vincent, B., andCrowley, T., “Hydrodynamic thickness of adsorbed polymer layers,” Macro-molecules, vol. 17, pp. 1825–1830, 1984.
[53] Conti, M., Bustanji, Y., Falini, G., Ferruti, P., Stefoni, S., andSamori, B., “The desorption process of macromolecules adsorbed on interfaces:the force spectroscopy approach,” ChemPhysChem, vol. 2, pp. 610–613, 2001.
[54] Conti, M., Falini, G., and Samori, B., “How strong is the coordina-tion bond between a histidine tag and ni-nitrilotriacetate? an experiment ofmechanochemistry on single molecules,” Angewandte Chemie, vol. 39, pp. 215–218, 2000.
[55] Cosgrove, T., “Estimates of the bound fraction of an adsorbed polymer at thesolid-liquid interface. exact enumeration study of a self-avoiding walk model,”Macromolecules, vol. 15, pp. 1290–1293, 1982.
[56] Cosgrove, T., “Polymer desorption by nmr,” Colloids and Surfaces, vol. 31,p. 117, 1988.
[57] Cosgrove, T., “Volume-fraction profiles of adsorbed polymers,” Journal ofthe Chemical Society, Faraday Transactions, vol. 86, pp. 1323–1332, 1990.
[58] Cosgrove, T., Crowley, T., Vincent, B., Barnett, K., and Tadros,T. F., “The configuration of adsorbed polymers at the solid-solution interface,”Faraday Symposia of the Chemical Society, vol. 16, pp. 101–108, 1981.
[59] Cosgrove, T. and Fergie-Woods, J., “On the kinetics and reversibility ofpolymer adsorption,” Colloids and Surfaces, vol. 25, pp. 91–99, 1987.
[60] Cosgrove, T. and Griffiths, P., “Nuclear magnetic resonance studies ofadsorbed polymer layers,” Advances in Colloid and Interface Science, vol. 42,pp. 175–204, 1992.
164
[61] Cosgrove, T. and Griffiths, P., “Characterisation of adsorbed polymerlayers using nmr solvent diffusion studies,” Colloids and Surfaces A: Physico-chemical and Engineering Aspects, vol. 84, pp. 249–258, 1994.
[62] Cosgrove, T., Luckham, P., Richardson, R., Webster, J., andZarbakhsh, A., “The measurement of volume fraction profiles for adsorbedpolymers under compression using neutron reflectometry,” Colloids and Sur-faces A: Physicochemical and Engineering Aspects, vol. 86, pp. 103–110, 1994.
[63] Cosgrove, T., Phipps, J., Richardson, R., Hair, M., and Gu-zonas, D., “Surface force and neutron scattering studies on adsorbed poly(2-vinylpyridine)-b-polystyrene,” Colloids and Surfaces A: Physicochemical andEngineering Aspects, vol. 86, pp. 91–101, 1994.
[64] Cosgrove, T. and Ryan, K., “Nmr relaxation studies on poly(ethylene ox-ide) terminally attached at the polystyrene/water interface,” Journal of theChemical Society, Chemical Communications, vol. 21, pp. 1424–1426, 1988.
[65] Cosgrove, T. and Ryan, K., “Nmr and neutron-scattering studies onpoly(ethylene oxide) terminally attached at the polystyrene/water interface,”Langmuir, vol. 6, pp. 136–142, 1990.
[66] Couture, L. and van de Ven, T., “Hydrodynamic layer thickness ofpoly(ethylene oxide) adsorbed on polystyrene latex,” Colloids and Surfaces,vol. 54, pp. 245–260, 1991.
[67] Cui, S., Liu, C., Zhang, W., Zhang, X., and Wu, C., “Desorption forceper polystyrene segment in water,” Macromolecules, vol. 36, pp. 3779–3782,2003.
[68] Dahlgren, M., Waltermo, A., Blomberg, E., Claesson, P.,Sjostrom, L., Akesson, T., and Jonsson, B., “Salt effects on the interac-tion between adsorbed cationic polyelectrolyte layers-theory and experiment,”Journal of Physical Chemistry, vol. 97, pp. 11769–11775, 1993.
[69] Daoulas, K. and Muller, M., “Single chain in mean field simulations:Quasi-instantaneous field approximation and quantitative comparison withmonte carlo simulations,” Journal of Chemical Physics, vol. 125, pp. 184904–1–184904–18, 2006.
[70] Daoulas, K., Muller, M., dee Pablo, J., Nealey, P., and Smith, G.,“Morphology of multi-component polymer systems: Single chain in mean fieldsimulation studies,” Soft Matter, vol. 2, pp. 573–583, 2006.
[71] de Gennes, P.-G., Scaling Concepts in Polymer Physics. Cornell UniversityPress, 1979.
[72] de Gennes, P.-G., “Polymer solutions near an interface. adsorption and de-pletion layers,” Macromolecules, vol. 14, pp. 1637–1644, 1981.
165
[73] de Gennes, P.-G., “Polymers at an interface. 2. interaction between twoplates carrying adsorbed polymer layers,” Macromolecules, vol. 15, pp. 492–500, 1982.
[74] de Joannis, J., Park, C.-W., Thomatos, J., and Bitsanis, I., “Ho-mopolymer physisorption: A monte carlo study,” Langmuir, vol. 17, pp. 69–77,2001.
[75] De Witt, J. and van de Ven, T., “The effect of neutral polymers andelectrolyte on the stability of aqueous polystyrene latex,” Advances in Colloidand Interface Science, vol. 42, pp. 41–64, 1992.
[76] Delle Site, L., Abrams, C., Alavi, A., and Kremer, K., “Polymersnear metal surfaces: Selective adsorption and global conformations,” PhysicalReview Letters, vol. 89, pp. 156103–1 – 156103–4, 2002.
[77] Deng, Y., Disxon, J., White, G., Loeppert, R., and Juo, A., “Bondingbetween polyacrylamide and smectite,” Colloids and Surfaces A: Physicochem-ical and Engineering Aspects, vol. 281, pp. 82–91, 2006.
[78] Di Biasio, A., Bordi, F., and Cametti, C., “Effect of polymer adsorptionon peo-coated latex particles during salt-induced aggregation,” Colloids andSurfaces A: Physicochemical and Engineering Aspects, vol. 160, pp. 189–198,1999.
[79] Diaz Barrios, A. and Howard, G., “Adsorption of polymers at the solu-tion/solid interface. 15. styrene-vinylferrocene copolymers,” MakromolekulareChemie, vol. 182, pp. 1081–1096, 1981.
[80] Dickinson, E. and Euston, S., “Short-range structure of simulated flocs ofparticles with bridging polymer,” Colloids and Surfaces, vol. 62, pp. 231–242,1992.
[81] DiMarzio, E., “Proper accounting of conformations of a polymer near a sur-face,” Journal of Chemical Physics, vol. 42, pp. 2101–2106, 1965.
[82] DiMarzio, E. and McCrackin, F., “One-dimensional model of polymeradsorption,” Journal of Chemical Physics, vol. 43, pp. 539–547, 1965.
[83] Dobrynin, A., Deshkovski, A., and Rubinstein, M., “Adsorption of poly-electrolytes at oppositely charged surfaces,” Macromolecules, vol. 34, pp. 3421–3436, 2001.
[84] Dorbrynin, A. and Rubinstein, M., “Theory of polyelectrolytes in solutionand at surfaces,” Progress in Polymer Science, vol. 30, pp. 1049–1118, 2005.
[85] Douglas, J., Schneider, H., Frantz, P., Lipman, R., and Granick, S.,“The origin and characterization of conformational heterogeneity in adsorbedpolymer layers,” Journal of Physics: Condensed Matter, vol. 9, pp. 7699–7718,1997.
166
[86] Eklund, D. and Lindstrom, T., Paper Chemistry: An Introduction. DTPaper Science Publications, 1991.
[87] Elaissari, A. and Pefferkorn, E., “Polyelectrolyte adsorption atsolid/liquid interfaces: A simple model for the structural relaxation and ex-cluded area effects,” Journal of Colloid and Interface Science, vol. 143, pp. 85–91, 1991.
[88] Ermoshkin, A., Chen, J., and Lai, P.-Y., “Adsorption of a random copoly-mer at a lipid bilayer membrane,” Physical Review E, vol. 66, pp. 051912–1 –051912–6, 2002.
[89] Fleer, G., Stuart, M., Scheutjens, J., Cosgrove, T., and Vincent,B., Polymers at Interfaces. Chapman and Hall, 1993.
[90] Flood, C., Cosgrove, T., Howell, I., and Revell, P., “Effects of elec-trolytes on adsorbed polymer layers: Poly(ethylene oxide)-silica system,” Lang-muir, vol. 22, pp. 6923–6930, 2006.
[91] Flood, C., Cosgrove, T., Qiu, D., Espidel, Y., Howell, I., and Rev-ell, P., “Influence of a surfactant and electrolytes on adsorbed polymer layers,”Langmuir, vol. 23, pp. 2408–2413, 2007.
[92] Florin, E.-L., Moy, V., and Gaub, H., “Adhesion forces between individualligand-receptor pairs,” Science, vol. 264, pp. 415–417, 1994.
[93] Forsman, W. and Latshaw, B., “Conformation of polymer molecules atsolid-liquid interfaces by small-angle neutron scattering,” Polymer Engineeringand Science, vol. 36, pp. 1114–1124, 1996.
[94] Frenkel, D. and Smit, B., Understanding Molecular Simulation From Algo-rithms to Applications. Academic Press, 2002.
[95] Fu, Z. and Santore, M., “Evolution of layer density and thickness duringpoly(thylene oxide) adsorption onto silica,” Langmuir, vol. 13, pp. 5779–5781,1997.
[96] Gao, S., Hahn, J., and Ho, W., “Adsorption induced hydrogen bonding bych group,” Journal of Chemical Physics, vol. 119, pp. 6232–6236, 2003.
[97] Garnier, L., Gauthier-Manuel, B., van der Vegte, E., Snijders, J.,and Hadziioannou, G., “Covalent bond force profile and cleavage in a singlepolymer chain,” Journal of Chemical Physics, vol. 113, pp. 2497–2503, 2000.
[98] Gess, J., ed., Retention of Fines and Fillers During Papermaking. TAPPIPRESS, 1975.
[99] Gibson, J., Zhang, K., Chen, K., Chynoweth, S., and Manke, C.,“Simulation of colloid-polymer systems using dissipative particle dynamics,”Molecular Simulation, vol. 23, pp. 1–41, 1999.
167
[100] Gilchrist, V., Lu, J., Staples, E., Garrett, P., and Penfold, J.,“Adsorption of pentaethylene glycol monododecyl ether at the planar poly-mer/water interface studied by specular neutron reflection,” Langmuir, vol. 15,pp. 250–258, 1999.
[101] Goel, T., Patra, C., Ghosh, S., and Mukherjee, T., “Structure of shortpolymers at interfaces: A combined simulation and theoretical study,” Journalof Chemical Physics, vol. 121, pp. 4865–4873, 2004.
[102] Grandbois, M., Beyer, M., Rief, M., Clausen-Schaumann, H., andGaub, H., “How strong is a covalent bond?,” Science, vol. 283, pp. 1727–1730,1999.
[103] Gregory, J., “Interaction of unequal double layers at constant charge,” Jour-nal of Colloid and Interface Science, vol. 51, pp. 44–51, 1975.
[104] Griebel, T., Kulicke, W.-M., and Hashemzadeh, A., “Characterizationof water-soluble, cationic polyelectrolytes as exemplified by poly(acrylamide-co-trimethylammoniumethylethacrylate chloride) and the establishment ofstructure-property relationships,” Colloid and Polymer Science, vol. 269,pp. 113–120, 1991.
[105] Grohens, Y., Carriere, P., Hamon, L., Castelein, G., Holl, Y., andSpevacek, J., “Adsorption of polymer/solvent complexes on silica surfaces,”Macromolecular Symposia, vol. 166, pp. 59–70, 2001.
[106] Groot, R. and Warren, P., “Dissipative particle dynamics: Bridgingthe gap between atomistic and mesoscopic simulation,” Journal of ChemicalPhysics, vol. 107, pp. 4423–4435, 1997.
[107] Haschke, H., Force Spectroscopy and Microscopy of Single Molecules at theSolid-Liquid Interface. PhD thesis, University of Bristol, 2003.
[108] Haschke, H., Miles, M., and Koutsos, V., “Conformation of a singlepolyacrylamide molecule adsorbed onto a mica surface studied with atomicforce microscopy,” Macromolecules, vol. 37, pp. 3799–3803, 2004.
[109] Haschke, H., Miles, M., and Sheppard, S., “Adsorption of individual poly-acrylamide molecules studied by atomic force microscopy,” Single Molecules,vol. 3, pp. 171–172, 2002.
[110] Hasegawa, R. and Doi, M., “Adsorption dynamics: Extension of self-consistent field theory to dynamical problems,” Macromolecules, vol. 30,pp. 3086–3089, 1997.
[111] Hayashi, S., Abe, T., Higashi, N., Niwa, M., and Kurihara, K., “Poly-electrolyte brush layers studied by surface forces measurement: Dependenceon ph and salt concentrations and scaling,” Langmuir, vol. 18, pp. 3932–3944,2002.
168
[112] Hecker, R., Fawell, P., and Jefferson, A., “The agglomeration of highmolecular mass polyacrylamide in aqueous solutions,” Journal of Applied Poly-mer Science, vol. 70, pp. 2241–2250, 1998.
[113] Heimenz, P. and Rajagopalan, R., Principles of Colloid and Surface Chem-istry. Marcel Dekker Inc., 1997.
[114] Helfand, E., “Theory of inhomogeneous polymers: Lattice model for polymer-polymer interfaces,” Journal of Chemical Physics, vol. 63, pp. 2192–2198, 1975.
[115] Helfand, E., “Theory of inhomogeneous polymers. lattice model for solutioninterfaces,” Mcaromolecules, vol. 9, pp. 307–310, 1976.
[116] Hesselink, F., “Theory of stabilization of dispersions by adsorbed macro-molecules. 1. statistics of the change of some configurational properties of ad-sorbed macromolecules on the approach of an impenetrable interface,” Journalof Physical Chemistry, vol. 75, pp. 65–71, 1971.
[117] Higgins, J. and Benoit, H., Polymers and Neutron Scattering. Oxford Uni-versity Press, 1994.
[118] Hoda, N. and Kumar, S., “Brownian dynamics simulations of polyelectrolyteadsorption onto charge patterned surfaces,” Langmuir, vol. 23, pp. 1741–1751,2007.
[119] Hoogendam, C., Peters, J., Tuinier, R., De Keizer, A., and Co-hen Stuart, M., “Effective viscosity of polymer solutions: Relation to thedetermination of the depletion thickness and thickness of the adsorbed layerof cellulose derivatives,” Journal of Colloid and Interface Science, vol. 207,pp. 309–316, 1998.
[120] Hoogerbrugge, P. and Koelman, J., “Simulating microscopic hydrody-namic phenomena with dissipative particle dynamics,” Europhysics Letters,vol. 19, pp. 155–160, 1992.
[121] Hugel, T., Grosholz, M., Clausen-Shaumann, H., Pfau, A., Gaub,H., and Seitz, M., “Elasticity of single polyelectrolyte chains and their des-orption from solid supports studied by afm based single molecule force spec-troscopy,” Macromolecules, vol. 34, pp. 1039–1047, 2001.
[122] Israelachvili, J., Intermolecular and Surface Forces. Academic Press, 1992.
[123] Israelachvili, J. and Adams, G., “Measurement of forces between two micasurfaces in aqueous electrolyte solutions in the range of 0-100nm,” Journal of theChemical Society, Faraday Transactions 1: Physical Chemistry in CondensedPhases, vol. 74, pp. 975–1001, 1978.
169
[124] Jakobsen, A., Besold, G., and Mouritsen, O., “Multiple time step up-date schemes for dissipative particle dynamics,” Journal of Chemical Physics,vol. 124, pp. 094104–1–094104–6, 2006.
[125] Janshoff, A., Neitzert, M., Oberdorfer, Y., and Fuchs, H., “Forcespectroscopy of molecular systems-single molecule spectroscopy of polymers andbiomolecules,” Angewandte Chemie, vol. 39, pp. 3212–3237, 2000.
[126] Jenkel, E. and Rumbach, B., “Adsorption of high polymers from solution,”Zeitschrift fuer Elektrochemie und Angewandte Physikalische Chemie, vol. 55,pp. 612–618, 1951.
[127] Karlstrom, G., Carlsson, A., and Lindman, B., “Phase diagrams of non-ionic polymer-water systems. experimental and theoretical studies of the effectsof surfactants and other cosolutes,” Journal of Physical Chemistry, vol. 94,pp. 5005–5015, 1990.
[128] Killmann, E., Sapuntzjis, P., and Maier, H., “Dynamic light scatter-ing for characterization of latexes,” Makromolekulare Chemie, MacromolecularSymposia, vol. 61, pp. 42–58, 1992.
[129] Kim, K. and Jo, W., “Effect of chain architecture of graft copolymer on thestructure of adsorbed layer: A monte carlo simulation approach,” Polymer,vol. 42, pp. 3205–3211, 2001.
[130] Klein, J. and Pincus, P., “Interaction between surfaces with adsorbed poly-mers: Poor solvents,” Macromolecules, vol. 15, pp. 1129–1135, 1982.
[131] Klein Wolterink, J., Koopal, L., Cohen Stuart, M., and Van Riems-dijk, W., “Surface charge regulation upon polyelectrolyte adsorption,hematite, polystyrene sulfonate, surface charge regulation theoretical calcula-tions and hematite-poly(styrene sulfonate) system,” Colloids and Surfaces A:Physicochemical Engineering Aspects, vol. 291, pp. 13–23, 2006.
[132] Kong, Y., Manke, C., Madden, W., and Schlijper, A., “Simulation of aconfined polymer in solution using the dissipative particle dynamics method,”International Journal of Thermophysics, vol. 15, pp. 1093–1101, 1994.
[133] Krishantha, D. M. M., Rajapakse, R. M. G., Tennakoon, D. T. B.,and Dias, H. V. R., “Ac impedance analysis of polyaniline-montmorillonitenanocomposites,” Ionics, vol. 12, pp. 287–294, 2006.
[134] Kumaki, J. and Hashimoto, T., “Conformational change in an isolated singlesynthetic polymer chain on a mica surface observed by atomic force microscopy,”Journal of the American Chemical Society, vol. 125, pp. 4907–4917, 2003.
[135] Kumaki, J., Nishikawa, Y., and Hashimoto, T., “Visualization of single-chain conformations of a synthetic polymer with atomic force microscopy,”Journal of the American Chemical Society, vol. 118, pp. 3321–3322, 1996.
170
[136] Lapcik, L., Alince, B., and van de Ven, T., “Effect of poly(ethylene oxide)on the stability and flocculation of clay dispersions,” Journal of Pulp and PaperScience, vol. 21, pp. 19–24, 1995.
[137] Lauw, Y., Leermakers, F., and Cohen Stuart, M., “Persistence lengthof wormlike micelles composed of ionic surfactants: Self-consistent-field predic-tions,” Journal of Physical Chemistry B, vol. 111, pp. 8158–8168, 2007.
[138] Lax, M., “Configuratio of an adsorbed polymer molecule: Solvent effect,”Journal of Chemical Physics, vol. 60, pp. 1931–1936, 1974.
[139] Lax, M., “A direct enumeration study of self-avoiding walks terminally at-tached to a surface,” Macromolecules, vol. 7, pp. 660–666, 1974.
[140] Lax, M., “Numerical study of the statistical thermodynamic properties ofa surface-interacting polymer chain,” Journal of Chemical Physics, vol. 61,pp. 4133–4137, 1974.
[141] Lee, G., Chrisey, L., and Colton, R., “Direct measurement of the forcesbetween complementary strands of dna,” Science, vol. 266, pp. 771–773, 1994.
[142] Lee, G., Kidwell, D., and Colton, R., “Sensing discrete strptavidin-biotininteractions with atomic force microscopy,” Langmuir, vol. 10, pp. 354–357,1994.
[143] Leermakers, F., Ballauff, M., and Borisov, O., “On the mechanismof uptake of globular proteins by polyelectrolyte brushes: A two-gradient self-consistent field analysis,” Langmuir, vol. 23, pp. 3937–3946, 2007.
[144] Levy, R. and Maaloum, M., “Probing adsorbed polymer chains using atomicforce microscopy: Interpretation of rupture distributions,” Journal of Physics:Condensed Matter, vol. 16, pp. 7199–7208, 2004.
[145] Levy, R. and Maaloum, M., “New tools for force spectroscopy,” Ultrami-croscopy, vol. 102, pp. 311–315, 2005.
[146] Li, H., Liu, B., Zhang, X., Gao, C., Shen, J., and Zou, G., “Single-molecule force spectroscopy on poly(acrylic acid) by afm,” Langmuir, vol. 15,pp. 2120–2124, 1999.
[147] Li, H., Rief, M., Oesterhelt, F., and Gaub, H., “Single-molecule forcespectroscopy on xanthan by afm,” Advanced Materials, vol. 3, pp. 316–319,1998.
[148] Li, H., Rief, M., Oesterhelt, F., and Gaub, H., “Force spectroscopy onsingle xanthan molecules,” Applied Physics A: Materials Science and Process-ing, vol. 68, pp. 407–410, 1999.
171
[149] Li, H., Rief, M., Oesterhelt, F., Gaub, H., Zhang, X., and Shen,J., “Single-molecule force spectroscopy on polysaccharides by afm- nanomech-naical fingerprint of alpha-(1,4)-linked polysaccharides,” Chemical Physics Let-ters, vol. 305, pp. 197–201, 1999.
[150] Li, H., Zhang, W., Xu, W., and Zhang, X., “Hydrogen bonding governsthe elastic properties of poly(vinyl alcohol) in water: Single-molecule force spec-troscopic studies of pva by afm,” Macromolecules, vol. 33, pp. 465–469, 2000.
[151] Li, H., Zhang, W., Zhang, X., Shen, J., Liu, B., Gao, C., and Zou, G.,“Single molecule force spectroscopy on poly(vinyl alcohol) by atomic force mi-croscopy,” Macromolecular Rapid Communications, vol. 19, pp. 609–611, 1998.
[152] Li, S. and Zhang, L., “Conformational structures and thermodynamic proper-ties of compact polymer chains confined between two parallel plane boundaries,”Journal of Polymer Science: Part B: Polymer Physics, vol. 44, pp. 2888–2901,2006.
[153] Li, Y., Nagy, E., Esmail, M., and Horvolgyi, Z., “Weak flocculationof aqueous kaolin suspensions initiating by nacmc with different molecularweights,” Macromolecular Symposia, vol. 202, pp. 307–323, 2003.
[154] Lide, D., ed., CRC Handbook of Chemistry and Physics. CRC Press, 1994.
[155] Linse, P., “Adsorption of weakly charged polyelectrolytes at oppositelycharged surfaces,” Macromolecules, vol. 29, pp. 326–336, 1996.
[156] Lipatov, Y. S. and Sergeeva, L. M., Adsorption of Polymers. Halsted,1974.
[157] Lisal, M. and Nezbeda, I., “Conformations of attractive, repulsive, and am-phiphilic polymer chains in a simple supercritical solvent: Molecular simulationstudy,” Journal of Chemical Physics, vol. 119, pp. 4026–4034, 2003.
[158] Liu, H. and Chakrabarti, A., “Molecular dynamics study of adsorption andspreading of a polymer chain onto a flat surface,” Polymer, vol. 40, pp. 7285–7293, 1999.
[159] Liufu, S.-C., Xiao, H.-N., and Li, Y.-P., “Adsorption of cationic polyelec-trolyte at the solid/liquid interface and dispersion of nanosized silica in water,”Journal of Colloid and Interface Science, vol. 285, pp. 33–40, 2005.
[160] Mackor, E. and van der Waals, J., “The statistics of the adsorption ofrod-shaped molecules in connection with the stability of certain colloidal dis-persions,” Journal of Colloid Science, vol. 7, pp. 535–550, 1952.
[161] Malfreyt, P. and Tildesley, D., “Dissipative particle dynamics simula-tions of grafted polymer chains between two walls,” Langmuir, vol. 16, pp. 4732–4740, 2000.
172
[162] Mao, Y., Burin, A., Ratner, M. A., and Jarrold, M., “A first-ordertransition in the charge-induced conformational changes of polymers,” Journalof Chemical Physics, vol. 116, pp. 9964–9974, 2002.
[163] Masters, A. and Warren, P., “Kinetic theory for dissipative particle dy-namics: The importance of collisions,” Europhysics Letters, vol. 48, pp. 1–7,1999.
[164] Mathur, S., Singh, P., and Moudgil, B., “Advances in selective floccu-lation technology for solid-solid separations,” International Journal of MineralProcessing, vol. 58, pp. 201–222, 2000.
[165] Mavrantzas, V., Beris, A., Leermakers, F., and Fleer, G., “Con-tinuum formulation of the scheutjens-fleer lattice statistical theory for ho-mopolymer adsorption from solution,” Journal of Chemical Physics, vol. 123,pp. 174901–1–174901–11, 2005.
[166] Meadows, J., Williams, P., Garvey, M., Harrop, R., and Phillips, G.,“Enhanced polyelectrolyte adsorption,” Colloids and Surfaces, vol. 32, pp. 275–288, 1988.
[167] Mears, S., Cosgrove, T., Obey, T., Thompson, L., and Howell, I.,“Dynamic light scattering and small-angle neutron scattering studies on thepoly(ethylene oxide)/sodium dodecyl sulfate/plystyrene latex system,” Lang-muir, vol. 14, pp. 4997–5003, 1998.
[168] Mears, S., Cosgrove, T., Thompson, L., and Howell, I., “Solvent relax-ation nmr measurements on polymer, particle, surfactant systems,” Langmuir,vol. 14, pp. 997–1001, 1998.
[169] Min, G., Bevan, M., Prieve, D., and Patterson, G., “Light scatter-ing characterization of polystyrene latex with and without adsorbed polymer,”Colloids and Surfaces A: Physicochemical and Engineering Aspects, vol. 202,pp. 9–21, 2002.
[170] Minko, S. and Roiter, Y., “Afm single molecule studies of adsorbed polyelec-trolytes,” Current Opinion in Colloid and Interface Science, vol. 10, pp. 9–15,2005.
[171] Mishra, P., Kumar, S., and Singh, Y., “Force-induced desorption of a linearpolymer chain adsorbed on an attractive surface,” Europhysics Letters, vol. 69,pp. 102–108, 2005.
[172] Miyamoto, T. and Cantow, H., “Nuclear magnetic resonance study on theadsorption of poly(methyl methacrylate) at a solid/liquid interface,” Makro-molekulare Chemie, vol. 162, pp. 43–51, 1972.
173
[173] Moudgil, B., Mathur, S., and Behl, S., “Dolomite-dolomite separation bya selective flocculation technique,” Transactions of Scoiety for Mining, Metal-lurgy, and Exploration, Inc., vol. 298, pp. 24–27, 1996.
[174] Moudgil, B. and Prakash, T., “Competitive adsorption of polymer sur-factants on solid substrates,” Colloids and Surfaces A: Physicochemical andEngineering Aspects, vol. 133, pp. 93–97, 1998.
[175] Nanko, H. and Pan, S., “Visualization of polymer adsorption on pulp fiber1: Polyacrylamide,” 2003.
[176] Nanko, H. and Pan, S., “Visualization of polymer adsorption on pulp fiber1: Polyacrylamide, part 2,” 2003.
[177] Nanko, H., Pan, S., and McNeal, M., “Polymer adsorption on cellulosesubstrate visualized by transmission electron microscopy,” 2003.
[178] Neimo, L., ed., Papermaking Chemistry. Fapet Oy, 1999.
[179] Nelson, A. and Cosgrove, T., “Dynamic light scattering studies ofpoly(ethylene oxide) adsorbed on laponite: Layer conformation and its effecton particle stability,” Langmuir, vol. 20, pp. 10382–10388, 2004.
[180] Nelson, A., Jack, K., Cosgrove, T., and Kozak, D., “Nmr solvent re-laxation in studies of multicomponent polymer adsorption,” Langmuir, vol. 18,pp. 2750–2755, 2002.
[181] Nicolai, T., Clarke, C., Jones, R., and Penfold, J., “Segment densityprofiles of end-adsorbed polymers in chemically identical melts,” Colloids andSurfaces, A: Physicochemical and Engineering Aspects, vol. 86, pp. 153–163,1994.
[182] Nikunen, P., Vattulainen, I., and Karttunen, M., “Reptational dynam-ics in dissipative particle dynamics simulations of polymer melts,” PhysicalReview E, vol. 75, pp. 036713–1–036713–7, 2007.
[183] Noskov, B., Akentiev, A., Bilibin, A., Grigoriev, D., Loglio, G.,Zorin, I., and Miller, R., “Adsorption kinetics of non-ionic polymers: Anellipsometric study,” Mendeleev Communications, vol. 5, pp. 198–200, 2005.
[184] Oberhauser, A., Marszalek, P., Carrion-Vazquez, M., and Fer-nandez, J., “Single protein misfolding events captured by atomic force mi-croscopy,” Nature Structural Biology, vol. 6, pp. 1025–1028, 1999.
[185] Omarjee, P., Hoerner, P., Riess, G., Cabuil, V., and Mondain-Monval, O., “Diblock copolymers adsorbed at a water-oil interface,” EuropeanPhysical Journal E: Soft Matter, vol. 4, pp. 45–50, 2001.
174
[186] Ono, H. and Deng, Y., “Cationic microparticle retention aids: The mecha-nism study and laboratory evaluation,” in Transactions of the 11th FundamentalResearch Symposium in The Fundamentals of Papermaking Materials Held atCambridge: September 1997, pp. 1097 – 1119, 1997.
[187] Ortiz, C. and Hadziioannou, G., “Entropic elasticity of single polymerchains of poly(methacrylic acid) measured by atomic force microscopy,” Macro-molecules, vol. 32, pp. 780–787, 1999.
[188] O’Shaughnessy, B. and Vavylonis, D., Theoretical and Mathematical Mod-els in Polymer Science. Academic, 1998.
[189] O’Shaughnessy, B. and Vavylonis, D., “Kinetic regimes and cross-overtimes in many-particle reacting systems,” Europhysics Letters, vol. 45, pp. 653–658, 1999.
[190] O’Shaughnessy, B. and Vavylonis, D., “Reactive polymer interfaces: Howreaction kinetics depend on reactivity and density of chemical groups,” Macro-molecules, vol. 32, pp. 1785–1796, 1999.
[191] O’Shaughnessy, B. and Vavylonis, D., “Irreversible adsorption from dilutepolymer solutions,” European Physical Journal E, vol. 11, pp. 213–230, 2003.
[192] O’Shaughnessy, B. and Vavylonis, D., “Non-equilibrium in adsorbed poly-mer layers,” Journal of Physics: Condensed Matter, vol. 17, pp. R63–R99, 2005.
[193] Oulanti, O., Pefferkorn, E., Champ, S., and Auweter, H., “Relax-ation phenomena of hydrolyzed polyvinylamine molecules adsorbed at the sil-ica/water interface i. saturated homogeneous polymer layers,” Journal of Col-loid and Interface Science, vol. 291, pp. 98–104, 2005.
[194] Oulanti, O., Pefferkorn, E., Champ, S., and Auweter, H., “Relax-ation phenomena of hydrolyzed polyvinylamine molecules adsorbed at the sil-ica/water interface ii. saturated heterogeneous polymer layers,” Journal of Col-loid and Interface Science, vol. 291, pp. 105–111, 2005.
[195] Oulanti, O., Pefferkorn, E., Champ, S., and Auweter, H., “Relax-ation phenomena of hydrolyzed polyvinylamine molecules adsorbed at the sil-ica/water interface iii. interfacial exchange and transfer processes,” Journal ofColloid and Interface Science, vol. 291, pp. 112–119, 2005.
[196] Oulanti, O., Widmaier, J., Pefferkorn, E., Champ, S., and Auweter,H., “Destabilization of polystyrene latex particles induced by adsorption ofpolyvinylamine: Mass, size and structure characteristics of the growing aggre-gates,” Journal of Colloid and Interface Science, vol. 294, pp. 95–103, 2006.
[197] Pashley, R., “Hydration forces between mica surfaces in aqueous electrolytesolutions,” Journal of Colloid and Interface Science, vol. 80, pp. 153–162, 1981.
175
[198] Pecora, R., “Dynamic light scattering measurement of nanometer particlesin liquids,” Journal of Nanoparticle Research, vol. 2, pp. 123–131, 2000.
[199] Pefferkorn, E. and Elaissari, A., “Adsorption-desorption processes incharged polymer/colloid systems; structural relaxation of adsorbed macro-molecules,” Journal of Colloid and Interface Science, vol. 138, pp. 187–194,1990.
[200] Pelssers, E., Cohen Stuart, M., and Fleer, G., “Kinetic aspects ofpolymer bridging: Equilibrium flocculation and nonequilibrium flocculation,”Colloids and Surfaces, vol. 38, pp. 15–25, 1989.
[201] Pelssers, E., Cohen Stuart, M., and Fleer, G., “Kinetics of bridgingflocculation,” Journal of the Chemical Society Faraday Transactions, vol. 86,pp. 1355–1361, 1990.
[202] Pelton, R., “Electrolyte effects in the adsorption and desorption of a cationicpolyacrylamide on cellulose fibers,” Journal of Colloid and Interface Science,vol. 111, pp. 475–485, 1986.
[203] Perkins, T., Smith, D., Larson, R., and Chu, S., “Stretching of a singletethered polymer in a uniform flow,” Science, vol. 268, pp. 83–87, 1995.
[204] Peters, E. and Barenbrug, T., “Efficient brownian dynamics simulation ofparticles near walls: Ii. sticky walls,” Physical Review E, vol. 66, pp. 056702–1– 056702–11, 2002.
[205] Pivkin, I. and Karniadakis, G., “Coarse-graining limist in open and wall-bounded dissipative particle dynamics systems,” Journal of Chemical Physics,vol. 124, pp. 184101–1–184101–7, 2006.
[206] Poggi, M., McFarland, A., Colton, J., and Bottomley, L., “A methodfor calculating the spring constant of atomic force microscopy cantilevers witha nonrectangular cross section,” Analytical Chemistry, vol. 77, pp. 1192–1195,2005.
[207] Polverari, M. and van de Ven, T., “Dynamic light scattering of suspen-sions of peo-coated latex particles,” Colloids and Surfaces, A: Physicochemicaland Engineering Aspects, vol. 86, pp. 209–228, 1994.
[208] Polverari, M. and van de Ven, T., “Electrostatic and steric interactionsin particle deposition studied by evanescent wave light scattering,” Journal ofColloid and Interface Science, vol. 173, pp. 343–353, 1995.
[209] Poncet, C., Tiberg, F., and Audebert, R., “Ellipsometric study of theadsorption of hydrophobically modified polyacrylates at hydrophobic surfaces,”Langmuir, vol. 14, pp. 1697–1704, 1998.
176
[210] Premilat, S. and Hermans Jr., J., “Conformational statistics of shortchains of poly(l-alanine) and poly(glycine) generated by monte carlo methodand the partition function of chains with constrained ends,” Journal of Chem-ical Physics, vol. 59, pp. 2602–2612, 1973.
[211] Radeva, T., Netzel, J., Petkanchin, I., and Stoylov, S., “Electroopticstudy of neutral polymer adsorption on mica,” Journal of Colloid and InterfaceScience, vol. 160, pp. 493–495, 1993.
[212] Radoslovich, E., “The structure of muscovite, kal2(si3al)o10(oh)2,” ActaCrystallographica, vol. 13, pp. 919–932, 1960.
[213] Raucci, R. and Vacatello, M., “Monte carlo studies of the conformationalstatistics of polymers. polyethylene,” Makromolekulare Chemie, Theory andSimulations, vol. 2, pp. 875–888, 1993.
[214] Ravi, M. and Hopfinger, A., “Molecular modeling of polymers. 10.characterization of conformational transitions of poly(acrylic acid) andpoly(methacrylic acid) using dyad structures,” Journal of Polymer Science,Part B: Polymer Physics, vol. 32, pp. 1033–1047, 1994.
[215] Ray, C., Brown, J., and Akhremitchev, B., “Correction of systematicerrors in single-molecule force spectroscopy with polymeric tethers by atomicforce microscopy,” Journal of Physical Chemistry B, vol. 111, pp. 1963–1974,2007.
[216] Rehmet, R. and Killmann, E., “Adsorption of cationic poly(diallyl-dimethyl-ammoniumchloride), poly(diallyl-dimethyl-ammoniumchloride-co-n-methyl-n-vinylactamide) and poly(n-methyl-n-vinyl-acetamide) on polystyrenelatex,” Colloids and Surfaces A: Physicochemical and Engineering Aspects,vol. 149, pp. 323–328, 1999.
[217] Rennie, A., Crawford, R., Lee, E., Thomas, R., Crowley, T.,Roberts, S., Qureshi, M., and Richards, R., “Adsorption of poly(ethyleneoxide) at the air-solution interface studied by neutron reflection,” Macro-molecules, vol. 22, pp. 3466–3475, 1989.
[218] Revenga, M., Zuniga, I., and Espanol, P., “Boundary conditions in dis-sipative particle dynamics,” Computer Physics Communications, vol. 121-122,pp. 309–311, 1999.
[219] Richmond, P., “Electrical force between particles with arbitrary fixed surfacecharge distributions in ionic solution,” Journal of the Chemical Society, FaradayTransactions 2: Molecular and Chemical Physics, vol. 70, pp. 1066–1073, 1974.
[220] Rief, M., Clausen-Schaumann, H., and Gaub, H., “Sequence-dependentmechanics of single dna molecules,” Nature Structural Biology, vol. 6, pp. 346–349, 1999.
177
[221] Rief, M., Gautel, M., Oesterhelt, F., Fernandez, J., and Gaub, H.,“Reversible unfolding of individual titin immunoglobulin domains by afm,” Sci-ence, vol. 276, pp. 1109–1112, 1997.
[222] Ringenbach, E., Chauveteau, G., and Pefferkorn, E., “Aggrega-tion/fragmentation of colloidal alumina,” Journal of Colloid and Interface Sci-ence, vol. 172, pp. 208–213, 1995.
[223] Roe, R., “Conformation of an isolated polymer molecule at an interface,” Pro-ceedings of the National Academy of Sciences of the United States of America,vol. 53, pp. 50–57, 1965.
[224] Roiter, Y., Jaeger, W., and Minko, S., “Conformation of single poly-electrolyte chains vs. salt concentration: Effects of sample history and solidsubstrate,” Polymer, vol. 47, pp. 2493–2498, 2006.
[225] Roiter, Y. and Minko, S., “Afm single molecule experiments at the solid-liquid interface: In situ conformation of adsorbed flexible polyelectrolytechains,” Journal of the American Chemical Society, vol. 127, pp. 15688–15689,2005.
[226] Roiter, Y. and Minko, S., “Adsorption of polyelectrolyte versus surfacecharge: In situ single-molecule atomic force microscopy experiments on sim-ilarly, oppositely, and heterogeneously charged surfaces,” Journal of PhysicalChemistry B, vol. 111, pp. 8597–8604, 2007.
[227] Rojas, O., Claesson, P., Muller, D., and Neuman, R., “The effectof salt concentration on adsorption of low-charge-density polyelectrolytes andinteractions between polyelectrolyte-coated surfaces,” Journal of Colloid andInterface Science, vol. 205, pp. 77–88, 1998.
[228] Sader, J., Chon, J., and Mulvaney, P., “Calibration of rectangularatomic force microscope cantilevers,” Review of Scientific Instruments, vol. 70,pp. 3967–3969, 1999.
[229] Samoshina, Y., Diaz, A., Becker, Y., Nylander, T., and Lindman, B.,“Adsorption of cationic, anionic, and hydrophobically modified polyacrylamideson silica surfaces,” Colloids and Surfaces, A: Physicochemical and EngineeringAspects, vol. 231, pp. 195–205, 2003.
[230] Samoshina, Y., Nylander, T., Shubin, V., Bauer, R., and Eskilsson,K., “Equilibrium aspects of polycation adsorption on silica surface: How the ad-sorbed layer responds to changes in bulk solution,” Langmuir, vol. 21, pp. 5872–5881, 2005.
[231] Santore, M. and Fu, Z., “Direct measurement of molecular-weight drivencompetition during polymer adsorption,” Macromolecules, vol. 30, pp. 8515–8516, 1997.
178
[232] Scheutjens, J. and Fleer, G., “Statistical theory of the adsorption of inter-acting chain molecules. 1. partition function, segment density distribution, andadsorption isotherms,” Journal of Physical Chemistry, vol. 83, pp. 1619–1635,1979.
[233] Scheutjens, J. and Fleer, G., “Statistical theory of the adsorption of in-teracting chain molecules. 2. train, loop, and tail size distribution,” Journal ofPhysical Chemistry, vol. 84, pp. 179–190, 1980.
[234] Scheutjens, J., Fleer, G., and Cohen Stuart, M., “End effects in poly-mer adsorption: A tale of tails,” Colloids and Surfaces, vol. 21, pp. 285–306,1986.
[235] Schlijper, A., Hoogerbrugge, P., and Manke, C., “Computer simulationof dilute polymer solutions with the dissipative particle dynamics method,”Journal of Rheology, vol. 39, pp. 567–579, 1995.
[236] Schneider, H., Frantz, P., and Granick, S., “The bimodal energy land-scape when polymers adsorb,” Langmuir, vol. 12, pp. 994–996, 1996.
[237] Scott, W., Principles of Wet End Chemistry. TAPPI Press, 1996.
[238] Seitz, W. and Klein, D., “Excluded volume effects for branched polymers:Monte carlo results,” Journal of Chemical Physics, vol. 75, pp. 5190–5193, 1981.
[239] Senden, T., “Force microscopy and surface interactions,” Current Opinion inColloid and Interface Science, vol. 6, pp. 95–101, 2001.
[240] Senden, T., di Meglio, J.-M., and Auroy, P., “Anomalous adhesion inadsorbed polymer layers,” The European Physical Journal B, vol. 3, pp. 211–216, 1998.
[241] Senden, T., di Meglio, J.-M., and Silberzan, I., “The conformation of ad-sorbed polyacrylamide and derived polymers,” Comptes Rendus de l’Academiedes Sciences, Serie IV: Physique, Astrophysique, vol. 1, pp. 1143–1152, 2000.
[242] Sennerfors, T., Solberg, D., and Tiberg, F., “Adsorption ofpolyelectrolyte-nanoparticle systems on silica: Influence of ionic strength,”Journal of Colloid and Interface Science, vol. 254, pp. 222–226, 2002.
[243] Shafir, A. and Andelman, D., “Polyelectrolyte adsorption: Chemical andelectrostatic interactions,” Physical Review E, vol. 70, pp. 061804–1–061804–12,2004.
[244] Shubin, V., “Adsorption of cationic polyacrylamide onto monodisperse col-loidal silica from aqueous electrolyte solutions,” Journal of Colloid and Inter-face Science, vol. 191, pp. 372–377, 1997.
179
[245] Shubin, V. and Linse, P., “Effect of electrolytes on adsorption of cationicpolyacrylamide on silica: ellipsometric study and theoretical modeling,” Journalof Physical Chemistry, vol. 99, pp. 1285–1291, 1995.
[246] Singh, Y., Giri, D., and Kumar, S., “Crossover of a polymer chain from bulkto surface states,” Journal of Physics A: Mathematical and General, vol. 34,pp. L67–L74, 2001.
[247] Siqueira, L. and Ribeiro, M., “Molecular dynamics simulation of the poly-mer electrolyte poly(ethylene oxide)/liclo4: I. structural properties,” Journalof Chemical Physics, vol. 122, pp. 194911/1–194911/8, 2005.
[248] Sperling, L., Introduction to Physical Polymer Science. Wiley-Interscience,2001.
[249] Sprakel, J., Besseling, N., Leermakers, F., and Cohen Stuart, M.,“Micellization of telechelic associative polymers: Self-consistent field model-ing and comparison with scaling concepts,” Journal of Physical Chemistry B,vol. 111, pp. 2903–2909, 2007.
[250] Stemme, S., Odberg, L., and Malmsten, M., “Effect of colloidal silicaand electrolyte on the structure of an adsorbed cationic polyelectrolyte layer,”Colloids and Surfaces, A: Physicochemical and Engineering Aspects, vol. 155,pp. 145–154, 1999.
[251] Stemme, S. and Odberg, L., “Layer thickness for high molecular weightcationic polyacrylamides adsorbed on a surface with a preadsorbed poly-diallyldimethylammonium chloride,” Colloids and Surfaces A: Physicochemicaland Engineering Aspects, vol. 157, pp. 307–313, 1999.
[252] Stromberg, R., Tutas, D., and Passaglia, E., “Conformation ofpolystyrene adsorbed at the theta-temperature,” Journal of Physical Chem-istry, vol. 69, pp. 3955–3963, 1965.
[253] Strunz, T., Oroszlan, K., Schafer, R., and Guntherodt, H.-J., “Dy-namic force spectroscopy of single dna molecules,” Proceeding of the NationalAcademy of Science USA, vol. 96, pp. 11277–11282, 1999.
[254] Sukhishvili, S. and Granick, S., “Polyelectrolyte adsorption onto aninitially-bare solid surface of opposite electrical charge,” Journal of ChemicalPhysics, vol. 109, pp. 6861–6868, 1998.
[255] Swerin, A. and Odberg, L., “Some aspects of retention aids,” in Trans-actions of the 11th Fundamental Research Symposium in The Fundamentals ofPapermaking Materials Held at Cambridge: September 1997, pp. 265–350, 1997.
[256] Swerin, A., Odberg, L., and Wagberg, L., “An extended model forthe estimation of flocculation efficiency factors in multicomponent flocculant
180
systems,” Colloids and Surfaces A: Physicochemical and Engineering Aspects,vol. 113, pp. 25–38, 1996.
[257] Swerin, A., Sjodin, U., and Odberg, L., “Flocculation of cellulosic fibersuspensions by model microparticulate retention aid systems. effect of polymercharge density and type of microparticle,” Nordic Pulp and Paper ResearchJournal, vol. 8, pp. 389–398, 1993.
[258] Symeonidis, V., Karniadakis, G., and Caswell, B., “Dissipative particledynamics simulations of polymer chains: Scaling laws and shearing responsecompared to dna experiments,” Physical Review Letters, vol. 95, pp. 076001–1–076001–4, 2005.
[259] Takahashi, A., Kawaguchi, M., and Kato, T., “Ellipsometric study ofadsorption of polyelectrolyte onto a metal surface,” ACS Symposium Series,vol. 240, pp. 39–52, 1984.
[260] Tanaka, H., “Copolymerization of cationic monomers with acrylamide in anaqueous solution,” Journal of Polymer Science: Polymer Chemistry Edition,vol. 24, pp. 29–36, 1986.
[261] Taunton, H., Toprakcioglu, C., Fetters, L., and Klein, J., “Forcesbetween surfaces bearing terminally anchored polymer chains in good solvents,”Nature, vol. 332, pp. 712–714, 1988.
[262] Taunton, H., Toprakcioglu, C., Fetters, L., and Klein, J., “Interac-tions between surfaces bearing end-adsorbed chains in a good solvent,” Macro-molecules, vol. 23, pp. 571–580, 1990.
[263] Taunton, H., Toprakcioglu, C., and Klein, J., “Direct measurement ofthe interaction between mica surfaces with adsorbed diblock copolymer in agood solvent,” Macromolecules, vol. 21, pp. 3333–3336, 1988.
[264] ter Horst, J., Wong Fong Sang, K., de Vreugd, C., Geertman,R., Witkamp, G., and van Rosmalen, G., “Adsorption behaviour of poly-electrolytes on calcium fluoride part ii: Molecular modeling of the adsorptionbehaviour,” Colloids and Surfaces A: Physicochemical and Engineering Aspects,vol. 154, pp. 273–284, 1999.
[265] Torrie, G., Middlemiss, K., Bly, S., and Whittington, S., “Self-avoiding walks interacting with an interface,” Journal of Chemical Physics,vol. 65, pp. 1867–1871, 1976.
[266] van de Steeg, H., Cohen Stuart, M., De Keizer, A., and Bijster-bosch, B., “Polyelectrolyte adsorption: A subtle balance of forces,” Langmuir,vol. 8, pp. 2538–2546, 1992.
181
[267] van de Ven, T., “Filler and fines retention in papermaking,” in Transactionsof the 13th Fundamental Research Symposium in The Fundamentals of Paper-making Materials Held at Cambridge: September 2005, pp. 1193–1224, 2005.
[268] van der Beek, G. and Cohen Stuart, M., “The hydrodynamic thicknessof adsorbed polymer layers measured by dynamic light scattering: Effects ofpolymer concentration and segmental binding strength,” Journal de Physique,vol. 49, pp. 1449–1454, 1988.
[269] van der Beek, G., Cohen Stuart, M., and Cosgrove, T., “Polymer ad-sorption and desorption studies via h nmr relaxation of the solvent,” Langmuir,vol. 7, pp. 327–334, 1991.
[270] van der Beek, G., Cohen Stuart, M., Fleer, G., and Hofman, J., “Achromatographic method for the determination of segmental adsorption energiesof polymers. polystyrene on silica,” Langmuir, vol. 5, pp. 1180–1186, 1989.
[271] van der Beek, G., Cohen Stuart, M., Fleer, G., and Hofman, J.,“Segmental adsorption energies for polymers on silica and alumina,” Macro-molecules, vol. 24, pp. 6600–6611, 1991.
[272] van Dyck J. van Landuyt G. van Tendeloo, S. A. D., ed., ElectronMicroscopy: Principles and Fundamentals. VCH, 1997.
[273] van Eijk, M. and Cohen Stuart, M., “Polymer adsorption kinetics: Effectsof supply rate,” Langmuir, vol. 13, pp. 5447–5450, 1997.
[274] van Eijk, M., Cohen Stuart, M., Rovillard, S., and DeConinck, J.,“Adsorption and spreading of polymers at plane interfaces; theory and molec-ular dynamics simulations,” The European Physical Journal B, vol. 1, pp. 233–244, 1998.
[275] Wagberg, L. and Eriksson, J., “New equipment for detection of polymerinduced flocculation of cellulosic fibres by using image analysis-application tomicroparticle systems,” Chemical Engineering Journal, vol. 80, pp. 51–63, 2000.
[276] Walldal, C. and Wall, S., “Coil-to-globule-type transition of poly(n-isopropylacrylamide) adsorbed on colloidal silica particles,” Colloid and Poly-mer Science, vol. 278, pp. 936–945, 2000.
[277] Walter, H., Harrats, C., Muller-Buschbaum, P., Jerome, R., andStamm, M., “Adsorption of ampholytic diblock copolymers from dilute aque-ous solution at the solid/liquid interface,” Langmuir, vol. 15, pp. 1260–1267,1999.
[278] Wang, C., Shi, W., Zhang, W., and Zhang, X., “Force spectroscopy studyon poly(acrylamide) derivatives: Effects of substitutes and buffers on single-chain elasticity,” Nano Letters, vol. 2, pp. 1169–1172, 2002.
182
[279] Wang, T. and Audebert, R., “Adsorption of cationic copolymers of acry-lamide at the silica-water interface: Hydrodynamic layer thickness measure-ments,” Journal of Colloid and Interface Science, vol. 121, pp. 32–41, 1988.
[280] Wang, Y. and Rajagopalan, R., “Dynamic properties of homopolymer lay-ers adsorbed on a solid surface,” Journal of Chemical Physics, vol. 105, pp. 696–705, 1996.
[281] Wang, Y., Rajagopalan, R., and Mattice, W., “Kinetics of detachment ofhomopolymers from a solid surface,” Physical Review Letters, vol. 74, pp. 2503–2506, 1995.
[282] Wang, Z., Luo, M., and Xu, J., “Conformational entropy of self-avoidingpolymer chains,” European Polymer Journal, vol. 35, pp. 973–975, 1999.
[283] Weber, T. and Helfand, E., “Theory of inhomogeneous polymers. solutionsfor the interfaces of the lattice model,” Macromolecules, vol. 9, pp. 311–316,1976.
[284] Widmaier, J., Shulga, A., Pefferkorn, E., Champ, S., and Auweter,H., “Reconformation of polyvinylamine adsorbed on glass fibers,” Journal ofColloid and Interface Science, vol. 264, pp. 277–283, 2003.
[285] Wind, B. and Killmann, E., “Adsorption of polyethylene oxide on surfacemodified silica-stability of bare and covered particles in suspension,” Colloidand Polymer Science, vol. 276, pp. 903–912, 1998.
[286] Wu, C. and Gao, J., “A simple scaling of the density profile of long linearpolymer chains adsorbed on a hydrophobic surface,” Macromolecules, vol. 32,pp. 1704–1705, 1999.
[287] Xu, Q., Zhang, W., and Zhang, X., “Oxygen bridge inhibits conformationaltransition of 1,4-linked alpha-d-galactose detected by single-molecule atomicforce microscopy,” Macromolecules, vol. 35, pp. 871–876, 2002.
[288] Yamamoto, S., Tsujii, Y., and Fukuda, T., “Atomic force microscopicstudy of stretching a single polymer chain in a polymer brush,” Macromolecules,vol. 33, pp. 5995–5998, 2000.
[289] Yang, S., Yan, D., and Shi, A., “Structure of adsorbed polymers on a colloidparticle,” Macromolecules, vol. 39, pp. 4168–4174, 2006.
[290] Yu, K.-Q., Li, Z.-S., and Sun, J., “Polymer structures and glass transition:A molecular dynamics simulation study,” Macromolecular Theory and Simula-tions, vol. 10, pp. 624–633, 2001.
[291] Zhang, L., Wang, X., Ma, H., and Huang, Y., “Conformational behaviorof short adsorbed polymer chains,” European Polymer Journal, vol. 35, pp. 167–172, 1999.
183
[292] Zhang, R., Liu, C., and Somasundaran, P., “A model for the cooperativeadsorption of surfactant mixtures on solid surfaces,” Journal of Colloid andInterface Science, vol. 310, pp. 377–384, 2007.
[293] Zhang, W., Xu, Q., Zou, S., Li, H., Xu, W., and Zhang, X., “Single-molecule force spectroscopy on bombyx mori silk fibroin by atomic force mi-croscopy,” Langmuir, vol. 16, pp. 4305–4308, 2000.
[294] Zhang, W. and Zhang, X., “Single molecule mechanochemistry of macro-molecules,” Progress in Polymer Science, vol. 28, pp. 1271–1295, 2003.
[295] Zhang, W., Zou, S., Wang, C., and Zhang, X., “Single polymer chainelongation of poly(n-isopropylacrylamide) and poly(acrylamide) by atomic forcemicroscopy,” Journal of Physical Chemistry B, vol. 104, pp. 10258–10264, 2000.
[296] Zhao, J. and Brown, W., “Dynamic light scattering study of adsorption of anonionic surfactant (c12e7) on polystyrene latex particles: Effects of aromaticamino groups and the surface polymer layer,” Journal of Colloid and InterfaceScience, vol. 179, pp. 281–289, 1996.
[297] Zhao, J. and Granick, S., “How polymer surface diffusion depends on surfacecoverage,” Macromolecules, vol. 40, pp. 1243–1247, 2007.
[298] Zhu, P. and Napper, D., “The effect of polymer concentration on the dy-namics of adsorbed poly(n-isopropylacrylamide) at particle surfaces in water,”Journal of Colloid and Interface Science, vol. 214, pp. 389–394, 1999.
[299] Zweistra, H. and Besseling, N., “Adsorption and desorption of reversiblesupramolecular polymers,” Physical Review E, vol. 74, pp. 021806–1–021806–10,2006.
184


![Td Adsorbed (Tetanus and Diphtheria Toxoids …products.sanofi.ca/en/td-adsorbed.pdfTd ADSORBED [Tetanus and Diphtheria Toxoids Adsorbed], is a sterile, cloudy, white, uniform suspension](https://img.pdfslide.us/doc/110x75/5e5ed39d07f6e0285b51c50f/td-adsorbed-tetanus-and-diphtheria-toxoids-td-adsorbed-tetanus-and-diphtheria.jpg)