Embed Size (px)
Citation preview
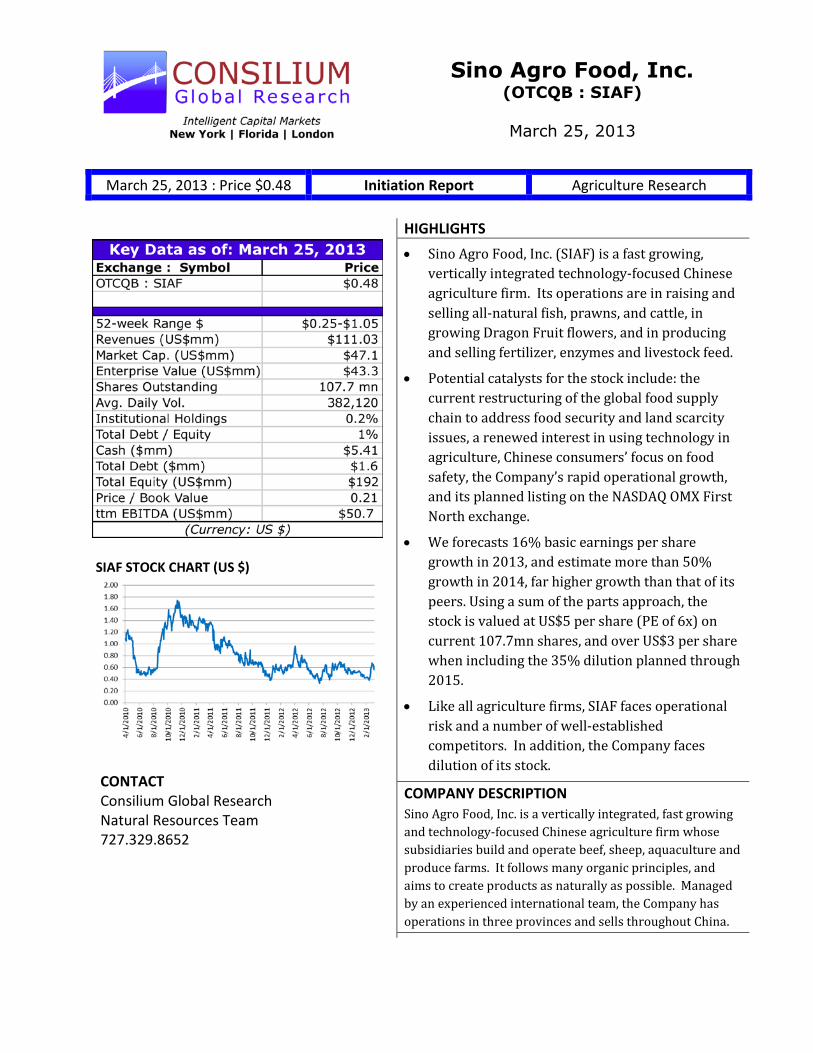
March 25, 2013 : Price $0.48 Initiation Report Agriculture Research
Sino Agro Food, Inc. (OTCQB : SIAF)
March 25, 2013
HIGHLIGHTS
SIAF STOCK CHART (US $)
x Sino Agro Food, Inc. (SIAF) is a fast growing, vertically integrated technology-focused Chinese agriculture firm. Its operations are in raising and selling all-natural fish, prawns, and cattle, in growing Dragon Fruit flowers, and in producing and selling fertilizer, enzymes and livestock feed.
x Potential catalysts for the stock include: the current restructuring of the global food supply chain to address food security and land scarcity issues, a renewed interest in using technology in agriculture, Chinese consumers’ focus on food safety, the Company’s rapid operational growth, and its planned listing on the NASDAQ OMX First North exchange.
x We forecasts 16% basic earnings per share growth in 2013, and estimate more than 50% growth in 2014, far higher growth than that of its peers. Using a sum of the parts approach, the stock is valued at US$5 per share (PE of 6x) on current 107.7mn shares, and over US$3 per share when including the 35% dilution planned through 2015.
x Like all agriculture firms, SIAF faces operational risk and a number of well-established competitors. In addition, the Company faces dilution of its stock.
COMPANY DESCRIPTION Sino Agro Food, Inc. is a vertically integrated, fast growing and technology-focused Chinese agriculture firm whose subsidiaries build and operate beef, sheep, aquaculture and produce farms. It follows many organic principles, and aims to create products as naturally as possible. Managed by an experienced international team, the Company has operations in three provinces and sells throughout China.
CONTACT Consilium Global Research Natural Resources Team 727.329.8652
Sino Agro Food, Inc March 24, 2013
CONSILIUM Global Research 2
EXECUTIVE SUMMARY
Sino Agro Food, Inc. (SIAF) is a fast growing, vertically integrated, technology focused Chinese agriculture firm. Its stock is presently trading at a substantial discount to its peers, and is backed by a number of potential catalysts.
Background. Formed by a reverse merger in August 2007, SIAF is a US-domiciled holding company active in agricultural activities in China.
Operations. SIAF presently operates in four key sectors (detailed below) and is rapidly expanding and diversifying its business.
� Fishery. 60% of revenues. SIAF’s largest business is in aquaculture, where it sells prawn, sleepy cod and fingerlings. The Company uses a licensed indoor aquaculture technology, which enables it to cultivate fish without using chemicals or antibiotics. A portion of the division’s income is from development contracts for the five new facilities that it is constructing with Chinese joint venture partners. By 2014, the Company plans to diversify its aquaculture business into other species, such as eel. It has begun trialing value added products, such as smoked seafood, at its processing facilities. Combined, these plans lead to Company aquaculture volume increases in excess of 140% for each of the next two years.
� Fertilizer, Enzymes and Livestock Feed. 17% of revenues. SIAF manufactures mixed and organic fertilizer and animal feed through two subsidiaries. From 2013, the Company plans to add a concentrated livestock feed and enzyme to the range, as well as selling electricity and waste by-products from 2014. The Chinese feed industry is in the process of consolidation, and the fertilizer one suffering excess capacity. As a vertically integrated supplier, SIAF is well positioned to capitalize on these changes.
� Cattle Farming. 13% of revenues. SIAF expects to process approximately 5,500 head of cattle this year, and to increase this volume by nearly 50% next year. The Company will add an abattoir, sheep farming, and value added product processing by 2014. We expect that revenues from operations in this division will increase more than 5x between 2012 and 2015.
� Flower Plantation. 10% of revenues. The Company cultivates 187 acres of Dragon Fruit flowers, selling them as both fresh and dried flowers. It plans to add pickled flowers and asparagus.
Catalysts. Potential catalysts for the stock include: the current restructuring of the global food supply chain to address food security and land scarcity issues, a renewed interest in using technology in agriculture, Chinese consumers’ focus on food safety, the Company’s rapid growth, and its planned listing on the NASDAQ OMX First North (“First North”) exchange.
Risks. Like all agriculture firms, SIAF faces operational risk and a number of well-established competitors. In addition, the Company faces dilution of its stock.
Financials. We forecasts 16% basic earnings per share growth in 2013, and more than 50% growth in 2014, far higher growth than that of its peers.
Valuation. Using a sum of the parts approach, the stock is valued at US$5 per share on current shares outstanding, and at more than US$3 per share when including all planned dilution through 2014.
Sino Agro Food, Inc March 24, 2013
CONSILIUM Global Research 3
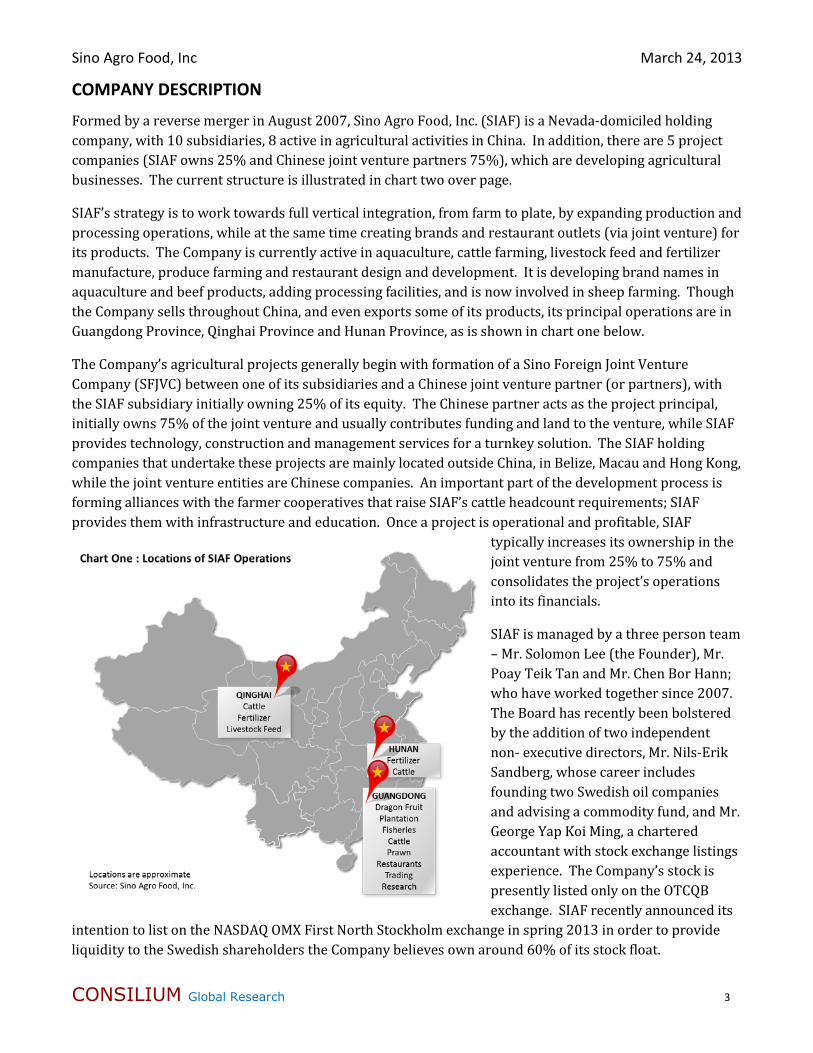
COMPANY DESCRIPTION
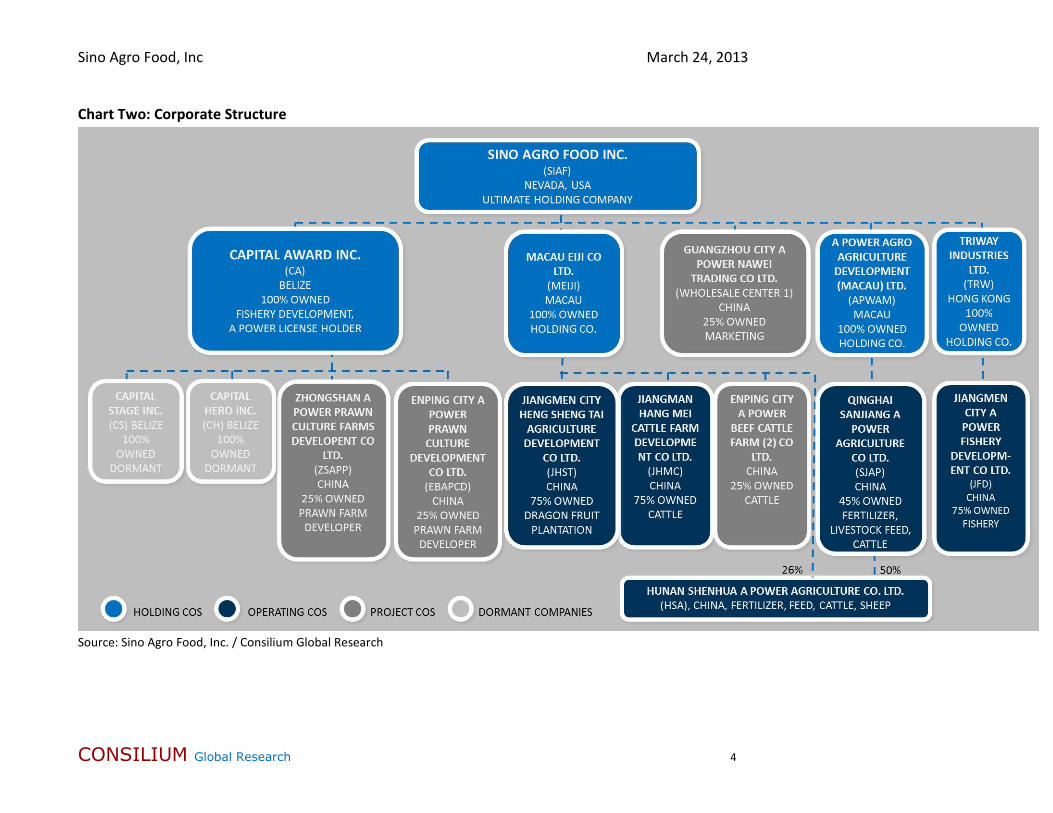
Formed by a reverse merger in August 2007, Sino Agro Food, Inc. (SIAF) is a Nevada-domiciled holding company, with 10 subsidiaries, 8 active in agricultural activities in China. In addition, there are 5 project companies (SIAF owns 25% and Chinese joint venture partners 75%), which are developing agricultural businesses. The current structure is illustrated in chart two over page.
SIAF’s strategy is to work towards full vertical integration, from farm to plate, by expanding production and processing operations, while at the same time creating brands and restaurant outlets (via joint venture) for its products. The Company is currently active in aquaculture, cattle farming, livestock feed and fertilizer manufacture, produce farming and restaurant design and development. It is developing brand names in aquaculture and beef products, adding processing facilities, and is now involved in sheep farming. Though the Company sells throughout China, and even exports some of its products, its principal operations are in Guangdong Province, Qinghai Province and Hunan Province, as is shown in chart one below.
The Company’s agricultural projects generally begin with formation of a Sino Foreign Joint Venture Company (SFJVC) between one of its subsidiaries and a Chinese joint venture partner (or partners), with the SIAF subsidiary initially owning 25% of its equity. The Chinese partner acts as the project principal, initially owns 75% of the joint venture and usually contributes funding and land to the venture, while SIAF provides technology, construction and management services for a turnkey solution. The SIAF holding companies that undertake these projects are mainly located outside China, in Belize, Macau and Hong Kong, while the joint venture entities are Chinese companies. An important part of the development process is forming alliances with the farmer cooperatives that raise SIAF’s cattle headcount requirements; SIAF provides them with infrastructure and education. Once a project is operational and profitable, SIAF
typically increases its ownership in the joint venture from 25% to 75% and consolidates the project’s operations into its financials.
SIAF is managed by a three person team – Mr. Solomon Lee (the Founder), Mr. Poay Teik Tan and Mr. Chen Bor Hann; who have worked together since 2007. The Board has recently been bolstered by the addition of two independent non- executive directors, Mr. Nils-Erik Sandberg, whose career includes founding two Swedish oil companies and advising a commodity fund, and Mr. George Yap Koi Ming, a chartered accountant with stock exchange listings experience. The Company’s stock is presently listed only on the OTCQB exchange. SIAF recently announced its
intention to list on the NASDAQ OMX First North Stockholm exchange in spring 2013 in order to provide liquidity to the Swedish shareholders the Company believes own around 60% of its stock float.
Sino Agro Food, Inc March 24, 2013
CONSILIUM Global Research 4
Chart Two: Corporate Structure
Source: Sino Agro Food, Inc. / Consilium Global Research
Sino Agro Food, Inc March 24, 2013
CONSILIUM Global Research 5
The Company divides its fast growing operations into four standalone business units; fishery, cattle, HU flower plantation and fertilizer, enzymes and livestock feed. The commonality between the divisions is that each is operating in a comparatively slow growth consolidating market; SIAF has a strategy of targeting niches of these markets with their high quality products. The Company has described its strategy as wanting to be the highest quality with high margins, but not the largest firm. A description of each division follows:
A. Fishery 60% of revenues | 17% of operating assets | 64% of net operating income1
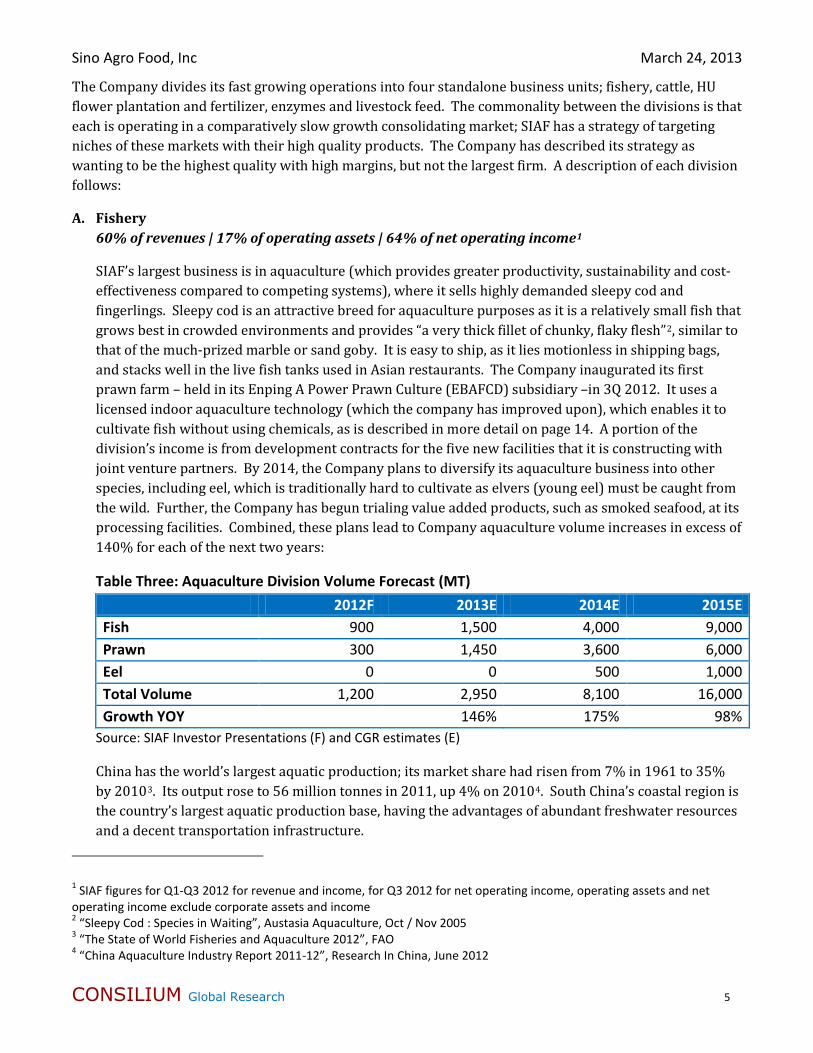
SIAF’s largest business is in aquaculture (which provides greater productivity, sustainability and cost-effectiveness compared to competing systems), where it sells highly demanded sleepy cod and fingerlings. Sleepy cod is an attractive breed for aquaculture purposes as it is a relatively small fish that grows best in crowded environments and provides “a very thick fillet of chunky, flaky flesh”2, similar to that of the much-prized marble or sand goby. It is easy to ship, as it lies motionless in shipping bags, and stacks well in the live fish tanks used in Asian restaurants. The Company inaugurated its first prawn farm – held in its Enping A Power Prawn Culture (EBAFCD) subsidiary –in 3Q 2012. It uses a licensed indoor aquaculture technology (which the company has improved upon), which enables it to cultivate fish without using chemicals, as is described in more detail on page 14. A portion of the division’s income is from development contracts for the five new facilities that it is constructing with joint venture partners. By 2014, the Company plans to diversify its aquaculture business into other species, including eel, which is traditionally hard to cultivate as elvers (young eel) must be caught from the wild. Further, the Company has begun trialing value added products, such as smoked seafood, at its processing facilities. Combined, these plans lead to Company aquaculture volume increases in excess of 140% for each of the next two years:
Table Three: Aquaculture Division Volume Forecast (MT) 2012F 2013E 2014E 2015E Fish 900 1,500 4,000 9,000 Prawn 300 1,450 3,600 6,000 Eel 0 0 500 1,000 Total Volume 1,200 2,950 8,100 16,000 Growth YOY 146% 175% 98%
Source: SIAF Investor Presentations (F) and CGR estimates (E)
China has the world’s largest aquatic production; its market share had risen from 7% in 1961 to 35% by 20103. Its output rose to 56 million tonnes in 2011, up 4% on 20104. South China’s coastal region is the country’s largest aquatic production base, having the advantages of abundant freshwater resources and a decent transportation infrastructure.
1 SIAF figures for Q1-Q3 2012 for revenue and income, for Q3 2012 for net operating income, operating assets and net operating income exclude corporate assets and income 2 “Sleepy Cod : Species in Waiting”, Austasia Aquaculture, Oct / Nov 2005 3 “The State of World Fisheries and Aquaculture 2012”, FAO 4 “China Aquaculture Industry Report 2011-12”, Research In China, June 2012
Sino Agro Food, Inc March 24, 2013
CONSILIUM Global Research 6
China is also the world’s largest fish consumer, at 31.9kg per capita compared to only 15.4kg per capita for the rest of the world3. Sleepy cod and eel are not as large a market in China as the prevalent carp
species; eel makes up only 1% of the total catch5.
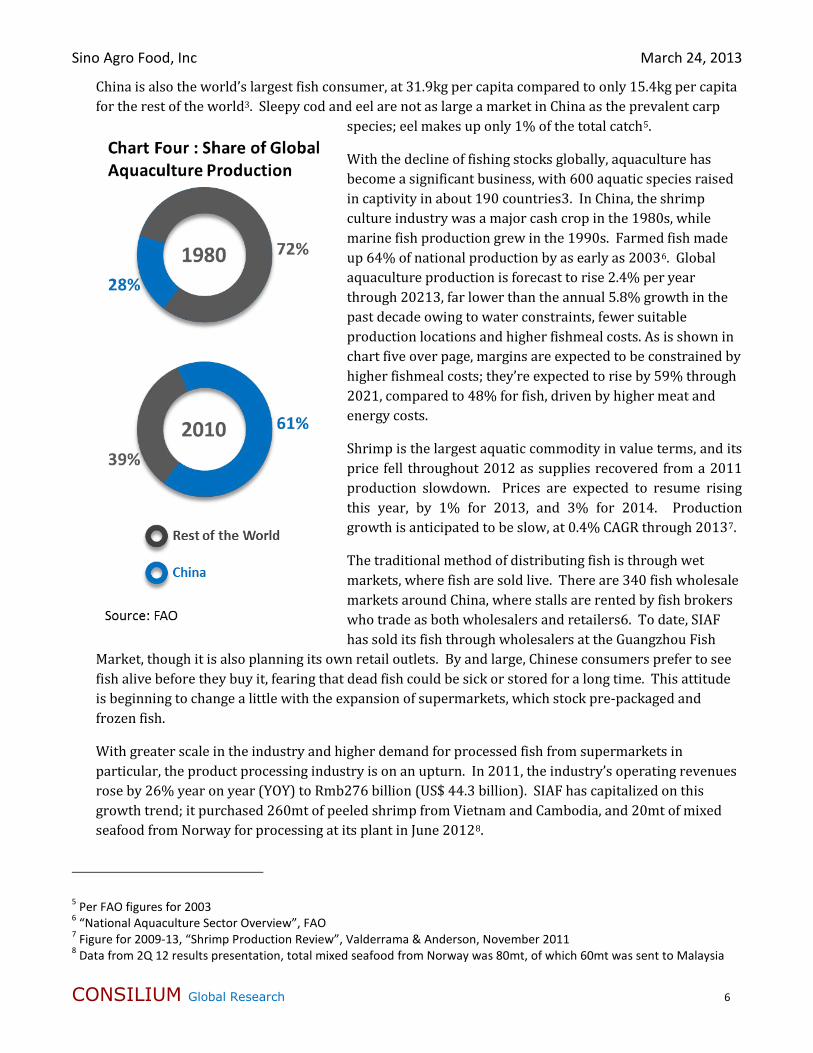
With the decline of fishing stocks globally, aquaculture has become a significant business, with 600 aquatic species raised in captivity in about 190 countries3. In China, the shrimp culture industry was a major cash crop in the 1980s, while marine fish production grew in the 1990s. Farmed fish made up 64% of national production by as early as 20036. Global aquaculture production is forecast to rise 2.4% per year through 20213, far lower than the annual 5.8% growth in the past decade owing to water constraints, fewer suitable production locations and higher fishmeal costs. As is shown in chart five over page, margins are expected to be constrained by higher fishmeal costs; they’re expected to rise by 59% through 2021, compared to 48% for fish, driven by higher meat and energy costs.
Shrimp is the largest aquatic commodity in value terms, and its price fell throughout 2012 as supplies recovered from a 2011 production slowdown. Prices are expected to resume rising this year, by 1% for 2013, and 3% for 2014. Production growth is anticipated to be slow, at 0.4% CAGR through 20137.
The traditional method of distributing fish is through wet markets, where fish are sold live. There are 340 fish wholesale markets around China, where stalls are rented by fish brokers who trade as both wholesalers and retailers6. To date, SIAF has sold its fish through wholesalers at the Guangzhou Fish
Market, though it is also planning its own retail outlets. By and large, Chinese consumers prefer to see fish alive before they buy it, fearing that dead fish could be sick or stored for a long time. This attitude is beginning to change a little with the expansion of supermarkets, which stock pre-packaged and frozen fish.
With greater scale in the industry and higher demand for processed fish from supermarkets in particular, the product processing industry is on an upturn. In 2011, the industry’s operating revenues rose by 26% year on year (YOY) to Rmb276 billion (US$ 44.3 billion). SIAF has capitalized on this growth trend; it purchased 260mt of peeled shrimp from Vietnam and Cambodia, and 20mt of mixed seafood from Norway for processing at its plant in June 20128.
5 Per FAO figures for 2003 6 “National Aquaculture Sector Overview”, FAO 7 Figure for 2009-13, “Shrimp Production Review”, Valderrama & Anderson, November 2011 8 Data from 2Q 12 results presentation, total mixed seafood from Norway was 80mt, of which 60mt was sent to Malaysia
Sino Agro Food, Inc March 24, 2013
CONSILIUM Global Research 7
SIAF faces a number of established and well-funded competitors, for instance Zhanjiang Guolian Aquatic Products had revenue 19 times that of SIAF’s aquaculture division in Q1-Q3 20129. Competition also comes from firms who previously exported to Europe, but who have been undercut by cheaper Southeast Asian competition. For example, Dongji Aquatic Products has seen its sales to Europe halve since
201110. In response, exporters are now marketing to local food service, central kitchen, food processors and restaurants.
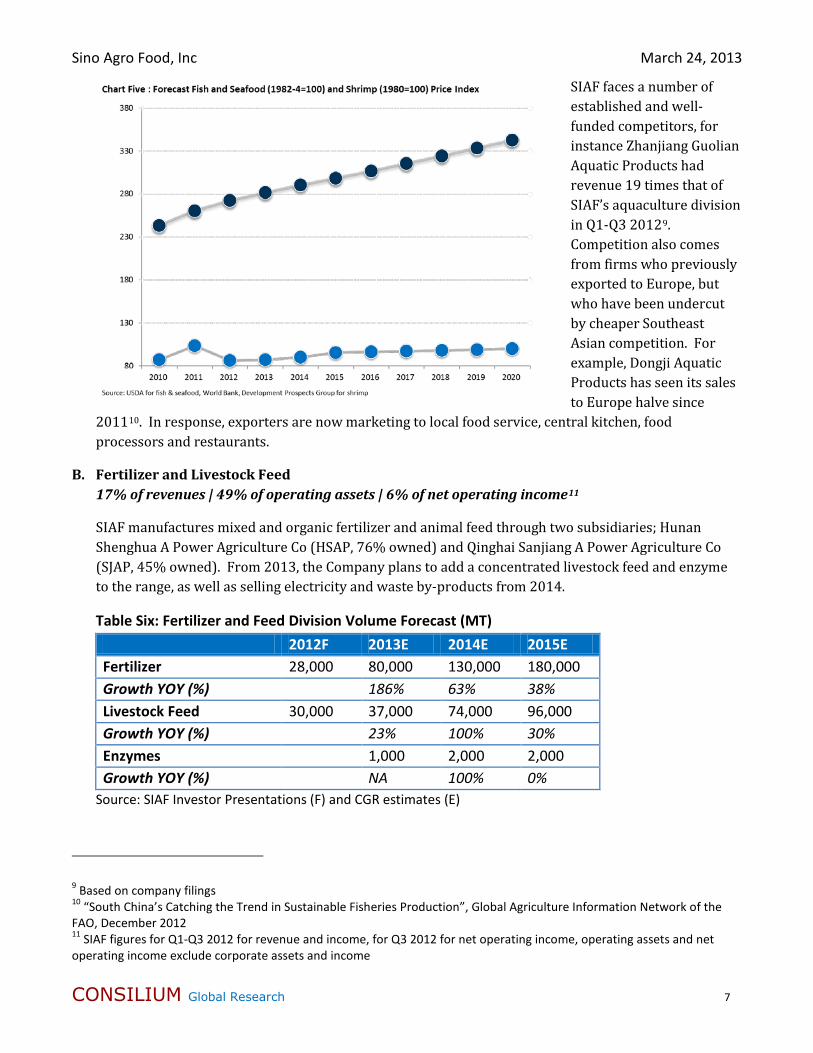
B. Fertilizer and Livestock Feed 17% of revenues | 49% of operating assets | 6% of net operating income11
SIAF manufactures mixed and organic fertilizer and animal feed through two subsidiaries; Hunan Shenghua A Power Agriculture Co (HSAP, 76% owned) and Qinghai Sanjiang A Power Agriculture Co (SJAP, 45% owned). From 2013, the Company plans to add a concentrated livestock feed and enzyme to the range, as well as selling electricity and waste by-products from 2014.
Table Six: Fertilizer and Feed Division Volume Forecast (MT) 2012F 2013E 2014E 2015E Fertilizer 28,000 80,000 130,000 180,000 Growth YOY (%) 186% 63% 38% Livestock Feed 30,000 37,000 74,000 96,000 Growth YOY (%) 23% 100% 30% Enzymes 1,000 2,000 2,000 Growth YOY (%) NA 100% 0%
Source: SIAF Investor Presentations (F) and CGR estimates (E)
9 Based on company filings 10 “South China’s Catching the Trend in Sustainable Fisheries Production”, Global Agriculture Information Network of the FAO, December 2012 11 SIAF figures for Q1-Q3 2012 for revenue and income, for Q3 2012 for net operating income, operating assets and net operating income exclude corporate assets and income
Sino Agro Food, Inc March 24, 2013
CONSILIUM Global Research 8
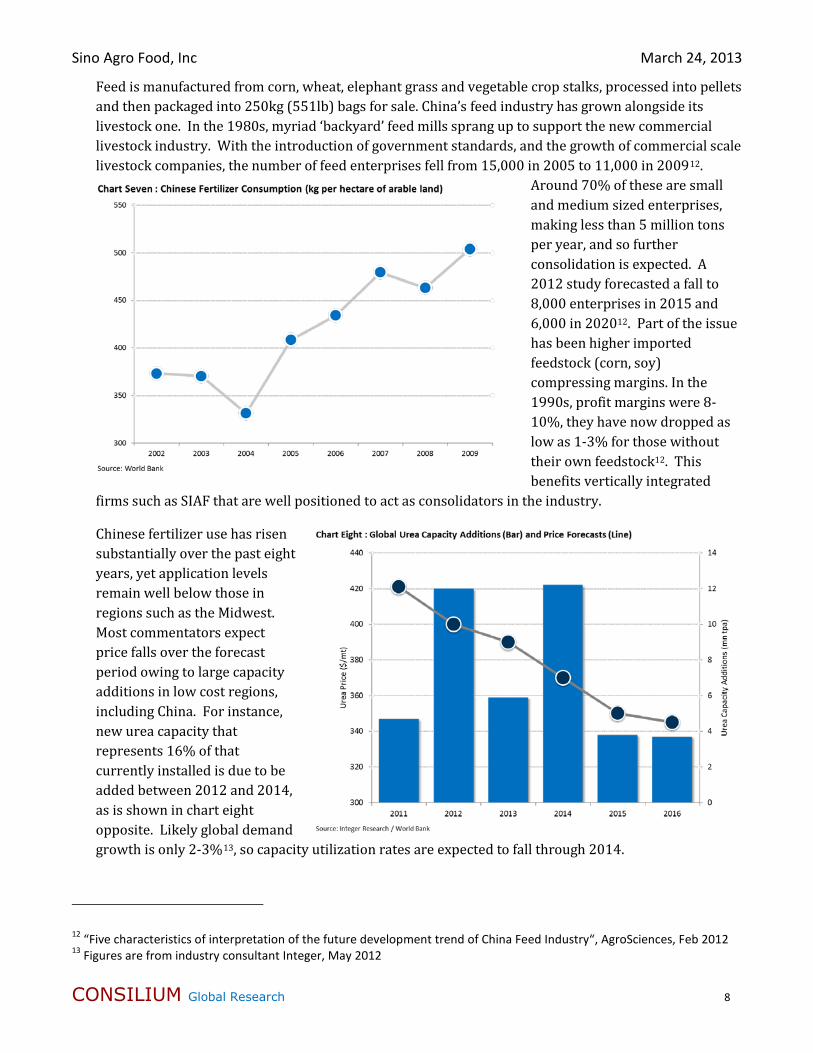
Feed is manufactured from corn, wheat, elephant grass and vegetable crop stalks, processed into pellets and then packaged into 250kg (551lb) bags for sale. China’s feed industry has grown alongside its livestock one. In the 1980s, myriad ‘backyard’ feed mills sprang up to support the new commercial livestock industry. With the introduction of government standards, and the growth of commercial scale livestock companies, the number of feed enterprises fell from 15,000 in 2005 to 11,000 in 200912.
Around 70% of these are small and medium sized enterprises, making less than 5 million tons per year, and so further consolidation is expected. A 2012 study forecasted a fall to 8,000 enterprises in 2015 and 6,000 in 202012. Part of the issue has been higher imported feedstock (corn, soy) compressing margins. In the 1990s, profit margins were 8-10%, they have now dropped as low as 1-3% for those without their own feedstock12. This benefits vertically integrated
firms such as SIAF that are well positioned to act as consolidators in the industry.
Chinese fertilizer use has risen substantially over the past eight years, yet application levels remain well below those in regions such as the Midwest. Most commentators expect price falls over the forecast period owing to large capacity additions in low cost regions, including China. For instance, new urea capacity that represents 16% of that currently installed is due to be added between 2012 and 2014, as is shown in chart eight opposite. Likely global demand growth is only 2-3%13, so capacity utilization rates are expected to fall through 2014.
12 “Five characteristics of interpretation of the future development trend of China Feed Industry“, AgroSciences, Feb 2012 13 Figures are from industry consultant Integer, May 2012
Sino Agro Food, Inc March 24, 2013
CONSILIUM Global Research 9
C. Cattle Farm 13% of revenues | 13% of operating assets | 16% of net operating income14
With operations in four subsidiaries, SIAF expected to process approximately 5,500 head of cattle in 2012, and to increase this volume by nearly 50% in 2013 as additional facilities are completed. The Company’s cattle are primarily Simmental, a common breed introduced to China in the early 20th century, Charolais, and some Angus cattle imported from the US. Six month old cattle are sold to local farmers, and SIAF commits to repurchasing the cattle at eighteen months. It also rents cattle housing to farmers, and will provide slaughter and deboning services to them once its abattoir is complete in 2014. Beef is distributed through wholesalers and through SIAF’s own restaurant. The Company will add sheep farming (through its SJAP subsidiary), and value added product processing in 2014, and aims to expand its steakhouse restaurant to a chain of 50 outlets over time. Overall, SIAF expects that revenues from operations in this division will rise more than 8x between 2012 and 2015, owing to the addition of further herds, and of processing facilities.
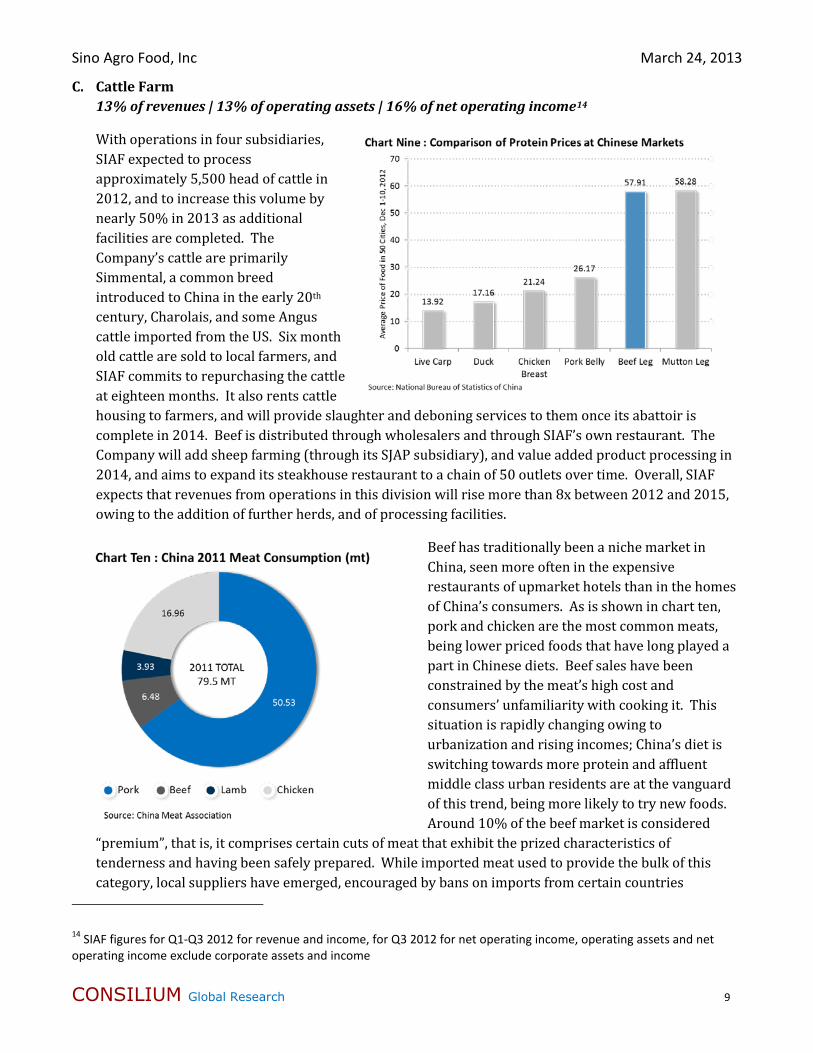
Beef has traditionally been a niche market in China, seen more often in the expensive restaurants of upmarket hotels than in the homes of China’s consumers. As is shown in chart ten, pork and chicken are the most common meats, being lower priced foods that have long played a part in Chinese diets. Beef sales have been constrained by the meat’s high cost and consumers’ unfamiliarity with cooking it. This situation is rapidly changing owing to urbanization and rising incomes; China’s diet is switching towards more protein and affluent middle class urban residents are at the vanguard of this trend, being more likely to try new foods. Around 10% of the beef market is considered
“premium”, that is, it comprises certain cuts of meat that exhibit the prized characteristics of tenderness and having been safely prepared. While imported meat used to provide the bulk of this category, local suppliers have emerged, encouraged by bans on imports from certain countries
14 SIAF figures for Q1-Q3 2012 for revenue and income, for Q3 2012 for net operating income, operating assets and net operating income exclude corporate assets and income
Sino Agro Food, Inc March 24, 2013
CONSILIUM Global Research 10
(including the US) and government support. Examples of competitors in the marketplace include The Shine’s Group, a Tianjin based company that sells organic vacuum-packed beef, and is advised by the renowned Dutch veal firm, the VanDrie group15.
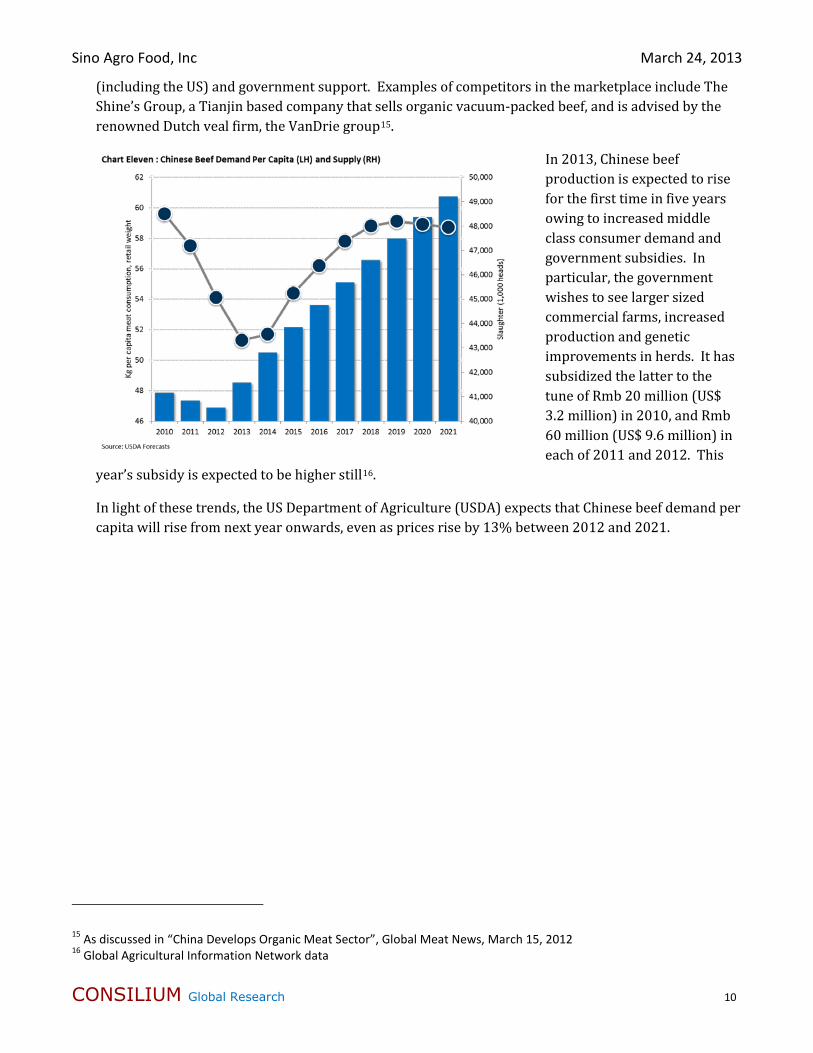
In 2013, Chinese beef production is expected to rise for the first time in five years owing to increased middle class consumer demand and government subsidies. In particular, the government wishes to see larger sized commercial farms, increased production and genetic improvements in herds. It has subsidized the latter to the tune of Rmb 20 million (US$ 3.2 million) in 2010, and Rmb 60 million (US$ 9.6 million) in each of 2011 and 2012. This
year’s subsidy is expected to be higher still16.
In light of these trends, the US Department of Agriculture (USDA) expects that Chinese beef demand per capita will rise from next year onwards, even as prices rise by 13% between 2012 and 2021.
15 As discussed in “China Develops Organic Meat Sector”, Global Meat News, March 15, 2012 16 Global Agricultural Information Network data
Sino Agro Food, Inc March 24, 2013
CONSILIUM Global Research 11
D. Flower Plantation 10% of revenues | 21% of operating assets | 14% of net operating income17
A 75% owned subsidiary18 – Jiangmen City Heng Sheng Tai Agriculture Development Co (JHST) –cultivates 187 acres of Hylocereous Undatus, or Dragon Fruit flowers in Guangdong Province. Dragon Fruit cacti flower for a very short period, sometimes only one night, and must be picked before they turn from green to white 10-12 inch long flowers, so they are by definition a fairly delicate crop. The harvesting season is from July through October.
Dragon Fruit cacti take three years to reach maturity, though they will flower a little even in their first year, and can produce for as long as twenty years. JHST was formed in 2007, and began planting in late 2007. The maturity profile of its plants is as follows:
Table Twelve : JHST Planting Schedule Planting Year Acres Planted Cumulative Acreage
2007 47 acres 47 acres
2008 88 acres 135 acres
2009 52 acres 187 acres
Source: SIAF SEC Filings
To date, the product has been sold in the form of dried flowers, which are used in health-related soups and teas, and fresh flowers, which are consumed as vegetables in China. The Company’s products have been sufficiently popular that they have been shipped as soon as ready, and this has led to a distinct seasonality in revenue, whereby more than half of the division’s revenues are recognized in the third quarter19, and no sales are booked in the first quarter. From 2013, the Company will also add pickled flowers, a higher value added product that has the benefit of being storable. By 2014, dried and pickled flowers are forecast to make up 96% of the division’s flower income as produce is diverted away from delicate fresh flowers. Over time, the Company plans to address the seasonality issue by selling dried and pickled flowers throughout the year and by adding an asparagus crop, though the latter is not reflected in the financial forecasts included here.
Fresh flowers are sold through more than 25 wholesale markets in Guangdong; they have a shelf life of only around three days. Dried flowers are sold domestically and exported to other Asian markets. The Chinese health food market is large, fast growing and fragmented. 11,653 registered domestic health food companies supply a Rmb200 billion20 (USD 32 billion) market that is growing at approximately 15% per year20. The Company views its greatest competition as local import / export firm Guangdong Zhong Dian Import & Export Inc. and Guangdong-based He Yuan Livestock Import & Export.
17 SIAF figures for Q1-Q3 2012 for revenue and income, for Q3 2012 for net operating income, operating assets and net operating income exclude corporate assets and income 18 Holding is through the 100% owned Macau Eiji Company Limited (MEIJI) 19 Based on 2011 figures, from SEC filings 20 USDA figure for 2011
Sino Agro Food, Inc March 24, 2013
CONSILIUM Global Research 12
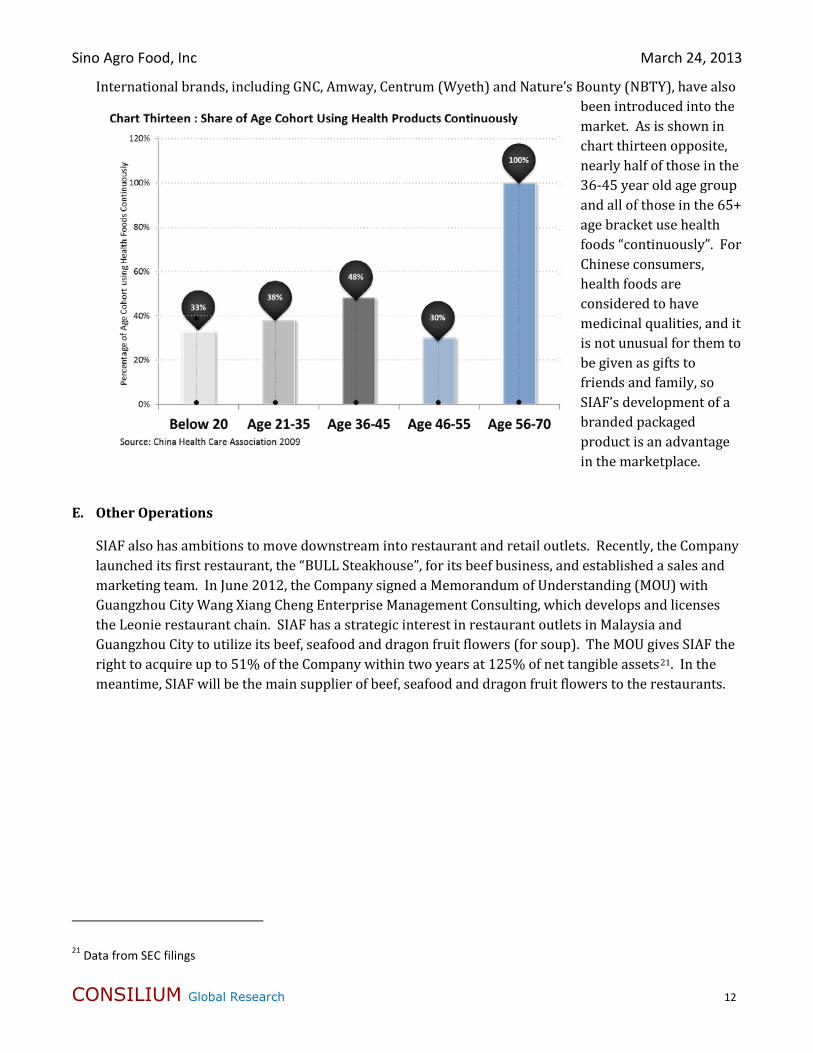
International brands, including GNC, Amway, Centrum (Wyeth) and Nature’s Bounty (NBTY), have also been introduced into the market. As is shown in chart thirteen opposite, nearly half of those in the 36-45 year old age group and all of those in the 65+ age bracket use health foods “continuously”. For Chinese consumers, health foods are considered to have medicinal qualities, and it is not unusual for them to be given as gifts to friends and family, so SIAF’s development of a branded packaged product is an advantage in the marketplace.
E. Other Operations
SIAF also has ambitions to move downstream into restaurant and retail outlets. Recently, the Company launched its first restaurant, the “BULL Steakhouse”, for its beef business, and established a sales and marketing team. In June 2012, the Company signed a Memorandum of Understanding (MOU) with Guangzhou City Wang Xiang Cheng Enterprise Management Consulting, which develops and licenses the Leonie restaurant chain. SIAF has a strategic interest in restaurant outlets in Malaysia and Guangzhou City to utilize its beef, seafood and dragon fruit flowers (for soup). The MOU gives SIAF the right to acquire up to 51% of the Company within two years at 125% of net tangible assets21. In the meantime, SIAF will be the main supplier of beef, seafood and dragon fruit flowers to the restaurants.
21 Data from SEC filings
Sino Agro Food, Inc March 24, 2013
CONSILIUM Global Research 13
POTENTIAL STOCK CATALYSTS
SIAF benefits from five potential catalysts for its business:
A. Restructuring of the Global Food Market
Globally, the food and agriculture sector is undergoing a structural adjustment owing to growing incomes and new lifestyles in emerging markets, globalization, liberalization of trade and emergence of new markets. World food markets are becoming more flexible, with new products entering markets more rapidly, especially value added products that are easier for consumers to prepare. Simultaneously, the land available for farming is shrinking globally, and yields for many crops have stagnated.
These changes are reflected in China’s food and agriculture sector. Rapid urbanization has impacted the availability of agricultural land, while simultaneously creating a modern urban middle class keen to ensure that their diet is diverse and their food safe. Urbanites tend to spend more on food, and be more adventurous in their food choices, than rural dwellers.
Distribution channels are also changing. The ‘wet markets’ that were the mainstay for the previous generation are considered outdated by a younger generation who prefer to buy groceries at supermarkets.
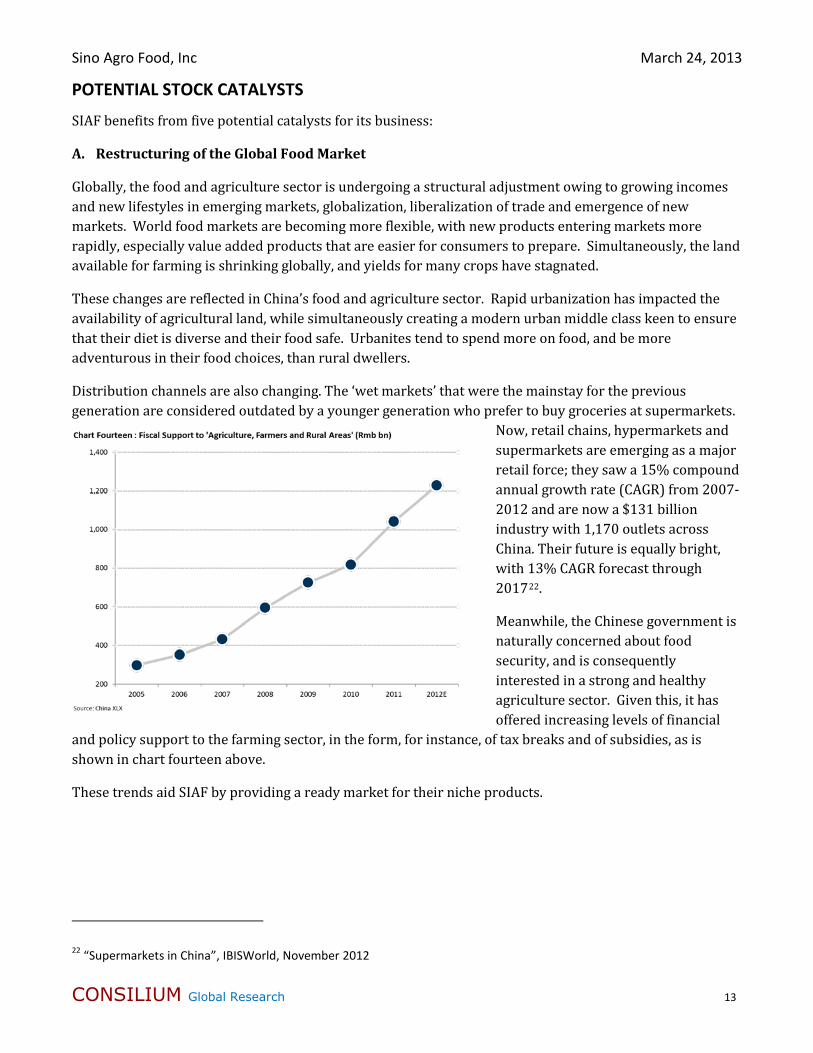
Now, retail chains, hypermarkets and supermarkets are emerging as a major retail force; they saw a 15% compound annual growth rate (CAGR) from 2007-2012 and are now a $131 billion industry with 1,170 outlets across China. Their future is equally bright, with 13% CAGR forecast through 201722.
Meanwhile, the Chinese government is naturally concerned about food security, and is consequently interested in a strong and healthy agriculture sector. Given this, it has offered increasing levels of financial
and policy support to the farming sector, in the form, for instance, of tax breaks and of subsidies, as is shown in chart fourteen above.
These trends aid SIAF by providing a ready market for their niche products.
22 “Supermarkets in China”, IBISWorld, November 2012
Sino Agro Food, Inc March 24, 2013
CONSILIUM Global Research 14
B. Use of Technology
One consequence of constrained farmland availability and stagnant yields is a revived interest in technology, both for farms and for the food supply chain. China is especially exposed, housing 22% of the world’s population, but having only 7% of the world’s arable land23. A recent study found a 22% increase in global agricultural research and development spending between 2000 and 2008, more than a third of which was in China24. SIAF is in lock step with this trend, investing in four production technologies and looking for others to acquire.
The most important of these is the A Power Technology, which is used in its aquaculture business. SIAF has advanced this technology to handle its sizeable farming facilities. The A-Power Technology is licensed to SIAF’s Capital Award subsidiary from Australian firm Infinity Environmental Group until the end of 2065. The Company describes the technology as “an engineered, self-contained water treatment and re-circulating aquaculture system ("RAS") for the growing of aquatic animals on a commercial scale.” The technology is proven, having been in use in Europe and Australia at various times for over 30 years. The Company attributes these benefits to the system: improved productivity, lower labor requirements, mortality rates of less than 8%, feed-to-fish conversion ratio of 1:1 for pallet feed and 2:1 for non-pallet feed. It is worth noting that some aquaculture systems use up to 3:1 ratios of feed-to-fish conversion. The indoor system is fully controlled, using UV treatment for water, which is then recycled, a solid waste filter, and micro-bio filter for soluble waste. Importantly, this system does not require chemicals or antibiotics and is pollution free. Given the high incidence of pollution in aquaculture, the technology gives SIAF a distinct advantage.
Further, the Company has adapted the technology for use in its prawn farm operations, allowing for their cultivation in controlled indoor environments.
Its livestock feed manufacture is aided by a technology patented in China and licensed through its Tri-Way subsidiary in 2008 for $8 million; it can be used across a number of animal feeds, including cattle and sheep. The Company has subsequently amended its livestock feed manufacturing process by incorporating its own enzyme technology. Finally, SIAF subsidiary MEIJI acquired additional technology for cattle feed in March 2012 for US$1.5 million.
C. Ambitious Expansion Plans
Though SIAF argues that it wishes to be the best quality, not the largest agriculture company, it has ambitious expansion plans over the next few years that increase the scale of existing lines of business, and diverse into new ones, such as processing and packaging. It intends to fund this expansion through a combination of internal cash flow, joint venture partner investments, land sales, bond issuance and bank debt. We forecasts 16% basic earnings per share growth in 2013, and more than 50% growth in 2014, far higher growth than that of its peers; the average earnings growth forecast for global agribusiness firms being only 1.2% for 201225.
23 FAO figures 24 ASTI Global Assessment Of Agricultural R&D Spending, October 2012 25 Figures are for the components of the MSCI Global Agriculture Producers Index for which data was publicly available
Sino Agro Food, Inc March 24, 2013
CONSILIUM Global Research 15
D. Vertical Integration
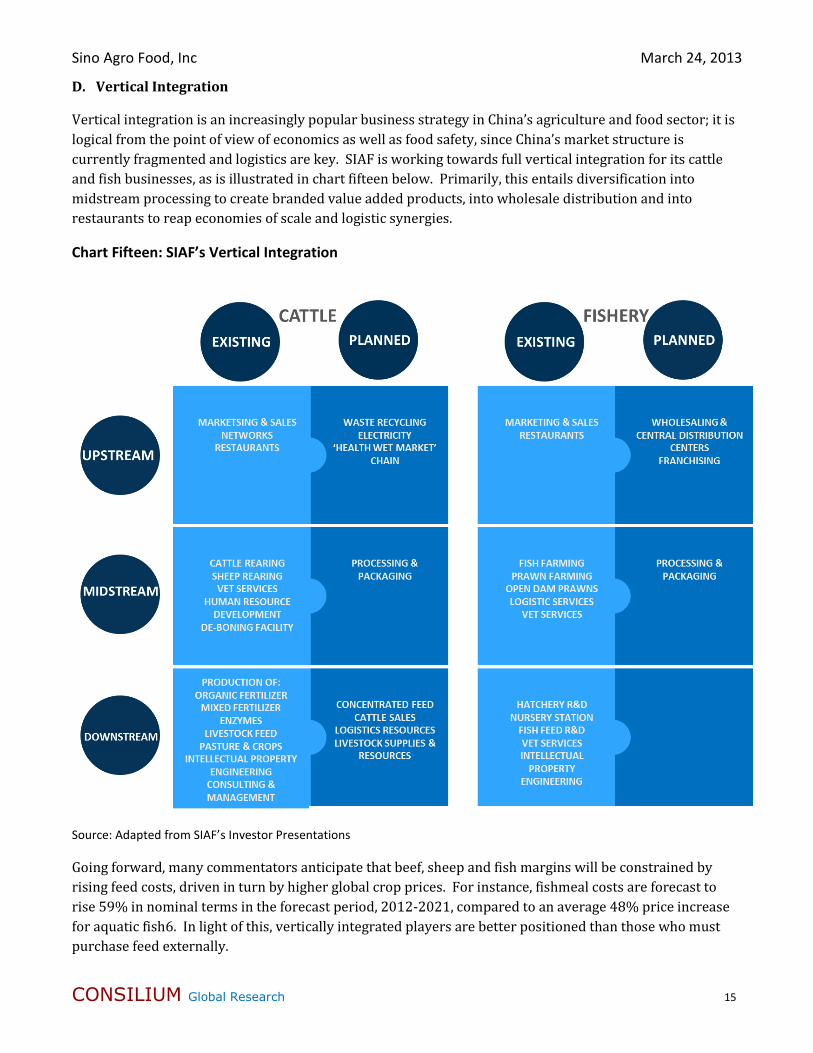
Vertical integration is an increasingly popular business strategy in China’s agriculture and food sector; it is logical from the point of view of economics as well as food safety, since China’s market structure is currently fragmented and logistics are key. SIAF is working towards full vertical integration for its cattle and fish businesses, as is illustrated in chart fifteen below. Primarily, this entails diversification into midstream processing to create branded value added products, into wholesale distribution and into restaurants to reap economies of scale and logistic synergies.
Chart Fifteen: SIAF’s Vertical Integration
Source: Adapted from SIAF’s Investor Presentations
Going forward, many commentators anticipate that beef, sheep and fish margins will be constrained by rising feed costs, driven in turn by higher global crop prices. For instance, fishmeal costs are forecast to rise 59% in nominal terms in the forecast period, 2012-2021, compared to an average 48% price increase for aquatic fish6. In light of this, vertically integrated players are better positioned than those who must purchase feed externally.
Sino Agro Food, Inc March 24, 2013
CONSILIUM Global Research 16
In addition, the margins available in value added products and retail are often more alluring than those from farming alone. For example, fish wholesalers receive an 8-50% margin, retailers a 10-100% one, depending on the size, quality and species of the fish26. By comparison, Shandong Homey Aquatic – Chinese subsidiary of the Canadian Homey Group major – has 22.7% gross margins on its aquaculture business.
Like others globally, China’s government is increasingly focused on improving the safety of the country’s food supply chain. As safety is the paramount concern for Chinese consumers when purchasing food, being considered a ‘safe brand’ is also important for a company’s success. In the absence of standardized procedures, one method for companies to be certain that their products are safe is to control production from the farm all the way through to the consumer, much as SIAF is planning to do over time.
E. Focus on Natural Foods and Sustainability
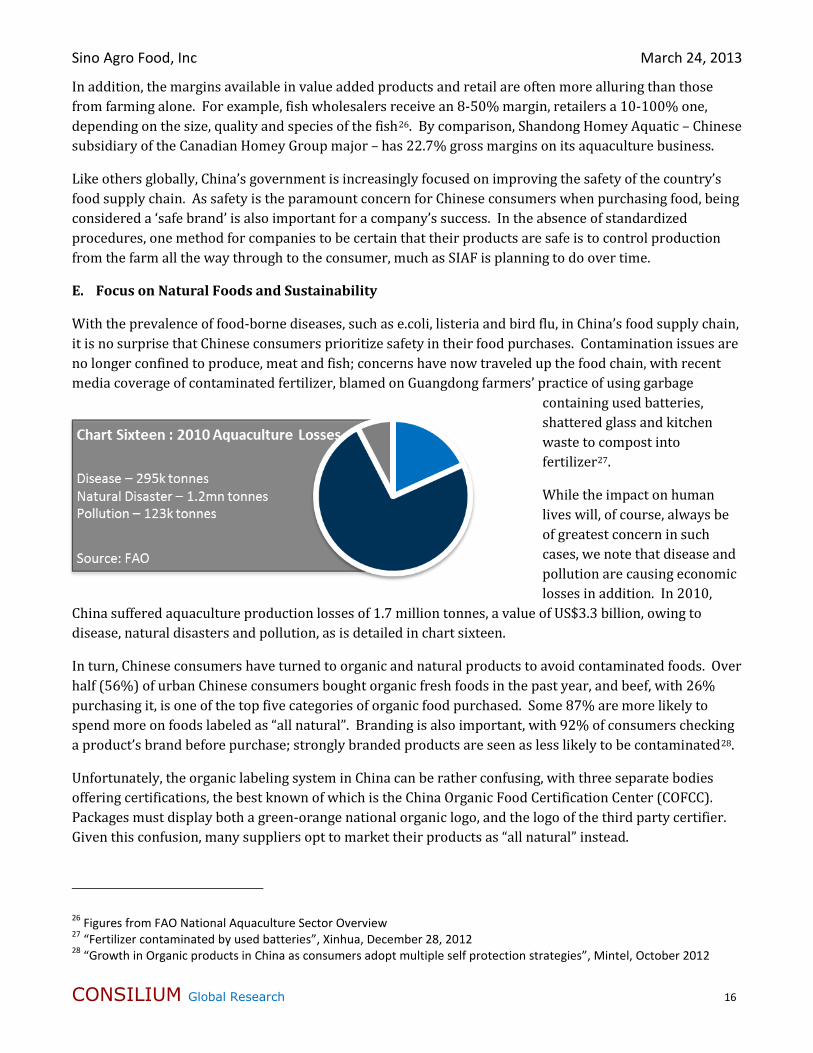
With the prevalence of food-borne diseases, such as e.coli, listeria and bird flu, in China’s food supply chain, it is no surprise that Chinese consumers prioritize safety in their food purchases. Contamination issues are no longer confined to produce, meat and fish; concerns have now traveled up the food chain, with recent media coverage of contaminated fertilizer, blamed on Guangdong farmers’ practice of using garbage
containing used batteries, shattered glass and kitchen waste to compost into fertilizer27.
While the impact on human lives will, of course, always be of greatest concern in such cases, we note that disease and pollution are causing economic losses in addition. In 2010,
China suffered aquaculture production losses of 1.7 million tonnes, a value of US$3.3 billion, owing to disease, natural disasters and pollution, as is detailed in chart sixteen.
In turn, Chinese consumers have turned to organic and natural products to avoid contaminated foods. Over half (56%) of urban Chinese consumers bought organic fresh foods in the past year, and beef, with 26% purchasing it, is one of the top five categories of organic food purchased. Some 87% are more likely to spend more on foods labeled as “all natural”. Branding is also important, with 92% of consumers checking a product’s brand before purchase; strongly branded products are seen as less likely to be contaminated28.
Unfortunately, the organic labeling system in China can be rather confusing, with three separate bodies offering certifications, the best known of which is the China Organic Food Certification Center (COFCC). Packages must display both a green-orange national organic logo, and the logo of the third party certifier. Given this confusion, many suppliers opt to market their products as “all natural” instead.
26 Figures from FAO National Aquaculture Sector Overview 27 “Fertilizer contaminated by used batteries”, Xinhua, December 28, 2012 28 “Growth in Organic products in China as consumers adopt multiple self protection strategies”, Mintel, October 2012
Sino Agro Food, Inc March 24, 2013
CONSILIUM Global Research 17
Though Chinese consumers care mostly about food safety and prices, not about sustainability, a growing number of suppliers view sustainable practices and international standards as a method of ensuring food safety. For instance, KFC insists that its cod fish fillets use sustainable fishery standards29. SIAF says that it intends to follow International Organization for Standardization (ISO) standards at its abattoir.
SIAF’s use of water-conserving and chemical-free fish farming methods puts it in the zeitgeist of this movement. SIAF has not qualified its beef as organic, because a small portion of its feed that it buys in is not certified organic. That said, the Company has created two ‘natural food’ brand names - SIAF Green & Natural (for meat products) and SIAF Sky Blue & Natural (for aquatic products) - and intends to continue marketing its products as “all natural”.
F. Increased Opportunities for Trading Post Swedish Listing
SIAF’s stock presently trades on the OTCQB exchange, which has the same SEC reporting requirements as other exchanges, but more lenient listing requirements. The exchange is thinly traded, and has attracted concerns regarding potential stock fraud over the years. By contrast, the OMX exchange is a grouping of European exchanges that was acquired by NASDAQ in 2007, and has equity trading volumes some 49 times30 those on the OTCQB. SIAF’s proposed listing on the NASDAQ OMX First North Stockholm market is therefore beneficial both for additional liquidity and for the firm’s reputation in financial markets.
Moreover, it is a common perception that European investors are more open to companies, which focus on sustainability as a core principle of their businesses. For instance, industry journal Pensions and Investments argues that there are nearly three times as many impact investment assets under management in Europe as in the US31.
29 “South China’s Catching the Trend in Sustainable Fisheries Production”, Global Agriculture Information Network of the FAO, December 2012 30 Based on Jan-Nov 2012 trading data from NASDAQ OMX for European equity only, and for all OTCQB trades 31 “Time to integrate ESG into analysis”, Pensions and Investments, March 5, 2012
Sino Agro Food, Inc March 24, 2013
CONSILIUM Global Research 18
COMPANY RISKS
SIAF faces operational and competition risks common to any agriculture business, as well financial and reputational risks owing to its holding company structure and ongoing stock dilution:
A. Operational Risks For any farming operation, crop failure is always a paramount concern. Indeed, SIAF is experimenting with greenhouse growing for its flower plantation after weather-related losses. For SIAF, operational risk is exacerbated by the extraordinary pace of growth in its operations. For example, it has delayed construction of processing facilities at its flower plantation by a few months as the governing authority required its plans to be redrafted (a common lag).
B. Well Established Competition As is illustrated in our discussion of SIAF’s peer group below, the Company faces a number of well-established and well-funded competitors in each of its divisions. Though some would argue that competition is irrelevant for a firm facing commodity markets, there will likely be competition for skilled labor and facilities at some point in the future, and many of the Company’s competitors are far larger than SIAF and have better access to capital. This is one of the many reasons that it is logical for SIAF to expand operations quickly, and to access additional sources of capital through an incremental listing strategy.
Part of this development capital comes from the private equity firms that have a newfound interest in the global agriculture sector; agriculture deals made up 9% of total Chinese private equity deals by number of transactions in Q3 201232. Large multinational funds, such as KKR (dairy firm Modern Farming), Sequoia Capital (services group Land V. Group Ltd, now divested) and the Carlyle Group (infant formula company Guangdong Yashili), have invested in the sector.
In addition, large firms in other industries are taking an interest in agriculture. For example, former state owned majors Wuhan Iron and Steel and Shaanxi Coking Coal Group have both announced a move into pig farming in the past year.
C. Holding Company Structure SIAF’s holding company structure is a common one for foreign companies operating in China, its accounts are audited by a Utah based accounting firm (Madsen & Associates), and the Company has provided far more comprehensive information in its SEC filings and investor presentations than is common for many of its peers. Despite this, holding company structures can be off putting for some international investors with a preference for non-conglomerate structures. We expect that these issues will be partially addressed by the NASDAQ OMX listing referenced above, as the firm will face more stringent reporting criteria on this exchange.
D. Potential for Further Stock Dilution We are assuming 40% dilution in the number of basic shares in 2012, 20% in 2013 and a further 20% in 2014. In addition, the Company has discussed listing some subsidiaries separately from 2015 onwards to assist capital raising for growth plans.
32 “China’s Private Equity Market, Q3 2012”, The China Perspective, October 2012
Sino Agro Food, Inc March 24, 2013
CONSILIUM Global Research 19
COMPANY FINANCIALS
The figures below are from SIAF for 2012 (A), and Consilium Global Research (CGR) estimates for 2013 (F), and CGR estimates for 2014 and 2015 (E).
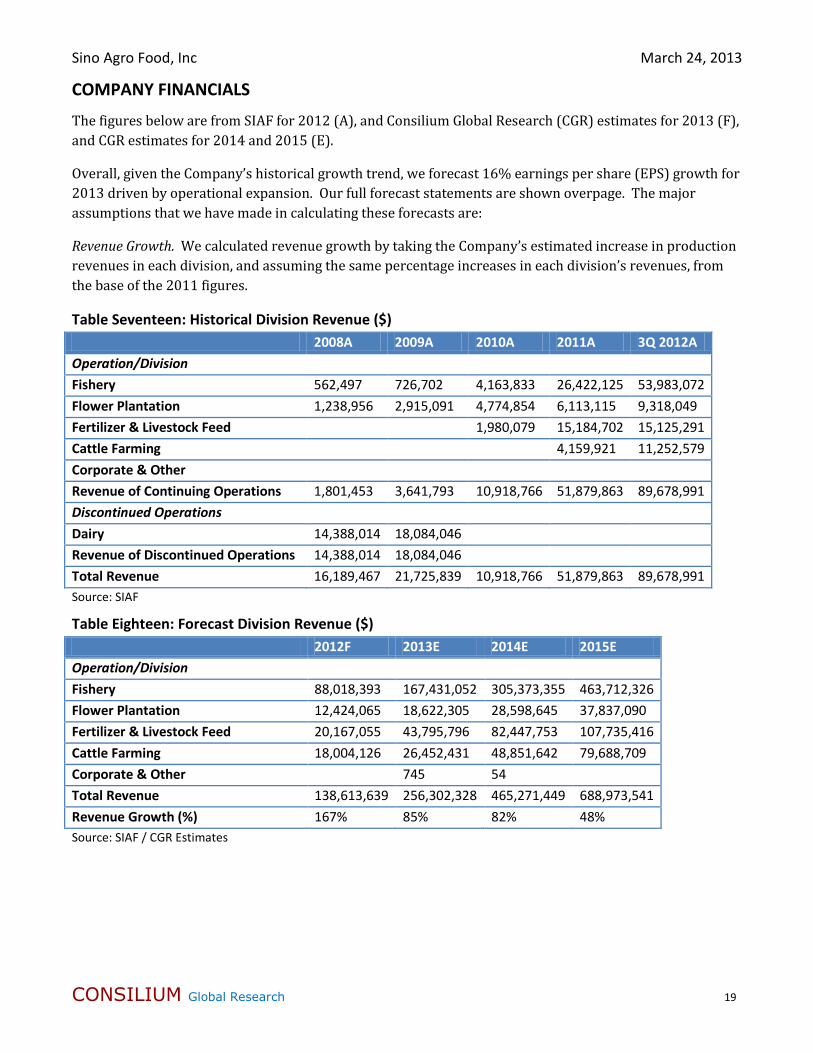
Overall, given the Company’s historical growth trend, we forecast 16% earnings per share (EPS) growth for 2013 driven by operational expansion. Our full forecast statements are shown overpage. The major assumptions that we have made in calculating these forecasts are:
Revenue Growth. We calculated revenue growth by taking the Company’s estimated increase in production revenues in each division, and assuming the same percentage increases in each division’s revenues, from the base of the 2011 figures.
Table Seventeen: Historical Division Revenue ($) 2008A 2009A 2010A 2011A 3Q 2012A Operation/Division Fishery 562,497 726,702 4,163,833 26,422,125 53,983,072 Flower Plantation 1,238,956 2,915,091 4,774,854 6,113,115 9,318,049 Fertilizer & Livestock Feed 1,980,079 15,184,702 15,125,291 Cattle Farming 4,159,921 11,252,579 Corporate & Other Revenue of Continuing Operations 1,801,453 3,641,793 10,918,766 51,879,863 89,678,991 Discontinued Operations Dairy 14,388,014 18,084,046 Revenue of Discontinued Operations 14,388,014 18,084,046 Total Revenue 16,189,467 21,725,839 10,918,766 51,879,863 89,678,991 Source: SIAF
Table Eighteen: Forecast Division Revenue ($) 2012F 2013E 2014E 2015E Operation/Division Fishery 88,018,393 167,431,052 305,373,355 463,712,326 Flower Plantation 12,424,065 18,622,305 28,598,645 37,837,090 Fertilizer & Livestock Feed 20,167,055 43,795,796 82,447,753 107,735,416 Cattle Farming 18,004,126 26,452,431 48,851,642 79,688,709 Corporate & Other 745 54 Total Revenue 138,613,639 256,302,328 465,271,449 688,973,541 Revenue Growth (%) 167% 85% 82% 48% Source: SIAF / CGR Estimates
Sino Agro Food, Inc March 24, 2013
CONSILIUM Global Research 20
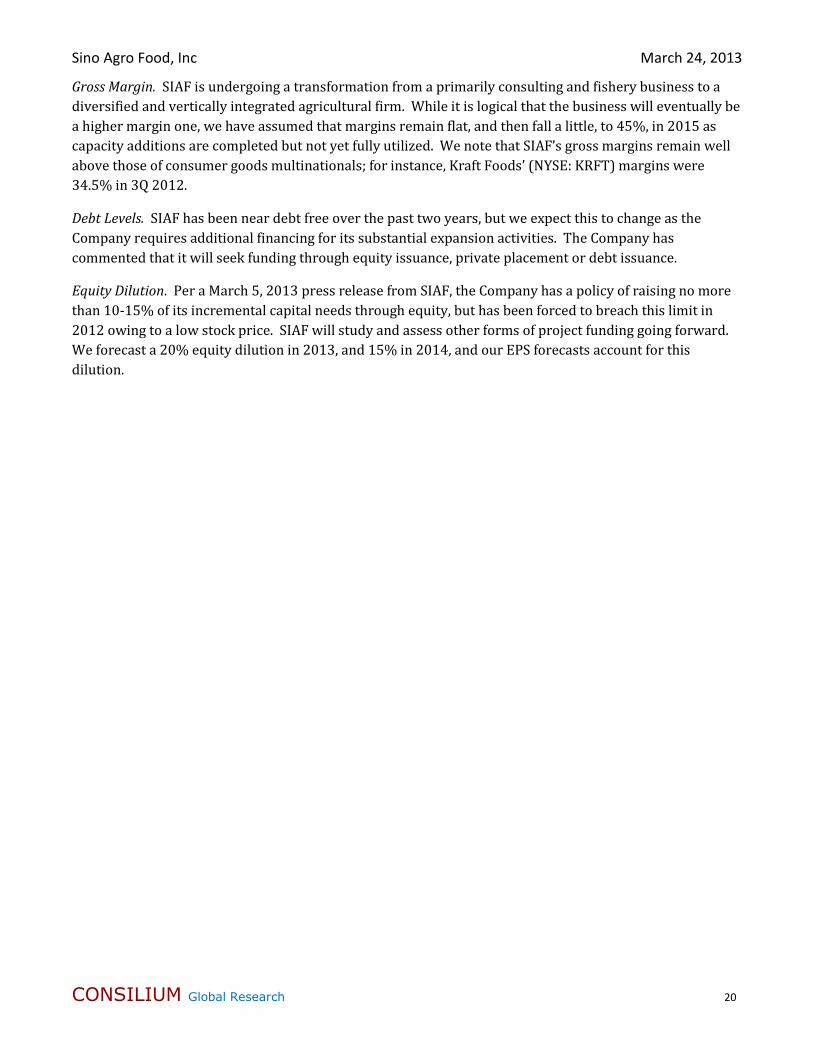
Gross Margin. SIAF is undergoing a transformation from a primarily consulting and fishery business to a diversified and vertically integrated agricultural firm. While it is logical that the business will eventually be a higher margin one, we have assumed that margins remain flat, and then fall a little, to 45%, in 2015 as capacity additions are completed but not yet fully utilized. We note that SIAF’s gross margins remain well above those of consumer goods multinationals; for instance, Kraft Foods’ (NYSE: KRFT) margins were 34.5% in 3Q 2012.
Debt Levels. SIAF has been near debt free over the past two years, but we expect this to change as the Company requires additional financing for its substantial expansion activities. The Company has commented that it will seek funding through equity issuance, private placement or debt issuance.
Equity Dilution. Per a March 5, 2013 press release from SIAF, the Company has a policy of raising no more than 10-15% of its incremental capital needs through equity, but has been forced to breach this limit in 2012 owing to a low stock price. SIAF will study and assess other forms of project funding going forward. We forecast a 20% equity dilution in 2013, and 15% in 2014, and our EPS forecasts account for this dilution.
Sino Agro Food, Inc March 24, 2013
CONSILIUM Global Research 21
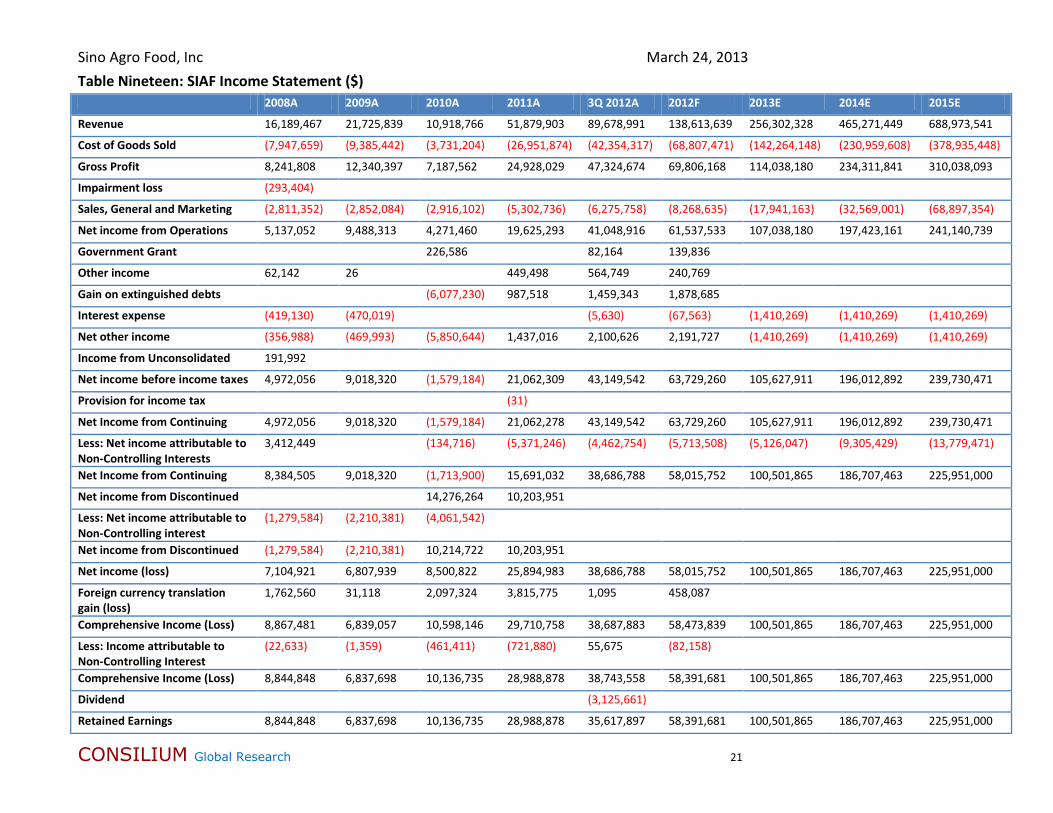
Table Nineteen: SIAF Income Statement ($) 2008A 2009A 2010A 2011A 3Q 2012A 2012F 2013E 2014E 2015E
Revenue 16,189,467 21,725,839 10,918,766 51,879,903 89,678,991 138,613,639 256,302,328 465,271,449 688,973,541
Cost of Goods Sold (7,947,659) (9,385,442) (3,731,204) (26,951,874) (42,354,317) (68,807,471) (142,264,148) (230,959,608) (378,935,448)
Gross Profit 8,241,808 12,340,397 7,187,562 24,928,029 47,324,674 69,806,168 114,038,180 234,311,841 310,038,093
Impairment loss (293,404)
Sales, General and Marketing (2,811,352) (2,852,084) (2,916,102) (5,302,736) (6,275,758) (8,268,635) (17,941,163) (32,569,001) (68,897,354)
Net income from Operations 5,137,052 9,488,313 4,271,460 19,625,293 41,048,916 61,537,533 107,038,180 197,423,161 241,140,739
Government Grant 226,586 82,164 139,836
Other income 62,142 26 449,498 564,749 240,769
Gain on extinguished debts (6,077,230) 987,518 1,459,343 1,878,685
Interest expense (419,130) (470,019) (5,630) (67,563) (1,410,269) (1,410,269) (1,410,269)
Net other income (356,988) (469,993) (5,850,644) 1,437,016 2,100,626 2,191,727 (1,410,269) (1,410,269) (1,410,269)
Income from Unconsolidated 191,992
Net income before income taxes 4,972,056 9,018,320 (1,579,184) 21,062,309 43,149,542 63,729,260 105,627,911 196,012,892 239,730,471
Provision for income tax (31)
Net Income from Continuing 4,972,056 9,018,320 (1,579,184) 21,062,278 43,149,542 63,729,260 105,627,911 196,012,892 239,730,471
Less: Net income attributable to Non-Controlling Interests
3,412,449 (134,716) (5,371,246) (4,462,754) (5,713,508) (5,126,047) (9,305,429) (13,779,471)
Net Income from Continuing 8,384,505 9,018,320 (1,713,900) 15,691,032 38,686,788 58,015,752 100,501,865 186,707,463 225,951,000
Net income from Discontinued 14,276,264 10,203,951
Less: Net income attributable to Non-Controlling interest
(1,279,584) (2,210,381) (4,061,542)
Net income from Discontinued (1,279,584) (2,210,381) 10,214,722 10,203,951
Net income (loss) 7,104,921 6,807,939 8,500,822 25,894,983 38,686,788 58,015,752 100,501,865 186,707,463 225,951,000
Foreign currency translation gain (loss)
1,762,560 31,118 2,097,324 3,815,775 1,095 458,087
Comprehensive Income (Loss) 8,867,481 6,839,057 10,598,146 29,710,758 38,687,883 58,473,839 100,501,865 186,707,463 225,951,000
Less: Income attributable to Non-Controlling Interest
(22,633) (1,359) (461,411) (721,880) 55,675 (82,158)
Comprehensive Income (Loss) 8,844,848 6,837,698 10,136,735 28,988,878 38,743,558 58,391,681 100,501,865 186,707,463 225,951,000
Dividend (3,125,661)
Retained Earnings 8,844,848 6,837,698 10,136,735 28,988,878 35,617,897 58,391,681 100,501,865 186,707,463 225,951,000
Sino Agro Food, Inc March 24, 2013
CONSILIUM Global Research 22
2008A 2009A 2010A 2011A 3Q 2012A 2012F 2013E 2014E 2015E
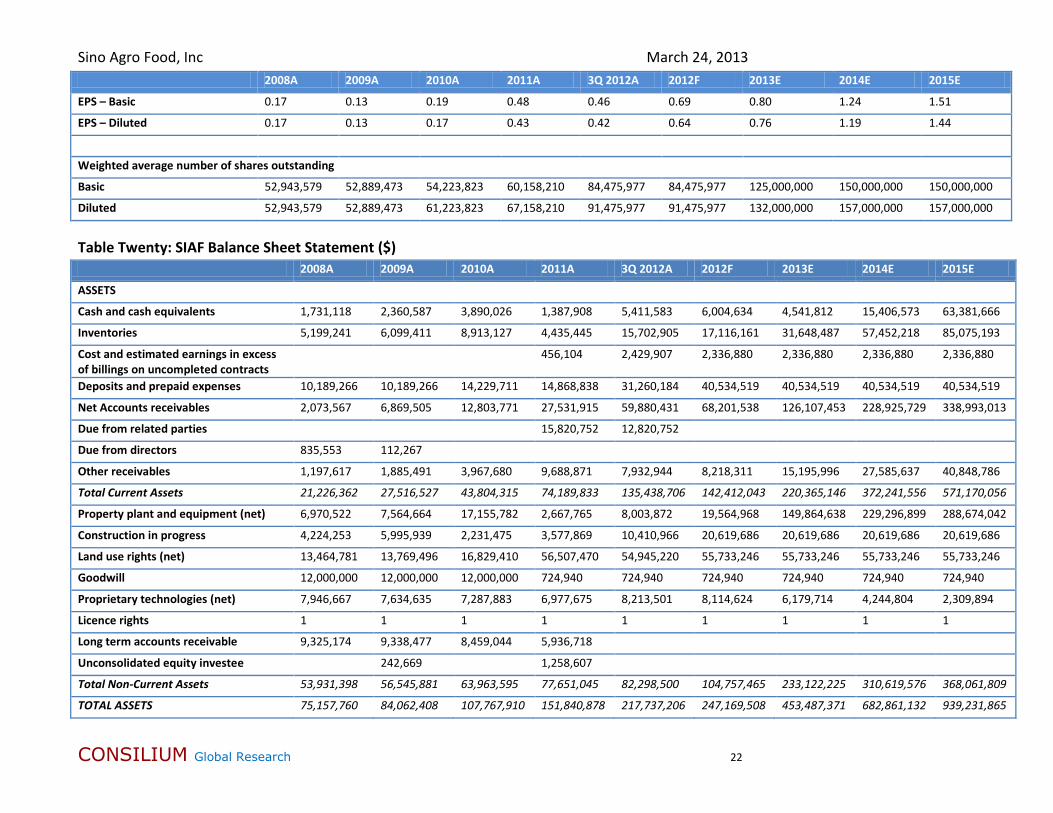
EPS – Basic 0.17 0.13 0.19 0.48 0.46 0.69 0.80 1.24 1.51
EPS – Diluted 0.17 0.13 0.17 0.43 0.42 0.64 0.76 1.19 1.44
Weighted average number of shares outstanding
Basic 52,943,579 52,889,473 54,223,823 60,158,210 84,475,977 84,475,977 125,000,000 150,000,000 150,000,000
Diluted 52,943,579 52,889,473 61,223,823 67,158,210 91,475,977 91,475,977 132,000,000 157,000,000 157,000,000
Table Twenty: SIAF Balance Sheet Statement ($) 2008A 2009A 2010A 2011A 3Q 2012A 2012F 2013E 2014E 2015E
ASSETS
Cash and cash equivalents 1,731,118 2,360,587 3,890,026 1,387,908 5,411,583 6,004,634 4,541,812 15,406,573 63,381,666
Inventories 5,199,241 6,099,411 8,913,127 4,435,445 15,702,905 17,116,161 31,648,487 57,452,218 85,075,193
Cost and estimated earnings in excess of billings on uncompleted contracts
456,104 2,429,907 2,336,880 2,336,880 2,336,880 2,336,880
Deposits and prepaid expenses 10,189,266 10,189,266 14,229,711 14,868,838 31,260,184 40,534,519 40,534,519 40,534,519 40,534,519
Net Accounts receivables 2,073,567 6,869,505 12,803,771 27,531,915 59,880,431 68,201,538 126,107,453 228,925,729 338,993,013
Due from related parties 15,820,752 12,820,752
Due from directors 835,553 112,267
Other receivables 1,197,617 1,885,491 3,967,680 9,688,871 7,932,944 8,218,311 15,195,996 27,585,637 40,848,786
Total Current Assets 21,226,362 27,516,527 43,804,315 74,189,833 135,438,706 142,412,043 220,365,146 372,241,556 571,170,056
Property plant and equipment (net) 6,970,522 7,564,664 17,155,782 2,667,765 8,003,872 19,564,968 149,864,638 229,296,899 288,674,042
Construction in progress 4,224,253 5,995,939 2,231,475 3,577,869 10,410,966 20,619,686 20,619,686 20,619,686 20,619,686
Land use rights (net) 13,464,781 13,769,496 16,829,410 56,507,470 54,945,220 55,733,246 55,733,246 55,733,246 55,733,246
Goodwill 12,000,000 12,000,000 12,000,000 724,940 724,940 724,940 724,940 724,940 724,940
Proprietary technologies (net) 7,946,667 7,634,635 7,287,883 6,977,675 8,213,501 8,114,624 6,179,714 4,244,804 2,309,894
Licence rights 1 1 1 1 1 1 1 1 1
Long term accounts receivable 9,325,174 9,338,477 8,459,044 5,936,718
Unconsolidated equity investee 242,669 1,258,607
Total Non-Current Assets 53,931,398 56,545,881 63,963,595 77,651,045 82,298,500 104,757,465 233,122,225 310,619,576 368,061,809
TOTAL ASSETS 75,157,760 84,062,408 107,767,910 151,840,878 217,737,206 247,169,508 453,487,371 682,861,132 939,231,865
Sino Agro Food, Inc March 24, 2013
CONSILIUM Global Research 23
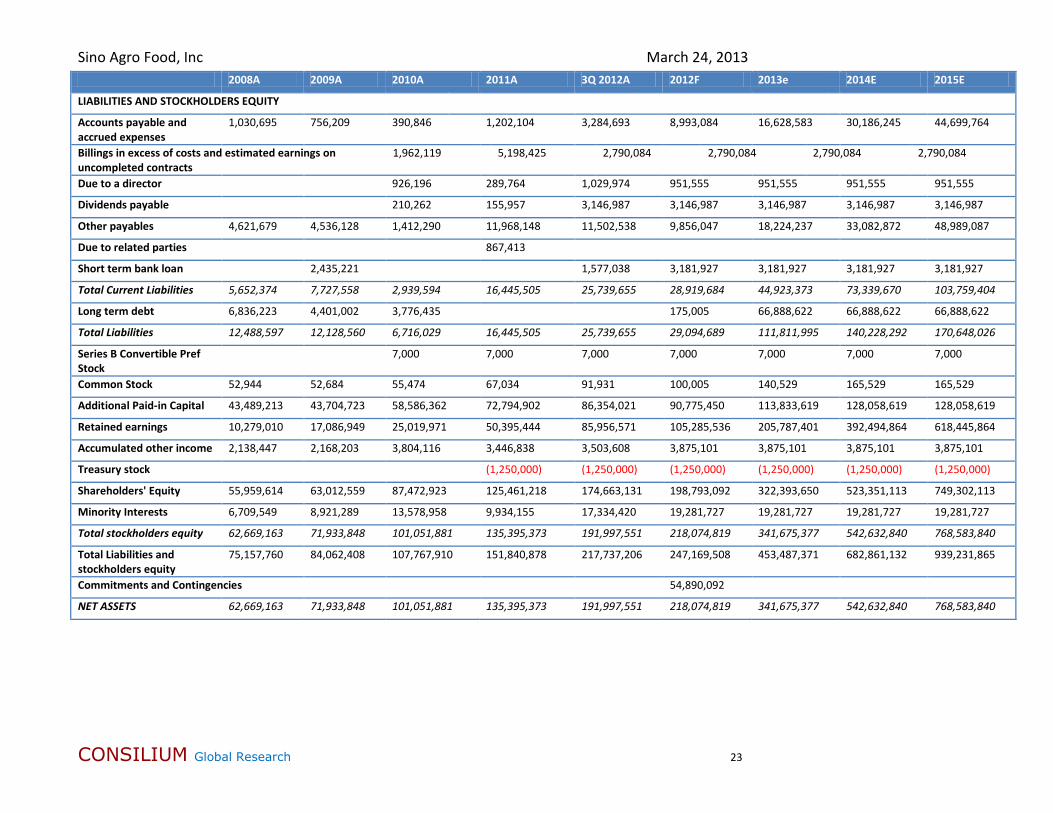
2008A 2009A 2010A 2011A 3Q 2012A 2012F 2013e 2014E 2015E
LIABILITIES AND STOCKHOLDERS EQUITY
Accounts payable and accrued expenses
1,030,695 756,209 390,846 1,202,104 3,284,693 8,993,084 16,628,583 30,186,245 44,699,764
Billings in excess of costs and estimated earnings on uncompleted contracts
1,962,119 5,198,425 2,790,084 2,790,084 2,790,084 2,790,084
Due to a director 926,196 289,764 1,029,974 951,555 951,555 951,555 951,555
Dividends payable 210,262 155,957 3,146,987 3,146,987 3,146,987 3,146,987 3,146,987
Other payables 4,621,679 4,536,128 1,412,290 11,968,148 11,502,538 9,856,047 18,224,237 33,082,872 48,989,087
Due to related parties 867,413
Short term bank loan 2,435,221 1,577,038 3,181,927 3,181,927 3,181,927 3,181,927
Total Current Liabilities 5,652,374 7,727,558 2,939,594 16,445,505 25,739,655 28,919,684 44,923,373 73,339,670 103,759,404
Long term debt 6,836,223 4,401,002 3,776,435 175,005 66,888,622 66,888,622 66,888,622
Total Liabilities 12,488,597 12,128,560 6,716,029 16,445,505 25,739,655 29,094,689 111,811,995 140,228,292 170,648,026
Series B Convertible Pref Stock
7,000 7,000 7,000 7,000 7,000 7,000 7,000
Common Stock 52,944 52,684 55,474 67,034 91,931 100,005 140,529 165,529 165,529
Additional Paid-in Capital 43,489,213 43,704,723 58,586,362 72,794,902 86,354,021 90,775,450 113,833,619 128,058,619 128,058,619
Retained earnings 10,279,010 17,086,949 25,019,971 50,395,444 85,956,571 105,285,536 205,787,401 392,494,864 618,445,864
Accumulated other income 2,138,447 2,168,203 3,804,116 3,446,838 3,503,608 3,875,101 3,875,101 3,875,101 3,875,101
Treasury stock (1,250,000) (1,250,000) (1,250,000) (1,250,000) (1,250,000) (1,250,000)
Shareholders' Equity 55,959,614 63,012,559 87,472,923 125,461,218 174,663,131 198,793,092 322,393,650 523,351,113 749,302,113
Minority Interests 6,709,549 8,921,289 13,578,958 9,934,155 17,334,420 19,281,727 19,281,727 19,281,727 19,281,727
Total stockholders equity 62,669,163 71,933,848 101,051,881 135,395,373 191,997,551 218,074,819 341,675,377 542,632,840 768,583,840
Total Liabilities and stockholders equity
75,157,760 84,062,408 107,767,910 151,840,878 217,737,206 247,169,508 453,487,371 682,861,132 939,231,865
Commitments and Contingencies 54,890,092
NET ASSETS 62,669,163 71,933,848 101,051,881 135,395,373 191,997,551 218,074,819 341,675,377 542,632,840 768,583,840
Sino Agro Food, Inc March 24, 2013
CONSILIUM Global Research 24
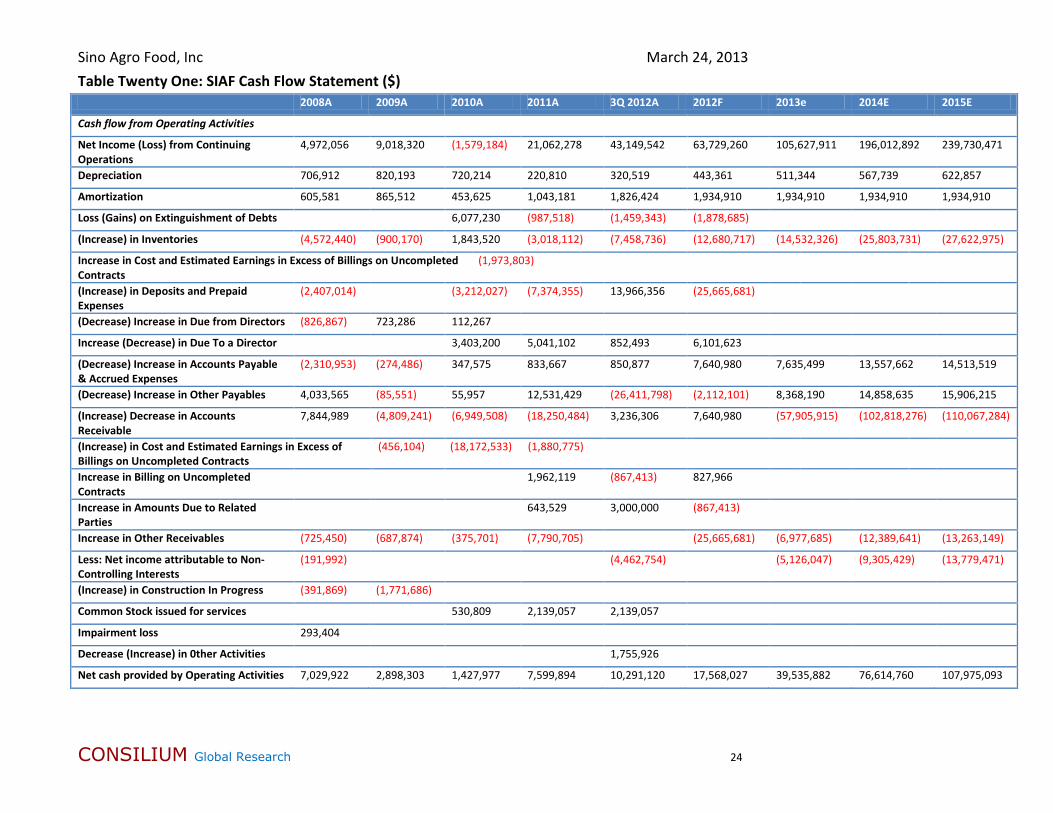
Table Twenty One: SIAF Cash Flow Statement ($) 2008A 2009A 2010A 2011A 3Q 2012A 2012F 2013e 2014E 2015E
Cash flow from Operating Activities
Net Income (Loss) from Continuing Operations
4,972,056 9,018,320 (1,579,184) 21,062,278 43,149,542 63,729,260 105,627,911 196,012,892 239,730,471
Depreciation 706,912 820,193 720,214 220,810 320,519 443,361 511,344 567,739 622,857
Amortization 605,581 865,512 453,625 1,043,181 1,826,424 1,934,910 1,934,910 1,934,910 1,934,910
Loss (Gains) on Extinguishment of Debts 6,077,230 (987,518) (1,459,343) (1,878,685)
(Increase) in Inventories (4,572,440) (900,170) 1,843,520 (3,018,112) (7,458,736) (12,680,717) (14,532,326) (25,803,731) (27,622,975)
Increase in Cost and Estimated Earnings in Excess of Billings on Uncompleted Contracts
(1,973,803)
(Increase) in Deposits and Prepaid Expenses
(2,407,014) (3,212,027) (7,374,355) 13,966,356 (25,665,681)
(Decrease) Increase in Due from Directors (826,867) 723,286 112,267
Increase (Decrease) in Due To a Director 3,403,200 5,041,102 852,493 6,101,623
(Decrease) Increase in Accounts Payable & Accrued Expenses
(2,310,953) (274,486) 347,575 833,667 850,877 7,640,980 7,635,499 13,557,662 14,513,519
(Decrease) Increase in Other Payables 4,033,565 (85,551) 55,957 12,531,429 (26,411,798) (2,112,101) 8,368,190 14,858,635 15,906,215
(Increase) Decrease in Accounts Receivable
7,844,989 (4,809,241) (6,949,508) (18,250,484) 3,236,306 7,640,980 (57,905,915) (102,818,276) (110,067,284)
(Increase) in Cost and Estimated Earnings in Excess of Billings on Uncompleted Contracts
(456,104) (18,172,533) (1,880,775)
Increase in Billing on Uncompleted Contracts
1,962,119 (867,413) 827,966
Increase in Amounts Due to Related Parties
643,529 3,000,000 (867,413)
Increase in Other Receivables (725,450) (687,874) (375,701) (7,790,705) (25,665,681) (6,977,685) (12,389,641) (13,263,149)
Less: Net income attributable to Non-Controlling Interests
(191,992) (4,462,754) (5,126,047) (9,305,429) (13,779,471)
(Increase) in Construction In Progress (391,869) (1,771,686)
Common Stock issued for services 530,809 2,139,057 2,139,057
Impairment loss 293,404
Decrease (Increase) in 0ther Activities 1,755,926
Net cash provided by Operating Activities 7,029,922 2,898,303 1,427,977 7,599,894 10,291,120 17,568,027 39,535,882 76,614,760 107,975,093
Sino Agro Food, Inc March 24, 2013
CONSILIUM Global Research 25
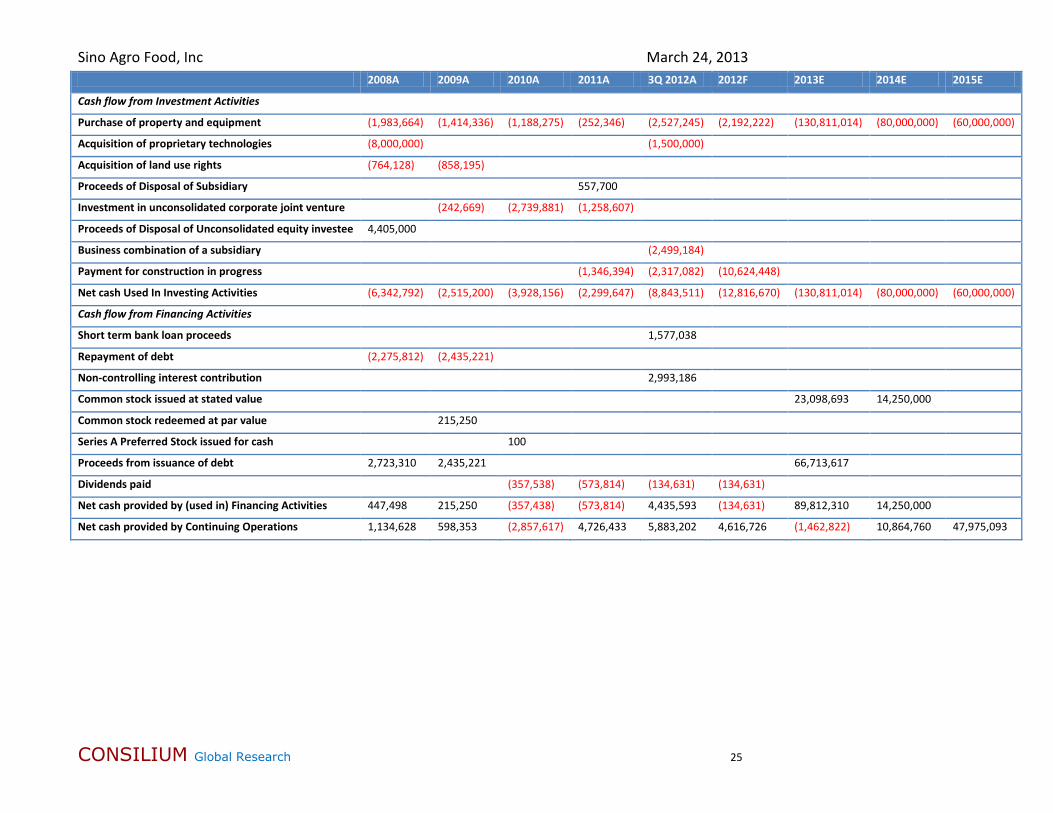
2008A 2009A 2010A 2011A 3Q 2012A 2012F 2013E 2014E 2015E
Cash flow from Investment Activities
Purchase of property and equipment (1,983,664) (1,414,336) (1,188,275) (252,346) (2,527,245) (2,192,222) (130,811,014) (80,000,000) (60,000,000)
Acquisition of proprietary technologies (8,000,000) (1,500,000)
Acquisition of land use rights (764,128) (858,195)
Proceeds of Disposal of Subsidiary 557,700
Investment in unconsolidated corporate joint venture (242,669) (2,739,881) (1,258,607)
Proceeds of Disposal of Unconsolidated equity investee 4,405,000
Business combination of a subsidiary (2,499,184)
Payment for construction in progress (1,346,394) (2,317,082) (10,624,448)
Net cash Used In Investing Activities (6,342,792) (2,515,200) (3,928,156) (2,299,647) (8,843,511) (12,816,670) (130,811,014) (80,000,000) (60,000,000)
Cash flow from Financing Activities
Short term bank loan proceeds 1,577,038
Repayment of debt (2,275,812) (2,435,221)
Non-controlling interest contribution 2,993,186
Common stock issued at stated value 23,098,693 14,250,000
Common stock redeemed at par value 215,250
Series A Preferred Stock issued for cash 100
Proceeds from issuance of debt 2,723,310 2,435,221 66,713,617
Dividends paid (357,538) (573,814) (134,631) (134,631)
Net cash provided by (used in) Financing Activities 447,498 215,250 (357,438) (573,814) 4,435,593 (134,631) 89,812,310 14,250,000
Net cash provided by Continuing Operations 1,134,628 598,353 (2,857,617) 4,726,433 5,883,202 4,616,726 (1,462,822) 10,864,760 47,975,093
Sino Agro Food, Inc March 24, 2013
CONSILIUM Global Research 26
2008A 2009A 2010A 2011A 3Q 2012A 2012F 2013E 2014E 2015E
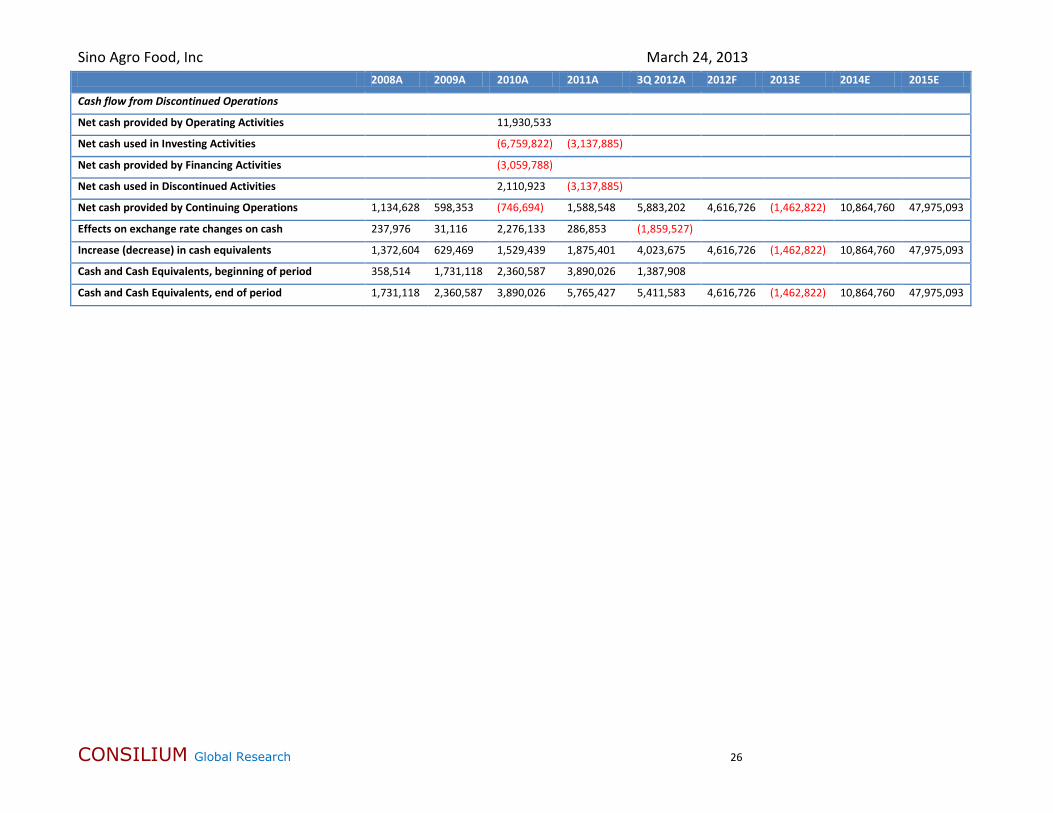
Cash flow from Discontinued Operations
Net cash provided by Operating Activities 11,930,533
Net cash used in Investing Activities (6,759,822) (3,137,885)
Net cash provided by Financing Activities (3,059,788)
Net cash used in Discontinued Activities 2,110,923 (3,137,885)
Net cash provided by Continuing Operations 1,134,628 598,353 (746,694) 1,588,548 5,883,202 4,616,726 (1,462,822) 10,864,760 47,975,093
Effects on exchange rate changes on cash 237,976 31,116 2,276,133 286,853 (1,859,527)
Increase (decrease) in cash equivalents 1,372,604 629,469 1,529,439 1,875,401 4,023,675 4,616,726 (1,462,822) 10,864,760 47,975,093
Cash and Cash Equivalents, beginning of period 358,514 1,731,118 2,360,587 3,890,026 1,387,908
Cash and Cash Equivalents, end of period 1,731,118 2,360,587 3,890,026 5,765,427 5,411,583 4,616,726 (1,462,822) 10,864,760 47,975,093
Sino Agro Food, Inc March 24, 2013
CONSILIUM Global Research 27
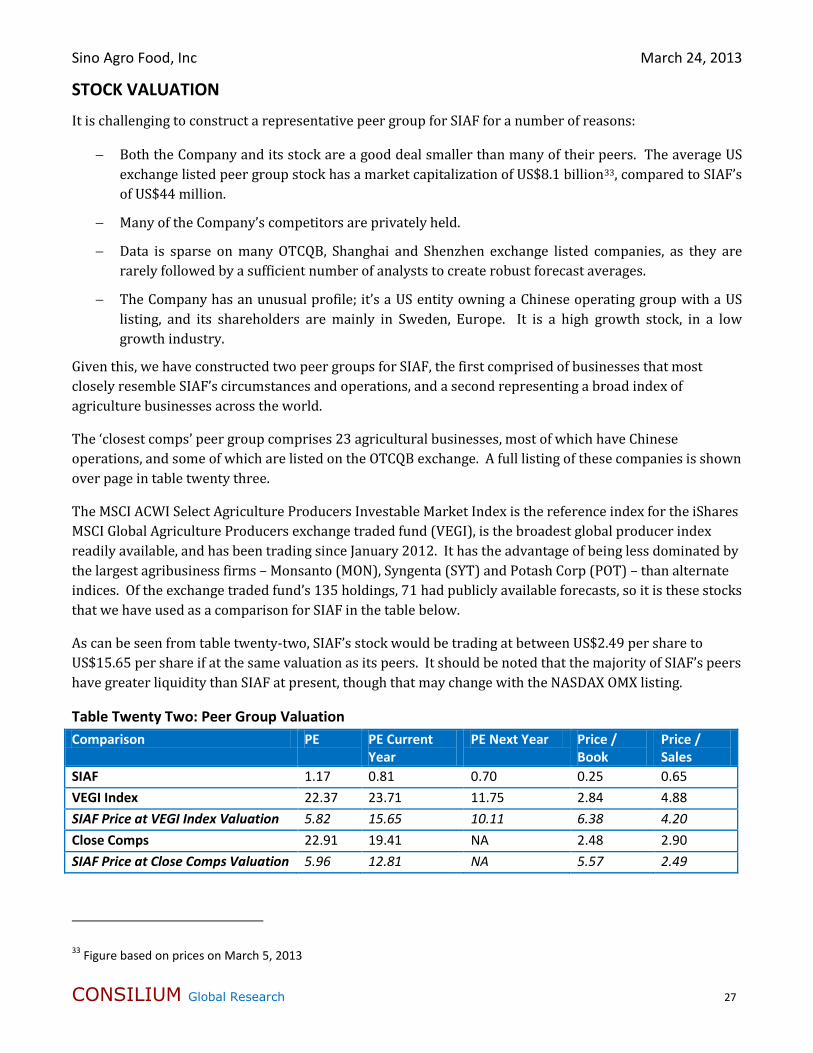
STOCK VALUATION
It is challenging to construct a representative peer group for SIAF for a number of reasons:
� Both the Company and its stock are a good deal smaller than many of their peers. The average US exchange listed peer group stock has a market capitalization of US$8.1 billion33, compared to SIAF’s of US$44 million.
� Many of the Company’s competitors are privately held.
� Data is sparse on many OTCQB, Shanghai and Shenzhen exchange listed companies, as they are rarely followed by a sufficient number of analysts to create robust forecast averages.
� The Company has an unusual profile; it’s a US entity owning a Chinese operating group with a US listing, and its shareholders are mainly in Sweden, Europe. It is a high growth stock, in a low growth industry.
Given this, we have constructed two peer groups for SIAF, the first comprised of businesses that most closely resemble SIAF’s circumstances and operations, and a second representing a broad index of agriculture businesses across the world.
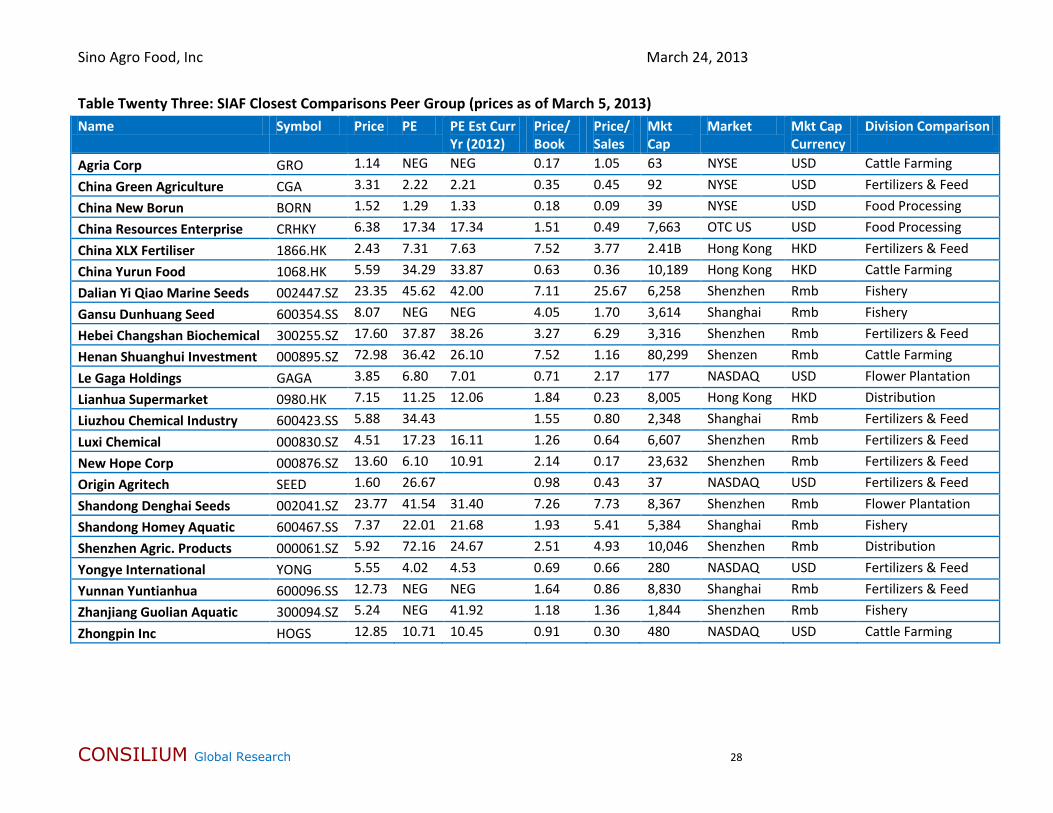
The ‘closest comps’ peer group comprises 23 agricultural businesses, most of which have Chinese operations, and some of which are listed on the OTCQB exchange. A full listing of these companies is shown over page in table twenty three.
The MSCI ACWI Select Agriculture Producers Investable Market Index is the reference index for the iShares MSCI Global Agriculture Producers exchange traded fund (VEGI), is the broadest global producer index readily available, and has been trading since January 2012. It has the advantage of being less dominated by the largest agribusiness firms – Monsanto (MON), Syngenta (SYT) and Potash Corp (POT) – than alternate indices. Of the exchange traded fund’s 135 holdings, 71 had publicly available forecasts, so it is these stocks that we have used as a comparison for SIAF in the table below.
As can be seen from table twenty-two, SIAF’s stock would be trading at between US$2.49 per share to US$15.65 per share if at the same valuation as its peers. It should be noted that the majority of SIAF’s peers have greater liquidity than SIAF at present, though that may change with the NASDAX OMX listing.
Table Twenty Two: Peer Group Valuation Comparison PE PE Current
Year PE Next Year Price /
Book Price / Sales
SIAF 1.17 0.81 0.70 0.25 0.65 VEGI Index 22.37 23.71 11.75 2.84 4.88 SIAF Price at VEGI Index Valuation 5.82 15.65 10.11 6.38 4.20 Close Comps 22.91 19.41 NA 2.48 2.90 SIAF Price at Close Comps Valuation 5.96 12.81 NA 5.57 2.49
33 Figure based on prices on March 5, 2013
Sino Agro Food, Inc March 24, 2013
CONSILIUM Global Research 28
Table Twenty Three: SIAF Closest Comparisons Peer Group (prices as of March 5, 2013) Name Symbol Price PE PE Est Curr
Yr (2012) Price/ Book
Price/Sales
Mkt Cap
Market Mkt Cap Currency
Division Comparison
Agria Corp GRO 1.14 NEG NEG 0.17 1.05 63 NYSE USD Cattle Farming
China Green Agriculture CGA 3.31 2.22 2.21 0.35 0.45 92 NYSE USD Fertilizers & Feed China New Borun BORN 1.52 1.29 1.33 0.18 0.09 39 NYSE USD Food Processing China Resources Enterprise CRHKY 6.38 17.34 17.34 1.51 0.49 7,663 OTC US USD Food Processing
China XLX Fertiliser 1866.HK 2.43 7.31 7.63 7.52 3.77 2.41B Hong Kong HKD Fertilizers & Feed China Yurun Food 1068.HK 5.59 34.29 33.87 0.63 0.36 10,189 Hong Kong HKD Cattle Farming Dalian Yi Qiao Marine Seeds 002447.SZ 23.35 45.62 42.00 7.11 25.67 6,258 Shenzhen Rmb Fishery
Gansu Dunhuang Seed 600354.SS 8.07 NEG NEG 4.05 1.70 3,614 Shanghai Rmb Fishery Hebei Changshan Biochemical 300255.SZ 17.60 37.87 38.26 3.27 6.29 3,316 Shenzhen Rmb Fertilizers & Feed Henan Shuanghui Investment 000895.SZ 72.98 36.42 26.10 7.52 1.16 80,299 Shenzen Rmb Cattle Farming
Le Gaga Holdings GAGA 3.85 6.80 7.01 0.71 2.17 177 NASDAQ USD Flower Plantation Lianhua Supermarket 0980.HK 7.15 11.25 12.06 1.84 0.23 8,005 Hong Kong HKD Distribution Liuzhou Chemical Industry 600423.SS 5.88 34.43 1.55 0.80 2,348 Shanghai Rmb Fertilizers & Feed
Luxi Chemical 000830.SZ 4.51 17.23 16.11 1.26 0.64 6,607 Shenzhen Rmb Fertilizers & Feed New Hope Corp 000876.SZ 13.60 6.10 10.91 2.14 0.17 23,632 Shenzhen Rmb Fertilizers & Feed Origin Agritech SEED 1.60 26.67 0.98 0.43 37 NASDAQ USD Fertilizers & Feed
Shandong Denghai Seeds 002041.SZ 23.77 41.54 31.40 7.26 7.73 8,367 Shenzhen Rmb Flower Plantation Shandong Homey Aquatic 600467.SS 7.37 22.01 21.68 1.93 5.41 5,384 Shanghai Rmb Fishery Shenzhen Agric. Products 000061.SZ 5.92 72.16 24.67 2.51 4.93 10,046 Shenzhen Rmb Distribution
Yongye International YONG 5.55 4.02 4.53 0.69 0.66 280 NASDAQ USD Fertilizers & Feed Yunnan Yuntianhua 600096.SS 12.73 NEG NEG 1.64 0.86 8,830 Shanghai Rmb Fertilizers & Feed Zhanjiang Guolian Aquatic 300094.SZ 5.24 NEG 41.92 1.18 1.36 1,844 Shenzhen Rmb Fishery
Zhongpin Inc HOGS 12.85 10.71 10.45 0.91 0.30 480 NASDAQ USD Cattle Farming
Sino Agro Food, Inc March 24, 2013
CONSILIUM Global Research 29
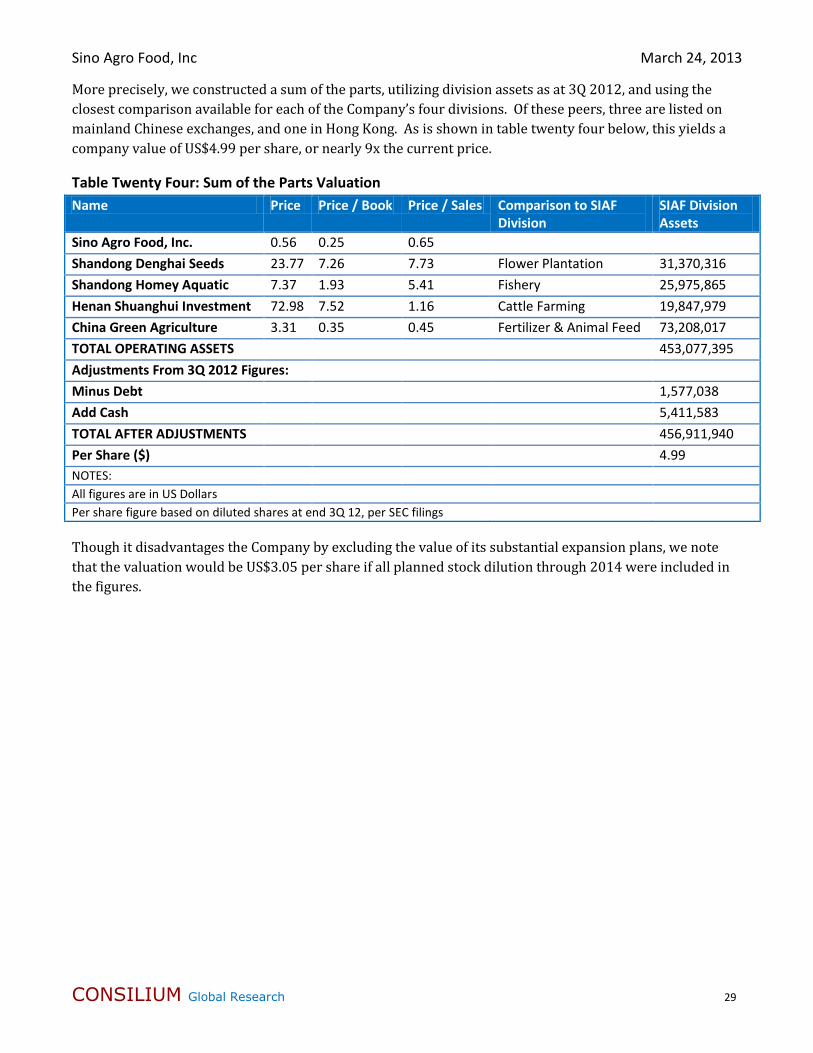
More precisely, we constructed a sum of the parts, utilizing division assets as at 3Q 2012, and using the closest comparison available for each of the Company’s four divisions. Of these peers, three are listed on mainland Chinese exchanges, and one in Hong Kong. As is shown in table twenty four below, this yields a company value of US$4.99 per share, or nearly 9x the current price.
Table Twenty Four: Sum of the Parts Valuation Name Price Price / Book Price / Sales Comparison to SIAF
Division SIAF Division Assets
Sino Agro Food, Inc. 0.56 0.25 0.65 Shandong Denghai Seeds 23.77 7.26 7.73 Flower Plantation 31,370,316 Shandong Homey Aquatic 7.37 1.93 5.41 Fishery 25,975,865 Henan Shuanghui Investment 72.98 7.52 1.16 Cattle Farming 19,847,979 China Green Agriculture 3.31 0.35 0.45 Fertilizer & Animal Feed 73,208,017 TOTAL OPERATING ASSETS 453,077,395 Adjustments From 3Q 2012 Figures: Minus Debt 1,577,038 Add Cash 5,411,583 TOTAL AFTER ADJUSTMENTS 456,911,940 Per Share ($) 4.99 NOTES: All figures are in US Dollars Per share figure based on diluted shares at end 3Q 12, per SEC filings
Though it disadvantages the Company by excluding the value of its substantial expansion plans, we note that the valuation would be US$3.05 per share if all planned stock dilution through 2014 were included in the figures.
Sino Agro Food, Inc March 24, 2013
CONSILIUM Global Research 30
DISCLOSURES AND RISKS
Consilium Global Research (CGR) is an independent research organization. The content of this report has been compiled primarily from information available to the public released by the Company. The Company is solely responsible for the accuracy of that information We do not recommend or solicit an investment in any particular stock or other security. We have prepared our research based upon information and sources considered to be reliable. We are compensated by a third party. We may distribute our research through other organizations or companies. In some instances, we may be compensated by the third party in stock in the Company. Additionally, we may perform consulting or advisory services for Companies that we produce research for. The opinions expressed in this report are the true opinions of the analyst about this company and industry. Any “forward looking statements and forecasts” are CGR’s best estimates and opinions based upon information that is publicly available and that we believe to be correct, but we have not independently verified with respect to truth or correctness. There is no guarantee that our forecasts will materialize. Actual results will likely vary. THIS REPORT IS PUBLISHED SOLELY FOR INFORMATIONAL PURPOSES AND IS NOT TO BE CONSTRUED AS AN OFFER TO SELL OR THE SOLICITATION OF AN OFFER TO BUY ANY SECURITY IN ANY STATE OR PROVINCE. PAST PERFORMANCE DOES NOT GUARANTEE FUTURE RESULTS. DO NOT MAKE ANY INVESTMENT DECISIONS BASED UPON THIS REPORT. ALWAYS CONSULT WITH YOUR FINANCIAL ADVISOR BEFORE MAKING ANY INVESTMENT DECISIONS. The information contained in this report is intended to be viewed only in jurisdictions where it may be legally viewed and is not intended for use by any person or entity in any jurisdiction where such use would be contrary to local regulations or which would require any registration requirement within such jurisdiction. All prices are as of March 25, 2013 except where noted
To Request a Meeting with Sino Agro Food, Inc. Follow the Link Below: http://consiliumglobalresearch.com/Contact_Us.html