Embed Size (px)
Citation preview
Int. Journal of Economics and Management 11 (S3) : 969 – 990 (2017)
IJEMInternational Journal of Economics and Management
Journal homepage: http://www.econ.upm.edu.my/ijem
969
*Corresponding author: [email protected]
IDA SURIYA ISMAILa, MOHD RIZAL PALILb*, ROSIATI RAMLIb, MARA RIDHUAN CHE ABDUL RAHMANb AND
NUR ASHIKIN MOHD SAATc
aFaculty of Accounting, Universiti Teknologi MARA Segamat, Malaysia.bFaculty of Economics and Management, Universiti Kebangsaan Malaysia,
Malaysia.cFaculti of Economics and Management, Universiti Putra Malaysia, Malaysia.
ABSTRACT
The aim of this paper is to analyze company dividend payouts from two observation periods; during transitional period of STT (2008-2013) and after the compulsory effects of STT (2014-2015). Therefore, three research questions need to be tested. Firstly, whether a company pays higher dividend during transitional period compared to before transitional period. Secondly, whether a company pays higher dividend after the compulsory effects of STT compared to before compulsory effects of STT. Lastly, is there any significant difference between top, moderate and low performance companies in their pattern of dividend payouts. Based on a sample of 1,824 observations, it was found that dividend payouts were differently governed between the two periods. Initially, during the transitional period, results were consistent with clientele theory when it was found that there was significantly increase in dividend payouts specifically regular dividend. However, after the compulsory effects of STT, companies reduced their dividend payouts but the difference was insignificant. This study also found that there is significant difference between top, moderate and low performance companies in their pattern of dividend payouts in which top companies had constantly higher dividend payouts than moderate and low companies.
Keywords: Single Tier Tax System, Dividend Exemption, Dividend Payouts, Tax Reform, Malaysia
JEL Classification: H24, E62
Single Tier Tax System: Analysis of Company Dividend Payouts
International Journal of Economics and Management
970
INTRODUCTION
Changes in dividend tax laws contribute a significant opportunities to study on company’s response towards dividend tax laws by examining dividend payouts behavior. Previous studies such as Chetty & Saez (2005), Seppo, Karikallio & Pirttilä (2008), Pattenden & Twite (2008), Wang & Guo (2011) and Deslandes, Landry & Fortin (2015) have shown that company increased their dividend payouts after major dividend tax reform occurred. It is expected that company would respond towards dividend tax reform by paying higher dividend when the reform favor their shareholders’ interest (Deslandes et al., 2015). It is in line with clientele theory, when shareholders would invest in the company based on dividend payouts policy that aligns with their tax and liquidity preferences.
Conversely, there is an arguable issue highlighted by previous studies when they found dividend tax reform was not the main factor that induces the company to increase their dividend payouts. For example Edgerton (2013), stated four facts that 2003 dividend tax reform in United States was not the main reasons for the companies to increase their dividend payout. According to Edgerton (2013), even if there is no dividend tax reform, the companies still increase the aggregate dividend payouts. Similarly, Brav, Graham, Harvey and Michaely (2008) also found that 2003 dividend tax reform in United States had insignificant effect on company decision to increase dividend payouts.
Due to inconclusive evidences discuss above, this study is motivated to further examine on Malaysian company dividend payouts by exploiting the changes of dividend tax laws from full imputation system to single tier tax system (STT). Unique features appeared during the changes in Malaysian dividend tax laws such as abolishment of Section 108 Frank Accounts within six years transitional period make this study different from other studies. Section 108 Frank Account is prepared by the company to record any deductions of tax from dividend paid, credited or distributed by the company to their shareholders. This Section 108 Frank Account is important to show whether the company is paying frank dividend or unfrank dividend since frank dividend would entitle the shareholders to get tax refund but not for unfrank dividend.
Specifically, this paper analyzes company dividend payouts from two observation periods. The periods are during the transitional period of STT and after the compulsory effects of STT. Using the two observation periods, this study attempts to answer three research questions. Firstly, this study examines whether a company pays higher dividend during transitional period (2008-2013) compared to before transitional period (2002-2007). Secondly, this study further explores whether a company pays higher dividend after the compulsory effects of STT (2014-2015) than before compulsory effects of STT (2012-2013). Lastly, this study examines whether there is any significant difference between three categories of company (top, moderate and low performance) in terms of their dividend payouts during transitional period of STT and after the compulsory effects of STT.
Based on a sample of 1,824 firms-year observations from 2002 until 2015, it was found that dividend payouts were differently governed between the two observation periods; during transitional period and after the compulsory effects of STT. Initially, during the transitional period, results were consistent with clientele theory when it was found that there was significant increase in terms of dividend payouts. To be specific, it was found that regular dividend
Single Tier Tax System: Analysis of Company Dividend Payouts
971
significantly increased during transitional period. However, the results suggested that there is no significant difference of dividend payouts once the compulsory effects of STT took place. Not only that, the number of observations for companies that pay dividends also reduced in the year of 2014 and 2015.
On top of that, this study also found that top performance company has significant and higher dividend payouts in both regular dividend and special dividend during transitional period as compared to before transitional period. It might be due to company try to fully utilize their section 108 frank dividend accounts by issuing higher dividend payouts. It is expected that this type of company still have substantial balance of section 108 in which need to be abolish after the transitional period ends. On the other hand, company that has insufficient balance of section 108 but retain distributable profit also tend to pay higher dividend since STT did not require frank dividend.
This study focuses on Malaysian dividend tax laws due to several reasons. Firstly, the change of dividend tax laws in Malaysia from full imputation system to STT is not the same as in developed countries like in United States, 2003 tax reform. Even though both tax reforms are related to dividend taxes but the United States reduced their dividend tax rate while Malaysia abolished dividend tax credits. Secondly, Malaysian companies are prohibited to implement off-market share repurchase transactions while other countries such as United States, Australia and Finland are allowed to carry out such transactions as a complement or substitute of dividend payouts. In addition, different characteristics particularly on self-assessment system, no tax charged on capital gain of shares and dissimilar underpinning legislation also lead this study to further analyze the unique characteristics of Malaysian dividend tax laws. Lastly, crisis in Malaysian financial market that started from the year of 2008 where the 6 years transitional period began, also motivated this study to examine the pattern of dividend payments among public listed companies. It is supported by Liew, Lim & Goh (2016), when they found an indicator of Malaysian stock liquidity crisis that began in 2008 due to the bankruptcy of Lehman Brothers and until 2014, there is no evidence to show that it has improved.
The remainder of the paper is structured as follows. Section 2 reviews the literature on dividend tax reform and dividend payouts. Section 3 then outlines the sample description and data collection. Section 4 discusses the results of this study through descriptive statistics, analysis on company characteristics related to types of dividend and test of significant different using t-test, MANOVA and ANOVA analysis. The final section contains the discussion and conclusion of this study.
LITERATURE REVIEW
Dividend tax reform and dividend payouts
Tax Reform is defined for example by Rao (2014) as a process of when it “can reduce tax evasion and avoidance, and allow for more efficient and fair tax collection that can finance public goods and services. It can make revenue levels more sustainable, and can promote future independence from foreign aid and natural resource revenues.” Based on this definition,
International Journal of Economics and Management
972
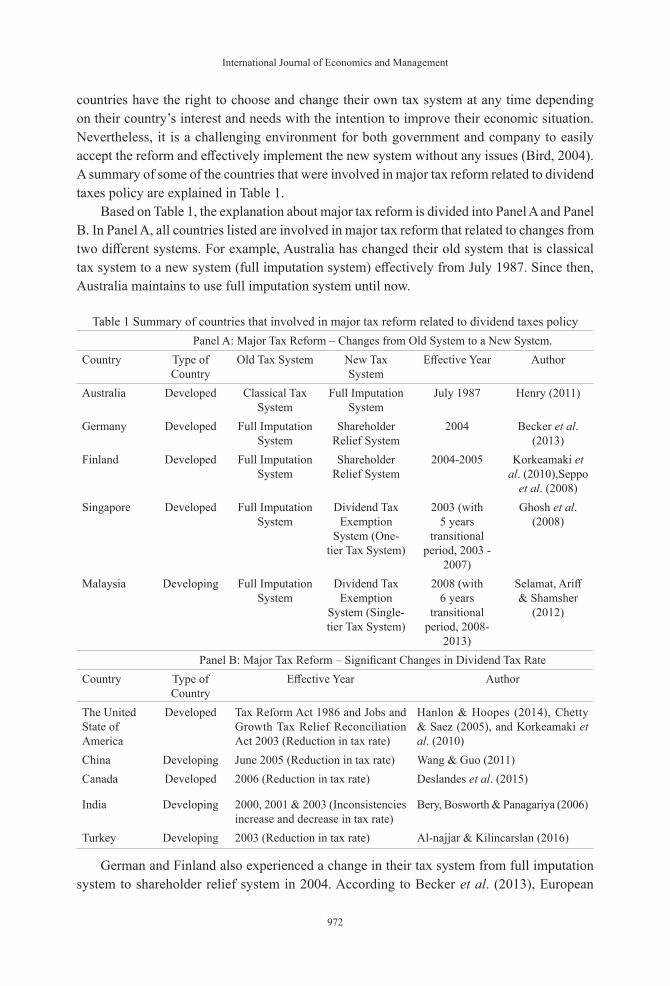
countries have the right to choose and change their own tax system at any time depending on their country’s interest and needs with the intention to improve their economic situation. Nevertheless, it is a challenging environment for both government and company to easily accept the reform and effectively implement the new system without any issues (Bird, 2004). A summary of some of the countries that were involved in major tax reform related to dividend taxes policy are explained in Table 1.
Based on Table 1, the explanation about major tax reform is divided into Panel A and Panel B. In Panel A, all countries listed are involved in major tax reform that related to changes from two different systems. For example, Australia has changed their old system that is classical tax system to a new system (full imputation system) effectively from July 1987. Since then, Australia maintains to use full imputation system until now.
Table 1 Summary of countries that involved in major tax reform related to dividend taxes policyPanel A: Major Tax Reform – Changes from Old System to a New System.
Country Type of Country
Old Tax System New Tax System
Effective Year Author
Australia Developed Classical Tax System
Full Imputation System
July 1987 Henry (2011)
Germany Developed Full Imputation System
Shareholder Relief System
2004 Becker et al. (2013)
Finland Developed Full Imputation System
Shareholder Relief System
2004-2005 Korkeamaki et al. (2010),Seppo
et al. (2008) Singapore Developed Full Imputation
SystemDividend Tax
Exemption System (One-
tier Tax System)
2003 (with 5 years
transitional period, 2003 -
2007)
Ghosh et al. (2008)
Malaysia Developing Full Imputation System
Dividend Tax Exemption
System (Single-tier Tax System)
2008 (with 6 years
transitional period, 2008-
2013)
Selamat, Ariff & Shamsher
(2012)
Panel B: Major Tax Reform – Significant Changes in Dividend Tax RateCountry Type of
CountryEffective Year Author
The United State of America
Developed Tax Reform Act 1986 and Jobs and Growth Tax Relief Reconciliation Act 2003 (Reduction in tax rate)
Hanlon & Hoopes (2014), Chetty & Saez (2005), and Korkeamaki et al. (2010)
China Developing June 2005 (Reduction in tax rate) Wang & Guo (2011)Canada Developed 2006 (Reduction in tax rate) Deslandes et al. (2015)
India Developing 2000, 2001 & 2003 (Inconsistencies increase and decrease in tax rate)
Bery, Bosworth & Panagariya (2006)
Turkey Developing 2003 (Reduction in tax rate) Al-najjar & Kilincarslan (2016)
German and Finland also experienced a change in their tax system from full imputation system to shareholder relief system in 2004. According to Becker et al. (2013), European
Single Tier Tax System: Analysis of Company Dividend Payouts
973
countries like German and Finland changed their dividend tax policy to align with the requirements of European tax laws. Both Singapore and Malaysia reformed their dividend tax system from full imputation system to dividend exemption system in 2003 and 2008 respectively. However, for both countries they implemented 5 and 6 years transitional period for the purpose of smoothing the exchange process.
On the other hand, Panel B of Table 1 shows a list of selected countries that were involved in major tax reform that were related to significant changes in dividend tax rate. For example, the United States of America has experienced twice significant reduction in dividend tax rate following the Tax Reform Act 1986 and Jobs and Growth Tax Relief Reconciliation Act 2003. Both events attracted the interest of the researchers such as Hanlon & Hoopes (2014), Korkeamaki Liljeblom & Pasternack (2010), Brown et al. (2007), Chetty & Saez (2005), and Poterba (2004) to study the impact of the tax changes towards companies dividend payouts.
In June 2005, China also announced a significant reduction in their individual dividend tax rate from 20 per cent to 10 per cent. A significant reduction in dividend tax rate also happened in Canada effectively in the year 2006 when the government reduced the rate by more than 5 per cent. In India, dividend tax rates were inconsistent, increasing and decreasing for the year 2000, 2001 and 2003 as announced by the Indian government in order to stabilize their economic situation. Lastly, Turkey also experienced a major tax reform in 2003 including the treatment of dividend income that affected company dividend payouts (Al-najjar & Kilincarslan, 2016).
Dividend tax reform are rarely happened, therefore, it becomes an opportunity for the researchers to examine the influence of taxes on company dividend payouts behavior (Baker, 2009) when the reform occurred. This can be seen through many studies have been done when there is major changes in dividend tax reform occurred. For example, when the Jobs and Growth Tax Relief Reconciliation Act of 2003 happened in the United States, many researchers used this tax reform as an opportunity to study on the effects of tax reform towards dividend policy. It started with Chetty and Seaz (2005) when they found that there was significant increased about 20 percent in dividends payout after the 2003 dividend tax cut.
Subsequently, it was followed by Brav et al. (2008), when they did a survey on how 2003 dividend tax cut influenced by company and shareholder. Unlike Chetty & Saez (2005), Brav et al. (2008) found that the reduction in tax rate was less important in determining company dividend payouts. According to the respondents, future cash flows, cash holdings and historic level of dividends were important determinant of payout policy. Recently, Jacob, Michaely & Alstadsæter (2015) also found that 2003 dividend tax cut has a large impact on company dividend payouts if company has less than four owners.
Finland also experienced major changes in their tax laws through Finnish Corporate and Capital Income Tax Reform 2005. Seppo et al. (2008) used this tax reform to examine the impacts of dividend tax changes on dividend distributions and investments. They found that firms that anticipated higher tax on dividend distributions increased their dividends payout even before the tax reform.
In developing countries like China, the dividend tax reform happened in 2005 when the government declared a reduction in individual investors’ dividend income from 20 percent to 10 percent. Therefore, Wang and Guo (2011) examined whether the reduction in dividend tax rate would lead the firms to increase their dividends payout by carrying out a comparison
International Journal of Economics and Management
974
between two groups of companies. They found that companies with large individual shares, large investment fund shares and higher executive stock holdings were more likely to increase their dividends payout.
In summary, empirical results found that company dividend payouts eventually increased after the existence of dividend tax reform as per discussion above. Nevertheless, the evidence proves that it is still an emerging issue especially for developing countries. It is expected that empirical findings from the perspective of a developing country such as Malaysia would be beneficial in discussing these issues. Therefore, this study attempts to answer the question of what is the trend of company dividend payouts during transitional period of STT and after the compulsory effects of STT. A significant growth of company dividend payouts between those two periods is anticipated to happen.
Background of Malaysian dividend tax reform
In Malaysia, significant changes in dividend taxes begin in 2008. Prior to 1 January 2008, Malaysia adopted full imputation systems that require the imposition of tax both on the profit at corporate level and shareholders level. The principle behind the imputation system is to overcome the double taxation of income. Under the imputation system, companies resident in Malaysia are required to deduct tax at source at the prevailing corporate tax rate on dividends paid to their shareholders. The same income would be taxed twice if the credit were not imputed to the shareholders. Part of company’s responsibilities under imputation system are to declare dividend income under section 4 (c), maintain section 108 dividend frank accounts and set-off for any amount previously tax deducted from dividend income received by company under section 110 of Income Tax Act (ITA) 1967. Those responsibilities will be eliminated when the STT are compulsory implemented.
The STT was introduced in Budget 2008 to replace the imputation system with effect from year of assessment 2008. Under STT, corporate income is taxed at corporate level and this is a final tax. Companies may declare single tier exempt dividend that would be exempt from tax in the hands of their shareholders. In order to avoid difficulties and minimize the burden of companies to comply to the new tax system, the Malaysian government introduced a six year transitional period from the year of 2008 until 2013. During this six year transitional period, it is not compulsory for the company to follow STT. Companies can choose to maintain the old system using full imputation system or fully apply the new system. However, once the company decides to apply STT, they are not allowed to revert to the old system.
The impact of changes in dividend tax laws towards public companies might create a challenging environment to them. Especially when the companies need to decide on their dividend payouts policy during the transitional period. The firms need to abolish their Section 108 of tax credit balance that a firm can pay their dividend from under the imputation tax system. Many companies still had substantial Section 108 balances when the Malaysian government announced these changes. The companies had the option whether to fully utilize their Section 108 of tax credit by issuing special dividends or to just continue with the new system.
Single Tier Tax System: Analysis of Company Dividend Payouts
975
METHODOLOGY
Sample description and data collection
In consideration of this paper as a preliminary study, only part of samples collected would be tested in the analysis process. Initially, all companies listed in Bursa Malaysia for both Main and Ace Market contributed to the population of this study. This study used Datastream Professional by Thomson Reuters to collect information regarding the type of industry and number of companies listed under Bursa Malaysia. This study excluded the finance, banking and REit industries since they are subject to different regulations and accounting methods in their preparation of financial statements. Other than that, this study also excluded industries that consists of less than five listed companies since the number of companies were too small such as the hotel industry. Finally, 7 industries were selected that include properties, construction, industrial products, technology, consumer products and trading and services. Total number of companies for the whole industry was 760 companies. However, 37 companies had incomplete information that makes the total of available listed companies only 723 companies. In terms of statistical suggestions, if the number of population is 723 companies, the sample size should not less than 186 companies. Therefore, this study decided to select 254 companies as a sample.
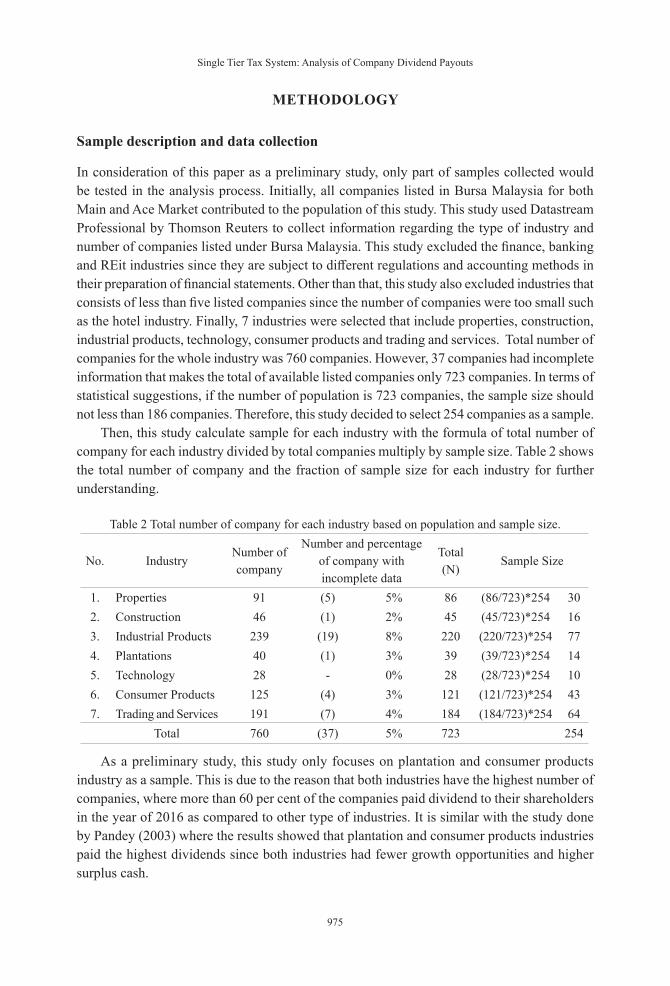
Then, this study calculate sample for each industry with the formula of total number of company for each industry divided by total companies multiply by sample size. Table 2 shows the total number of company and the fraction of sample size for each industry for further understanding.
Table 2 Total number of company for each industry based on population and sample size.
No. IndustryNumber of company
Number and percentage of company with incomplete data
Total (N)
Sample Size
1. Properties 91 (5) 5% 86 (86/723)*254 302. Construction 46 (1) 2% 45 (45/723)*254 163. Industrial Products 239 (19) 8% 220 (220/723)*254 774. Plantations 40 (1) 3% 39 (39/723)*254 145. Technology 28 - 0% 28 (28/723)*254 106. Consumer Products 125 (4) 3% 121 (121/723)*254 437. Trading and Services 191 (7) 4% 184 (184/723)*254 64
Total 760 (37) 5% 723 254
As a preliminary study, this study only focuses on plantation and consumer products industry as a sample. This is due to the reason that both industries have the highest number of companies, where more than 60 per cent of the companies paid dividend to their shareholders in the year of 2016 as compared to other type of industries. It is similar with the study done by Pandey (2003) where the results showed that plantation and consumer products industries paid the highest dividends since both industries had fewer growth opportunities and higher surplus cash.
International Journal of Economics and Management
976
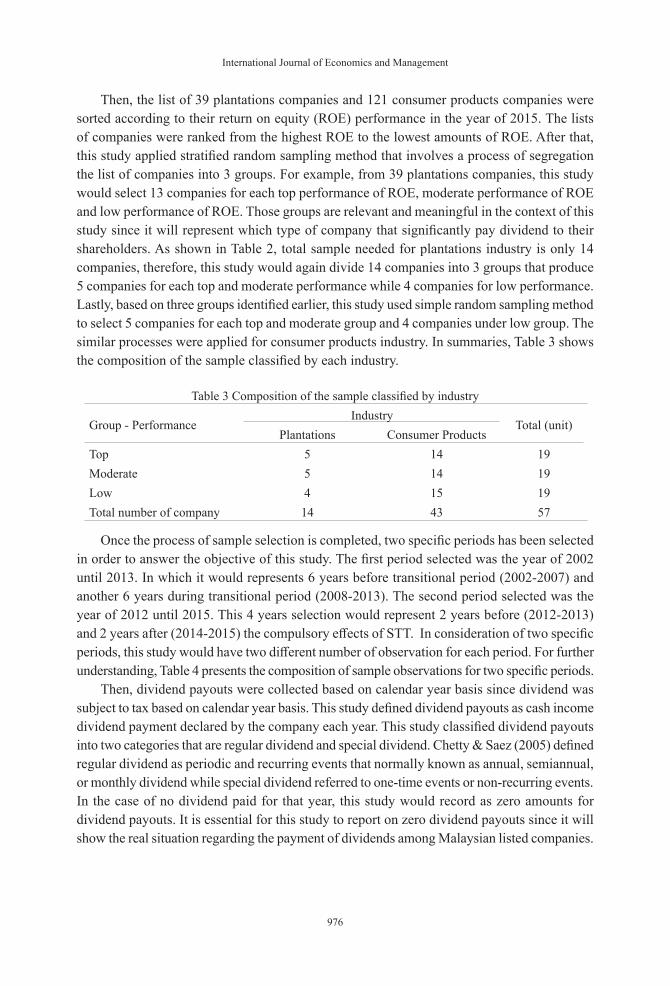
Then, the list of 39 plantations companies and 121 consumer products companies were sorted according to their return on equity (ROE) performance in the year of 2015. The lists of companies were ranked from the highest ROE to the lowest amounts of ROE. After that, this study applied stratified random sampling method that involves a process of segregation the list of companies into 3 groups. For example, from 39 plantations companies, this study would select 13 companies for each top performance of ROE, moderate performance of ROE and low performance of ROE. Those groups are relevant and meaningful in the context of this study since it will represent which type of company that significantly pay dividend to their shareholders. As shown in Table 2, total sample needed for plantations industry is only 14 companies, therefore, this study would again divide 14 companies into 3 groups that produce 5 companies for each top and moderate performance while 4 companies for low performance. Lastly, based on three groups identified earlier, this study used simple random sampling method to select 5 companies for each top and moderate group and 4 companies under low group. The similar processes were applied for consumer products industry. In summaries, Table 3 shows the composition of the sample classified by each industry.
Table 3 Composition of the sample classified by industry
Group - PerformanceIndustry
Total (unit)Plantations Consumer Products
Top 5 14 19Moderate 5 14 19Low 4 15 19Total number of company 14 43 57
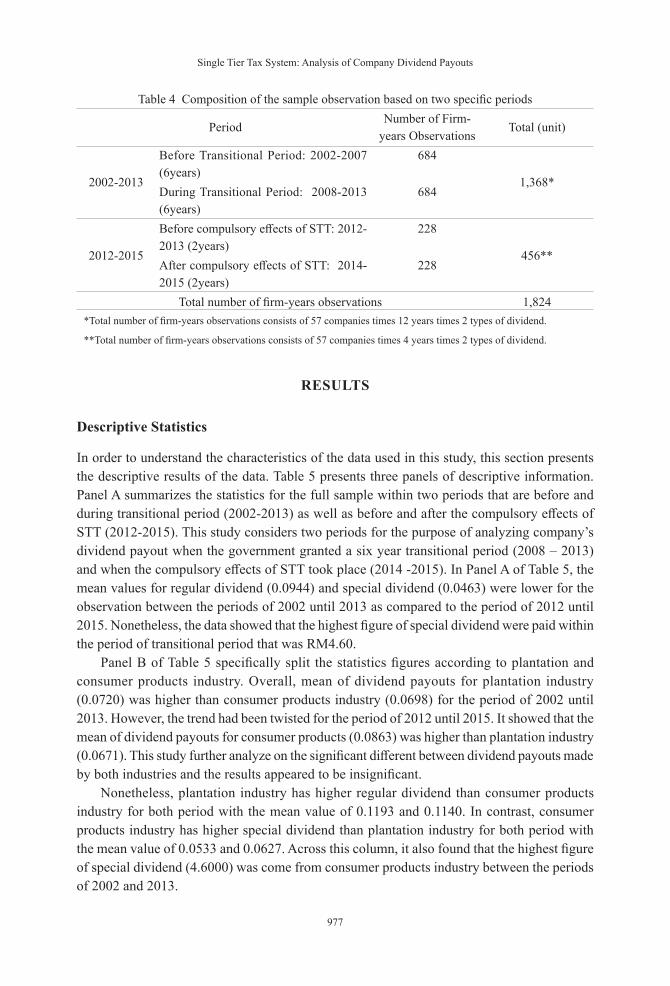
Once the process of sample selection is completed, two specific periods has been selected in order to answer the objective of this study. The first period selected was the year of 2002 until 2013. In which it would represents 6 years before transitional period (2002-2007) and another 6 years during transitional period (2008-2013). The second period selected was the year of 2012 until 2015. This 4 years selection would represent 2 years before (2012-2013) and 2 years after (2014-2015) the compulsory effects of STT. In consideration of two specific periods, this study would have two different number of observation for each period. For further understanding, Table 4 presents the composition of sample observations for two specific periods.
Then, dividend payouts were collected based on calendar year basis since dividend was subject to tax based on calendar year basis. This study defined dividend payouts as cash income dividend payment declared by the company each year. This study classified dividend payouts into two categories that are regular dividend and special dividend. Chetty & Saez (2005) defined regular dividend as periodic and recurring events that normally known as annual, semiannual, or monthly dividend while special dividend referred to one-time events or non-recurring events. In the case of no dividend paid for that year, this study would record as zero amounts for dividend payouts. It is essential for this study to report on zero dividend payouts since it will show the real situation regarding the payment of dividends among Malaysian listed companies.
Single Tier Tax System: Analysis of Company Dividend Payouts
977
Table 4 Composition of the sample observation based on two specific periods
PeriodNumber of Firm-
years ObservationsTotal (unit)
2002-2013
Before Transitional Period: 2002-2007 (6years)
684
1,368*During Transitional Period: 2008-2013 (6years)
684
2012-2015
Before compulsory effects of STT: 2012-2013 (2years)
228
456**After compulsory effects of STT: 2014-2015 (2years)
228
Total number of firm-years observations 1,824*Total number of firm-years observations consists of 57 companies times 12 years times 2 types of dividend.
**Total number of firm-years observations consists of 57 companies times 4 years times 2 types of dividend.
RESULTS
Descriptive Statistics
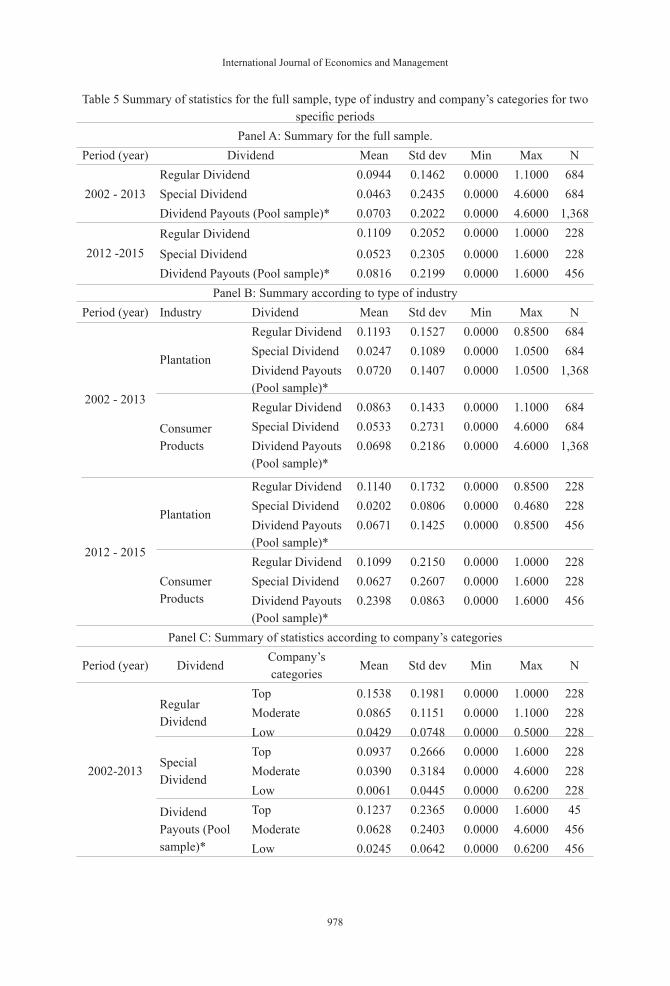
In order to understand the characteristics of the data used in this study, this section presents the descriptive results of the data. Table 5 presents three panels of descriptive information. Panel A summarizes the statistics for the full sample within two periods that are before and during transitional period (2002-2013) as well as before and after the compulsory effects of STT (2012-2015). This study considers two periods for the purpose of analyzing company’s dividend payout when the government granted a six year transitional period (2008 – 2013) and when the compulsory effects of STT took place (2014 -2015). In Panel A of Table 5, the mean values for regular dividend (0.0944) and special dividend (0.0463) were lower for the observation between the periods of 2002 until 2013 as compared to the period of 2012 until 2015. Nonetheless, the data showed that the highest figure of special dividend were paid within the period of transitional period that was RM4.60.
Panel B of Table 5 specifically split the statistics figures according to plantation and consumer products industry. Overall, mean of dividend payouts for plantation industry (0.0720) was higher than consumer products industry (0.0698) for the period of 2002 until 2013. However, the trend had been twisted for the period of 2012 until 2015. It showed that the mean of dividend payouts for consumer products (0.0863) was higher than plantation industry (0.0671). This study further analyze on the significant different between dividend payouts made by both industries and the results appeared to be insignificant.
Nonetheless, plantation industry has higher regular dividend than consumer products industry for both period with the mean value of 0.1193 and 0.1140. In contrast, consumer products industry has higher special dividend than plantation industry for both period with the mean value of 0.0533 and 0.0627. Across this column, it also found that the highest figure of special dividend (4.6000) was come from consumer products industry between the periods of 2002 and 2013.
International Journal of Economics and Management
978
Table 5 Summary of statistics for the full sample, type of industry and company’s categories for two specific periods
Panel A: Summary for the full sample.Period (year) Dividend Mean Std dev Min Max N
2002 - 2013Regular Dividend 0.0944 0.1462 0.0000 1.1000 684Special Dividend 0.0463 0.2435 0.0000 4.6000 684Dividend Payouts (Pool sample)* 0.0703 0.2022 0.0000 4.6000 1,368
2012 -2015Regular Dividend 0.1109 0.2052 0.0000 1.0000 228
Special Dividend 0.0523 0.2305 0.0000 1.6000 228Dividend Payouts (Pool sample)* 0.0816 0.2199 0.0000 1.6000 456
Panel B: Summary according to type of industryPeriod (year) Industry Dividend Mean Std dev Min Max N
2002 - 2013
Plantation
Regular Dividend 0.1193 0.1527 0.0000 0.8500 684Special Dividend 0.0247 0.1089 0.0000 1.0500 684Dividend Payouts (Pool sample)*
0.0720 0.1407 0.0000 1.0500 1,368
Consumer Products
Regular Dividend 0.0863 0.1433 0.0000 1.1000 684Special Dividend 0.0533 0.2731 0.0000 4.6000 684Dividend Payouts (Pool sample)*
0.0698 0.2186 0.0000 4.6000 1,368
2012 - 2015
Plantation
Regular Dividend 0.1140 0.1732 0.0000 0.8500 228Special Dividend 0.0202 0.0806 0.0000 0.4680 228Dividend Payouts (Pool sample)*
0.0671 0.1425 0.0000 0.8500 456
Consumer Products
Regular Dividend 0.1099 0.2150 0.0000 1.0000 228Special Dividend 0.0627 0.2607 0.0000 1.6000 228Dividend Payouts (Pool sample)*
0.2398 0.0863 0.0000 1.6000 456
Panel C: Summary of statistics according to company’s categories
Period (year) DividendCompany’s categories
Mean Std dev Min Max N
2002-2013
Regular Dividend
Top 0.1538 0.1981 0.0000 1.0000 228Moderate 0.0865 0.1151 0.0000 1.1000 228Low 0.0429 0.0748 0.0000 0.5000 228
Special Dividend
Top 0.0937 0.2666 0.0000 1.6000 228Moderate 0.0390 0.3184 0.0000 4.6000 228Low 0.0061 0.0445 0.0000 0.6200 228
Dividend Payouts (Pool sample)*
Top 0.1237 0.2365 0.0000 1.6000 45Moderate 0.0628 0.2403 0.0000 4.6000 456Low 0.0245 0.0642 0.0000 0.6200 456
Single Tier Tax System: Analysis of Company Dividend Payouts
979
2012-2015
Regular Dividend
Top 0.2304 0.3034 0.0000 1.0000 76Moderate 0.0655 0.0712 0.0000 0.2500 76Low 0.0369 0.0904 0.0000 0.5000 76
Special Dividend
Top 0.1267 0.3734 0.0000 1.6000 76Moderate 0.0195 0.0874 0.0000 0.5000 76Low 0.0106 0.0724 0.0000 0.6200 76
Dividend Payouts (Pool sample)*
Top 0.1786 0.3431 0.0000 1.6000 152Moderate 0.0425 0.0827 0.0000 0.5000 152Low 0.0237 0.0827 0.0000 0.6200 152
* Dividend payouts (pool sample) are combination of regular dividend and special dividend collected in this study.
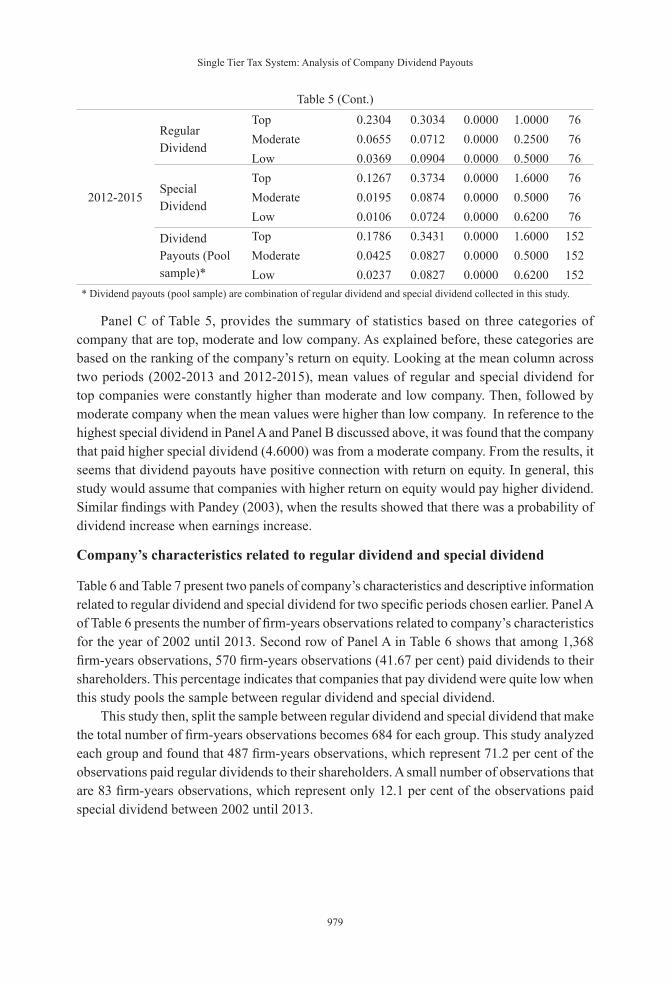
Panel C of Table 5, provides the summary of statistics based on three categories of company that are top, moderate and low company. As explained before, these categories are based on the ranking of the company’s return on equity. Looking at the mean column across two periods (2002-2013 and 2012-2015), mean values of regular and special dividend for top companies were constantly higher than moderate and low company. Then, followed by moderate company when the mean values were higher than low company. In reference to the highest special dividend in Panel A and Panel B discussed above, it was found that the company that paid higher special dividend (4.6000) was from a moderate company. From the results, it seems that dividend payouts have positive connection with return on equity. In general, this study would assume that companies with higher return on equity would pay higher dividend. Similar findings with Pandey (2003), when the results showed that there was a probability of dividend increase when earnings increase.
Company’s characteristics related to regular dividend and special dividend
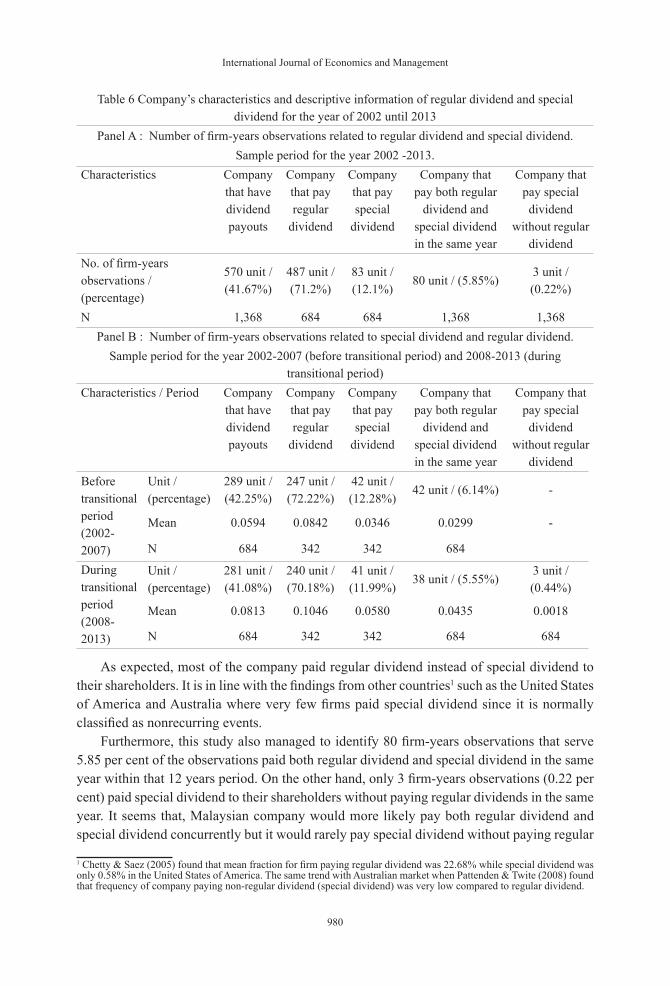
Table 6 and Table 7 present two panels of company’s characteristics and descriptive information related to regular dividend and special dividend for two specific periods chosen earlier. Panel A of Table 6 presents the number of firm-years observations related to company’s characteristics for the year of 2002 until 2013. Second row of Panel A in Table 6 shows that among 1,368 firm-years observations, 570 firm-years observations (41.67 per cent) paid dividends to their shareholders. This percentage indicates that companies that pay dividend were quite low when this study pools the sample between regular dividend and special dividend.
This study then, split the sample between regular dividend and special dividend that make the total number of firm-years observations becomes 684 for each group. This study analyzed each group and found that 487 firm-years observations, which represent 71.2 per cent of the observations paid regular dividends to their shareholders. A small number of observations that are 83 firm-years observations, which represent only 12.1 per cent of the observations paid special dividend between 2002 until 2013.
Table 5 (Cont.)
International Journal of Economics and Management
980
Table 6 Company’s characteristics and descriptive information of regular dividend and special dividend for the year of 2002 until 2013
Panel A : Number of firm-years observations related to regular dividend and special dividend.Sample period for the year 2002 -2013.
Characteristics Company that have dividend payouts
Company that pay regular
dividend
Company that pay special
dividend
Company that pay both regular
dividend and special dividend in the same year
Company that pay special dividend
without regular dividend
No. of firm-years observations / (percentage)
570 unit / (41.67%)
487 unit / (71.2%)
83 unit / (12.1%)
80 unit / (5.85%)3 unit / (0.22%)
N 1,368 684 684 1,368 1,368Panel B : Number of firm-years observations related to special dividend and regular dividend.
Sample period for the year 2002-2007 (before transitional period) and 2008-2013 (during transitional period)
Characteristics / Period Company that have dividend payouts
Company that pay regular
dividend
Company that pay special
dividend
Company that pay both regular
dividend and special dividend in the same year
Company that pay special dividend
without regular dividend
Before transitional period (2002-2007)
Unit / (percentage)
289 unit / (42.25%)
247 unit /(72.22%)
42 unit / (12.28%)
42 unit / (6.14%) -
Mean 0.0594 0.0842 0.0346 0.0299 -
N 684 342 342 684
During transitional period (2008-2013)
Unit / (percentage)
281 unit / (41.08%)
240 unit / (70.18%)
41 unit / (11.99%)
38 unit / (5.55%)3 unit / (0.44%)
Mean 0.0813 0.1046 0.0580 0.0435 0.0018
N 684 342 342 684 684
As expected, most of the company paid regular dividend instead of special dividend to their shareholders. It is in line with the findings from other countries1 such as the United States of America and Australia where very few firms paid special dividend since it is normally classified as nonrecurring events.
Furthermore, this study also managed to identify 80 firm-years observations that serve 5.85 per cent of the observations paid both regular dividend and special dividend in the same year within that 12 years period. On the other hand, only 3 firm-years observations (0.22 per cent) paid special dividend to their shareholders without paying regular dividends in the same year. It seems that, Malaysian company would more likely pay both regular dividend and special dividend concurrently but it would rarely pay special dividend without paying regular
1 Chetty & Saez (2005) found that mean fraction for firm paying regular dividend was 22.68% while special dividend was only 0.58% in the United States of America. The same trend with Australian market when Pattenden & Twite (2008) found that frequency of company paying non-regular dividend (special dividend) was very low compared to regular dividend.
Single Tier Tax System: Analysis of Company Dividend Payouts
981
dividend to their shareholders.Next, this study further analyzed descriptive information of dividend payouts relative to
before transitional period and during transitional period in Panel B of Table 6. This study split the 12 years period in Panel A of Table 6 into first 6 firm-years observations from 2002 until 2007 that group the sample data as before transitional period and another 6 firm-years observations from 2008 until 2013 as during transitional period. Each period have 342 observations to be analyzed in this study. The purpose of splitting process was to analyze company’s dividend payouts before the transitional period of STT and during the 6 years transitional period given by Malaysian government. Eventually, company should plan their dividend policy particularly on the abolishment of section 108 since the company only allowed using that account within 6 years of transitional period.
As shown in Panel B of Table 6, the number of firm-years observations before transitional period for companies that have dividend payouts, pay regular dividend, pay special dividend and pay both regular dividend and special dividend in the same year is higher than the number of firm-years observations during transitional period which are 289, 247, 42 and 42 respectively. Based on those observations, it seems that companies paid more dividend payouts before transitional period than during transitional period. However, that trend has changed completely when this study examined on mean value for each characteristic across the column. The mean values during transitional period for the company that has dividend payouts was 0.0813 which slightly higher than before transitional period (0.0594). Similarly, mean values during transitional period for companies that pay regular dividend, special dividend and a combination payment of regular dividend and special dividend in the same year was also higher than before transitional period which are 0.1046, 0.0580 and 0.0435 respectively.
In addition, a few companies also attempted to respond to the 6 year transitional period given by the government when 3 firm-years observations were found for companies that pay special dividend without paying regular dividend to their shareholders. It is interesting to highlight these findings since it rarely occcured before and after the transitional period, which are 2002 until 2007 and 2014 until 20152 respectively. The mean value related to this special dividend is 0.0018. Even though it is a small figure, these findings provide early indicators that companies actually take into consideration the effects of dividend tax on their dividend payouts policy.
2 Refer to Table 7 for the mean value related to the year of 2014 and 2015.
International Journal of Economics and Management
982
Table 7 Company’s characteristics and descriptive information of regular dividend and special dividend for the year of 2012 until 2015
Panel A: Number of firm-years observations related to special dividend and regular dividend.Sample period for the year 2012 -2015.
Characteristics Company that have dividend payouts
Company that pay regular
dividend
Company that pay special
dividend
Company that pay both regular
dividend and special dividend in the same year
Company that pay special dividend
without regular dividend
No. of firm-years observations/ (percentage)
173 unit/ (37.94%)
151 unit/ (66.23%)
22 unit/ (9.65%)
20unit/ (4.39%) 2 unit/ (0.44%)
N 456 228 228 456 456Panel B: Number of observations related to special dividend and regular dividend.
Sample period for the year 2012-2013 (before compulsory STT) and 2014-2015 (compulsory STT)Characteristics / Period Company
that have dividend payouts
Company that pay regular
dividend
Company that pay special
dividend
Company that pay both regular
dividend and special dividend in the same year
Company that pay special dividend
without regular dividend
Before compulsory STT (2012 - 2013)
No. of firm-years
observations /(percentage)
91 unit/ (39.91%)
76 unit/ (66.67%)
15 unit/ (13.16%)
13 unit/ (5.7%) 2 unit/ (0.88%)
Means 0.0963 0.1204 0.0722 0.0555 0.0049N 228 114 114 228 228
Compulsory STT (2014 - 2015)
No. of firm-years
observations /(percentage)
82 unit/ (35.96%)
75 unit/ (65.79%)
7 unit/ (6.14%)
7 unit/ (-3.07%) -
Means 0.067 0.1015 0.0324 0.0348N 228 114 114 228
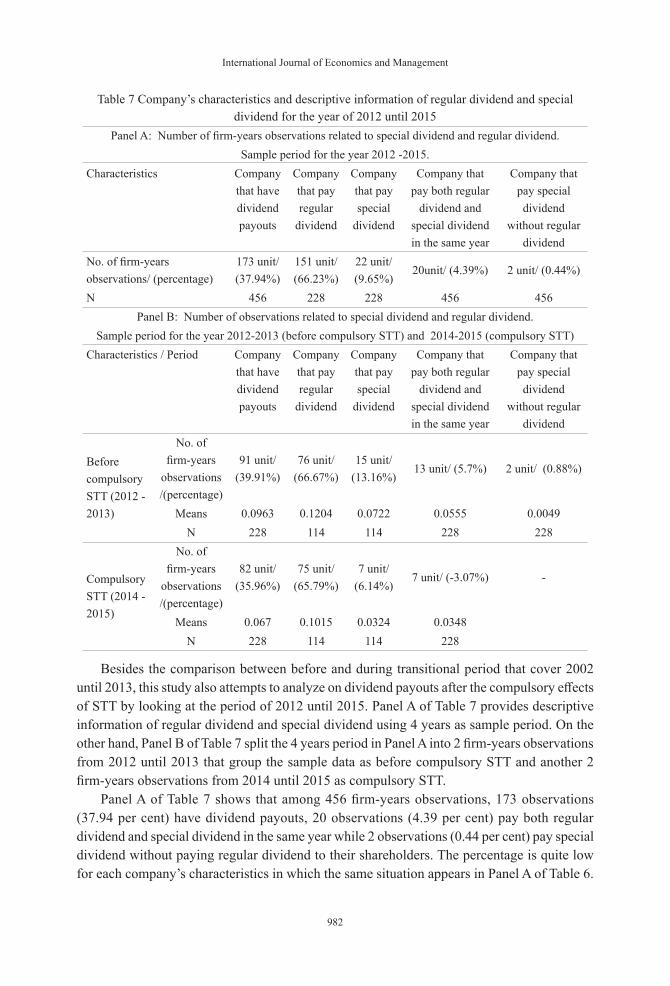
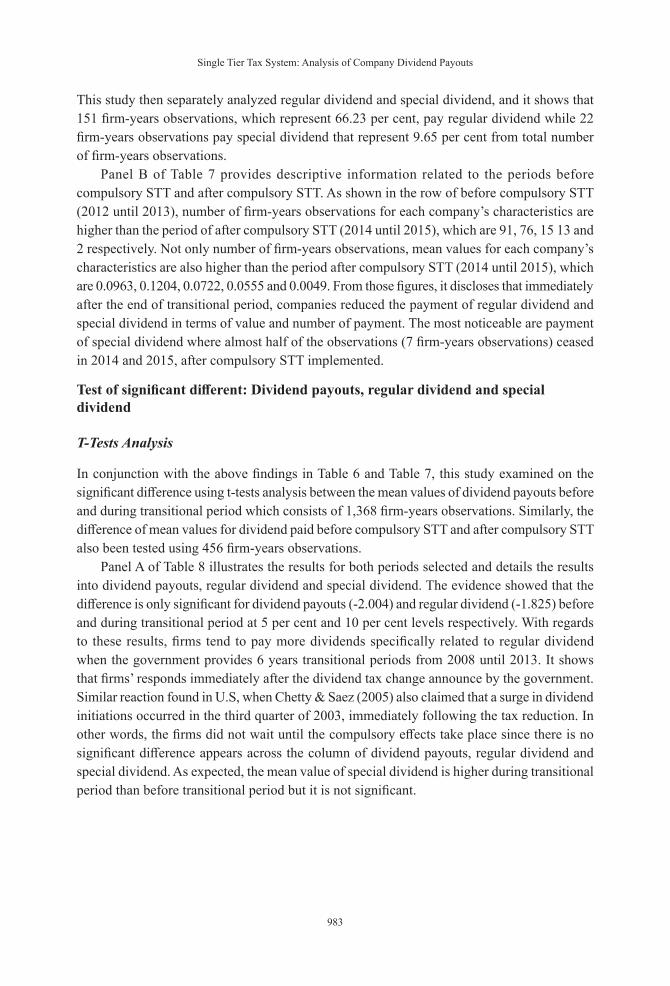
Besides the comparison between before and during transitional period that cover 2002 until 2013, this study also attempts to analyze on dividend payouts after the compulsory effects of STT by looking at the period of 2012 until 2015. Panel A of Table 7 provides descriptive information of regular dividend and special dividend using 4 years as sample period. On the other hand, Panel B of Table 7 split the 4 years period in Panel A into 2 firm-years observations from 2012 until 2013 that group the sample data as before compulsory STT and another 2 firm-years observations from 2014 until 2015 as compulsory STT.
Panel A of Table 7 shows that among 456 firm-years observations, 173 observations (37.94 per cent) have dividend payouts, 20 observations (4.39 per cent) pay both regular dividend and special dividend in the same year while 2 observations (0.44 per cent) pay special dividend without paying regular dividend to their shareholders. The percentage is quite low for each company’s characteristics in which the same situation appears in Panel A of Table 6.
Single Tier Tax System: Analysis of Company Dividend Payouts
983
This study then separately analyzed regular dividend and special dividend, and it shows that 151 firm-years observations, which represent 66.23 per cent, pay regular dividend while 22 firm-years observations pay special dividend that represent 9.65 per cent from total number of firm-years observations.
Panel B of Table 7 provides descriptive information related to the periods before compulsory STT and after compulsory STT. As shown in the row of before compulsory STT (2012 until 2013), number of firm-years observations for each company’s characteristics are higher than the period of after compulsory STT (2014 until 2015), which are 91, 76, 15 13 and 2 respectively. Not only number of firm-years observations, mean values for each company’s characteristics are also higher than the period after compulsory STT (2014 until 2015), which are 0.0963, 0.1204, 0.0722, 0.0555 and 0.0049. From those figures, it discloses that immediately after the end of transitional period, companies reduced the payment of regular dividend and special dividend in terms of value and number of payment. The most noticeable are payment of special dividend where almost half of the observations (7 firm-years observations) ceased in 2014 and 2015, after compulsory STT implemented.
Test of significant different: Dividend payouts, regular dividend and special dividend
T-Tests Analysis
In conjunction with the above findings in Table 6 and Table 7, this study examined on the significant difference using t-tests analysis between the mean values of dividend payouts before and during transitional period which consists of 1,368 firm-years observations. Similarly, the difference of mean values for dividend paid before compulsory STT and after compulsory STT also been tested using 456 firm-years observations.
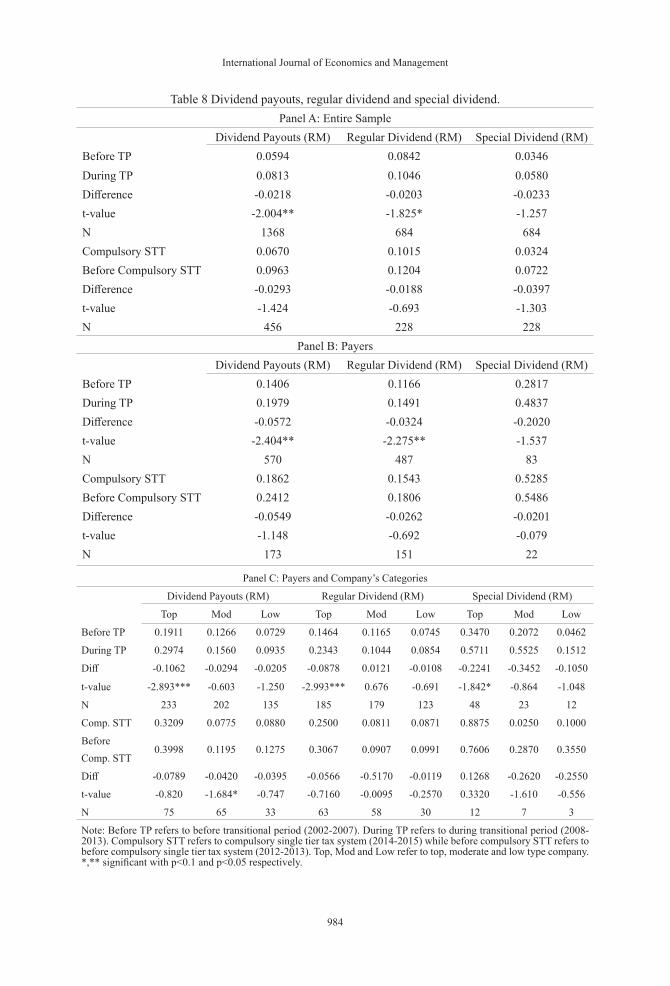
Panel A of Table 8 illustrates the results for both periods selected and details the results into dividend payouts, regular dividend and special dividend. The evidence showed that the difference is only significant for dividend payouts (-2.004) and regular dividend (-1.825) before and during transitional period at 5 per cent and 10 per cent levels respectively. With regards to these results, firms tend to pay more dividends specifically related to regular dividend when the government provides 6 years transitional periods from 2008 until 2013. It shows that firms’ responds immediately after the dividend tax change announce by the government. Similar reaction found in U.S, when Chetty & Saez (2005) also claimed that a surge in dividend initiations occurred in the third quarter of 2003, immediately following the tax reduction. In other words, the firms did not wait until the compulsory effects take place since there is no significant difference appears across the column of dividend payouts, regular dividend and special dividend. As expected, the mean value of special dividend is higher during transitional period than before transitional period but it is not significant.
International Journal of Economics and Management
984
Table 8 Dividend payouts, regular dividend and special dividend. Panel A: Entire Sample
Dividend Payouts (RM) Regular Dividend (RM) Special Dividend (RM)Before TP 0.0594 0.0842 0.0346During TP 0.0813 0.1046 0.0580Difference -0.0218 -0.0203 -0.0233t-value -2.004** -1.825* -1.257N 1368 684 684Compulsory STT 0.0670 0.1015 0.0324Before Compulsory STT 0.0963 0.1204 0.0722Difference -0.0293 -0.0188 -0.0397t-value -1.424 -0.693 -1.303N 456 228 228
Panel B: PayersDividend Payouts (RM) Regular Dividend (RM) Special Dividend (RM)
Before TP 0.1406 0.1166 0.2817During TP 0.1979 0.1491 0.4837Difference -0.0572 -0.0324 -0.2020t-value -2.404** -2.275** -1.537N 570 487 83Compulsory STT 0.1862 0.1543 0.5285Before Compulsory STT 0.2412 0.1806 0.5486Difference -0.0549 -0.0262 -0.0201t-value -1.148 -0.692 -0.079N 173 151 22
Panel C: Payers and Company’s Categories
Dividend Payouts (RM) Regular Dividend (RM) Special Dividend (RM)
Top Mod Low Top Mod Low Top Mod Low
Before TP 0.1911 0.1266 0.0729 0.1464 0.1165 0.0745 0.3470 0.2072 0.0462
During TP 0.2974 0.1560 0.0935 0.2343 0.1044 0.0854 0.5711 0.5525 0.1512
Diff -0.1062 -0.0294 -0.0205 -0.0878 0.0121 -0.0108 -0.2241 -0.3452 -0.1050
t-value -2.893*** -0.603 -1.250 -2.993*** 0.676 -0.691 -1.842* -0.864 -1.048
N 233 202 135 185 179 123 48 23 12
Comp. STT 0.3209 0.0775 0.0880 0.2500 0.0811 0.0871 0.8875 0.0250 0.1000
Before Comp. STT
0.3998 0.1195 0.1275 0.3067 0.0907 0.0991 0.7606 0.2870 0.3550
Diff -0.0789 -0.0420 -0.0395 -0.0566 -0.5170 -0.0119 0.1268 -0.2620 -0.2550
t-value -0.820 -1.684* -0.747 -0.7160 -0.0095 -0.2570 0.3320 -1.610 -0.556
N 75 65 33 63 58 30 12 7 3
Note: Before TP refers to before transitional period (2002-2007). During TP refers to during transitional period (2008-2013). Compulsory STT refers to compulsory single tier tax system (2014-2015) while before compulsory STT refers to before compulsory single tier tax system (2012-2013). Top, Mod and Low refer to top, moderate and low type company. *,** significant with p<0.1 and p<0.05 respectively.
Single Tier Tax System: Analysis of Company Dividend Payouts
985
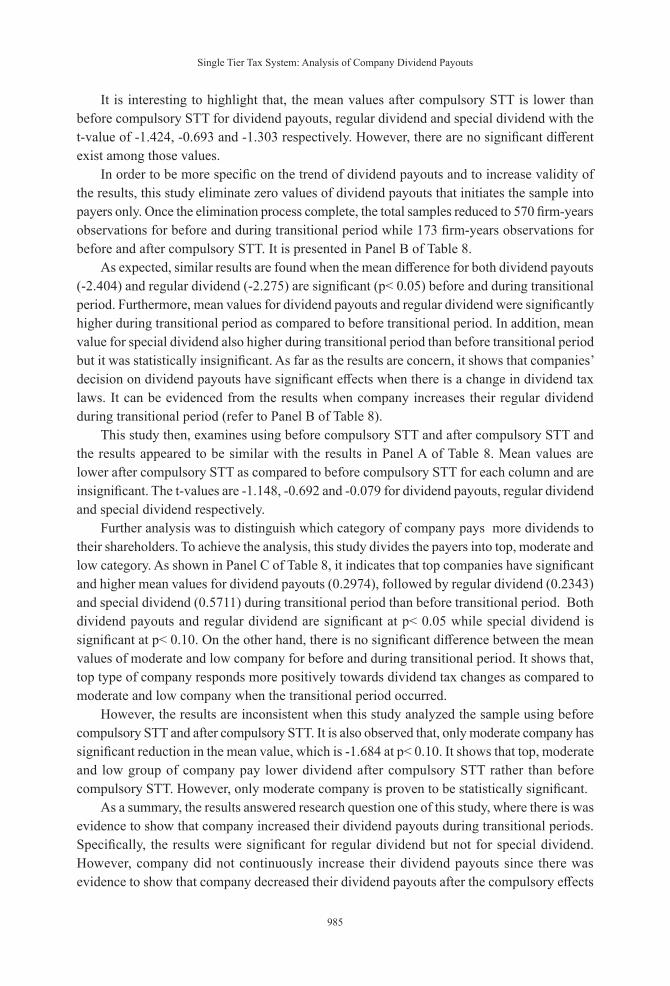
It is interesting to highlight that, the mean values after compulsory STT is lower than before compulsory STT for dividend payouts, regular dividend and special dividend with the t-value of -1.424, -0.693 and -1.303 respectively. However, there are no significant different exist among those values.
In order to be more specific on the trend of dividend payouts and to increase validity of the results, this study eliminate zero values of dividend payouts that initiates the sample into payers only. Once the elimination process complete, the total samples reduced to 570 firm-years observations for before and during transitional period while 173 firm-years observations for before and after compulsory STT. It is presented in Panel B of Table 8.
As expected, similar results are found when the mean difference for both dividend payouts (-2.404) and regular dividend (-2.275) are significant (p< 0.05) before and during transitional period. Furthermore, mean values for dividend payouts and regular dividend were significantly higher during transitional period as compared to before transitional period. In addition, mean value for special dividend also higher during transitional period than before transitional period but it was statistically insignificant. As far as the results are concern, it shows that companies’ decision on dividend payouts have significant effects when there is a change in dividend tax laws. It can be evidenced from the results when company increases their regular dividend during transitional period (refer to Panel B of Table 8).
This study then, examines using before compulsory STT and after compulsory STT and the results appeared to be similar with the results in Panel A of Table 8. Mean values are lower after compulsory STT as compared to before compulsory STT for each column and are insignificant. The t-values are -1.148, -0.692 and -0.079 for dividend payouts, regular dividend and special dividend respectively.
Further analysis was to distinguish which category of company pays more dividends to their shareholders. To achieve the analysis, this study divides the payers into top, moderate and low category. As shown in Panel C of Table 8, it indicates that top companies have significant and higher mean values for dividend payouts (0.2974), followed by regular dividend (0.2343) and special dividend (0.5711) during transitional period than before transitional period. Both dividend payouts and regular dividend are significant at p< 0.05 while special dividend is significant at p< 0.10. On the other hand, there is no significant difference between the mean values of moderate and low company for before and during transitional period. It shows that, top type of company responds more positively towards dividend tax changes as compared to moderate and low company when the transitional period occurred.
However, the results are inconsistent when this study analyzed the sample using before compulsory STT and after compulsory STT. It is also observed that, only moderate company has significant reduction in the mean value, which is -1.684 at p< 0.10. It shows that top, moderate and low group of company pay lower dividend after compulsory STT rather than before compulsory STT. However, only moderate company is proven to be statistically significant.
As a summary, the results answered research question one of this study, where there is was evidence to show that company increased their dividend payouts during transitional periods. Specifically, the results were significant for regular dividend but not for special dividend. However, company did not continuously increase their dividend payouts since there was evidence to show that company decreased their dividend payouts after the compulsory effects
International Journal of Economics and Management
986
of STT. But the difference was insignificant. Therefore, the answer for research question two is company did not pay higher dividend after the compulsory effects of STT.
To answer the third research question, this study found that there was difference responds between top, moderate and low performance company towards the implementation of STT by analyzing their dividend payouts. The results showed that only top company significantly increased their dividend payouts for both regular dividend and special dividend during transitional periods but not for moderate and low company. Moreover, only moderate company has significant reduction in their dividend payouts after the compulsory effects of STT that was in the year of 2014 and 2015.
Multiple analysis of variance (MANOVA).
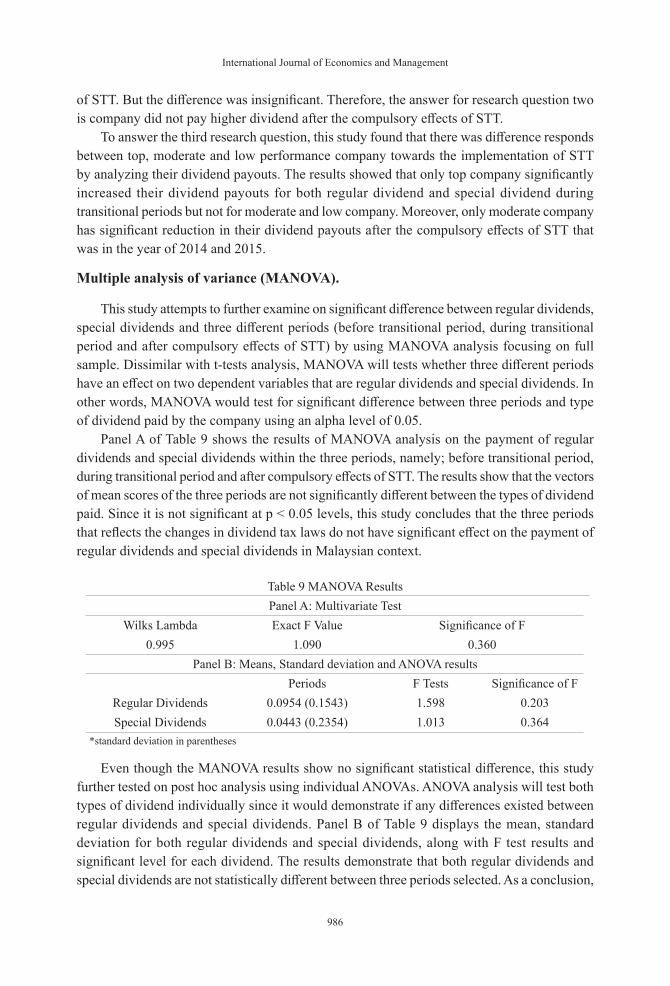
This study attempts to further examine on significant difference between regular dividends, special dividends and three different periods (before transitional period, during transitional period and after compulsory effects of STT) by using MANOVA analysis focusing on full sample. Dissimilar with t-tests analysis, MANOVA will tests whether three different periods have an effect on two dependent variables that are regular dividends and special dividends. In other words, MANOVA would test for significant difference between three periods and type of dividend paid by the company using an alpha level of 0.05.
Panel A of Table 9 shows the results of MANOVA analysis on the payment of regular dividends and special dividends within the three periods, namely; before transitional period, during transitional period and after compulsory effects of STT. The results show that the vectors of mean scores of the three periods are not significantly different between the types of dividend paid. Since it is not significant at p < 0.05 levels, this study concludes that the three periods that reflects the changes in dividend tax laws do not have significant effect on the payment of regular dividends and special dividends in Malaysian context.
Table 9 MANOVA ResultsPanel A: Multivariate Test
Wilks Lambda Exact F Value Significance of F0.995 1.090 0.360
Panel B: Means, Standard deviation and ANOVA resultsPeriods F Tests Significance of F
Regular Dividends 0.0954 (0.1543) 1.598 0.203Special Dividends 0.0443 (0.2354) 1.013 0.364
*standard deviation in parentheses
Even though the MANOVA results show no significant statistical difference, this study further tested on post hoc analysis using individual ANOVAs. ANOVA analysis will test both types of dividend individually since it would demonstrate if any differences existed between regular dividends and special dividends. Panel B of Table 9 displays the mean, standard deviation for both regular dividends and special dividends, along with F test results and significant level for each dividend. The results demonstrate that both regular dividends and special dividends are not statistically different between three periods selected. As a conclusion,
Single Tier Tax System: Analysis of Company Dividend Payouts
987
from MANOVA and ANOVA analysis, there is no significant difference between three periods and dividends paid by the company.
As far as this study is concern, the results found in MANOVA and ANOVA analyses are contradicts with t-test discussed above. Using t-test analysis, this study found significantly different between regular dividends paid by the company before and during transitional period. Therefore, this study decided to use the findings from t-test analysis to answer research questions of this study.
DISCUSSION AND CONCLUSION
Tax return in many countries has called a significant reaction to many taxpayers particularly listed companies. In Malaysia for instance, changes in dividend tax law in 2008 from imputation system to STT has significantly affect dividend payouts. Therefore, this study aims to examine on company dividend payouts using two different periods that are before and during transitional period of STT as well as before and after compulsory effects of STT. This study focuses on the implementation of STT since companies need to decide on their dividend payouts policy especially during the 6 years transitional period from 2008 until 2013. During this transitional period, firms have the option whether to fully utilize their section 108 tax credit by issuing more dividend or just continue with the new system.
This study suggests that company paid more dividends during the transitional period as compared to before transitional period, which relates to research question one of this study. Specifically, during transitional period that is from 2008 until 2013, mean value of dividend payouts were significantly higher than before transitional period. In addition, more regular dividend was paid during transitional period when this study split the sample between types of dividend. Similar findings also appeared when this study removed zero dividend payouts that referred to non-payers observations from the sample selected. Interestingly, among the payers (company), top performance company had significantly higher dividend payouts, regular dividend and special dividend during transitional period than before transitional period. These findings are in line with previous studies such as Chetty & Saez (2005), Seppo et al. (2008) and Wang & Guo (2011)3 where they found significant increase in dividend payouts after dividend tax reform.
Besides comparing before and after transitional period, this study also compared dividend payouts between before compulsory STT and after compulsory STT that are related to research question two. The results showed that mean values of dividend payouts were lower after compulsory STT than before compulsory STT. However, it was insignificant except for moderate company that had significant reduction in dividend payouts.
As a conclusion, the first expectation, which is companies tend to pay higher dividend during the 6 years transitional period actually occurred. Nevertheless, the significant increase in dividend payouts during transitional period is related to regular dividend not special dividend. As far as this study is concerned, there are certain types of investors that prefer
3 Chetty & Saez (2005) examined dividend payouts using 2003 dividend tax cut in U.S., Seppo et al. (2008) studied on dividend distributions using Finnish Corporate and Capital Income Tax Reform while Wang & Guo (2011) examined dividend payouts using 2005 China Tax Reform.
International Journal of Economics and Management
988
to receive dividend from their investments. As the results of this study divided the samples to top, moderate and low group of company (based on their return on equity). It becomes a guideline to investors to take into consideration return on equity of the company as part of their investment analysis.
This study contributes to the literature in several ways. Firstly, this study use Malaysian tax reform in which the changes is from imputation tax system to dividend exemption system that creates different features and characteristics. Unlike other studies such as Brown et al. (2007), Chetty & Saez (2005) and Wang & Guo (2011) that use tax reform that implement reduction in dividend tax cut under the 2003 U.S tax reform and 2005 China tax reform respectively.
Secondly, the results provide empirical findings to prove that some companies are respond positively towards STT. It shows that the intention of the government to encourage company to pay dividend by removing complicated process under the old system is achievable.
Not only that, the findings can also be used as a guideline for the regulator to improve legal requirement regarding dividend policy among public listed company. This is due to current issues highlighted in The Edge Malaysia dated 24 April 2017 on whether Securities Commission Malaysia (SCM) should considere to add additional listing criteria regarding compulsory payment of dividends among public listed company (Liew, 2017a). Since there is currently no requirement for the company to pay dividend to their shareholders. Another suggestion by president of Malaysian Investors’ Association (MIA) to penalize directors of companies who refused to pay dividend without legitimate reasons (Liew, 2017b) also create diverse reactions towards public listed company. As far as this study is concerned, not all companies are able to pay dividend especially when they are in a growth or expansion phase. Therefore, the findings of this study can be used as a guidance for the basis of implementating new dividend listing criteria in Malaysia.
The last contribution is, this study provides evidence to prove that ROE is one of the indicators to determine company dividend payouts. The results showed that company with higher ROE tend to pay higher dividend. Therefore, investors should consider ROE as one of the significant element in their investment plan.
ACKNOWLEDGEMENT
The authors would like to thank anonymous referees of the journals for their constructive comments and suggestions that have improved the manuscript. Any remaining errors or omissions rest solely with the author(s) of this paper.
REFERENCES
Al-najjar, B. and Kilincarslan, E. (2016), “The effect of ownership structure on dividend policy : evidence from Turkey”, Corporate Governance, Vol. 16 No. 1, pp. 135–161.
Baker, H.K. (2009), Dividends and Dividend Policy, John Wiley & Sons, Inc.
Becker, B., Jacob, M. and Jacob, M. (2013), “Payout taxes and the allocation of investment”, Journal of Financial Economics, Vol. 107 No. 1, pp. 1–24.
Single Tier Tax System: Analysis of Company Dividend Payouts
989
Bery, S., Bosworth, B. and Panagariya, A. (2006), India Policy Forum 2005/2006, SAGE Publications, India.
Bird, R.M. (2004), “Managing Tax Reform”, International Bureau of Fiscal Documentation, pp. 42–55.
Brav, A., Graham, J.R., Harvey, C.R. and Michaely, R. (2008), “Managerial response to the May 2003 dividend tax cut”, Financial Management, Vol. 37 No. 4, pp. 611–624.
Brown, J.R., Liang, N. and Weisbenner, S. (2007), “Executive Financial Incentives and Payout Policy: Firm Responses to the 2003 Dividend Tax Cut”, The Journal of Finance, Vol. 62 No. 4, pp. 1935–1965.
Chetty, R. and Saez, E. (2005), “Dividend taxes and corporate behavior: evidence from the 2003 dividend tax cut”, The Quarterly Journal of Economics, Vol. 120 No. 3, pp. 791–833.
Deslandes, M., Landry, S. and Fortin, A. (2015), “The effects of a tax dividend cut on payout policies: Canadian evidence”, International Journal of Managerial Finance, Vol. 11 No. 1, pp. 2–22.
Edgerton, J. (2013), “Four facts about dividend payouts and the 2003 tax cut”, International Tax and Public Finance, Vol. 20 No. 5, pp. 769–784.
Ghosh, A., Sandison, D., Cornelius, P., Tan, P., Wong, S., Woo, C., Ling, W.S., et al. (2008), Mergers & Acquisition-Asian Taxation Guide 2008 Singapore.
Hanlon, M. and Hoopes, J.L. (2014), “What do firms do when dividend tax rates change? An examination of alternative payout responses”, Journal of Financial Economics, Elsevier, Vol. 114 No. 1, pp. 105–124.
Henry, D. (2011), “Ownership structure and tax-friendly dividends”, Journal of Banking and Finance, Elsevier B.V., Vol. 35 No. 10, pp. 2747–2760.
Jacob, M., Michaely, R. and Alstadsæter, A. (2015), Taxation and Dividend Policy: The Muting Effect of Diverse Ownership Structure, Accounting Research Centre, Chicago Booth, available at:https://doi.org/10.2139/ssrn.2516927.
Korkeamaki, T., Liljeblom, E. and Pasternack, D. (2010), “Tax reform and payout policy: Do shareholder clienteles or payout policy adjust?”, Journal of Corporate Finance, Vol. 16 No. 4, pp. 572–587.
Liew, J.T. (2017a), “Should companies be forced to pay dividends?”, The Edge Malaysia, p. 14.
Liew, J.T. (2017b), “MIA: Punish stingy directors for not paying dividends”, The Edge Malaysia, p. 15.
Liew, P.X., Lim, K.P. and Goh, K.L. (2016), “Aggregate liquidity for Malaysian stock market: New indicators and time series properties”, International Journal of Economics and Management, Vol. 10 No. 2, pp. 297–319.
Pandey, I.M. (2003), “Corporate Dividend Policy And Behaviour : The Malaysian Evidence”, Asian Academy of Management Journal, Vol. 8 No. 1, pp. 17–32.
Pattenden, K. and Twite, G. (2008), “Taxes and dividend policy under alternative tax regimes”, Journal of Corporate Finance, Vol. 14 No. 1, pp. 1–16.
Poterba, J. (2004), “Taxation and corporate payout policy”, American Economic Review, Vol. 94, pp. 171–175.
Rao, S. (2014), “Tax Reform: Topic guide”, GSDRC, University of Birmingham.
Selamat, A., Ariff, M. and Shamsher, M. (2012), “Dividend tax cuts in the united states and single-tier tax regime in malaysia: Share price reactions to tax policy changes”, Pertanika Journal of Social Science and Humanities, Vol. 20 No. 4, pp. 1209–1228.
International Journal of Economics and Management
990
Seppo, K., Karikallio, H. and Pirttilä, J. (2008), “Anticipating Tax Changes : Evidence from the Finnish Corporate Income Tax Reform of 2005”, Fiscal Studies, Vol. 29 No. 2, pp. 167–196.
Wang, C.F. and Guo, Y. (2011), “Do dividend tax cuts lead firms to increase dividends: Evidence from China”, China Journal of Accounting Research, Vol. 4 No. 4, pp. 197–209.