Embed Size (px)
Citation preview
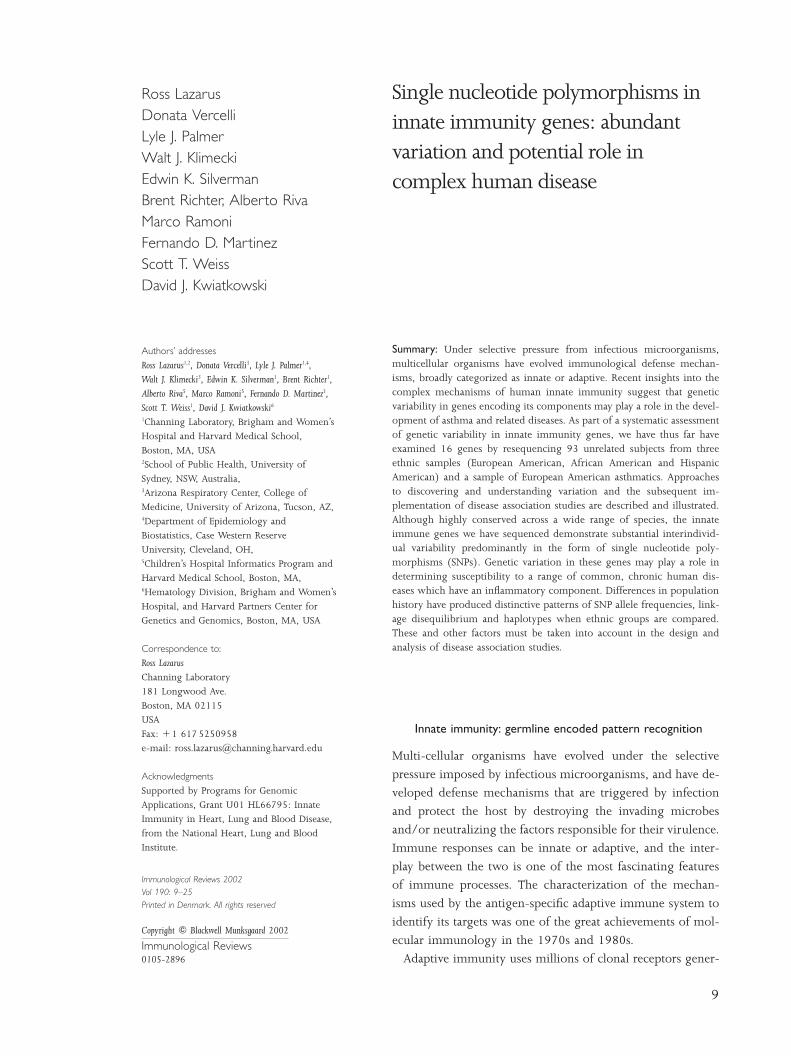
Ross Lazarus Single nucleotide polymorphisms inDonata Vercelli innate immunity genes: abundantLyle J. Palmer
variation and potential role inWalt J. KlimeckiEdwin K. Silverman complex human diseaseBrent Richter, Alberto RivaMarco RamoniFernando D. MartinezScott T. WeissDavid J. Kwiatkowski
Authors’ addresses
Ross Lazarus1,2, Donata Vercelli3, Lyle J. Palmer1,4,Walt J. Klimecki3, Edwin K. Silverman1, Brent Richter1,Alberto Riva5, Marco Ramoni5, Fernando D. Martinez3,Scott T. Weiss1, David J. Kwiatkowski6
1Channing Laboratory, Brigham and Women’sHospital and Harvard Medical School,Boston, MA, USA2School of Public Health, University ofSydney, NSW, Australia,3Arizona Respiratory Center, College ofMedicine, University of Arizona, Tucson, AZ,4Department of Epidemiology andBiostatistics, Case Western ReserveUniversity, Cleveland, OH,5Children’s Hospital Informatics Program andHarvard Medical School, Boston, MA,6Hematology Division, Brigham and Women’sHospital, and Harvard Partners Center forGenetics and Genomics, Boston, MA, USA
Correspondence to:
Ross LazarusChanning Laboratory181 Longwood Ave.Boston, MA 02115USAFax: π1 6175250958e-mail: [email protected]
Acknowledgments
Supported by Programs for GenomicApplications, Grant U01 HL66795: InnateImmunity in Heart, Lung and Blood Disease,from the National Heart, Lung and BloodInstitute.
Immunological Reviews 2002Vol 190: 9–25Printed in Denmark. All rights reserved
Copyright c Blackwell Munksgaard 2002
Immunological Reviews0105-2896
9
Summary: Under selective pressure from infectious microorganisms,multicellular organisms have evolved immunological defense mechan-isms, broadly categorized as innate or adaptive. Recent insights into thecomplex mechanisms of human innate immunity suggest that geneticvariability in genes encoding its components may play a role in the devel-opment of asthma and related diseases. As part of a systematic assessmentof genetic variability in innate immunity genes, we have thus far haveexamined 16 genes by resequencing 93 unrelated subjects from threeethnic samples (European American, African American and HispanicAmerican) and a sample of European American asthmatics. Approachesto discovering and understanding variation and the subsequent im-plementation of disease association studies are described and illustrated.Although highly conserved across a wide range of species, the innateimmune genes we have sequenced demonstrate substantial interindivid-ual variability predominantly in the form of single nucleotide poly-morphisms (SNPs). Genetic variation in these genes may play a role indetermining susceptibility to a range of common, chronic human dis-eases which have an inflammatory component. Differences in populationhistory have produced distinctive patterns of SNP allele frequencies, link-age disequilibrium and haplotypes when ethnic groups are compared.These and other factors must be taken into account in the design andanalysis of disease association studies.
Innate immunity: germline encoded pattern recognition
Multi-cellular organisms have evolved under the selective
pressure imposed by infectious microorganisms, and have de-
veloped defense mechanisms that are triggered by infection
and protect the host by destroying the invading microbes
and/or neutralizing the factors responsible for their virulence.
Immune responses can be innate or adaptive, and the inter-
play between the two is one of the most fascinating features
of immune processes. The characterization of the mechan-
isms used by the antigen-specific adaptive immune system to
identify its targets was one of the great achievements of mol-
ecular immunology in the 1970s and 1980s.
Adaptive immunity uses millions of clonal receptors gener-
Lazarus et al ¡ Analysis of SNPs in innate immunity genes
ated through somatic mechanisms (i.e. gene rearrangements)
during the ontogeny of each individual organism. The anti-
genic targets of adaptive immune cells (T and B lymphocytes)
are multiple and highly variable. Adaptive responses are char-
acterized by memory, which implies amplification and
shortened reaction times, but the rearrangements necessary
to generate an inclusive receptor repertoire are highly prone
to error. Thus, adaptive discrimination between self and non-
self can go awry.
In remarkable contrast, the phylogenetically ancient innate
immune system recognizes microbial pathogens through a
limited repertoire of nonclonal, germline-encoded receptors.
Since innate discrimination between self and nonself has
evolved encoded in the germline, it is essentially perfect.
Critical to this perfection is the nature of the targets of innate
immune recognition. Innate immune cells (dendritic cells,
macrophages) have receptors (termed PRRs, for pattern rec-
ognition receptors) which recognize invariant molecular con-
stituents of infectious agents (termed PAMPs, for pathogen-
associated molecular patterns) (reviewed in 1–3), most of
which are shared by large groups of pathogens and none of
which are produced by the host. Furthermore, and as import-
antly, all of the PAMP structures are essential for the physi-
ology and survival of the respective microbes, so that by tar-
geting them the system maximizes its defensive efficacy. Un-
like adaptive immunity, innate receptors sense general
molecular patterns (most often, arrays of sugars and/or lipids
or nucleic acids) rather than discrete proteins.
Induction of an immune response is only appropriate if the
antigen recognized is derived from, or belongs to, a patho-
gen. Indeed, activation of immunity against self antigens or
innocuous persistent environmental antigens is deleterious.
Therefore activation of antigen-specific adaptive immunity re-
quires signals that provide information about the origin of
the antigen and the type of response to be induced. It is the
key task of innate immunity to provide these signals.
Pattern recognition receptors: Toll PRRs at the cellexternal interface
Few molecules recapitulate the features and properties of innate
PRRs as eloquently as Toll and related members of the Toll fam-
ily (4). The Toll protein was originally identified in Drosophila,
where it controls embryonic development (5) and is required
for antifungal immune responses, because it controls the ex-
pression of the antifungal peptide drosomycin (6). Toll is a type
I transmembrane receptor. The extra-cellular domain contains
leucine-rich repeats, while the cytoplasmic domain is similar
10 Immunological Reviews 190/2002
to that of interleukin-1 (IL-1) receptor (4). Ten human homo-
logs of Toll (Toll-like receptors, TLRs) have been identified so
far (reviewed in 7). Most of the known TLRs appear as sentinels
on the outside of cells, recognize discrete PAMPs in their extra-
cellular domain and trigger the activation of intracellular sig-
naling leading to the nuclear translocation of NF-kB through
a MyD88-dependent pathway as well as a poorly understood
MyD88-independent pathway. The MyD88-dependent path-
way involves IRAK proteins such as IRAK-1 and possibly IRAK-
4 (8), with recent evidence suggesting that IRAK-M may be an
important down-regulator of this pathway (9). TLR-delivered
signals ultimately culminate in the production of pro-inflam-
matory cytokines, which on the one hand mediate direct de-
fense responses and on the other alert adaptive immune cells to
the presence of a pathogen.
Other intracellular molecules have been found to be in-
volved in signaling initiated by PAMPs, although their role
relative to TLR-dependent pathways remains to be defined. In
particular, Nod1 (CARD4) and Nod2 (CARD15) may func-
tion as cytosolic receptors for pathogen components derived
from invading bacteria (10, 11). Beta-catenin (CTNNB), a
transcriptional coactivator, is part of the intracellular signal
transduction pathways triggered by lipopolysaccharide (LPS)
in human macrophages, and appears to be involved in LPS-
induction of gene transcription (12).
TLR2 recognizes a variety of bacterial components, such as
peptidoglycan, bacterial triacylated lipoproteins, mycoplasma
diacylated lipoprotein, and glycosylphosphatidylinositol
(GPI) anchors from Trypanosoma cruzi (13, 14). TLR4 is essen-
tial for responses to LPS, a glycolipid specific to Gram-nega-
tive bacterial cell walls (15). Of note, ligand-dependent cell
activation through TLR4 and TLR2 (and possibly other TLRs)
requires additional molecules, first and foremost CD14,
which is expressed both as a GPI-linked and a soluble protein
(16, 17).
LPS initiates its biological activities through a heteromeric
receptor complex containing CD14, TLR4, and at least one
other protein, MD-2. LPS binds directly to CD14 and is cross-
linked specifically to TLR4 and MD-2 only when coexpressed
with CD14. Thus, LPS is in close proximity to the three
known proteins of its membrane receptor complex and binds
directly to each of the members of the tripartite LPS receptor
complex (16). MD-2 is a required component of the LPS sig-
naling complex and (similar to CD14) can function as a sol-
uble receptor for cells that do not otherwise express it (18).
TLR5 recognizes flagellin, a protein component of bacterial
flagella (19). Nucleotides specific to pathogens and nucle-
otide analogs are also detected by TLRs; TLR3 (20), TLR7
Lazarus et al ¡ Analysis of SNPs in innate immunity genes
(21), and TLR9 (22) participate in the recognition of viral
double-stranded RNA, imidazoquinolines, and bacterial DNA
with unmethylated CpG motifs, respectively.
Additional human TLRs have been actively sought, but none
have been found. Thus, the main burden of monitoring the
host/environment interface appears to rest with a family of
proteins that appears to include relatively few members. A
subtle but important change in zeitgeist is occurring in the
TLR field. Initially, the burning question was how a few in-
nate immune receptors could recognize many different patho-
gens. Thus, emphasis was on the discrepancy between the
paucity of TLR family members and the diversity of patho-
gens. This raised a nontrivial conceptual problem: if the main
purpose of innate immunity is not only to alert the organism
to the presence of an invader, but also to impart instructions
for optimal, tailored responses to it (which cannot be identi-
cal for viruses, bacteria, mycobacteria and multicellular para-
sites), how can very few receptors do the job? Recent work
is clarifying this important issue, and attention is now focus-
ing on how both specificity and inclusiveness of recognition
may be achieved in spite of the low number of receptors
involved. The finding that heterodimerization of different
TLRs provides fine discrimination for PAMP recognition is of
particular importance in this context.
Lipoproteins are produced by a variety of pathogens includ-
ing mycobacteria, Gram-negative bacteria, and mycoplasma.
The N-terminal acylated region is responsible for the immu-
nostimulatory activity of lipoproteins. Interestingly, lipopro-
teins of bacteria are triacylated, whereas those of mycoplasma
are diacylated. Thus, the degree of acylation of the N-terminal
cysteine becomes a molecular signature of the pathogen.
Studies with knock-out mice clearly show that TLR2 is essen-
tial for the response to both tri- and diacylated lipopeptide
(23). TLR6 specifically recognizes diacylated lipopeptide in
conjunction with TLR2 (23). By contrast, TLR1 is involved
in the recognition of triacylated bacterial lipoprotein, again
in conjunction with TLR2 (14). Thus TLR2 pairs with TLR1
or TLR6 to recognize different PAMPs and distinguish the de-
gree of acylation (and thus the source) of the lipopeptide.
It is possible that other TLRs (e.g. TLR10) may take part in
heterodimerization, thus significantly broadening the spec-
trum of innate immune recognition and providing the re-
sponse with additional functional plasticity.
Potential importance of variation in innate immunity genes
The fundamental hypothesis that we are pursuing is that nat-
urally occurring variation in the innate immunity genes has
11Immunological Reviews 190/2002
an important role in human susceptibility to a variety of dis-
eases that relate to the immune system, particularly the com-
mon lung diseases asthma and chronic obstructive pulmonary
disease. The rationale underlying our hypothesis is that these
lung diseases have both an inflammatory and a genetic com-
ponent to their pathogenesis. Three main considerations sup-
port our hypothesis. First, variation affecting the innate im-
munity genes is heritable, relatively extensive, and potentially
enhanced by evolutionary benefits of such variation. Second,
these genes are critical for both triggering and sustaining in-
flammatory responses and in providing cues necessary to pro-
gram adaptive, antigen-specific responses. Last, given the po-
sition of the innate immunity genes and the proteins they
encode at the interface of host and environment, even minor
variation in these genes could have a major impact on down-
stream responses that could be critical for host defense or
inflammatory disease pathogenesis.
One essential corollary to our hypothesis is that innate im-
munity genes should harbor enough variation within a popu-
lation and between populations to potentially contribute to
the pathogenesis of genetic disorders. Although highly con-
served phylogenetically, there is ample evidence that interin-
dividual variation in genes encoding innate immunity pro-
teins can influence their activity and the risk of disease. For
example, IL10 production is strongly influenced by known
genetic variation (24), and a number of studies have reported
association between IL10 polymorphism and risk of a diverse
range of diseases including asthma (25–27), systemic lupus
erythematosus (28) and arthritis (29)
For this reason, our research program, the Innate Immunity
Program in Genomics Applications (IIPGA, http://innateim-
munity.net), is focused firstly on discovering and describing
human genetic variation in innate immunity genes in a com-
prehensive manner and secondly on examining disease risk
associated with this variation. Single nucleotide polymorph-
isms (SNPs) are being used to characterize variation, because
they have advantages compared to other types of genetic poly-
morphism (30, 31). Firstly, SNPs are ubiquitous in the hu-
man genome, being found in exons, introns, promoters, en-
hancers and intergenic regions, allowing them to be used as
markers in dense positional cloning investigations using both
randomly distributed markers and markers clustered within
genes (30, 32), and the sheer abundance of SNPs makes it
likely that alleles at some of these polymorphisms are them-
selves functional (33, 34). Secondly, groups of adjacent SNPs
may exhibit patterns of linkage disequilibrium and haplotypic
diversity that could be used to enhance gene mapping (35)
and which may highlight recombination ‘hot-spots’ (36).
Lazarus et al ¡ Analysis of SNPs in innate immunity genes
Thirdly, interpopulation differences in SNP frequencies may
be used in population-based genetic studies (37, 38). Finally,
there is good evidence that SNPs are less mutable than other
types of polymorphism (39, 40). The resultant greater sta-
bility may allow more consistent estimates of linkage disequi-
librium and genotype–phenotype associations, and there is
evidence suggesting that biallelic SNPs may be more powerful
and more accurate than microsatellite markers in association-
based analysis under some circumstances (41). As will be
shown, we have found substantial levels of interindividual
variation in the form of SNPs in nearly all of the genes we
have sequenced within self-described racial groups, as well as
important differences between the groups themselves.
Discovering variation in innate immunity genes:sequencing issues and methods
While there are alternative strategies for the discovery of gen-
etic variation in the human genome, many laboratories are
turning to resequencing as a direct and efficient method.
Here, we briefly review our own current practice of rese-
quencing for variation discovery. We are interested in charac-
terizing variation in the multiple ethnic populations of the
United States. Therefore, resequencing is performed using
three sets of DNA samples from apparently healthy and unre-
lated individuals of self-reported ethnicity: 24 African Ameri-
cans, 23 European Americans (both from the Coriell Insti-
tute) and 24 Hispanic Americans (from the Arizona Respir-
atory Center, University of Arizona, Tucson, AZ). In addition,
to enrich for genetic variation that might be important in
respiratory disease, we resequence 22 self-identified European
Americans with physician-diagnosed asthma.
The basic procedure for a resequencing analysis is to design
oligonucleotide primers that uniquely match a segment of the
desired gene. This portion, termed an amplicon, is amplified
from each of the individual DNA samples in a polymerase
chain reaction (PCR). Fluorescent dye chemistry is used to
infer the sequence of bases in each sample of amplified DNA.
The individual sequence traces are then aligned to permit
identification of all sites where there is variation between in-
dividuals. The vast majority of the human genome does not
vary between individuals so, in practice, alignment of good
quality sequence traces and comparison between individuals
is generally straightforward.
There are two approaches to the extent of resequencing
analysis that is done. The first approach is a selective approach
in which the entire genomic extent of a gene is not se-
quenced. Rather, portions of a gene are sequenced, typically
12 Immunological Reviews 190/2002
focusing on a somewhat arbitrary region 5ƒ to the transcrip-
tion start site (presumed to be important in regulation of
transcription and therefore expression of the gene), all exons
and portions of their surrounding introns, and some portion
of the 3ƒ untranslated region (potentially important in mess-
age stability and therefore level of expression). The second
approach is complete genomic resequencing, in which the
entire genomic extent of a gene as well as some flanking
sequence is determined.
The benefits of selective resequencing relate to the reduced
total cost, focusing resources on regions thought to be func-
tionally important. This approach is also supported by the
general observation made from the study of ‘strong’ muta-
tions in genes causing Mendelian conditions that over 90%
of all mutations will be found using such an approach. On
the other hand, complete resequencing requires no a priori
knowledge or assumptions about the most functionally rel-
evant genomic regions within a gene. In addition, complete
resequencing yields complete information on the variation
within the gene, and enables generation and analysis of a
complete catalog of haplotypes for that gene. Thus, one limi-
tation of selective resequencing is that the true number of
haplotypes in the population will be underestimated, since
polymorphisms in unsequenced regions will often subdivide
haplotypes based solely upon the variation discovered in a
selective resequencing strategy. In addition, limited evidence
suggests that variation in regulatory noncoding sequences
may be a relatively common cause of significant variation in
disease predisposition (42). Based upon these considerations,
we are currently pursuing a strategy of complete resequenc-
ing whenever the gene is of manageable size, i.e.20kb in
extent. For genes of larger genomic extent, we use the selec-
tive approach described above.
Briefly, in our laboratory procedure we design primers
using Primer 3 (http://www-genome.wi.mit.edu/cgi-bin/
primer/primer3) that yield 700–1000 base amplicons using
sequence data taken from the University of California at Santa
Cruz website (http://genome.ucsc.edu). Consecutive am-
plicons are designed to have an overlap of about 200bp. PCR
reactions are tested and optimized for annealing temperature,
then PCR is performed on the 93 DNA samples and treated
with Exo-SAP. Cycle sequencing reactions (BigDye V3,
Applied Biosystems) are set up at 1/6 dilution using 10ng
of amplified DNA. Sequencing reactions are cleaned using
vacuum filtration in 384 well, filter-bottom plates (Millipore
384SEQ), with immediate resuspension in water. Cleaned se-
quencing reactions are run on a 3700 DNA analyzer (Applied
Biosystems).
Lazarus et al ¡ Analysis of SNPs in innate immunity genes
Discovering variation in innate immunity genes:bioinformatics issues and methods
In the broad sense, bioinformatics covers computer-based ac-
tivities supporting the IIPGA variation discovery, disease as-
sociation study, information dissemination and educational
effort. The critical importance of bioinformatics in genome
research is well known, and the role of bioinformatics sup-
port in the work of the IIPGA is fundamental to its success.
Fortunately, there are a large number of very useful and well
known bioinformatics resources available, many of which are
on-line and accessible to any internet connected web browser
such as the vast National Center for Biotechnology Infor-
mation (NCBI) repository (http://www.ncbi.nih.gov) and
the Human Genome browser (http://genome.ucsc.edu). We
have also assembled a number of freely available (generally,
open source) bioinformatics tools and resources for our own
use, and like many other groups, we create custom tools and
applications where necessary, making these available for other
researchers to use wherever possible.
Once the initial steps leading to primer design are com-
pleted as described above, the next set of bioinformatics tools
for variation discovery are those that are used for collecting,
archiving, and analyzing the sequence data produced by the
sequencing apparatus from DNA samples. Chromatogram
management and analysis relies on a set of Perl scripts de-
veloped and maintained at the Nickerson Laboratory (http://
pga.mbt.washington.edu). Electropherogram interpretation,
sequence assembly, and polymorphism analysis are performed
using the Phred, Phrap, Consed, and PolyPhred suite of soft-
ware programs (43, 44). SNPs and diallelic insertion/de-
letions are catalogued using this system. Microsatellite poly-
morphisms are not catalogued because of difficulty in allele
assignment by sequence analysis. All individual genotypes are
confirmed by direct visual inspection of the chromatograms
by an analyst.
Once the sequencing is complete, the sequence data ana-
lyzed and requisite quality checks performed to ensure ade-
quate coverage of the region sequenced with consistently
high quality reads, the sequence data is processed for display
on our website (http://innateimmunity.net). A variety of
existing and custom-written applications are used to trans-
form sequence variation information from each gene into a
wide range of formats and displays, all of which are available
from the IIPGA website(see examples below).
One important custom tool that our group has developed
and continues to support and refine is SNPper (http://
snpper.chip.org). SNPper is a freely available on-line resource
13Immunological Reviews 190/2002
which was originally developed as a tool to combine available
information on SNPs from multiple public databases. It has
been steadily expanded in function so that it now permits
analysis of SNPs on a gene by gene basis as well as individu-
ally using a variety of SNP naming conventions. Within a
gene, SNPper accesses the most recent genomic sequence in-
formation for that gene, including all known isoforms and
generates a graphical representation of the location of SNPs,
showing their position relative to nearby exons and their ef-
fect on amino acid sequence, as appropriate. It also provides
data export functionality in a variety of formats, including
XML and a transportable file showing each SNP with user-
definable length flanking sequences, facilitating importation
to primer design programs. The user-definable length flank-
ing sequences available from SNPper have been found to pro-
duce SNP assays which are more likely to succeed than those
using primers designed with flanking sequences from dbSNP
(45).
A number of analyses are performed on the variation data
to enhance their utility to the community. For each SNP, allele
counts and frequencies, genotype counts and frequencies,
Hardy–Weinberg equilibrium measurements, and linkage dis-
equilibrium measurements between each pair of SNPs are
presented. In addition, the location of the SNPs are presented
and compared with those in public databases using the
SNPper utility. We use the Phase software package (46) to
infer the haplotype patterns in each gene using the genotype
data available from the variation discovery resequencing and
have developed a deterministic method for identifying opti-
mal sets of haplotype tagging SNPs to facilitate the design of
optimally efficient association studies(see below).
Understanding variation in innate immunity genes: linkagedisequilibrium
Linkage disequilibrium (LD) is a statistical measure of the
extent to which particular alleles at two loci are associated
with each other in a population. Understanding the LD and
haplotype patterns in a gene is of fundamental importance in
strategic planning for disease association studies. In practice,
usually only a subset of all SNP can be genotyped in large
samples, but if any of those SNP are in strong LD with the
true causal site(s), an association is likely to be detectable.
The two statistical attributes of LD of interest in gene map-
ping exercises are the magnitude and the statistical signifi-
cance of LD. Statistical significance of LD between two SNPs
may be determined by performing Fisher’s exact test on a
2¿2 contingency table under the null hypothesis of indepen-
Lazarus et al ¡ Analysis of SNPs in innate immunity genes
dence. Determining the magnitude of LD is more compli-
cated, and there are several different measures of two-locus
disequilibrium (47–49).
The most commonly used measure of LD magnitude is D,
the difference between the observed and expected (under the
null hypothesis of independence) proportion of haplotypes
bearing specific alleles at two loci (50).
DΩpAB ªpApB
where PA and PB are the proportions of two alleles A and B at
two SNP loci; A and B are generally taken as the most com-
mon alleles at each locus. D can be positive or negative, de-
pending upon the arbitrary labeling of alleles. Positive values
of D suggest that the common alleles at each locus segregate
together (‘coupling’); negative values suggest that the com-
mon allele at one locus segregates with the rare allele at the
other locus (‘repulsion’).
A standardized measure of D, Lewontin’s D prime (Dƒ)(47), minimizes the dependence on allele frequency and is
probably the most quoted measure of LD magnitude in gene
discovery:
DƒΩD
Dmax
where the maximum possible value of D depends upon allele
frequency; if D is positive, Dmax is the lesser of pApb or papB; if
D is negative, Dmax is the lesser of pApB or papb. Another com-
monly quoted measure of LD magnitude is r2, the square of
the correlation coefficient between the A and B loci:
r2 ΩD2
pApapBpb
Dƒ and r2 have different properties that make them useful in
different situations. In general, choice of LD measure can have
a significant impact upon both accuracy and interpretability
of disequilibrium method (49). Dƒ is inversely biased with
sample size, being inflated in small samples; the degree of
bias will be greater for SNPs with rare alleles. Further, the
interpretation of values of Dƒ 1 is problematic, and values
are difficult to compare between different samples because of
the dependence on sample size.
However, Dƒ is standardized so as to be relatively robust
to differences in allele frequencies. In contrast, r2 is highly
dependent upon allele frequency, and can be difficult to inter-
pret when loci differ in their allele frequencies (51). How-
ever, r2 has desirable sampling properties (52), is directly re-
lated to the amount of information provided by one locus
14 Immunological Reviews 190/2002
about the other, and is particularly useful in evolutionary and
population genetics applications. Further, multiplying r2 by
the number of chromosomes in the sample gives a c2-value
that can be used to test for association. Earlier studies, which
have compared the use of different measures of LD specifically
for disequilibrium mapping purposes, generally suggested
that Dƒ is preferable to r2 in most realistic settings (48, 49,
53). Both deterministic calculations and simulations suggest
that Dƒ allows greater ability to correctly determine the loca-
tion of a disease locus within a given population, providing
a symmetric, unimodal measure with a maximum at the true
disease locus.
In contrast, r2 often shows an asymmetric, multimodal
measure with a maximum not at the true disease locus (49).
Further, the relationship between r2 and q (the recombination
fraction between two loci) may be obscured by marginal al-
lele frequencies to a much greater extent that will the re-
lationship between Dƒ and q; large values of r2 will be associ-
ated with small allele frequencies and vice versa. However, it
should be noted that in the presence of recurrent mutation at
one or both of a pair of loci, the performance of all measures
of LD will depend on allele frequencies (48). More recent
research has emphasized r2 as a useful measure of pairwise
LD in association studies, particularly when the sample size
is small (52, 54, 55). This utility is principally because r2
values 1 are more interpretable than Dƒ values 1, and
because the inverse relationship between the sample size re-
quired to detect significant LD and r2 provides a guide to the
‘usefulness’ of a given level of LD (54).
It is evident that there is no single best measure of LD under
all possible circumstances. Our view of the different prop-
erties of Dƒ and r2 is that these are complementary measures.
Given that our IIPGA project involves elements of both popu-
lation genetics and disequilibrium mapping of disease suscep-
tibility loci, both Dƒ and r2 are routinely available on our
website.
Understanding variation in innate immunity genes:haplotypes
Haplotypes are the arrangements of alleles on individual
transmitted chromosomes. In complex disease where there
may be more than one variant locus contributing to disease
susceptibility, haplotypes are potentially important, since
combinations of particular alleles in the same gene in cis (i.e.
on the same transmitted chromosome) may result in different
effects on the proteins being transcribed or transcription
regulation compared with the same alleles in trans. In ad-
Lazarus et al ¡ Analysis of SNPs in innate immunity genes
dition, haplotypes offer advantages in terms of statistical
power to detect a true association with a given sample size
compared with analyses based on single SNP or combinations
of SNP.
In nearly all large SNP-based association studies, genotypic
data is phase-unknown, so haplotypes for double hetero-
zygotes are unknown and must be imputed. There has been
substantial progress over the past few years in the develop-
ment and implementation of appropriate statistical methods.
Probably the most well known approach is the use of the
Expectation Maximization (EM) algorithm to estimate haplo-
type frequencies compatible with maximum likelihood of the
genotype frequencies in the data, such as implemented in the
Arlequin package (56). In practice, this method is relatively
fast, but it is restricted to haplotypes of about 30 or fewer
SNP, since the amount of computer memory required be-
comes impracticably large beyond this point.
More recently, implementations based on Bayesian methods
have become available, such as Haplotyper (57) and the Phase
(46) package which is currently used in the IIPGA. Although
computationally more intensive than EM-based methods, we
have successfully applied Phase to haplotypes of more than
100 SNP. Both Haplotyper and Phase optionally perform miss-
ing value imputation, which is very important in order to
make best use of all available data. In practice, results from
sequencing or genotyping any given SNP are rarely 100%
complete; when multiple individual SNP are combined into
haplotypes, complete data is generally available from only a
small fraction of individuals from the sample.
Longstanding preliminary evidence is now supported by
more comprehensive studies which suggest that the human
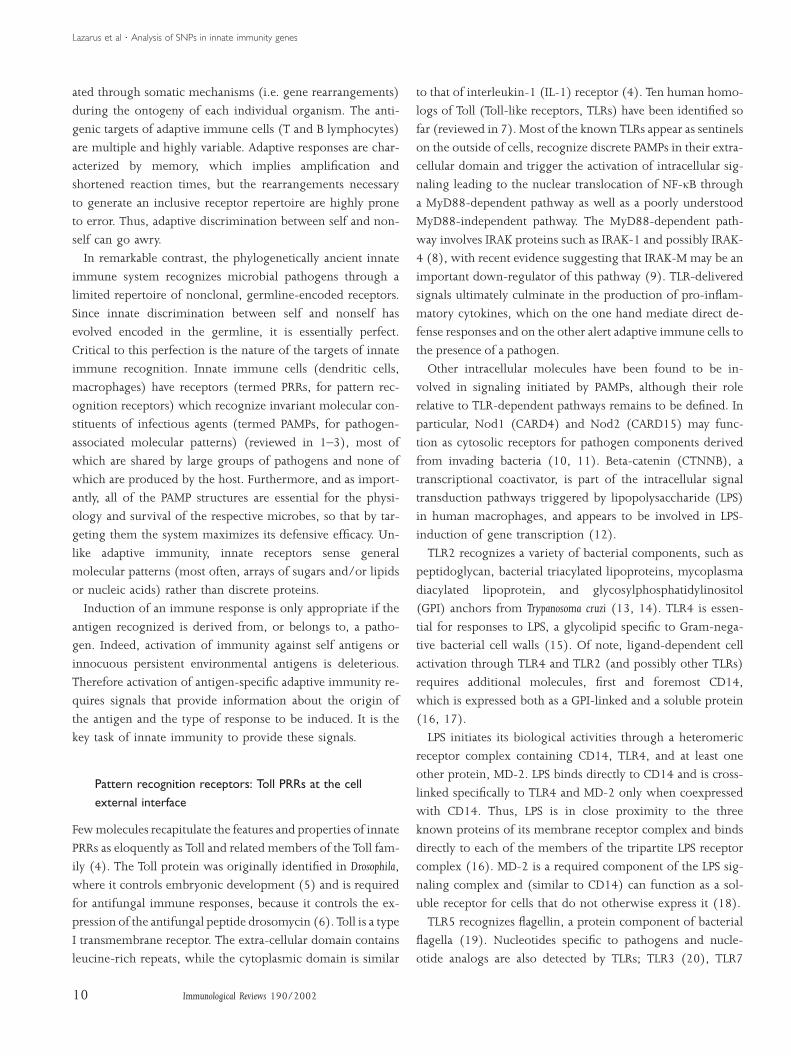
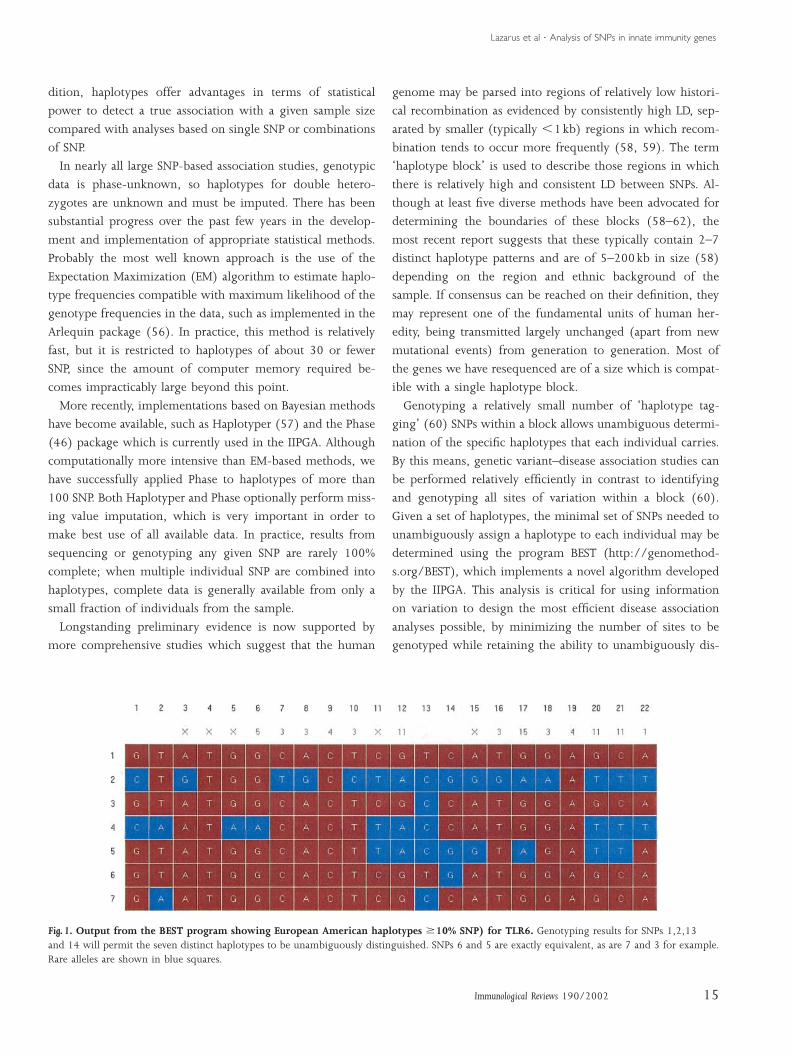
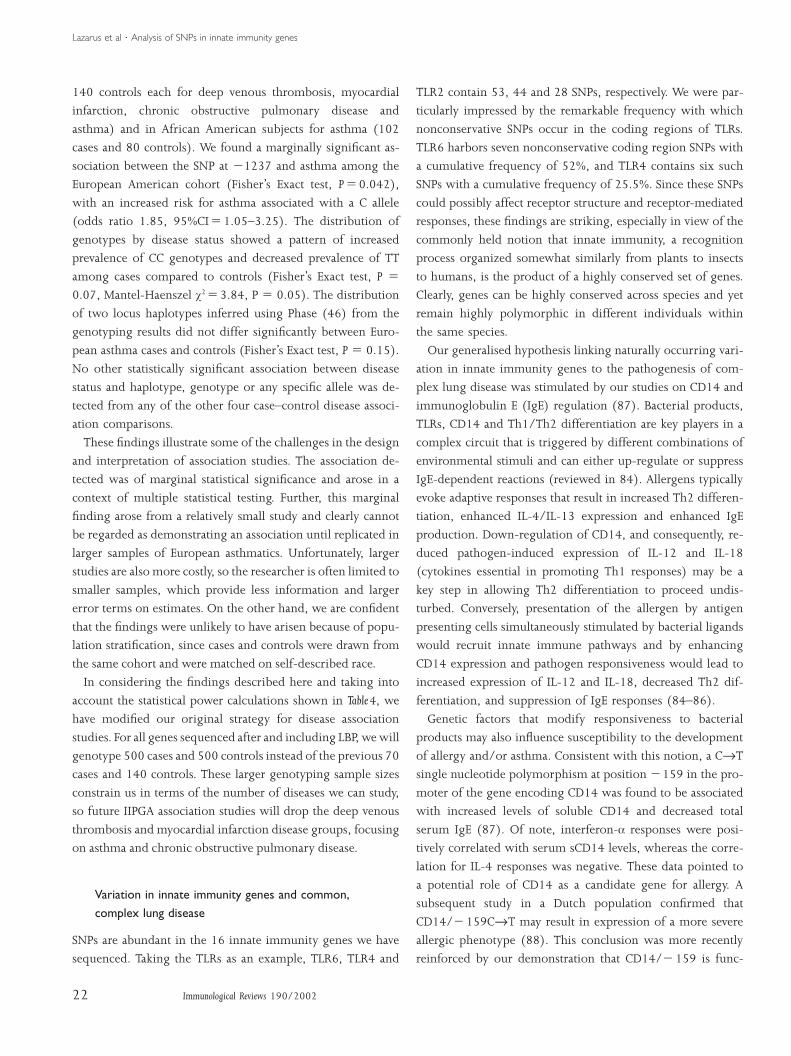
Fig. 1. Output from the BEST program showing European American haplotypes 10% SNP) for TLR6. Genotyping results for SNPs 1,2,13and 14 will permit the seven distinct haplotypes to be unambiguously distinguished. SNPs 6 and 5 are exactly equivalent, as are 7 and 3 for example.Rare alleles are shown in blue squares.
15Immunological Reviews 190/2002
genome may be parsed into regions of relatively low histori-
cal recombination as evidenced by consistently high LD, sep-
arated by smaller (typically 1kb) regions in which recom-
bination tends to occur more frequently (58, 59). The term
‘haplotype block’ is used to describe those regions in which
there is relatively high and consistent LD between SNPs. Al-
though at least five diverse methods have been advocated for
determining the boundaries of these blocks (58–62), the
most recent report suggests that these typically contain 2–7
distinct haplotype patterns and are of 5–200kb in size (58)
depending on the region and ethnic background of the
sample. If consensus can be reached on their definition, they
may represent one of the fundamental units of human her-
edity, being transmitted largely unchanged (apart from new
mutational events) from generation to generation. Most of
the genes we have resequenced are of a size which is compat-
ible with a single haplotype block.
Genotyping a relatively small number of ‘haplotype tag-
ging’ (60) SNPs within a block allows unambiguous determi-
nation of the specific haplotypes that each individual carries.
By this means, genetic variant–disease association studies can
be performed relatively efficiently in contrast to identifying
and genotyping all sites of variation within a block (60).
Given a set of haplotypes, the minimal set of SNPs needed to
unambiguously assign a haplotype to each individual may be
determined using the program BEST (http://genomethod-
s.org/BEST), which implements a novel algorithm developed
by the IIPGA. This analysis is critical for using information
on variation to design the most efficient disease association
analyses possible, by minimizing the number of sites to be
genotyped while retaining the ability to unambiguously dis-
Lazarus et al ¡ Analysis of SNPs in innate immunity genes
tinguish haplotypes. For European samples, this method gen-
erally identifies a subset of SNPs that should be genotyped,
that is, between a tenth and a third of the size of the entire
set of SNPs, leading to substantial savings in genotyping costs
without any loss of haplotype information.
As an example, Fig. 1 illustrates the output from BEST pack-
age for TLR6 haplotypes inferred by Phase for SNPs with rare
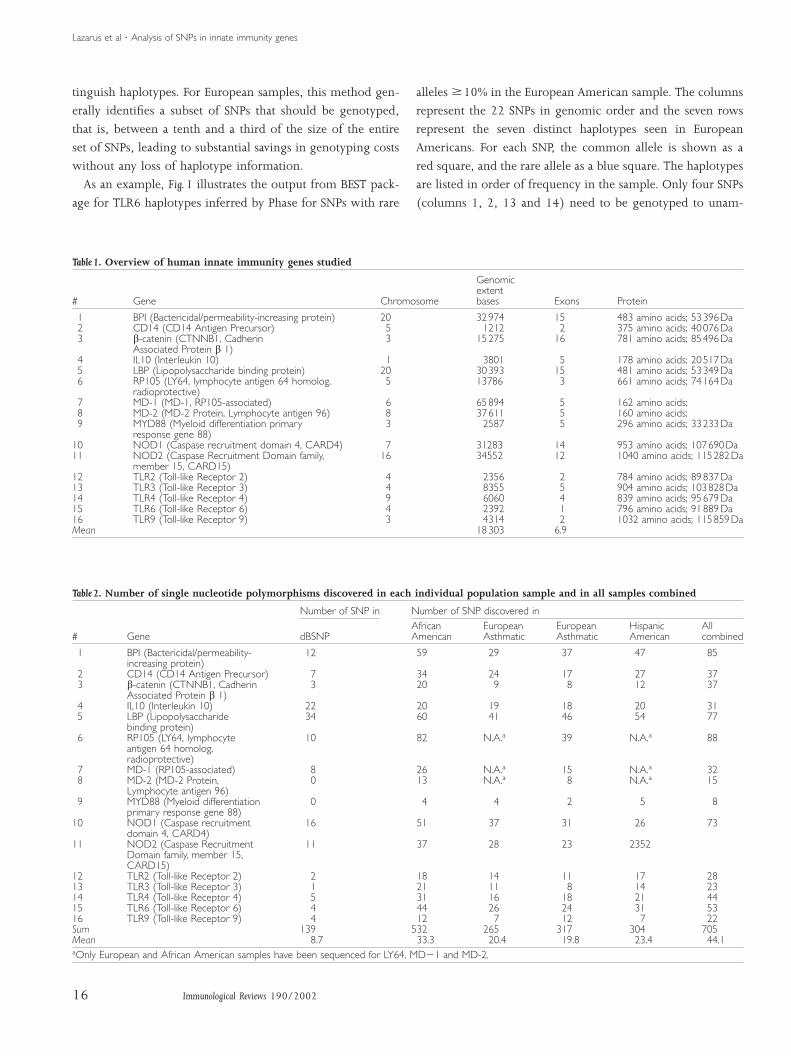
Table 1. Overview of human innate immunity genes studied
Genomicextent
. Gene Chromosome bases Exons Protein
1 BPI (Bactericidal/permeability-increasing protein) 20 32974 15 483 amino acids; 53396Da2 CD14 (CD14 Antigen Precursor) 5 1212 2 375 amino acids; 40076Da3 b-catenin (CTNNB1, Cadherin 3 15275 16 781 amino acids; 85496Da
Associated Protein b 1)4 IL10 (Interleukin 10) 1 3801 5 178 amino acids; 20517Da5 LBP (Lipopolysaccharide binding protein) 20 30393 15 481 amino acids; 53349Da6 RP105 (LY64, lymphocyte antigen 64 homolog, 5 13786 3 661 amino acids; 74164Da
radioprotective)7 MD-1 (MD-1, RP105-associated) 6 65894 5 162 amino acids;8 MD-2 (MD-2 Protein, Lymphocyte antigen 96) 8 37611 5 160 amino acids;9 MYD88 (Myeloid differentiation primary 3 2587 5 296 amino acids; 33233Da
response gene 88)10 NOD1 (Caspase recruitment domain 4, CARD4) 7 31283 14 953 amino acids; 107690Da11 NOD2 (Caspase Recruitment Domain family, 16 34552 12 1040 amino acids; 115282Da
member 15, CARD15)12 TLR2 (Toll-like Receptor 2) 4 2356 2 784 amino acids; 89837Da13 TLR3 (Toll-like Receptor 3) 4 8355 5 904 amino acids; 103828Da14 TLR4 (Toll-like Receptor 4) 9 6060 4 839 amino acids; 95679Da15 TLR6 (Toll-like Receptor 6) 4 2392 1 796 amino acids; 91889Da16 TLR9 (Toll-like Receptor 9) 3 4314 2 1032 amino acids; 115859DaMean 18303 6.9
Table 2. Number of single nucleotide polymorphisms discovered in each individual population sample and in all samples combined
Number of SNP in Number of SNP discovered inAfrican European European Hispanic All
. Gene dBSNP American Asthmatic Asthmatic American combined
1 BPI (Bactericidal/permeability- 12 59 29 37 47 85increasing protein)
2 CD14 (CD14 Antigen Precursor) 7 34 24 17 27 373 b-catenin (CTNNB1, Cadherin 3 20 9 8 12 37
Associated Protein b 1)4 IL10 (Interleukin 10) 22 20 19 18 20 315 LBP (Lipopolysaccharide 34 60 41 46 54 77
binding protein)6 RP105 (LY64, lymphocyte 10 82 N.A.a 39 N.A.a 88
antigen 64 homolog,radioprotective)
7 MD-1 (RP105-associated) 8 26 N.A.a 15 N.A.a 328 MD-2 (MD-2 Protein, 0 13 N.A.a 8 N.A.a 15
Lymphocyte antigen 96)9 MYD88 (Myeloid differentiation 0 4 4 2 5 8
primary response gene 88)10 NOD1 (Caspase recruitment 16 51 37 31 26 73
domain 4, CARD4)11 NOD2 (Caspase Recruitment 11 37 28 23 2352
Domain family, member 15,CARD15)
12 TLR2 (Toll-like Receptor 2) 2 18 14 11 17 2813 TLR3 (Toll-like Receptor 3) 1 21 11 8 14 2314 TLR4 (Toll-like Receptor 4) 5 31 16 18 21 4415 TLR6 (Toll-like Receptor 6) 4 44 26 24 31 5316 TLR9 (Toll-like Receptor 9) 4 12 7 12 7 22Sum 139 532 265 317 304 705Mean 8.7 33.3 20.4 19.8 23.4 44.1aOnly European and African American samples have been sequenced for LY64, MDª1 and MD-2.
16 Immunological Reviews 190/2002
alleles 10% in the European American sample. The columns
represent the 22 SNPs in genomic order and the seven rows
represent the seven distinct haplotypes seen in European
Americans. For each SNP, the common allele is shown as a
red square, and the rare allele as a blue square. The haplotypes
are listed in order of frequency in the sample. Only four SNPs
(columns 1, 2, 13 and 14) need to be genotyped to unam-
Lazarus et al ¡ Analysis of SNPs in innate immunity genes
biguously distinguish these seven haplotypes. This number
represents a substantial reduction (18 SNPs eliminated) in
genotyping costs without any loss of ability to discriminate
between haplotypes.
Describing variation: results from analysis of variation in16 innate immunity genes
A list of the 16 innate immunity genes which we have studied
to date is shown in Table 1. These genes are of medium size,
with a mean genomic extent of 18.3kb, although there is
wide variation. This size contrasts with a rather average pro-
tein size of 77163kDa, and it is likely due to the relatively
small number of exons in most of these genes, including
TLR6 which is encoded by a single exon of length 2.4kb.
A total of 705 SNP were discovered in the 16 genes among
all four population samples combined (Table 2). The mean
number of SNP per gene was highest in the African Ameri-
cans (3, 33) and smallest in the European Americans (8, 19).
In our analyses and for designing disease association studies,
we focus on more common SNPs, typically those with a rare
allele frequency of 10% or more, because of statistical power
considerations discussed below.
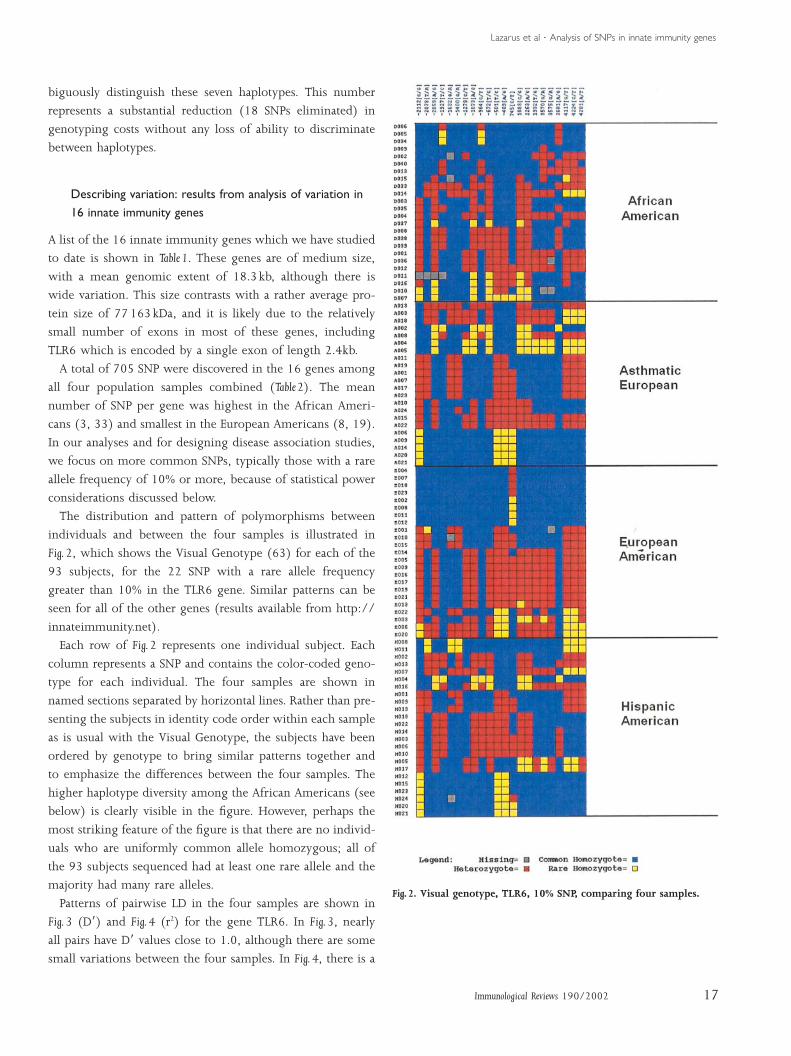
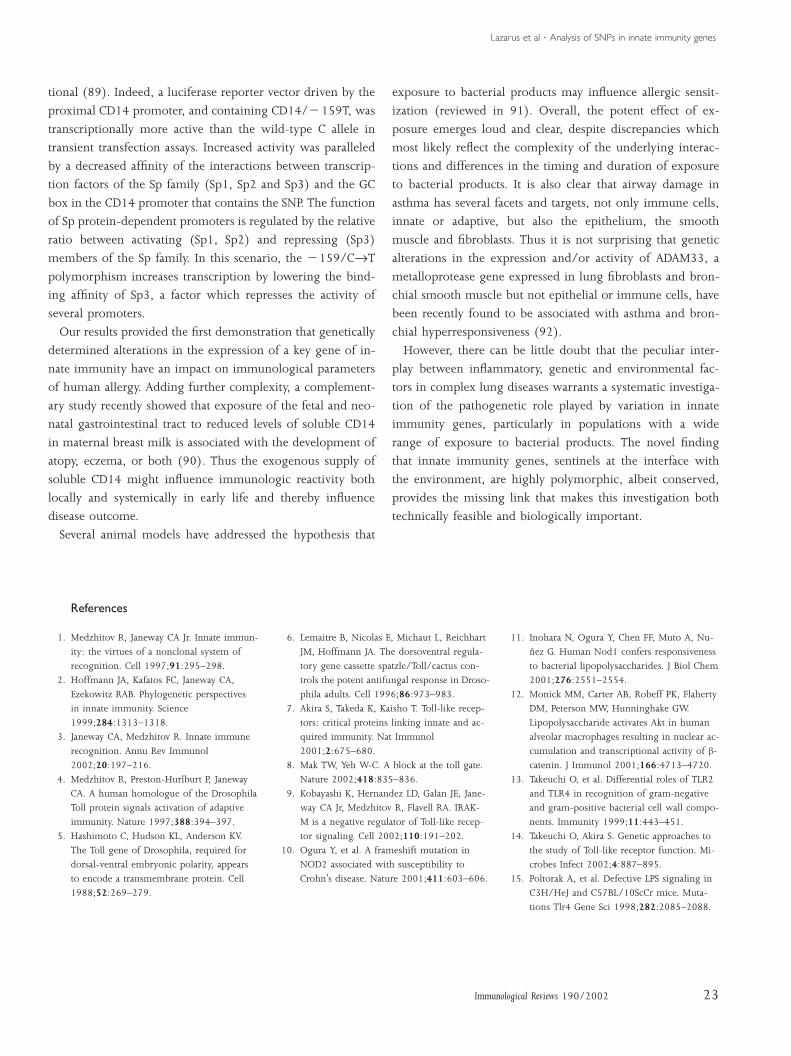
The distribution and pattern of polymorphisms between
individuals and between the four samples is illustrated in
Fig. 2, which shows the Visual Genotype (63) for each of the
93 subjects, for the 22 SNP with a rare allele frequency
greater than 10% in the TLR6 gene. Similar patterns can be
seen for all of the other genes (results available from http://
innateimmunity.net).
Each row of Fig. 2 represents one individual subject. Each
column represents a SNP and contains the color-coded geno-
type for each individual. The four samples are shown in
named sections separated by horizontal lines. Rather than pre-
senting the subjects in identity code order within each sample
as is usual with the Visual Genotype, the subjects have been
ordered by genotype to bring similar patterns together and
to emphasize the differences between the four samples. The
higher haplotype diversity among the African Americans (see
below) is clearly visible in the figure. However, perhaps the
most striking feature of the figure is that there are no individ-
uals who are uniformly common allele homozygous; all of
the 93 subjects sequenced had at least one rare allele and the
majority had many rare alleles.
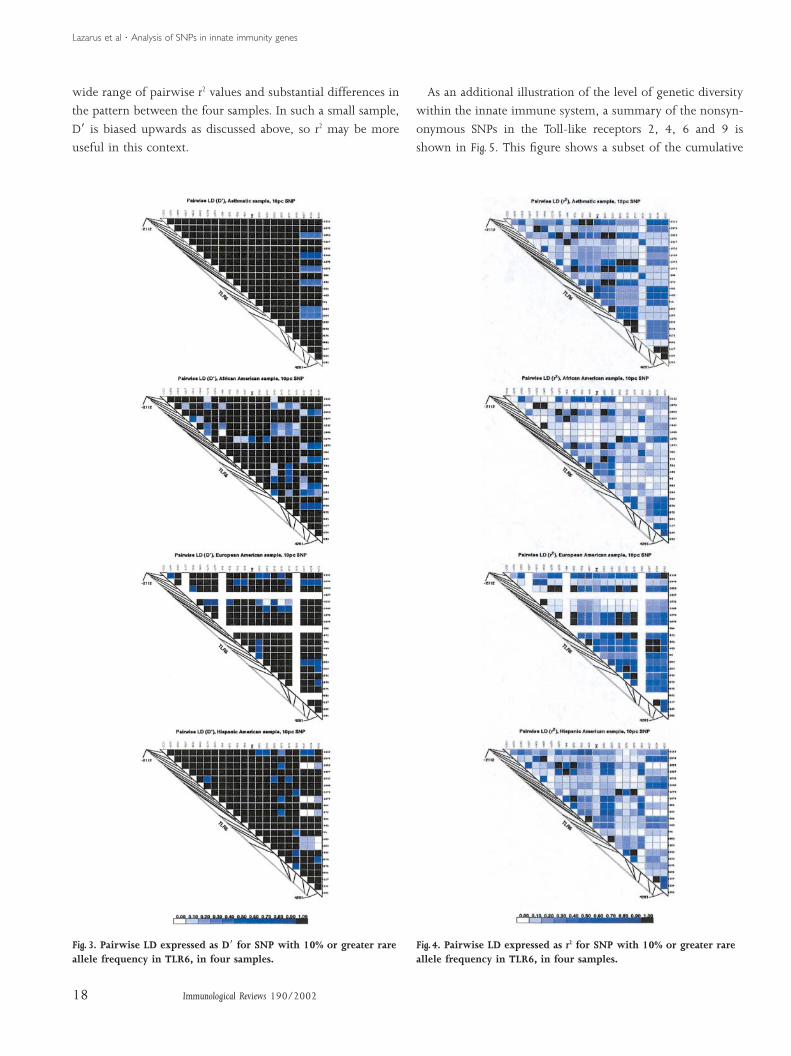
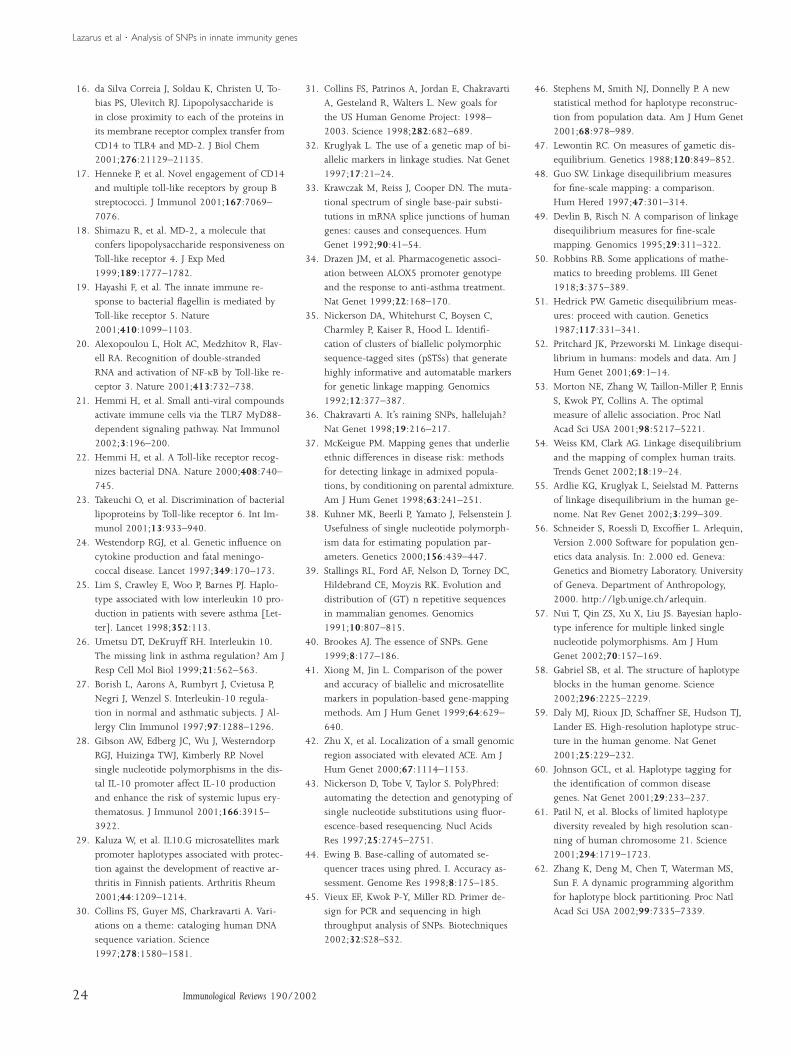
Patterns of pairwise LD in the four samples are shown in
Fig. 3 (Dƒ) and Fig. 4 (r2) for the gene TLR6. In Fig. 3, nearly
all pairs have Dƒ values close to 1.0, although there are some
small variations between the four samples. In Fig. 4, there is a
17Immunological Reviews 190/2002
Fig. 2. Visual genotype, TLR6, 10% SNP, comparing four samples.
Lazarus et al ¡ Analysis of SNPs in innate immunity genes
wide range of pairwise r2 values and substantial differences in
the pattern between the four samples. In such a small sample,
Dƒ is biased upwards as discussed above, so r2 may be more
useful in this context.
Fig. 3. Pairwise LD expressed as Dƒ for SNP with 10% or greater rareallele frequency in TLR6, in four samples.
18 Immunological Reviews 190/2002
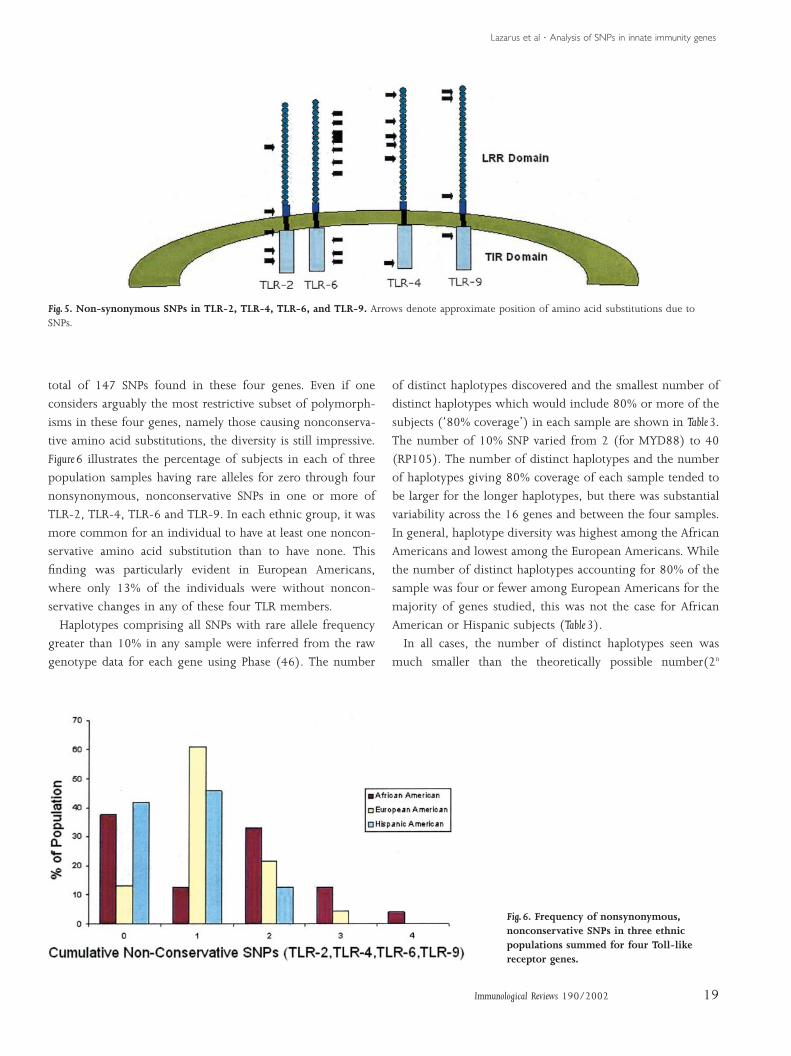
As an additional illustration of the level of genetic diversity
within the innate immune system, a summary of the nonsyn-
onymous SNPs in the Toll-like receptors 2, 4, 6 and 9 is
shown in Fig. 5. This figure shows a subset of the cumulative
Fig. 4. Pairwise LD expressed as r2 for SNP with 10% or greater rareallele frequency in TLR6, in four samples.
Lazarus et al ¡ Analysis of SNPs in innate immunity genes
Fig. 5. Non-synonymous SNPs in TLR-2, TLR-4, TLR-6, and TLR-9. Arrows denote approximate position of amino acid substitutions due toSNPs.
total of 147 SNPs found in these four genes. Even if one
considers arguably the most restrictive subset of polymorph-
isms in these four genes, namely those causing nonconserva-
tive amino acid substitutions, the diversity is still impressive.
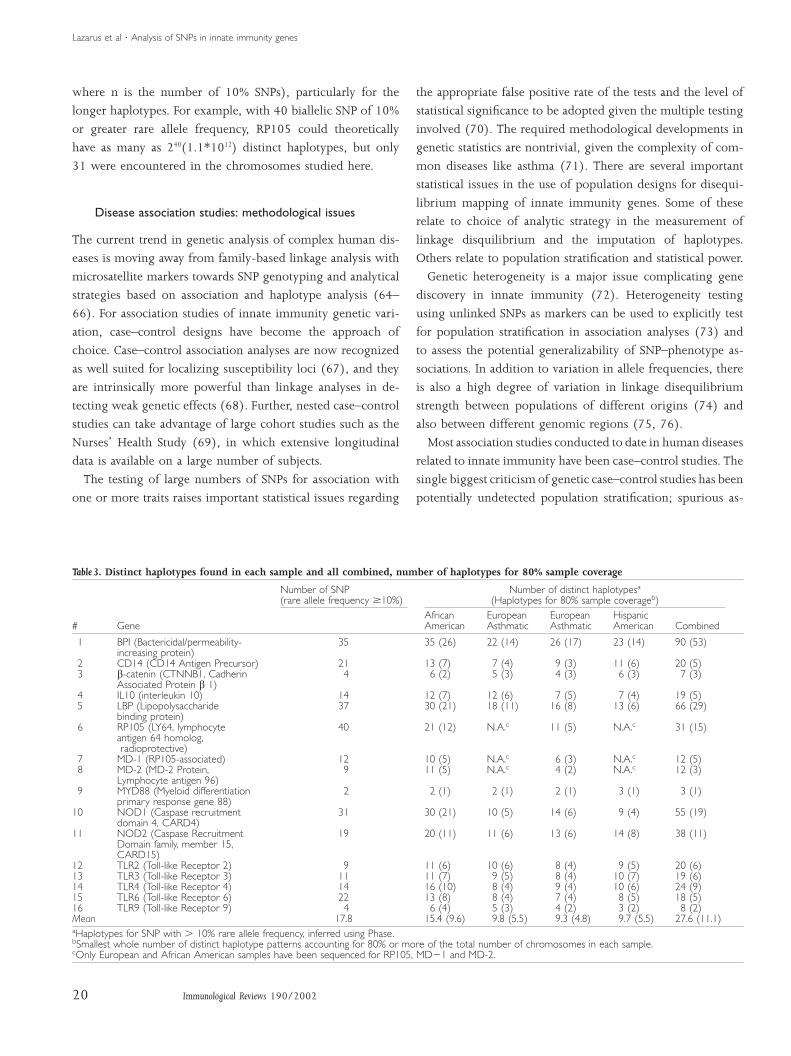
Figure 6 illustrates the percentage of subjects in each of three
population samples having rare alleles for zero through four
nonsynonymous, nonconservative SNPs in one or more of
TLR-2, TLR-4, TLR-6 and TLR-9. In each ethnic group, it was
more common for an individual to have at least one noncon-
servative amino acid substitution than to have none. This
finding was particularly evident in European Americans,
where only 13% of the individuals were without noncon-
servative changes in any of these four TLR members.
Haplotypes comprising all SNPs with rare allele frequency
greater than 10% in any sample were inferred from the raw
genotype data for each gene using Phase (46). The number
Fig. 6. Frequency of nonsynonymous,nonconservative SNPs in three ethnicpopulations summed for four Toll-likereceptor genes.
19Immunological Reviews 190/2002
of distinct haplotypes discovered and the smallest number of
distinct haplotypes which would include 80% or more of the
subjects (‘80% coverage’) in each sample are shown in Table 3.
The number of 10% SNP varied from 2 (for MYD88) to 40
(RP105). The number of distinct haplotypes and the number
of haplotypes giving 80% coverage of each sample tended to
be larger for the longer haplotypes, but there was substantial
variability across the 16 genes and between the four samples.
In general, haplotype diversity was highest among the African
Americans and lowest among the European Americans. While
the number of distinct haplotypes accounting for 80% of the
sample was four or fewer among European Americans for the
majority of genes studied, this was not the case for African
American or Hispanic subjects (Table 3).
In all cases, the number of distinct haplotypes seen was
much smaller than the theoretically possible number(2n
Lazarus et al ¡ Analysis of SNPs in innate immunity genes
where n is the number of 10% SNPs), particularly for the
longer haplotypes. For example, with 40 biallelic SNP of 10%
or greater rare allele frequency, RP105 could theoretically
have as many as 240(1.1*1012) distinct haplotypes, but only
31 were encountered in the chromosomes studied here.
Disease association studies: methodological issues
The current trend in genetic analysis of complex human dis-
eases is moving away from family-based linkage analysis with
microsatellite markers towards SNP genotyping and analytical
strategies based on association and haplotype analysis (64–
66). For association studies of innate immunity genetic vari-
ation, case–control designs have become the approach of
choice. Case–control association analyses are now recognized
as well suited for localizing susceptibility loci (67), and they
are intrinsically more powerful than linkage analyses in de-
tecting weak genetic effects (68). Further, nested case–control
studies can take advantage of large cohort studies such as the
Nurses’ Health Study (69), in which extensive longitudinal
data is available on a large number of subjects.
The testing of large numbers of SNPs for association with
one or more traits raises important statistical issues regarding
Table 3. Distinct haplotypes found in each sample and all combined, number of haplotypes for 80% sample coverage
Number of SNP Number of distinct haplotypesa
(rare allele frequency 10%) (Haplotypes for 80% sample coverageb)African European European Hispanic
. Gene American Asthmatic Asthmatic American Combined
1 BPI (Bactericidal/permeability- 35 35 (26) 22 (14) 26 (17) 23 (14) 90 (53)increasing protein)
2 CD14 (CD14 Antigen Precursor) 21 13 (7) 7 (4) 9 (3) 11 (6) 20 (5)3 b-catenin (CTNNB1, Cadherin 4 6 (2) 5 (3) 4 (3) 6 (3) 7 (3)
Associated Protein b 1)4 IL10 (interleukin 10) 14 12 (7) 12 (6) 7 (5) 7 (4) 19 (5)5 LBP (Lipopolysaccharide 37 30 (21) 18 (11) 16 (8) 13 (6) 66 (29)
binding protein)6 RP105 (LY64, lymphocyte 40 21 (12) N.A.c 11 (5) N.A.c 31 (15)
antigen 64 homolog,radioprotective)
7 MD-1 (RP105-associated) 12 10 (5) N.A.c 6 (3) N.A.c 12 (5)8 MD-2 (MD-2 Protein, 9 11 (5) N.A.c 4 (2) N.A.c 12 (3)
Lymphocyte antigen 96)9 MYD88 (Myeloid differentiation 2 2 (1) 2 (1) 2 (1) 3 (1) 3 (1)
primary response gene 88)10 NOD1 (Caspase recruitment 31 30 (21) 10 (5) 14 (6) 9 (4) 55 (19)
domain 4, CARD4)11 NOD2 (Caspase Recruitment 19 20 (11) 11 (6) 13 (6) 14 (8) 38 (11)
Domain family, member 15,CARD15)
12 TLR2 (Toll-like Receptor 2) 9 11 (6) 10 (6) 8 (4) 9 (5) 20 (6)13 TLR3 (Toll-like Receptor 3) 11 11 (7) 9 (5) 8 (4) 10 (7) 19 (6)14 TLR4 (Toll-like Receptor 4) 14 16 (10) 8 (4) 9 (4) 10 (6) 24 (9)15 TLR6 (Toll-like Receptor 6) 22 13 (8) 8 (4) 7 (4) 8 (5) 18 (5)16 TLR9 (Toll-like Receptor 9) 4 6 (4) 5 (3) 4 (2) 3 (2) 8 (2)Mean 17.8 15.4 (9.6) 9.8 (5.5) 9.3 (4.8) 9.7 (5.5) 27.6 (11.1)aHaplotypes for SNP with 10% rare allele frequency, inferred using Phase.bSmallest whole number of distinct haplotype patterns accounting for 80% or more of the total number of chromosomes in each sample.cOnly European and African American samples have been sequenced for RP105, MDª1 and MD-2.
20 Immunological Reviews 190/2002
the appropriate false positive rate of the tests and the level of
statistical significance to be adopted given the multiple testing
involved (70). The required methodological developments in
genetic statistics are nontrivial, given the complexity of com-
mon diseases like asthma (71). There are several important
statistical issues in the use of population designs for disequi-
librium mapping of innate immunity genes. Some of these
relate to choice of analytic strategy in the measurement of
linkage disquilibrium and the imputation of haplotypes.
Others relate to population stratification and statistical power.
Genetic heterogeneity is a major issue complicating gene
discovery in innate immunity (72). Heterogeneity testing
using unlinked SNPs as markers can be used to explicitly test
for population stratification in association analyses (73) and
to assess the potential generalizability of SNP–phenotype as-
sociations. In addition to variation in allele frequencies, there
is also a high degree of variation in linkage disequilibrium
strength between populations of different origins (74) and
also between different genomic regions (75, 76).
Most association studies conducted to date in human diseases
related to innate immunity have been case–control studies. The
single biggest criticism of genetic case–control studies has been
potentially undetected population stratification; spurious as-
Lazarus et al ¡ Analysis of SNPs in innate immunity genes
sociation may arise in a case-control study when allelic fre-
quencies vary across subpopulations, e.g. subjects from differ-
ent ethnic groups (77). Such population stratification may re-
sult from recent admixture or from poorly matched cases and
controls. Genotyping of random panels of SNPs can be used to
partition study populations into genetically homogeneous
groups. Methods have recently been developed to assess popu-
lation stratification and, if necessary, to correctly test for associ-
ation in the presence of such stratification (78–80). However,
systematic testing for population stratification and application
of these new statistical methods has yet to be incorporated into
most genetic association studies.
Growing experience with complex disease genetics has
made clear the need to restrict the type I error in genetic
studies (64, 81). Statistical power to detect a true association
is a particularly challenging issue for SNP-based association
studies of susceptibility loci for complex phenomena such as
innate immunity, which are heterogeneous and likely to in-
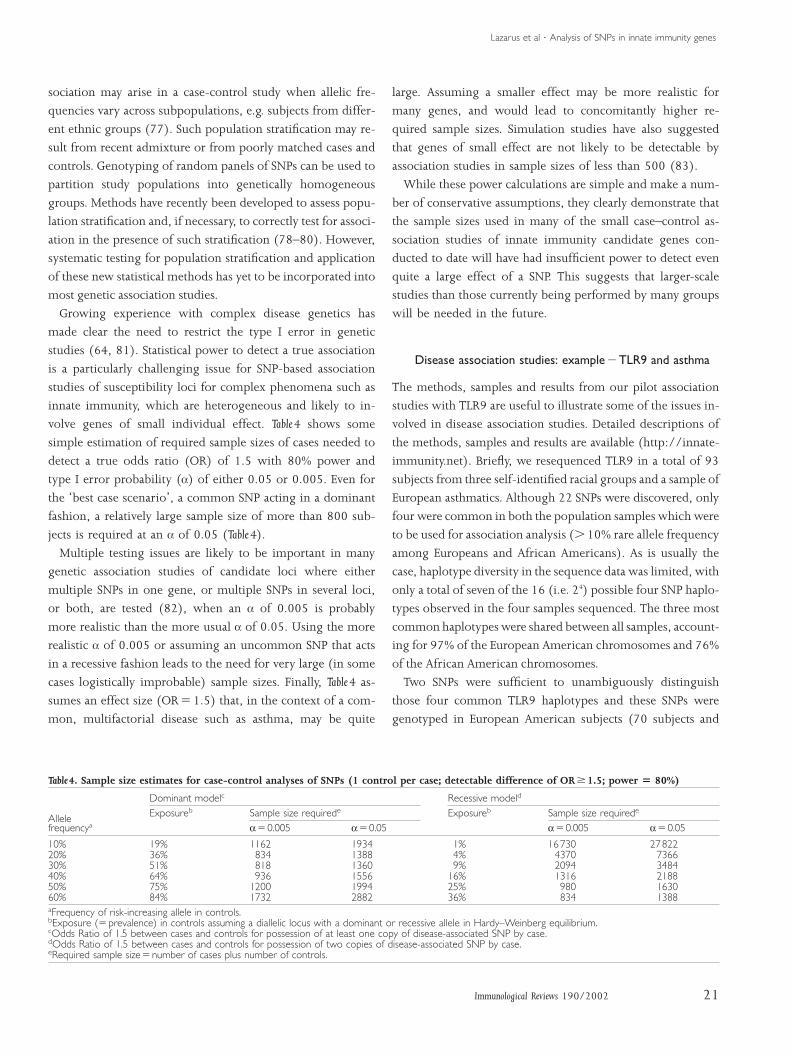
volve genes of small individual effect. Table 4 shows some
simple estimation of required sample sizes of cases needed to
detect a true odds ratio (OR) of 1.5 with 80% power and
type I error probability (a) of either 0.05 or 0.005. Even for
the ‘best case scenario’, a common SNP acting in a dominant
fashion, a relatively large sample size of more than 800 sub-
jects is required at an a of 0.05 (Table 4).
Multiple testing issues are likely to be important in many
genetic association studies of candidate loci where either
multiple SNPs in one gene, or multiple SNPs in several loci,
or both, are tested (82), when an a of 0.005 is probably
more realistic than the more usual a of 0.05. Using the more
realistic a of 0.005 or assuming an uncommon SNP that acts
in a recessive fashion leads to the need for very large (in some
cases logistically improbable) sample sizes. Finally, Table 4 as-
sumes an effect size (ORΩ1.5) that, in the context of a com-
mon, multifactorial disease such as asthma, may be quite
Table 4. Sample size estimates for case-control analyses of SNPs (1 control per case; detectable difference of OR 1.5; power Ω 80%)
Dominant modelc Recessive modeld
Allele Exposureb Sample size requirede Exposureb Sample size requirede
frequencya a Ω0.005 a Ω0.05 a Ω0.005 a Ω0.05
10% 19% 1162 1934 1% 16730 2782220% 36% 834 1388 4% 4370 736630% 51% 818 1360 9% 2094 348440% 64% 936 1556 16% 1316 218850% 75% 1200 1994 25% 980 163060% 84% 1732 2882 36% 834 1388aFrequency of risk-increasing allele in controls.bExposure (Ωprevalence) in controls assuming a diallelic locus with a dominant or recessive allele in Hardy–Weinberg equilibrium.cOdds Ratio of 1.5 between cases and controls for possession of at least one copy of disease-associated SNP by case.dOdds Ratio of 1.5 between cases and controls for possession of two copies of disease-associated SNP by case.eRequired sample sizeΩnumber of cases plus number of controls.
21Immunological Reviews 190/2002
large. Assuming a smaller effect may be more realistic for
many genes, and would lead to concomitantly higher re-
quired sample sizes. Simulation studies have also suggested
that genes of small effect are not likely to be detectable by
association studies in sample sizes of less than 500 (83).
While these power calculations are simple and make a num-
ber of conservative assumptions, they clearly demonstrate that
the sample sizes used in many of the small case–control as-
sociation studies of innate immunity candidate genes con-
ducted to date will have had insufficient power to detect even
quite a large effect of a SNP. This suggests that larger-scale
studies than those currently being performed by many groups
will be needed in the future.
Disease association studies: exampleªTLR9 and asthma
The methods, samples and results from our pilot association
studies with TLR9 are useful to illustrate some of the issues in-
volved in disease association studies. Detailed descriptions of
the methods, samples and results are available (http://innate-
immunity.net). Briefly, we resequenced TLR9 in a total of 93
subjects from three self-identified racial groups and a sample of
European asthmatics. Although 22 SNPs were discovered, only
four were common in both the population samples which were
to be used for association analysis (10% rare allele frequency
among Europeans and African Americans). As is usually the
case, haplotype diversity in the sequence data was limited, with
only a total of seven of the 16 (i.e. 24) possible four SNP haplo-
types observed in the four samples sequenced. The three most
common haplotypes were shared between all samples, account-
ing for 97% of the European American chromosomes and 76%
of the African American chromosomes.
Two SNPs were sufficient to unambiguously distinguish
those four common TLR9 haplotypes and these SNPs were
genotyped in European American subjects (70 subjects and
Lazarus et al ¡ Analysis of SNPs in innate immunity genes
140 controls each for deep venous thrombosis, myocardial
infarction, chronic obstructive pulmonary disease and
asthma) and in African American subjects for asthma (102
cases and 80 controls). We found a marginally significant as-
sociation between the SNP at ª1237 and asthma among the
European American cohort (Fisher’s Exact test, P Ω0.042),
with an increased risk for asthma associated with a C allele
(odds ratio 1.85, 95%CIΩ1.05–3.25). The distribution of
genotypes by disease status showed a pattern of increased
prevalence of CC genotypes and decreased prevalence of TT
among cases compared to controls (Fisher’s Exact test, P Ω0.07, Mantel-Haenszel c2 Ω3.84, P Ω 0.05). The distribution
of two locus haplotypes inferred using Phase (46) from the
genotyping results did not differ significantly between Euro-
pean asthma cases and controls (Fisher’s Exact test, P Ω 0.15).
No other statistically significant association between disease
status and haplotype, genotype or any specific allele was de-
tected from any of the other four case–control disease associ-
ation comparisons.
These findings illustrate some of the challenges in the design
and interpretation of association studies. The association de-
tected was of marginal statistical significance and arose in a
context of multiple statistical testing. Further, this marginal
finding arose from a relatively small study and clearly cannot
be regarded as demonstrating an association until replicated in
larger samples of European asthmatics. Unfortunately, larger
studies are also more costly, so the researcher is often limited to
smaller samples, which provide less information and larger
error terms on estimates. On the other hand, we are confident
that the findings were unlikely to have arisen because of popu-
lation stratification, since cases and controls were drawn from
the same cohort and were matched on self-described race.
In considering the findings described here and taking into
account the statistical power calculations shown in Table 4, we
have modified our original strategy for disease association
studies. For all genes sequenced after and including LBP, we will
genotype 500 cases and 500 controls instead of the previous 70
cases and 140 controls. These larger genotyping sample sizes
constrain us in terms of the number of diseases we can study,
so future IIPGA association studies will drop the deep venous
thrombosis and myocardial infarction disease groups, focusing
on asthma and chronic obstructive pulmonary disease.
Variation in innate immunity genes and common,complex lung disease
SNPs are abundant in the 16 innate immunity genes we have
sequenced. Taking the TLRs as an example, TLR6, TLR4 and
22 Immunological Reviews 190/2002
TLR2 contain 53, 44 and 28 SNPs, respectively. We were par-
ticularly impressed by the remarkable frequency with which
nonconservative SNPs occur in the coding regions of TLRs.
TLR6 harbors seven nonconservative coding region SNPs with
a cumulative frequency of 52%, and TLR4 contains six such
SNPs with a cumulative frequency of 25.5%. Since these SNPs
could possibly affect receptor structure and receptor-mediated
responses, these findings are striking, especially in view of the
commonly held notion that innate immunity, a recognition
process organized somewhat similarly from plants to insects
to humans, is the product of a highly conserved set of genes.
Clearly, genes can be highly conserved across species and yet
remain highly polymorphic in different individuals within
the same species.
Our generalised hypothesis linking naturally occurring vari-
ation in innate immunity genes to the pathogenesis of com-
plex lung disease was stimulated by our studies on CD14 and
immunoglobulin E (IgE) regulation (87). Bacterial products,
TLRs, CD14 and Th1/Th2 differentiation are key players in a
complex circuit that is triggered by different combinations of
environmental stimuli and can either up-regulate or suppress
IgE-dependent reactions (reviewed in 84). Allergens typically
evoke adaptive responses that result in increased Th2 differen-
tiation, enhanced IL-4/IL-13 expression and enhanced IgE
production. Down-regulation of CD14, and consequently, re-
duced pathogen-induced expression of IL-12 and IL-18
(cytokines essential in promoting Th1 responses) may be a
key step in allowing Th2 differentiation to proceed undis-
turbed. Conversely, presentation of the allergen by antigen
presenting cells simultaneously stimulated by bacterial ligands
would recruit innate immune pathways and by enhancing
CD14 expression and pathogen responsiveness would lead to
increased expression of IL-12 and IL-18, decreased Th2 dif-
ferentiation, and suppression of IgE responses (84–86).
Genetic factors that modify responsiveness to bacterial
products may also influence susceptibility to the development
of allergy and/or asthma. Consistent with this notion, a C»T
single nucleotide polymorphism at position ª159 in the pro-
moter of the gene encoding CD14 was found to be associated
with increased levels of soluble CD14 and decreased total
serum IgE (87). Of note, interferon-a responses were posi-
tively correlated with serum sCD14 levels, whereas the corre-
lation for IL-4 responses was negative. These data pointed to
a potential role of CD14 as a candidate gene for allergy. A
subsequent study in a Dutch population confirmed that
CD14/ª159C»T may result in expression of a more severe
allergic phenotype (88). This conclusion was more recently
reinforced by our demonstration that CD14/ª159 is func-
Lazarus et al ¡ Analysis of SNPs in innate immunity genes
tional (89). Indeed, a luciferase reporter vector driven by the
proximal CD14 promoter, and containing CD14/ª159T, was
transcriptionally more active than the wild-type C allele in
transient transfection assays. Increased activity was paralleled
by a decreased affinity of the interactions between transcrip-
tion factors of the Sp family (Sp1, Sp2 and Sp3) and the GC
box in the CD14 promoter that contains the SNP. The function
of Sp protein-dependent promoters is regulated by the relative
ratio between activating (Sp1, Sp2) and repressing (Sp3)
members of the Sp family. In this scenario, the ª159/C»T
polymorphism increases transcription by lowering the bind-
ing affinity of Sp3, a factor which represses the activity of
several promoters.
Our results provided the first demonstration that genetically
determined alterations in the expression of a key gene of in-
nate immunity have an impact on immunological parameters
of human allergy. Adding further complexity, a complement-
ary study recently showed that exposure of the fetal and neo-
natal gastrointestinal tract to reduced levels of soluble CD14
in maternal breast milk is associated with the development of
atopy, eczema, or both (90). Thus the exogenous supply of
soluble CD14 might influence immunologic reactivity both
locally and systemically in early life and thereby influence
disease outcome.
Several animal models have addressed the hypothesis that
References
1. 6. 11.Medzhitov R, Janeway CA Jr. Innate immun- Lemaitre B, Nicolas E, Michaut L, Reichhart Inohara N, Ogura Y, Chen FF, Muto A, Nu-ity: the virtues of a nonclonal system of JM, Hoffmann JA. The dorsoventral regula- nez G. Human Nod1 confers responsivenessrecognition. Cell 1997;91:295–298. tory gene cassette spatzle/Toll/cactus con- to bacterial lipopolysaccharides. J Biol Chem
2. trols the potent antifungal response in Droso-Hoffmann JA, Kafatos FC, Janeway CA, 2001;276:2551–2554.Ezekowitz RAB. Phylogenetic perspectives phila adults. Cell 1996;86:973–983. 12. Monick MM, Carter AB, Robeff PK, Flahertyin innate immunity. Science 7. Akira S, Takeda K, Kaisho T. Toll-like recep- DM, Peterson MW, Hunninghake GW.1999;284:1313–1318. tors: critical proteins linking innate and ac- Lipopolysaccharide activates Akt in human
3. quired immunity. Nat ImmunolJaneway CA, Medzhitov R. Innate immune alveolar macrophages resulting in nuclear ac-recognition. Annu Rev Immunol 2001;2:675–680. cumulation and transcriptional activity of b-2002;20:197–216. 8. Mak TW, Yeh W-C. A block at the toll gate. catenin. J Immunol 2001;166:4713–4720.
4. Nature 2002;418:835–836.Medzhitov R, Preston-Hurlburt P, Janeway 13. Takeuchi O, et al. Differential roles of TLR2CA. A human homologue of the Drosophila 9. Kobayashi K, Hernandez LD, Galan JE, Jane- and TLR4 in recognition of gram-negativeToll protein signals activation of adaptive way CA Jr, Medzhitov R, Flavell RA. IRAK- and gram-positive bacterial cell wall compo-immunity. Nature 1997;388:394–397. M is a negative regulator of Toll-like recep- nents. Immunity 1999;11:443–451.
5. tor signaling. Cell 2002;110:191–202.Hashimoto C, Hudson KL, Anderson KV. 14. Takeuchi O, Akira S. Genetic approaches toThe Toll gene of Drosophila, required for 10. Ogura Y, et al. A frameshift mutation in the study of Toll-like receptor function. Mi-dorsal-ventral embryonic polarity, appears NOD2 associated with susceptibility to crobes Infect 2002;4:887–895.to encode a transmembrane protein. Cell Crohn’s disease. Nature 2001;411:603–606. 15. Poltorak A, et al. Defective LPS signaling in1988;52:269–279. C3H/HeJ and C57BL/10ScCr mice. Muta-
tions Tlr4 Gene Sci 1998;282:2085–2088.
23Immunological Reviews 190/2002
exposure to bacterial products may influence allergic sensit-
ization (reviewed in 91). Overall, the potent effect of ex-
posure emerges loud and clear, despite discrepancies which
most likely reflect the complexity of the underlying interac-
tions and differences in the timing and duration of exposure
to bacterial products. It is also clear that airway damage in
asthma has several facets and targets, not only immune cells,
innate or adaptive, but also the epithelium, the smooth
muscle and fibroblasts. Thus it is not surprising that genetic
alterations in the expression and/or activity of ADAM33, a
metalloprotease gene expressed in lung fibroblasts and bron-
chial smooth muscle but not epithelial or immune cells, have
been recently found to be associated with asthma and bron-
chial hyperresponsiveness (92).
However, there can be little doubt that the peculiar inter-
play between inflammatory, genetic and environmental fac-
tors in complex lung diseases warrants a systematic investiga-
tion of the pathogenetic role played by variation in innate
immunity genes, particularly in populations with a wide
range of exposure to bacterial products. The novel finding
that innate immunity genes, sentinels at the interface with
the environment, are highly polymorphic, albeit conserved,
provides the missing link that makes this investigation both
technically feasible and biologically important.
Lazarus et al ¡ Analysis of SNPs in innate immunity genes
16. 31. 46.da Silva Correia J, Soldau K, Christen U, To- Collins FS, Patrinos A, Jordan E, Chakravarti Stephens M, Smith NJ, Donnelly P. A newbias PS, Ulevitch RJ. Lipopolysaccharide is A, Gesteland R, Walters L. New goals for statistical method for haplotype reconstruc-in close proximity to each of the proteins in the US Human Genome Project: 1998– tion from population data. Am J Hum Genetits membrane receptor complex transfer from 2003. Science 1998;282:682–689. 2001;68:978–989.CD14 to TLR4 and MD-2. J Biol Chem 32. Kruglyak L. The use of a genetic map of bi- 47. Lewontin RC. On measures of gametic dis-2001;276:21129–21135. allelic markers in linkage studies. Nat Genet equilibrium. Genetics 1988;120:849–852.
17. 1997;17:21–24.Henneke P, et al. Novel engagement of CD14 48. Guo SW. Linkage disequilibrium measuresand multiple toll-like receptors by group B 33. Krawczak M, Reiss J, Cooper DN. The muta- for fine-scale mapping: a comparison.streptococci. J Immunol 2001;167:7069– tional spectrum of single base-pair substi- Hum Hered 1997;47:301–314.7076. tutions in mRNA splice junctions of human 49. Devlin B, Risch N. A comparison of linkage
18. genes: causes and consequences. HumShimazu R, et al. MD-2, a molecule that disequilibrium measures for fine-scaleconfers lipopolysaccharide responsiveness on Genet 1992;90:41–54. mapping. Genomics 1995;29:311–322.Toll-like receptor 4. J Exp Med 34. Drazen JM, et al. Pharmacogenetic associ- 50. Robbins RB. Some applications of mathe-1999;189:1777–1782. ation between ALOX5 promoter genotype matics to breeding problems. III Genet
19. and the response to anti-asthma treatment.Hayashi F, et al. The innate immune re- 1918;3:375–389.sponse to bacterial flagellin is mediated by Nat Genet 1999;22:168–170. 51. Hedrick PW. Gametic disequilibrium meas-Toll-like receptor 5. Nature 35. Nickerson DA, Whitehurst C, Boysen C, ures: proceed with caution. Genetics2001;410:1099–1103. Charmley P, Kaiser R, Hood L. Identifi- 1987;117:331–341.
20. cation of clusters of biallelic polymorphicAlexopoulou L, Holt AC, Medzhitov R, Flav- 52. Pritchard JK, Przeworski M. Linkage disequi-ell RA. Recognition of double-stranded sequence-tagged sites (pSTSs) that generate librium in humans: models and data. Am JRNA and activation of NF-kB by Toll-like re- highly informative and automatable markers Hum Genet 2001;69:1–14.ceptor 3. Nature 2001;413:732–738. for genetic linkage mapping. Genomics 53. Morton NE, Zhang W, Taillon-Miller P, Ennis
21. 1992;12:377–387.Hemmi H, et al. Small anti-viral compounds S, Kwok PY, Collins A. The optimalactivate immune cells via the TLR7 MyD88- 36. Chakravarti A. It’s raining SNPs, hallelujah? measure of allelic association. Proc Natldependent signaling pathway. Nat Immunol Nat Genet 1998;19:216–217. Acad Sci USA 2001;98:5217–5221.2002;3:196–200. 37. McKeigue PM. Mapping genes that underlie 54. Weiss KM, Clark AG. Linkage disequilibrium
22. ethnic differences in disease risk: methodsHemmi H, et al. A Toll-like receptor recog- and the mapping of complex human traits.nizes bacterial DNA. Nature 2000;408:740– for detecting linkage in admixed popula- Trends Genet 2002;18:19–24.745. tions, by conditioning on parental admixture. 55. Ardlie KG, Kruglyak L, Seielstad M. Patterns
23. Am J Hum Genet 1998;63:241–251.Takeuchi O, et al. Discrimination of bacterial of linkage disequilibrium in the human ge-lipoproteins by Toll-like receptor 6. Int Im- 38. Kuhner MK, Beerli P, Yamato J, Felsenstein J. nome. Nat Rev Genet 2002;3:299–309.munol 2001;13:933–940. Usefulness of single nucleotide polymorph- 56. Schneider S, Roessli D, Excoffier L. Arlequin,
24. ism data for estimating population par-Westendorp RGJ, et al. Genetic influence on Version 2.000 Software for population gen-cytokine production and fatal meningo- ameters. Genetics 2000;156:439–447. etics data analysis. In: 2.000 ed. Geneva:coccal disease. Lancet 1997;349:170–173. 39. Stallings RL, Ford AF, Nelson D, Torney DC, Genetics and Biometry Laboratory. University
25. Hildebrand CE, Moyzis RK. Evolution andLim S, Crawley E, Woo P, Barnes PJ. Haplo- of Geneva. Department of Anthropology,type associated with low interleukin 10 pro- distribution of (GT) n repetitive sequences 2000. http://lgb.unige.ch/arlequin.duction in patients with severe asthma [Let- in mammalian genomes. Genomics 57. Nui T, Qin ZS, Xu X, Liu JS. Bayesian haplo-ter]. Lancet 1998;352:113. 1991;10:807–815. type inference for multiple linked single
26. 40. nucleotide polymorphisms. Am J HumUmetsu DT, DeKruyff RH. Interleukin 10. Brookes AJ. The essence of SNPs. GeneThe missing link in asthma regulation? Am J 1999;8:177–186. Genet 2002;70:157–169.Resp Cell Mol Biol 1999;21:562–563. 41. Xiong M, Jin L. Comparison of the power 58. Gabriel SB, et al. The structure of haplotype
27. and accuracy of biallelic and microsatelliteBorish L, Aarons A, Rumbyrt J, Cvietusa P, blocks in the human genome. ScienceNegri J, Wenzel S. Interleukin-10 regula- markers in population-based gene-mapping 2002;296:2225–2229.tion in normal and asthmatic subjects. J Al- methods. Am J Hum Genet 1999;64:629– 59. Daly MJ, Rioux JD, Schaffner SE, Hudson TJ,lergy Clin Immunol 1997;97:1288–1296. 640. Lander ES. High-resolution haplotype struc-
28. 42. ture in the human genome. Nat GenetGibson AW, Edberg JC, Wu J, Westerndorp Zhu X, et al. Localization of a small genomicRGJ, Huizinga TWJ, Kimberly RP. Novel region associated with elevated ACE. Am J 2001;25:229–232.single nucleotide polymorphisms in the dis- Hum Genet 2000;67:1114–1153. 60. Johnson GCL, et al. Haplotype tagging fortal IL-10 promoter affect IL-10 production 43. Nickerson D, Tobe V, Taylor S. PolyPhred: the identification of common diseaseand enhance the risk of systemic lupus ery- automating the detection and genotyping of genes. Nat Genet 2001;29:233–237.thematosus. J Immunol 2001;166:3915– single nucleotide substitutions using fluor- 61. Patil N, et al. Blocks of limited haplotype3922. escence-based resequencing. Nucl Acids diversity revealed by high resolution scan-
29. Res 1997;25:2745–2751.Kaluza W, et al. IL10.G microsatellites mark ning of human chromosome 21. Sciencepromoter haplotypes associated with protec- 44. Ewing B. Base-calling of automated se- 2001;294:1719–1723.tion against the development of reactive ar- quencer traces using phred. I. Accuracy as- 62. Zhang K, Deng M, Chen T, Waterman MS,thritis in Finnish patients. Arthritis Rheum sessment. Genome Res 1998;8:175–185. Sun F. A dynamic programming algorithm2001;44:1209–1214. 45. Vieux EF, Kwok P-Y, Miller RD. Primer de- for haplotype block partitioning. Proc Natl
30. sign for PCR and sequencing in highCollins FS, Guyer MS, Charkravarti A. Vari- Acad Sci USA 2002;99:7335–7339.ations on a theme: cataloging human DNA throughput analysis of SNPs. Biotechniquessequence variation. Science 2002;32:S28–S32.1997;278:1580–1581.
24 Immunological Reviews 190/2002
Lazarus et al ¡ Analysis of SNPs in innate immunity genes
63. 73. 83.Nickerson DA, et al. DNA sequence diversity Roewer L, et al. A new method for the evalu- Long AD, Langley CH. The power of associ-in a 9.7-kb region of the human lipopro- ation of matches in non-recombining ge- ation studies to detect the contribution oftein lipase gene. Nature Genet nomes: application to Y-chromosomal short candidate genetic loci to variation in com-1998;19:233–240. tandem repeat (STR) haplotypes in European plex traits. Genome Res 1999;9:720–731.
64. males. Forensic Sci Int 2000;114:31–43.Risch NJ. Searching for genetic determinants 84. Vercelli D. The functional genomics of CD14in the new millennium. Nature 74. Zavattari P, et al. Major factors influencing and IgE-mediated disease: An integrated2000;405:847–856. linkage disequilibrium by analysis of dif- view. J Allergy Clin Immunol 2002;109:14–
65. ferent chromosome regions in distinctSchork NJ, Fallin D, Lanchbury JS. Single nu- 21.cleotide polymorphisms and the future of populations: demography, chromosome re- 85. Vercelli D, Baldini M, Martinez F. The mono-genetic epidemiology. Clin Genet combination frequency and selection. Hum cyte/IgE connection: May polymorphisms2000;58:250–264. Mol Genet 2000;9:2947–2957. in the CD14 gene teach us about IgE regula-
66. 75. tion? Int Arch Allergy ImmunolPalmer LJ, Cookson WOCM. Using single Watkins WS, et al. Linkage disequilibriumnucleotide polymorphisms (SNPs) as a means patterns vary with chromosomal location: 2001;124:20–24.to understanding the pathophysiology of a case study from the von Willebrand factor 86. Vercelli D, Baldini M, Stern D, Lohman IC,asthma. Resp Res 2001;2:102–112. region. Am J Hum Genet 1994;55:348–355. Halonen M, Martinez F. CD14: a bridge be-
67. 76. tween innate immunity and adaptive IgE re-Silverman EK, Palmer LJ. Case–control as- Jorde LB, et al. Linkage disequilibrium pre-sociation studies for the genetics of com- dicts physical distance in the adenomatous sponses. J Endotoxin Res 2001;7:45–48.plex respiratory diseases. Am J Respir Cell polyposis coli region. Am J Hum Genet 87. Baldini M, Lohman IC, Halonen M, EricksonMol Biol 2000;22:645–648. 1994;54:884–898. RP, Holt PG, Martinez FD. A polymorphism
68. 77. in the 5ƒ flanking region of the CD14 geneElston R. The genetic dissection of multifac- Ewens W, Spielman R. The transmission/torial traits. Clin Exp Allergy 1995;2:103– disequilibrium test: history, subdivision, is associated with circulating soluble CD14106. admixture. Am J Hum Genet 1995;57:455– levels and with total serum IgE. Am J Respir
69. 464.Colditz GA, Manson JE, Hankinson SE. The Cell Mol Biol 1999;20:976–983.Nurses’ Health Study: 20-year contribution 78. Pritchard JK, Rosenberg NA. Use of un- 88. Koppelman GH, et al. Association of a pro-to the understanding of health among linked genetic markers to detect population moter polymorphism of the CD14 genewomen. J Women’s Health 1997;6:49–62. stratification in association studies. Am J and atopy. Am J Respir Crit Care Med
70. Hum Genet 1999;65:220–228.Risch N, Merikangas K. The future of gen- 2001;163:965–969.etic studies of complex human diseases. 79. Pritchard JK, Stephens M, Rosenberg NA, 89. LeVan TD, et al. A common single nucle-Science 1996;273:1516–1517. Donnelly P. Association mapping in struc- otide polymorphism in the CD14 promoter
71. tured populations. Am J Hum GenetPalmer LJ, Cookson WOCM, James AL, Musk decreases the affinity of Sp protein bindingAW, Burton PR. Gibbs-sampling based seg- 2000;67:170–181. and enhances transcriptional activity. J Im-regation analysis of asthma-associated quan- 80. Devlin B, Roeder K. Genomic control for as- munol 2001;167:5838–5844.titative traits in a population-based sample of sociation studies. Biometrics 90. Jones CA, et al. Reduced soluble CD14 levelsnuclear families. Genetic Epidemiol 1999;55:997–1004. in amniotic fluid and breast milk are associ-2001;20:356–372. 81. Lander E, Kruglyak L. Genetic dissection of ated with the subsequent development of
72. complex traits: guidelines for interpretingPalmer LJ, Cookson WOCM. Genomic ap- atopy, eczema, or both. J Allergy Clin Immu-proaches to understanding asthma. Genome and reporting linkage results. Nat Genet nol 2002;109:858–866.Res 2000;10:1280–1287. 1995;11:241–247. 91. Liu A. Endotoxin exposure in allergy and
82. asthma: reconciling a paradox. J Allergy ClinWitte JS, Elston RC, Cardon LR. On the rela-tive sample size required for multiple com- Immunol 2002;109:379–392.parisons. Stat Med 2000;19:369–372. 92. Van Eerdewegh P, et al. Association of the
ADAM33 gene with asthma and bronchialhyperresponsiveness. Nature2002;418:426–430.
25Immunological Reviews 190/2002