Embed Size (px)
Citation preview
TITLE: Gender effects of single nucleotide polymorphisms and miRNAs targeting clock-genes in metastatic colorectal cancer patients (mCRC)
1Carlo Garufi*§, 2Elisa Giacomini, 3Angela Torsello, 4Isabella Sperduti, 5Elisa Melucci, 5Marcella Mottolese, 6Massimo Zeuli, 7Giuseppe Maria Ettorre,2Teresa Ricciardi, 6Francesco Cognetti, 2Mauro Magnani and 2Annamaria Ruzzo*§
*Carlo Garufi and Annamaria Ruzzo contributed equally to the study
1Division of Medical Oncology, Spirito Santo Hospital Pescara, Italy; 2 Dept. of Biomolecular Sciences (DiSB) University of Urbino "Carlo Bo",
Urbino, Italy;. 3.Division of Medical Oncology Azienda Ospedaliera San Giovanni Addolorata Hospital, Rome , Italy; 4 Biostatistic Unit, Regina Elena
National Cancer Institute Rome, Italy; 5 Pathology Department Regina Elena National Cancer Institute Rome Italy; 6Division of Medical Oncology
Regina Elena National Cancer Institute Rome, Italy; 7 General Surgery and Transplantation Unit San Camillo Hospital Rome Italy. .
SUPPLEMENTARY
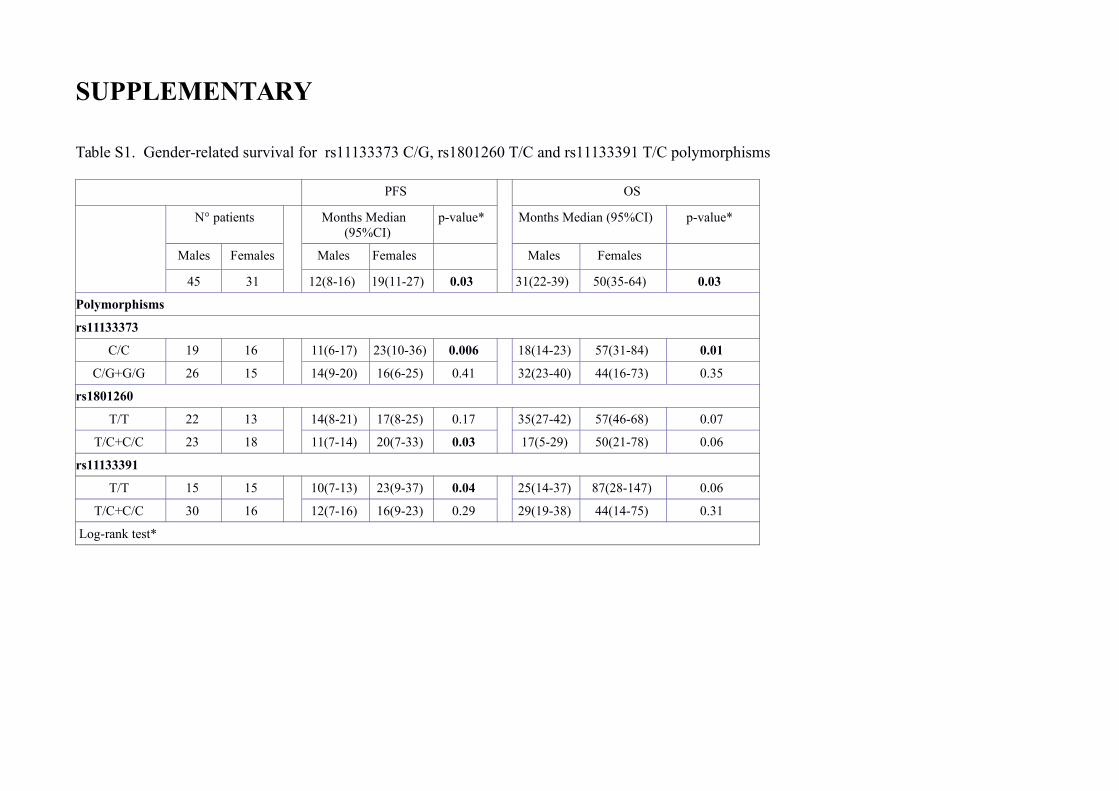
Table S1. Gender-related survival for rs11133373 C/G, rs1801260 T/C and rs11133391 T/C polymorphisms
PFS OS
N° patients Months Median(95%CI)
p-value* Months Median (95%CI) p-value*
Males Females Males Females Males Females
45 31 12(8-16) 19(11-27) 0.03 31(22-39) 50(35-64) 0.03
Polymorphisms
rs11133373
C/C 19 16 11(6-17) 23(10-36) 0.006 18(14-23) 57(31-84) 0.01
C/G+G/G 26 15 14(9-20) 16(6-25) 0.41 32(23-40) 44(16-73) 0.35
rs1801260
T/T 22 13 14(8-21) 17(8-25) 0.17 35(27-42) 57(46-68) 0.07
T/C+C/C 23 18 11(7-14) 20(7-33) 0.03 17(5-29) 50(21-78) 0.06
rs11133391
T/T 15 15 10(7-13) 23(9-37) 0.04 25(14-37) 87(28-147) 0.06
T/C+C/C 30 16 12(7-16) 16(9-23) 0.29 29(19-38) 44(14-75) 0.31
Log-rank test*
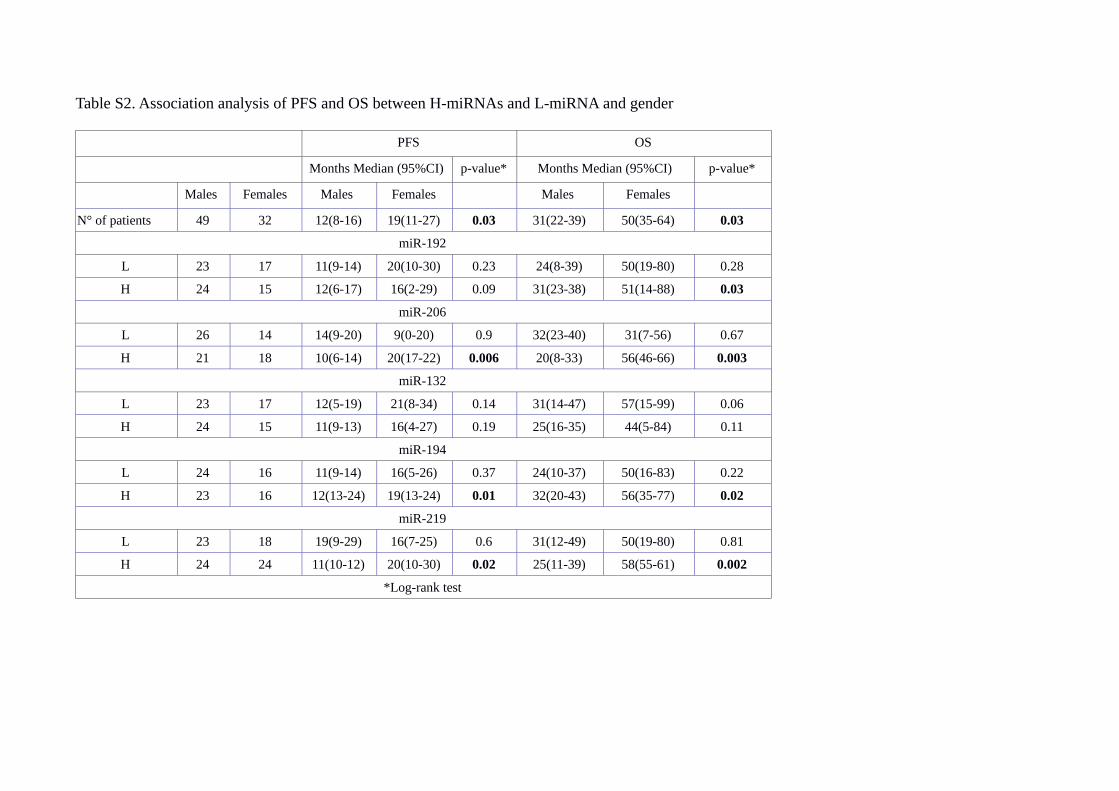
Table S2. Association analysis of PFS and OS between H-miRNAs and L-miRNA and gender
PFS OS
Months Median (95%CI) p-value* Months Median (95%CI) p-value*
Males Females Males Females Males Females
N° of patients 49 32 12(8-16) 19(11-27) 0.03 31(22-39) 50(35-64) 0.03
miR-192
L 23 17 11(9-14) 20(10-30) 0.23 24(8-39) 50(19-80) 0.28
H 24 15 12(6-17) 16(2-29) 0.09 31(23-38) 51(14-88) 0.03
miR-206
L 26 14 14(9-20) 9(0-20) 0.9 32(23-40) 31(7-56) 0.67
H 21 18 10(6-14) 20(17-22) 0.006 20(8-33) 56(46-66) 0.003
miR-132
L 23 17 12(5-19) 21(8-34) 0.14 31(14-47) 57(15-99) 0.06
H 24 15 11(9-13) 16(4-27) 0.19 25(16-35) 44(5-84) 0.11
miR-194
L 24 16 11(9-14) 16(5-26) 0.37 24(10-37) 50(16-83) 0.22
H 23 16 12(13-24) 19(13-24) 0.01 32(20-43) 56(35-77) 0.02
miR-219
L 23 18 19(9-29) 16(7-25) 0.6 31(12-49) 50(19-80) 0.81
H 24 24 11(10-12) 20(10-30) 0.02 25(11-39) 58(55-61) 0.002
*Log-rank test
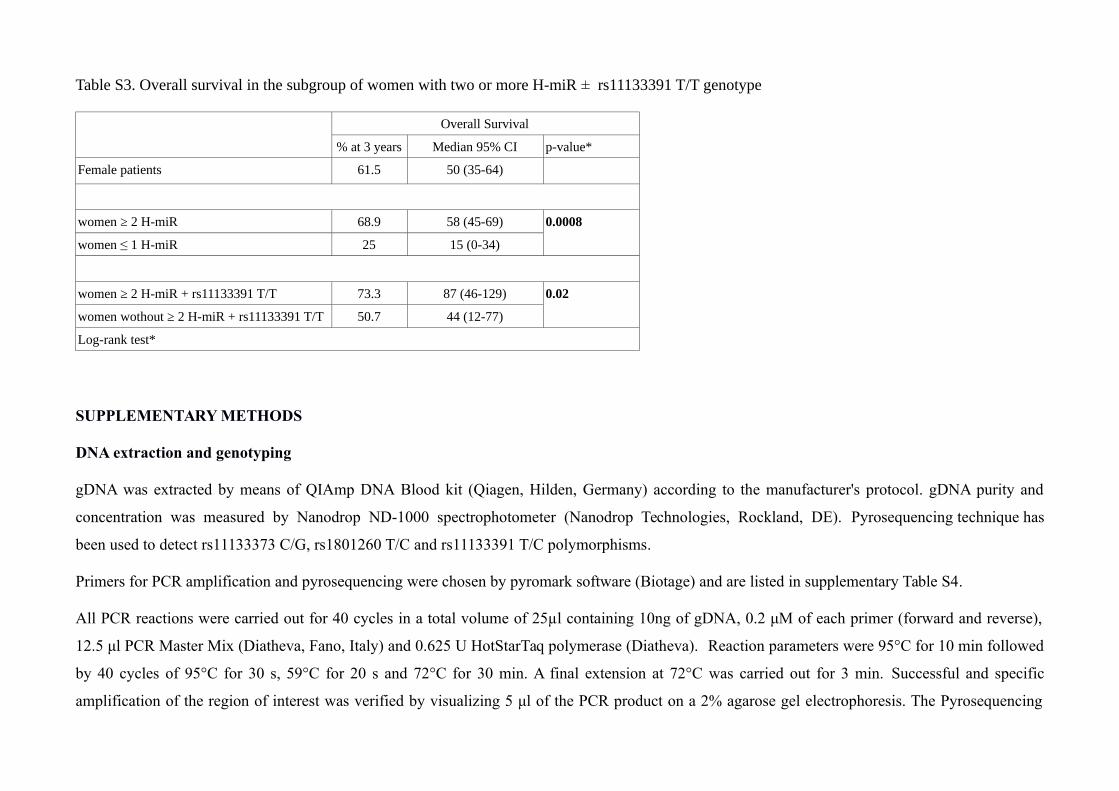
Table S3. Overall survival in the subgroup of women with two or more H-miR ± rs11133391 T/T genotype
Overall Survival
% at 3 years Median 95% CI p-value*
Female patients 61.5 50 (35-64)
women ≥ 2 H-miR 68.9 58 (45-69) 0.0008
women ≤ 1 H-miR 25 15 (0-34)
women ≥ 2 H-miR + rs11133391 T/T 73.3 87 (46-129) 0.02
women wothout ≥ 2 H-miR + rs11133391 T/T 50.7 44 (12-77)
Log-rank test*
SUPPLEMENTARY METHODS
DNA extraction and genotyping
gDNA was extracted by means of QIAmp DNA Blood kit (Qiagen, Hilden, Germany) according to the manufacturer's protocol. gDNA purity and
concentration was measured by Nanodrop ND-1000 spectrophotometer (Nanodrop Technologies, Rockland, DE). Pyrosequencing technique has
been used to detect rs11133373 C/G, rs1801260 T/C and rs11133391 T/C polymorphisms.
Primers for PCR amplification and pyrosequencing were chosen by pyromark software (Biotage) and are listed in supplementary Table S4.
All PCR reactions were carried out for 40 cycles in a total volume of 25µl containing 10ng of gDNA, 0.2 μM of each primer (forward and reverse),
12.5 μl PCR Master Mix (Diatheva, Fano, Italy) and 0.625 U HotStarTaq polymerase (Diatheva). Reaction parameters were 95°C for 10 min followed
by 40 cycles of 95°C for 30 s, 59°C for 20 s and 72°C for 30 min. A final extension at 72°C was carried out for 3 min. Successful and specific
amplification of the region of interest was verified by visualizing 5 μl of the PCR product on a 2% agarose gel electrophoresis. The Pyrosequencing
technique was performed on a PSQ 96MA instrument (Biotage) using PyroGold reagents (Qiagen) following the protocol suggested by the
manufacturers and the determination of rs11133373 C/G, rs1801260 T/C and rs11133391 T/C polymorphisms were made by using PyroMark™ ID
program (Qiagen).
miRNAs extraction and Quantitative Real-Time Polymerase Chain Reaction (q-RT-PCR)
Three to five 10-μm sections from FFPE specimens were obtained from the primary tumor. Representative areas from FFPE tumor blocks were
evaluated by pathologists. Before cutting sections for miRNAs isolation, one slide was prepared for hematoxylin and eosin staining to select only
representative samples with almost complete tumor infiltration. All assays were performed by investigators who were blinded to the clinical data of the
sample cohort.
Total cellular RNA was isolated from human FFPE specimens using the miRNeasy FFPE Kit (Qiagen) according to the manufacturer's instructions.
The extracted RNA was quantified and its purity was evaluated by the NanoDrop 1000 spectrophotometer (Nanodrop Technologies) and 250 ng of total
RNA was reverse transcribed using the miScript II RT Kit (Qiagen) according to the manufacturer's instructions. Conditions for the reverse
transcription (RT) reaction were as follows: 37°C for 60 minutes and 95°C for 5 minute. Obtained cDNA was diluted 1:11 and used as template in the
q-RT-PCR, mixed with QuantiTect SYBR Green PCR Master Mix and miScript Universal Primer (Qiagen) and loaded into each well of a Custom
miScript miRNA PCR Arrays made to include the set of miScript Primer Assay (Qiagen)of miR-192, miR-206, miR-132, miR-194 and miR-219
according to the manufacturer's instructions. The analysis was performed on an ABI-PRISM 7500 Real Time PCR System (Applied Biosystems, Foster
City, CA, USA) using the manufacturer’s recommended program. Data were quantified using the SDS 2.1 software and normalized using RNU6-2 as
endogenous control. The cycle threshold (Ct) value, which was calculated relatively to the endogenous control (ΔCt), was used to evaluate the relative
changes in miRNA expression levels. The expression levels of each miRNA was expressed as value obtained from the Δct equation with respect to
RNU-6-2 reference gene (Δct=Cttarget -Ctreference).
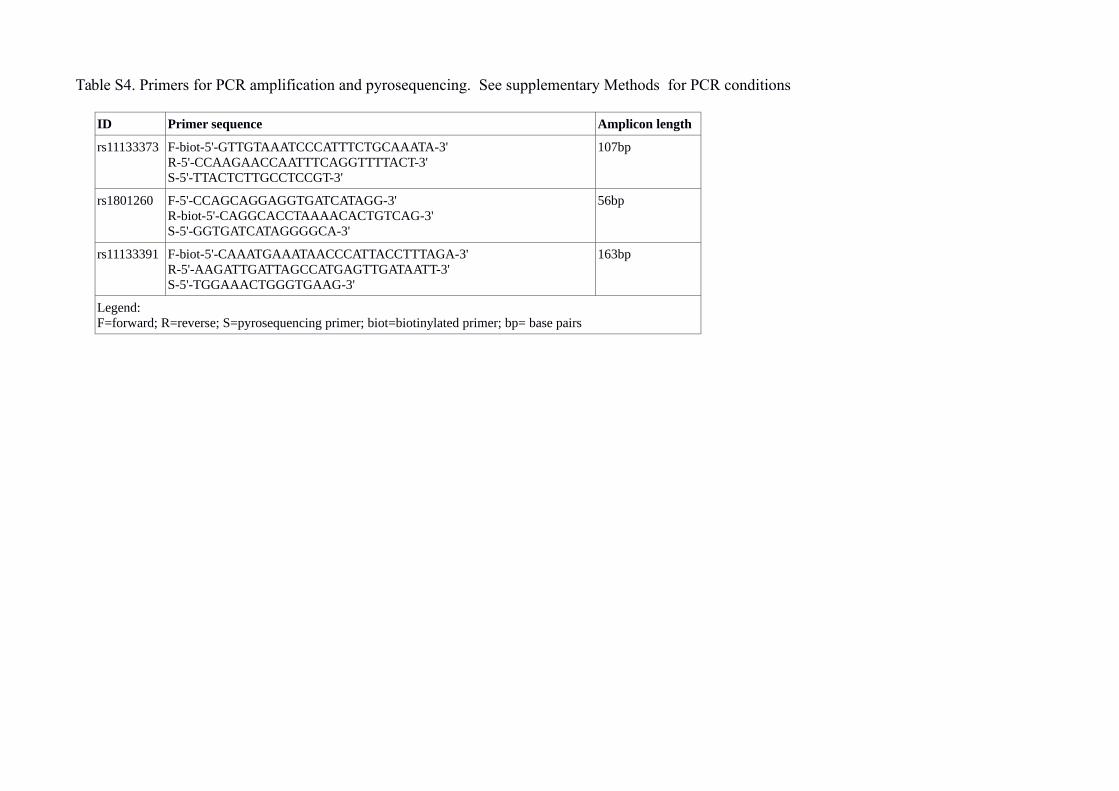
Table S4. Primers for PCR amplification and pyrosequencing. See supplementary Methods for PCR conditions
ID Primer sequence Amplicon length
rs11133373 F-biot-5'-GTTGTAAATCCCATTTCTGCAAATA-3'R-5'-CCAAGAACCAATTTCAGGTTTTACT-3'S-5'-TTACTCTTGCCTCCGT-3'
107bp
rs1801260 F-5'-CCAGCAGGAGGTGATCATAGG-3'R-biot-5'-CAGGCACCTAAAACACTGTCAG-3'S-5'-GGTGATCATAGGGGCA-3'
56bp
rs11133391 F-biot-5'-CAAATGAAATAACCCATTACCTTTAGA-3'R-5'-AAGATTGATTAGCCATGAGTTGATAATT-3'S-5'-TGGAAACTGGGTGAAG-3'
163bp
Legend: F=forward; R=reverse; S=pyrosequencing primer; biot=biotinylated primer; bp= base pairs
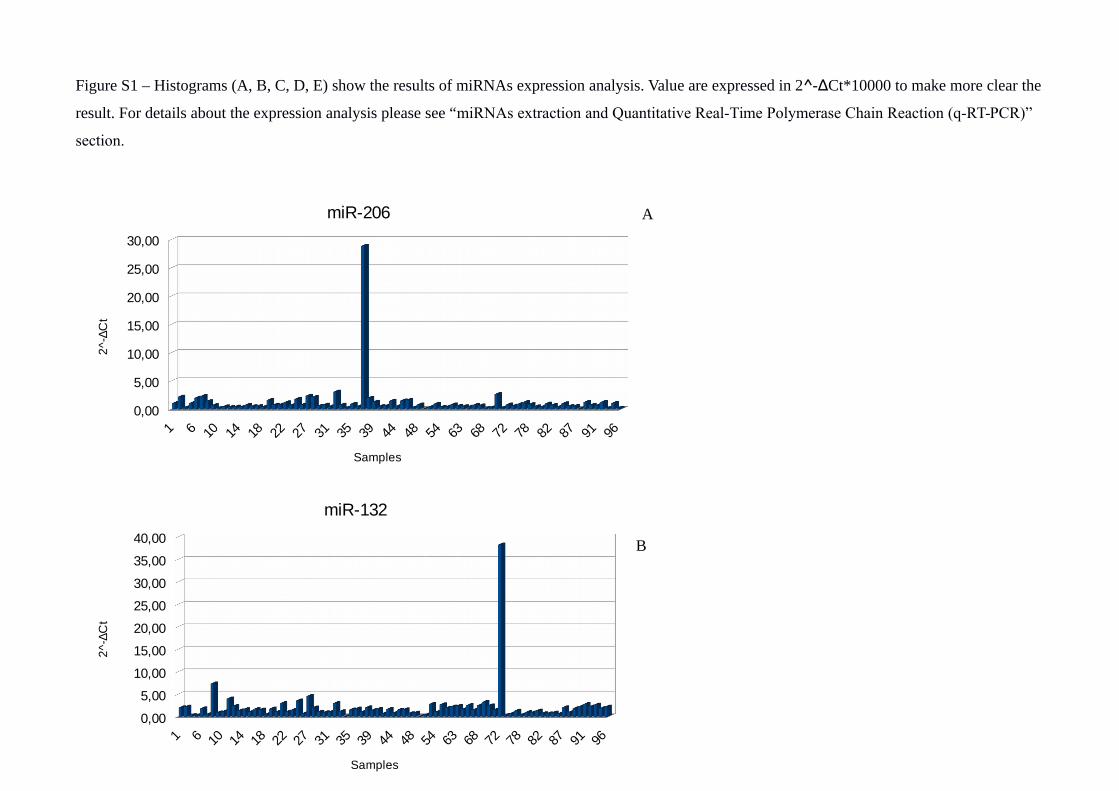
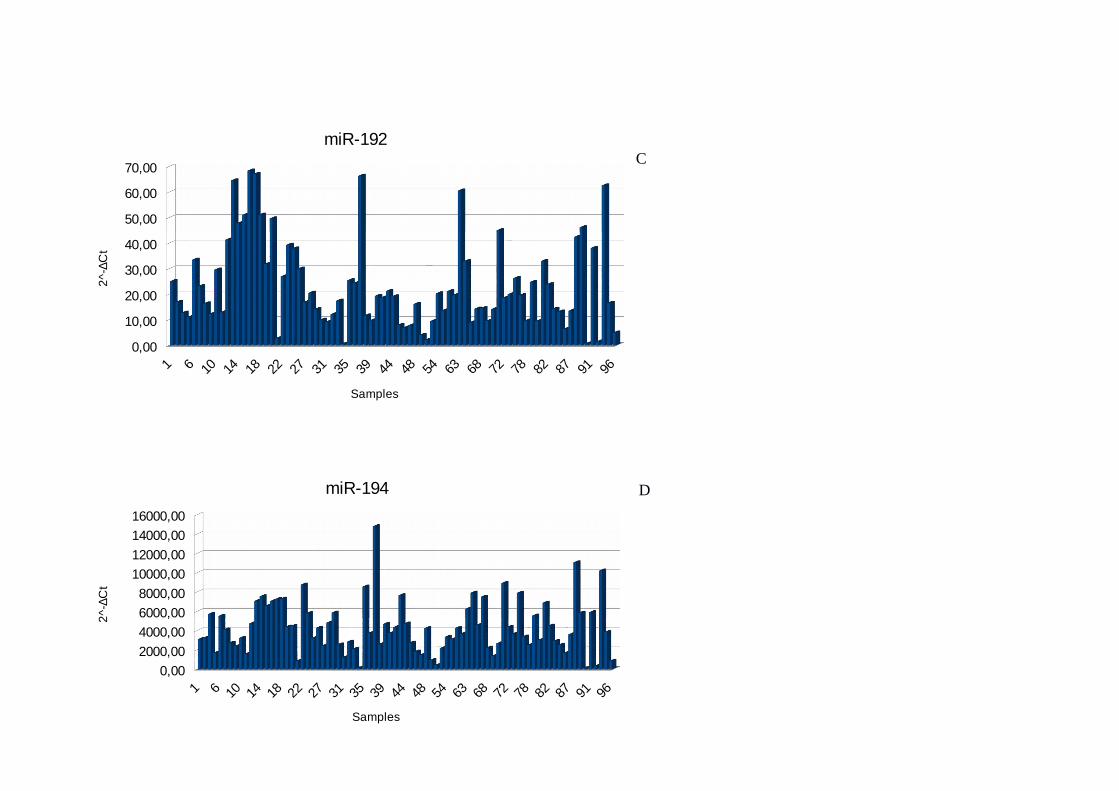
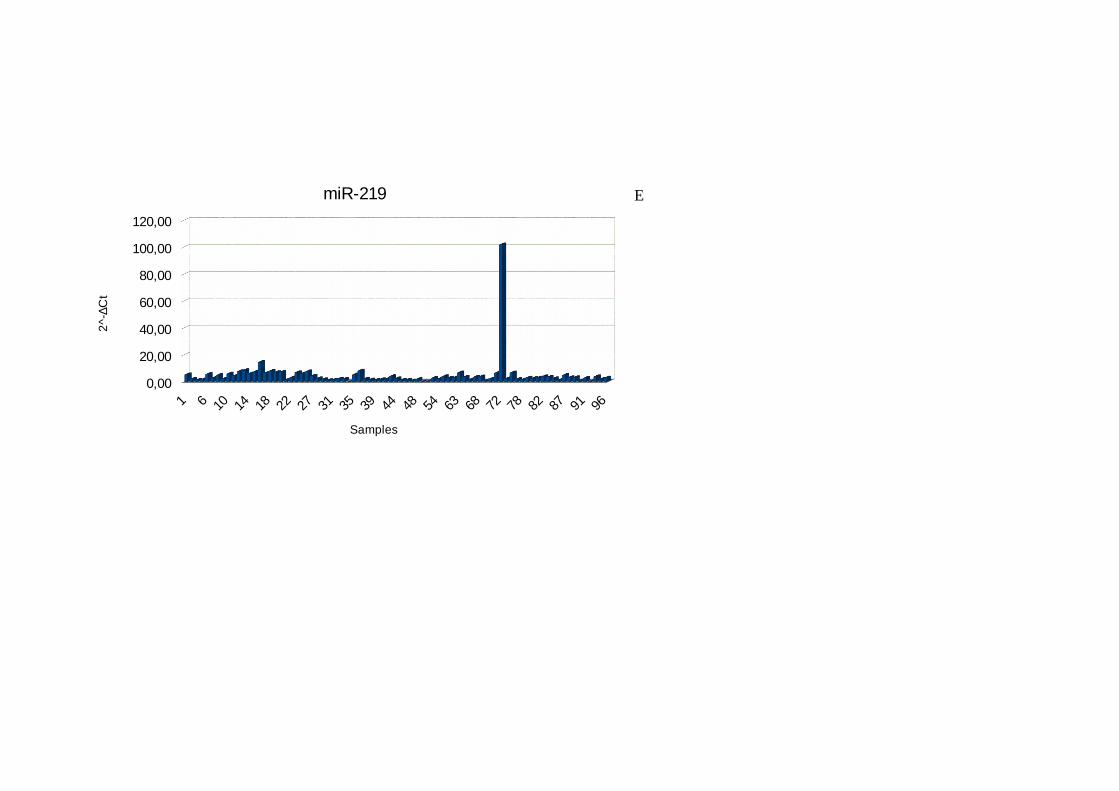
Figure S1 – Histograms (A, B, C, D, E) show the results of miRNAs expression analysis. Value are expressed in 2^-∆Ct*10000 to make more clear the
result. For details about the expression analysis please see “miRNAs extraction and Quantitative Real-Time Polymerase Chain Reaction (q-RT-PCR)”
section.
A
B
0,00
5,00
10,00
15,00
20,00
25,00
30,00
miR-206
Samples
2^-
∆C
t
0,00
5,00
10,00
15,00
20,00
25,00
30,00
35,00
40,00
miR-132
Samples
2^-
∆C
t
C
D
0,00
10,00
20,00
30,00
40,00
50,00
60,00
70,00
miR-192
Samples
2^-
∆C
t
0,00
2000,00
4000,00
6000,00
8000,00
10000,00
12000,00
14000,00
16000,00
miR-194
Samples
2^-
∆C
t
E
0,00
20,00
40,00
60,00
80,00
100,00
120,00
miR-219
Samples
2^-
∆C
t