Embed Size (px)
Citation preview
Single Nanoparticle Collisions at Microfluidic Microband Electrodes:The Effect of Electrode Material and Mass TransferTimothy M. Alligrant, Morgan J. Anderson, Radhika Dasari, Keith J. Stevenson,* and Richard M. Crooks*
Department of Chemistry and Center for Nano- and Molecular Science and Technology, The University of Texas at Austin, 105 East24th Street, Stop A5300, Austin, Texas 78712-0165, United States
*S Supporting Information
ABSTRACT: We report on the effect of convection on electrochemically active collisions between individual Pt nanoparticles(PtNPs) and Hg and Au electrodes. Compared to standard electrochemical cells utilizing Hg and Au ultramicroelectrodes(UMEs) used in previous studies of electrocatalytic amplification, microelectrochemical devices offer two major advantages. First,the PtNP limit of detection (0.084 pM) is ∼8 times lower than the lowest concentration measured using UMEs. Second,convection enhances the mass transfer of PtNPs to the electrode surface, which enhances the collision frequency from ∼0.02pM−1 s−1 on UMEs to ∼0.07 pM−1 s−1 in microelectrochemical devices. We also show that the size of PtNPs can be measured inflowing systems using data from collision experiments and then validate this finding using multiphysics simulations.
■ INTRODUCTION
Electrocatalytic amplification (ECA) refers to the faradaicelectrochemical response that results when a single, catalyticnanoparticle collides with a catalytically inactive electrode in thepresence of an appropriate redox couple.1,2 This situation isillustrated in Scheme 1a. Here, a catalytic Pt nanoparticle(PtNP) collides with a noncatalytic Hg electrode. Once thePtNP collides with the electrode, hydrazine (N2H4) iselectrocatalytically oxidized at the PtNP surface. This leads tothe type of current transient shown to the right of thescheme.1,2 Experiments such as these are normally carried outin quiescent solutions using standard micro- or nanodiskelectrodes (henceforth we refer to this configuration as a’standard electrochemical cell’).1,3,4 However, we recentlyshowed that collision experiments can also be carried out inmicroelectrochemical devices under conditions of pressuredriven flow (PDF).5 Microelectrochemical systems providesome key advantages, compared to standard electrochemicalcells, for migrating fundamental studies of collision phenomenato sensor applications,5,6 and hence we have focused ourattention on better understanding how the micron-scalechannel, solution flow, and electrode type and configurationaffect electrochemical responses. Here, we focus on theelectrode material and solution flow.ECA experiments are usually carried out by poising the
working electrode (Au, Pt, PtOx, carbon, or Hg) at a potential
where little faradaic current flows in the presence of anelectroactive species (N2H4, water, H2O2, H
+, O2, and BH4‑).1
Upon introduction of catalytic NPs (Au, Pt, or IrOX), however,current transients are observed (i-t traces, Scheme 1). Each ofthese corresponds to a collision between a catalytic particle andthe inert working electrode. As discussed later, the shape of thecurrent transient depends on the details of the particular systemunder study. Important parameters include the size andmaterial of the electrode and NPs,1 the electrolyte7 and NPconcentrations, the redox probe molecule undergoing theelectrocatalytic reaction,1 and the electrochemical detectionmethod (chronoamperometry, potentiometry, or fast-scanvoltammetry).1,2,8,9 The groups of Alpuche-Aviles,10 Andrees-cu,11 Bard,1,3,8,12−14 Compton,15−18 Crooks,5 Koper,19,20
Macpherson,13 Stevenson,21−23 Unwin,19 and Zhang3,9,14,24
have all contributed significantly to our understanding of theserelationships, though many mysteries remain.The work reported herein builds specifically on prior
collision results from the Stevenson and Crooks groups. Forexample, the Stevenson group has shown that Hg electrodeslead to much higher signal-to-noise (S/N) levels than Auelectrodes, primarily because of low faradaic background
Received: September 10, 2014Revised: October 19, 2014Published: October 31, 2014
Article
pubs.acs.org/Langmuir
© 2014 American Chemical Society 13462 dx.doi.org/10.1021/la503628h | Langmuir 2014, 30, 13462−13469
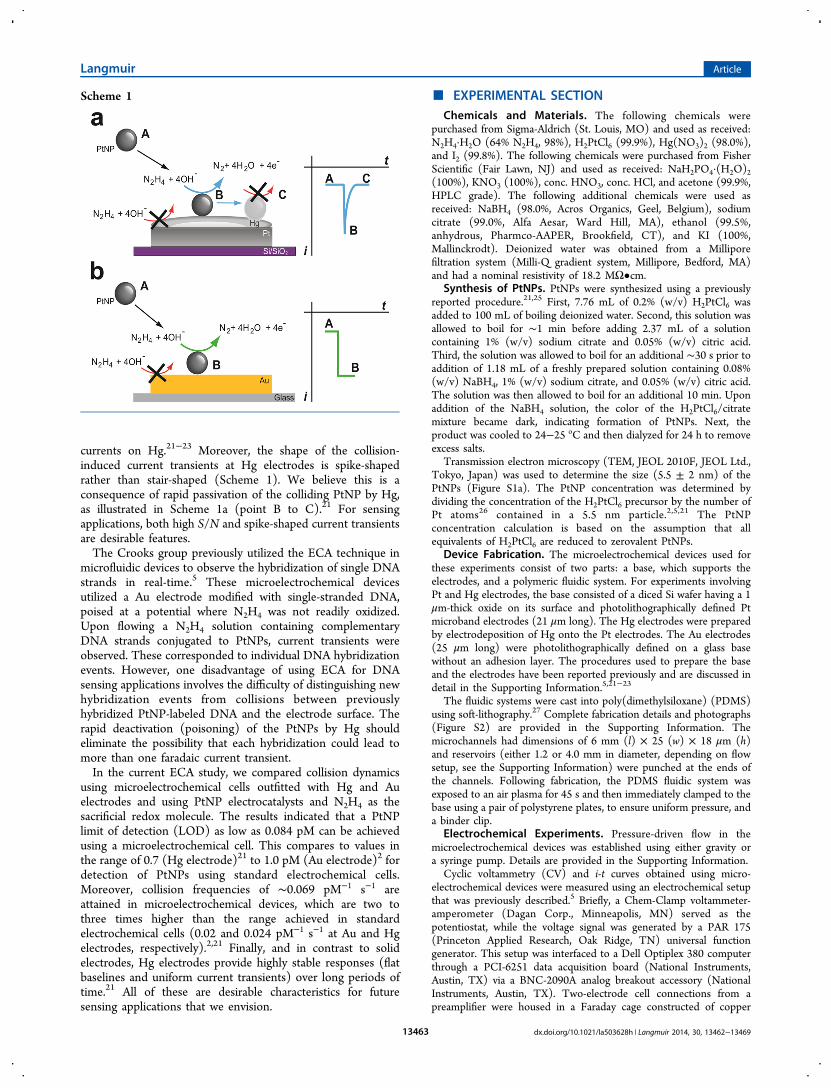
currents on Hg.21−23 Moreover, the shape of the collision-induced current transients at Hg electrodes is spike-shapedrather than stair-shaped (Scheme 1). We believe this is aconsequence of rapid passivation of the colliding PtNP by Hg,as illustrated in Scheme 1a (point B to C).21 For sensingapplications, both high S/N and spike-shaped current transientsare desirable features.The Crooks group previously utilized the ECA technique in
microfluidic devices to observe the hybridization of single DNAstrands in real-time.5 These microelectrochemical devicesutilized a Au electrode modified with single-stranded DNA,poised at a potential where N2H4 was not readily oxidized.Upon flowing a N2H4 solution containing complementaryDNA strands conjugated to PtNPs, current transients wereobserved. These corresponded to individual DNA hybridizationevents. However, one disadvantage of using ECA for DNAsensing applications involves the difficulty of distinguishing newhybridization events from collisions between previouslyhybridized PtNP-labeled DNA and the electrode surface. Therapid deactivation (poisoning) of the PtNPs by Hg shouldeliminate the possibility that each hybridization could lead tomore than one faradaic current transient.In the current ECA study, we compared collision dynamics
using microelectrochemical cells outfitted with Hg and Auelectrodes and using PtNP electrocatalysts and N2H4 as thesacrificial redox molecule. The results indicated that a PtNPlimit of detection (LOD) as low as 0.084 pM can be achievedusing a microelectrochemical cell. This compares to values inthe range of 0.7 (Hg electrode)21 to 1.0 pM (Au electrode)2 fordetection of PtNPs using standard electrochemical cells.Moreover, collision frequencies of ∼0.069 pM−1 s−1 areattained in microelectrochemical devices, which are two tothree times higher than the range achieved in standardelectrochemical cells (0.02 and 0.024 pM−1 s−1 at Au and Hgelectrodes, respectively).2,21 Finally, and in contrast to solidelectrodes, Hg electrodes provide highly stable responses (flatbaselines and uniform current transients) over long periods oftime.21 All of these are desirable characteristics for futuresensing applications that we envision.
■ EXPERIMENTAL SECTIONChemicals and Materials. The following chemicals were
purchased from Sigma-Aldrich (St. Louis, MO) and used as received:N2H4·H2O (64% N2H4, 98%), H2PtCl6 (99.9%), Hg(NO3)2 (98.0%),and I2 (99.8%). The following chemicals were purchased from FisherScientific (Fair Lawn, NJ) and used as received: NaH2PO4·(H2O)2(100%), KNO3 (100%), conc. HNO3, conc. HCl, and acetone (99.9%,HPLC grade). The following additional chemicals were used asreceived: NaBH4 (98.0%, Acros Organics, Geel, Belgium), sodiumcitrate (99.0%, Alfa Aesar, Ward Hill, MA), ethanol (99.5%,anhydrous, Pharmco-AAPER, Brookfield, CT), and KI (100%,Mallinckrodt). Deionized water was obtained from a Milliporefiltration system (Milli-Q gradient system, Millipore, Bedford, MA)and had a nominal resistivity of 18.2 MΩ•cm.
Synthesis of PtNPs. PtNPs were synthesized using a previouslyreported procedure.21,25 First, 7.76 mL of 0.2% (w/v) H2PtCl6 wasadded to 100 mL of boiling deionized water. Second, this solution wasallowed to boil for ∼1 min before adding 2.37 mL of a solutioncontaining 1% (w/v) sodium citrate and 0.05% (w/v) citric acid.Third, the solution was allowed to boil for an additional ∼30 s prior toaddition of 1.18 mL of a freshly prepared solution containing 0.08%(w/v) NaBH4, 1% (w/v) sodium citrate, and 0.05% (w/v) citric acid.The solution was then allowed to boil for an additional 10 min. Uponaddition of the NaBH4 solution, the color of the H2PtCl6/citratemixture became dark, indicating formation of PtNPs. Next, theproduct was cooled to 24−25 oC and then dialyzed for 24 h to removeexcess salts.
Transmission electron microscopy (TEM, JEOL 2010F, JEOL Ltd.,Tokyo, Japan) was used to determine the size (5.5 ± 2 nm) of thePtNPs (Figure S1a). The PtNP concentration was determined bydividing the concentration of the H2PtCl6 precursor by the number ofPt atoms26 contained in a 5.5 nm particle.2,5,21 The PtNPconcentration calculation is based on the assumption that allequivalents of H2PtCl6 are reduced to zerovalent PtNPs.
Device Fabrication. The microelectrochemical devices used forthese experiments consist of two parts: a base, which supports theelectrodes, and a polymeric fluidic system. For experiments involvingPt and Hg electrodes, the base consisted of a diced Si wafer having a 1μm-thick oxide on its surface and photolithographically defined Ptmicroband electrodes (21 μm long). The Hg electrodes were preparedby electrodeposition of Hg onto the Pt electrodes. The Au electrodes(25 μm long) were photolithographically defined on a glass basewithout an adhesion layer. The procedures used to prepare the baseand the electrodes have been reported previously and are discussed indetail in the Supporting Information.5,21−23
The fluidic systems were cast into poly(dimethylsiloxane) (PDMS)using soft-lithography.27 Complete fabrication details and photographs(Figure S2) are provided in the Supporting Information. Themicrochannels had dimensions of 6 mm (l) × 25 (w) × 18 μm (h)and reservoirs (either 1.2 or 4.0 mm in diameter, depending on flowsetup, see the Supporting Information) were punched at the ends ofthe channels. Following fabrication, the PDMS fluidic system wasexposed to an air plasma for 45 s and then immediately clamped to thebase using a pair of polystyrene plates, to ensure uniform pressure, anda binder clip.
Electrochemical Experiments. Pressure-driven flow in themicroelectrochemical devices was established using either gravity ora syringe pump. Details are provided in the Supporting Information.
Cyclic voltammetry (CV) and i-t curves obtained using micro-electrochemical devices were measured using an electrochemical setupthat was previously described.5 Briefly, a Chem-Clamp voltammeter-amperometer (Dagan Corp., Minneapolis, MN) served as thepotentiostat, while the voltage signal was generated by a PAR 175(Princeton Applied Research, Oak Ridge, TN) universal functiongenerator. This setup was interfaced to a Dell Optiplex 380 computerthrough a PCI-6251 data acquisition board (National Instruments,Austin, TX) via a BNC-2090A analog breakout accessory (NationalInstruments, Austin, TX). Two-electrode cell connections from apreamplifier were housed in a Faraday cage constructed of copper
Scheme 1
Langmuir Article
dx.doi.org/10.1021/la503628h | Langmuir 2014, 30, 13462−1346913463
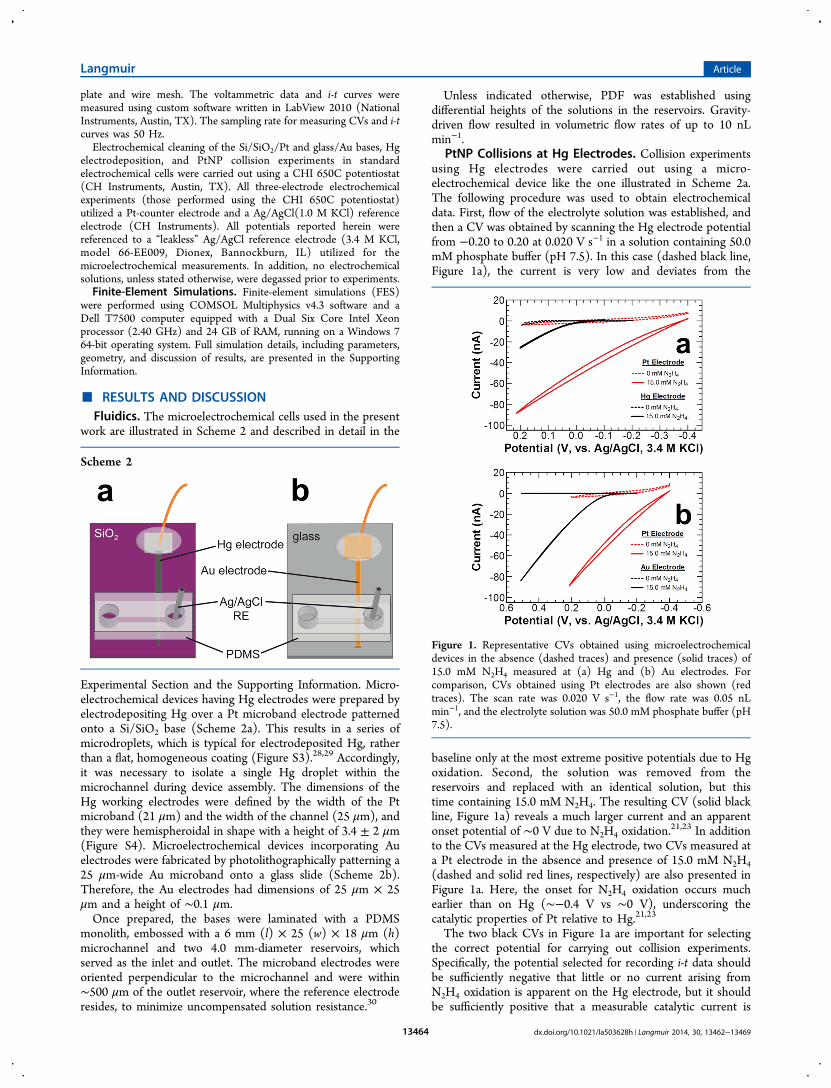
plate and wire mesh. The voltammetric data and i-t curves weremeasured using custom software written in LabView 2010 (NationalInstruments, Austin, TX). The sampling rate for measuring CVs and i-tcurves was 50 Hz.Electrochemical cleaning of the Si/SiO2/Pt and glass/Au bases, Hg
electrodeposition, and PtNP collision experiments in standardelectrochemical cells were carried out using a CHI 650C potentiostat(CH Instruments, Austin, TX). All three-electrode electrochemicalexperiments (those performed using the CHI 650C potentiostat)utilized a Pt-counter electrode and a Ag/AgCl(1.0 M KCl) referenceelectrode (CH Instruments). All potentials reported herein werereferenced to a “leakless” Ag/AgCl reference electrode (3.4 M KCl,model 66-EE009, Dionex, Bannockburn, IL) utilized for themicroelectrochemical measurements. In addition, no electrochemicalsolutions, unless stated otherwise, were degassed prior to experiments.Finite-Element Simulations. Finite-element simulations (FES)
were performed using COMSOL Multiphysics v4.3 software and aDell T7500 computer equipped with a Dual Six Core Intel Xeonprocessor (2.40 GHz) and 24 GB of RAM, running on a Windows 764-bit operating system. Full simulation details, including parameters,geometry, and discussion of results, are presented in the SupportingInformation.
■ RESULTS AND DISCUSSIONFluidics. The microelectrochemical cells used in the present
work are illustrated in Scheme 2 and described in detail in the
Experimental Section and the Supporting Information. Micro-electrochemical devices having Hg electrodes were prepared byelectrodepositing Hg over a Pt microband electrode patternedonto a Si/SiO2 base (Scheme 2a). This results in a series ofmicrodroplets, which is typical for electrodeposited Hg, ratherthan a flat, homogeneous coating (Figure S3).28,29 Accordingly,it was necessary to isolate a single Hg droplet within themicrochannel during device assembly. The dimensions of theHg working electrodes were defined by the width of the Ptmicroband (21 μm) and the width of the channel (25 μm), andthey were hemispheroidal in shape with a height of 3.4 ± 2 μm(Figure S4). Microelectrochemical devices incorporating Auelectrodes were fabricated by photolithographically patterning a25 μm-wide Au microband onto a glass slide (Scheme 2b).Therefore, the Au electrodes had dimensions of 25 μm × 25μm and a height of ∼0.1 μm.Once prepared, the bases were laminated with a PDMS
monolith, embossed with a 6 mm (l) × 25 (w) × 18 μm (h)microchannel and two 4.0 mm-diameter reservoirs, whichserved as the inlet and outlet. The microband electrodes wereoriented perpendicular to the microchannel and were within∼500 μm of the outlet reservoir, where the reference electroderesides, to minimize uncompensated solution resistance.30
Unless indicated otherwise, PDF was established usingdifferential heights of the solutions in the reservoirs. Gravity-driven flow resulted in volumetric flow rates of up to 10 nLmin−1.
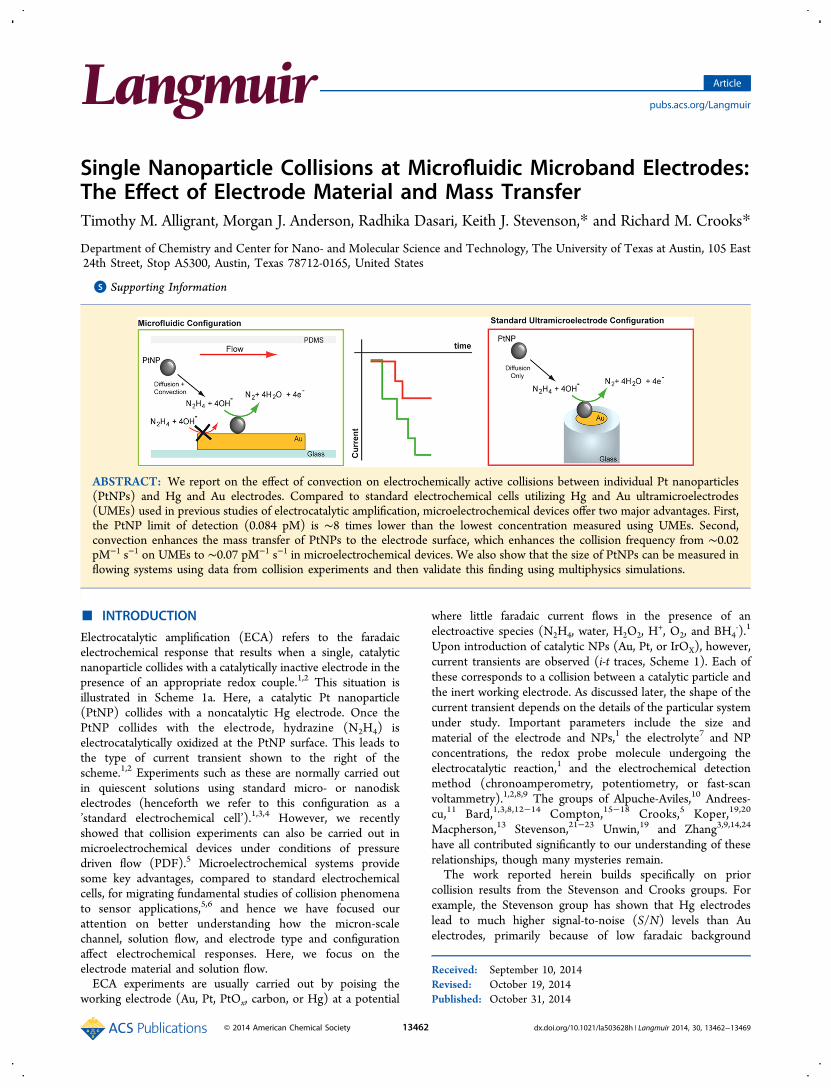
PtNP Collisions at Hg Electrodes. Collision experimentsusing Hg electrodes were carried out using a micro-electrochemical device like the one illustrated in Scheme 2a.The following procedure was used to obtain electrochemicaldata. First, flow of the electrolyte solution was established, andthen a CV was obtained by scanning the Hg electrode potentialfrom −0.20 to 0.20 at 0.020 V s−1 in a solution containing 50.0mM phosphate buffer (pH 7.5). In this case (dashed black line,Figure 1a), the current is very low and deviates from the
baseline only at the most extreme positive potentials due to Hgoxidation. Second, the solution was removed from thereservoirs and replaced with an identical solution, but thistime containing 15.0 mM N2H4. The resulting CV (solid blackline, Figure 1a) reveals a much larger current and an apparentonset potential of ∼0 V due to N2H4 oxidation.
21,23 In additionto the CVs measured at the Hg electrode, two CVs measured ata Pt electrode in the absence and presence of 15.0 mM N2H4(dashed and solid red lines, respectively) are also presented inFigure 1a. Here, the onset for N2H4 oxidation occurs muchearlier than on Hg (∼−0.4 V vs ∼0 V), underscoring thecatalytic properties of Pt relative to Hg.21,23
The two black CVs in Figure 1a are important for selectingthe correct potential for carrying out collision experiments.Specifically, the potential selected for recording i-t data shouldbe sufficiently negative that little or no current arising fromN2H4 oxidation is apparent on the Hg electrode, but it shouldbe sufficiently positive that a measurable catalytic current is
Scheme 2
Figure 1. Representative CVs obtained using microelectrochemicaldevices in the absence (dashed traces) and presence (solid traces) of15.0 mM N2H4 measured at (a) Hg and (b) Au electrodes. Forcomparison, CVs obtained using Pt electrodes are also shown (redtraces). The scan rate was 0.020 V s−1, the flow rate was 0.05 nLmin−1, and the electrolyte solution was 50.0 mM phosphate buffer (pH7.5).
Langmuir Article
dx.doi.org/10.1021/la503628h | Langmuir 2014, 30, 13462−1346913464
observed when a PtNP collides with the Hg surface.Accordingly, and consistent with previous reports,21,23 weselected a potential of −0.050 V for the collision experimentscarried out using the Hg electrodes.Figures 2a−2c show representative sections of i-t recordings
for PtNP collisions in the absence (black lines) and presence
(red lines) of PtNPs (all collision experiments were carried outfor a total of 600 s). In the absence of PtNPs, the i-t plotsexhibit a near-constant current of ∼−0.62 nA, due to slowoxidation of N2H4 on the Hg electrode, but they are otherwisefeatureless.The experiments represented by the red i-t traces were
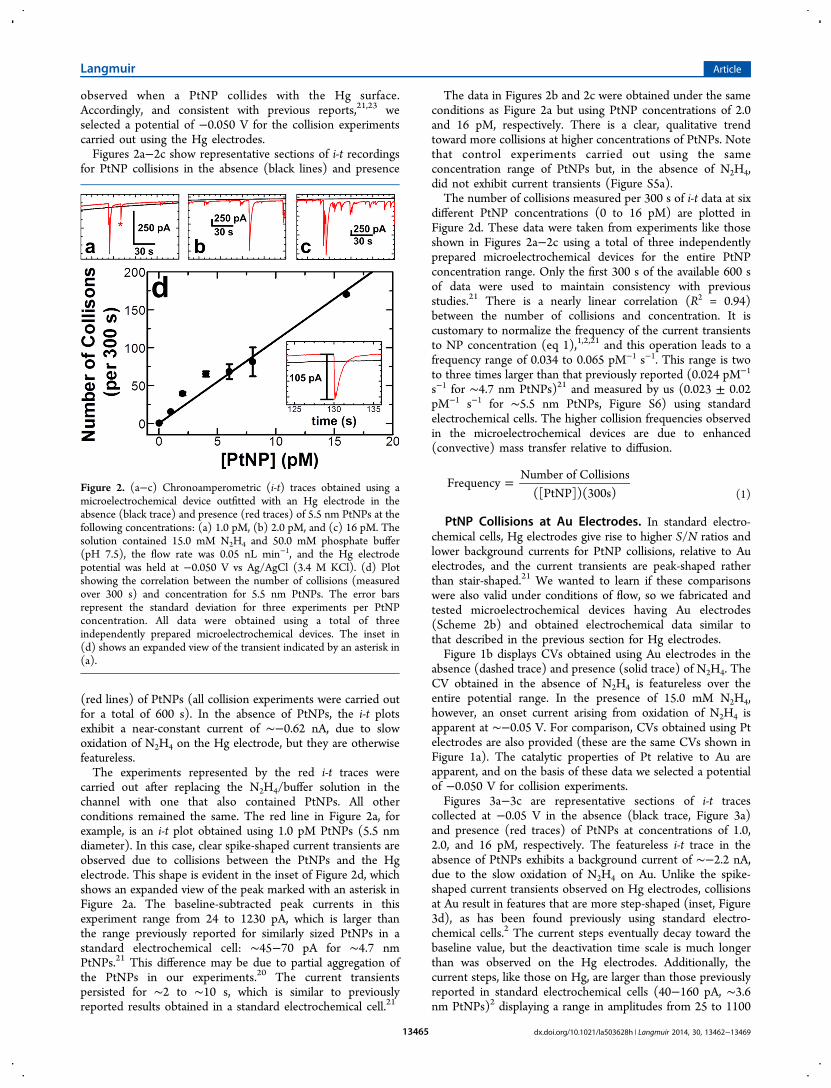
carried out after replacing the N2H4/buffer solution in thechannel with one that also contained PtNPs. All otherconditions remained the same. The red line in Figure 2a, forexample, is an i-t plot obtained using 1.0 pM PtNPs (5.5 nmdiameter). In this case, clear spike-shaped current transients areobserved due to collisions between the PtNPs and the Hgelectrode. This shape is evident in the inset of Figure 2d, whichshows an expanded view of the peak marked with an asterisk inFigure 2a. The baseline-subtracted peak currents in thisexperiment range from 24 to 1230 pA, which is larger thanthe range previously reported for similarly sized PtNPs in astandard electrochemical cell: ∼45−70 pA for ∼4.7 nmPtNPs.21 This difference may be due to partial aggregation ofthe PtNPs in our experiments.20 The current transientspersisted for ∼2 to ∼10 s, which is similar to previouslyreported results obtained in a standard electrochemical cell.21
The data in Figures 2b and 2c were obtained under the sameconditions as Figure 2a but using PtNP concentrations of 2.0and 16 pM, respectively. There is a clear, qualitative trendtoward more collisions at higher concentrations of PtNPs. Notethat control experiments carried out using the sameconcentration range of PtNPs but, in the absence of N2H4,did not exhibit current transients (Figure S5a).The number of collisions measured per 300 s of i-t data at six
different PtNP concentrations (0 to 16 pM) are plotted inFigure 2d. These data were taken from experiments like thoseshown in Figures 2a−2c using a total of three independentlyprepared microelectrochemical devices for the entire PtNPconcentration range. Only the first 300 s of the available 600 sof data were used to maintain consistency with previousstudies.21 There is a nearly linear correlation (R2 = 0.94)between the number of collisions and concentration. It iscustomary to normalize the frequency of the current transientsto NP concentration (eq 1),1,2,21 and this operation leads to afrequency range of 0.034 to 0.065 pM−1 s−1. This range is twoto three times larger than that previously reported (0.024 pM−1
s−1 for ∼4.7 nm PtNPs)21 and measured by us (0.023 ± 0.02pM−1 s−1 for ∼5.5 nm PtNPs, Figure S6) using standardelectrochemical cells. The higher collision frequencies observedin the microelectrochemical devices are due to enhanced(convective) mass transfer relative to diffusion.
=FrequencyNumber of Collisions
([PtNP])(300s) (1)
PtNP Collisions at Au Electrodes. In standard electro-chemical cells, Hg electrodes give rise to higher S/N ratios andlower background currents for PtNP collisions, relative to Auelectrodes, and the current transients are peak-shaped ratherthan stair-shaped.21 We wanted to learn if these comparisonswere also valid under conditions of flow, so we fabricated andtested microelectrochemical devices having Au electrodes(Scheme 2b) and obtained electrochemical data similar tothat described in the previous section for Hg electrodes.Figure 1b displays CVs obtained using Au electrodes in the
absence (dashed trace) and presence (solid trace) of N2H4. TheCV obtained in the absence of N2H4 is featureless over theentire potential range. In the presence of 15.0 mM N2H4,however, an onset current arising from oxidation of N2H4 isapparent at ∼−0.05 V. For comparison, CVs obtained using Ptelectrodes are also provided (these are the same CVs shown inFigure 1a). The catalytic properties of Pt relative to Au areapparent, and on the basis of these data we selected a potentialof −0.050 V for collision experiments.Figures 3a−3c are representative sections of i-t traces
collected at −0.05 V in the absence (black trace, Figure 3a)and presence (red traces) of PtNPs at concentrations of 1.0,2.0, and 16 pM, respectively. The featureless i-t trace in theabsence of PtNPs exhibits a background current of ∼−2.2 nA,due to the slow oxidation of N2H4 on Au. Unlike the spike-shaped current transients observed on Hg electrodes, collisionsat Au result in features that are more step-shaped (inset, Figure3d), as has been found previously using standard electro-chemical cells.2 The current steps eventually decay toward thebaseline value, but the deactivation time scale is much longerthan was observed on the Hg electrodes. Additionally, thecurrent steps, like those on Hg, are larger than those previouslyreported in standard electrochemical cells (40−160 pA, ∼3.6nm PtNPs)2 displaying a range in amplitudes from 25 to 1100
Figure 2. (a−c) Chronoamperometric (i-t) traces obtained using amicroelectrochemical device outfitted with an Hg electrode in theabsence (black trace) and presence (red traces) of 5.5 nm PtNPs at thefollowing concentrations: (a) 1.0 pM, (b) 2.0 pM, and (c) 16 pM. Thesolution contained 15.0 mM N2H4 and 50.0 mM phosphate buffer(pH 7.5), the flow rate was 0.05 nL min−1, and the Hg electrodepotential was held at −0.050 V vs Ag/AgCl (3.4 M KCl). (d) Plotshowing the correlation between the number of collisions (measuredover 300 s) and concentration for 5.5 nm PtNPs. The error barsrepresent the standard deviation for three experiments per PtNPconcentration. All data were obtained using a total of threeindependently prepared microelectrochemical devices. The inset in(d) shows an expanded view of the transient indicated by an asterisk in(a).
Langmuir Article
dx.doi.org/10.1021/la503628h | Langmuir 2014, 30, 13462−1346913465
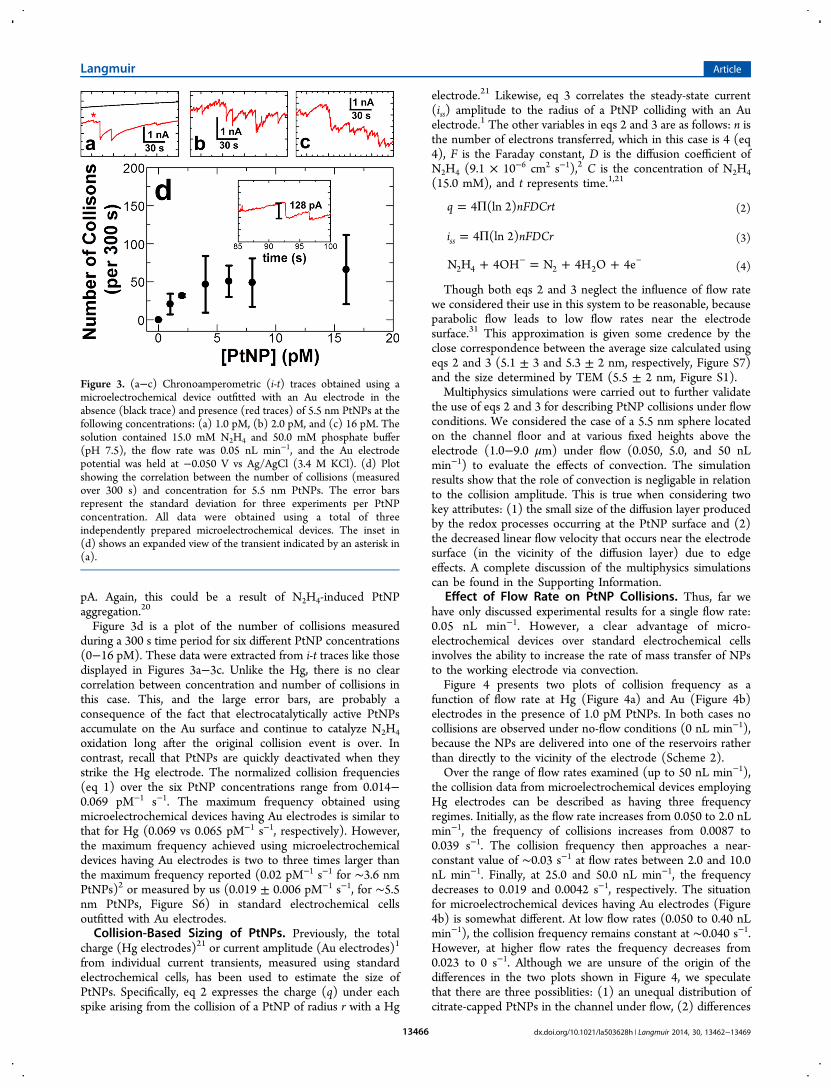
pA. Again, this could be a result of N2H4-induced PtNPaggregation.20
Figure 3d is a plot of the number of collisions measuredduring a 300 s time period for six different PtNP concentrations(0−16 pM). These data were extracted from i-t traces like thosedisplayed in Figures 3a−3c. Unlike the Hg, there is no clearcorrelation between concentration and number of collisions inthis case. This, and the large error bars, are probably aconsequence of the fact that electrocatalytically active PtNPsaccumulate on the Au surface and continue to catalyze N2H4oxidation long after the original collision event is over. Incontrast, recall that PtNPs are quickly deactivated when theystrike the Hg electrode. The normalized collision frequencies(eq 1) over the six PtNP concentrations range from 0.014−0.069 pM−1 s−1. The maximum frequency obtained usingmicroelectrochemical devices having Au electrodes is similar tothat for Hg (0.069 vs 0.065 pM−1 s−1, respectively). However,the maximum frequency achieved using microelectrochemicaldevices having Au electrodes is two to three times larger thanthe maximum frequency reported (0.02 pM−1 s−1 for ∼3.6 nmPtNPs)2 or measured by us (0.019 ± 0.006 pM−1 s−1, for ∼5.5nm PtNPs, Figure S6) in standard electrochemical cellsoutfitted with Au electrodes.Collision-Based Sizing of PtNPs. Previously, the total
charge (Hg electrodes)21 or current amplitude (Au electrodes)1
from individual current transients, measured using standardelectrochemical cells, has been used to estimate the size ofPtNPs. Specifically, eq 2 expresses the charge (q) under eachspike arising from the collision of a PtNP of radius r with a Hg
electrode.21 Likewise, eq 3 correlates the steady-state current(iss) amplitude to the radius of a PtNP colliding with an Auelectrode.1 The other variables in eqs 2 and 3 are as follows: n isthe number of electrons transferred, which in this case is 4 (eq4), F is the Faraday constant, D is the diffusion coefficient ofN2H4 (9.1 × 10⁻⁶ cm2 s−1),2 C is the concentration of N2H4(15.0 mM), and t represents time.1,21
= Πq nFDCrt4 (ln 2) (2)
= Πi nFDCr4 (ln 2)ss (3)
+ = + +− −N H 4OH N 4H O 4e2 4 2 2 (4)
Though both eqs 2 and 3 neglect the influence of flow ratewe considered their use in this system to be reasonable, becauseparabolic flow leads to low flow rates near the electrodesurface.31 This approximation is given some credence by theclose correspondence between the average size calculated usingeqs 2 and 3 (5.1 ± 3 and 5.3 ± 2 nm, respectively, Figure S7)and the size determined by TEM (5.5 ± 2 nm, Figure S1).Multiphysics simulations were carried out to further validate
the use of eqs 2 and 3 for describing PtNP collisions under flowconditions. We considered the case of a 5.5 nm sphere locatedon the channel floor and at various fixed heights above theelectrode (1.0−9.0 μm) under flow (0.050, 5.0, and 50 nLmin−1) to evaluate the effects of convection. The simulationresults show that the role of convection is negligable in relationto the collision amplitude. This is true when considering twokey attributes: (1) the small size of the diffusion layer producedby the redox processes occurring at the PtNP surface and (2)the decreased linear flow velocity that occurs near the electrodesurface (in the vicinity of the diffusion layer) due to edgeeffects. A complete discussion of the multiphysics simulationscan be found in the Supporting Information.
Effect of Flow Rate on PtNP Collisions. Thus, far wehave only discussed experimental results for a single flow rate:0.05 nL min−1. However, a clear advantage of micro-electrochemical devices over standard electrochemical cellsinvolves the ability to increase the rate of mass transfer of NPsto the working electrode via convection.Figure 4 presents two plots of collision frequency as a
function of flow rate at Hg (Figure 4a) and Au (Figure 4b)electrodes in the presence of 1.0 pM PtNPs. In both cases nocollisions are observed under no-flow conditions (0 nL min−1),because the NPs are delivered into one of the reservoirs ratherthan directly to the vicinity of the electrode (Scheme 2).Over the range of flow rates examined (up to 50 nL min−1),
the collision data from microelectrochemical devices employingHg electrodes can be described as having three frequencyregimes. Initially, as the flow rate increases from 0.050 to 2.0 nLmin−1, the frequency of collisions increases from 0.0087 to0.039 s−1. The collision frequency then approaches a near-constant value of ∼0.03 s−1 at flow rates between 2.0 and 10.0nL min−1. Finally, at 25.0 and 50.0 nL min−1, the frequencydecreases to 0.019 and 0.0042 s−1, respectively. The situationfor microelectrochemical devices having Au electrodes (Figure4b) is somewhat different. At low flow rates (0.050 to 0.40 nLmin−1), the collision frequency remains constant at ∼0.040 s−1.However, at higher flow rates the frequency decreases from0.023 to 0 s−1. Although we are unsure of the origin of thedifferences in the two plots shown in Figure 4, we speculatethat there are three possiblities: (1) an unequal distribution ofcitrate-capped PtNPs in the channel under flow, (2) differences
Figure 3. (a−c) Chronoamperometric (i-t) traces obtained using amicroelectrochemical device outfitted with an Au electrode in theabsence (black trace) and presence (red traces) of 5.5 nm PtNPs at thefollowing concentrations: (a) 1.0 pM, (b) 2.0 pM, and (c) 16 pM. Thesolution contained 15.0 mM N2H4 and 50.0 mM phosphate buffer(pH 7.5), the flow rate was 0.05 nL min−1, and the Au electrodepotential was held at −0.050 V vs Ag/AgCl (3.4 M KCl). (d) Plotshowing the correlation between the number of collisions (measuredover 300 s) and concentration for 5.5 nm PtNPs. The error barsrepresent the standard deviation for three experiments per PtNPconcentration. All data were obtained using a total of threeindependently prepared microelectrochemical devices. The inset in(d) shows an expanded view of the transient indicated by an asterisk in(a).
Langmuir Article
dx.doi.org/10.1021/la503628h | Langmuir 2014, 30, 13462−1346913466

in electrode geometry, and (3) physicochemical effects. Theseare discussed next.Previous studies have found lower concentrations of NPs
(diameter = 64−100 nm) near micro- and nanofluidic channelwalls relative to their concentration in the center of the fluidicchannel.32−35 These findings were attributed primarily toelectrostatic repulsion between the negatively-charged particlesand channel walls. Such electrostatic effects are influenced bythe ionic strength of the solution used. In our studies the ionicstrength is ∼3 times higher than in an earlier report,32 butnevertheless electrostatic effects could play a role indetermining the local concentration of PtNPs. Additionally,the Hg electrode (3.4 ± 2 μm in height) extends further intothe fluidic channel than the Au electrode (0.1 μm in height).Because the Hg electrode extends away from the channel walls,it might be able to sample more PtNPs relative to Auelectrodes. Additionally, differences in physicochemical param-eters, such as the point-of-zero charge of the electrode, mayhave some influence on the results observed in Figure 4.Because convection increases the rate of mass transfer of
PtNPs in microelectrochemical devices, PtNP collisions shouldbe observed at lower concentrations relative to electrodes instandard electrochemical cells. We tested this hypothesis byevaluating the LOD for collisions using the optimal flow rates(flow rates yielding the highest collision frequency). FromFigure 4, the highest collision frequencies were measured at 2.0
(frequency = 0.039 s−1) and 0.050 nL min−1 (frequency =0.040 s−1) on Hg and Au electrodes, respectively.The LOD studies were carried out in a manner similar to that
used to collect the data for Figures 2 and 3. The exceptionswere the use of the aforementioned optimal flow rates, lowerPtNP concentrations, and preparation of three independentlyprepared microelectrochemical devices having Au electrodesper PtNP concentration (The use of multiple devices in thecase of Au electrodes is necessary because PtNPs adhereirreversibly to Au electrodes, and hence only a single collisionexperiment can be carried out on each device.).Figure 5a displays a single i-t trace for 0.050 pM PtNPs
flowing (2.0 nL min−1) through a microelectrochemical device
having a Hg electrode. The part of this trace in which fourcollisions are observed is expanded in the inset (Figure 5c).Experiments like the one displayed in Figure 5a were replicatedthree times at six different PtNP concentrations. A plot ofcollision frequency as a function of PtNP concentration (Figure5c) yields a linear correlation (R2 = 0.99). Using these data, theLOD, calculated as 3 times the standard deviation divided bythe slope, is 0.084 pM.36 This value is more than eight timeslower than the lowest PtNP concentration previously measuredon Hg electrodes using standard electrochemical cells: 0.7 pMfor ∼4.7 nm PtNPs.21
Figure 4. Plot of the collision frequency (measured over 600 s) as afunction of flow rate measured at (a) Hg and (b) Au electrodes inmicroelectrochemical devices. The i-t curves used to construct this plotwere measured using a solution containing 15.0 mM N2H4, 50.0 mMphosphate buffer (pH 7.5), and 1.0 pM 5.5 nm PtNPs. The electrodepotential was held at −0.05 V vs Ag/AgCl (3.4 M KCl). The insetsrepresent expanded views of the low flow rate region. The error bars inboth plots represent the standard deviation for three experiments perPtNP concentration. All data in (a) were obtained using a total ofthree independently prepared microelectrochemical devices having Hgelectrodes. The data in (b) were obtained using 39 micro-electrochemical devices having Au electrodes (three independentlyprepared devices per point).
Figure 5. Chronoamperometric (i-t) traces obtained using micro-electrochemical devices outfitted with (a) Hg and (b) Au electrodes.The solutions contained 15.0 mM N2H4, 50.0 mM phosphate buffer(pH 7.5), and 0.050 pM PtNPs. The electrode potential was held at−0.05 V vs Ag/AgCl (3.4 M KCl). The flow rates were (a) 2.0 nLmin−1 and (b) 0.05 nL min−1. The arrows in (b) indicate the locationof three collisions. (c−d) Plots of collision frequency (measured over300 s) as a function of the concentration of 5.5 nm PtNPs. The errorbars in (c) represent the standard deviation for three experiments perPtNP concentration. All data in (c) were obtained using a total ofthree independently prepared microelectrochemical devices. The errorbars in (d) represent the standard deviation for three experiments perPtNP concentration. The data in (d) were obtained using a total of 18independently prepared microelectrochemical devices (three devicesper PtNP concentration). The inset in (c) shows an expanded view offour transients observed in (a).
Langmuir Article
dx.doi.org/10.1021/la503628h | Langmuir 2014, 30, 13462−1346913467

Figure 5b displays an i-t trace recorded under similarconditions to that in Figure 5a, except the electrode was Au andthe flow rate was 0.05 nL min−1. In this case, just threecollisions, indicated by arrows, are observed. On the basis ofexperiments like this, the LOD was determined to be 0.27 pM(Figure 5d). This LOD is nearly four times lower than thelowest PtNP concentration previously determined using Auelectrodes within standard electrochemical cells: 1.0 pM for∼3.6 nm PtNP.2
■ SUMMARY AND CONCLUSIONS
In this report we have compared collision dynamics betweenPtNPs and Hg and Au electrodes under flowing conditions.The important results are as follows. First, the PtNP LOD wasfound to be as low as 0.084 pM in the microelectrochemicaldevice, which is approximately eight times lower than thelowest PtNP concentration measured in a standard electro-chemical cell. Second, convection enhances the mass transfer ofPtNPs to the electrode surface, which increases the frequencyof collisions from ∼0.02 pM−1 s−1 in standard electrochemicalcells to ∼0.07 pM−1 s−1 in microelectrochemical devices. Third,we were able to determine the size of PtNPs as previouslyreported by both the Bard2 and Stevenson21 groups. The roleof convection is mixed: it enhances the rate of arrival of thePtNPs to the electrode surface, but it does not increase thecurrent amplitude.Our interest in ECA is currently directed toward using it as a
method for chemical sensing (particularly for DNA), and thefindings described here are important because they highlightsome of the advantages and limitations of microelectrochemicalcells for this purpose. The principle advantage of usingmicroelectrochemical cells versus standard electrochemicalcells involves the higher rate of mass transfer due to convection.However, we discovered that the distribution of PtNPs withinthe flow profile is irregular (Figure 4) and electrostaticrepulsion may be responsible. If this is true, then it may bedifficult to obtain similar LODs for DNA-modified PtNPconjugate collisions within a microelectrochemical device,5
given the negative charge of the DNA phosphodiesterbackbone (one negative charge per nucleotide). Currently, weare evaluating the use of both naked and single-stranded,thiolated DNA (ssDNA-SH) modified Hg electrodes in thepresence of both ssDNA-SH-modified and naked PtNPs todetermine the effect that DNA modification has on ECAexperiments. There are a number of key questions that we hopeto answer in forthcoming publications. For example, is itpossible to decrease the influence of electrostatic repulsion bymodifying the channel walls with a neutral surfactant orcovalently linked monolayer (e.g., octadecyltrichlorosilane)33 orby increasing the electrolyte concentration? Second, we havepreviously reported that very high collision frequencies (2.35 ×10³ pM−1 s−1) can be obtained by enhancing mass transfer withmagnetic fields.6 Those studies were carried out usingmicrobeads, but we think it may be possible to gain thissame advantage using nanoparticles having a magnetic core anda catalytic shell.37−39 Third, why are larger collision transients(∼1 nA; Figure 2a−c and 3a−c) observed in micro-electrochemical devices relative to standard electrochemicalcells?
■ ASSOCIATED CONTENT*S Supporting InformationElectron micrographs of PtNPs, additional device fabricationdetails, supplementary electrochemical data, electrochemicalsizing of PtNPs, and details regarding finite element simulations(FESs). This material is available free of charge via the Internetat http://pubs.acs.org.
■ AUTHOR INFORMATIONCorresponding Authors*Phone: 512-232-9160. E-mail: [email protected].*Phone: 512-475-8674. E-mail: [email protected] authors declare no competing financial interest.
■ ACKNOWLEDGMENTSWe gratefully acknowledge financial support from the U.S.Defense Threat Reduction Agency (Grant No. HDTRA1-11-1-0005). R.M.C. thanks the Robert A. Welch Foundation (GrantF-0032) for sustained research support. We would also like tothank Ms. Elizabeth G. Nettleton for preparing the Si/SiO2/Ptsubstrates and Ms. Nellymar Membreno for the TEM images ofthe PtNPs. We are indebted to Prof. Allen J. Bard (UT Austin)and Prof. Bo Zhang (University of Washington) for helpfuldiscussions. Additionally, we are grateful to Dr. ShouliangZhang (TMI/CNM, UT Austin) for assistance with SEMmeasurements.
■ REFERENCES(1) Bard, A. J.; Zhou, H.; Kwon, S. J. Electrochemistry of SingleNanoparticles via Electrocatalytic Amplification. Isr. J. Chem. 2010, 50,267−276.(2) Xiao, X.; Fan, F.-R. F.; Zhou, J.; Bard, A. J. Current Transients inSingle Nanoparticle Collision Events. J. Am. Chem. Soc. 2008, 130,16669−16677.(3) Park, J. H.; Thorgaard, S. N.; Zhang, B.; Bard, A. J. Single-ParticleDetection by Area Amplification: Single-Wall Carbon NanotubeAttachment to a Nanoelectrode. J. Am. Chem. Soc. 2013, 135, 5258−5261.(4) Kim, J.; Kim, B.-K.; Cho, S. K.; Bard, A. J. TunnelingUltramicroelectrode: Nanoelectrodes and Nanoparticle Collisions. J.Am. Chem. Soc. 2014, 136, 8173−8176.(5) Alligrant, T. M.; Nettleton, E. G.; Crooks, R. M. Electrochemicaldetection of individual DNA hybridization events. Lab Chip 2013, 13,349−354.(6) Yoo, J. J.; Anderson, M. J.; Alligrant, T. M.; Crooks, R. M.Electrochemical Detection of Insulating Beads at SubattomolarConcentration via Magnetic Enrichment in a Microfluidic Device.Anal. Chem. 2014, 86, 4302−4307.(7) Park, J. H.; Boika, A.; Park, H. S.; Lee, H. C.; Bard, A. J. SingleCollision Events of Conductive Nanoparticles Driven by Migration. J.Phys. Chem. C 2013, 117, 6651−6687.(8) Zhou, H.; Park, J. H.; Fan, F.-R. F.; Bard, A. J. Observation ofSingle Metal Nanoparticle Collisions by Open Circuit (Mixed)Potential Changes at an Ultramicroelectrode. J. Am. Chem. Soc.2012, 134, 13212−13215.(9) Guo, Z.; Percival, S. J.; Zhang, B. Chemically Resolved TransientCollision Events of Single Electrocatalytic Nanoparticles. J. Am. Chem.Soc. 2014, 136, 8879−8882.(10) Fernando, A.; Parajuli, S.; Alpuche-Aviles, M. A. Observation ofIndividual Semiconducting Nanoparticle Collisions by StochasticPhotoelectrochemical Currents. J. Am. Chem. Soc. 2013, 135,10894−10897.(11) Sardesai, N. P.; Andreescu, D.; Andreescu, S. ElectroanalyticalEvaluation of Antioxidant Activity of Cerium Oxide Nanoparticles by
Langmuir Article
dx.doi.org/10.1021/la503628h | Langmuir 2014, 30, 13462−1346913468

Nanoparticle Collisions at Microelectrodes. J. Am. Chem. Soc. 2013,135, 16770−16773.(12) Kwon, S. J.; Bard, A. J. Analysis of Diffusion-ControlledStochastic Events of Iridium Oxide Single-Nanoparticle Collisions byScanning Electrochemical Microscopy. J. Am. Chem. Soc. 2012, 134,7102−7108.(13) Wakerley, D.; Guell, A. G.; Hutton, L. A.; Miller, T. S.; Bard, A.J.; Macpherson, J. V. Boron doped diamond ultramicroelectrodes: ageneric platform for sensing single nanoparticle electrocatalyticcollisions. Chem. Commun. 2013, 49, 5657−5659.(14) Park, J. H.; Zhou, H.; Percival, S. J.; Zhang, B.; Fan, F.-R. F.;Bard, A. J. Open Circuit (Mixed) Potential Changes Upon ContactBetween Different Intert Electrodes-Size and Kinetic Effects. Anal.Chem. 2013, 85, 964−970.(15) Rees, N. V.; Zhou, Y.-G.; Compton, R. G. Making contact:charge transfer during particle-electrode collisions. RSC Adv. 2012, 2,379−384.(16) Zhou, Y.-G.; Rees, N. V.; Compton, R. G. The ElectrochemicalDetection and Characterization of Silver Nanoparticles in AqueousSolution. Angew. Chem., Int. Ed. 2011, 50, 4219−4221.(17) Zhou, Y.-G.; Rees, N. V.; Compton, R. G. The electrochemicaldetection of tagged nanoparticles via particle-electrode collisions:nanoelectroanalysis beyond immobilisation. Chem. Commun. 2012, 48,2510−2512.(18) Ly, L. S. Y.; Batchelor-McAuley, C.; Tschulik, K.; Katelhon, E.;Compton, R. G. A Critical Evaluation of the Interpretation ofElectrocatalytic Nanoimpacts. J. Phys. Chem. C 2014, 118, 17756−17763.(19) Kleijn, S. E. F.; Lai, S. C. S.; Miller, T. S.; Yanson, A. I.; Koper,M. T. M.; Unwin, P. R. Landing and Catalytic Characterization ofIndividual Nanoparticles on Electrode Surfaces. J. Am. Chem. Soc.2012, 134, 18558−18561.(20) Kleijn, S. E. F.; Serrano Bou, B.; Yanson, A. I.; Koper, M. T. M.Influence of Hydrazine-Induced Aggregation on the ElectrochemicalDetection of Platinum Nanoparticles. Langmuir 2013, 29, 2054−2064.(21) Dasari, R.; Robinson, D. A.; Stevenson, K. J. UltrasensitiveElectroanalytical Tool for Detecting, Sizing, and Evaluating theCatalytic Activity of Platinum Nanoparticles. J. Am. Chem. Soc. 2013,135, 570−573.(22) Dasari, R.; Walther, B.; Robinson, D. A.; Stevenson, K. J.Influence of the Redox Indicator Reaction on Single NanoparticleCollisions at Mercury and Bismuth Modified Pt Ultramicroelectrodes.Langmuir 2013, 29, 15100−15106.(23) Dasari, R.; Tai, K.; Robinson, D. A.; Stevenson, K. J.Electrochemical Monitoring of Single Nanoparticle Collisions atMercury-Modified Platinum Ultramicroelectrodes. ACS Nano 2014, 8,4539−4546.(24) Kwon, S. J.; Zhou, H.; Fan, F.-R. F.; Vorobyev, V.; Zhang, B.;Bard, A. J. Stochastic electrochemistry with electrocatalytic nano-particles at inert ultramicroelectrodestheory and experiments. Phys.Chem. Chem. Phys. 2011, 13, 5394−5402.(25) Bigall, N. C.; Hartling, T.; Klose, M.; Simon, P.; Eng, L. M.;Eychmuller, A. Monodisperse Platinum Nanospheres with AdjustableDiameters from 10 to 100 nm: Synthesis and Distinct OpticalProperties. Nano Lett. 2008, 8, 4588−4592.(26) Jentys, A. Estimation of the mean size and shape of small metalparticles by EXAFS. Phys. Chem. Chem. Phys. 1999, 1, 4059−4063.(27) Xia, Y.; Whitesides, G. M. Soft Lithography. Angew. Chem., Int.Ed. 1998, 37, 550−575.(28) Powell, M.; Ball, J. C.; Tsai, Y.-C.; Suarez, M. F.; Compton, R.G. Square Wave Anodic Stripping Voltammetry at Mercury-PlatedElectrodes. Simulation of Surface Morphology Effects on Electro-chemically Reversible, Irreversible, and Quasi-reversible Processes:Comparision of Thin Films and Microdroplets. J. Phys. Chem. B 2000,104, 8268−8278.(29) Wu, H. P. Nature and Stability of Mercury Thin Films on GlassyCarbon Electrodes under Fast-Scan Anodic Stripping Voltammetry.Anal. Chem. 1994, 66, 3151−3157.
(30) Bard, A. J.; Faulkner, L. R. Electrochemical Methods:Fundamentals and Applications; Wiley: New York, 2000.(31) Cooper, J. A.; Compton, R. G. Channel Electrodes - A Review.Electroanalysis 1998, 10, 141−155.(32) Li, H. F.; Yoda, M. Multilayer nano-particle image velocimetry(MnPIV) in microscale Poiseuille flows. Meas. Sci. Technol. 2008, 19,075402−075410.(33) Yoda, M.; Li, H. An experimental study of slip considering theeffects of non-uniform colloidal tracer distributions. J. Fluid Mech.2010, 662, 269−287.(34) Kazoe, Y.; Iseki, K.; Mawatari, K.; Kitamori, T. EvanescentWave-Based Particle Tracking Velocimetry for Nanochannel Flows.Anal. Chem. 2013, 85, 10780−10786.(35) Kanda, K.; Ogata, S.; Jingu, K.; Yang, M. Measurement ofParticle Distribution in Microchannel Flow Using a 3D-TIRFMTechnique. J. Vis. 2007, 10, 207−215.(36) Long, G. L.; Wineforder, J. D. Limit of Detection: A CloserLook at the IUPAC Definition. Anal. Chem. 1983, 55, 712A−724A.(37) Robinson, D. A.; Stevenson, K. J. Uniform epitaxial growth of Pton Fe3O4 Nanoparticles; synergetic enhancement to Pt activity for theoxygen reduction reaction. J. Mater. Chem. A 2013, 1, 13443−13453.(38) Melo, A. F. A. A.; Carvalho, V. A. N.; Pagnoncelli, K. C.;Crespilho, F. N. Single microparticle applied in magnetic-switchableelectrochemistry. Electrochem. Commun. 2013, 30, 79−82.(39) Santos, G. P.; Melo, A. F. A. A.; Crespilho, F. N. Magneticallycontrolled single-nanoparticle detection via particle-electrode colli-sions. Phys. Chem. Chem. Phys. 2014, 16, 8012−8018.
Langmuir Article
dx.doi.org/10.1021/la503628h | Langmuir 2014, 30, 13462−1346913469