Embed Size (px)
Citation preview

1
Single-molecule studies of the dynamics and interactions of bacterial
OXPHOS complexes
Tchern Lenna and Mark C. Leake
b,*
a School of Biological and Chemical Sciences, Queen Mary University of London,
Mile End Road, London, E1 4NS, UK. b Biological Physics Sciences Institute (BPSI), Departments of Physics and Biology,
University of York, York, YO10 5DD, UK
* Corresponding author. Tel: +44 1904 322697
Email address: [email protected] (M. Leake)
Highlights
Bacterial OXPHOS can be explored at the single-molecule level using advanced
fluorescence microscopy of fluorescent protein labelled cell strains
Bacterial OXPHOS components are dynamic in the cell membrane
OXPHOS supercomplexes, as evidenced in mitochondria, are not universally
found in all bacteria
Abstract
Although significant insight has been gained into biochemical, genetic and structural
features of oxidative phosphorylation (OXPHOS) at the single-enzyme level,
relatively little was known of how the component complexes function together in time
and space until recently. Several pioneering single-molecule studies have emerged
over the last decade in particular, which have illuminated our knowledge of
OXPHOS, most especially on model bacterial systems. Here, we discuss these recent
findings of bacterial OXPHOS, many of which generate time-resolved information of
the OXPHOS machinery with the native physiological context intact. These new
investigations are transforming our knowledge of not only the molecular arrangement
of OXPHOS components in live bacteria, but also of the way components
dynamically interact with each other in a functional state. These new discoveries have
important implications towards putative supercomplex formation in bacterial
OXPHOS in particular.
1. Introduction
The enzymes and substrates used by bacteria for chemiosmotic ATP synthesis are as
varied as the ecological niches they occupy. As autotrophs and/or heterotrophs living
phototrophically, chemolithotrophically, and/or organotrophically, bacteria can use
light, minerals and organic substrates as sources of reducing electrons for electron
transport chains that establish a proton motive force (pmf) by redox reactions coupled
to proton translocation, which can be vectoral (where protons are literally pumped
through channels in the enzyme) or scalar (where protons are chemically consumed
on one side of the membrane and liberated on the other). The pmf in turn is used to
power the rotary mechanism of the F1Fo-ATP synthase which produces ATP [1].
While there is great diversity in the enzymes and electron transport chains that allow
bacteria to ‘eat’ everything from photons and water, to elemental sulphur and sugars,

2
the basic mechanism of chemiosmotic ATP synthesis [2] is same and requires a pmf
across a membrane, established by correctly oriented electron transport chain
enzymes which effectively move protons across that membrane in the opposite
direction to that which protons must flow through the ATP synthase for ATP
synthesis.
Historically, the chemiosmotic ATP synthesis systems of the plant chloroplast and
mammalian mitochondrion are the bases of understanding the two classical modes of
chemiosmosis: photo-phosphorylation in the former and oxidative phosphorylation
(OXPHOS) in the latter [3]. Figure 1 schematises chemiosmotic ATP synthesis by
oxidative phosphorylation (OXPHOS) in the model heterotrophic bacterium
Escherichia coli, illustrating the metabolic flexibility of this organism. (For more
detail on E. coli OXPHOS genes, we refer the reader to the review by Magalon and
Alberge, BBA 2015, in this special issue and figure 1 of that review in particular).
This central metabolic pathway is governed by a multi-enzyme system that is
localized to bioenergetic membranes, but the organization and dynamics of
bioenergetic complexes in two dimensions in the plane of the membrane is not well
understood and has implications for the operation of the system as a whole. Two
extreme models of organization and dynamics can be envisaged: solid state or random
diffusion [4]. A solid state model implies that protein complexes are locked together
and substrates are channelled from one to the other, such that the efficiency of the
system would be limited by the turnover of the enzymes, whereas a random diffusion
model allows for the possibility that the concentration of components in the
membrane limits flux.
The presence of oxidative OXPHOS supercomplexes in mitochondria and bacteria [5-
10] and role of supercomplexing for channeling electrons [11] support of a solid state
model in mitochondria, but the relevance of supercomplexing to the catalytic kinetics
and efficiency of the system is disputed by alternative interpretations [12] of the data
of Lapuente-Braun et al [11]. Blaza et al [12] in fact suggest that while
supercomplexes exist in mitochondria, perhaps they have no physiological function
other than to allow optimal enzyme packing and thus improve overall efficiency of
OXPHOS at the level of the whole mitochondrion.
What is the situation in bacteria? The operation of bacterial electron transport chains
should be of great importance for those interested in killing or manipulating bacteria
for disease management, bioproduction and bioremediation. For instance, altering
levels of mobile electron carriers might have large effects for bacteria which operate a
random collision system, but might have little effect on bacteria that operate at solid
state system.
Fluorescence microscopy studies have allowed researchers to address the questions of
the organization and dynamics of bacterial OXPHOS components in live cells.
Traditional fluorescence imaging techniques involve exciting and collecting the
emitted fluorescence from all the fluorophores in the focal plane simultaneously.
Images are generated directly by photons landing on a 2-dimensional detector, which
translates the signal into a photon intensity map – or takes a photograph (confocal
images can be considered to be a photo-collage). Such images are diffraction-limited
in terms of spatial resolution to the typical optical resolution limit of ca. 200-300 nm

3
which is determined from the Abbe theory of optical diffraction to be roughly half the
wavelength of emitted light. These diffraction-limited fluorescence imaging
techniques suggested a heterogeneous distribution of OXPHOS complexes in the
plasma membranes of Bacillus subtilis [13] and Escherichia coli [14] and that
OXPHOS complexes are mobile in the bacterial membrane.
Single-molecule imaging approaches aim to build up a picture of the cell by observing
many molecules but individually, one at a time. Such approaches not only reveal the
overall trend for a population of molecules but also the population structure, showing
up heterogeneities that may be averaged out in an ensemble measurement. They also
have the advantage of being able to determine the location of molecules 10-50-fold
more accurately than in diffraction-limited imaging [15]. This is because the detected
emission from a point source of light on a two-dimensional detector is manifest as a
point spread function image of 200-300 nm width which can be fitted by an analytical
function (typically approximated by a 2D Gaussian profile) to determine the location
of the intensity centroid as the best estimate for the location of that source [16]. Such
studies on OXPHOS in bacteria have painted a detailed picture of bacterial OXPHOS
systems in live cells, which is suggestive of how the many enzymes might work
together to achieve ATP synthesis.
As far as we are aware, single-molecule fluorescence studies on bacterial OXPHOS
have only been carried out on E. coli [17-20]. These studies have characterized the
patches of OXPHOS complexes that have been observed by ensemble average
imaging to unprecedented levels of detail. They have also catalogued the mobility of
complexes in the membrane, taking advantage of the improved spatial resolution of
single molecule approaches, revealing that the movement of complexes is not
uniform. They have thus begun to address the question of how OXPHOS complexes
relate to each other spatially.
2. Heterogeneous Patching
To date, the quinone reducing enzymes: type 1 NADH dehydrogenase (NDH-1) [21,
22] and succinate dehydrogenase (SDH) [23], quinol oxidising enzymes: the
Cytochrome bo [24] and Cytochrome bd-1 complexes [25-27], and the F1Fo-ATP
synthase [28, 29] have been functionally fluorescent-protein labelled and expressed
from native loci in E. coli cells (Table 1). By ensemble average imaging, all of these
complexes were observed to be heterogeneously distributed in the E. coli membrane
and apparently localized in mobile clusters [17, 30]. A more precise single-molecule
approach was taken to study these apparent clusters in order to tease out details such
at the variation in the number of complexes in each cluster, the distribution of
physical sizes of the clusters and the diffusional behaviour of individual clusters or
complexes [17, 19].
Single-molecule counting methods (see Box 1), developed originally from
stoichiometry studies of torque-generating components of the bacterial flageller motor
[31], revealed that these clusters are heterogeneous in terms of the number of
complexes located within them (Table 2). The clusters are also expected to be
variable in size as estimated by the comparison of the apparent full width at half
maximum (FWHM) of the individual clusters to that of a single fluorophore in the

4
same microscope [17].
PALM (Photo-Activation Localisation Microscopy) imaging of Cytochrome bd-1 and
NDH-1 in fixed cells gives a more detailed picture of the arrangement of these
complexes in the membrane [19], see Box 2. Consistent with the broad distributions
that were suggested by diffraction-limited imaging, the clusters of complexes were
inconsistent in shape and population and appear randomly located in the plane of the
membrane. Single complexes were interspersed between clusters confirming that the
apparent clusters of proteins observed in diffraction-limited images are in fact rather
loose associations of proteins rather than rigid structures. In this case of fixed cells,
proteins were therefore assumed to be immobile, with complexes functionally tagged
with the photo-switchable fluorescent protein mMaple [32]. Localizations of mMaple
were calculated according to Lee et al. (2012) [33] and the images were rendered
similarly to Betzig et al. (2006) [34] and interpreted qualitatively.
3. Two modes of Diffusion
Additional evidence for the patchwork organisation of OXPHOS complexes comes
from observing the diffusional behavior of single OXPHOS complexes in the E. coli
membrane. The mean squared displacement (MSD) vs time interval relation of a
proportion of tracked fluorescent spots in [17] and [19] plateau, indicating confined
diffusion of molecules within a membrane domain of approximately 100 nm in
diameter. Renz et al. (2012) [18] suggest that this is an artefact of a small imaging
window due to the curvature of the cell, however, Renz et al. (2012) [18]
inconsistently report the width of the short axis of an E. coli cell, reporting 500 nm in
the discussion, while the total internal reflection fluorescence (TIRF) micrograph
shown with 1 m scale bar seems to indicate a width closer to 1 m. Also, the
diffusion coefficient D used in the simulation data that demonstrates that diffusion
perpendicular to the long axis of the cell is systematically underestimated, is
approximately twice that calculated for the real data. The conclusions of the paper
would be more convincing if the authors had shown window size dependency of
calculated D over a range of diffusion coefficients as the authors themselves state that
the ‘size limit should increase with faster diffusion’. Conversely the size limit should
decrease with slower diffusion - i.e. the diffusion coefficient of proteins in an E. coli
cell might not be underestimated estimation for slow moving objects (D < 0.18
m2/s). In fact, for Llorente-Garcia et al. [19], the complexes observed had a mean D
of 0.007 m2/s and the authors report similar dimensional diffusion coefficient
perpendicular or parallel to the long axis of the cells. The Bayesian ranking of
diffusion (BARD) analysis [35] (see Box 3) used to classify tracks in Llorente-Garcia
et al., [19] is a proposed solution to the problem of short tracks mentioned in Renz et
al., 2012 [18]. Llorente-Garcia et al., [19] detected both classes of tracks with MSD vs
time plots that did plateau (i.e. putative confined diffusion) and tracks that did not (i.e.
putative free Brownian diffusion). If the confined diffusion was an artifact, surely all
tracks would appear confined. Finally, it is worth noting that Llorente-Garcia et al.
[19] only used tracks that contained 5 consecutive data points (i.e. could be tracked
for at least 5 frames) whereas Renz et al. 2012 [18] seems to have included shorter
tracks. This may be the reason for the discrepancy in D as selecting only longer tracks
may have biased sampling to slow moving complexes as fast moving complexes may
have moved out of the field of view within 4 frames. Nonetheless free and confined
diffusion of OXPHOS complexes have been observed in E. coli.
5
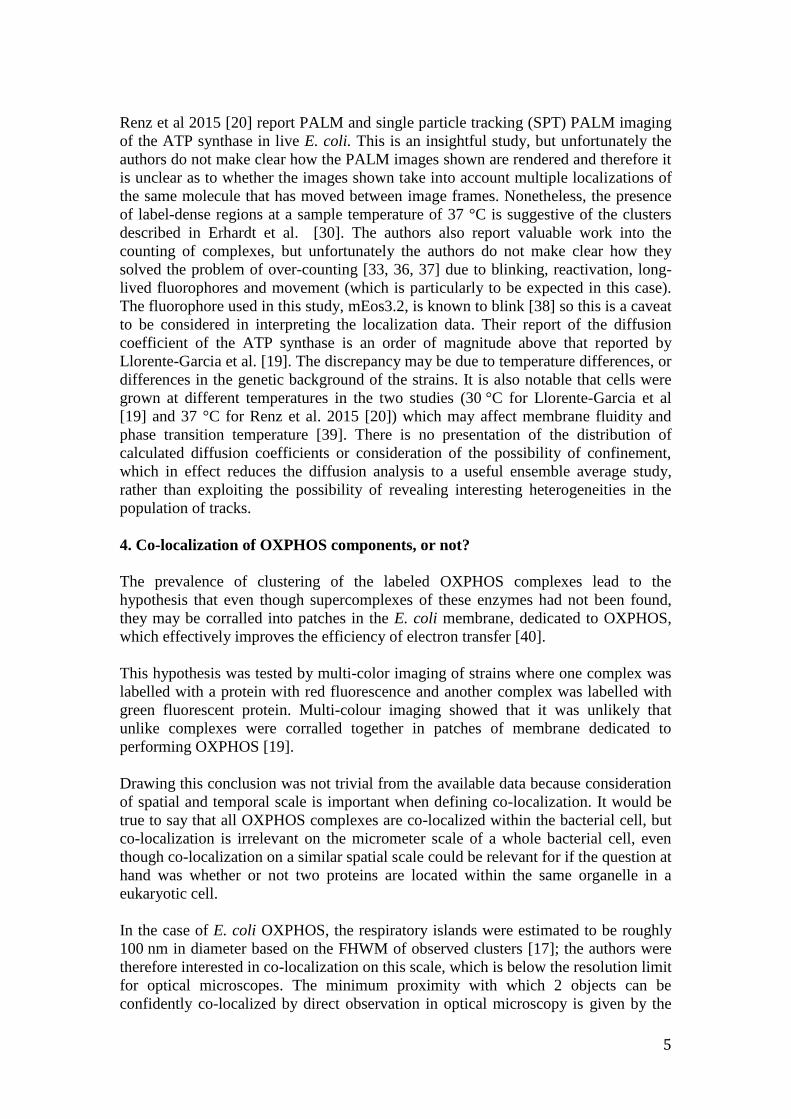
Renz et al 2015 [20] report PALM and single particle tracking (SPT) PALM imaging
of the ATP synthase in live E. coli. This is an insightful study, but unfortunately the
authors do not make clear how the PALM images shown are rendered and therefore it
is unclear as to whether the images shown take into account multiple localizations of
the same molecule that has moved between image frames. Nonetheless, the presence
of label-dense regions at a sample temperature of 37 °C is suggestive of the clusters
described in Erhardt et al. [30]. The authors also report valuable work into the
counting of complexes, but unfortunately the authors do not make clear how they
solved the problem of over-counting [33, 36, 37] due to blinking, reactivation, long-
lived fluorophores and movement (which is particularly to be expected in this case).
The fluorophore used in this study, mEos3.2, is known to blink [38] so this is a caveat
to be considered in interpreting the localization data. Their report of the diffusion
coefficient of the ATP synthase is an order of magnitude above that reported by
Llorente-Garcia et al. [19]. The discrepancy may be due to temperature differences, or
differences in the genetic background of the strains. It is also notable that cells were
grown at different temperatures in the two studies (30 °C for Llorente-Garcia et al
[19] and 37 °C for Renz et al. 2015 [20]) which may affect membrane fluidity and
phase transition temperature [39]. There is no presentation of the distribution of
calculated diffusion coefficients or consideration of the possibility of confinement,
which in effect reduces the diffusion analysis to a useful ensemble average study,
rather than exploiting the possibility of revealing interesting heterogeneities in the
population of tracks.
4. Co-localization of OXPHOS components, or not?
The prevalence of clustering of the labeled OXPHOS complexes lead to the
hypothesis that even though supercomplexes of these enzymes had not been found,
they may be corralled into patches in the E. coli membrane, dedicated to OXPHOS,
which effectively improves the efficiency of electron transfer [40].
This hypothesis was tested by multi-color imaging of strains where one complex was
labelled with a protein with red fluorescence and another complex was labelled with
green fluorescent protein. Multi-colour imaging showed that it was unlikely that
unlike complexes were corralled together in patches of membrane dedicated to
performing OXPHOS [19].
Drawing this conclusion was not trivial from the available data because consideration
of spatial and temporal scale is important when defining co-localization. It would be
true to say that all OXPHOS complexes are co-localized within the bacterial cell, but
co-localization is irrelevant on the micrometer scale of a whole bacterial cell, even
though co-localization on a similar spatial scale could be relevant for if the question at
hand was whether or not two proteins are located within the same organelle in a
eukaryotic cell.
In the case of E. coli OXPHOS, the respiratory islands were estimated to be roughly
100 nm in diameter based on the FHWM of observed clusters [17]; the authors were
therefore interested in co-localization on this scale, which is below the resolution limit
for optical microscopes. The minimum proximity with which 2 objects can be
confidently co-localized by direct observation in optical microscopy is given by the

6
point spread function width of the microscope, or typically 200-300 nm - i.e. two
subunits unit of a small protein complex that are in contact with each other can appear
just as ‘co-localized’ as two proteins that are independently floating within a round
corral that is 300 nm in diameter. For mobile objects, timescale is also an important
consideration as one would want to distinguish between objects that have
independently explored the same area in the field of view within the temporal
observation window, and objects that are stably associated over time.
In Llorente-Garcia et al. [19], images were recorded with a 40 ms camera exposure
time (this being the temporal resolution in this study) and co-localization of OXPHOS
complexes was considered on various time scales.
On the time scale of seconds, co-localization was measured by analyzing frame
averaged images of 25 consecutive image frames. These images revealed the
aforementioned immobile/slow-moving patches as bright regions in the field of view.
Qualitative analysis of the images clearly showed that the immobile/slow-moving
patches of the two complexes observed in each cell strain tended to be located in
different parts of the cell. A more quantitative analysis measured co-localization in
approximately 20% of the pixels and a similar result was obtained on a 40 ms (i.e.
single image frame) time scale (see Box 4). However these metrics were obtained in
an ensemble imaging approach - limited by the optical resolution of the microscope.
A single-molecule approach was also taken, by allowing the sample to photobleach
until single diffusing spots in each channel were seen. In sections of the video where
single spots could be simultaneously tracked in both channels for at least 5 image
frames, the overlap integral of fluorescent spots (approximated as the overlap of two
2D Gaussian intensity profiles) was calculated at each time point. Co-localization was
defined as an overlap score of at least 0.2, according to the Raleigh resolution
criterion. The percentage of time points where spots were co-localized was less than
but close to the frequency predicted by chance proximity due to random walking. Co-
localization events were therefore not frequent enough to be reasonably due to
anything more than ‘chance meetings’ of randomly diffusing complexes in the cell
membrane.
The authors conclude that NDH-1 is not co-localized with Cytochrome bd-1 nor SDH
and Cytochrome bd-1 does not co-localize with ATP synthase, except when,
apparently by chance, two complexes, or two patches of complexes, happen to drift
close to each other. There are no data for combinations of NDH-1 and Cytochrome
bo, nor ATP synthase with any other complexes. Unfortunately the double-labelled
cell mutants tested did not include combinations of OXPHOS supercomplexes which
have been suggested in E. coli [10, 41, 42].
5. Summary and Further questions
We observe: 1) the existence of patches of complexes; 2) a lack of co-localization of
the pairs of complexes observed; 3) a fluorescent ubiquinone analog, NBDHA-Q, is
not patchy in the membrane and diffuses much faster than OXPHOS complexes; 4)
the oxygen consumption rate scaled in proportion to the diffusion coefficient of
NBDHA-Q [19]. These observations suggest that the rate of electron transport
through OXPHOS is limited not by the slow mobility of the membrane patches in E.
7
coli, but rather by the mobility of the delocalized NBDHA-Q. In other words, that the
entire cell membrane should be considered to be a single electron-transport
compartment, rather than a patchwork of closed electron transport circuits. While
OXPHOS supercomplexes have been suggested from biochemical data in E. coli [10,
41, 42], the physiological function of these supercomplexes and the metabolic flux
through them in vivo is as yet unclear. Currently, random collision accounts better for
the mechanism of electron transport in E. coli than a solid state model, see Fig. 2.
What about protons? In vivo 2-color imaging of the ATP synthase and SDH in B.
subtilis [13] did not suggest co-localization and neither was Cytochrome bd-1 co-
localized with ATP synthase in E. coli [19]. There is no in vivo evidence for localized
proton circuits. However, the ATP synthase activity, along with NADH oxidation
activity, was found to be higher in membrane vesicles containing flagella, than
unflagellated vesicles - there was apparent Förster Resonance Energy Transfer
between fluorescently labelled flagellar motor components and subunits of these
OXPHOS complexes, however the authors do not demonstrate that the fluorescently
labelled peptides are incorporated into active complexes [43]. Nonetheless, the
immobile/slow moving spots of OXPHOS complexes observed by Llorente-Garcia et
al. [19] may be complexes associated with the flagellar motor, which is also immobile
in the membrane - providing a local ‘power pack’. (But note, a dual-fluorophore
labelled NDH-1-ATP synthase mutant has not yet been reported). Local pmf-power
plants, close to proton-consuming processes is an attractive hypothesis but is yet to be
proven.
Single-molecule fluorescence studies of OXPHOS in bacteria have concentrated on
the genetically tractable model E. coli. They show that in this bacterium, OXPHOS
complexes tend to patch in the membrane but only with like-complexes. Given that
ubiquinol appears to be uniformly distributed and is fast diffusing, electron transport
in E. coli is likely occur by random collisions of freely diffusing quinone/quinol
molecules with relatively slow moving OXPHOS enzymes that do not tend to mingle.
These single-molecule studies have also given us a unique view of the E. coli
membrane, which appears to be a patchwork rather than a homogenous mixture. How
this patchwork arises is still a mystery, as is its physiological significance, if any. Is
the explanation of Blaza et al. [12] for supercomplexing in mitochondria also
applicable to the E. coli membrane? Is patching the evolutionary solution to optimally
pack the membrane with apparatus for energy production and other metabolic
processes, transport, secretion, motility, cell division and sensing? Is this patchiness
of proteins truly a generic feature of bacterial membrane architecture and what are the
implications for membrane function?
From an ecological/evolutionary perspective, it is also interesting to ask if there is a
fitness advantage for E. coli to have OXPHOS complexes in patches rather than
dispersed and while disruption in supercomplex formation is seen in mitochondrial
dysfunction [44], how important are supercomplexes for bacterial OXPHOS?
Rich veins of research have been opened up by single-molecule imaging of bacterial
OXPHOS. Quantitatively considering the organisation and dynamics of OXPHOS
components in space and time provide excellent examples of experimental single-
molecule cellular biophysics and single-molecule cell biology in practice. These

8
experiments are a good demonstration of just how far light microscopy has come
since its inception over 300 years ago [15, 16, 45-67].
9
Acknowledgements
M.C.L was funded in part by the Biological Physical Sciences Institute (BPSI) at
York University and from a Royal Society University Research Fellowship.
References
1 Stock D, Gibbons C, Arechaga I, Leslie AG, Walker JE. The rotary mechanism of ATP synthase. Curr Opin Struct Biol 2000, 10: 672-679 2 Mitchell P. Coupling of phosphorylation to electron and hydrogen transfer by a chemi-osmotic type of mechanism. Nature 1961, 191: 144-148 3 Nicholls DG, Ferguson SJ. Bioenergetics 3. San Diego, Calif.: Academic Press 2002 4 Lenaz G, Genova ML. Kinetics of integrated electron transfer in the mitochondrial respiratory chain: random collisions vs. solid state electron channeling. Am J Physiol Cell Physiol 2007, 292: C1221-1239 5 Dudkina NV, Kouril R, Peters K, Braun H-P, Boekema EJ. Structure and function of mitochondrial supercomplexes. Biochimica et biophysica acta 2010, 1797: 664-670 6 Dudkina NV, Heinemeyer J, Sunderhaus S, Boekema EJ, Braun H-P. Respiratory chain supercomplexes in the plant mitochondrial membrane. Trends in plant science 2006, 11: 232-240 7 Stroh A, Anderka O, Pfeiffer K, Yagi T, Finel M, Ludwig B, Schägger H. Assembly of respiratory complexes I, III, and IV into NADH oxidase supercomplex stabilizes complex I in Paracoccus denitrificans. The Journal of biological chemistry 2004, 279: 5000-5007 8 Schägger H, Pfeiffer K. Supercomplexes in the respiratory chains of yeast and mammalian mitochondria. The EMBO journal 2000, 19: 1777-1783 9 Schäfer E, Seelert H, Reifschneider NH, Krause F, Dencher NA, Vonck J. Architecture of active mammalian respiratory chain supercomplexes. The Journal of biological chemistry 2006, 281: 15370-15375 10 Sousa PMF, Videira MAM, Bohn A, Hood BL, Conrads TP, Goulao LF, Melo AMP. The aerobic respiratory chain of Escherichia coli: from genes to supercomplexes. Microbiology (Reading, England) 2012, 158: 2408-2418 11 Lapuente-Brun E, Moreno-Loshuertos R, Acín-Pérez R, Latorre-Pellicer A, Colás C, Balsa E, Perales-Clemente E, et al. Supercomplex assembly determines electron flux in the mitochondrial electron transport chain. Science (New York, NY) 2013, 340: 1567-1570 12 Blaza JN, Serreli R, Jones AJ, Mohammed K, Hirst J. Kinetic evidence against partitioning of the ubiquinone pool and the catalytic relevance of respiratory-chain supercomplexes. Proc Natl Acad Sci U S A 2014, 111: 15735-15740 13 Johnson AS, van Horck S, Lewis PJ. Dynamic localization of membrane proteins in Bacillus subtilis. Microbiology (Reading, England) 2004, 150: 2815-2824 14 Erhardt H, Dempwolff F, Pfreundschuh M, Riehle M, Schäfer C, Pohl T, Graumann P, et al. Organization of the Escherichia coli aerobic enzyme complexes of oxidative phosphorylation in dynamic domains within the cytoplasmic membrane. MicrobiologyOpen 2014, 3: 316-326
10
15 Lenn T, Leake MC. Experimental approaches for addressing fundamental biological questions in living, functioning cells with single molecule precision. Open biology 2012, 2: 120090 16 Leake MC. Analytical tools for single-molecule fluorescence imaging in cellulo. Phys Chem Chem Phys 2014, 16: 12635-12647 17 Lenn T, Leake MC, Mullineaux CW. Clustering and dynamics of cytochrome bd-I complexes in the Escherichia coli plasma membrane in vivo. Molecular microbiology 2008, 70: 1397-1407 18 Renz M, Rendler T, Börsch M. Diffusion properties of single FoF1-ATP synthases in a living bacterium unraveled by localization microscopy. 2012: 822513-822513-822511 19 Llorente-Garcia I, Lenn T, Erhardt H, Harriman OL, Liu LN, Robson A, Chiu SW, et al. Single-molecule in vivo imaging of bacterial respiratory complexes indicates delocalized oxidative phosphorylation. Biochim Biophys Acta 2014, 1837: 811-824 20 Renz A, Renz M, Klütsch D, Deckers-Hebestreit G, Börsch M. 3D-localization microscopy and tracking of FoF1-ATP synthases in living bacteria. ed. 2015: 93310D-93310D-93312 21 Friedrich T. The NADH:ubiquinone oxidoreductase (complex I) from Escherichia coli. Biochimica et Biophysica Acta (BBA) - Bioenergetics 1998, 1364: 134-146 22 Efremov RG, Baradaran R, Sazanov LA. The architecture of respiratory complex I. Nature 2010, 465: 441-445 23 Cecchini G, Schröder I, Gunsalus RP, Maklashina E. Succinate dehydrogenase and fumarate reductase from Escherichia coli. Biochimica et Biophysica Acta (BBA) - Bioenergetics 2002, 1553: 140-157 24 Abramson J, Riistama S, Larsson G, Jasaitis A, Svensson-Ek M, Laakkonen L, Puustinen A, et al. The structure of the ubiquinol oxidase from Escherichia coli and its ubiquinone binding site. Nat Struct Mol Biol 2000, 7: 910-917 25 Kita K, Konishi K, Anraku Y. Terminal oxidases of Escherichia coli aerobic respiratory chain. I. Purification and properties of cytochrome b562-o complex from cells in the early exponential phase of aerobic growth. Journal of Biological Chemistry 1984, 259: 3368-3374 26 Kita K, Konishi K, Anraku Y. Terminal oxidases of Escherichia coli aerobic respiratory chain. II. Purification and properties of cytochrome b558-d complex from cells grown with limited oxygen and evidence of branched electron-carrying systems. Journal of Biological Chemistry 1984, 259: 3375-3381 27 Borisov VB, Gennis RB, Hemp J, Verkhovsky MI. The cytochrome bd respiratory oxygen reductases. Biochimica et Biophysica Acta (BBA) - Bioenergetics 2011, 1807: 1398-1413 28 Capaldi RA, Schulenberg B, Murray J, Aggeler R. Cross-linking and electron microscopy studies of the structure and functioning of the Escherichia coli ATP synthase. Journal of Experimental Biology 2000, 203: 29-33 29 Senior AE, Nadanaciva S, Weber J. The molecular mechanism of ATP synthesis by F1F0-ATP synthase. Biochimica et Biophysica Acta (BBA) - Bioenergetics 2002, 1553: 188-211 30 Erhardt H, Dempwolff F, Pfreundschuh M, Riehle M, Schafer C, Pohl T, Graumann P, et al. Organization of the Escherichia coli aerobic enzyme

11
complexes of oxidative phosphorylation in dynamic domains within the cytoplasmic membrane. Microbiologyopen 2014, 3: 316-326 31 Leake MC, Chandler JH, Wadhams GH, Bai F, Berry RM, Armitage JP. Stoichiometry and turnover in single, functioning membrane protein complexes. Nature 2006, 443: 355-358 32 McEvoy AL, Hoi H, Bates M, Platonova E, Cranfill PJ, Baird MA, Davidson MW, et al. mMaple: a photoconvertible fluorescent protein for use in multiple imaging modalities. PloS one 2012, 7: e51314 33 Lee S-H, Shin JY, Lee A, Bustamante C. Counting single photoactivatable fluorescent molecules by photoactivated localization microscopy (PALM). Proceedings of the National Academy of Sciences of the United States of America 2012, 109: 17436-17441 34 Betzig E, Patterson GH, Sougrat R, Lindwasser OW, Olenych S, Bonifacino JS, Davidson MW, et al. Imaging Intracellular Fluorescent Proteins at Nanometer Resolution. Science 2006, 313: 1642-1645 35 Robson A, Burrage K, Leake MC. Inferring diffusion in single live cells at the single-molecule level. Philosophical transactions of the Royal Society of London Series B, Biological sciences 2013, 368: 20120029 36 Rollins GC, Shin JY, Bustamante C, Pressé S. Stochastic approach to the molecular counting problem in superresolution microscopy. Proceedings of the National Academy of Sciences 2015, 112: E110-E118 37 Wang J. A promising approach to molecular counting problem in superresolution microscopy. Proceedings of the National Academy of Sciences 2015, 112: 304-305 38 Zhang M, Chang H, Zhang Y, Yu J, Wu L, Ji W, Chen J, et al. Rational design of true monomeric and bright photoactivatable fluorescent proteins. Nat Meth 2012, 9: 727-729 39 Nenninger A, Mastroianni G, Robson A, Lenn T, Xue Q, Leake MC, Mullineaux CW. Independent mobility of proteins and lipids in the plasma membrane of Escherichia coli. Molecular Microbiology 2014, 92: 1142-1153 40 Lenn T, Leake MC, Mullineaux CW. Are Escherichia coli OXPHOS complexes concentrated in specialized zones within the plasma membrane? Biochemical Society transactions 2008, 36: 1032-1036 41 Sousa PMF, Silva STN, Hood BL, Charro N, Carita JN, Vaz F, Penque D, et al. Supramolecular organizations in the aerobic respiratory chain of Escherichia coli. Biochimie 2011, 93: 418-425 42 Sousa PM, Videira MA, Melo AM. The formate: oxygen oxidoreductase supercomplex of Escherichia coli aerobic respiratory chain. FEBS letters 2013, 587: 2559-2564 43 Zarbiv G, Li H, Wolf A, Cecchini G, Caplan SR, Sourjik V, Eisenbach M. Energy complexes are apparently associated with the switch-motor complex of bacterial flagella. J Mol Biol 2012, 416: 192-207 44 Zhang M, Mileykovskaya E, Dowhan W. Cardiolipin is essential for organization of complexes III and IV into a supercomplex in intact yeast mitochondria. The Journal of biological chemistry 2005, 280: 29403-29408 45 Dobbie IM, Robson A, Delalez N, Leake MC. Visualizing single molecular complexes in vivo using advanced fluorescence microscopy. J Vis Exp 2009: 1508 46 Leake MC. The physics of life: one molecule at a time. Philos Trans R Soc Lond B Biol Sci 2013, 368: 20120248

12
47 Wollman AJ, Nudd R, Hedlund EG, Leake MC. From Animaculum to single molecules: 300 years of the light microscope. Open Biol 2015, 5: 150019 48 Leake MC. Shining the spotlight on functional molecular complexes: The new science of single-molecule cell biology. Commun Integr Biol 2010, 3: 415-418 49 Harriman OL, Leake MC. Single molecule experimentation in biological physics: exploring the living component of soft condensed matter one molecule at a time. J Phys Condens Matter 2011, 23: 503101 50 Chiu SW, Leake MC. Functioning nanomachines seen in real-time in living bacteria using single-molecule and super-resolution fluorescence imaging. Int J Mol Sci 2011, 12: 2518-2542 51 Leake MC. Single-molecule cellular biophysics. Cambridge University Press. 1st Ed. 2013, ISBN:9781107005839 52 Rowe A, Leake MC, Morgan H, Berry RM. Rapid rotation of micron and sub-micron dielectric particles measured using optical tweezers. J. Mod. Opt. 2003 50: 1539-1555. 53 Leake MC, Wilson D, Bullard B, Simmons RM. The elasticity of single kettin molecules using a two-bead laser-tweezers assay. FEBS Lett. 2003 535: 55-60. 54 Leake MC, Wilson D, Gautel M, Simmons RM. The elasticity of single titin molecules using a two-bead optical tweezers assay. Biophys. J. 2004 87: 1112-1135. 55 Lo CJ, Leake MC, Berry RM. Fluorescence measurement of intracellular sodium concentration in single Escherichia coli cells. Biophys. J. 2006 90: 357-65. 56 Sowa Y, Rowe AD, Leake MC, Yakushi T, Homma M, Ishijima A, Berry RM. Direct observation of steps in rotation of the bacterial flagellar motor. Nature 2005 437: 916-919. 57 Lo CJ, Leake MC, Pilizota T, Berry RM. Single-cell measurements of Membrane Potential, Sodium-Motive Force and Flagellar Motor Speed in Escherichia coli. 2007 Biophys. J. 93: 294-302. 58 Leake MC, Greene NP, Godun RM, Granjon T, Buchanan G, Chen S, Berry RM, Palmer T & Berks BC. Variable stoichiometry of the TatA component of the twin-arginine protein transport system observed by in vivo single-molecule imaging. Proc Natl Acad Sci U S A. 2008, 105:15376-15381. 59 Plank M, Wadhams GH, Leake MC. Millisecond timescale slimfield imaging and automated quantification of single fluorescent protein molecules for use in probing complex biological processes. Integr. Biol. 2009, 1:602 – 612. 60 Delalez NJ, Wadhams GH, Rosser G, Xue Q, Brown MT, Dobbie IM, Berry RM, Leake MC, Armitage JP. Signal-dependent turnover of the bacterial flagellar switch protein FliM. Proc Natl Acad Sci U S A 2010, 107:11347-11351. 61 Badrinarayanan A, Reyes-Lamothe R, Uphoff S, Leake MC, Sherratt DJ. In vivo architecture and action of bacterial structural maintenance of chromosome proteins. Science 2012, 338: 528-531. 62 Chiu S-W, Roberts MAJ, Leake MC, Armitage JP. Positioning of chemosensory proteins and FtsZ through the Rhodobacter sphaeroides cell cycle. Mol Microbiol. 2013, 90: 322-37. 63 Bryan SJ, Burroughs NJ, Shevela D, Yu J, Rupprecht E, Liu L-N, Mastroianni G, Xue Q, Llorente-Garcia I, Leake MC, Eichacker LA, Schneider D, Nixon PJ, Mullineaux CW. Dynamic behaviour and interactions of the Vipp1 protein 1 in cyanobacteria. Mol. Microbiol. 2014, 94: 1179–1195. 64 Miller H, Zhou Z, Wollman AJM, Leake MC. Superresolution imaging of single DNA molecules using stochastic photoblinking of minor groove and intercalating dye. Methods 2015, In Press. DOI: 10.1016/j.ymeth.2015.01.010. 65 Wollman AJM, Miller H, Zhou Z, Leake MC. Probing DNA interactions with proteins using a single-molecule toolbox: inside the cell, in a test tube, and in a computer. Biochem. Soc. Trans. 2015, 43:139-145. 66 Wollman AJM, Leake MC. Millisecond single-molecule localization microscopy combined with convolution analysis and automated image segmentation to determine protein concentrations in complexly structured, functional cells, one cell at a time. Faraday Discussions 2015, In Press. DOI 10.1039/C5FD00077G 67 Zhou Z, Miller H, Wollman AJM, Leake MC. Developing a new biophysical tool to combine magneto-optical tweezers with super-resolution fluorescence microscopy. Photonics 2015, 2: 758-772.

13
68 Unden G, Bongaerts J. Alternative respiratory pathways of Escherichia coli: energetics and transcriptional regulation in response to electron acceptors. Biochim Biophys Acta 1997, 1320: 217-234 69 Mortensen KI, Churchman LS, Spudich JA, Flyvbjerg H. Optimized localization analysis for single-molecule tracking and super-resolution microscopy. Nat Methods 2010, 7: 377-381 70 Thompson RE, Larson DR, Webb WW. Precise nanometer localization analysis for individual fluorescent probes. Biophys J 2002, 82: 2775-2783 71 Reyes-Lamothe R, Sherratt DJ, Leake MC. Stoichiometry and architecture of active DNA replication machinery in Escherichia coli. Science (New York, NY) 2010, 328: 498-501 72 Tanaka KA, Suzuki KG, Shirai YM, Shibutani ST, Miyahara MS, Tsuboi H, Yahara M, et al. Membrane molecules mobile even after chemical fixation. Nat Methods 2010, 7: 865-866 73 Newman RH, Fosbrink MD, Zhang J. Genetically encodable fluorescent biosensors for tracking signaling dynamics in living cells. Chem Rev 2011, 111: 3614-3666

14
Figure 1: Schematic representation of the Escherichia coli OXPHOS chain
Electrons are transferred from donor substrates (D) to quinones (Q) by quinone
reductases (in yellow) and then to acceptor substrates (A) by terminal oxidases (in
blue). Electron transport is concomitant with proton translocation, resulting in a pmf.
for chemiosmotic ATP synthesis by the F1FO ATP synthase (in grey). Below each
depicted enzyme is the range of electron donors and acceptors that can be used by the
E. coli respiratory chain and the numbers indicate the number of known isozymes for
each substrate (data adapted from [68]).

15
Figure 2: Models of Electron Flux (A) and the PMF (B) in E. coli.
A) While patches of OXPHOS complexes exist alongside individual enzymes
(not represented) it is likely that each patch contains only one type of
OXPHOS enzyme, either reducing quinone (Q) to quinol (QH) or oxidizing
QH to Q, which freely diffuse in the membrane plane. While supercomplexes
of complete redox circuits have been detected in vitro [42], these have yet to
be studied in vivo. B) It is unclear, as yet as to whether the ‘proton pool’ is effectively uniform
as the ‘quinone pool’ appears to be in a E. coli (upper panel) or if ‘proton sinks’ have ‘local power supplies’ (lower panel).

16
Box 1: Single-molecule counting methods (developed from [31]):
- Step-wise photobleaching:
o Dye molecules (e.g. used as reporter molecules, such as fluorescence
proteins (FPs)) photobleach irreversibly
o Size of the photobleach step is a ‘molecular signature’ equivalent to
the brightness of a single dye molecule unique to the physical and
chemical environment of that molecule
o Steps, for example multiple steps from a molecular complex tagged
with multiple dye molecules can be detected directly in the ‘time
domain’, but this is error-prone since it is difficult to objectify the
detection of ‘real’ steps over noise
o A more robust approach involves Fourier spectral analysis, involving
generating the pairwise difference distribution of fluorescent spot
intensity values and calculating the power spectrum of this to estimate
the fundamental peak which is the unitary brightness of one dye
molecule, IFP.
- Calibration with single FPs in vitro:
o Single FP molecule can be immobilized to a coverslip using anti-FP
antibodies for example.
o The brightness of each molecule can be measured under the same
imaging conditions but using a more controlled chemical environment.
o The brightness of single FP molecule in vivo may be different from the
in vitro value due to differences in local pH and halide ion
concentration, in addition to some small local differences in laser
excitation intensity.
o Experiments on model systems suggest that under most circumstances
the in vivo and in vitro brightness values agree to within ~10%.
o This allows the in vitro value to be used as a guide on the sometimes
noisy power spectrum from the in vivo Fourier special analysis to
facilitate finding the correct peak corresponding to the single-molecule
FP brightness.
- Calculation of stoichiometry:
o The initial brightness I0 of a fluorescently-labeled molecular complex
can be estimated from an exponential fit to the spot intensity vs time
data during photobleaching observed from a given tracked spot.
o The stoichiometry for each spot can be estimated as I0/IFP.
o The error on the stoichiometry estimate is sub single-molecule for
typical values of stoichiometry of 10 molecules or less per spot.
o For higher stoichiometry spots the error in the stoichiometry estimate
is greater than a single molecule for a given single spot, however
performing this estimate on several such spots allows estimates for
mean values in a population of molecules, or even in sub-populations
if identified as distinct peak in the stoichiometry probability
distribution, to be made which have better than single-molecule
precision.

17
Box 2: PALM microscopy: E. coli cells expressing mMaple labeled Cytochrome
bd-1 oxidase.
These PALM images are rendered such that information about the intensity centroid
estimate for each localized molecule and the degree of certainty about the location
that centroid are taken into account. Each photon burst, which meets various selection
criteria, such as brightness, duration and area, is considered to be a localization event
of a single molecule and its centroid determined by the location of the peak of its
point-spread function. Each localized molecule is rendered as a 2D Gaussian with
normalised integrated volume, centered on the calculated intensity centroid with
width determined by the uncertainty of centroid localization, which is dependent on
the number of photons collected in that event [69, 70]. Variations in the uncertainty of
centroid location can be due to:
o Brightness of individual events – the centroids of bright localizations
can be more accurately located than dim ones [69, 70].
o Duration of localization event – more photons will be collected for
long-lived molecule that “resists” photobleaching.
o Variation in camera noise and autofluorescent background [69].
o Movement of molecules [71] (even in fixed samples [72]).
In this rendering, the final image is the sum of rendered localizations and could
therefore be interpreted as a probability map of molecule locations where the brightest
areas correspond to the regions where the reader can be most confident of where
molecules are located and the dimmest areas are highly unlikely to contain any
labeled complexes – assuming that the labeled complexes are well sampled.
Box 2 Figure: PALM images of E. coli cells expressing mMaple tagged Cytochrome
bd-1 [19].
18
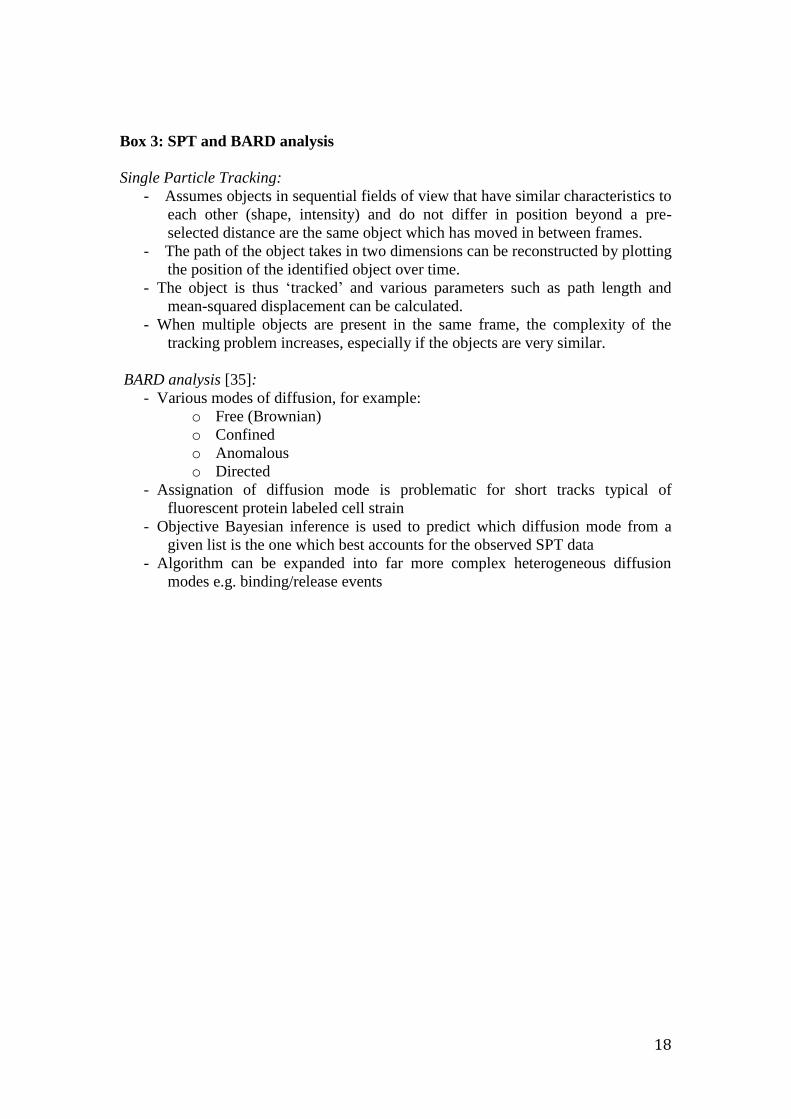
Box 3: SPT and BARD analysis
Single Particle Tracking:
- Assumes objects in sequential fields of view that have similar characteristics to
each other (shape, intensity) and do not differ in position beyond a pre-
selected distance are the same object which has moved in between frames.
- The path of the object takes in two dimensions can be reconstructed by plotting
the position of the identified object over time.
- The object is thus ‘tracked’ and various parameters such as path length and
mean-squared displacement can be calculated.
- When multiple objects are present in the same frame, the complexity of the
tracking problem increases, especially if the objects are very similar.
BARD analysis [35]:
- Various modes of diffusion, for example:
o Free (Brownian)
o Confined
o Anomalous
o Directed
- Assignation of diffusion mode is problematic for short tracks typical of
fluorescent protein labeled cell strain
- Objective Bayesian inference is used to predict which diffusion mode from a
given list is the one which best accounts for the observed SPT data
- Algorithm can be expanded into far more complex heterogeneous diffusion
modes e.g. binding/release events

19
Box 4: Two co-localization metrics in Llorente-Garcia et al [19] :
- Multiple length scale methods, can infer co-localization:
o Cell-by-cell
o Track by track
o Pixel-by-pixel
- Multiple time scale methods, can infer co-localization on separate scales of:
o 10s of seconds
o Seconds
o 10s of milliseconds
- Pixel-level statistics:
o Normalize intensity values in each separate color channel min-max
o Look at normalized ratio of intensity values of corresponsing pixels in
each color channel
o Pixels where only 1 fluorophore is present will take on extreme values
(1 or -1)
o Pixels containing signals from both fluorophores (or none) will be
close to 0
- Gaussian overlap method:
o Models each fluorescent spot as a 2D Gaussian intensity profile o Tracks probed from each color channels which are coincident in time
o Overlap integral calculated on the basis of integrated overlap between these 2D Gaussians as a metric for co-localization (or not)

20
Table 1: Funtionally labelled E. coli OXPHOS complexes
OXPHOS
Complex
Subunit Terminus Linker Fluorophore Reference
source
NDH-1 NuoF N Thr-Asp-Pro-
Ala-Leu-Arg-
Ala
GFP, mCherry,
mMaple
[30],
[17],[19]
NDH-1 NuoF C Gly-Leu-
Cys-Gly-Arg
cerulean [30]
SDH SdhC N Thr-Asp-Pro-
Ala-Leu-Arg-
Ser*
mCherry [30]
Cytochrome
bd-1
CydB C Gly-Leu-
Cys-Gly-Arg
GFP, mCherry,
mMaple
[17],
[19]
Cytochrome
bo
CyoA C No linker mCherry [30]
ATP-
synthase
AtpB C Gly-Ser-Met-
Val
GFP [30]
ATP-
synthase
AtpB C Gly-Ser GFP, PAGFP,
mEos3.2
[20]
*replaces Met-Ile-Arg-Asn

21
Table 2: Stoichiometry of OXPHOS enzyme clusters
OXPHOS
Complex
Range of number of
complexes per cluster
NDH-1 10-20
Cyt bo 24-45
Cyt bd-1 70-180
SDH 20-40
ATPase 40-60