Embed Size (px)
Citation preview
Single-molecule fluorescence imaging of
processive myosin with enhanced background
suppression using linear zero-mode waveguides
(ZMWs) and convex lens induced confinement
(CLIC)
Mary Williard Elting,1,2,3
Sabrina R. Leslie,4,5
L. Stirling Churchman,2,6
Jonas Korlach,7
Christopher M. J. McFaul,4 Jason S. Leith,
4 Michael J. Levene,
8 Adam E. Cohen,
5 and
James A. Spudich2,*
1Department of Applied Physics, Stanford University, Stanford, California 94305, USA
2Department of Biochemistry, Stanford University, Stanford, California 94305, USA 3Current Address: Department of Cell and Tissue Biology, University of California, San Francisco, California
94143, USA 4Department of Physics, McGill University, Montreal, QC H3A 2TA, Canada
5Departments of Chemistry and Chemical Biology and of Physics, Harvard University, Cambridge, Massachusetts 02138, USA
6Department of Genetics, Harvard Medical School, Boston, Massachusetts 02115, USA 7Pacific Biosciences, Menlo Park, California 94025, USA
8Department of Biomedical Engineering, Yale University, New Haven, Connecticut 06520, USA *[email protected]
Abstract: Resolving single fluorescent molecules in the presence of high
fluorophore concentrations remains a challenge in single-molecule
biophysics that limits our understanding of weak molecular interactions.
Total internal reflection fluorescence (TIRF) imaging, the workhorse of
single-molecule fluorescence microscopy, enables experiments at
concentrations up to about 100 nM, but many biological interactions have
considerably weaker affinities, and thus require at least one species to be at
micromolar or higher concentration. Current alternatives to TIRF often
require three-dimensional confinement, and thus can be problematic for
extended substrates, such as cytoskeletal filaments. To address this
challenge, we have demonstrated and applied two new single-molecule
fluorescence microscopy techniques, linear zero-mode waveguides (ZMWs)
and convex lens induced confinement (CLIC), for imaging the processive
motion of molecular motors myosin V and VI along actin filaments. Both
technologies will allow imaging in the presence of higher fluorophore
concentrations than TIRF microscopy. They will enable new biophysical
measurements of a wide range of processive molecular motors that move
along filamentous tracks, such as other myosins, dynein, and kinesin. A
particularly salient application of these technologies will be to examine
chemomechanical coupling by directly imaging fluorescent nucleotide
molecules interacting with processive motors as they traverse their actin or
microtubule tracks.
©2013 Optical Society of America
OCIS codes: (000.1430) Biology and medicine; (170.2520) Fluorescence microscopy;
(180.25200) Fluorescence microscopy.
#178943 - $15.00 USD Received 5 Nov 2012; revised 14 Dec 2012; accepted 15 Dec 2012; published 10 Jan 2013(C) 2013 OSA 14 January 2013 / Vol. 21, No. 1 / OPTICS EXPRESS 1189
References and links
1. T. Komori, S. Nishikawa, T. Ariga, A. H. Iwane, and T. Yanagida, “Simultaneous measurement of nucleotide
occupancy and mechanical displacement in myosin-V, a processive molecular motor,” Biophys. J. 96(1), L04–
L06 (2009). 2. K. Adachi, K. Oiwa, T. Nishizaka, S. Furuike, H. Noji, H. Itoh, M. Yoshida, and K. Kinosita, Jr., “Coupling of
rotation and catalysis in F(1)-ATPase revealed by single-molecule imaging and manipulation,” Cell 130(2), 309–
321 (2007). 3. M. J. Levene, J. Korlach, S. W. Turner, M. Foquet, H. G. Craighead, and W. W. Webb, “Zero-mode waveguides
for single-molecule analysis at high concentrations,” Science 299(5607), 682–686 (2003).
4. E. Boukobza, A. Sonnenfeld, and G. Haran, “Immobilization in Surface-Tethered Lipid Vesicles as a New Tool for Single Biomolecule Spectroscopy,” J. Phys. Chem. B 105(48), 12165–12170 (2001).
5. D. T. Chiu, R. M. Lorenz, and G. D. M. Jeffries, “Droplets for ultrasmall-volume analysis,” Anal. Chem. 81(13),
5111–5118 (2009). 6. J. J. Benítez, A. M. Keller, and P. Chen, “Nanovesicle trapping for studying weak protein interactions by single-
molecule FRET,” Methods Enzymol. 472, 41–60 (2010).
7. B. Okumus, S. Arslan, S. M. Fengler, S. Myong, and T. Ha, “Single molecule nanocontainers made porous using a bacterial toxin,” J. Am. Chem. Soc. 131(41), 14844–14849 (2009).
8. A. B. Loveland, S. Habuchi, J. C. Walter, and A. M. van Oijen, “A general approach to break the concentration
barrier in single-molecule imaging,” Nat. Methods 9(10), 987–992 (2012).
9. M. Rief, R. S. Rock, A. D. Mehta, M. S. Mooseker, R. E. Cheney, and J. A. Spudich, “Myosin-V stepping
kinetics: a molecular model for processivity,” Proc. Natl. Acad. Sci. U.S.A. 97(17), 9482–9486 (2000).
10. T. Sakamoto, M. R. Webb, E. Forgacs, H. D. White, and J. R. Sellers, “Direct observation of the mechanochemical coupling in myosin Va during processive movement,” Nature 455(7209), 128–132 (2008).
11. E. M. De La Cruz, E. M. Ostap, and H. L. Sweeney, “Kinetic mechanism and regulation of myosin VI,” J. Biol.
Chem. 276(34), 32373–32381 (2001). 12. S. M. Block, “Kinesin motor mechanics: binding, stepping, tracking, gating, and limping,” Biophys. J. 92(9),
2986–2995 (2007). 13. W. Qiu, N. D. Derr, B. S. Goodman, E. Villa, D. Wu, W. Shih, and S. L. Reck-Peterson, “Dynein achieves
processive motion using both stochastic and coordinated stepping,” Nat. Struct. Mol. Biol. 19(2), 193–200
(2012). 14. M. A. DeWitt, A. Y. Chang, P. A. Combs, and A. Yildiz, “Cytoplasmic dynein moves through uncoordinated
stepping of the AAA+ ring domains,” Science 335(6065), 221–225 (2012).
15. T. Funatsu, Y. Harada, H. Higuchi, M. Tokunaga, K. Saito, Y. Ishii, R. D. Vale, and T. Yanagida, “Imaging and nano-manipulation of single biomolecules,” Biophys. Chem. 68(1-3), 63–72 (1997).
16. A. Ishijima, H. Kojima, T. Funatsu, M. Tokunaga, H. Higuchi, H. Tanaka, and T. Yanagida, “Simultaneous
observation of individual ATPase and mechanical events by a single myosin molecule during interaction with actin,” Cell 92(2), 161–171 (1998).
17. M. Tokunaga, K. Kitamura, K. Saito, A. H. Iwane, and T. Yanagida, “Single molecule imaging of fluorophores
and enzymatic reactions achieved by objective-type total internal reflection fluorescence microscopy,” Biochem. Biophys. Res. Commun. 235(1), 47–53 (1997).
18. K. Oiwa, J. F. Eccleston, M. Anson, M. Kikumoto, C. T. Davis, G. P. Reid, M. A. Ferenczi, J. E. Corrie, A.
Yamada, H. Nakayama, and D. R. Trentham, “Comparative single-molecule and ensemble myosin enzymology: sulfoindocyanine ATP and ADP derivatives,” Biophys. J. 78(6), 3048–3071 (2000).
19. T. Komori, S. Nishikawa, T. Ariga, A. H. Iwane, and T. Yanagida, “Measurement system for simultaneous
observation of myosin V chemical and mechanical events,” Biosystems 93(1-2), 48–57 (2008). 20. M. W. Elting, Z. Bryant, J. C. Liao, and J. A. Spudich, “Detailed tuning of structure and intramolecular
communication are dispensable for processive motion of myosin VI,” Biophys. J. 100(2), 430–439 (2011).
21. H. L. Sweeney, H. Park, A. B. Zong, Z. Yang, P. R. Selvin, and S. S. Rosenfeld, “How myosin VI coordinates its heads during processive movement,” EMBO J. 26(11), 2682–2692 (2007).
22. Y. Oguchi, S. V. Mikhailenko, T. Ohki, A. O. Olivares, E. M. De La Cruz, and S. Ishiwata, “Load-dependent
ADP binding to myosins V and VI: implications for subunit coordination and function,” Proc. Natl. Acad. Sci. U.S.A. 105(22), 7714–7719 (2008).
23. A. R. Dunn, P. Chuan, Z. Bryant, and J. A. Spudich, “Contribution of the myosin VI tail domain to processive
stepping and intramolecular tension sensing,” Proc. Natl. Acad. Sci. U.S.A. 107(17), 7746–7750 (2010). 24. J. Eid, A. Fehr, J. Gray, K. Luong, J. Lyle, G. Otto, P. Peluso, D. Rank, P. Baybayan, B. Bettman, A. Bibillo, K.
Bjornson, B. Chaudhuri, F. Christians, R. Cicero, S. Clark, R. Dalal, A. Dewinter, J. Dixon, M. Foquet, A.
Gaertner, P. Hardenbol, C. Heiner, K. Hester, D. Holden, G. Kearns, X. Kong, R. Kuse, Y. Lacroix, S. Lin, P.
Lundquist, C. Ma, P. Marks, M. Maxham, D. Murphy, I. Park, T. Pham, M. Phillips, J. Roy, R. Sebra, G. Shen,
J. Sorenson, A. Tomaney, K. Travers, M. Trulson, J. Vieceli, J. Wegener, D. Wu, A. Yang, D. Zaccarin, P. Zhao,
F. Zhong, J. Korlach, and S. Turner, “Real-time DNA sequencing from single polymerase molecules,” Science 323(5910), 133–138 (2009).
25. S. Uemura, C. E. Aitken, J. Korlach, B. A. Flusberg, S. W. Turner, and J. D. Puglisi, “Real-time tRNA transit on
single translating ribosomes at codon resolution,” Nature 464(7291), 1012–1017 (2010). 26. S. R. Leslie, A. P. Fields, and A. E. Cohen, “Convex lens-induced confinement for imaging single molecules,”
#178943 - $15.00 USD Received 5 Nov 2012; revised 14 Dec 2012; accepted 15 Dec 2012; published 10 Jan 2013(C) 2013 OSA 14 January 2013 / Vol. 21, No. 1 / OPTICS EXPRESS 1190
Anal. Chem. 82(14), 6224–6229 (2010).
27. L. S. Churchman, Z. Okten, R. S. Rock, J. F. Dawson, and J. A. Spudich, “Single molecule high-resolution colocalization of Cy3 and Cy5 attached to macromolecules measures intramolecular distances through time,”
Proc. Natl. Acad. Sci. U.S.A. 102(5), 1419–1423 (2005).
28. J.-C. Liao, M. W. Elting, S. L. Delp, J. A. Spudich, and Z. Bryant, “Engineered myosin VI motors reveal minimal structural determinants of directionality and processivity,” J. Mol. Biol. 392(4), 862–867 (2009).
29. J. D. Pardee and J. A. Spudich, “Purification of muscle actin,” Methods Cell Biol. 24, 271–289 (1982).
30. J. Korlach, P. J. Marks, R. L. Cicero, J. J. Gray, D. L. Murphy, D. B. Roitman, T. T. Pham, G. A. Otto, M. Foquet, and S. W. Turner, “Selective aluminum passivation for targeted immobilization of single DNA
polymerase molecules in zero-mode waveguide nanostructures,” Proc. Natl. Acad. Sci. U.S.A. 105(4), 1176–
1181 (2008). 31. J. Wenger, P.-F. Lenne, E. Popov, H. Rigneault, J. Dintinger, and T. Ebbesen, “Single molecule fluorescence in
rectangular nano-apertures,” Opt. Express 13(18), 7035–7044 (2005).
32. J. A. Theriot and T. J. Mitchison, “The nucleation-release model of actin filament dynamics in cell motility,” Trends Cell Biol. 2(8), 219–222 (1992).
33. R. Littlefield and V. M. Fowler, “A minor actin catastrophe,” Nat. Cell Biol. 4(9), E209–E211 (2002).
34. I. Fujiwara, S. Takahashi, H. Tadakuma, T. Funatsu, and S. Ishiwata, “Microscopic analysis of polymerization dynamics with individual actin filaments,” Nat. Cell Biol. 4(9), 666–673 (2002).
35. R. Carballido-López, “The bacterial actin-like cytoskeleton,” Microbiol. Mol. Biol. Rev. 70(4), 888–909 (2006).
1. Introduction
Reducing background fluorescence from fluorophores in solution presents a challenge to
many single-molecule fluorescence experiments. For single-molecule fluorescence imaging
of surface-immobilized species, total internal reflection fluorescence (TIRF) microscopy is
usually used to interrogate a thin layer of molecules close to the surface in order to suppress
background fluorescence from molecules freely diffusing in solution. By coupling to
fluorophores using an evanescent field, TIRF restricts the excitation volume to a layer of
molecules within a few hundred nanometers above the coverslip surface, enabling individual
fluorophores attached to the surface to be resolved in the presence of freely diffusing
fluorophores at concentrations up to approximately 100 nM [1,2], many times higher than is
possible using epifluorescent excitation. However, 100 nM is still well below the affinity of
many biologically relevant associations. Furthermore, the kinetics of binding events at such
low concentrations are often problematically slow. Consequently, the development and
application of single-molecule imaging techniques that probe low affinity interactions
inaccessible to TIRF microscopy remains an outstanding challenge to experimental
biophysics.
Recently, a few alternatives to TIRF have begun to increase the concentration limit at
which single fluorescent molecules can be observed. For instance, circular zero-mode
waveguides (ZMWs) constrain fluorescent excitation in sub-micron scale chambers, as
described in more detail below [3]. Alternatively, fluorescent substrates can be constrained in
lipid vesicles, which can either be trapped or surface-tethered, or in trapped droplets
suspended in oil [4–6]. All of these approaches allow imaging at up to micromolar
concentrations by limiting the excitation volume in all three dimensions, which works very
well for studying substrates whose dimensions are all sub-micron and that do not undergo
micron-scale motions. However, for studying extended substrates or for substrates that transit
distances of more than a few hundred nanometers, including cytoskeletal motors moving
along actin or microtubule tracks, three-dimensional confinement is not appropriate.
Furthermore, lipid vesicles or trapped droplets do not generally allow exchange of buffer
within the confined volume, which is problematic for studying enzymes, since the reactants
may quickly become consumed. Although nanovesicles can be adapted to allow exchange of
small molecules through nanopores with the buffer in which the vesicles are immersed, this is
not useful in the case that small molecule reactants, such as ATP, are the fluorescent
substrates to be imaged [7]. Another alternative strategy for increasing the concentration limit
that avoids three-dimensional confinement, PhotoActivation, Diffusion, and Excitation
(PhADE), was recently demonstrated [8]. This method of activating fluorophores near the
surface via TIRF and then waiting for fluorescent species not bound to molecules of interest
#178943 - $15.00 USD Received 5 Nov 2012; revised 14 Dec 2012; accepted 15 Dec 2012; published 10 Jan 2013(C) 2013 OSA 14 January 2013 / Vol. 21, No. 1 / OPTICS EXPRESS 1191

to diffuse away is likely to prove useful in many contexts; however, it does require the use of
specialized photoactivatable fluorophores and its time resolution is limited by the time
required for both the activation and diffusion.
The association of processive cytoskeletal molecular motors with fluorescently labeled
nucleotide molecules is an important class of experiments that remains inaccessible to
standard microscopy techniques. Most dimeric processive motors, including myosins V and
VI, kinesin, and, to some extent, dynein, appear to coordinate their stepwise motion with
kinetic rates that vary depending on which motor “head” is in the leading vs. trailing position
[9–14]. Since their kinetic cycles are highly coupled to nucleotide binding, hydrolysis, and
release, open questions on the underlying mechanochemical coupling and coordination
mechanisms could be directly addressed by visualizing single molecules of fluorescently
labeled ATP binding to and releasing from single processive motors as they advance along
their tracks. However, the fluorescent ATP concentrations accessible to single-molecule TIRF
microscopy are prohibitive in such an experiment, since the motors would move extremely
slowly, and might exhibit off-pathway kinetics, and the alternatives involving nano-
confinement are prohibitive for observing multiple steps along their extended tracks. A few
experiments have successfully visualized the association of fluorescent nucleotides with
myosin II [15–18] or myosin V [1,10,19], but with one exception [10] (see below) these
experiments required very low concentrations of nucleotide (up to 100 nM) and/or fractional
labeling of nucleotides (10% fluorescent). Because of these limitations, these experiments
were able to detect ATP turnover by myosin motors and correlate that with a myosin power-
stroke but, for the most part, were not able to detect coordination between motor domains.
Thus far, myosin V is the only processive motor for which detection of fluorescent
nucleotides has been used to directly measure intra-molecular coordination, and doing so
required the use of a custom-prepared fluorescent nucleotide analog with the unusual property
of brightening on binding to the motor [10]; while this custom fluorescent nucleotide
minimally perturbed myosin V, its kinetics were altered somewhat, and such effects can be
very enzyme-specific, meaning that this specific approach will not necessarily be applicable
to other myosins, or to kinesin or dynein. New and accessible technology that enables
imaging single molecules at higher concentrations, while also allowing flexibility in the
choice of a fluorescent nucleotide analog, would therefore be a powerful addition to the
single-molecule microscopy arsenal. There are several molecular motors such as myosin VI
and dynein, for which mechanisms of coordination remain controversial or insufficiently
characterized [11,13,14,20–23], and for which direct detection of coordination, for instance
through imaging of fluorescent ATP binding and release, has not yet been possible. These are
especially important systems for applying such a technology.
In this work, we demonstrate the feasibility of two new technologies for imaging
processive myosins with enhanced background suppression: linear zero-mode waveguides
(ZMWs) and convex lens induced confinement (CLIC). While these two techniques have
been used in the past, here we describe significant alterations and advances that were essential
for applying these technologies to cytoskeletal motors moving along tracks. This work
demonstrates that both of these techniques can be used with myosin motors moving along
actin filaments and can be extended to a broad range of applications, such as imaging
fluorescent nucleotides associating with actin or microtubule motors or examining
polymerization dynamics of actin filaments or microtubules. Both of these techniques
function by decreasing the observation volume in which fluorophores are excited in one or
two, but importantly not all three, dimensions. Linear ZMWs decrease the observation
volume primarily by confining the excitation to a thin layer close to the entrance of the
waveguide (at least an order of magnitude thinner than TIRF) and by physically confining the
sample in a narrow strip, reducing the excitation volume by a few fold in one of the lateral
dimensions as well (Fig. 1(a)). The CLIC imaging chamber, whose thickness varies
#178943 - $15.00 USD Received 5 Nov 2012; revised 14 Dec 2012; accepted 15 Dec 2012; published 10 Jan 2013(C) 2013 OSA 14 January 2013 / Vol. 21, No. 1 / OPTICS EXPRESS 1192

continuously from 2 nm to several microns, decreases the observation volume by physically
confining the fluorescent molecules within a thin layer (Fig. 1(b)).
A zero-mode waveguide (ZMW) consists of an aluminum film deposited on a fused silica
surface and then etched using lithography to create small holes (waveguides) in the film that
are narrower than the wavelength of light [3]. When light enters these waveguides from the
fused silica side, the sub-wavelength gaps prevent the light from propagating, creating an
evanescent field inside the waveguide whose intensity falls off much more quickly with depth
than TIRF illumination. Thus, ZMWs can be used to resolve single molecules at a much
higher concentration of fluorophores since fewer background molecules are excited by the
very shallow evanescent field. To this end, cylindrical zero-mode waveguides have been used
to image DNA polymerase synthesizing individual fluorescent nucleotides into DNA at
fluorophore concentrations up to 10 µM and tRNAs transiting on translating ribosomes at
micromolar concentrations [3,24,25]. While this technology has had several important
applications, the cylindrical geometry severely restricts the kind of experiments for which it is
useful. For example, this geometry is prohibitive for processive cytoskeletal motors, since the
diameter of the cylinders (around 100 nm) would only allow the insertion of filaments that
would be much too short to detect more than a very small number of steps. Here, we have
developed a new kind of ZMW with a very different geometry: waveguides that are narrow in
one dimension but microns long (Fig. 1(a)). Using polarized light, we demonstrate that, with
these new ZMWs, the excitation can still be confined near the surface. We show that actin can
be introduced into the linear ZMWs by polymerization inside the waveguides, and that
myosin V can move along these actin filaments.
Fig. 1. Schematics of new microscopy methods demonstrated in this work that suppress
background fluorescence. (a) Myosin walking on actin in a linear ZMW (not to scale). Fluorescent ATP molecules (red dots) are only excited when they are located very near the
entrance to the ZMW. Since the ZMW slits are narrower than the wavelength of light, the
excitation volume is confined both vertically and in the direction in which the slits are narrowest. (b) Myosin walking in the CLIC device (not to scale). Near the contact region, the
thin CLIC imaging chamber confines the excited molecules to a thin layer.
Convex lens induced confinement (CLIC) has previously been reported as a method to
reject background fluorescence and to image single molecules under confinement [26]. In its
published implementation, the CLIC imaging chamber was formed between the curved
surface of a convex lens and a coverslip, placed in direct contact. The CLIC imaging chamber
confined molecules to a thin film whose thickness was defined by the local chamber height.
This height was limited by surface roughness (~2 nm) at the contact point, and increased
gradually over several fields of view (e.g., by tens of nanometers over hundreds of microns
close to the contact point). Using this approach, individual protein molecules and
fluorophores have been resolved in the presence of background concentrations up to 2 µM.
Here, we demonstrate a new implementation of CLIC imaging, and use it to show for the first
time that CLIC is compatible with biological activity. This new version of CLIC uses a
#178943 - $15.00 USD Received 5 Nov 2012; revised 14 Dec 2012; accepted 15 Dec 2012; published 10 Jan 2013(C) 2013 OSA 14 January 2013 / Vol. 21, No. 1 / OPTICS EXPRESS 1193
standard flow chamber (two planar coverslips separated by double stick tape). This flow
chamber is subsequently deformed by a lens that presses downward on the top surface until it
comes into contact with the bottom coverslip (Fig. 1(b)). This implementation makes CLIC
easier to use than the previous design: it consists of disposable parts, eliminates the need for
cleaning the lens between measurements, facilitates serial sample replacement and imaging,
reduces sample evaporation, and requires a smaller sample volume. These changes
dramatically improve the accessibility of CLIC, since it can now be easily combined with
very standard biophysical assays performed using flow cells. Here, we use flow cell CLIC to
demonstrate the first biological application of this technology, showing that the processive
motion of myosin VI can be imaged in the CLIC device at coverslip-coverslip separations as
small as 60 nm, corresponding to five-fold enhanced background rejection in comparison to
TIRF.
2. Methods
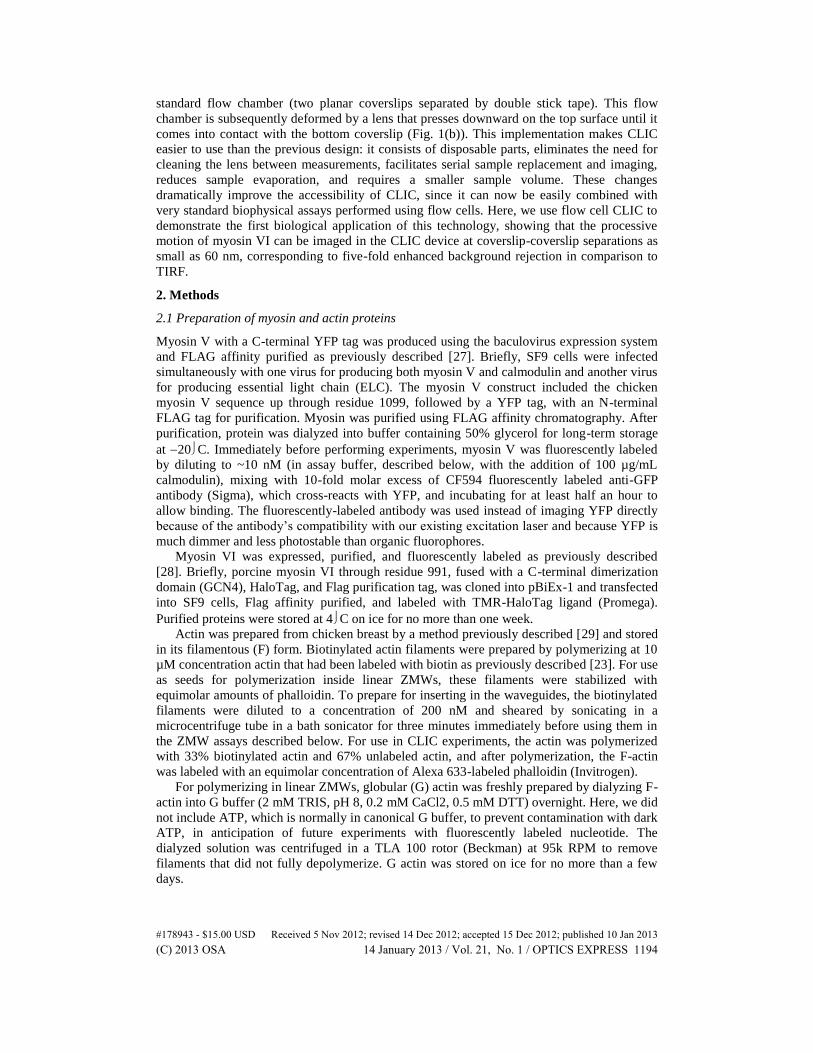
2.1 Preparation of myosin and actin proteins
Myosin V with a C-terminal YFP tag was produced using the baculovirus expression system
and FLAG affinity purified as previously described [27]. Briefly, SF9 cells were infected
simultaneously with one virus for producing both myosin V and calmodulin and another virus
for producing essential light chain (ELC). The myosin V construct included the chicken
myosin V sequence up through residue 1099, followed by a YFP tag, with an N-terminal
FLAG tag for purification. Myosin was purified using FLAG affinity chromatography. After
purification, protein was dialyzed into buffer containing 50% glycerol for long-term storage
at 20C. Immediately before performing experiments, myosin V was fluorescently labeled
by diluting to ~10 nM (in assay buffer, described below, with the addition of 100 µg/mL
calmodulin), mixing with 10-fold molar excess of CF594 fluorescently labeled anti-GFP
antibody (Sigma), which cross-reacts with YFP, and incubating for at least half an hour to
allow binding. The fluorescently-labeled antibody was used instead of imaging YFP directly
because of the antibody’s compatibility with our existing excitation laser and because YFP is
much dimmer and less photostable than organic fluorophores.
Myosin VI was expressed, purified, and fluorescently labeled as previously described
[28]. Briefly, porcine myosin VI through residue 991, fused with a C-terminal dimerization
domain (GCN4), HaloTag, and Flag purification tag, was cloned into pBiEx-1 and transfected
into SF9 cells, Flag affinity purified, and labeled with TMR-HaloTag ligand (Promega).
Purified proteins were stored at 4C on ice for no more than one week.
Actin was prepared from chicken breast by a method previously described [29] and stored
in its filamentous (F) form. Biotinylated actin filaments were prepared by polymerizing at 10
µM concentration actin that had been labeled with biotin as previously described [23]. For use
as seeds for polymerization inside linear ZMWs, these filaments were stabilized with
equimolar amounts of phalloidin. To prepare for inserting in the waveguides, the biotinylated
filaments were diluted to a concentration of 200 nM and sheared by sonicating in a
microcentrifuge tube in a bath sonicator for three minutes immediately before using them in
the ZMW assays described below. For use in CLIC experiments, the actin was polymerized
with 33% biotinylated actin and 67% unlabeled actin, and after polymerization, the F-actin
was labeled with an equimolar concentration of Alexa 633-labeled phalloidin (Invitrogen).
For polymerizing in linear ZMWs, globular (G) actin was freshly prepared by dialyzing F-
actin into G buffer (2 mM TRIS, pH 8, 0.2 mM CaCl2, 0.5 mM DTT) overnight. Here, we did
not include ATP, which is normally in canonical G buffer, to prevent contamination with dark
ATP, in anticipation of future experiments with fluorescently labeled nucleotide. The
dialyzed solution was centrifuged in a TLA 100 rotor (Beckman) at 95k RPM to remove
filaments that did not fully depolymerize. G actin was stored on ice for no more than a few
days.
#178943 - $15.00 USD Received 5 Nov 2012; revised 14 Dec 2012; accepted 15 Dec 2012; published 10 Jan 2013(C) 2013 OSA 14 January 2013 / Vol. 21, No. 1 / OPTICS EXPRESS 1194
2.2 Computer simulations of excitation intensity inside linear ZMWs
Finite-element time-domain simulations of excitation light intensity at the entrance of a linear
ZMW were performed with the electric field vector of the excitation light either parallel or
perpendicular to the long dimension of the waveguide. Because the simulations benefited
from symmetry, they were performed in 2D. All simulations were performed by the
COMSOL Multiphysics package (Burlington, MA).
2.3 Imaging excitation polarization dependent background fluorescence of free fluorophores
in linear ZMWs
Average fluorescence intensity from 1 µM of freely diffusing Cy3-ATP (prepared in imaging
buffer, described below) was observed as a function of the polarization angle of excitation
light by a 532 nm laser (Coherent). The light introduced was linearly polarized, and the
polarization was rotated using a half-wave plate. Imaging was conducted on a home-built
inverted epifluorescence microscope using a 100x 1.4 NA oil immersion objective (Zeiss).
Excitation light was filtered out using a notch filter (Semrock) and imaged onto an EMCCD
camera (Andor iXon).
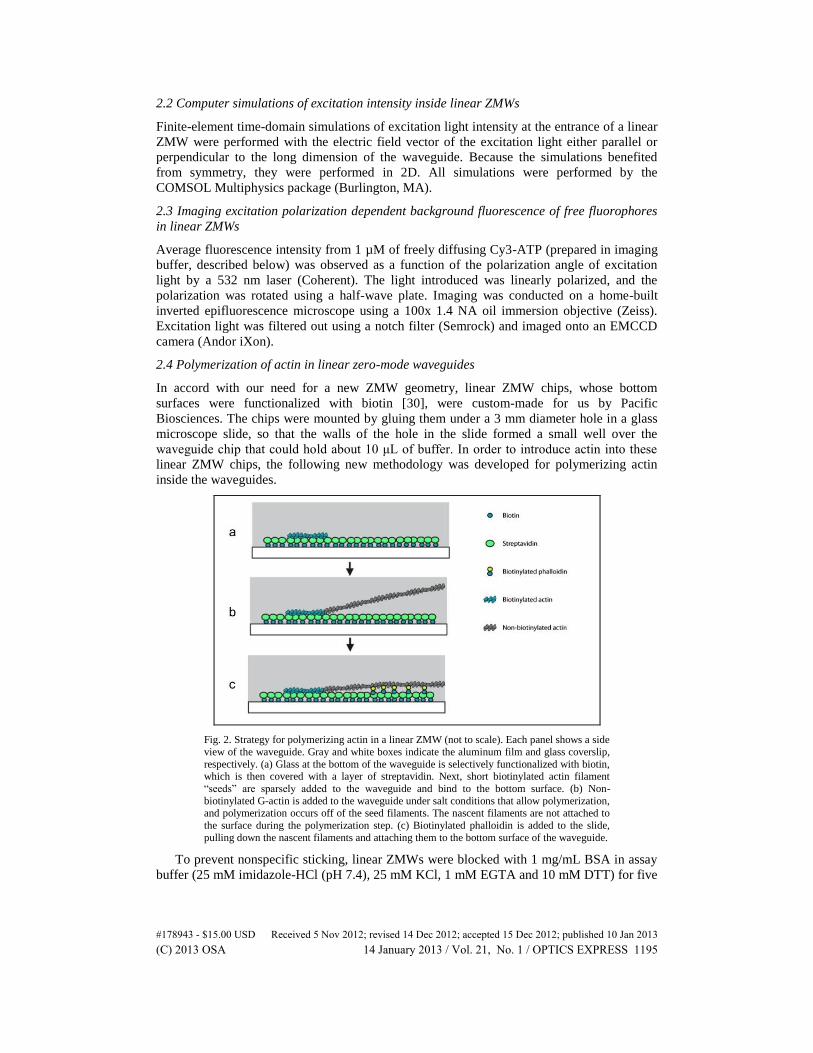
2.4 Polymerization of actin in linear zero-mode waveguides
In accord with our need for a new ZMW geometry, linear ZMW chips, whose bottom
surfaces were functionalized with biotin [30], were custom-made for us by Pacific
Biosciences. The chips were mounted by gluing them under a 3 mm diameter hole in a glass
microscope slide, so that the walls of the hole in the slide formed a small well over the
waveguide chip that could hold about 10 μL of buffer. In order to introduce actin into these
linear ZMW chips, the following new methodology was developed for polymerizing actin
inside the waveguides.
Fig. 2. Strategy for polymerizing actin in a linear ZMW (not to scale). Each panel shows a side
view of the waveguide. Gray and white boxes indicate the aluminum film and glass coverslip,
respectively. (a) Glass at the bottom of the waveguide is selectively functionalized with biotin, which is then covered with a layer of streptavidin. Next, short biotinylated actin filament
“seeds” are sparsely added to the waveguide and bind to the bottom surface. (b) Non-
biotinylated G-actin is added to the waveguide under salt conditions that allow polymerization,
and polymerization occurs off of the seed filaments. The nascent filaments are not attached to
the surface during the polymerization step. (c) Biotinylated phalloidin is added to the slide,
pulling down the nascent filaments and attaching them to the bottom surface of the waveguide.
To prevent nonspecific sticking, linear ZMWs were blocked with 1 mg/mL BSA in assay
buffer (25 mM imidazole-HCl (pH 7.4), 25 mM KCl, 1 mM EGTA and 10 mM DTT) for five
#178943 - $15.00 USD Received 5 Nov 2012; revised 14 Dec 2012; accepted 15 Dec 2012; published 10 Jan 2013(C) 2013 OSA 14 January 2013 / Vol. 21, No. 1 / OPTICS EXPRESS 1195

minutes. Blocking buffer was removed, and 1 mg/mL streptavidin (Invitrogen) was allowed
to bind to the biotinylated surface for 5 minutes. The ZMW chamber was rinsed three
successive times with assay buffer plus BSA, this was removed, and sheared actin filaments
were added to the chip and allowed to bind for 5 minutes (Fig. 2(a)). Excess actin filaments
that did not bind to the waveguides were removed by three successive washes with assay
buffer plus BSA. G actin was freshly diluted into assay buffer (whose salts induce
polymerization) at a concentration of approximately 3 μM and added to the chip. The G actin
was allowed to polymerize off the seed filaments already attached to the bottom of the
waveguide for 20 minutes (Fig. 2(b)). Note that polymerization occurred successfully despite
not adding ATP to the polymerization buffer. The ZMW chip was rinsed with assay buffer
plus BSA three times to remove excess G actin or filaments that polymerized but were not
attached to the surface. Biotinylated phalloidin at a concentration of 1 μM in assay buffer was
added to the chip to attach the nascent filaments to the bottom of the waveguides; it was
allowed to incubate for 5 minutes (Fig. 2(c)). The biotin phalloidin solution was then removed
and replaced with imaging buffer, as described below.
2.5 Imaging myosin in linear zero-mode waveguides
After polymerizing actin and attaching it to the surface, as described above, imaging buffer
that included fluorescently labeled myosin V and 50 µM ATP was added to the waveguide
chip. The imaging buffer consisted of assay buffer (above) with the addition of an oxygen
scavenging system consisting of 0.5% glucose, 0.2 mg/mL glucose oxidase (from Aspergillus
niger, Calbiochem), and 36 μg/mL catalase (from Aspergillus niger, Calbiochem); 1.2 mM
Trolox for improved photostability; and 0.05% Triton X-100 to prevent nonspecific sticking.
For imaging, an Axiovert (Zeiss) with home-built epifluorescence path was used. A 532
nm laser (Coherent) was focused in the center of the back focal plane of a 100x Zeiss TIRF
objective. The laser beam was linearly plane wave polarized, and the polarization was rotated
with a half-wave plate so that the electric field vector pointed along the waveguides, which
was the condition that minimized leakage of incident light into the waveguide (Fig. 4).
Imaging was conducted on an EMCCD camera (Andor iXon).
2.6 Convex lens induced confinement (CLIC) with flow cells
This work introduces a new implementation of CLIC imaging using flow cells that are
standard in many microscopy labs, an important addition as CLIC is consequently now
compatible with existing assays and materials and straightforward to implement. Two initially
planar sheets of glass comprise the top and bottom surfaces of the imaging chamber (#0 glass
coverslip from Ted Pella, # 1.5 glass coverslips from VWR, respectively). In the work
described here, these coverslips were cleaned using a 1:2 solution of 30% hydrogen peroxide
to 95-98% sulfuric acid, at room temperature for 30 minutes (piranha solution). We have also
cleaned coverslips for these experiments using successive sonication washes with Alconox
detergent dissolved in water; acetone; ethanol; 1 M KOH; and ultra-pure water; with several
washes with ultrapure water between each sonication step. The latter presents a less harsh
though more time-consuming approach. Flow chambers were constructed by adhering two
coverslips together with double-sided tape (Scotch brand Permanent Double Sided tape).
To prepare the sample, the flow cell was first coated non-specifically with biotinylated-
BSA (Sigma) by incubating at a concentration of 1 mg/mL in assay buffer (described above)
for 2 minutes. The following solutions were then added to the chamber and allowed to
incubate for 2 minutes each: 30 µL of assay buffer plus 1 mg/mL BSA; then 10 µL of 1
mg/mL streptavidin (Invitrogen) in assay buffer. The chamber was rinsed with 30 µL of assay
buffer plus BSA. Biotinylated actin filaments were diluted in assay buffer to 200 nM
(monomer concentration), and 10 µL were added to the chamber and incubated for two
minutes. The actin was rinsed out with 30 µL of assay buffer plus BSA, and finally 10 µL of
imaging buffer containing myosin VI and 50 µM ATP was added to the chamber. Imaging
#178943 - $15.00 USD Received 5 Nov 2012; revised 14 Dec 2012; accepted 15 Dec 2012; published 10 Jan 2013(C) 2013 OSA 14 January 2013 / Vol. 21, No. 1 / OPTICS EXPRESS 1196

buffer was the same as that described above for ZMWs, except that it did not contain Triton-
X 100, and additionally contained an ATP regeneration system consisting of 1 mM
phosphocreatine and 100 μg/mL creatine phosphokinase (Calbiochem), as well as a spectrally
separate, non-reactive fluorophore (Alexa 488, 50 nM), whose fluorescence served as an in
situ diagnostic of the chamber height.
To form the imaging chamber, the flow cell CLIC device (Fig. 3) was assembled as in
Fig. 3(a). The interface between the pushing lens and the top coverslip was coated with index-
matching immersion oil (Cargille HF), to prevent reflections from surfaces other than the two
coverslip-buffer interfaces. The mechanical clamp was used to press the lens downward on
the top coverslip (thin and flexible), which caused the top coverslip to bow downward until it
made contact with the bottom coverslip (thicker and less flexible) at a single point. The
device function and mechanics are shown in Fig. 3.
Fig. 3. Flow-cell CLIC apparatus. (a) Side view of the flow-cell CLIC apparatus (not to scale).
The lens (Thorlabs LA4966) is initially raised for sample insertion (left) and subsequently lowered for imaging (right), decreasing the volume of excited fluorophores (pink) in the
imaging region. Excitation light entering from below is shown in green. (b) Top-view of the
CLIC device (to scale). A cantilever controls the lens positioning. It contains a clearance hole for a finely threaded rod (Thorlabs F25US200). A spring (Small Parts CSXX-0160-05) is
mounted around the rod and directly above the cantilever. A finely threaded lock-nut (Thorlabs
LN25100) is mounted on the rod directly above the spring. The downward rotation of the lock-
nut presses against the spring and consequently lowers the lens. The spring resists the
downward motion of the lock-nut with approximately the same force (~1 N) as is required to
deform the coverslip in this geometry. The initial flow chamber (~8 mm wide, ~100 µm thick) is confined vertically by the top and bottom coverslip surfaces and laterally by the edges of
double-sided tape. The cantilever is mounted, using custom clamps, on a thin aluminum hinge aligned so that the lens surface is in contact with the top of the flow cell when the cantilever is
horizontal. The flow cell is held in place by custom spring clips. (c) Side view of the CLIC
device showing the imaging chamber (to scale). The dark gray trapezoid depicts a hole in the plate that gives clearance for the objective.
Molecules were imaged in the deformed chamber using an inverted fluorescence
microscope (Nikon TI-E with 1.5x added magnification; 60x oil immersion objective; Andor
897 camera). The microscopy was performed in 4 sequential steps: first, the central region of
the imaging chamber was imaged to determine the intensity profile of freely diffusing
fluorophores. The center contact point was identified by the minimum dye fluorescent
intensity. Next, the surface-immobilized actin filaments were imaged, and then movies were
taken of the myosin proteins at several chamber locations (and therefore gap heights). Finally,
interferometry of the imaging chamber was performed to spatially resolve its height profile.
In each step, a 5x5 grid of high-resolution images (91 × 91 µm2), spanning a total area of 278
× 291 µm2, was acquired by translating the sample relative to the objective using a
programmed microscope stage (Biopoint2, Ludl).
The free dye was imaged using a 488 nm laser (Sapphire 100 mW, Coherent), 10 mW
illumination, 1 frame per location, and a 100 ms exposure time. The actin filaments were
#178943 - $15.00 USD Received 5 Nov 2012; revised 14 Dec 2012; accepted 15 Dec 2012; published 10 Jan 2013(C) 2013 OSA 14 January 2013 / Vol. 21, No. 1 / OPTICS EXPRESS 1197
imaged using a 640 nm laser (OBIS 100 mW, Coherent), 7 mW illumination, 1 frame per
location, and 100 ms exposure time. The myosin proteins were imaged using a 561 nm laser
(Sapphire 100 mW, Coherent), 20 mW illumination, 100 frames per location, and a 500 ms
exposure time. Interferometry of the chamber height profile was performed by directly
imaging the 488 nm laser profile, using 0.1 mW illumination, 1 frame per location, and a 30
ms exposure time. The emission filters were in place for fluorescence imaging and removed
for interferometry [26].
2.7 Characterization of CLIC imaging chamber height
The dye fluorescence intensity and chamber interferometry (corresponding to Newton’s rings)
were analyzed to characterize the chamber heights at the locations of the myosin motors.
Newton’s rings are separated by 184 nm, taking the refractive index of solution and probe
wavelength to be 1.33 and 488 nm respectively. To calculate the chamber height, the
normalized dye fluorescence (proportional to the local chamber height) was fit to a sixth-
order polynomial. The proportionality constant between the chamber height and the dye
fluorescence was calculated using the location of the first interference ring. The re-scaled fit
of the dye fluorescence was used as an input to a direct least-squares fit of the measured
interference profile (using the 488 nm probe). In estimating the error on the determination of
the height of the CLIC chamber, it was assumed that the dominant source of error was the
proportionality constant between the dye fluorescence and the chamber height. Since the
constant was calculated using the location of the first interference fringe, the error was
estimated by varying the constant such that the first contour of the fitted chamber height
profile lay either just outside or just inside the edges of the first minimum ring on the
measured interferometry image.
3. Results
3.1 Linear zero-mode waveguides can reduce background fluorescence when the light
polarization is parallel to the slits
The new linear, rather than cylindrical, geometry was essential to our application of linear
ZMWs to experiments with myosin. To test whether this new geometry could be used to
restrict excitation of fluorophores to a layer very close to the surface of the waveguide and
significantly shallower than TIRF, we conducted finite element simulations of excitation light
entering the linear ZMW, with polarization both parallel and perpendicular to the slits (Figs.
4(a), 4(b), and 4(c)). We found that when the electric field vector of the excitation light was
perpendicular to the slits, the light propagated through the slit and deeply into solution (Fig.
4(a)), which would cause a high background fluorescence from excitation of fluorophores in
solution. However, when the electric field was directed parallel to the slits, excitation fell off
quickly with depth and was confined within a few nanometers of the entrance to the linear
ZMW; the intensity was decreased by 2-3 orders of magnitude by the top of the 120 nm thick
aluminum film (Fig. 4(b)). This matched well with previous experiments with rectangular
nanoslits, which were comparable in width to our linear ZMWs, although these nanoslits were
much shorter [31].
To verify this excitation confinement experimentally, we imaged freely diffusing
fluorescent dye (Cy3-ATP) inside linear ZMWs at a concentration of 1 µM while varying the
polarization (Fig. 4(d)). As expected from the simulations, polarization perpendicular to the
slits caused a considerable amount of background. This background was significantly reduced
when the polarization was parallel to the slits.
#178943 - $15.00 USD Received 5 Nov 2012; revised 14 Dec 2012; accepted 15 Dec 2012; published 10 Jan 2013(C) 2013 OSA 14 January 2013 / Vol. 21, No. 1 / OPTICS EXPRESS 1198

Fig. 4. Linear ZMWs restrict fluorescent excitation when light is polarized parallel to the slits.
(a) 2D finite-element time-domain simulations of excitation light intensity with polarization
perpendicular to the long dimension of the waveguide. Simulations were performed for a 50 nm linear ZMW and the intensity is plotted on a log scale. Under this condition, a significant
amount of excitation light propagates up into solution. (b) Simulations analogous to panel (a),
but with excitation light polarization parallel to the long dimension of the waveguide (condition that minimizes background fluorescence). Under this condition, intensity has
decreased by about 3 orders of magnitude over the 120 nm depth of the linear ZMW. Note that
the log intensity scale varies between panels (a) and (b). (c) Image of nanofabricated linear ZMW, imaged with a 20x objective and a white light source. Linear ZMWs range from ~50-
250 nm in width. The linear ZMW at the top of the image include manufacturing defects of
unknown cause. The definition of the polarization angle for panels (a) and (b) is drawn on top of the image. (d) Average fluorescence intensity (red dots) due to the diffuse background of 1
µM free Cy3-ATP as a function of the excitation polarization angle with fit to theory (blue
line). When the polarization is parallel to the longest dimension of the ZMW, the background fluorescence is minimized.
3.2 Actin filaments can be introduced into linear ZMWs by polymerizing inside the
waveguides
A major challenge to the use of linear ZMWs for myosin motility experiments was loading
actin filaments into the bottom of the waveguides. We tried two methods of doing so: by
specifically attaching actin filaments to the bottom of the slits and by developing a new
strategy to polymerize actin filaments inside the waveguides.
Loading already-polymerized actin filaments into the narrow waveguide slits was likely to
prove challenging since long actin filaments rotationally diffuse slowly enough that they are
rarely oriented properly to allow diffusion to the bottom of the waveguide. Indeed, we found
that when we blocked the aluminum surface and preferentially functionalized the bottom of
the waveguides with biotin [30], actin filaments that were long enough for myosin to take
more than a few steps were only rarely attached to the bottom of the waveguides when they
were introduced by diffusion. We attempted to increase the loading of actin filaments to the
bottom of the slits by using increasing concentrations of actin, by waiting longer amount of
time for them to attach, and by shearing the actin to produce shorter filaments, but we were
not able to reproducibly introduce actin filaments longer than a few hundred nanometers into
the linear ZMWs with these approaches.
We then took an alternative approach of loading actin by polymerizing the filaments
inside the linear ZMWs, as described in detail in the methods section. This new strategy for
attaching actin to a coverslip surface was much more successful. We verified that actin was
#178943 - $15.00 USD Received 5 Nov 2012; revised 14 Dec 2012; accepted 15 Dec 2012; published 10 Jan 2013(C) 2013 OSA 14 January 2013 / Vol. 21, No. 1 / OPTICS EXPRESS 1199

present by adding fluorescently labeled myosin, and looking for processive myosin runs that
would indicate the presence of actin filaments, as described below (Fig. 5).
3.3 Myosin moves along actin filaments inside linear ZMWs
To observe myosin motility on polymerized actin filaments, we added fluorescently labeled
myosin V and ATP to the ZMWs. We were able to see myosin V runs of >1 micron, as shown
in the kymograph in Fig. 5, indicating that long actin filaments had been polymerized inside
the linear ZMWs. Since myosin V steps are ~36 nm in length, this is long enough to allow at
least 30 steps along actin inside the linear ZMWs.
Fig. 5. Example kymograph of myosin V molecules walking along actin in a linear ZMW.
Note that in some of the myosin runs shown in this kymograph, such as the one beginning
around 5 seconds and the one beginning around 35 seconds, two myosin molecules are walking along the actin filament very close together.
3.4 Myosin walks in the flow-cell CLIC device under significant confinement
The CLIC imaging chamber confines molecules to a thin film to suppress background
fluorescence. When the imposed confinement is on the same order as the molecular size, the
confinement can alter molecular behavior. This was an important potential hurdle to
overcome with CLIC, as it had not previously been demonstrated that the mechanical
confinement introduced by the CLIC device was compatible with biological activity. In this
work, we demonstrate the first biological application of CLIC by characterizing the
processive movement of myosin along actin filaments at various degrees of confinement. This
was an important step toward applying CLIC imaging to studying interactions of myosin with
fluorescently labeled ATP at high concentrations. This characterization provides not only a
technical measure of the potential improvement in imaging quality, but also insight into how
confinement or crowding affects molecular interactions in this system and others.
The applied confinement, corresponding to the chamber height, is shown in Fig. 6(a). The
contours of the least-squares fit to the interference pattern and dye fluorescence are
superimposed on the data (see Methods Sect. 2.5).
The spatial distribution of actin filaments within the chamber was uniform, which was
expected since the filaments were inserted before the chamber was compressed. The
trajectories of individual myosin proteins at different locations in the chamber were imaged
(e.g. Figure 6(b)). Figure 6(c) shows the area density at which we observed processive
myosins as a function of the chamber height. Processive myosin movement was not observed
in chambers with heights less than 58 nm ( + 6 nm/-12 nm; see Methods Sect. 2.7 for error
analysis); instead, these motor proteins were either diffusing or immobile. Using the
trajectories of motors that did undergo processive movement, the speed was calculated at
different locations in the chamber. Little correlation was seen between velocity and chamber
height, indicating that, if motile, the myosin movement is largely unperturbed by the
confinement of the CLIC device (Fig. 6(d)). The chamber height measured by interferometry
is the coverslip-coverslip separation, which exceeds the effective chamber height experienced
by the proteins (e.g. due to surface-blocking agents, see Discussion).
#178943 - $15.00 USD Received 5 Nov 2012; revised 14 Dec 2012; accepted 15 Dec 2012; published 10 Jan 2013(C) 2013 OSA 14 January 2013 / Vol. 21, No. 1 / OPTICS EXPRESS 1200
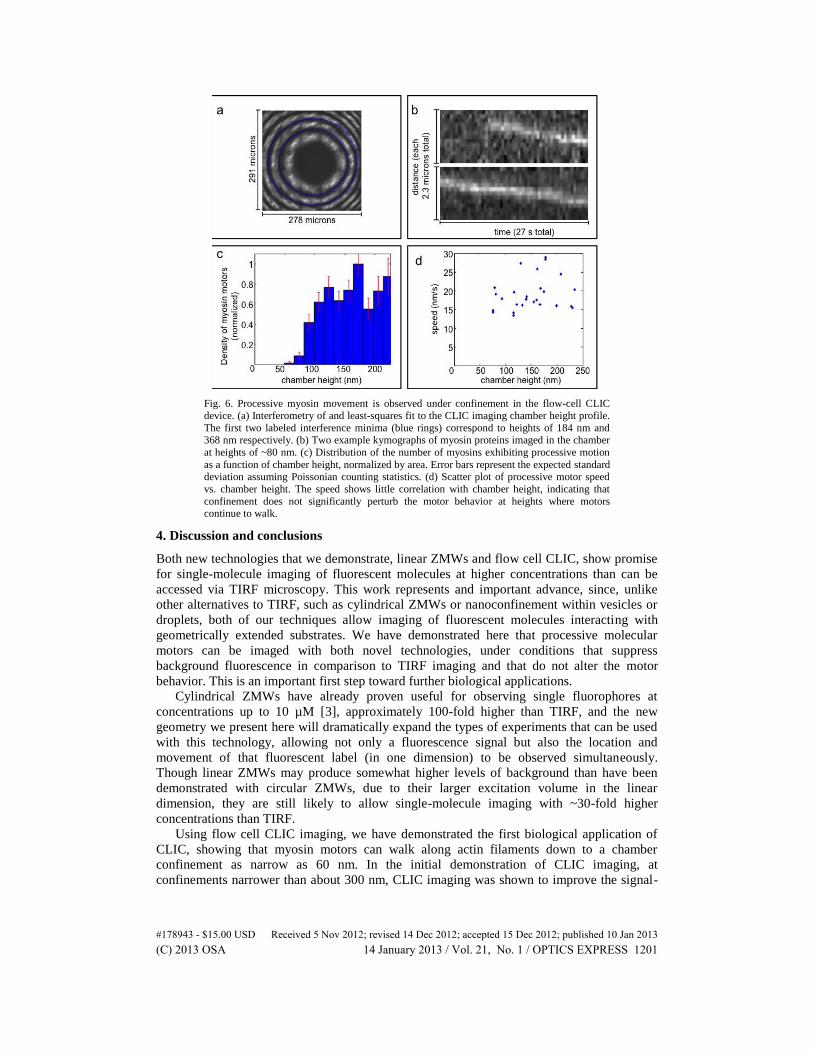
Fig. 6. Processive myosin movement is observed under confinement in the flow-cell CLIC device. (a) Interferometry of and least-squares fit to the CLIC imaging chamber height profile.
The first two labeled interference minima (blue rings) correspond to heights of 184 nm and 368 nm respectively. (b) Two example kymographs of myosin proteins imaged in the chamber
at heights of ~80 nm. (c) Distribution of the number of myosins exhibiting processive motion
as a function of chamber height, normalized by area. Error bars represent the expected standard deviation assuming Poissonian counting statistics. (d) Scatter plot of processive motor speed
vs. chamber height. The speed shows little correlation with chamber height, indicating that
confinement does not significantly perturb the motor behavior at heights where motors continue to walk.
4. Discussion and conclusions
Both new technologies that we demonstrate, linear ZMWs and flow cell CLIC, show promise
for single-molecule imaging of fluorescent molecules at higher concentrations than can be
accessed via TIRF microscopy. This work represents and important advance, since, unlike
other alternatives to TIRF, such as cylindrical ZMWs or nanoconfinement within vesicles or
droplets, both of our techniques allow imaging of fluorescent molecules interacting with
geometrically extended substrates. We have demonstrated here that processive molecular
motors can be imaged with both novel technologies, under conditions that suppress
background fluorescence in comparison to TIRF imaging and that do not alter the motor
behavior. This is an important first step toward further biological applications.
Cylindrical ZMWs have already proven useful for observing single fluorophores at
concentrations up to 10 µM [3], approximately 100-fold higher than TIRF, and the new
geometry we present here will dramatically expand the types of experiments that can be used
with this technology, allowing not only a fluorescence signal but also the location and
movement of that fluorescent label (in one dimension) to be observed simultaneously.
Though linear ZMWs may produce somewhat higher levels of background than have been
demonstrated with circular ZMWs, due to their larger excitation volume in the linear
dimension, they are still likely to allow single-molecule imaging with ~30-fold higher
concentrations than TIRF.
Using flow cell CLIC imaging, we have demonstrated the first biological application of
CLIC, showing that myosin motors can walk along actin filaments down to a chamber
confinement as narrow as 60 nm. In the initial demonstration of CLIC imaging, at
confinements narrower than about 300 nm, CLIC imaging was shown to improve the signal-
#178943 - $15.00 USD Received 5 Nov 2012; revised 14 Dec 2012; accepted 15 Dec 2012; published 10 Jan 2013(C) 2013 OSA 14 January 2013 / Vol. 21, No. 1 / OPTICS EXPRESS 1201

to-background in comparison to TIRF imaging [26]. Therefore, we expect that, at the
confinements demonstrated in this study, implementing CLIC imaging will suppress the
background from fluorophores in solution by at least five-fold, making single-molecule
imaging possible at fluorophore concentrations at least five times higher than with TIRF. In
fact, it may be that even further improvements are possible, since the BSA coating used to
block both surfaces in this study may substantially increase the effective confinement
experienced by molecules in the imaging chamber. While these concentration improvements
are not as dramatic as those possible with ZMWs, they are significant, and CLIC has the
advantage of the ease with which it may be implemented.
Thus, both technologies will have an important place, with ZMWs possibly more
applicable to systems where large increases in concentration are needed, and CLIC useful
when more modest concentration increases are sufficient but a simpler experimental setup is
desirable. Though not employed in this study, the CLIC geometry has an additional imaging
characteristic that is advantageous for some experiments: it extends typical diffusion-limited
observation periods of small proteins from ~10 microseconds for ZMWs (or ~100
microseconds for TIRF) to ~seconds for CLIC imaging. These improvements to both
suppressing background fluorescence and extending observation periods make a wide range
of new biophysical measurements possible.
In conclusion, we have demonstrated two new microscopy technologies that will facilitate
a wide range of new single-molecule studies of low affinity molecular interactions and
dynamics, particularly with substrates where one dimension extends beyond 100 nm. We
have already described one of the most obvious applications: looking at fluorescent
nucleotide binding and releasing as processive motors move along filaments. There are many
systems for which such an experiment will be informative, including the processive myosins,
kinesins, and dynein. Another important application is in examining polymerization of
biological filaments, such as actin. For instance, it has been suggested that actin may be able
to undergo dynamic instability [32], analogous to that of microtubules. Although there is
some evidence from experiments using TIRF that dynamics that are more transient and
smaller in scale may occur in actin compared to those in microtubules [33,34], dynamic
instability of actin has not been clearly observed experimentally. Imaging polymerization at
higher concentrations of fluorescently labeled monomers will facilitate direct measurements
of the polymerization and depolymerization kinetics of actin and of other biological
filaments, such as microtubules or the many recently-discovered bacterial actin homologues
[35].
Acknowledgments
MWE and JAS were supported by NIH Grant GM33289. MWE thanks the Gerald J.
Lieberman Fellowship (Stanford University) for support. SRL thanks the Mary Feiser
Fellowship (Harvard University) for support during early development of this work. SRL
thanks NSERC EQPEQ 422513-12 and NSERC RGPIN 418915-12 for financial support of
the presented CLIC microscopy (performed at McGill University). CM and JSL thank
NSERC’s Cellular Dynamics of Molecular Complexes CREATE Program for fellowship
support. AEC was supported by NSF Grant CHE-0910824 and by the Harvard Materials
Research Science and Engineering Center (MRSEC) under grant DMR-0820484. The authors
thank Daniel Berard for assistance with flow cell preparation and for preparing the device
schematic in Fig. 3 and Blair Jia for experimental assistance with flow cell preparation in the
Leslie laboratory.
Statement of competing financial interests
JK is a full-time employee at Pacific Biosciences, a company commercializing single-
molecule, real-time nucleic acid sequencing technologies.
#178943 - $15.00 USD Received 5 Nov 2012; revised 14 Dec 2012; accepted 15 Dec 2012; published 10 Jan 2013(C) 2013 OSA 14 January 2013 / Vol. 21, No. 1 / OPTICS EXPRESS 1202