Embed Size (px)
Citation preview
Article
Single Live Cell Monitoring
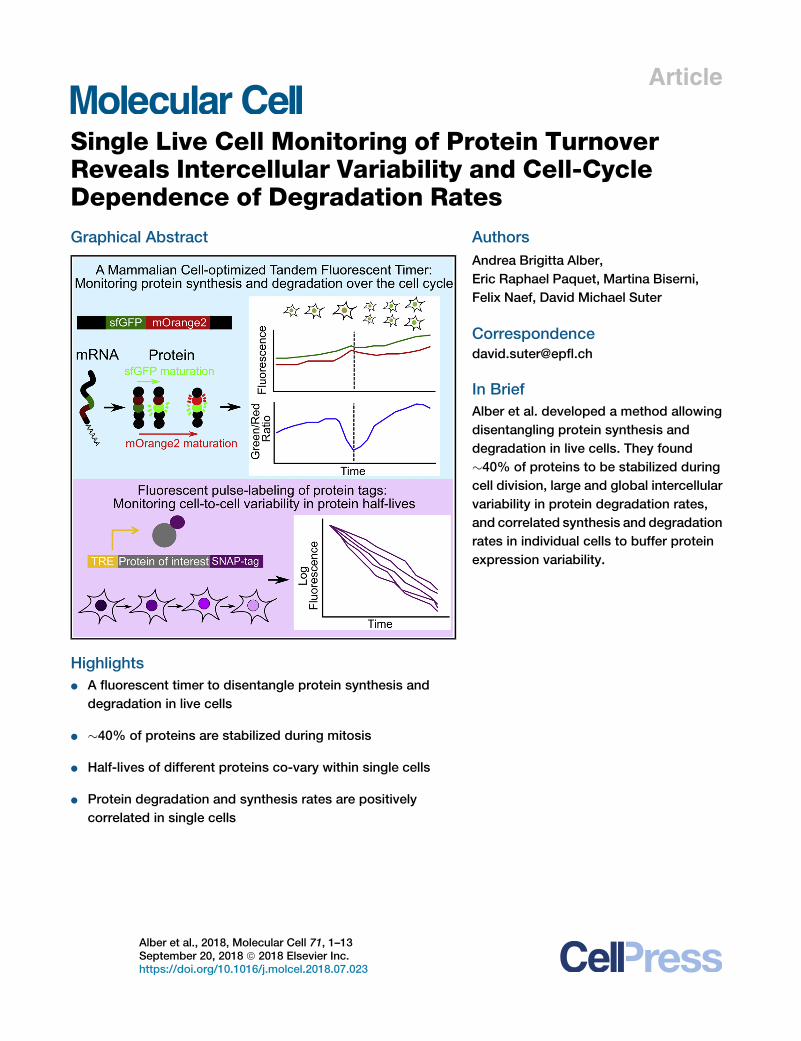
of Protein TurnoverReveals Intercellular Variability and Cell-CycleDependence of Degradation RatesGraphical Abstract
Highlights
d A fluorescent timer to disentangle protein synthesis and
degradation in live cells
d �40% of proteins are stabilized during mitosis
d Half-lives of different proteins co-vary within single cells
d Protein degradation and synthesis rates are positively
correlated in single cells
Alber et al., 2018, Molecular Cell 71, 1–13September 20, 2018 ª 2018 Elsevier Inc.https://doi.org/10.1016/j.molcel.2018.07.023
Authors
Andrea Brigitta Alber,
Eric Raphael Paquet, Martina Biserni,
Felix Naef, David Michael Suter
In Brief
Alber et al. developed a method allowing
disentangling protein synthesis and
degradation in live cells. They found
�40% of proteins to be stabilized during
cell division, large and global intercellular
variability in protein degradation rates,
and correlated synthesis and degradation
rates in individual cells to buffer protein
expression variability.
Please cite this article in press as: Alber et al., Single Live Cell Monitoring of Protein Turnover Reveals Intercellular Variability and Cell-Cycle Depen-dence of Degradation Rates, Molecular Cell (2018), https://doi.org/10.1016/j.molcel.2018.07.023
Molecular Cell
Article
Single Live Cell Monitoring of Protein TurnoverReveals Intercellular Variabilityand Cell-Cycle Dependence of Degradation RatesAndrea Brigitta Alber,1,2 Eric Raphael Paquet,1,2 Martina Biserni,1 Felix Naef,1 and David Michael Suter1,3,*1Institute of Bioengineering, School of Life Sciences, Ecole Polytechnique Federale de Lausanne (EPFL), Lausanne 1015, Switzerland2These authors contributed equally3Lead Contact*Correspondence: [email protected]
https://doi.org/10.1016/j.molcel.2018.07.023
SUMMARY
Cells need to reliably control their proteome compo-sition to maintain homeostasis and regulate growth.How protein synthesis and degradation interplay tocontrol protein expression levels remains unclear.Here, we combined a tandem fluorescent timer andpulse-chase protein labeling to disentangle howprotein synthesis and degradation control proteinhomeostasis in single live mouse embryonic stemcells. We discovered substantial cell-cycle depen-dence in protein synthesis rates and stabilization ofa large number of proteins around cytokinesis. Pro-tein degradation rates were highly variable betweencells, co-varied within individual cells for differentproteins, and were positively correlated with synthe-sis rates. This suggests variability in proteasomeactivity as an important source of global extrinsicnoise in gene expression. Our approach paves theway toward understanding the complex interplay ofsynthesis and degradation processes in determiningprotein levels of individual mammalian cells.
INTRODUCTION
Dynamic changes in protein expression levels are determined by
how cells balance the rates at which proteins are synthesized
and degraded. In proliferating cells, the proteome needs to be
precisely doubled from one division to the next, as otherwise
cell homeostasis would be compromised. However, how
doubling of global protein levels is achieved and how protein
synthesis and degradation rates vary over the cell cycle is not
well understood. Studies based on transcriptome and prote-
ome-wide approaches, such as ribosome profiling or puromy-
cin-associated nascent chain proteomics (PUNCH-P), have re-
ported that most proteins are synthesized at similar relative
rates in G1, S, and G2 phase (Aviner et al., 2013; Stumpf et al.,
2013; Tanenbaum et al., 2015). Larger changes in protein syn-
thesis occur in M phase, during which transcriptional activity
(Palozola et al., 2017; Parsons and Spencer, 1997) and transla-
M
tional efficiency of most mRNAs are strongly reduced (Tanen-
baum et al., 2015). In contrast, our understanding on changes
in protein degradation rates over the cell cycle is restricted to
specific cases such as proteins involved in cell-cycle regulation
(Shaik et al., 2012) and targets of the GSK3 kinase (Acebron
et al., 2014). Furthermore, most of these studies are limited by
low temporal resolution, the use of cell-cycle synchronizing
drugs that can interfere with translation (Coldwell et al., 2013),
and cell population-based measurements that obscure cell-to-
cell variability.
Over the past decade, single-cell analysis has revealed sur-
prisingly large intercellular variability in gene expression, which
has direct implications on a broad range of biological processes
(Kaern et al., 2005; Raj and van Oudenaarden, 2008). This is of
particular relevance for stem cells, as expression level variability
of certain stem cell markers can have an impact on cell differen-
tiation (Chang et al., 2008). Importantly, variability in gene tran-
scription was shown to vary substantially between genes (Suter
et al., 2011), however, it is not known whether this is also true for
downstream steps of gene expression such as translation and
protein degradation.
Here, we leveraged on several single-cell time-lapse imaging
strategies and computational modeling to disentangle synthesis
and degradation rates of 40 endogenous proteins in mouse em-
bryonic stem cells (ESCs) and to measure cell-to-cell variability
in protein turnover. First, we developed an approach based on
protein tagging with a tandem fluorescent timer and show that
it allows for simultaneously measuring synthesis and degrada-
tion rates of endogenous proteins in single ESCs. Second, we
used pulse-chase labeling and time-lapse imaging of dual
fluorescent SNAP/Halo-tags to measure protein degradation
rates in individual cells. We found that protein synthesis varies
substantially between G1 and G2 phase, while degradation is
markedly decreased for a large fraction of proteins around cyto-
kinesis. Surprisingly, protein degradation rates displayed signif-
icant intercellular variability in both ESCs and fibroblasts and
these were accompanied by compensatory changes in protein
synthesis rates that dampened intercellular variability in protein
expression levels. Finally, we show that cell-to-cell variability in
protein degradation rates is caused by global rather than gene-
specific differences in protein degradation and is correlated
with single-cell expression levels of the proteasome component
ADRM1.
olecular Cell 71, 1–13, September 20, 2018 ª 2018 Elsevier Inc. 1
A B C
D
E
F G
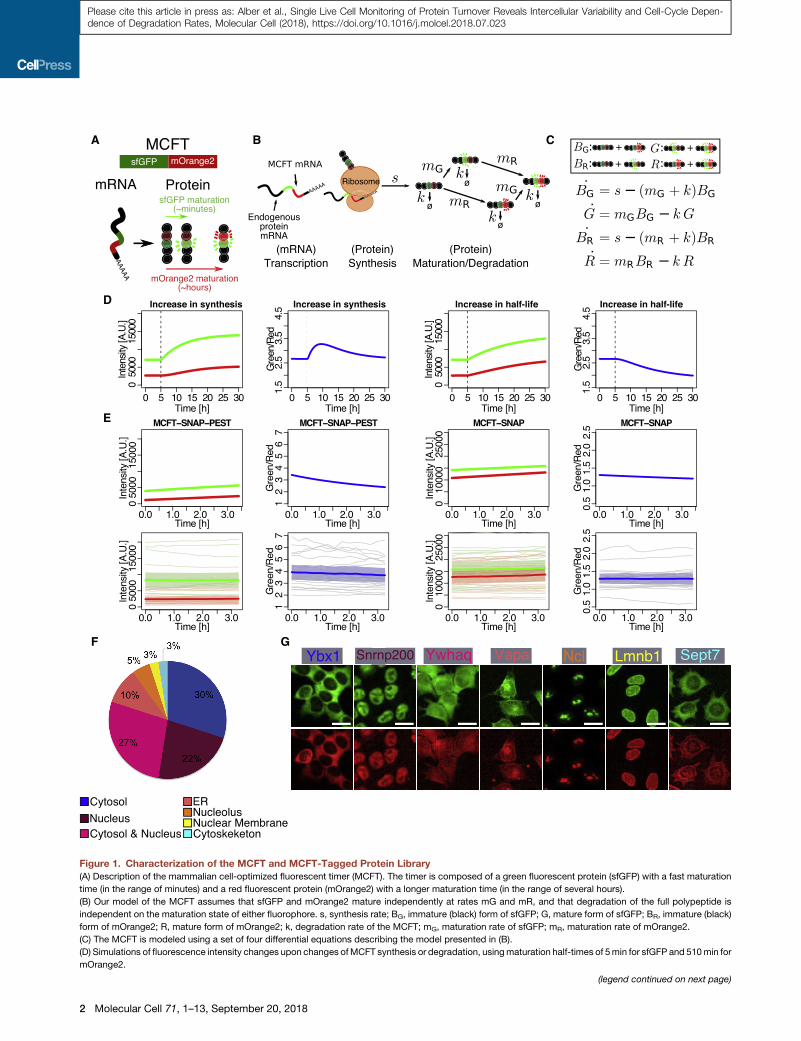
Figure 1. Characterization of the MCFT and MCFT-Tagged Protein Library
(A) Description of the mammalian cell-optimized fluorescent timer (MCFT). The timer is composed of a green fluorescent protein (sfGFP) with a fast maturation
time (in the range of minutes) and a red fluorescent protein (mOrange2) with a longer maturation time (in the range of several hours).
(B) Our model of the MCFT assumes that sfGFP and mOrange2 mature independently at rates mG and mR, and that degradation of the full polypeptide is
independent on the maturation state of either fluorophore. s, synthesis rate; BG, immature (black) form of sfGFP; G, mature form of sfGFP; BR, immature (black)
form of mOrange2; R, mature form of mOrange2; k, degradation rate of the MCFT; mG, maturation rate of sfGFP; mR, maturation rate of mOrange2.
(C) The MCFT is modeled using a set of four differential equations describing the model presented in (B).
(D) Simulations of fluorescence intensity changes upon changes ofMCFT synthesis or degradation, usingmaturation half-times of 5min for sfGFP and 510min for
mOrange2.
(legend continued on next page)
2 Molecular Cell 71, 1–13, September 20, 2018
Please cite this article in press as: Alber et al., Single Live Cell Monitoring of Protein Turnover Reveals Intercellular Variability and Cell-Cycle Depen-dence of Degradation Rates, Molecular Cell (2018), https://doi.org/10.1016/j.molcel.2018.07.023
Please cite this article in press as: Alber et al., Single Live Cell Monitoring of Protein Turnover Reveals Intercellular Variability and Cell-Cycle Depen-dence of Degradation Rates, Molecular Cell (2018), https://doi.org/10.1016/j.molcel.2018.07.023
RESULTS
A Mammalian-Cell-Optimized Tandem FluorescentTimer to Monitor Endogenous Protein Turnover inSingle CellsTandem fluorescent timers consist of the fusion of a fast-
maturing superfolder green fluorescent protein (sfGFP) to a
slower maturing red fluorescent protein (Khmelinskii et al.,
2012). The distinct maturation times of the two fluorophores
can be used to measure protein age and stability. While a
mCherry fusion to sfGFP is ideal to study shorter-lived yeast
proteins, mammalian proteins are longer lived and thus require
a red fluorescent protein with a longer maturation half-time (Fig-
ure S1A). Therefore, we decided to use a fusion of sfGFP and
mOrange2, hereafter named mammalian-cell-optimized fluores-
cent timer (MCFT), because mOrange2 has a maturation time of
several hours (Figures 1A and S1A) (Shaner et al., 2008).
While tandem fluorescent timers have been mainly used as a
readout of protein age or to compare relative degradation rates
between different proteins (Khmelinskii et al., 2014), we
reasoned that they could also allow distinguishing between dy-
namic changes in protein synthesis and protein degradation
because these processes should impact differently on changes
in the emission of the two fluorophores. To substantiate this
concept, we performed computational simulations of fluores-
cence time traces of the MCFT, subjected to shifts in synthesis
and degradation rates (Figures 1B–1D). We simulated the
MCFT using a set of four differential equations corresponding
to the four protein states of our MCFT, i.e., the immature and
mature forms of both the sfGFP and mOrange2 fluorophores
(Figures 1B and 1C; STAR Methods). While similar changes in
steady-state protein levels can be obtained by opposite alter-
ations of synthesis or degradation rates, these two scenarios
will reflect differently on the ratio between green and red fluores-
cence (Figure 1D). Therefore, time-lapse monitoring of theMCFT
should enable disentangling changes in protein synthesis versus
protein degradation. As a proof of principle to illustrate this, we
simulated fluorescence levels using themodel (including realistic
levels of noise; see STAR Methods) and fitted those traces,
which showed that synthesis and degradation rates could be
retrieved accurately from the combined green and red time
traces, even in a non-steady-state configuration (Figures S1B
and S1C; STAR Methods).
To complement our simulations and to confirm that indeed the
MCFT is sensitive to protein half-lives, we generated two mouse
ESC lines allowing doxycycline (dox)-inducible expression of a
nuclear MCFT or a nuclear MCFT fused to a protein destabiliza-
tion sequence (PEST), respectively (Rogers et al., 1986). In
addition, we fused both MCFT versions to a SNAP-tag (Keppler
et al., 2003), allowing quantification of protein half-lives in vivo
(Alber and Suter, 2018; Bojkowska et al., 2011) (Figure S1D).
(E) Comparison of the evolution of simulated (top) and obtained (bottom) green
MCFT-SNAP-PEST and MCFT-SNAP timers in mouse ESCs. Thick line and shad
(F) Percentages of MCFT-tagged proteins for each subcellular localization.
(G) Examples of one MCFT-tagged protein for each subcellular localization (color
fluorescence. Scale bars, 20 mm.
See also Figure S1 and Table S1.
We then determined the half-lives of MCFT-SNAP-PEST and
MCFT-SNAP by pulse-labeling with SNAP SiR-647 ligand 24 hr
after dox induction, followed by fluorescence decay monitoring
by microscopy (6.9 ± 2.2 hr [SD] and 21.0 ± 5.3 hr [SD], respec-
tively, Figure S1E). Next, we monitored green and red fluores-
cence time traces of MCFT-SNAP-PEST and MCFT-SNAP
48 hr after dox induction at the single-cell level (Figure 1E). As
expected, and in line with our simulations, we observed a lower
level of intensity of the sfGFP-mOrange2 fluorophores as well as
a higher level for the green/red ratio for theMCFT-SNAP-PEST in
comparison with the MCFT-SNAP (Figure 1E). Using the
half-lives determined by the SNAP fluorescence decay, the
experimental data could be well reproduced by simulations,
suggesting that modeling the MCFT should enable inferring pro-
tein synthesis and degradation rates in mouse ESCs.
A Library of Endogenously MCFT-Tagged ProteinsWe next aimed at using the MCFT to monitor endogenous pro-
tein synthesis and degradation rates in single live cells. To do
so, we took advantage of the central dogma (CD)-tagging
approach (Jarvik et al., 1996), which allows for internal fusions
of fluorescent tags to endogenous proteins in mammalian cells
(Harikumar et al., 2017; Sigal et al., 2007), mostly without altering
their turnover rates (Cohen et al., 2008).We generated a library of
40 mouse ESC lines, in each of which a different endogenous
protein was tagged with the MCFT (Figure S1F) and identified
by 30rapid amplification of cDNA ends (30RACE) (Yeku and Froh-
man, 2011). The 40 tagged proteins spanned a broad range of
biological functions (Figure S1G; Table S1) and their subcellular
localizations mostly (38/40) matched those described in the liter-
ature (Figures 1F and 1G; Table S1).
Protein Accumulation Dynamics during InterphaseHow protein synthesis and degradation interplay to control pro-
tein accumulation during the cell cycle is not well understood. To
quantify protein accumulation, synthesis, and degradation over
the cell cycle in single live cells, we measured the total nuclear
green (sfGFP) and red (mOrange2) fluorescence intensities
from one division to the next with time intervals of 15 min for 6
nuclear timer-tagged proteins from our library using semi-auto-
mated cell tracking. The temporal accumulation of the green
fluorescence intensity, which is a good surrogate of the absolute
protein level due to the short maturation time of the sfGFP (STAR
Methods), showed that all protein levels steadily increased dur-
ing the cell cycle (Figure 2A). In fact, none seemed to reach a
steady state within one cell cycle, which likely reflects that the
studied proteins are longer-lived than the cell-cycle duration
(12.3 ± 2 hr [SD]). To estimate synthesis (s) and degradation (k)
rates from modeling the MCFT intensities (STAR Methods), we
assumed a simple model in which these can increase or
decrease with a fixed slope during cell-cycle progression. The
and red traces as well as green/red ratios after 48 hr dox-induction of the
es: mean and 95% confidence intervals, respectively.
code refers to F). Images show sfGFP (green, top) and mOrange2 (red, bottom)
Molecular Cell 71, 1–13, September 20, 2018 3
A
EDC
B
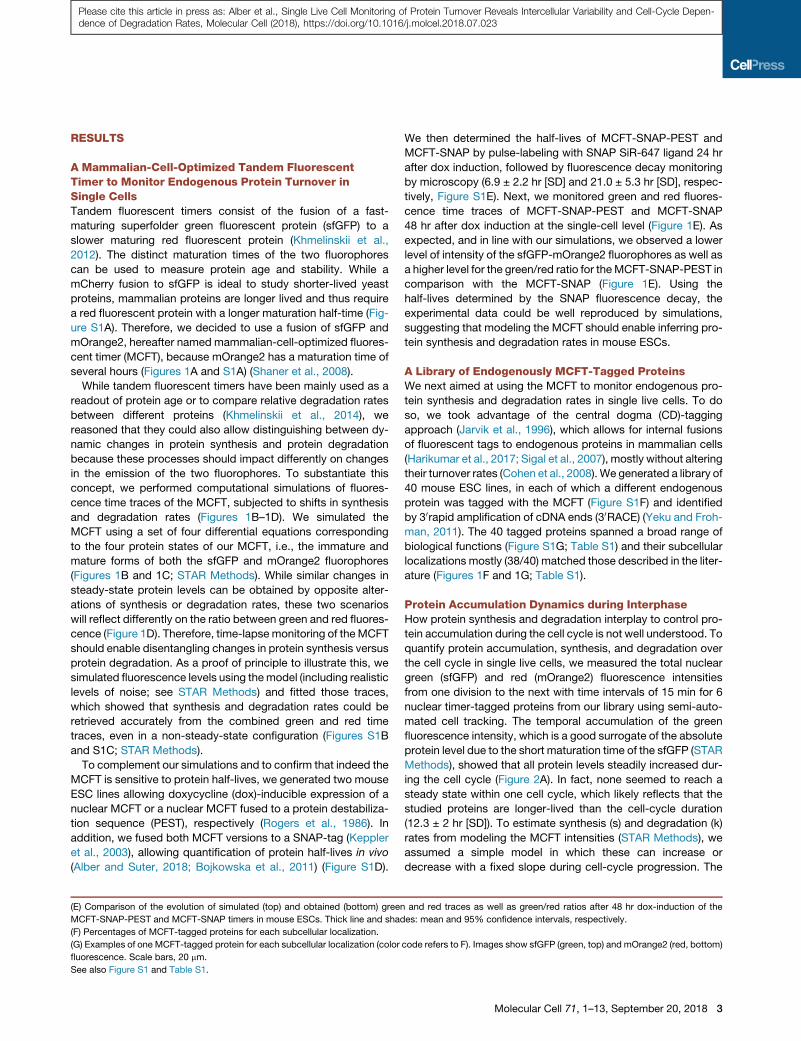
Figure 2. Protein Accumulation Dynamics during the Cell Cycle(A) Single-cell accumulation dynamics of 6 nuclear MCFT-tagged proteins over one cell cycle and percentage of traces best fit by a linear (l), exponential (e), or
quadratic (q) model.
(B) Percentage (at any given time) of the steady state (s(k)/k(t)) reached by the 6 nuclear MCFT-tagged proteins over the cell cycle. Plain and dashed lines, median
and inter-quartile ranges, respectively. Dashed red line, median percentage over the cell cycle.
(C) Protein doubling during the cell cycle for 6 nuclear MCFT-tagged proteins.
(D) Protein doubling as a function of cell-cycle duration for 6 nuclear MCFT-tagged proteins.
(E) Comparison of synthesis and degradation rates at the beginning and end of the cell cycle for all individual cells of 6 nuclearMCFT-tagged proteins.Mean (dots)
and 2D SD (ellipses) of estimated synthesis (left) and degradation (right) rates from all individual cells are shown.
See also Figure S2.
Please cite this article in press as: Alber et al., Single Live Cell Monitoring of Protein Turnover Reveals Intercellular Variability and Cell-Cycle Depen-dence of Degradation Rates, Molecular Cell (2018), https://doi.org/10.1016/j.molcel.2018.07.023
fitted rates showed that the observed sfGFP intensities corre-
sponded to �50% of the predicted instantaneous steady state
s(t)/k(t) (Figures 2B and S2A). Furthermore, best fits of the green
signals showed that, except for the accumulation of RALY that is
better explained by a linear increase, all studied proteins best fit
upward bent quadratic or exponential accumulation patterns
(Figure 2A). Single-cell protein expression levels at the beginning
of the cell cycle did not correlate with a particular protein accu-
mulation dynamics (Figure S2B). Linear and quadratic protein
accumulation dynamics have been previously linked to unstable
and stable mRNAs, respectively (Cohen et al., 2009).
To quantify the relative increase of protein levels within one
cell cycle, we compared green intensities at the end (defined
4 Molecular Cell 71, 1–13, September 20, 2018
as the maximum intensity obtained in a window of 1 hr before
cytokinesis) and the beginning (defined as the minimal inten-
sity obtained in a window of 1 hr after cytokinesis) of the
cell cycle. On average, protein levels in individual cells
doubled during each cell cycle (Figure 2C), independently of
cell-cycle duration, which varied from 10 to 20 hr (Figure 2D),
indicating that the accumulation rate and the cell-cycle dura-
tion scale inversely (Figure S2C). As our analysis of the MCFT
can also distinguish changes in protein synthesis from
changes in protein degradation over the cell cycle, we found
that, consistent with a majority of nonlinear accumulation pro-
files of the green protein (Figure 2A), protein synthesis
increased during the cell cycle for 4 out of 6 nuclear proteins,
A B C
FED
G
(legend on next page)
Molecular Cell 71, 1–13, September 20, 2018 5
Please cite this article in press as: Alber et al., Single Live Cell Monitoring of Protein Turnover Reveals Intercellular Variability and Cell-Cycle Depen-dence of Degradation Rates, Molecular Cell (2018), https://doi.org/10.1016/j.molcel.2018.07.023
Please cite this article in press as: Alber et al., Single Live Cell Monitoring of Protein Turnover Reveals Intercellular Variability and Cell-Cycle Depen-dence of Degradation Rates, Molecular Cell (2018), https://doi.org/10.1016/j.molcel.2018.07.023
while protein degradation rates did not show clear trends (Fig-
ures 2E, S2D, and S2E).
Protein Accumulation Dynamics around Cell DivisionInitial MCFT experiments revealed significant changes in
green/red ratios around cytokinesis for several proteins, which
motivated us to analyze our full library of 40 MCFT-tagged pro-
teins in a time window ranging from 5 hr before to 5 hr after
cytokinesis. Briefly, we tracked green and red fluorescence in-
tensities for 20 cells per clone. Importantly, our tracking
approach took into account the integrated fluorescence inten-
sities of the whole cell; thus, our measurements should be fairly
insensitive to changes in protein localization during the cell cycle.
In contrast to the analysis performed in the previous section, we
focused on changes in protein amounts per fixed number of
MCFT-tagged alleles (2 tagged alleles in G2) and therefore
summed the intensities of the two daughter cells after division.
The first time framewhere the two daughter cells were separated
was defined as t = 0 hr and the individual traceswere split in three
intervals around cytokinesis: (1) before division (bD) (�5 hr
to �1 hr), (2) during division (D) (�1 hr to 30 min), and (3) after di-
vision (aD) (30min to 5 hr). Because these intervals are fairly short
on the scale of protein half-lives, we assumed synthesis and
degradation rates to be constant in every interval, and estimated
best fits of the green and red intensities over the three intervals
(STAR Methods; Table S2).
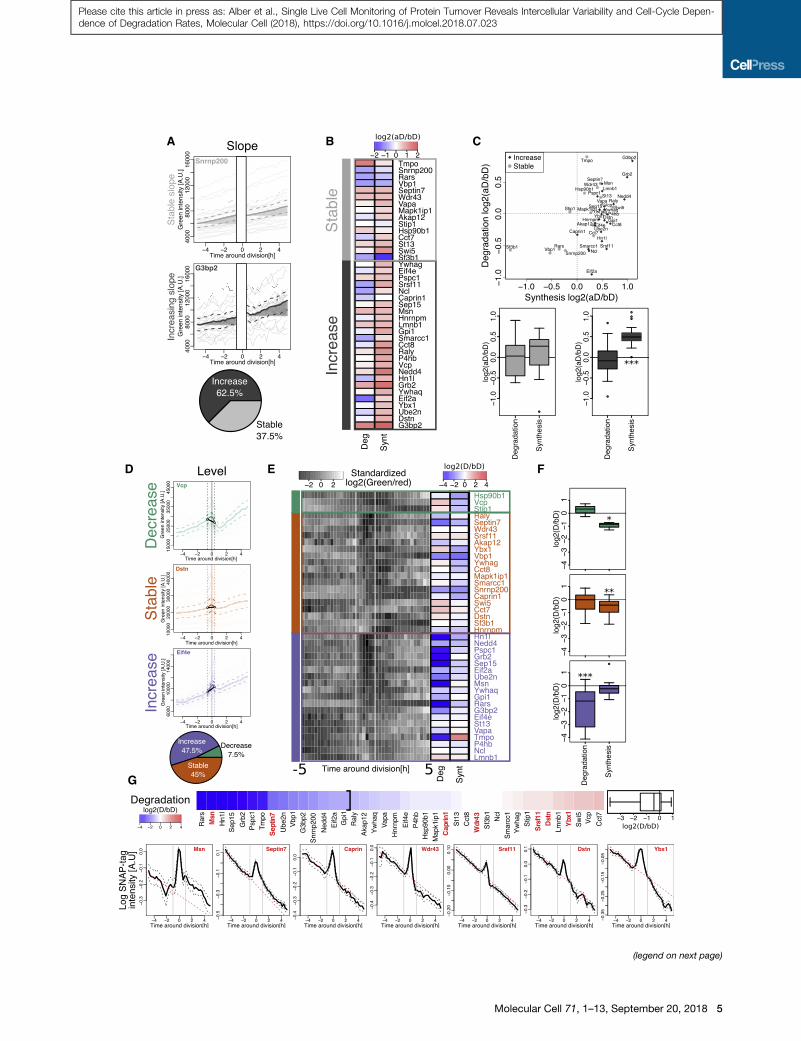
We first focused on changes in protein accumulation rate
(slopes) between the aD and bD intervals. While 15 proteins dis-
played stable accumulation rates, 25 increased their accumula-
tion rate after division (Figures 3A and S3A). We then used the
kinetic model to determine how underlying changes in synthesis
and degradation explain these profiles. While protein degrada-
tion rates were mostly unchanged between the aD and bD inter-
vals, most proteins increasing their accumulation rate in the aD
interval displayed a higher synthesis rate per allele after division
(Figures 3B and 3C). Therefore, increased protein accumulation
rate in G1 phase is mostly due to an increase in protein synthesis
per gene copy.
Given that a global decrease in translation and stabilization of
subsets of proteins were reported during mitosis (Acebron et al.,
Figure 3. Protein Accumulation Dynamics around Division
(A) Single-cell integrated green fluorescence intensities from�5 hr to�1 hr and +
the two groups (pie chart). Bold lines, population average; dashed lines, 95% co
(B) Median log2 ratio (aD/bD) of degradation and synthesis rates for proteins wit
(C) Top: log2 (aD/bD) synthesis and degradation rates for all individual proteins. B
proteins in each of the two groups (***p < 0.001, t test).
(D) Single-cell integrated green fluorescence intensities from �1 hr to +0.5 hr with
(pie chart). Bold lines, population average; dashed lines, 95%confidence intervals
in green intensity during division; vertical line, cytokinesis.
(E) Standardized averaged log2(green/red) ratio around division for all 40 proteins.
ordered by their green/red ratio around cytokinesis. To the right of the heatmap:
lines, �1 hr and +0.5 hr time points.
(F) Distribution of log2 (D/bD) ratios for synthesis and degradation rates of proteins
and ***p < 0.001, t test).
(G) Top: ordered log2 ratio of degradation rates during division (D) and before divis
Bottom: mean SNAP-tag decay (thick black lines) signal and SE (black dashed
around division in the MCFT dataset. Red dashed lines, fitted decays estimated
See also Figure S3 and Table S2.
6 Molecular Cell 71, 1–13, September 20, 2018
2014; Tanenbaumet al., 2015), we next focused our analysis on a
narrower time window centered on cell division. MCFT-tagged
proteins were grouped according to their changes in protein
levels during a time period of 1 hr before to 30 min after cytoki-
nesis. We found that protein levels either decreased (3/40
clones), were stable (18/40 clones), or increased (19/40 clones)
during this time interval (Figures 3D and S3B). Furthermore, a
large fraction of proteins displayed a transient decrease in their
green/red ratio around division (Figure 3E), suggesting altered
protein synthesis and/or degradation around division. We then
used our MCFT model to determine how changes in synthesis
and degradation rates lead to changes in protein levels in the
three groups (Figure 3E; STAR Methods). We found that the
decreasing and stable protein profiles seen in the first and
second groups are caused by a decrease in protein synthesis
during division (Figures 3E and 3F). In contrast, the increasing
protein level profiles of the third group were not caused by
changes in synthesis rates, but rather by a large decrease in
degradation rates (protein stabilization) during division (Figures
3E and 3F). Thus, protein synthesis (Figures 3C and 3F) and
degradation (Figure 3F) are modulated differentially and in a pro-
tein-specific manner to shape protein accumulation profiles
around cytokinesis.
To validate the observed changes in degradation rates using
an orthogonal approach, we generated seven dox-inducible
cell lines, each expressing the coding sequence of one protein
of interest from theMCFT-tagged protein library fused to a C-ter-
minal SNAP-tag. After pulse-labeling with the SiR-647 dye, we
measured the decaying signal in a window of 10 hr centered
on cytokinesis to estimate how degradation rates change during
cell division (Figure 3G). Because the obtained fluorescence in-
tensity values at the time-points around division are imprecise
due to cell detachment during cytokinesis, we fitted the SNAP-
tag decay signal from 5 to 1 hr before cytokinesis and compared
it to the observed decay curve after cytokinesis. For MSN and
SEPTIN7, the predicted protein stabilization during division
was confirmed by the upward shift in the fluorescence decay
curve after cytokinesis (Figure 3G). For CAPRIN1 and WDR43,
we observed no major differences in the fluorescence decay
traces after cytokinesis as expected from theMCFT data. Lastly,
0.5 hr to +5 hr with respect to cytokinesis for representative proteins of each of
nfidence intervals.
h either stable or increasing accumulation rate.
ottom: distribution of log2 (aD/bD) ratios for synthesis and degradation rates of
respect to cytokinesis for representative proteins of each of the three groups
; vertical dashed lines, time points (�1 hr and +0.5 hr) used to estimate changes
Proteins are first ordered by their group (decrease, stable, or increase) and then
median log2 ratio (D/bD) of the degradation and synthesis rates. White vertical
associated to the decrease, stable, and increase groups (*p < 0.05, **p < 0.01,
ion (bD). The left bracket highlights the proteins with a log2 ratio lower than�1.
lines) around division for 7 proteins showing different degradation dynamics
from �5 to �1 hr before division.
A
B
C
D E F
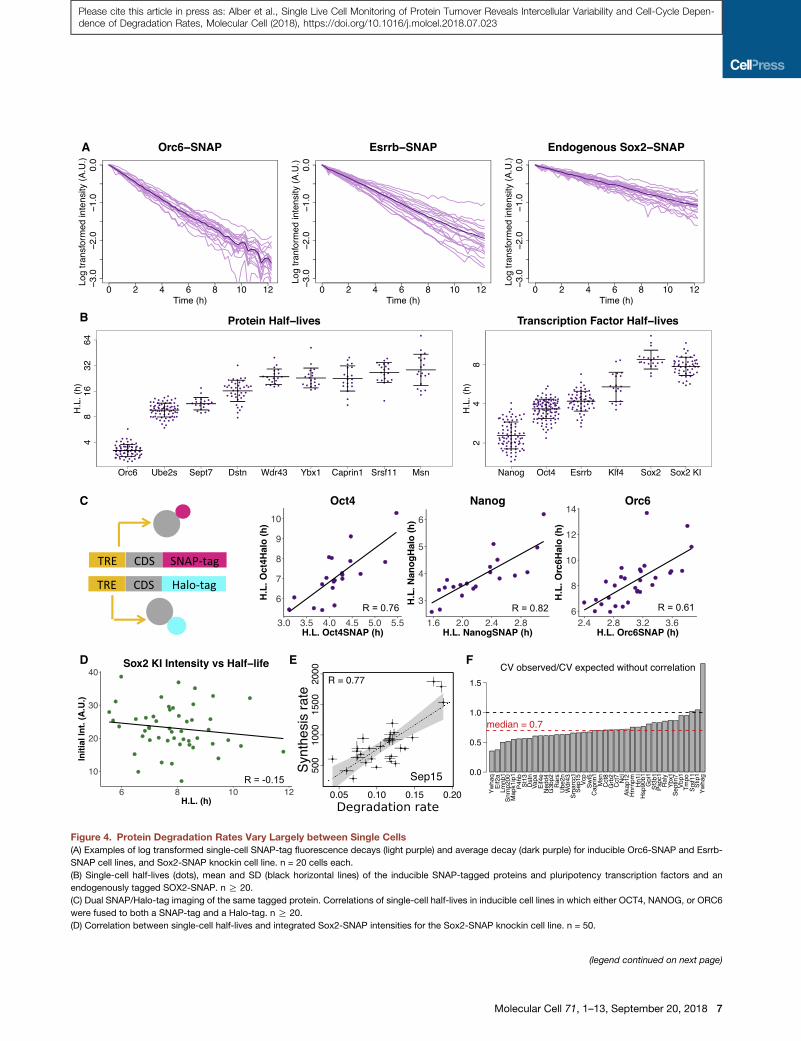
Figure 4. Protein Degradation Rates Vary Largely between Single Cells
(A) Examples of log transformed single-cell SNAP-tag fluorescence decays (light purple) and average decay (dark purple) for inducible Orc6-SNAP and Esrrb-
SNAP cell lines, and Sox2-SNAP knockin cell line. n = 20 cells each.
(B) Single-cell half-lives (dots), mean and SD (black horizontal lines) of the inducible SNAP-tagged proteins and pluripotency transcription factors and an
endogenously tagged SOX2-SNAP. n R 20.
(C) Dual SNAP/Halo-tag imaging of the same tagged protein. Correlations of single-cell half-lives in inducible cell lines in which either OCT4, NANOG, or ORC6
were fused to both a SNAP-tag and a Halo-tag. n R 20.
(D) Correlation between single-cell half-lives and integrated Sox2-SNAP intensities for the Sox2-SNAP knockin cell line. n = 50.
(legend continued on next page)
Molecular Cell 71, 1–13, September 20, 2018 7
Please cite this article in press as: Alber et al., Single Live Cell Monitoring of Protein Turnover Reveals Intercellular Variability and Cell-Cycle Depen-dence of Degradation Rates, Molecular Cell (2018), https://doi.org/10.1016/j.molcel.2018.07.023
Please cite this article in press as: Alber et al., Single Live Cell Monitoring of Protein Turnover Reveals Intercellular Variability and Cell-Cycle Depen-dence of Degradation Rates, Molecular Cell (2018), https://doi.org/10.1016/j.molcel.2018.07.023
for SRSF11, DSTN, and YBX1, we predicted an increase in
degradation, which was confirmed by the downward shift in fluo-
rescence decay traces after division, even though the effect was
slightly delayed for YBX1. To probe the degradation dynamics
around division for shorter-lived proteins, we performed the
same experiment with SNAP-tag fusions of five pluripotency-
associated transcription factors and observed a decrease in
degradation around division for two of them (Figure S3C). We
conclude that the SNAP-tag decay data are in very good agree-
ment with the predictions made using the MCFT, confirming that
protein degradation rates are altered in a large fraction of pro-
teins around cell division.
Protein Degradation Rates Vary Significantly betweenSingle CellsWe next aimed at determining how protein degradation rates
vary between individual cells. To do so, we used the 12 dox-
inducible SNAP-tag fusion cell lines described above and two
additional cell lines expressing SNAP-tagged versions of the
origin of replication complex member ORC6 and the ubiquitin
ligase UBE2S. We determined single-cell protein half-lives in
all 14 cell lines by pulse-labeling and fitting of exponential decay
curves (Alber and Suter, 2018) (Figures 4A and S1D). Surpris-
ingly, individual cells displayed up to 2- to 3-fold differences
between cells with the shortest and longest half-lives and coef-
ficients of variation of 0.2–0.4 (Figures 4B and S4A). Single-cell
half-lives were not correlated with the initial integrated SNAP
fluorescence intensity (Figures S4B and S4C; Table S3), sug-
gesting that the observed variability is not due to an overexpres-
sion artifact. In addition, we measured the half-life of endoge-
nous SOX2 using a knockin cell line in which both SOX2 alleles
are endogenously fused to a SNAP-tag (Strebinger et al., 2018)
and found similar average SOX2 half-lives and variability as for
the corresponding dox-inducible cell line (Figure 4B). To further
confirm that the observed cell-to-cell variability in half-lives is
not merely due to uncertainty in single-cell measurements
and/or exponential fittings, we generated three cell lines in which
we expressed both a SNAP-tagged and a Halo-tagged (Los
et al., 2008) fusion of the same protein, both under the control
of a dox-inducible promoter (Figure 4C). The Halo-tag works
on the same principle as the SNAP-tag and it can be labeled
with a fluorescent ligand of a different color. If the observed
variability in degradation rates stemmed from measurement un-
certainty, wewould expect the half-lives of the two proteins to be
poorly correlated in single cells. We thus determined the half-
lives of the SNAP-tagged and the Halo-tagged version of our
proteins of interest in single cells. While the Halo-tag prolonged
the half-lives of all tagged proteins, the half-lives of the SNAP-
tagged and the Halo-tagged proteins were highly correlated in
single cells, indicating that the observed variability in protein
degradation rates is not due to measurement or exponential
fitting uncertainty (Figure 4C; Table S3).
(E) Example of correlation between degradation and synthesis rates for the SEP15
95% confidence interval of the linear fit.
(F) Ratio of observed coefficient of variation (CV) versus expected one if synthesis
50% steady state.
See also Figure S4 and Table S3.
8 Molecular Cell 71, 1–13, September 20, 2018
Interestingly, we did not observe higher initial SNAP fluores-
cence intensity in cells with longer half-lives in the Sox2-SNAP
knockin cell line (Figure 4D; Table S3). Because longer protein
half-lives should lead to higher protein levels, this suggests
that cell-to-cell differences in protein degradation might be
compensated at the synthesis level. We thus asked how the syn-
thesis and degradation rates that we previously obtained around
division from our 40MCFT-tagged proteins (Figure 3) correlate in
single cells. We observed significant positive correlation
between the two rates for most proteins (35/40, 87.5%) in our
library (Figures 4E and S4D), suggesting that individual cells
compensate for variations in degradation rates by changes in
synthesis rates. While a correlation between the two rates is
not necessary to preserve the mean protein level (Figure S4E),
it is required to buffer protein level fluctuations and allows for
maintaining the coefficient of variation to a median level lower
than in the absence of correlation between synthesis and degra-
dation rates (Figures 4F and S4F; STAR Methods).
Cell-to-Cell Variability in Half-Lives Is Caused byHeterogeneity in Global Protein Degradation RatesWe next asked whether intercellular heterogeneity in protein
degradation rates is caused by protein-specific mechanisms or
global variability in protein degradation rates. To do so, we
generated seven additional dox-inducible ESC lines, in each of
which one protein is taggedwith a SNAP-tag and another protein
is tagged with a Halo-tag, andmeasured the fluorescence decay
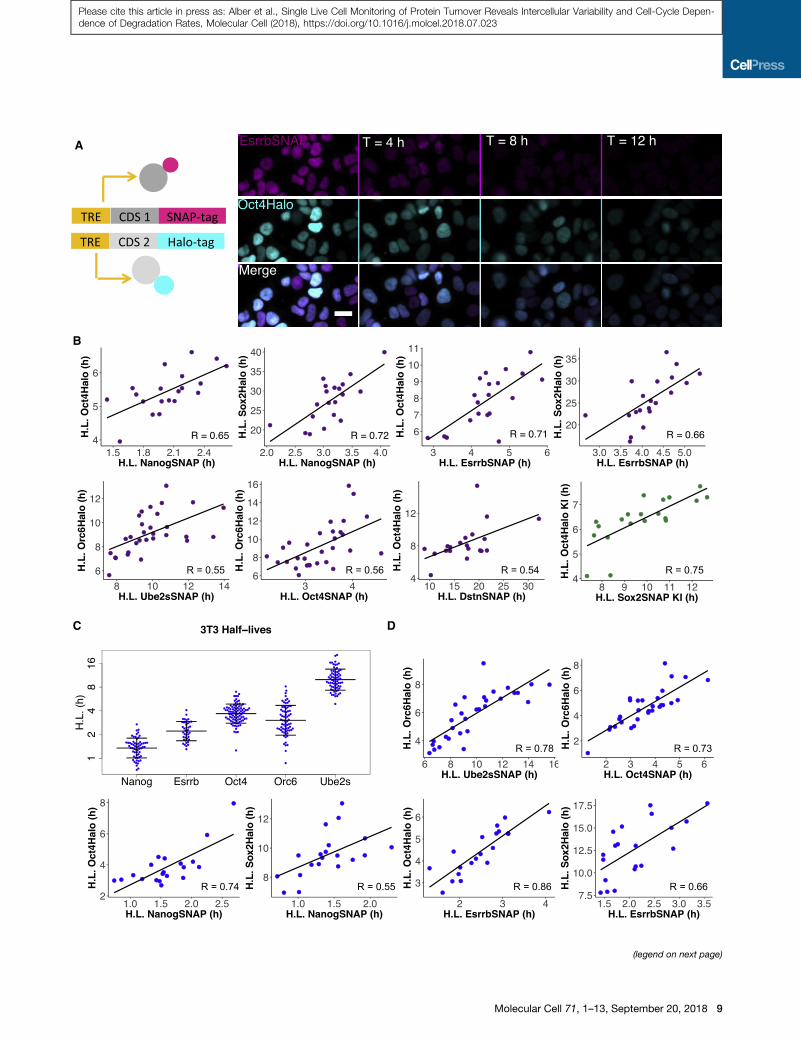
from both channels as described above (Figure 5A). Strikingly,
the determined half-lives were strongly correlated, not only be-
tween functionally related proteins (pluripotency transcription
factors), but also between unrelated proteins (Figure 5B; Table
S3). Importantly, the fluorescence decay in either channel was
not affected by photobleaching (Figure S4G). In addition, we
also monitored the SNAP/Halo decay in a SOX2-SNAP/OCT4-
Halo knockin cell line (Strebinger et al., 2018) and observed a
high correlation of endogenous SOX2 and OCT4 protein half-
lives in individual cells (Figure 5B; Table S3). Next, we measured
single-cell protein half-lives in NIH 3T3 fibroblasts, and found
similar ranges of intercellular variability in protein degradation
rates, as well as similar coefficients of variations (Figures 5C
and S5A). In addition, we also observed strong correlations in
the half-lives of different proteins in single cells (Figures 5D
and S5B; Table S3). We conclude that cell-to-cell variability in
protein half-lives is largely due to global variations in protein
degradation rates in both ESCs and NIH 3T3 fibroblasts.
Finally, we asked whether differences in proteasome activity
could account for intercellular variability in protein degradation
rates. While the rate-limiting components of protein degradation
are not known, raising the levels of ADRM1, which acts as a ubiq-
uitin receptor and is part of the 19S subunit of the proteasome,
was reported to increase proteasome activity (Huang and Her,
2017). We thus asked whether the expression levels of ADRM1
protein on n = 30 single cell traces. Lines, SE; dashed line, linear fit; gray area,
and degradation rates were not correlated for the 40 MCFT-tagged proteins at
A
B
C D
(legend on next page)
Molecular Cell 71, 1–13, September 20, 2018 9
Please cite this article in press as: Alber et al., Single Live Cell Monitoring of Protein Turnover Reveals Intercellular Variability and Cell-Cycle Depen-dence of Degradation Rates, Molecular Cell (2018), https://doi.org/10.1016/j.molcel.2018.07.023
Please cite this article in press as: Alber et al., Single Live Cell Monitoring of Protein Turnover Reveals Intercellular Variability and Cell-Cycle Depen-dence of Degradation Rates, Molecular Cell (2018), https://doi.org/10.1016/j.molcel.2018.07.023
or two other putatively non-rate limiting proteasome subunits
(proteasome 20S alpha 2 subunit, a component of the protea-
some core complex, and TBP7 [PSMC4], an ATPase subunit of
the 19S regulatory complex) could explain intercellular heteroge-
neity in protein half-lives. We first measured the decay of fluores-
cence from the inducible ORC6-SNAP, UBE2S-SNAP, and
OCT4-SNAP cell lines in E14 andNIH 3T3 cells and fixed the cells
immediately after time-lapse microscopy. We then stained
ADRM1, the proteasome 20S alpha 2, and TBP7 by immunoflu-
orescence and re-imaged the same fields of view from which we
measured protein degradation rates. This enabled us tomeasure
protein degradation rates and to quantify the levels of the protea-
some subunits of interest within the same cells (Figure 6A). While
single-cell half-lives did not correlate with the levels of Protea-
some 20S alpha2 and TBP7 (Figures S5C–S5F; Table S3), we
found significant negative correlations between ADRM1 levels
and protein half-lives for most tested proteins in individual
ESCs and NIH 3T3 fibroblasts (Figures 6B and 6C; Table S3).
This suggests that heterogeneity in ADRM1 levels contributes
to intercellular variability in protein degradation rates. To further
investigate the role of ADRM1 expression levels in protein degra-
dation, we generated two cell lines expressing dox-inducible
versions of both ADRM1 and SOX2-SNAP or ORC6-SNAP and
tested whether ADRM1 overexpression has an impact on protein
half-lives (Figure 6D). We observed a moderate decrease in half-
lives for both SOX2-SNAP and ORC6-SNAP, suggesting that
heterogeneity in expression levels for rate-limiting components
of the proteasome contributes to intercellular variability in global
protein degradation rates.
DISCUSSION
Cellular proteins are constantly synthesized and degraded,
however, it has been challenging to understand how these two
processes interplay to regulate protein levels. Here, we report
an approach that allows to disentangle protein synthesis from
protein degradation changes in single living cells and in a time-
resolved manner. This method should be broadly applicable to
any cell type or organism that is amenable to time-lapse fluores-
cence imaging.
We found major changes in protein synthesis and degradation
over the cell cycle, in particular around the time of cell division.
Most strikingly, many of our MCFT-tagged proteins were stabi-
lized during division. Whereas a decrease in protein synthesis
might be expected, as both transcription and translation are
known to decrease substantially during mitosis (Palozola et al.,
2017; Tanenbaum et al., 2015), the observed global decrease
in protein degradation is surprising. In fact, a similar phenome-
Figure 5. Cell-to-Cell Variability in Protein Half-Lives Is Caused by Glo
Fibroblasts
(A) Dual SNAP/Halo-tag imaging of 2 different tagged proteins. Construct schem
Oct4-Halo cell line. Scale bar, 20 mm.
(B) Single-cell half-life correlations for 7 combinations of SNAP- and Halo-tag
n R 20 each.
(C) Single-cell half-lives (dots), mean, and SD (black horizontal lines), for the indu
(D) Single-cell half-life correlations for 6 combinations of SNAP- and Halo-tagged
See also Figure S5 and Table S3.
10 Molecular Cell 71, 1–13, September 20, 2018
non has only been observed for GSK3 target proteins, which
are protected from degradation during M phase (Acebron
et al., 2014). However, with the exception of PSPC1, TMPO,
and NEDD4, none of the other proteins stabilized during division
are known GSK3 targets (Acebron et al., 2014; Taelman et al.,
2010). In addition, in our ESC culture conditions, we use inhibi-
tors directly targeting GSK3, thus bypassing the source of cell-
cycle-dependent fluctuations in the GSK3 pathway. Therefore,
the mechanistic basis of the observed decrease in degradation
remains unclear. Mitosis is characterized by massive degrada-
tion of cell-cycle-related proteins regulated by two different E3
ligase complexes: the SCF complex, which targets a variety of
cell-cycle-associated substrates for degradation at the G2/M
transition and the APC/C complex, which regulates the meta-
phase to anaphase transition by regulating the degradation of
CYCLIN A, CYCLIN B, SECURIN, and various other substrates
(Shaik et al., 2012). Therefore, this could potentially limit protein
degradation resources for other cellular proteins. However,
further studies will be required to explore this hypothesis. The
consequences of protein stabilization around cell division for
cellular physiology are also unclear. In the case of GSK3 target
genes, blocking Wnt-dependent protection from degradation
during mitosis has been shown to significantly reduce the cell
size of daughter cells (Acebron et al., 2014). Because the stabi-
lization of proteins we describe here affects a large fraction of
proteins, it may also contribute to maintaining protein levels
and thereby cell size in newly born cells.
The compensation of intercellular variability of degradation
rates by corresponding changes in synthesis rates suggests a
coupling between these two processes. Interestingly, mamma-
lian target of rapamycin complex 1 (mTORC1) activity was
shown to regulate both protein synthesis and degradation by
increasing the synthesis of both ribosomal and proteasomal
components and by facilitating the formation of the immunopro-
teasome (Yun et al., 2016; Zhang et al., 2014). Further studies
shall clarify whether intercellular variability in mTORC1 activity
underlies coordinated intercellular variability in protein synthesis
and degradation rates.
While gene expression levels displays large intercellular vari-
ability within isogenic and phenotypically homogeneous popula-
tions in a broad range of organisms (Kaern et al., 2005; Raj and
van Oudenaarden, 2008), the contribution of variability in protein
degradation rates remains largely uncharacterized. Here, we
found that these display up to 2- to 3-fold variability within ESC
and fibroblast cell populations and are at least partly due to het-
erogeneous expression levels of a rate-limiting component of the
proteasome. The heterogeneity in protein degradation rates we
describe acts as a global source of extrinsic noise that seemingly
bal Differences in Protein Degradation Rates in ESCs and NIH 3T3
e and images showing the fluorescence decay of the inducible Esrrb-SNAP/
ged inducible proteins and a Sox2-SNAP Oct4-Halo knockin (KI) cell line.
cible SNAP-tag fusion proteins in NIH 3T3 cells. n R 20 each.
proteins in NIH 3T3 cells. n R 20 each.

A
D
C
B
Figure 6. Variability in Proteasome Activity Contributes to Intercellular Heterogeneity in Protein Half-Lives
(A) Decay of fluorescence in the E14 Ube2s-SNAP cell line and an ADRM1 immunofluorescence (IF) image of the same x/y-coordinates. One representative cell is
highlighted to illustrate single-cell time-lapse monitoring followed by IF quantification of ADRM1. Scale bar, 30 mm.
(B) Correlations of single-cell protein half-lives and ADRM1 expression levels in the E14 Orc6-SNAP, Ube2s-SNAP, and Oct4-SNAP cell lines. n = 30.
(C) Correlations of single-cell protein half-lives and ADRM1 expression levels in the NIH 3T3 Orc6-SNAP, Ube2s-SNAP, and Oct4-SNAP cell lines. n = 30.
(D) Single-cell protein half-lives (dots), mean, and SD (black horizontal lines) of ORC6-SNAP and SOX2-SNAP upon 24 hr of ADRM1 overexpression (500 ng/mL
dox) as compared to data shown in Figure 4B. Representative immunofluorescence images of ADRM1 overexpression cells versus cells with endogenous
ADRM1 levels are shown. Scale bar, 30 mm.
See also Figure S5 and Table S3.
Please cite this article in press as: Alber et al., Single Live Cell Monitoring of Protein Turnover Reveals Intercellular Variability and Cell-Cycle Depen-dence of Degradation Rates, Molecular Cell (2018), https://doi.org/10.1016/j.molcel.2018.07.023
affects all targets of the ubiquitin proteasome system to a similar
extent. This contrasts with other sources of gene expression
noise such as transcription, which is largely gene-specific (Suter
et al., 2011). Whether protein degradation rate variability affects
proteome levels proportionally and thereby alters cell size or
growth shall be clarified by further studies.
Molecular Cell 71, 1–13, September 20, 2018 11
Please cite this article in press as: Alber et al., Single Live Cell Monitoring of Protein Turnover Reveals Intercellular Variability and Cell-Cycle Depen-dence of Degradation Rates, Molecular Cell (2018), https://doi.org/10.1016/j.molcel.2018.07.023
STAR+METHODS
Detailed methods are provided in the online version of this paper
and include the following:
d KEY RESOURCES TABLE
d CONTACT FOR REAGENT AND RESOURCE SHARING
d EXPERIMENTAL MODEL AND SUBJECT DETAILS
12
B Cell lines and culture
d METHOD DETAILS
B Plasmid construction
B Production of lentiviral vectors and generation of stable
cell lines
B Identification of insertion sites by 30 Rapid Amplifica-
tion of cDNA Ends
B Time-lapse fluorescence microscopy
B Image processing and analysis
B Immunofluorescence experiments
B Modeling the mammalian cell-optimized tandem fluo-
rescent timer (MCFT)
B Estimating the fluorescence correction factor a
B Estimating the sfGFP maturation time
B Estimating the mOrange2 maturation time
B Quantification of FRET effects in the MCFT
B Fitting the MCFT during interphase
B Validating synthesis and degradation retrieval during
interphase
B Fitting the MCFT around cell division
B Validating synthesis and degradation retrieval around
cell division
B Analysis of correlations in synthesis and degrada-
tion rates
d QUANTIFICATION AND STATISTICAL ANALYSIS
d DATA AND SOFTWARE AVAILABILITY
SUPPLEMENTAL INFORMATION
Supplemental Information includes six figures and three tables and can be
found with this article online at https://doi.org/10.1016/j.molcel.2018.07.023.
ACKNOWLEDGMENTS
We thank Cedric Deluz, Ricardo Camilo Moreira, and Nattapong Sanguankiat-
tichai for help with cell line generation; Aleksandra Mandic for help with image
analysis; Fabien Kuttler from the Swiss Federal Institute of Technology (EPFL)
Biomolecular Screening Facility (EPFL-BSF) and Luigi Bozzo and Jose Artacho
from the EPFL Bioimaging andOptics Core Facility (EPFL-BIOP) for assistance
in imaging; and Nicholas Phillips for reading and commenting on the manu-
script. Fluorescence-activated cell sorting was performed in the EPFL Flow
Cytometry Core Facility (EPFL-FCCF). This work was supported by aCanadian
Institute of Health Research (CIHR 358808 to E.R.P.) and SystemsX.ch transi-
tion postdoc fellowships (51FSP0163584 to E.R.P), the PierreMercier Founda-
tion (to D.M.S.), and the Teofilo Rossi di Montelera e di Premuda Foundation
and an anonymous donor, both advised by CARIGEST SA (to D.M.S).
AUTHOR CONTRIBUTIONS
Conceptualization, A.B.A. and D.M.S.; Methodology, A.B.A., D.M.S., E.R.P.,
and F.N.; Software, E.R.P.; Formal Analysis, A.B.A. and E.R.P.; Investigation,
A.B.A., E.R.P., and M.B.; Resources, D.M.S. and F.N., Writing – Original Draft,
A.B.A., E.R.P., and D.M.S.; Writing – Review & Editing, A.B.A., E.R.P., D.M.S.,
Molecular Cell 71, 1–13, September 20, 2018
and F.N.; Funding Acquisition, E.R.P., D.M.S., and F.N.; Supervision, D.M.S.
and F.N.
DECLARATION OF INTERESTS
The authors declare no competing interests.
Received: April 4, 2018
Revised: June 5, 2018
Accepted: July 20, 2018
Published: August 23, 2018
REFERENCES
Acebron, S.P., Karaulanov, E., Berger, B.S., Huang, Y.-L., and Niehrs, C.
(2014). Mitotic wnt signaling promotes protein stabilization and regulates cell
size. Mol. Cell 54, 663–674.
Alber, A.B., and Suter, D.M. (2018). Single-cell quantification of protein degra-
dation rates by time-lapse fluorescence microscopy in adherent cell culture.
J. Vis. Exp. (132) https://doi.org/10.3791/56604..
Aviner, R., Geiger, T., and Elroy-Stein, O. (2013). Novel proteomic approach
(PUNCH-P) reveals cell cycle-specific fluctuations in mRNA translation.
Genes Dev. 27, 1834–1844.
Balleza, E., Kim, J.M., and Cluzel, P. (2018). Systematic characterization of
maturation time of fluorescent proteins in living cells. Nat. Methods 15, 47–51.
Barry, J.D., Dona, E., Gilmour, D., and Huber, W. (2016). TimerQuant: a model-
ling approach to tandem fluorescent timer design and data interpretation for
measuring protein turnover in embryos. Development 143, 174–179.
Bieler, J., Cannavo, R., Gustafson, K., Gobet, C., Gatfield, D., and Naef, F.
(2014). Robust synchronization of coupled circadian and cell cycle oscillators
in single mammalian cells. Mol. Syst. Biol. 10, 739.
Bojkowska, K., Santoni de Sio, F., Barde, I., Offner, S., Verp, S., Heinis, C.,
Johnsson, K., and Trono, D. (2011). Measuring in vivo protein half-life.
Chem. Biol. 18, 805–815.
Chang, H.H., Hemberg, M., Barahona, M., Ingber, D.E., and Huang, S. (2008).
Transcriptome-wide noise controls lineage choice in mammalian progenitor
cells. Nature 453, 544–547.
Cohen, A.A., Geva-Zatorsky, N., Eden, E., Frenkel-Morgenstern, M., Issaeva,
I., Sigal, A., Milo, R., Cohen-Saidon, C., Liron, Y., Kam, Z., et al. (2008).
Dynamic proteomics of individual cancer cells in response to a drug.
Science 322, 1511–1516.
Cohen, A.A., Kalisky, T., Mayo, A., Geva-Zatorsky, N., Danon, T., Issaeva, I.,
Kopito, R.B., Perzov, N., Milo, R., Sigal, A., and Alon, U. (2009). Protein dy-
namics in individual human cells: experiment and theory. PLoS ONE 4, e4901.
Coldwell, M.J., Cowan, J.L., Vlasak, M., Mead, A., Willett, M., Perry, L.S., and
Morley, S.J. (2013). Phosphorylation of eIF4GII and 4E-BP1 in response to no-
codazole treatment: a reappraisal of translation initiation during mitosis. Cell
Cycle 12, 3615–3628.
Deluz, C., Friman, E.T., Strebinger, D., Benke, A., Raccaud, M., Callegari, A.,
Leleu, M., Manley, S., and Suter, D.M. (2016). A role for mitotic bookmarking
of SOX2 in pluripotency and differentiation. Genes Dev. 30, 2538–2550.
Harikumar, A., Edupuganti, R.R., Sorek, M., Azad, G.K., Markoulaki, S.,
Sehnalova, P., Legartova, S., Bartova, E., Farkash-Amar, S., Jaenisch, R.,
et al. (2017). An endogenously tagged fluorescent fusion protein library in
mouse embryonic stem cells. Stem Cell Reports 9, 1304–1314.
Huang, Z.-N., and Her, L.-S. (2017). The ubiquitin receptor ADRM1 modulates
HAP40-induced proteasome activity. Mol. Neurobiol. 54, 7382–7400.
Jarvik, J.W., Adler, S.A., Telmer, C.A., Subramaniam, V., and Lopez, A.J.
(1996). CD-tagging: a new approach to gene and protein discovery and
analysis. Biotechniques 20, 896–904.
Kaern, M., Elston, T.C., Blake, W.J., and Collins, J.J. (2005). Stochasticity in
gene expression: from theories to phenotypes. Nat. Rev. Genet. 6, 451–464.
Please cite this article in press as: Alber et al., Single Live Cell Monitoring of Protein Turnover Reveals Intercellular Variability and Cell-Cycle Depen-dence of Degradation Rates, Molecular Cell (2018), https://doi.org/10.1016/j.molcel.2018.07.023
Keppler, A., Gendreizig, S., Gronemeyer, T., Pick, H., Vogel, H., and Johnsson,
K. (2003). A general method for the covalent labeling of fusion proteins with
small molecules in vivo. Nat. Biotechnol. 21, 86–89.
Khmelinskii, A., Keller, P.J., Bartosik, A., Meurer, M., Barry, J.D., Mardin, B.R.,
Kaufmann, A., Trautmann, S., Wachsmuth, M., Pereira, G., et al. (2012).
Tandem fluorescent protein timers for in vivo analysis of protein dynamics.
Nat. Biotechnol. 30, 708–714.
Khmelinskii, A., Blaszczak, E., Pantazopoulou, M., Fischer, B., Omnus, D.J., Le
Dez, G., Brossard, A., Gunnarsson, A., Barry, J.D., Meurer, M., et al. (2014).
Protein quality control at the inner nuclear membrane. Nature 516, 410–413.
Khmelinskii, A., Meurer, M., Ho, C.-T., Besenbeck, B., F€uller, J., Lemberg,
M.K., Bukau, B., Mogk, A., and Knop, M. (2016). Incomplete proteasomal
degradation of green fluorescent proteins in the context of tandem fluorescent
protein timers. Mol. Biol. Cell 27, 360–370.
Kolb, V.A., Makeyev, E.V., and Spirin, A.S. (1994). Folding of firefly luciferase
during translation in a cell-free system. EMBO J. 13, 3631–3637.
Los, G.V., Encell, L.P., McDougall, M.G., Hartzell, D.D., Karassina, N.,
Zimprich, C., Wood, M.G., Learish, R., Ohana, R.F., Urh, M., et al. (2008).
HaloTag: a novel protein labeling technology for cell imaging and protein anal-
ysis. ACS Chem. Biol. 3, 373–382.
Molina, N., Suter, D.M., Cannavo, R., Zoller, B., Gotic, I., and Naef, F. (2013).
Stimulus-inducedmodulation of transcriptional bursting in a singlemammalian
gene. Proc. Natl. Acad. Sci. USA 110, 20563–20568.
Palozola, K.C., Donahue, G., Liu, H., Grant, G.R., Becker, J.S., Cote, A., Yu, H.,
Raj, A., and Zaret, K.S. (2017). Mitotic transcription and waves of gene reacti-
vation during mitotic exit. Science 358, 119–122.
Parsons, G.G., and Spencer, C.A. (1997). Mitotic repression of RNA polymer-
ase II transcription is accompanied by release of transcription elongation com-
plexes. Mol. Cell. Biol. 17, 5791–5802.
Raj, A., and van Oudenaarden, A. (2008). Nature, nurture, or chance: stochas-
tic gene expression and its consequences. Cell 135, 216–226.
Rogers, S., Wells, R., and Rechsteiner, M. (1986). Amino acid sequences com-
mon to rapidly degraded proteins: the PEST hypothesis. Science 234,
364–368.
Schindelin, J., Arganda-Carreras, I., Frise, E., Kaynig, V., Longair, M., Pietzsch,
T., Preibisch, S., Rueden, C., Saalfeld, S., Schmid, B., et al. (2012). Fiji: an
open-source platform for biological-image analysis. Nat. Methods 9, 676–682.
Shaik, S., Fukushima, H., Wang, Z., andWei, W. (2012). Protein Degradation in
Cell Cycle. In eLS (John Wiley & Sons). https://doi.org/10.1002/
9780470015902.a0023158.
Shaner, N.C., Lin, M.Z., McKeown, M.R., Steinbach, P.A., Hazelwood, K.L.,
Davidson, M.W., and Tsien, R.Y. (2008). Improving the photostability of bright
monomeric orange and red fluorescent proteins. Nat. Methods 5, 545–551.
Sigal, A., Danon, T., Cohen, A., Milo, R., Geva-Zatorsky, N., Lustig, G., Liron,
Y., Alon, U., and Perzov, N. (2007). Generation of a fluorescently labeled
endogenous protein library in living human cells. Nat. Protoc. 2, 1515–1527.
Strebinger, D., Friman, E.T., Deluz, C., Govindan, S., Alber, A.B., and Suter,
D.M. (2018). Endogenous fluctuations of OCT4 and SOX2 bias pluripotent
cell fate decisions. bioRxiv. https://doi.org/10.1101/299073.
Stumpf, C.R., Moreno, M.V., Olshen, A.B., Taylor, B.S., and Ruggero, D.
(2013). The translational landscape of the mammalian cell cycle. Mol. Cell
52, 574–582.
Suter, D.M., Cartier, L., Bettiol, E., Tirefort, D., Jaconi, M.E., Dubois-Dauphin,
M., and Krause, K.-H. (2006). Rapid generation of stable transgenic embryonic
stem cell lines using modular lentivectors. Stem Cells 24, 615–623.
Suter, D.M., Molina, N., Gatfield, D., Schneider, K., Schibler, U., and Naef, F.
(2011). Mammalian genes are transcribed with widely different bursting ki-
netics. Science 332, 472–474.
Taelman, V.F., Dobrowolski, R., Plouhinec, J.-L., Fuentealba, L.C., Vorwald,
P.P., Gumper, I., Sabatini, D.D., and De Robertis, E.M. (2010). Wnt signaling
requires sequestration of glycogen synthase kinase 3 inside multivesicular en-
dosomes. Cell 143, 1136–1148.
Tanenbaum, M.E., Stern-Ginossar, N., Weissman, J.S., and Vale, R.D. (2015).
Regulation of mRNA translation during mitosis. eLife 4, e07957.
Yeku, O., and Frohman, M.A. (2011). Rapid amplification of cDNA ends
(RACE). Methods Mol. Biol. 703, 107–122.
Yun, Y.S., Kim, K.H., Tschida, B., Sachs, Z., Noble-Orcutt, K.E., Moriarity,
B.S., Ai, T., Ding, R., Williams, J., Chen, L., et al. (2016). mTORC1 coordinates
protein synthesis and immunoproteasome formation via PRAS40 to prevent
accumulation of protein stress. Mol. Cell 61, 625–639.
Zhang, Y., Nicholatos, J., Dreier, J.R., Ricoult, S.J.H., Widenmaier, S.B.,
Hotamisligil, G.S., Kwiatkowski, D.J., and Manning, B.D. (2014).
Coordinated regulation of protein synthesis and degradation by mTORC1.
Nature 513, 440–443.
Molecular Cell 71, 1–13, September 20, 2018 13
Please cite this article in press as: Alber et al., Single Live Cell Monitoring of Protein Turnover Reveals Intercellular Variability and Cell-Cycle Depen-dence of Degradation Rates, Molecular Cell (2018), https://doi.org/10.1016/j.molcel.2018.07.023
STAR+METHODS
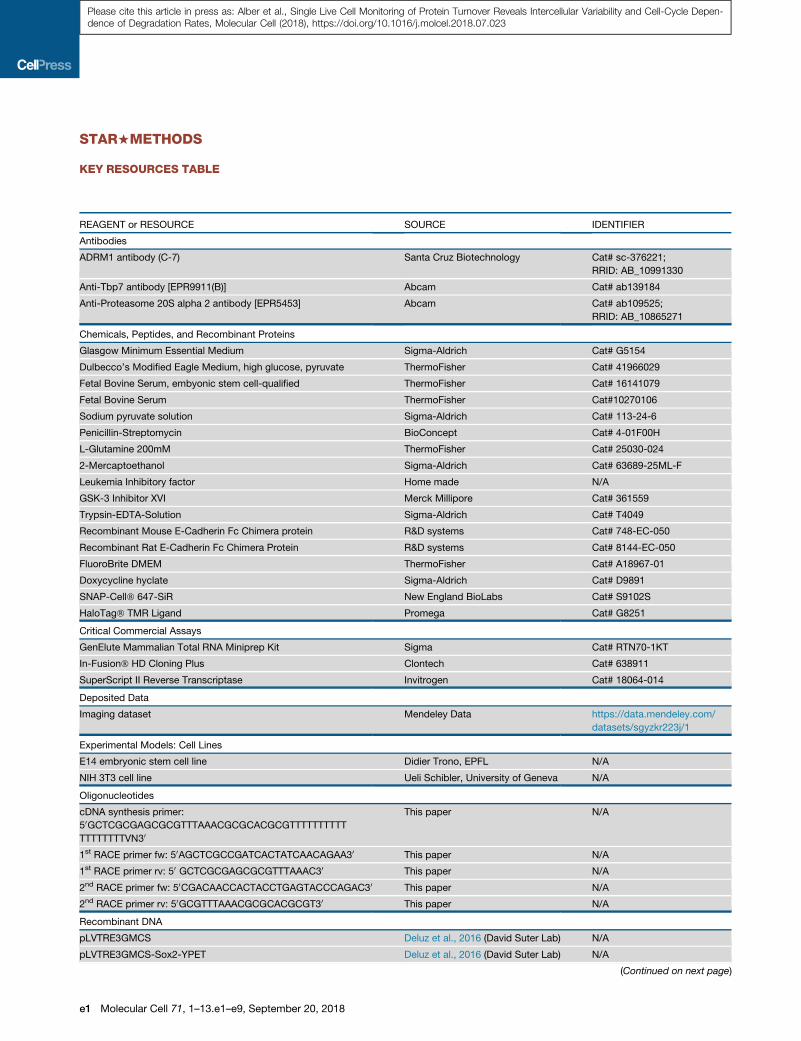
KEY RESOURCES TABLE
REAGENT or RESOURCE SOURCE IDENTIFIER
Antibodies
ADRM1 antibody (C-7) Santa Cruz Biotechnology Cat# sc-376221;
RRID: AB_10991330
Anti-Tbp7 antibody [EPR9911(B)] Abcam Cat# ab139184
Anti-Proteasome 20S alpha 2 antibody [EPR5453] Abcam Cat# ab109525;
RRID: AB_10865271
Chemicals, Peptides, and Recombinant Proteins
Glasgow Minimum Essential Medium Sigma-Aldrich Cat# G5154
Dulbecco’s Modified Eagle Medium, high glucose, pyruvate ThermoFisher Cat# 41966029
Fetal Bovine Serum, embyonic stem cell-qualified ThermoFisher Cat# 16141079
Fetal Bovine Serum ThermoFisher Cat#10270106
Sodium pyruvate solution Sigma-Aldrich Cat# 113-24-6
Penicillin-Streptomycin BioConcept Cat# 4-01F00H
L-Glutamine 200mM ThermoFisher Cat# 25030-024
2-Mercaptoethanol Sigma-Aldrich Cat# 63689-25ML-F
Leukemia Inhibitory factor Home made N/A
GSK-3 Inhibitor XVI Merck Millipore Cat# 361559
Trypsin-EDTA-Solution Sigma-Aldrich Cat# T4049
Recombinant Mouse E-Cadherin Fc Chimera protein R&D systems Cat# 748-EC-050
Recombinant Rat E-Cadherin Fc Chimera Protein R&D systems Cat# 8144-EC-050
FluoroBrite DMEM ThermoFisher Cat# A18967-01
Doxycycline hyclate Sigma-Aldrich Cat# D9891
SNAP-Cell� 647-SiR New England BioLabs Cat# S9102S
HaloTag� TMR Ligand Promega Cat# G8251
Critical Commercial Assays
GenElute Mammalian Total RNA Miniprep Kit Sigma Cat# RTN70-1KT
In-Fusion� HD Cloning Plus Clontech Cat# 638911
SuperScript II Reverse Transcriptase Invitrogen Cat# 18064-014
Deposited Data
Imaging dataset Mendeley Data https://data.mendeley.com/
datasets/sgyzkr223j/1
Experimental Models: Cell Lines
E14 embryonic stem cell line Didier Trono, EPFL N/A
NIH 3T3 cell line Ueli Schibler, University of Geneva N/A
Oligonucleotides
cDNA synthesis primer:
50GCTCGCGAGCGCGTTTAAACGCGCACGCGTTTTTTTTTT
TTTTTTTTVN30
This paper N/A
1st RACE primer fw: 50AGCTCGCCGATCACTATCAACAGAA30 This paper N/A
1st RACE primer rv: 50 GCTCGCGAGCGCGTTTAAAC30 This paper N/A
2nd RACE primer fw: 50CGACAACCACTACCTGAGTACCCAGAC30 This paper N/A
2nd RACE primer rv: 50GCGTTTAAACGCGCACGCGT30 This paper N/A
Recombinant DNA
pLVTRE3GMCS Deluz et al., 2016 (David Suter Lab) N/A
pLVTRE3GMCS-Sox2-YPET Deluz et al., 2016 (David Suter Lab) N/A
(Continued on next page)
e1 Molecular Cell 71, 1–13.e1–e9, September 20, 2018
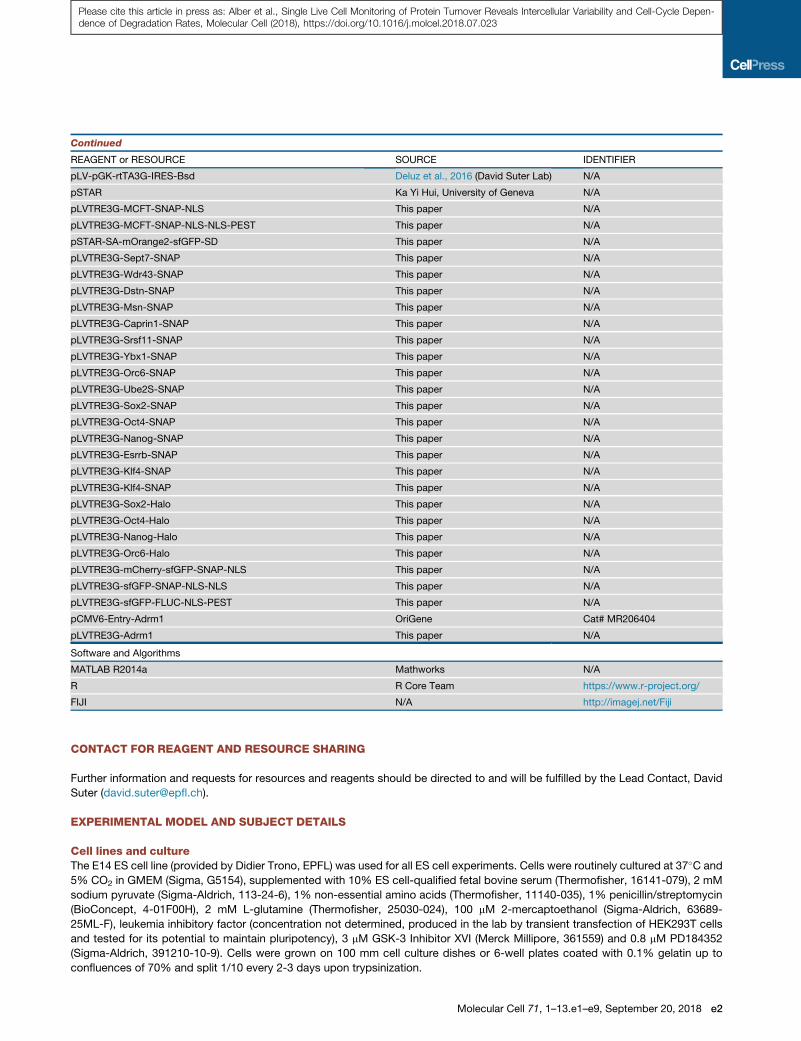
Continued
REAGENT or RESOURCE SOURCE IDENTIFIER
pLV-pGK-rtTA3G-IRES-Bsd Deluz et al., 2016 (David Suter Lab) N/A
pSTAR Ka Yi Hui, University of Geneva N/A
pLVTRE3G-MCFT-SNAP-NLS This paper N/A
pLVTRE3G-MCFT-SNAP-NLS-NLS-PEST This paper N/A
pSTAR-SA-mOrange2-sfGFP-SD This paper N/A
pLVTRE3G-Sept7-SNAP This paper N/A
pLVTRE3G-Wdr43-SNAP This paper N/A
pLVTRE3G-Dstn-SNAP This paper N/A
pLVTRE3G-Msn-SNAP This paper N/A
pLVTRE3G-Caprin1-SNAP This paper N/A
pLVTRE3G-Srsf11-SNAP This paper N/A
pLVTRE3G-Ybx1-SNAP This paper N/A
pLVTRE3G-Orc6-SNAP This paper N/A
pLVTRE3G-Ube2S-SNAP This paper N/A
pLVTRE3G-Sox2-SNAP This paper N/A
pLVTRE3G-Oct4-SNAP This paper N/A
pLVTRE3G-Nanog-SNAP This paper N/A
pLVTRE3G-Esrrb-SNAP This paper N/A
pLVTRE3G-Klf4-SNAP This paper N/A
pLVTRE3G-Klf4-SNAP This paper N/A
pLVTRE3G-Sox2-Halo This paper N/A
pLVTRE3G-Oct4-Halo This paper N/A
pLVTRE3G-Nanog-Halo This paper N/A
pLVTRE3G-Orc6-Halo This paper N/A
pLVTRE3G-mCherry-sfGFP-SNAP-NLS This paper N/A
pLVTRE3G-sfGFP-SNAP-NLS-NLS This paper N/A
pLVTRE3G-sfGFP-FLUC-NLS-PEST This paper N/A
pCMV6-Entry-Adrm1 OriGene Cat# MR206404
pLVTRE3G-Adrm1 This paper N/A
Software and Algorithms
MATLAB R2014a Mathworks N/A
R R Core Team https://www.r-project.org/
FIJI N/A http://imagej.net/Fiji
Please cite this article in press as: Alber et al., Single Live Cell Monitoring of Protein Turnover Reveals Intercellular Variability and Cell-Cycle Depen-dence of Degradation Rates, Molecular Cell (2018), https://doi.org/10.1016/j.molcel.2018.07.023
CONTACT FOR REAGENT AND RESOURCE SHARING
Further information and requests for resources and reagents should be directed to and will be fulfilled by the Lead Contact, David
Suter ([email protected]).
EXPERIMENTAL MODEL AND SUBJECT DETAILS
Cell lines and cultureThe E14 ES cell line (provided by Didier Trono, EPFL) was used for all ES cell experiments. Cells were routinely cultured at 37�C and
5% CO2 in GMEM (Sigma, G5154), supplemented with 10% ES cell-qualified fetal bovine serum (Thermofisher, 16141-079), 2 mM
sodium pyruvate (Sigma-Aldrich, 113-24-6), 1% non-essential amino acids (Thermofisher, 11140-035), 1% penicillin/streptomycin
(BioConcept, 4-01F00H), 2 mM L-glutamine (Thermofisher, 25030-024), 100 mM 2-mercaptoethanol (Sigma-Aldrich, 63689-
25ML-F), leukemia inhibitory factor (concentration not determined, produced in the lab by transient transfection of HEK293T cells
and tested for its potential to maintain pluripotency), 3 mM GSK-3 Inhibitor XVI (Merck Millipore, 361559) and 0.8 mM PD184352
(Sigma-Aldrich, 391210-10-9). Cells were grown on 100 mm cell culture dishes or 6-well plates coated with 0.1% gelatin up to
confluences of 70% and split 1/10 every 2-3 days upon trypsinization.
Molecular Cell 71, 1–13.e1–e9, September 20, 2018 e2
Please cite this article in press as: Alber et al., Single Live Cell Monitoring of Protein Turnover Reveals Intercellular Variability and Cell-Cycle Depen-dence of Degradation Rates, Molecular Cell (2018), https://doi.org/10.1016/j.molcel.2018.07.023
NIH 3T3 cells (provided by Ueli Schibler, University of Geneva) and HEK293T cells (ATCC) were routinely cultured at 37�C and
5% CO2 in DMEM (Thermofisher; 41966029), supplemented with 10% fetal bovine serum (Thermofisher, 10270106) and 1%
penicillin/streptomycin (BioConcept, 4-01F00H). Cells were grown in 100 mm cell culture dishes or 6-well plates up to a confluence
of 70% and split 1/6 every 2-3 days.
METHOD DETAILS
Plasmid constructionThe inducible MCFT-SNAP and MCFT-SNAP-PEST constructs were generated using the pLVTRE3GMCS lentiviral vector (Deluz
et al., 2016) as follows: First, the mOrange2-AgeI-sfGFP sequence was PCR-amplified using primers with overhangs encoding
SalI and EcoRV restriction sites and ligated into the pLVTRE3GMCS vector. To generate a short-lived inducibleMCFT, the NLS-PEST
sequence was PCR amplified from the pSTAR vector (gift from Ka Yi Hui, University of Geneva) with overhangs containing a 50 and a
30 homology arm and inserted into the inducible mOrange2-sfGFP vector by infusion cloning (Clontech) upon EcoRV digestion of the
vector. Finally, the SNAP-tag sequence was PCR-amplified using overhangs encoding 50 and 30 homology arms and an NLS
sequence on the 30 end and inserted into the short-lived and long-lived MCFT vectors by infusion cloning upon digest of the vectors
with EcoRV. This led to the generation of the final pLVTRE3G-mOrange2-sfGFP-SNAP-NLS-NLS-PEST (further referred to as
inducible MCFT-SNAP-PEST) and pLVTRE3G-mOrange2-sfGFP-SNAP-NLS (further referred to as inducible MCFT-SNAP) vectors.
For the generation of the endogenous CD-tagged MCFT clones, a pSTAR-SA-mOrange2-sfGFP-SD vector was produced. First,
the mOrange2-AgeI-sfGFP sequence was PCR-amplified using overhangs containing the sequences for a splice acceptor (SA) and a
splice donor (SD) as well as restriction sites for ClaI and NheI. The PCR product was then digested with ClaI and NheI and ligated into
the pSTAR vector (gift from Ka Yi Hui, University of Geneva).
For the generation of the inducible SNAP-tagged candidate cell lines, the SNAP-tag sequence was PCR-amplified from the
inducible MCFT-SNAP vector with suitable restriction site overhangs. The inducible Sox2-SNAP cell line was generated
from the pLVTRE3G-Sox2-YPet (Deluz et al., 2016) by replacing the YPet sequence with the SNAP-tag sequence. For the
remaining SNAP-tag fusion cell lines, the coding sequences of both the housekeeping proteins and transcription factors were
PCR-amplified from E14 wild-type cDNA upon mRNA extraction and cDNA synthesis, using primers with suitable restriction
site overhangs. The coding sequences and SNAP-tag sequence were ligated into the pLVTRE3GMCS vector to generate the
following constructs:
d pLVTRE3G-MluI-Sept7-SpeI-SNAP-AscI
d pLVTRE3G-SalI-Wdr43-SpeI-SNAP-AscI
d pLVTRE3G-SalI-Dstn-SpeI-SNAP-AscI
d pLVTRE3G-SalI-Msn-AscI-SNAP-EcoRV
d pLVTRE3G-SalI-Caprin1-AscI-SNAP-EcoRV
d pLVTRE3G-SalI-Srsf11-AscI-SNAP-EcoRV
d pLVTRE3G-SalI-Ybx1-AscI-SNAP-EcoRV
d pLVTRE3G-SalI-Orc6-AscI-SNAP-EcoRV
d pLVTRE3G-SalI-Ube2s-AscI-SNAP-EcoRV
d pLVTRE3G-SalI-Sox2-AscI-SNAP-EcoRV
d pLVTRE3G-SalI-Oct4-AscI-SNAP-EcoRV
d pLVTRE3G-SalI-Nanog-AscI-SNAP-EcoRV
d pLVTRE3G-SalI-Esrrb-AscI-SNAP-EcoRV
d pLVTRE3G-SalI-Klf4-AscI-SNAP-EcoRV
To generate the inducible Sox2-, Oct4-, Nanog-, and Orc6-Halo cell lines, the pLVTRE3G-Sox2-SNAP, pLVTRE3G-Oct4-SNAP,
pLVTRE3G-Nanog-SNAP and pLVTRE3G-Orc6-SNAP vectors were digested with AscI and EcoRV to replace the SNAP-tag
sequence by the Halo-tag sequence previously PCR amplified with the corresponding restriction site overhangs. This led to the
generation of the following constructs:
d pLVTRE3G-SalI-Sox2-AscI-Halo-EcoRV
d pLVTRE3G-SalI-Oct4-AscI-Halo-EcoRV
d pLVTRE3G-SalI-Nanog-AscI-Halo-EcoRV
d pLVTRE3G-SalI-Orc6-AscI-Halo-EcoRV
For the FRET experiments, an inducible nuclear sfGFP and an inducible mCherry-sfGFP timer were generated. For the inducible
nuclear sfGFP, the sfGFP sequence was amplified with SalI and AscI restriction site overhangs and the SNAP-NLS-NLS was
amplified from the MCFT-SNAP-PEST using primers containing AscI and EcoRV restriction site overhangs. The pLVTRE3G-Sox2-
SNAP vector was then digested with SalI and EcoRV to remove the Sox2-SNAP sequence and the sfGFP and SNAP-NLS-NLS
e3 Molecular Cell 71, 1–13.e1–e9, September 20, 2018
Please cite this article in press as: Alber et al., Single Live Cell Monitoring of Protein Turnover Reveals Intercellular Variability and Cell-Cycle Depen-dence of Degradation Rates, Molecular Cell (2018), https://doi.org/10.1016/j.molcel.2018.07.023
were ligated into the digested vector. For the mCherry-sfGFP timer, the mCherry sequence was PCR-amplified with restriction site
overhangs for SalI and AscI and the sfGFP sequencewas amplifiedwith restriction site overhangs for AscI and EcoRV. Subsequently,
the inducible long-lived MCFT (pLVTRE3G-mOrange2-sfGFP-SNAP-NLS) was digested with SalI and EcoRV and mCherry and
sfGFP sequences were ligated into the vector, which led to the generation of a pLVTRE3G-mCherry-sfGFP-SNAP-NLS vector.
For the inducible sfGFP-FLuc-NLS-PEST cell line, the sfGFP sequence was PCR-amplified with restriction site overhangs for SalI
and XbaI and the FLuc-NLS-PEST sequence was PCR-amplified with restriction site overhangs for XbaI and AscI. The two fragments
were subsequently ligated into the pLVTRE3GMCS vector.
To generate a pLVTRE3G-Adrm1 overexpression construct, the Adrm1 sequence was PCR amplified from the pCMV6-Entry-
Adrm1 plasmid (OriGene, MR206404) with restriction site overhangs for SalI and AscI and ligated into the pLVTRE3G vector.
Production of lentiviral vectors and generation of stable cell linesHEK293T cells were seeded at a density of 45,000 cells/cm2 and transfected using calcium phosphate one day after seeding. Cells
were co-transfected with PAX2 (envelope), MD2G (packaging), and the lentiviral construct of interest and concentrated 120-fold by
ultracentrifugation as described previously (Suter et al., 2006). Target E14 or 3T3 cells were seeded at a density of 13,000/cm2 in a
24-well plate and transduced with 50 mL of concentrated lentivirus. For all dox-inducible cell lines, cells were first transduced with the
pLV-pGK-rtTA3G-IRES-Bsd construct (Deluz et al., 2016), selected using 8 mg/ml Blasticidin (Thermofisher, A11139-03), transduced
with the pLVTRE3G-construct of interest, and selected with puromycin (Thermofisher, A11138-03) at 2 mg/ml. For the dual
SNAP/Halo-tag cell lines, cells were first transduced with the rtTA3G-IRES-Bsd and the pLVTRE3G-SNAP constructs of interest,
and selected for 10 days. Subsequently, cells were transduced with the pLVTRE3G-Halo construct of interest, labeled
with 100 nM TMR Halo ligand (Promega, G8251) and sorted for Halo-positive cells by fluorescence activated cell sorting (FACS)
4 – 6 days after transduction. 100,000 to 200,000 cells per cell line were sorted and outgrown in 100 mm cell culture dishes as
polyclonal cell lines. Similarly, the inducible Adrm1/Sox2-SNAP and Adrm1/Orc6-SNAP cell lines were generated by first transducing
cells with the rtTA3G-IRES-Bsd and pLVTRE3G-Adrm1 constructs and selecting with Blasticidin and Puromycin for 10 days.
Subsequently, cells were transduced with the pLVTRE3G-Sox2-SNAP or the pLVTRE3G-Orc6-SNAP construct and sorted for
SNAP-positive cells upon pulse-labeling with 12 nM of SNAP-Cell� 647-SiR dye (NEB, S9102S) by fluorescence activated cell sort-
ing (FACS) 4 days after transduction.
For the generation of the CD-tagged endogenous protein library, 1.5 3 106 cells were plated per 100 mm cell culture dishes and
transduced with 6.67 mL of concentrated pSTAR-SA-mOrange2-sfGFP-SD virus. The medium was replaced one day after transduc-
tion and cells were sorted by FACS three days after transduction. 0.05%of cells were found to beGFP-positive and the 0.01%of cells
displaying the brightest GFP signal were sorted into 96-well plates as single cells and outgrown as monoclonal cell lines. In total, a
library of 40 cell lines, each expressing a different protein tagged with the MCFT was generated. Of note, incomplete degradation of
sfGFP in tandem fluorescent timers has been observed previously and could perturb the interpretation of fluorescence imaging
(Khmelinskii et al., 2016). However, we would expect this to lead to a mismatch of the subcellular localization of the fluorescent
signals of sfGFP and mOrange2 in a substantial number of tagged proteins, since protein localization signals are typically located
within a single stretch of amino acids. We did not observe such mismatches for any of 40 our clones, suggesting the MCFT is not
affected by incomplete degradation.
Identification of insertion sites by 30 Rapid Amplification of cDNA EndsTagged protein identification was performed by 30 Rapid Amplification of cDNA Ends (30RACE) as described previously (Sigal et al.,
2007). Briefly, cells were grown up to confluences of 70% in 6-well plates and total RNA was extracted using an RNA miniprep kit
(Sigma, RTN70-1KT). Subsequently, cDNA was synthesized using the superscript II reverse transcriptase (Invitrogen, 18064-014)
with the following primer:
50GCTCGCGAGCGCGTTTAAACGCGCACGCGTTTTTTTTTTTTTTTTTTVN30
Two nested PCR reactions were then performed using the following primers:
1st PCR:
Forward (within sfGFP sequence): 50AGCTCGCCGATCACTATCAACAGAA30
Reverse (within 30 adaptor sequence): 50 GCTCGCGAGCGCGTTTAAAC30
2nd PCR:
Forward (within sfGFP sequence): 50CGACAACCACTACCTGAGTACCCAGAC30
Reverse (within 30 adaptor sequence): 50GCGTTTAAACGCGCACGCGT30
PCR products were purified after the 1st PCR reaction and run on an agarose gel after the 2nd PCR reaction. Bands were cut, gel-
extracted, and sent for Sanger sequencing. In case of multiple bands, indicating multiple splice variants, all bands were cut and sent
for sequencing separately.
Molecular Cell 71, 1–13.e1–e9, September 20, 2018 e4
Please cite this article in press as: Alber et al., Single Live Cell Monitoring of Protein Turnover Reveals Intercellular Variability and Cell-Cycle Depen-dence of Degradation Rates, Molecular Cell (2018), https://doi.org/10.1016/j.molcel.2018.07.023
Time-lapse fluorescence microscopyFluorescence time-lapse imaging experiments were performed as previously described (Alber and Suter, 2018). Briefly, cells were
seeded on 96-well plates coated with 5 ng/mL recombinant mouse or rat E-cadherin Fc chimera protein (E-cad-Fc, R&D systems,
748-EC-050 or 8144-EC-050) at densities of 30 000 cells/cm2.
For imaging of the CD-tagged protein library, the culture medium was replaced by FluoroBrite DMEM (Thermofisher, A18967-01),
supplemented with 10% ES cell-qualified fetal bovine serum, 2 mM sodium pyruvate, 1% non-essential amino acids, 1% penicillin/
streptomycin, 2mML-glutamine, 100 mM2-mercaptoethanol, LIF, 3 mMCHIR99021 and 0.8 mMPD184352 24 h after cell seeding and
cells were imaged using an InCell Analyzer 2200 (GE Healthcare Life Sciences) for 24-30 h with time intervals of 15 min (Objective:
20x, Laser power: 10%, Exposure: 300 ms for FITC, 500 ms for Cy3, live cell imaging settings: 5% CO2 and 37�C).For imaging of the dox-inducible SNAP-tag and SNAP/Halo-tag cell lines, 500 ng/ml doxycycline was added 7 h before imaging for
the SNAP-tagged pluripotency transcription factors, and 24 h before imaging for the SNAP-tagged housekeeping proteins and the
dual SNAP/Halo-tagged cell lines. 2 h before starting the time-lapse experiment, cells were pulse-labeled with 12 nM of SNAP-Cell�647-SiR dye (NEB, S9102S) and 100 nM of Halo-Tag� TMR dye (Promega, G8251) and washed repeatedly, as described in (Alber
and Suter, 2018). For pulse-labeling of the Sox2-SNAP/Oct4-Halo knockin cell line, concentrations of 12 nM of SNAP-Cell� 647-SiR
dye and 5 nM of Halo-Tag� TMR dye were used. Subsequently, imaging medium was added (FluoroBrite DMEM supplemented as
described above for ES cells, FluoroBrite DMEM supplemented with FBS and penicillin/streptomycin for 3T3 cells) and cells were
imaged using an InCell Analyzer 2200 (GE Healthcare Life Sciences) for 12 - 20 h at time intervals for 15 min (Objective: 20x, Laser
power: 10%, Exposure: 100 - 300 ms for Cy5, 50 - 100 ms for Cy3, live cell imaging settings: 5% CO2 and 37�C).
Image processing and analysisImage processing
The acquired time-lapse fluorescence movies were collected as stacks in tiff format and further processed using the Fiji software
(Schindelin et al., 2012). The background was subtracted from all the images in the stack using the Fiji background subtraction
algorithm (rolling ball radius = 50 pixels).
Automated cell tracking and image quantification for full cell cycle analysis
For the analysis of the full cell cycle traces of the CD-tagged nuclear proteins (Figure 2), a semi-automated image analysis pipeline
was used to quantify the integrated fluorescence intensities over the whole cell cycle (Bieler et al., 2014).
Manual cell tracking and image quantification from 5h before to 5h after cytokinesis
For the analysis of the synthesis and degradation rates before, during and after division (Figure 3), dividing cells were selected and
manually quantified from 20 time frames (5 h) before to 20 time frames (5 h) after division. To do so, a circle or polygon was drawn
around the cell of interest for each time frame, its area and mean intensity were measured and its integrated intensity was calculated
over the course of the movie for both fluorescence channels:
Icell = Meancell�AreaCell
Subsequently, the local background was estimated by drawing a circle close to the cell of interest (but excluding any cellular signal)
for each time frame and the integrated background intensity of the cell was estimated:
IBG =MeanBG�AreaCell
Finally, the background-subtracted intensity over time was calculated for each single cell:
ICell�BG = ICell--IBG
Note that we summed up the intensities of both daughter cells in order to determine changes of synthesis and degradation before and
after division for the same number of gene copies (2 tagged alleles).
Estimation of protein degradation rates using the SNAP-tag
Degradation rates during division were measured using the SNAP-tag fluorescence decay movies of 7 inducible SNAP-tagged
proteins of interest. Dividing cells were selected manually and integrated fluorescence intensities were analyzed from 5 h before
to 5 h after division as described previously for the MCFT-tagged proteins. The integrated fluorescence intensities at the time-point
of division (first time frame at which the daughter cells were separated) were set as time t = 0 and normalized to 1. The cell averaged
fluorescence decay was calculated to determine transient changes in degradation during division.
Single cell protein half-lives of the SNAP/Halo-tagged proteins (Figures 4–6) were calculated as described previously (Alber and
Suter, 2018). Briefly, integrated fluorescence intensities were measured over 50 time frames (12.5 h), summing up the intensities
of the daughter cells in case of cell divisions. Analyzed cells were picked randomly, such that divisions took place at different
time-points for all individual traces. Next, fluorescence intensity traces were normalized to the intensity of the first frame and a curve
fitting was performed in MATLAB, using the following equation:
FðtÞ= e�bt
e5 Molecular Cell 71, 1–13.e1–e9, September 20, 2018
Please cite this article in press as: Alber et al., Single Live Cell Monitoring of Protein Turnover Reveals Intercellular Variability and Cell-Cycle Depen-dence of Degradation Rates, Molecular Cell (2018), https://doi.org/10.1016/j.molcel.2018.07.023
Where F(t) is the fluorescence intensity over time and b is the decay rate. The single cell half-lives were then calculated as follows:
T1=2 = lnð2Þ=b
Immunofluorescence experimentsTo correlate protein degradation rates and expression levels of proteasome components in single cells, protein half-lives were calcu-
lated by monitoring the fluorescence decay of the SNAP-tagged protein of interest as described above. After time-lapse imaging,
cells were immediately fixed in PBS + 2% paraformaldehyde for 30 min, permeabilized in 0.5% Triton for 30 min and blocked in
PBS + 5% FBS for 30 min. Cells were incubated overnight with the primary antibody, diluted in PBS + 5% FBS. The primary antibody
used and their concentrations were as following: anti ADRM1 antibody 1/200 (1 mg/ml) (sc-376221, Santa Cruz Biotechnology), anti
Tbp7 antibody 1/100 (ab139184, abcam), anti Proteasome 20S alpha 2 1/100 (ab109525, abcam). Next, cells were washed 2x in
PBS and incubated with a fluorescently-labeled secondary antibody (1/1000) in PBS + 5% FBS for 1 h. Cells were then washed
with 3x with PBS-Tween 0.1% and incubated with 1 mg/ml DAPI. Finally, cells were washed 3x with PBS-Tween 0.1% and left in
PBS. Fixed and stained cells were re-imaged, using the same xy-coordinates as for the fluorescence decay imaging. Cells for which
the SNAP fluorescence decay had been acquired previously were re-identified in the immunofluorescence images and the integrated
fluorescence intensity of the antibody was quantified as described previously. In case of divisions, the average integrated intensity of
both daughter cells was calculated.
Modeling the mammalian cell-optimized tandem fluorescent timer (MCFT)The mathematical model used to infer the synthesis and degradation rates from the fluorescence traces obtained from the MCFT
relies on the differential maturation dynamics of the sfGFP and mOrange2 proteins. To model the maturation dynamics of the
MCFT, we assumed as previously (Barry et al., 2016; Khmelinskii et al., 2012) that the two fluorophores present on the same
polypeptide mature independently at rate mG and mR (Figure 1B). Thus, we can model the dynamics of the mature green and red
proteins using the four variables defined in Figure 1C as follows:
_BG = s� ðmG + kÞBG
_G=mGBG � kG_BR = s� ðmR + kÞBR_R=mRBR � kR
(1)
Here, BG stands for the pool of proteins with an immature (black) sfGFP, which is synthesized at a rate s. The immature sfGFP then
matures into the green (G) fluorescent form. A corresponding set of equations describes the mOrange2 fluorophore, i.e., the
immature form of the mOrange2 (BR) is converted to a mature form (R) at a maturation ratemR. Note that in this formulation, the syn-
thesis s commonly acts on both BG and BR, and the degradation rate k does not depend on the maturation state of the fluorophores.
The total level of the protein T is given by T = BG + G = BR + R.
Estimating the fluorescence correction factor aTo later compare the measured fluorescence levels with the model predictions, an empirically determined scale factor a (applied to
mOrange2) is needed to compensate for the different optical properties of the two fluorescent proteins and the imaging settings of the
two channels.
To estimate a, we used a condition where the levels of matured sfGFP and mOrange2 proteins are very similar. In order to achieve
this, we used a doxycycline (dox)-inducible construct expressing a long-lived version of the MCFT that we induced for 24 h before
stopping the induction. In this condition the measured green to red fluorescence ratio G/R is expected to converge to a, as demon-
strated in a simulation (Figures S6A and S6B). Guided by this simulation we decided to quantify a 55 h after stopping the induction
since the level of both the sfGFP and mOrange2 were still detectable and the G/R ratio reached a stable value of a (Figure S6B).
We estimated the G/R ratio from 30 different individual cells taken from three different fields of view using a standardized set of
imaging parameters and on the same microscope that was used throughout the entire study. We also validated that the amount
of dox, and consequently the intensity level of the MCFT, did not have any impact on the estimated a (Figure S6C). We see that
the estimatedG/R ratio (i.e., a) is tightly centered on 0.6, meaning that in our system, the sfGFP protein has an intensity corresponding
to 60% of the mOrange2 protein. Consequently, for all the modeling performed in this study, we used a value of a = 0.6.
Estimating the sfGFP maturation timeTo validate the short maturation kinetics of sfGFP, we took advantage of the SNAP-tag (Figure S1D), which is not dependent on
fluorophore maturation, and we also generated a cell line allowing dox-inducible expression of the fast-folding Firefly luciferase
(Fluc) fused to sfGFP (Kolb et al., 1994; Molina et al., 2013). We seeded sfGFP-Fluc and MCFT-SNAP-PEST cells on E-cadherin
and induced with 500 ng/ml doxycycline shortly before onset of imaging. sfGFP-Fluc cells were imaged with a luminescence
microscope (LV200, Olympus) and a fluorescence microscope (Cell Xcellence, Zeiss). MCFT-SNAP-PEST cells were incubated
with 24 nM of SiR-647 SNAP dye that was left in the medium, and imaged with a fluorescence microscope (Cell Xcellence, Zeiss).
We analyzed integrated luminescence and fluorescence traces from the time frame at which a signal appeared (2.5 h after addition
Molecular Cell 71, 1–13.e1–e9, September 20, 2018 e6
Please cite this article in press as: Alber et al., Single Live Cell Monitoring of Protein Turnover Reveals Intercellular Variability and Cell-Cycle Depen-dence of Degradation Rates, Molecular Cell (2018), https://doi.org/10.1016/j.molcel.2018.07.023
of dox) and compared the rate of green fluorescence increase upon dox induction to i) the rate of luminescence increase in the induc-
ible sfGFP-Fluc cell line, and ii) the rate of SNAP SiR647 signal increase in the MCFT-SNAP-PEST cell line. The green fluorescence
increase was indistinguishable from the increase in Fluc signal or SNAP fluorescence (Figure S6D). This suggests that the sfGFP
maturation rate lies within the same range as the folding times of the SNAP-tag and firefly luciferase, in line with the measured sfGFP
maturation half-time of 5 – 14 min (Balleza et al., 2018; Khmelinskii et al., 2012).
Estimating the mOrange2 maturation timeTomodel theMCFT using the set of differential equations (ref. Equation 1), we also needed to estimate themOrange2maturation time
(mR). To achieve this, we compared the half-life estimations made with the MCFT to an independent approach using the SNAP-tag
approach described (Figure S1D).
Using the half-life estimations obtained for seven proteins (CAPRIN1, DESTRIN/DSTN, MSN, SEPTIN7, SRSF11, WDR43, and
YBX1, see Figure 4B) with the SNAP-tag approach as our gold-standard, we determined mR that would give half-life estimates
that closelymatch the values retrieved from our gold standard. For this we used theMCFT data acquired around division for the seven
proteins (Figure 3) in combination with our fitting approach around cell division (see section below) to estimate the half-life before (bD)
and after division (aD).
We reasoned that the optimalmRwould lead to a slope as close as possible to 1when comparing the half-lives of the gold-standard
with the ones retrieved from the MCFT. To find the optimal mR, we tested maturation half-time values from 1 h to 18.5 h with 0.5 h
increment. For every mR, we obtained half-lives for all seven proteins from our MCFT that we compared to those obtained from the
SNAP-tag using a linear relationship with no intercept. From this analysis we found that the optimal mR, i.e., the one yielding a dis-
tribution of slopes centered on one, corresponds to a maturation half-time of 8.5 h (Figure S6E).
Quantification of FRET effects in the MCFTWe quantified putative FRET effects between the sfGFP and mOrange2 by fluorescence lifetime imaging (FLIM), using an SP8 FLIM
microscope (Leica). We compared the fluorescence lifetime of sfGFP in a cell line expressing nuclear sfGFP alone (inducible sfGFP-
SNAP-NLS) to its lifetime in the two inducible timer cell linesMCFT-SNAP andMCFT-SNAP-PEST (Figure 1), and in one additional cell
line from our endogenous MCFT-tagged protein library (Snrnp200). sfGFP fluorescence lifetime was quantified and averaged for
three cells per cell line, with 1000 – 2500 kiloCounts being acquired per cell. We found that the FRET effect between sfGFP
and mOrange2 is negligible (average FRET for the three cell lines tested = 1.25%) (MCFT-SNAP-PEST = �0.26%, MCFT-
SNAP = �0.79%, and Snrnp200-MCFT = 4.8%). As a control we used an inducible mCherry-sfGFP timer, for which we found a
FRET of 15.5%, in line with the previously reported value of 17.3% (Khmelinskii et al., 2012).
Fitting the MCFT during interphaseWe modeled the MCFT to fit the red and green intensities during interphase (Figure 2) using the set of equations described in
Equation 1, but with time-dependent rates s(t) and k(t):
_BG = sðtÞ � ðmG + kðtÞÞBG
_G=mGBG � kðtÞG_BR = sðtÞ � ðmR + kðtÞÞBR_R=mRBR � kðtÞR
(2)
We opted to use a linear functions for s(t) and k(t) to keep the number of parameters low in ourmodel.We therefore used two synthesis
rates (sG1 and sG2) and two degradation rates (kG1 and kG2), the first at the beginning (G1) and the second at the end (G2) of the cell
cycle (Figure S6H):
sðtÞ= sG1 +
�sG2 � sG1
l
�t
kðtÞ= kG1 +
�kG2 � kG1
l
�t
(3)
where l corresponds to the cell cycle duration (in hours) and is specific to each cell trace.
The full set of parameters Q = {T0, BG0, BR0, sG1, sG2, kG1, kG2} now also includes the three initial conditions BG0 = BG(0),
BR0 = BR(0) and T0 = T(0) (T = BG+G = BR+R is the total protein abundance) in addition to the two synthesis and degradation rates.
We then maximized the likelihood of the observed green (Go) and red (Ro) signals given the parametersQ (Equation 4), using the pre-
viously determined value of a = 0.6, as well as the green and redmaturation ratesmG andmR (corresponding tomaturation half-times
of 5 min for sfGFP and 8.5 h for mOrange2). For every new set of parametersQ, we simulated green (Gs) and red (Rs) signals from the
second time frame after cell division (i = 1) to one hour before cell division (i = n).
e7 Molecular Cell 71, 1–13.e1–e9, September 20, 2018
Please cite this article in press as: Alber et al., Single Live Cell Monitoring of Protein Turnover Reveals Intercellular Variability and Cell-Cycle Depen-dence of Degradation Rates, Molecular Cell (2018), https://doi.org/10.1016/j.molcel.2018.07.023
Exploratory analysis showed that a multiplicative noise model is suitable, which led us to use the following likelihood function:
bQ = argmaxQ log pðGo;RojQÞ
pðGo;RojQÞ=Yni =1
f
�Goi �Gsi
Gsi
�Yni = 1
f
�a�1Roi � Rsi
Rsi
�
fðxÞ= 1
sffiffiffiffiffiffi2p
p e�x2
2s2
(4)
with s = 0.1. Goi, Gsi, Roi, Rsi stands for green (G) and red (R) traces, observed (o) or simulated (s) at time point i.
We applied this optimization procedure to all individual traces of all 6 nuclear MCFT-tagged proteins. In Figure S6H we show the
best fit of one individual trace. We used the optim function in R with the box constraints approach (L-BFGS-B) for optimizing all pa-
rameters (Q). Standard errors of the optimal Q parameters were obtained by inverting the negative Hessian matrix.
Validating synthesis and degradation retrieval during interphaseTo test the analysis during interphase, we simulated traces to mimic the real traces obtained using the MCFT. To evaluate howmuch
noise should be added to our simulated traces, we used the traces obtained around division from all 40 proteins and estimated rela-
tive noise as follows: (Goi - ~Gi)/ ~Gi and (Goi - ~Ri)/ ~RI, where ~Gi and ~Ri were obtained from smoothing Goi and Roi (using the standard
lowess function in R, Figure S6F). These relative noise levels were found to be fairly homogeneous across all the proteins
(Figure S6G).
Simulating realistic traces during interphase required four rates (sG1, sG2, kG1, and kG2) in addition to the timer parameters (Fig-
ure S6H). We used parameter values retrieved around division (Figure 3). G2 parameters were estimated before division (bD), while
G1 for parameters estimated after division (aD) for the individual cells. An example of the simulated traces obtained from the gene
GRB2 are shown in Figure S6I. To evaluate if our approach could retrieve the simulation parameters we calculated the relative error
between the simulated and retrieved parameters (Figure S6J). Overall, for most parameters and over all 40 realistic simulations
obtained from our 40 genes (i.e., 20 simulated traces from 40 genes), the relative error corresponded to 5% (0.05) of the simulated
parameters (Figure S6K).
Fitting the MCFT around cell divisionWhen studying protein dynamics around cell division with the MCFT, we faced challenges, notably since mitosis is short (�1 h) rela-
tive to the remaining of the cell cycle, and also because cells detach during this period, introducing artifacts in the recorded fluores-
cence signals. Thus, we could not directly rely on the signal during division to infer protein dynamics, but used the flanking signals (not
influenced by detachment) to constrain the dynamics during division (schematized in Figure S6L). To keep the model parsimonious
we modeled the entire signal around division using piecewise constant degradation and synthesis rates, i.e., one (s, k) pair for every
interval (before division (bD), during division (D), after division (aD)). Thus, s(t) and k(t) are given by:
sðtÞ=8<:
sbD if t < � 45minsD if � 45 % t < 45min
saDif t R 45min
kðtÞ=8<:
kbD if t < � 45minkD if � 45% t < 45min
kaDif t R 45 min
(5)
The full set of parametersQ = {T0, BG0, BR0, sbD, sD, saD, kbD, kD, kaD} now also includes the three initial conditionsBG0 = BG(0), BR0 =
BR(0) and T0 = T(0) (T = BG+G = BR+R is the total protein abundance) corresponding to the levels at the beginning of the bD
interval. Also, in G1 we summed the signals of the two daughters cells to study the dynamic of the labeled protein pool per fixed num-
ber (two) of tagged alleles. We then maximized the likelihood of the green (Go) and red (Ro) observed signals given the parametersQ
(Equation 4) (Figure S6L).
Validating synthesis and degradation retrieval around cell divisionFor validation, we simulated individual traces using parameters sbD, sD, saD, kbD, kD, and kbD (see Figures S6L and S6M) and evaluated
how precisely our approach is able to retrieve those parameters. We simulated green and red traces using a realistic set of hetero-
geneous parameters (i.e., different sets of synthesis and degradation rates) to mimic cell traces around division. For this we used the
median of the inferred parameters for the 40 genes in our library. We show an example of simulated traces using the median param-
eters for SF3B1 as well as the distributions of the retrieved parameters (Figures S6M and S6N). Overall, for most parameters and over
all 40 realistic simulations obtained from our 40 genes (i.e., 20 simulated traces from 40 genes), the relative error corresponded to 5%
(0.05) of the simulated parameters with a 5% increase for parameters inferred during division (Figure S6O).
Molecular Cell 71, 1–13.e1–e9, September 20, 2018 e8
Please cite this article in press as: Alber et al., Single Live Cell Monitoring of Protein Turnover Reveals Intercellular Variability and Cell-Cycle Depen-dence of Degradation Rates, Molecular Cell (2018), https://doi.org/10.1016/j.molcel.2018.07.023
Analysis of correlations in synthesis and degradation ratesTo assess the impact of correlations between the synthesis (s) and the degradation rates (k) on the mean expression level and the
coefficient of variation (standard deviation/mean) (Figures 4E, 4F, and S4D–S4F), we simulated traces using the MCFT model (Fig-
ure 1C). We simulated a first set of traces using the estimated degradation and synthesis rates in all individual traces, and a second
set of traces in which we broke the observed correlations by randomly shuffling the degradation and synthesis rates between the
cells. We used the simulated traces to estimate protein level (Figure S4E) and the coefficient of variation (Figures 4E, 4F, and S4F)
at 50% of the steady state (s/k).
QUANTIFICATION AND STATISTICAL ANALYSIS
Statistical analysis was performed using the R software. In Figures 3A, 3D, S3A, and S3B, we used a one-sided Wilcoxon test to
determine if the accumulation rates (slopes, Figure 3A) and levels (Figure 3D) and the integrated green fluorescence intensity
increased or decreased around division considering a Benjamini-Hochberg adjusted p < 0.05 to be significant. For the Pearson cor-
relations (Figures 4–6), the correlation (R), determination (R squared) and p values were determined (Table S3). p < 0.05 was consid-
ered statistically significant. For monitoring the changes in half-life upon ADRM1 overexpression (Figure 6D) a two-tailed Student’s
t test was performed and p values < 0.05 were considered significant.
DATA AND SOFTWARE AVAILABILITY
Original imaging data have been deposited to Mendeley Data and can be accessed using the following link: https://data.mendeley.
com/datasets/sgyzkr223j/1
e9 Molecular Cell 71, 1–13.e1–e9, September 20, 2018