Embed Size (px)
Citation preview
© 2013 S. Karger AG, Basel1420–8008/13/0362–0001$38.00/0
Original Research Article
Dement Geriatr Cogn Disord 2013;36:1–19
Single-Domain Amnestic Mild Cognitive Impairment Identified by Cluster Analysis Predicts Alzheimer’s Disease in the European Prospective DESCRIPA Study Marinella Damian a Lucrezia Hausner a Katrin Jekel a, b Melany Richter a Lutz Froelich a Ove Almkvist e Merce Boada i Roger Bullock j Peter Paul De Deyn n Giovanni B. Frisoni o Harald Hampel c, d Roy W. Jones k Patrick Kehoe l Hermine Lenoir q Lennart Minthon h Marcel G.M. Olde Rikkert t Guido Rodriguez p Philip Scheltens u Hilkka Soininen w Luiza Spiru x Jacques Touchon r Magda Tsolaki y Bruno Vellas s Frans R.J. Verhey v Bengt Winblad f Lars-Olof Wahlund g Gordon Wilcock m Pieter Jelle Visser u
a Department of Geriatric Psychiatry, Clinic of Psychiatry and Psychotherapy, Central Institute of Mental Health, Medical Faculty Mannheim/Heidelberg University, Mannheim , b Network Aging Research (NAR), Heidelberg University, Heidelberg, c Alzheimer Memorial Center, Department of Psychiatry, Ludwig-Maximilian University, Munich , and d Department of Psychiatry, Goethe University of Frankfurt, Frankfurt , Germany; e Department of Psychology, Stockholm University, f KI-Alzheimer Disease Research Center (KI-ADRC), Karolinska Institutet, and g Section for Clinical Geriatrics, NVS Department, Karolinska Institutet, Karolinska University Hospital, Stockholm , and h Clinical Memory Research Unit, Department of Clinical Sciences Malmö, Lund University, Malmö , Sweden; i Fundació ACE, Barcelona , Spain; j Kingshill Research Centre, Swindon , k The Research Institute for the Care of Older People (RICE), Bath , and l Dementia Research Group, John James Laboratories and m Department of Care of Elderly, Frenchay Hospital, University of Bristol, Bristol , UK; n Institute Born Bunge, Laboratory of Neurochemistry and Behavior, University of Antwerp and Memory Clinic ZNA, Antwerp , Belgium; o LENITEM, IRCCS Fatebenefratelli, Brescia , and p Clinical Neurophysiology Service Unit, Department of Endocrinological and Metabolic Sciences, University of Genoa, Genoa , Italy; q Department of Geriatrics, Hopital Broca, Paris , r Institute National de la Santé et de la Recherche Medicinale INSERM U 888, Montpellier , and s Department of Internal Medicine and Clinical Gerontology, Toulouse University Hospital, Toulouse , France; t Department of Geriatrics and Radboud Alzheimer Centre, Radboud University Medical Centre, Nijmegen , u Department of Neurology, Alzheimer Centre, VU Medical Centre, Amsterdam , and v Department of Psychiatry and Neuropsychology, Alzheimer Centre Limburg, Institute of Brain and Cognition, Maastricht University Medical Center (MUMC), Maastricht , The Netherlands; w Department of Neurology, University of Eastern Finland and Kuopio University Hospital, Kuopio , Finland; x Memory Clinic and Geriatric-Alzheimer Unit Clinical Department, ‘Carol Davila’ University of Medicine and Pharmacy, Bucharest , Romania; y Aristotle University of Thessaloniki Memory and Dementia Centre, 3rd Department of Neurology, G. Papanicolaore General Hospital, Thessaloniki , Greece
Accepted: January 8, 2013 Published online: May 3, 2013
Marinella Damian, PhD Zentralinstitut für Seelische Gesundheit J5, DE–68159 Mannheim (Germany) E-Mail marinella.damian @ zi-mannheim.de
www.karger.com/dem
DOI: 10.1159/000348354
Dow
nloa
ded
by:
UB
der
LM
U M
ünch
en
129.
187.
254.
47 -
10/
20/2
014
2:36
:49
PM
2Dement Geriatr Cogn Disord 2013;36:1–19
DOI: 10.1159/000348354
Damian et al.: Single-Domain Amnestic MCI Identified by Cluster Analysis Predicts AD in the European Prospective DESCRIPA Study
www.karger.com/dem© 2013 S. Karger AG, Basel
Key Words Mild cognitive impairment · Alzheimer’s disease · Mild cognitive impairment subtypes · Conversion to Alzheimer’s disease
Abstract Background/Aims: To identify prodromal Alzheimer’s disease (AD) subjects using a data-driven approach to determine cognitive profiles in mild cognitive impairment (MCI). Methods: A total of 881 MCI subjects were recruited from 20 memory clinics and followed for up to 5 years. Outcome measures included cognitive variables, conversion to AD, and biomarkers (e.g. CSF, and MRI markers). Two hierarchical cluster analyses (HCA) were performed to identify clusters of subjects with distinct cognitive profiles. The first HCA included all subjects with complete cognitive data, whereas the second one selected subjects with very mild MCI (MMSE ≥ 28). ANOVAs and ANCOVAs were computed to examine whether the clusters differed with regard to conversion to AD, and to AD-specific biomarkers. Results: The HCAs identified 4-cluster solutions that best reflected the sample structure. One cluster (aMCIsingle) had a significantly higher conversion rate (19%), compared to subjective cognitive impairment (SCI, p < 0.0001), and non-amnestic MCI (naMCI, p = 0.012). This cluster was the only one showing a significantly different biomarker profile (Aβ 42 , t-tau, APOE ε4, and medial temporal atrophy), compared to SCI or naMCI. Conclusion: In subjects with mild MCI, the single-domain amnes-tic MCI profile was associated with the highest risk of conversion, even if memory impairment did not necessarily cross specific cut-off points. A cognitive profile characterized by isolated memory deficits may be sufficient to warrant applying prevention strategies in MCI, whether or not memory performance lies below specific z-scores. This is supported by our preliminary biomarker analyses. However, further analyses with bigger samples are needed to corroborate these findings. Copyright © 2013 S. Karger AG, Basel
Introduction
Subjects with mild cognitive impairment (MCI) have an increased risk for Alzheimer’s disease (AD) [1] . Previous studies have shown that specific subtypes of MCI are more likely to progress to AD-type dementia. However, there is still disagreement concerning the conversion rates of these subtypes, which in turn leads to the question of whether it is justified to label one of these subtypes the prodromal stage of AD [2, 3] .
Previous approaches to define prodromal AD by specific cognitive subtypes had several problems. According to Petersen [4] , MCI can be differentiated into amnestic (aMCI) versus non-amnestic (naMCI) subtypes, which can further be divided into the subtypes ‘single domain’ and ‘multiple domains’, depending on which and how many cognitive domains are impaired [1, 4] . However, as neither specific tests nor specific cut-off scores are prescribed to define cognitive impairment, Petersen’s criteria are often operationalized in many different ways. In a Consensus Conference in Stockholm in 2003, these criteria were therefore revised by Winblad et al. [5] . The Stockholm MCI criteria standardized the definition of objective cognitive impairment by setting the cut-off point at –1.5 SD, minimizing the risk for false-positive diagnoses (in contrast to –1.0 SD). However, this cut-off point remains an arbitrary criterion. Defining MCI subtypes using pre-specified cut-offs leads to subtypes that are more theoretical entities than empirical groups with homogeneous cognitive profiles. Depending on the specific cut-off point, the distribution of the subjects across the subtypes can vary considerably [6, 7] . This is all the more evident when bearing in mind that often subjects fall into one subtype because they curtly ‘miss’ the alternative one. Hence, one cannot expect the
Dow
nloa
ded
by:
UB
der
LM
U M
ünch
en
129.
187.
254.
47 -
10/
20/2
014
2:36
:49
PM
3Dement Geriatr Cogn Disord 2013;36:1–19
DOI: 10.1159/000348354
Damian et al.: Single-Domain Amnestic MCI Identified by Cluster Analysis Predicts AD in the European Prospective DESCRIPA Study
www.karger.com/dem© 2013 S. Karger AG, Basel
resulting subtypes to be ‘real’ syndromes with a specific underlying pathology and, in turn, liability to progress to dementia, not to mention AD.
Visser and Verhey [8] examined 320 non-demented patients of a memory clinic and diag-nosed MCI according to 5 sets of MCI criteria: ageing-associated cognitive decline [9] , age-associated memory impairment [10] , aMCI [4] , and mild functional impairment [11] . After 5 years, 18% of the patients had progressed to AD, but the conversion rate strongly depended on the applied criteria and ranged from 20 (ageing-associated cognitive decline) to 38% (aMCI). The authors concluded that none of the present MCI concepts is fully predictive of AD conversion. Different biomarkers have been identified as useful in detecting prodromal AD, but they are still not universally available in routine clinical practice [12] . Hence, there is still a pressing need for further neuropsychological characterization of individuals with MCI who are most likely to convert to AD or other types of dementia [13] .
The present study intended to identify a data-driven typology of MCI subtypes using hier-archical cluster analysis (HCA) and to validate the empirical clusters longitudinally, based on their rates of conversion to AD and on the basis of AD-specific biomarkers, in order to identify one cluster that could be regarded as the pre-clinical stage of AD. Unlike defining MCI subtypes using pre-specified cut-offs, cluster analysis determines the grouping of MCI subjects on the basis of the data at hand. We started from the assumption that isolating maximally different neuropsychological clusters by HCA would help identify one cluster that, in combination with a higher rate of conversion to AD and an AD-specific biomarker profile, could be labelled as the prodromal AD profile.
Materials and Methods
Study Design, Setting and Participants The study was part of the DESCRIPA project, a 5-year multi-centre prospective cohort study conducted
within the network of the European Alzheimer’s Disease Consortium [14] . A cohort of 881 subjects with objective or subjective cognitive impairment (SCI, age ≥ 55) were assessed in 20 European memory clinics between March 2003 and March 2007. Subjects with subjective, but no objective cognitive impairment were included as MCI (not as healthy control subjects), as they have a higher risk of cognitive decline compared to subjects without subjective (and objective) impairment [15, 16] . Subjects with dementia or any somatic, metabolic, psychiatric or neurological disorder that may cause cognitive impairment were excluded. No healthy controls were included in the study. The study protocol was approved by the local Medical Ethics Committee of each centre. All participants and/or their authorized representatives gave their informed consent. For the following analyses, we selected only subjects with complete neuropsychological tests at baseline (see below) and at least 1 follow-up (n = 485).
Measurements Clinical Assessment All subjects underwent a standard battery of examinations, including clinical history, medical/neuro-
logical examinations, laboratory tests, MRI, neuropsychological examinations and clinical rating scales (CDR, neuropsychiatric scales, depression scales and ADL scales). Diagnoses were made on the basis of a clinical consensus. Both the clinical phenotype (syndrome) and the presumed aetiology were recorded. All subjects were invited for annual follow-up assessments for up to 5 years. Dementia was diagnosed according to DSM-IV [17] and AD according to NINCDS-ADRDA criteria [18] by the diagnostic team at each centre. Outcome measures included cognitive variables and progression to AD. Sixteen (80%) of the involved clinics also obtained biological data (CSF Aβ 42 , t-tau, p-tau, APOE ε4 genotype, medial temporal lobe atrophy, MTA, and/or white matter lesions, WML). Data were collected by investigators who were blinded to the results of the CSF and blood analyses, as well as to the imaging results. The study methods are described in detail in Visser et al. [14, 19] .
Dow
nloa
ded
by:
UB
der
LM
U M
ünch
en
129.
187.
254.
47 -
10/
20/2
014
2:36
:49
PM
4Dement Geriatr Cogn Disord 2013;36:1–19
DOI: 10.1159/000348354
Damian et al.: Single-Domain Amnestic MCI Identified by Cluster Analysis Predicts AD in the European Prospective DESCRIPA Study
www.karger.com/dem© 2013 S. Karger AG, Basel
Neuropsychological Examination Because the participation of the centres in the DESCRIPA study was intended not to interfere with their
routine practice, the neuropsychological tests used in this study varied among centres. However, all centres assessed the following cognitive domains: memory, language, executive function, attention and visuo-construction. For each cognitive domain, a primary test was selected at each centre that was the same as, or similar, to the tests that were used at the other centres [14] . The primary tests to assess memory were the learning and delayed recall measure of the Rey auditory verbal learning test [ 20 , 6 centres], and the word list of the Consortium to Establish a Registry for AD (CERAD) test battery [ 21 , 3 centres]. The primary test to assess language was the 1-min verbal fluency test for animals [ 22 , all centres]. The primary test to assess speed/attention and executive function was the trail-making test (TMT), parts A and B [ 23 , all centres]. The primary tests to assess visuo-construction were the copy subtest of the Rey-Osterrieth complex figure [ 24 , 7 centres], or the copy of the CERAD figures [ 21 , 2 centres]. If patients had missing data in these primary tests, alternative tests were used, which were selected beforehand for each primary test [14, 19] . All centres administered the MMSE [25] . Raw test scores were transformed to standardized scores wherein the age, education and gender of the subjects were taken into consideration. The standardization of the test scores was performed using normative data routinely used at each centre. In order to be able to merge the data from the different centres, further analyses were performed using z-scores. The relevant methods have been detailed elsewhere [14, 26–29] . For the analyses reported in this paper, the 6 ‘key’ cognitive scores were selected, as a relatively big portion of the sample (485 of the 881 subjects) had data in these variables. These variables were either single measures of a cognitive domain (e.g. the variable ‘tmt-a’ assessing speed and attention on the basis of the TMT-A score alone), or were composite variables containing information from tests selected as primary, or alternative tests (e.g. ‘learning’, assessing episodic memory on the basis of CERAD, ADAS-cog and word lists of other tests).
Cerebrospinal Fluid CSF was collected to measure Aβ 42 , t-tau and p-tau with single-parameter ELISA kits. The operators
analysing the CSF data were blinded to all clinical information. In order to provide reference data for the prevalence of a CSF AD profile, 93 healthy controls were selected from another study [19] . All CSF values were expressed as z-scores and corrected for age and gender if appropriate, based on the reference popu-lation of the healthy control subjects [14] . The z-scores of Aβ 42 , t-tau and p-tau were inverted such that for all measures a more negative z-score indicated a more severe reduction (as was expected for Aβ 42 ) and a more positive z-score indicated more elevated concentrations (as was expected for t- and p-tau). Of the 487 subjects included in this investigation, CSF data were available for 182 subjects from 8 study sites.
Genetics The APOE ε4 genotype was determined by PCR of genomic DNA, extracted from EDTA anti-coagulated
blood using the PCR technique [27] . Data for APOE ε4 were available for 546 subjects from 16 study sites.
Imaging In some of the centres, subjects underwent a neuroimaging examination, i.e. either CT or MRI, according
to the routine protocol of the specific centre. Although the scanners and protocols at different sites varied, the imaging data were collected and analysed centrally [27] . For the analyses presented here, 2 imaging vari-ables were selected: MTA and WML. Both were rated with qualitative rating scales [24, 25] , using a 5-point visual rating scale to assess MTA, and the Age-Related White Matter Changes Scale to assess WML. MTA and WML data were available from 10 sites for 370 and 372 subjects, respectively. Subjects with and without data for the neuropsychological or biomarker variables did not differ from each other with regard to age, gender and education. As the most important conclusions were those drawn from the analyses pertaining to the clusters, the only differences tested were those within each cluster.
Whereas the cluster analyses included 485 subjects with complete data sets in the cognitive variables used to build the clusters, only 114, 331 and 246 of the original 881 subjects had data in the CSF, APOE ε4 and imaging variables, respectively. The analyses reported here included different portions of the complete sample, as the sample size would have been reduced to only 71 subjects if only subjects with complete data sets in all of the above-mentioned variables had been selected.
Dow
nloa
ded
by:
UB
der
LM
U M
ünch
en
129.
187.
254.
47 -
10/
20/2
014
2:36
:49
PM
5Dement Geriatr Cogn Disord 2013;36:1–19
DOI: 10.1159/000348354
Damian et al.: Single-Domain Amnestic MCI Identified by Cluster Analysis Predicts AD in the European Prospective DESCRIPA Study
www.karger.com/dem© 2013 S. Karger AG, Basel
Statistical Procedures Hierarchical Cluster Analysis HCA was performed to investigate whether the heterogeneous MCI cohort could be differentiated into
more homogeneous subgroups. To sort the subjects into different clusters, the 6 neuropsychological vari-ables were entered into the analysis in order to build groups of subjects with possibly homogeneous but distinct cognitive profiles. The hierarchical method was chosen because – unlike partitioning methods – it does not start from a specific predefined grouping of the elements, but determines the grouping on the basis of the data at hand. The clustering of cognitively similar subjects into one group was reached using an agglom-erative algorithm, where the starting point was the finest partitioning of the elements: at the beginning of the clustering procedure each subject constituted its own cluster and subsequently the algorithm put those subjects and clusters together to which had the most similar cognitive profile, i.e. which minimized the distance or the heterogeneity measure.
Due to the metric level of the z-transformed neuropsychological scores, the distance measure ‘squared euclidean distance’ was chosen, as several linkage algorithms are based on this measure. The Ward method was used because other grouping methods have several drawbacks or are very difficult to understand. A simulation study by Bergs [30] showed that, compared to the other algorithms, Ward’s method offers good partitions, puts the elements in the ‘correct’ groups and signals the correct number of clusters. The Ward algorithm summarizes those elements or clusters which augment the heterogeneity measure (here the variance criterion) in a minimal degree, so that Ward’s method is also suitable to build maximally homoge-neous groups. To help determine the optimal number of clusters, the horizontal hierarchical tree plot was used to visualize the course of the used heterogeneity measure during the agglomeration process.
Two HCA were performed: the first HCA included all 485 subjects with complete cognitive data sets; the second HCA was run selecting subjects with baseline MMSE ≥ 28, i.e. with very mild MCI. We chose MMSE ≥ 28 because in subjects with ‘normal’ educational level (in general at least 8 years), and age ≥ 65, the corre-sponding z-scores are still in the normal range [31] . By this selection we could also rule out a possible confounding effect of the overall severity of cognitive impairment on cluster building.
Logistic Regression Analysis To investigate whether sub-classifying MCI subjects enhances the prediction of AD compared to the
plain use of cognitive test scores, logistic regression analyses (LRA) were computed, using the variable ‘conversion to AD’ as the binary dependent variable (converted vs. not converted at follow-up) and the cluster and cognitive variables as predictor (independent) variables. Different sets of predictors were included as independent variables in order to compare their suitability to predict conversion to AD.
Three sets of predictors were chosen. The first set contained the 6 aforementioned cognitive variables only. The second set included these cognitive variables plus the cluster variable cluster_485. This variable resulted from the cluster analysis that included all 485 subjects and contains information about the cluster membership of these subjects (e.g. if subject 1 has a ‘2’ in this variable, this means that this subject was clas-sified into cluster 2, whose label will be described in the results section). The third set of predictors included the cognitive variables, the cluster variable cluster_485, and the cluster variable cluster_313. The last-mentioned variable resulted from the cluster analysis that included only the 313 subjects with very mild MCI, i.e. MMSE ≥ 28. By including this variable as a predictor, the LRA automatically excluded all subjects with missing data in this variable. Hence, the results of the analyses run with the third set of predictors apply only to the 313 subjects with MMSE ≥ 28.
For each of the 3 sets of predictors, two stepwise (‘stepforward’) LRA were computed. In the first ones, all predictors were forced into the model in order to determine: (1) the predictive validity of the model including all available cognitive information and (2) the order from the best to the least predicting variable. To allow all available variables into the model, the inclusion p values were set at 1. In the second analyses, the inclusion p values were set at 0.05 so that each variable was expected to increment the prediction by a minimum degree in order to be included in the model. These second analyses were run in order to determine at which point the algorithm stops including further variables because they do not enhance the predictive accuracy, demonstrating which predictors are necessary and sufficient to predict AD. The second analyses are denoted with an inverted comma (e.g. model 1’, model 2’, etc.). In order to compare the predictive value of the different models, sensitivity, specificity, and positive and negative predictive values were computed. Because these predictive values are affected by the prevalence of the disease at hand, the (positive and negative) likelihood ratios were also reported.
Dow
nloa
ded
by:
UB
der
LM
U M
ünch
en
129.
187.
254.
47 -
10/
20/2
014
2:36
:49
PM
6Dement Geriatr Cogn Disord 2013;36:1–19
DOI: 10.1159/000348354
Damian et al.: Single-Domain Amnestic MCI Identified by Cluster Analysis Predicts AD in the European Prospective DESCRIPA Study
www.karger.com/dem© 2013 S. Karger AG, Basel
To validate the MCI clusters identified by the HCAs, ANOVAs and ANCOVAs were computed in order to examine whether the clusters differed from each other in their biomarker profiles. The analyses were computed using the biomarkers as dependent variables, and the variable ‘MCI clusters’ as the independent variable. Because the biomarkers MTA and WML were age dependent, ANCOVAs were computed including age as a covariate.
To examine demographic, clinical and neuropsychological differences between the clusters, genders or other groups, additional analyses were conducted: To test for differences between two independent groups, we performed Student’s t tests (for continuous variables). In cases where the variances differed between the compared groups, the corrected t and d.f. values are reported. Paired-sample t tests were conducted to compare the means of 2 variables in one sample. ANOVAs were performed to test for differences between more than two groups. In case of significant group differences, the ANOVAs were followed by Games-Howell post hoc analyses, as this type of post hoc test takes into account small and/or unequal sample sizes. When post hoc tests indicated significant differences between 2 clusters, or 2 cluster pairs only, the reports were limited to the (significant) p values. Differences between the distributions of categorical, non-dichotomous variables were tested with Pearson’s χ 2 tests. For dichotomous variables, Fisher’s exact tests were computed (here, only p values are reported). To test correlations between nominal variables, the phi coefficient and odds ratio (OR) were computed. For ordinal variables, or when dichotomous or ordinal variables were corre-lated with metric variables, Kendall’s tau-b was used. When multiple hypotheses were tested on a set of data, the Bonferroni correction was used to avoid cumulating α-errors: when n hypotheses were tested, each indi-vidual hypothesis was tested at a statistical significance level of 0.05/n or 0.01/n. All tests were two-sided. All analyses were performed using the Statistical Package for the Social Sciences (SPSS 19 and IBM SPSS 20).
Results
Descriptives As only subjects with complete neuropsychological tests at baseline and at least 1 follow-
up (n = 485) were included in the analyses, 396 subjects had to be excluded. The baseline characteristics of the included (n = 485) and excluded (n = 396) subjects are shown in table 1 .
The included subjects were comparable to the excluded subjects in terms of gender (p = 0.631) and rate of conversion to AD (p = 0.149). However, they differed significantly in terms of age [t(878) = 4.125, p < 0.0001], baseline MMSE [t(703) = –5.589, p < 0.0001], and education [t(879) = 2.509, p = 0.012]. Both age and education were higher in the excluded subjects (age = 71.5 years, education = 10.7 years) compared with the included subjects (age = 69.3 years, education = 10.0 years), whereas baseline MMSE was lower in the former (27.0) than in the latter (27.8). Hence, the included subjects were less cognitively impaired (MMSE) and younger, but less educated than the excluded subjects.
Whereas the mean time to AD and the rate of conversion to AD did not differ significantly between the two groups [t(157) = –0.208, p = 0.835 and p = 0.149, respectively], mean follow-up time differed significantly between the included and the excluded subjects [t(370) = 8.359, p < 0.0001].
Demographic Variables and Conversion to AD Of the 485 subjects considered in the first HCA, 91 (18.8%) had developed AD at one of the
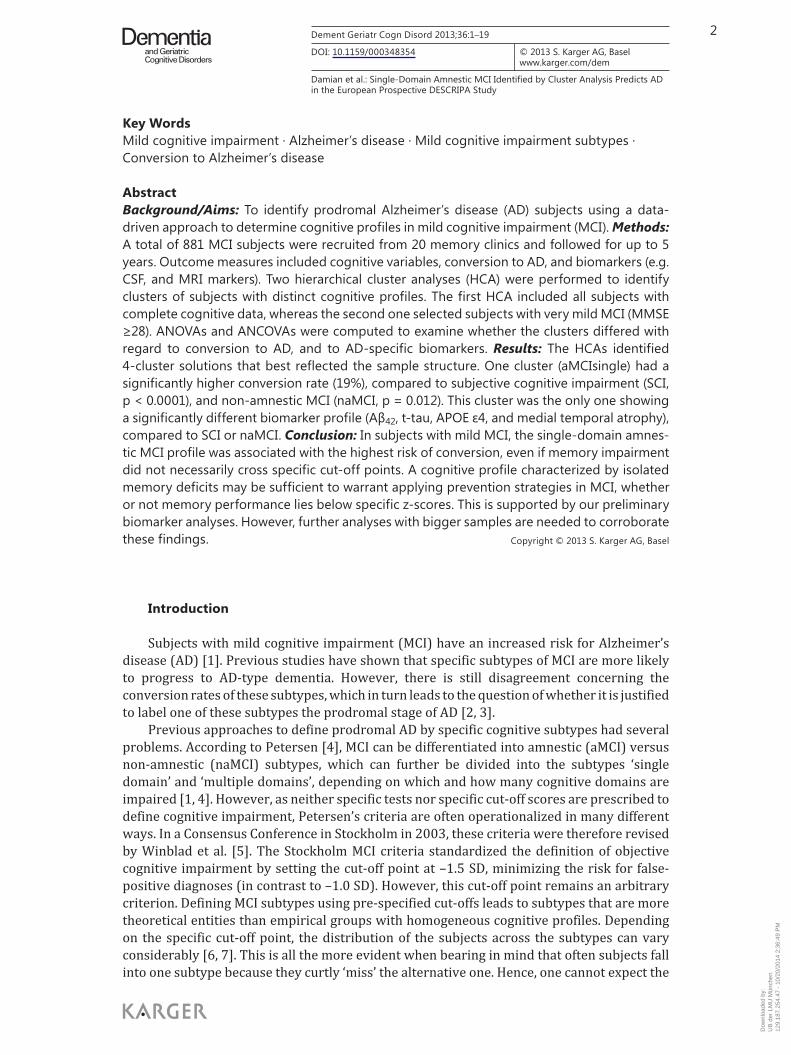
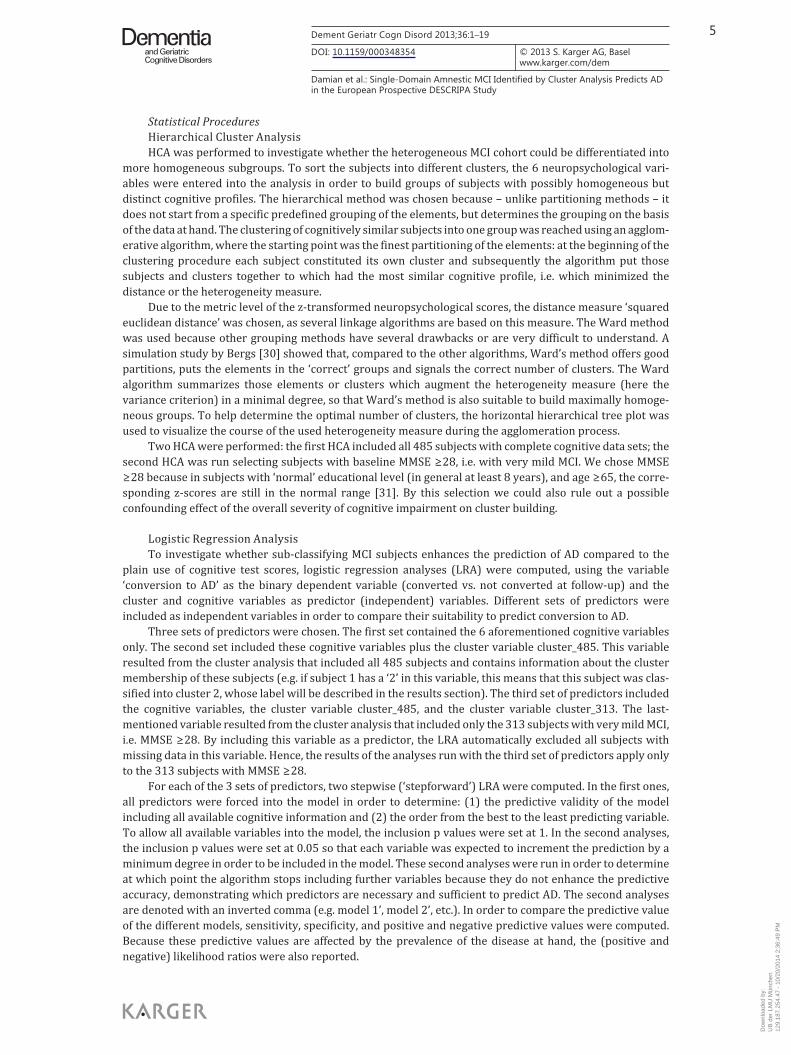
follow-up visits. The risk of conversion to AD increased with age [r(485) = 0.203, p < 0.0001] but was not associated with gender [phi(485) = 0.058, p = 0.205; OR(485) = 1.353, 95% CI = 0.847–2.163] or education [r(485) = –0.022, p = 0.563]. Figure 1 shows the cognitive profiles of the ‘converters’ and the ‘non-converters’. The x-axis depicts the cognitive variables (sepa-rately for converters and non-converters) and the y-axis shows the mean values of their z-scores.
At baseline, converters (mean MMSE = 26.4, SD = 2.39) and non-converters (meanMMSE = 28.1, SD = 1.56) differed from each other not only in the magnitude of the cognitive deficits [t(107) = 6.738, p < 0.0001] but also in the pattern of relative strengths and weak-
Dow
nloa
ded
by:
UB
der
LM
U M
ünch
en
129.
187.
254.
47 -
10/
20/2
014
2:36
:49
PM
7Dement Geriatr Cogn Disord 2013;36:1–19
DOI: 10.1159/000348354
Damian et al.: Single-Domain Amnestic MCI Identified by Cluster Analysis Predicts AD in the European Prospective DESCRIPA Study
www.karger.com/dem© 2013 S. Karger AG, Basel
Table 1. Baseline characteristics and status at follow-up
Included subjects (n = 485) Excluded subjects (n = 396)
Immediate recall z-scores –0.76 1.20 4851 –1.09 1.18 3431
Delayed recall –0.85 1.32 4851 –1.34 1.29 2981
Verbal fluency –0.69 0.95 4851 –1.04 1.05 3511
Constructional praxis 0.05 1.16 4851 0.12 1.14 2771
TMT-A –0.74 1.61 4851 –0.61 1.76 2711
TMT-B –0.92 1.91 4851 –1.03 2.08 2571
MMSE 27.8 1.87 4821 27.0 2.48 3871
Age, years 69.35 7.60 4851 71.5 7.94 3951
Female, n, % 275 56.7 4851 231 58.3 3951
Education, years 10.04 4.17 4851 10.7 4.27 3961
Status at follow-up, n % not demented 394 81.2 223 85.1AD 91 18.8 4851 59 14.9 3961
Follow-up time, years 2.79 0.81 3941 2.10 1.06 2231
Time to AD, years 1.80 0.94 941 1.83 1.02 651
Data are expressed as mean and SD unless otherwise specified. For the cognitive variables, z-scores are listed, indicating the number of SDs from the average of a healthy control population. 1 Number of subjects without missing data in the respective variable.
0.5
0
–0.5
–1.0
–1.5
–2.0
–2.5
–3.0
–3.5
–4.0Non-converters Converters
z-sc
ores
Immediate recall (verbal)
Delayed recall (verbal)
Verbal fluency
Constructional praxis
TMT-A
TMT-B
Fig. 1. Cognitive profiles of ‘converters’ vs. ‘non-converters’. The z-scores on the y-axis indicate the cognitive performance of subjects who remained non-demented vs. those who converted to AD at follow-up. Usually, z-scores ≤ –1.5 or ≤ –1.0 are used to define impaired test performance.
Dow
nloa
ded
by:
UB
der
LM
U M
ünch
en
129.
187.
254.
47 -
10/
20/2
014
2:36
:49
PM
8Dement Geriatr Cogn Disord 2013;36:1–19
DOI: 10.1159/000348354
Damian et al.: Single-Domain Amnestic MCI Identified by Cluster Analysis Predicts AD in the European Prospective DESCRIPA Study
www.karger.com/dem© 2013 S. Karger AG, Basel
nesses. Both groups performed relatively well in constructional praxis. However, only converters were significantly more impaired in delayed versus immediate recall [t(90) = 4.920, p < 0.0001] and in TMT-B versus TMT-A [t(90) = 2.996, p < 0.004], a pattern of impairment typical for demented subjects.
Differentiating MCI Clusters The horizontal hierarchical tree plot showed that the value of the heterogeneity measure
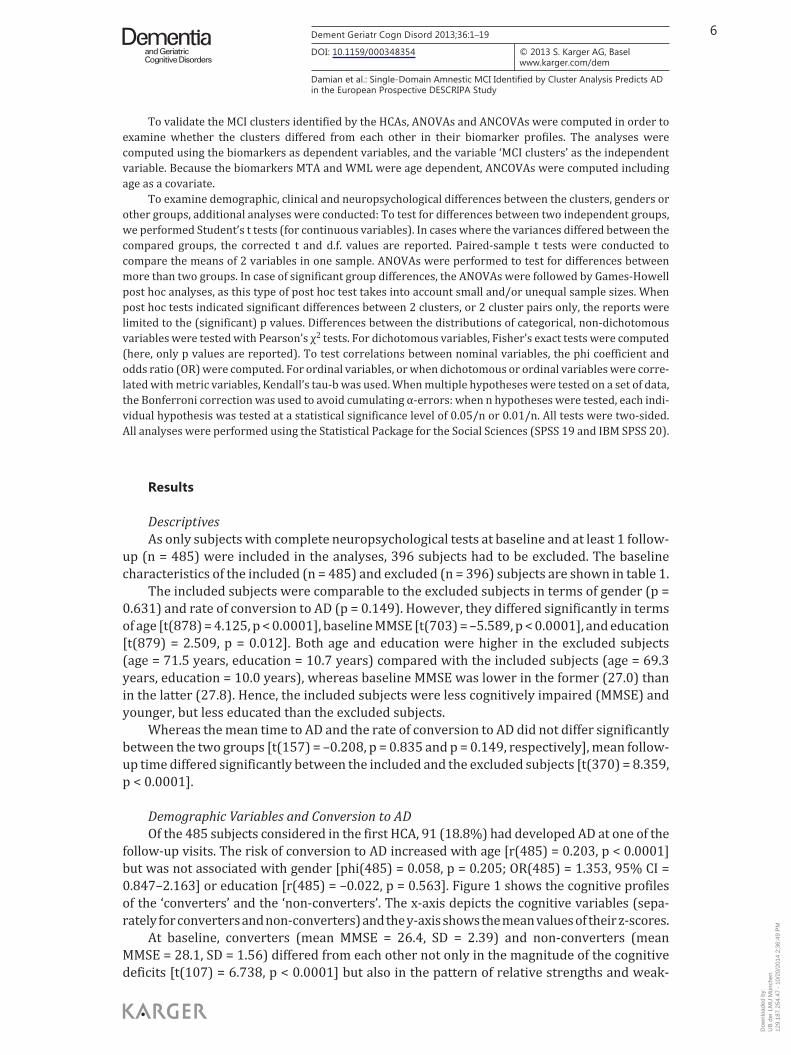
escalated after building 4 clusters. Thus, a 4-cluster solution was regarded as the best choice. The HCA sorted the 485 subjects into the following 4 clusters: 224 (46.2%) were clas-
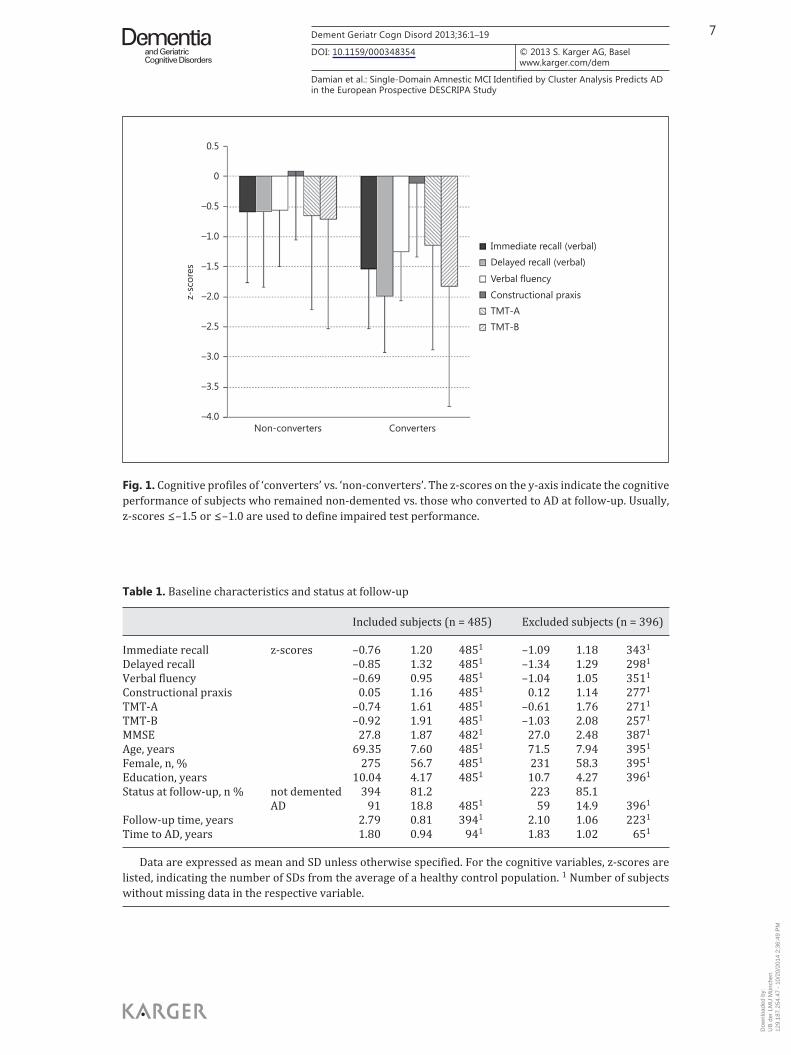
sified into cluster 1, 62 (12.8%) into cluster 2, 32 (6.6%) into cluster 3 and 167 (34.4%) into cluster 4. Table 2 lists the baseline scores of the clusters on the 6 cognitive variables, the mean MMSE scores, demographics, cluster-specific rates of conversion to AD, mean time to conversion, and mean follow-up duration in the 4 clusters.
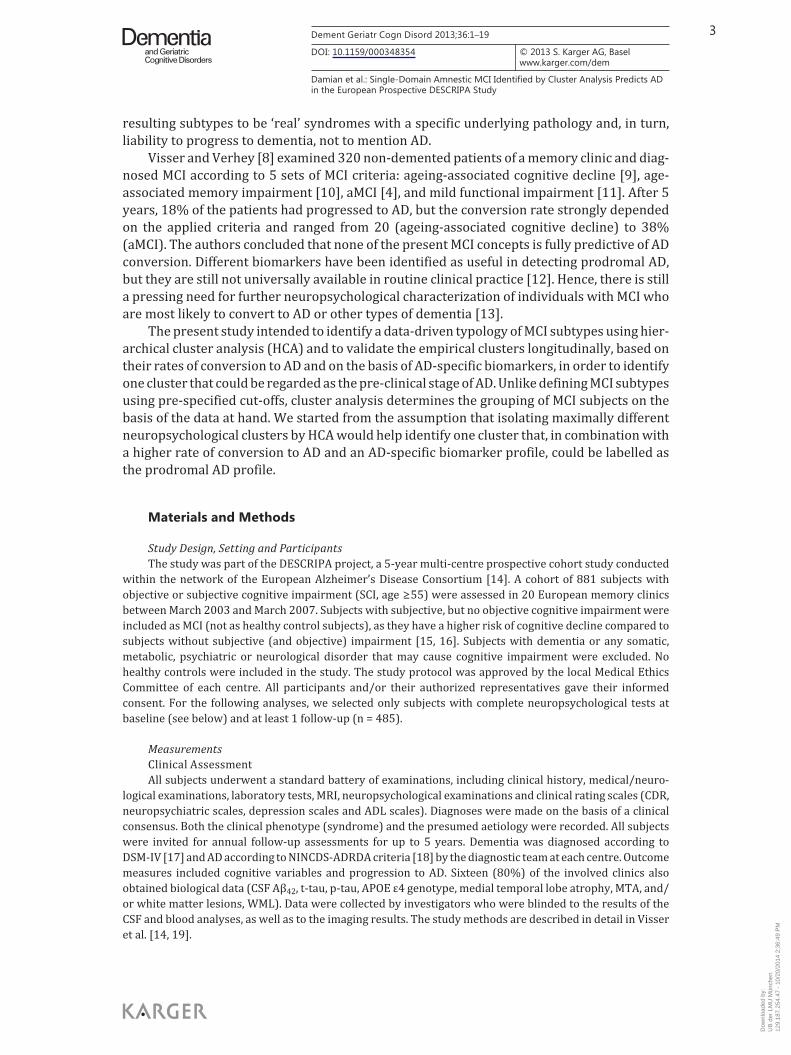
Figure 2 specifies the cognitive profiles of the 4 clusters. Based on the neuropsychological variables entered into the HCA, the 4 clusters can be
characterized as follows: • Cluster 1 (n = 224) had subjective cognitive impairments with very mild (if any) objective
deficits, so that it can be best labelled with ‘SCI’. • Cluster 2 (n = 62) had severe deficits in psychomotor speed, moderate deficits in exec-
utive functioning and mild memory deficits, so that it can be best labelled with ‘inat-tentive, dysexecutive aMCI’ (aMCIatex).
• Cluster 3 (n = 32) had prominent deficits in executive functioning, mild-to-moderate memory deficits and mild deficits in verbal fluency. This group was the most impaired group and can be best described with ‘dysexecutive aMCI’ (aMCIexec).
• Cluster 4 (n = 167) showed deficits in immediate verbal recall that were comparable to those in cluster 3, but with more pronounced impairment in delayed memory, without executive or attentional deficits. This cluster can be referred to as ‘aMCI, single domain’ (aMCIsingle).
Table 2. Baseline cognitive scores and status at follow up: HCA sample and clusters (n = 485)
SCI (n = 224) aMCIatex (n = 62) aMCIexec (n = 32) aMCIsingle (n = 167)
Immediate recall z-scores 0.02 0.93 – 0.92 1.03 –1.69 1.12 – 1.58 0.86Delayed recall 0.12 0.90 – 0.86 1.02 –1.45 1.11 – 2.02 0.81Verbal fluency –0.19 0.91 – 0.96 0.84 –1.24 0.78 – 1.14 0.75Constructional praxis 0.16 1.11 – 0.44 1.32 –0.17 1.29 0.13 1.10TMT-A –0.03 0.97 – 3.99 0.90 –0.68 0.99 – 0.49 1.06TMT-B –0.09 1.30 – 3.12 1.74 –4.77 0.46 – 0.47 1.17MMSE 28.5 1.43 27.02 2.08 26.69 2.16 27.3 1.90Age, years 67.98 7.45 70.418 5.64 71.26 7.63 70.416 8.14Female, n, % 121 54.0 45 72.6 23 71.9 86 51.5Education, years 10.79 4.20 6.98 3.29 8.69 4.04 10.43 3.90Status at follow-up, n, % not demented 216 96.4 47 75.8 17 53.1 114 68.3
AD 8 3.6 15 24.2 15 46.9 53 31.7Follow-up time, years 2.89 0.82 2.49 0.58 2.76 0.56 2.72 0.87Time to AD, years 1.43 0.53 1.80 0.56 1.60 0.74 1.63 0.75
Data are expressed as mean and SD unless otherwise specified. For the cognitive variables, z-scores are listed, indicating the number of SDs from the average of a healthy control population.
Dow
nloa
ded
by:
UB
der
LM
U M
ünch
en
129.
187.
254.
47 -
10/
20/2
014
2:36
:49
PM
9Dement Geriatr Cogn Disord 2013;36:1–19
DOI: 10.1159/000348354
Damian et al.: Single-Domain Amnestic MCI Identified by Cluster Analysis Predicts AD in the European Prospective DESCRIPA Study
www.karger.com/dem© 2013 S. Karger AG, Basel
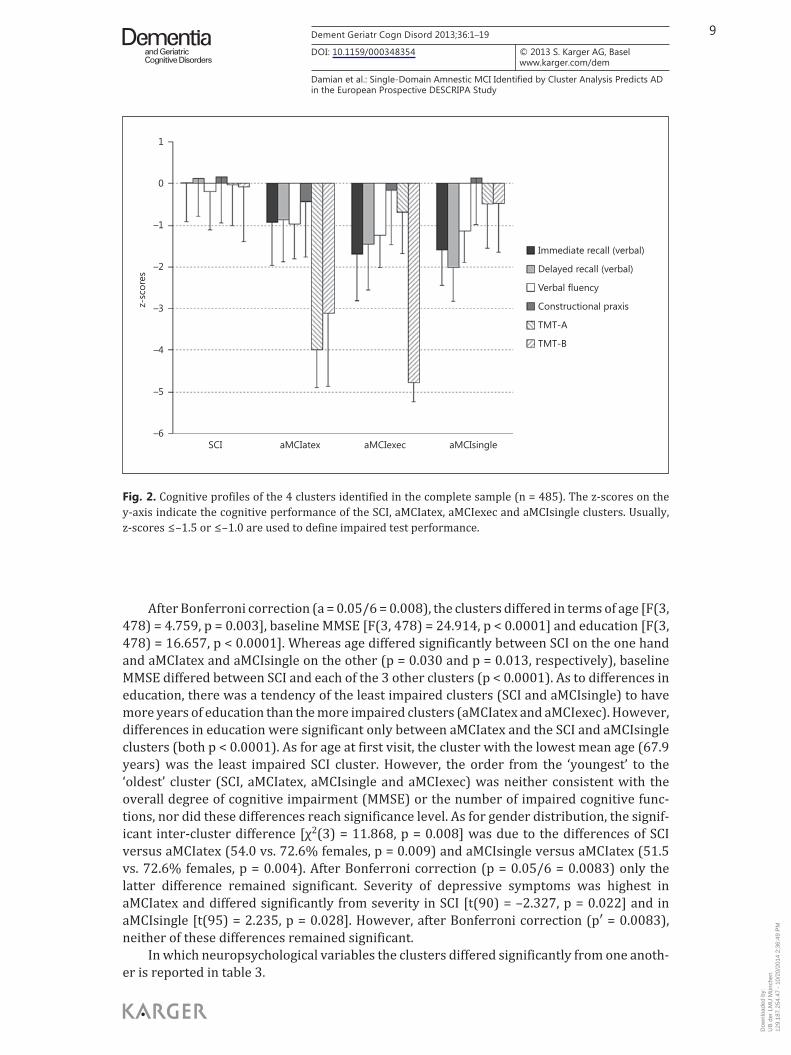
After Bonferroni correction (a = 0.05/6 = 0.008), the clusters differed in terms of age [F(3, 478) = 4.759, p = 0.003], baseline MMSE [F(3, 478) = 24.914, p < 0.0001] and education [F(3, 478) = 16.657, p < 0.0001]. Whereas age differed significantly between SCI on the one hand and aMCIatex and aMCIsingle on the other (p = 0.030 and p = 0.013, respectively), baseline MMSE differed between SCI and each of the 3 other clusters (p < 0.0001). As to differences in education, there was a tendency of the least impaired clusters (SCI and aMCIsingle) to have more years of education than the more impaired clusters (aMCIatex and aMCIexec). However, differences in education were significant only between aMCIatex and the SCI and aMCIsingle clusters (both p < 0.0001). As for age at first visit, the cluster with the lowest mean age (67.9 years) was the least impaired SCI cluster. However, the order from the ‘youngest’ to the ‘oldest’ cluster (SCI, aMCIatex, aMCIsingle and aMCIexec) was neither consistent with the overall degree of cognitive impairment (MMSE) or the number of impaired cognitive func-tions, nor did these differences reach significance level. As for gender distribution, the signif-icant inter-cluster difference [χ 2 (3) = 11.868, p = 0.008] was due to the differences of SCI versus aMCIatex (54.0 vs. 72.6% females, p = 0.009) and aMCIsingle versus aMCIatex (51.5 vs. 72.6% females, p = 0.004). After Bonferroni correction (p = 0.05/6 = 0.0083) only the latter difference remained significant. Severity of depressive symptoms was highest in aMCIatex and differed significantly from severity in SCI [t(90) = –2.327, p = 0.022] and in aMCIsingle [t(95) = 2.235, p = 0.028]. However, after Bonferroni correction (p′ = 0.0083), neither of these differences remained significant.
In which neuropsychological variables the clusters differed significantly from one anoth-er is reported in table 3 .
1
0
–1
–2
–3
–4
–5
–6
z-sc
ores
Immediate recall (verbal)
Delayed recall (verbal)
Verbal fluency
Constructional praxis
TMT-A
TMT-B
SCI aMCIatex aMCIexec aMCIsingle
Fig. 2. Cognitive profiles of the 4 clusters identified in the complete sample (n = 485). The z-scores on the y-axis indicate the cognitive performance of the SCI, aMCIatex, aMCIexec and aMCIsingle clusters. Usually, z-scores ≤ –1.5 or ≤ –1.0 are used to define impaired test performance.
Dow
nloa
ded
by:
UB
der
LM
U M
ünch
en
129.
187.
254.
47 -
10/
20/2
014
2:36
:49
PM
10Dement Geriatr Cogn Disord 2013;36:1–19
DOI: 10.1159/000348354
Damian et al.: Single-Domain Amnestic MCI Identified by Cluster Analysis Predicts AD in the European Prospective DESCRIPA Study
www.karger.com/dem© 2013 S. Karger AG, Basel
Conversion to AD, Mean Time to Conversion, and Mean Follow-Up Duration The cluster-specific rates of conversion to AD, mean time to conversion and mean follow-
up duration in the 4 clusters are reported in table 2 . The highest conversion rate was found in the aMCIexec cluster (46.9%), which differed significantly from that of the aMCIatex cluster (24.2%, p = 0.036). However, after Bonferroni correction (0.05/3 = 0.016) this difference was no longer significant. Because significantly lower conversion rates were self-evident in subjects with just SCI, only the rates of the clusters with objective cognitive impairment were compared with one another. The clusters did not differ with regard to the mean time to AD either [F(3, 84) = 0.489, p = 0.691], whereas the average follow-up time was significantly longer in the SCI than in the aMCIatex cluster (p = 0.001). Whereas time to AD was computed selecting subjects who converted to AD, follow-up time was examined only in subjects who did not convert, in order to avoid comparing it between groups with different conversion rates (and hence different follow-up times, as converters dropped out of the study earlier).
Differentiating MCI Clusters of Subjects with MMSE ≥ 28 A second HCA was conducted to test if the stability of the clusters could also be demon-
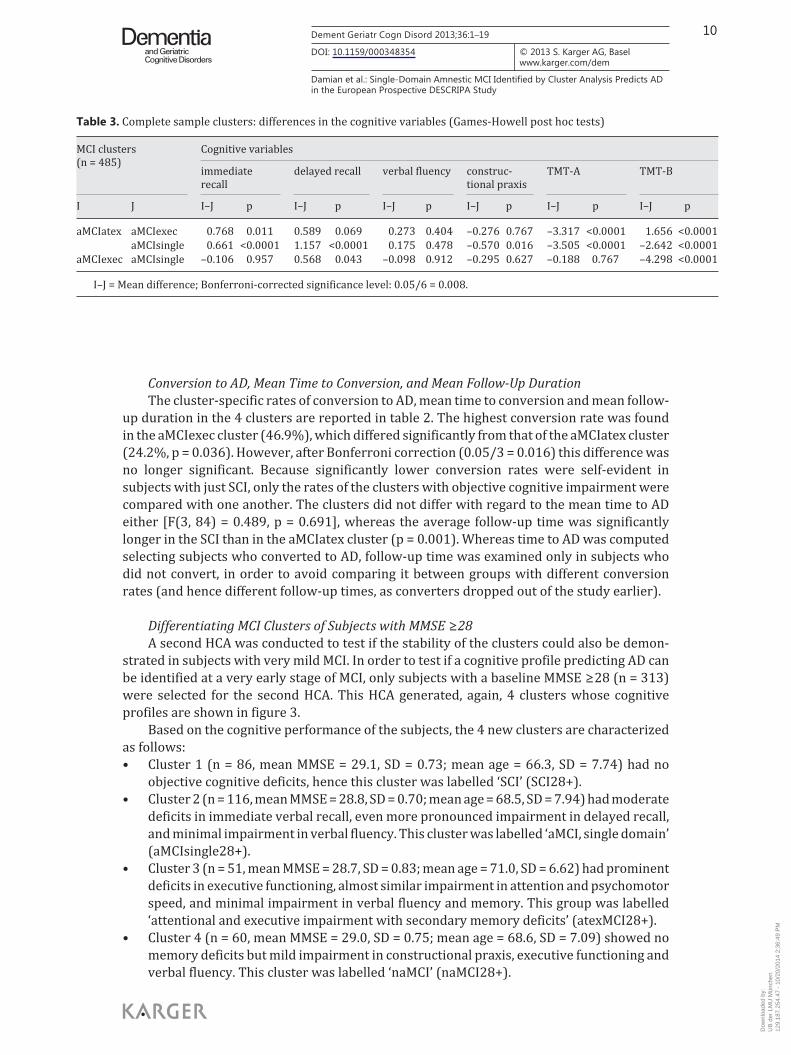
strated in subjects with very mild MCI. In order to test if a cognitive profile predicting AD can be identified at a very early stage of MCI, only subjects with a baseline MMSE ≥ 28 (n = 313) were selected for the second HCA. This HCA generated, again, 4 clusters whose cognitive profiles are shown in figure 3 .
Based on the cognitive performance of the subjects, the 4 new clusters are characterized as follows: • Cluster 1 (n = 86, mean MMSE = 29.1, SD = 0.73; mean age = 66.3, SD = 7.74) had no
objective cognitive deficits, hence this cluster was labelled ‘SCI’ (SCI28+). • Cluster 2 (n = 116, mean MMSE = 28.8, SD = 0.70; mean age = 68.5, SD = 7.94) had moderate
deficits in immediate verbal recall, even more pronounced impairment in delayed recall, and minimal impairment in verbal fluency. This cluster was labelled ‘aMCI, single domain’ (aMCIsingle28+).
• Cluster 3 (n = 51, mean MMSE = 28.7, SD = 0.83; mean age = 71.0, SD = 6.62) had prominent deficits in executive functioning, almost similar impairment in attention and psychomotor speed, and minimal impairment in verbal fluency and memory. This group was labelled ‘attentional and executive impairment with secondary memory deficits’ (atexMCI28+).
• Cluster 4 (n = 60, mean MMSE = 29.0, SD = 0.75; mean age = 68.6, SD = 7.09) showed no memory deficits but mild impairment in constructional praxis, executive functioning and verbal fluency. This cluster was labelled ‘naMCI’ (naMCI28+).
Table 3. Complete sample clusters: differences in the cognitive variables (Games-Howell post hoc tests)
MCI clusters (n = 485)
Cognitive variables
immediate recall
delayed recall verbal fluency construc-tional praxis
TMT-A TMT-B
I J I–J p I–J p I–J p I–J p I–J p I–J p
aMCIatex aMCIexec 0.768 0.011 0.589 0.069 0.273 0.404 –0.276 0.767 –3.317 <0.0001 1.656 <0.0001 aMCIsingle 0.661 <0.0001 1.157 <0.0001 0.175 0.478 –0.570 0.016 –3.505 <0.0001 –2.642 <0.0001aMCIexec aMCIsingle –0.106 0.957 0.568 0.043 –0.098 0.912 –0.295 0.627 –0.188 0.767 –4.298 <0.0001
I–J = Mean difference; Bonferroni-corrected significance level: 0.05/6 = 0.008.
Dow
nloa
ded
by:
UB
der
LM
U M
ünch
en
129.
187.
254.
47 -
10/
20/2
014
2:36
:49
PM
11Dement Geriatr Cogn Disord 2013;36:1–19
DOI: 10.1159/000348354
Damian et al.: Single-Domain Amnestic MCI Identified by Cluster Analysis Predicts AD in the European Prospective DESCRIPA Study
www.karger.com/dem© 2013 S. Karger AG, Basel
After Bonferroni correction (a = 0.05/6 = 0.008), the clusters did not differ with regard to baseline MMSE except for the difference between SCI28+ and aMCIsingle28+ (p = 0.003). The clusters SCI28+ and atexMCI28+ differed significantly with regard to age (p = 0.001) and education (p < 0.0001). Education differed also between aMCIsingle28+ and atexMCI28+ (p < 0.0001), with aMCIsingle28+ being more educated than atexMCI28+. Severity of depres-sive symptoms differed between the clusters too [F(3, 250) = 2.707, p = 0.046]. Games-Howell post hoc comparisons indicated that the inter-cluster difference in depressive symp-toms was only attributable to the difference SCI28+ versus atexMCI28+ (p = 0.045). In contrast to aMCIsingle28+, where delayed recall was slightly more impaired than immedi-ate recall (t = 1.70; d.f. = 115; p = 0.092), an opposite tendency was present in atexMCI28+ (t = –1.568; d.f. = 50; p = 0.123), although both results were not significant. In summary, atexMCI28+ was the cluster with the lowest education level and the highest severity of depressive symptoms. There were no differences in gender distribution [χ 2 (3) = 1.438, p = 0.697].
In which neuropsychological variables the ‘very mild MCI’ clusters differed significantly from one another is reported in table 4 .
Conversion to AD, Mean Time to Conversion, and Mean Follow-Up Duration in the MMSE ≥ 28 Clusters In the subset of subjects with milder cognitive impairment (MMSE ≥ 28), the highest
conversion rate was found in the aMCIsingle cluster (19%), which differed significantly
2.0
1.0
0
–1.0
–2.0
–3.0
–4.0
–5.0
–6.0
z-sc
ores
SCI28+ naMCI28+ atexMCI28+ aMCIsingle28+
Immediate recall (verbal)
Delayed recall (verbal)
Verbal fluency
Constructional praxis
TMT-A
TMT-B
Fig. 3. Cognitive profiles of the 4 clusters identified in the very mild MCI (MMSE ≥ 28) sample (n = 313). The z-scores on the y-axis indicate the cognitive performance of the SCI28+, naMCI28+, atexMCI28+ and aMCIsingle28+ clusters. Usually, z-scores ≤ –1.5 or ≤ –1.0 are used to define impaired test performance.
Dow
nloa
ded
by:
UB
der
LM
U M
ünch
en
129.
187.
254.
47 -
10/
20/2
014
2:36
:49
PM
12Dement Geriatr Cogn Disord 2013;36:1–19
DOI: 10.1159/000348354
Damian et al.: Single-Domain Amnestic MCI Identified by Cluster Analysis Predicts AD in the European Prospective DESCRIPA Study
www.karger.com/dem© 2013 S. Karger AG, Basel
from the conversion rate of naMCI (5%, p = 0.012, Bonferroni-corrected significance level: 0.05/3 = 0.016). Time to AD did not differ between the clusters [F(3, 26) = 0.446, p = 0.722], whereas the average follow-up time was significantly longer in SCI28+ than in atexMCI28+ (p = 0.004).
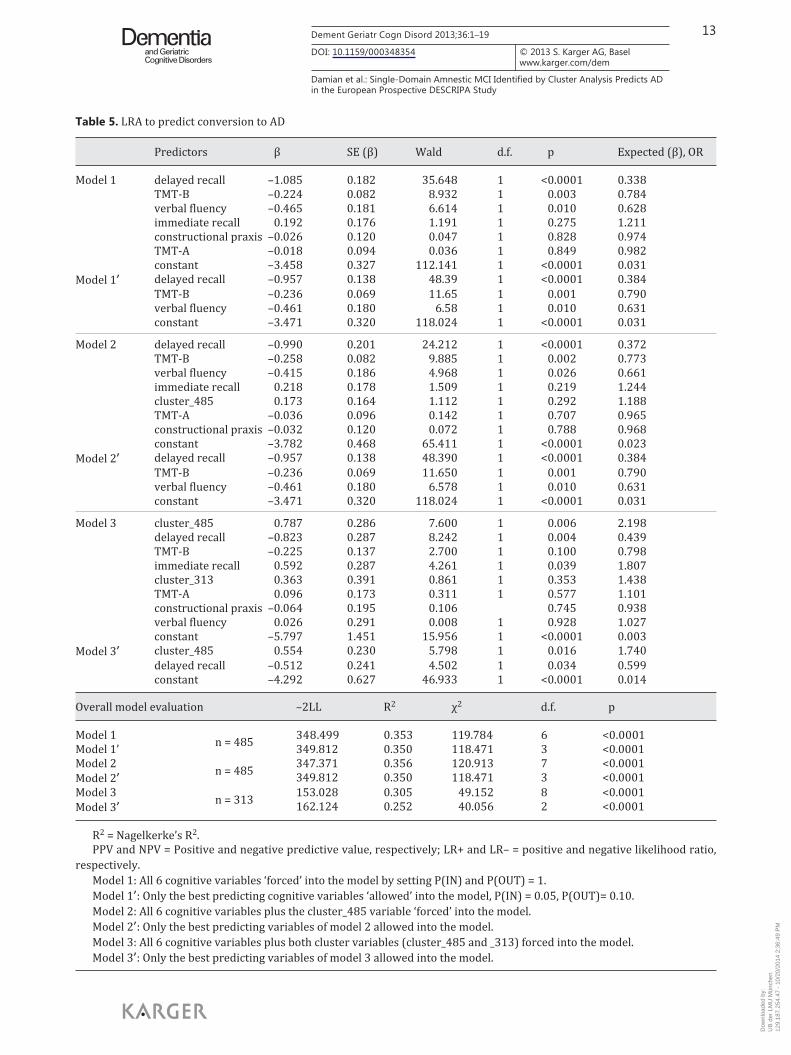
Predicting Conversion to AD: Does Sub-Classifying MCI Subjects Improve the Diagnostic Accuracy of the Cognitive Scores? In order to determine whether knowledge of the subtype or cluster of an MCI subject has
an additional benefit to the prediction of conversion to AD compared to the plain use of the subjects’ cognitive scores, 6 LRA were performed, using different combinations of potentially predicting variables. The 6 resulting models are presented in table 5 .
According to the LRA that included the cognitive variables only (models 1 and 1’), conversion to AD at follow-up was correctly predicted in 84.5% of the cases. Specificity amounted to 96.4% and sensitivity to 33.0% (model 1). In model 1’, where the LRA algorithm stopped including further variables if they did not enhance the predictive accuracy, the vari-ables of delayed recall, TMT-B and verbal fluency were identified as the best predictors. The variables of verbal immediate recall, constructional praxis and TMT-A did not contribute to the prediction of conversion to AD (p = 0.275, p = 0.828 and p = 0.849, respectively). While the predictive accuracy of the 6 cognitive variables (model 1) remained virtually unaffected by the exclusion of the redundant cognitive variables (model 1’, see table 6 ) in both models, high specificity values are derogated by low sensitivity values.
To examine whether the clustering of the MCI sample improves prediction of AD, the models 1 and 1’ were supplemented by two further models (models 2 and 2’): in model 2, the 6 aforementioned cognitive variables plus the cluster_485 variable were included. In model 3, these model 2 predictors were supplemented by the cluster_313 variable.
In model 2, the order of the included variables shows that the cluster_485 variable was slightly more predictive than the redundant variables identified in model 2’. However, the contribution of the cluster_485 variable was not significant (p = 0.292), so that the predictive accuracy of this set of predictors does not significantly improve, compared to models 1 and 1’.
In contrast, model 3, which also included the cluster_313 variable, showed another picture: here, the LRA algorithm selected the cluster_485 variable as the best predictor, followed by the variables of delayed recall, TMT-B and immediate recall. In model 3’ the algo-rithm excluded all variables but cluster_485 (best predictor) and delayed recall (second-best predictor). However, in model 3’ sensitivity is significantly reduced compared to model 3. On the basis of these 2 ‘best’ variables, AD was predicted for only 1 subject who, at least in the 4 years of follow-up, did not progress to AD.
Table 4. MMSE 28+ clusters: differences in the cognitive variables (Games-Howell post hoc tests)
MCI Clusters 28+(n = 313)
Cognitive variables
immediate recall
delayed recall verbalfluency
constructionalpraxis
TMT-A TMT-B
I J I–J p I–J p I–J p I–J p I–J p I–J p
aMCIsingle28+ atexMCI28+ –0.819 <0.0001 –1.184 <0.0001 –0.130 0.753 0.514 0.058 2.375 <0.0001 3.077 <0.0001naMCI28+ –1.46 <0.0001 –1.668 <0.0001 –0.476 0.003 0.854 <0.0001 0.159 0.702 0.358 0.147
atexMCI28+ naMCI28+ –0.638 0.003 –0.484 0.016 –0.346 0.118 0.341 0.445 –2.217 <0.0001 –2.719 <0.0001
I–J = mean difference; Bonferroni-corrected significance level: 0.05/6 = 0.008.
Dow
nloa
ded
by:
UB
der
LM
U M
ünch
en
129.
187.
254.
47 -
10/
20/2
014
2:36
:49
PM
13Dement Geriatr Cogn Disord 2013;36:1–19
DOI: 10.1159/000348354
Damian et al.: Single-Domain Amnestic MCI Identified by Cluster Analysis Predicts AD in the European Prospective DESCRIPA Study
www.karger.com/dem© 2013 S. Karger AG, Basel
Table 5. LRA to predict conversion to AD
Predictors β SE (β) Wald d.f. p Expected (β), OR
Model 1 delayed recall –1.085 0.182 35.648 1 <0.0001 0.338TMT-B –0.224 0.082 8.932 1 0.003 0.784verbal fluency –0.465 0.181 6.614 1 0.010 0.628immediate recall 0.192 0.176 1.191 1 0.275 1.211constructional praxis –0.026 0.120 0.047 1 0.828 0.974TMT-A –0.018 0.094 0.036 1 0.849 0.982constant –3.458 0.327 112.141 1 <0.0001 0.031
Model 1’ delayed recall –0.957 0.138 48.39 1 <0.0001 0.384TMT-B –0.236 0.069 11.65 1 0.001 0.790verbal fluency –0.461 0.180 6.58 1 0.010 0.631constant –3.471 0.320 118.024 1 <0.0001 0.031
Model 2 delayed recall –0.990 0.201 24.212 1 <0.0001 0.372TMT-B –0.258 0.082 9.885 1 0.002 0.773verbal fluency –0.415 0.186 4.968 1 0.026 0.661immediate recall 0.218 0.178 1.509 1 0.219 1.244cluster_485 0.173 0.164 1.112 1 0.292 1.188TMT-A –0.036 0.096 0.142 1 0.707 0.965constructional praxis –0.032 0.120 0.072 1 0.788 0.968constant –3.782 0.468 65.411 1 <0.0001 0.023
Model 2’ delayed recall –0.957 0.138 48.390 1 <0.0001 0.384TMT-B –0.236 0.069 11.650 1 0.001 0.790verbal fluency –0.461 0.180 6.578 1 0.010 0.631constant –3.471 0.320 118.024 1 <0.0001 0.031
Model 3 cluster_485 0.787 0.286 7.600 1 0.006 2.198delayed recall –0.823 0.287 8.242 1 0.004 0.439TMT-B –0.225 0.137 2.700 1 0.100 0.798immediate recall 0.592 0.287 4.261 1 0.039 1.807cluster_313 0.363 0.391 0.861 1 0.353 1.438TMT-A 0.096 0.173 0.311 1 0.577 1.101constructional praxis –0.064 0.195 0.106 0.745 0.938verbal fluency 0.026 0.291 0.008 1 0.928 1.027constant –5.797 1.451 15.956 1 <0.0001 0.003
Model 3’ cluster_485 0.554 0.230 5.798 1 0.016 1.740delayed recall –0.512 0.241 4.502 1 0.034 0.599constant –4.292 0.627 46.933 1 <0.0001 0.014
Overall model evaluation –2LL R2 χ2 d.f. p
Model 1 n = 485 348.499 0.353 119.784 6 <0.0001Model 1’ 349.812 0.350 118.471 3 <0.0001Model 2 n = 485 347.371 0.356 120.913 7 <0.0001Model 2’ 349.812 0.350 118.471 3 <0.0001Model 3 n = 313 153.028 0.305 49.152 8 <0.0001Model 3’ 162.124 0.252 40.056 2 <0.0001
R2 = Nagelkerke’s R2. PPV and NPV = Positive and negative predictive value, respectively; LR+ and LR– = positive and negative likelihood ratio,
respectively.Model 1: All 6 cognitive variables ‘forced’ into the model by setting P(IN) and P(OUT) = 1.Model 1’: Only the best predicting cognitive variables ‘allowed’ into the model, P(IN) = 0.05, P(OUT)= 0.10.Model 2: All 6 cognitive variables plus the cluster_485 variable ‘forced’ into the model.Model 2’: Only the best predicting variables of model 2 allowed into the model.Model 3: All 6 cognitive variables plus both cluster variables (cluster_485 and _313) forced into the model.Model 3’: Only the best predicting variables of model 3 allowed into the model.
Dow
nloa
ded
by:
UB
der
LM
U M
ünch
en
129.
187.
254.
47 -
10/
20/2
014
2:36
:49
PM
14Dement Geriatr Cogn Disord 2013;36:1–19
DOI: 10.1159/000348354
Damian et al.: Single-Domain Amnestic MCI Identified by Cluster Analysis Predicts AD in the European Prospective DESCRIPA Study
www.karger.com/dem© 2013 S. Karger AG, Basel
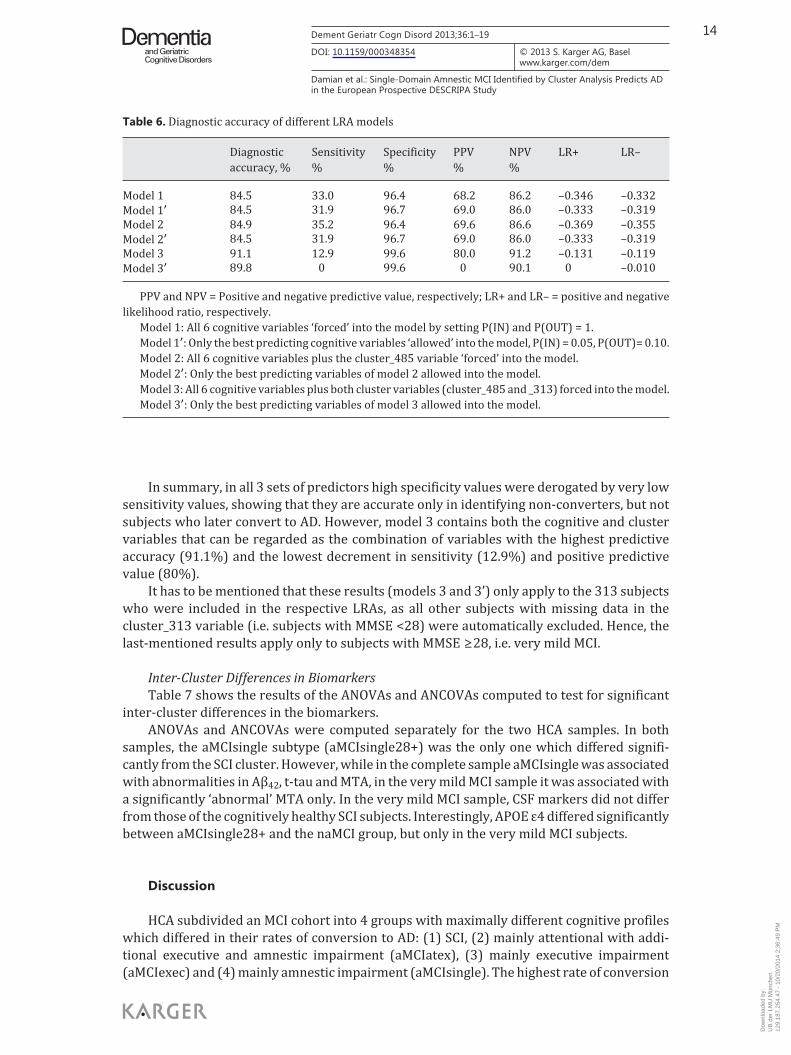
In summary, in all 3 sets of predictors high specificity values were derogated by very low sensitivity values, showing that they are accurate only in identifying non-converters, but not subjects who later convert to AD. However, model 3 contains both the cognitive and cluster variables that can be regarded as the combination of variables with the highest predictive accuracy (91.1%) and the lowest decrement in sensitivity (12.9%) and positive predictive value (80%).
It has to be mentioned that these results (models 3 and 3’) only apply to the 313 subjects who were included in the respective LRAs, as all other subjects with missing data in the cluster_313 variable (i.e. subjects with MMSE <28) were automatically excluded. Hence, the last-mentioned results apply only to subjects with MMSE ≥ 28, i.e. very mild MCI.
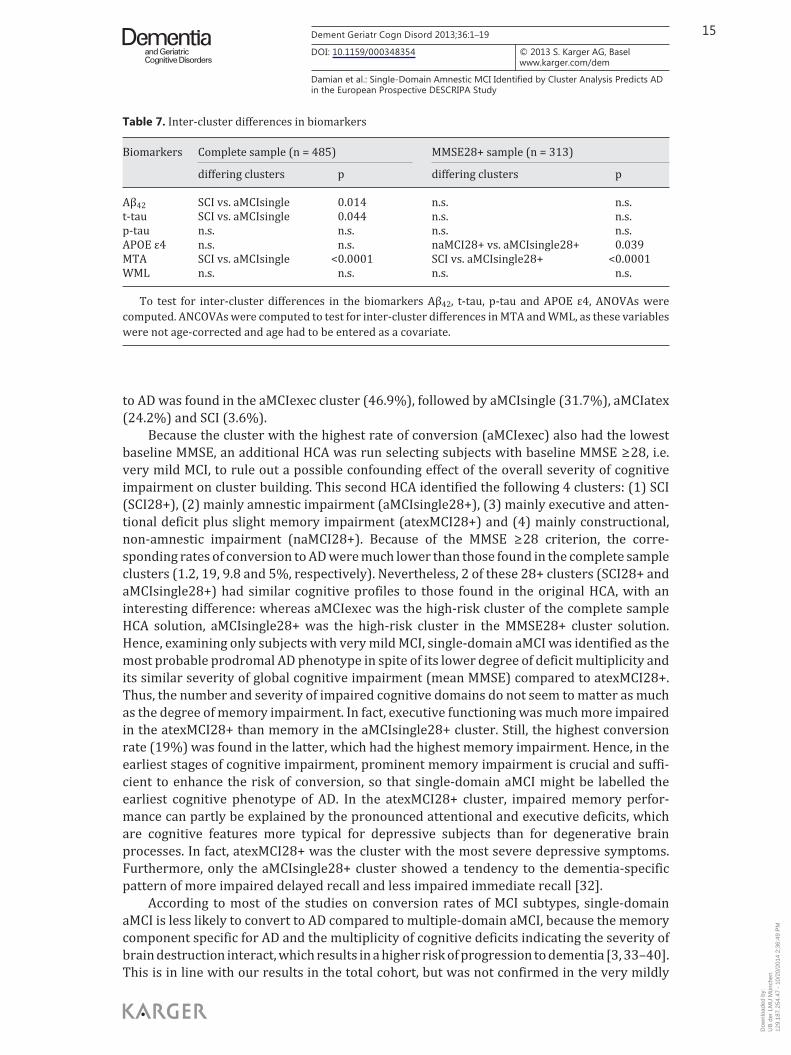
Inter-Cluster Differences in Biomarkers Table 7 shows the results of the ANOVAs and ANCOVAs computed to test for significant
inter-cluster differences in the biomarkers. ANOVAs and ANCOVAs were computed separately for the two HCA samples. In both
samples, the aMCIsingle subtype (aMCIsingle28+) was the only one which differed signifi-cantly from the SCI cluster. However, while in the complete sample aMCIsingle was associated with abnormalities in Aβ 42 , t-tau and MTA, in the very mild MCI sample it was associated with a significantly ‘abnormal’ MTA only. In the very mild MCI sample, CSF markers did not differ from those of the cognitively healthy SCI subjects. Interestingly, APOE ε4 differed significantly between aMCIsingle28+ and the naMCI group, but only in the very mild MCI subjects.
Discussion
HCA subdivided an MCI cohort into 4 groups with maximally different cognitive profiles which differed in their rates of conversion to AD: (1) SCI, (2) mainly attentional with addi-tional executive and amnestic impairment (aMCIatex), (3) mainly executive impairment (aMCIexec) and (4) mainly amnestic impairment (aMCIsingle). The highest rate of conversion
Table 6. Diagnostic accuracy of different LRA models
Diagnosticaccuracy, %
Sensitivity%
Specificity%
PPV%
NPV%
LR+ LR–
Model 1 84.5 33.0 96.4 68.2 86.2 –0.346 –0.332Model 1’ 84.5 31.9 96.7 69.0 86.0 –0.333 –0.319Model 2 84.9 35.2 96.4 69.6 86.6 –0.369 –0.355Model 2’ 84.5 31.9 96.7 69.0 86.0 –0.333 –0.319Model 3 91.1 12.9 99.6 80.0 91.2 –0.131 –0.119Model 3’ 89.8 0 99.6 0 90.1 0 –0.010
PPV and NPV = Positive and negative predictive value, respectively; LR+ and LR– = positive and negative likelihood ratio, respectively.
Model 1: All 6 cognitive variables ‘forced’ into the model by setting P(IN) and P(OUT) = 1.Model 1’: Only the best predicting cognitive variables ‘allowed’ into the model, P(IN) = 0.05, P(OUT)= 0.10.Model 2: All 6 cognitive variables plus the cluster_485 variable ‘forced’ into the model.Model 2’: Only the best predicting variables of model 2 allowed into the model.Model 3: All 6 cognitive variables plus both cluster variables (cluster_485 and _313) forced into the model.Model 3’: Only the best predicting variables of model 3 allowed into the model.
Dow
nloa
ded
by:
UB
der
LM
U M
ünch
en
129.
187.
254.
47 -
10/
20/2
014
2:36
:49
PM
15Dement Geriatr Cogn Disord 2013;36:1–19
DOI: 10.1159/000348354
Damian et al.: Single-Domain Amnestic MCI Identified by Cluster Analysis Predicts AD in the European Prospective DESCRIPA Study
www.karger.com/dem© 2013 S. Karger AG, Basel
to AD was found in the aMCIexec cluster (46.9%), followed by aMCIsingle (31.7%), aMCIatex (24.2%) and SCI (3.6%).
Because the cluster with the highest rate of conversion (aMCIexec) also had the lowest baseline MMSE, an additional HCA was run selecting subjects with baseline MMSE ≥ 28, i.e. very mild MCI, to rule out a possible confounding effect of the overall severity of cognitive impairment on cluster building. This second HCA identified the following 4 clusters: (1) SCI (SCI28+), (2) mainly amnestic impairment (aMCIsingle28+), (3) mainly executive and atten-tional deficit plus slight memory impairment (atexMCI28+) and (4) mainly constructional, non-amnestic impairment (naMCI28+). Because of the MMSE ≥ 28 criterion, the corre-sponding rates of conversion to AD were much lower than those found in the complete sample clusters (1.2, 19, 9.8 and 5%, respectively). Nevertheless, 2 of these 28+ clusters (SCI28+ and aMCIsingle28+) had similar cognitive profiles to those found in the original HCA, with an interesting difference: whereas aMCIexec was the high-risk cluster of the complete sample HCA solution, aMCIsingle28+ was the high-risk cluster in the MMSE28+ cluster solution. Hence, examining only subjects with very mild MCI, single-domain aMCI was identified as the most probable prodromal AD phenotype in spite of its lower degree of deficit multiplicity and its similar severity of global cognitive impairment (mean MMSE) compared to atexMCI28+. Thus, the number and severity of impaired cognitive domains do not seem to matter as much as the degree of memory impairment. In fact, executive functioning was much more impaired in the atexMCI28+ than memory in the aMCIsingle28+ cluster. Still, the highest conversion rate (19%) was found in the latter, which had the highest memory impairment. Hence, in the earliest stages of cognitive impairment, prominent memory impairment is crucial and suffi-cient to enhance the risk of conversion, so that single-domain aMCI might be labelled the earliest cognitive phenotype of AD. In the atexMCI28+ cluster, impaired memory perfor-mance can partly be explained by the pronounced attentional and executive deficits, which are cognitive features more typical for depressive subjects than for degenerative brain processes. In fact, atexMCI28+ was the cluster with the most severe depressive symptoms. Furthermore, only the aMCIsingle28+ cluster showed a tendency to the dementia-specific pattern of more impaired delayed recall and less impaired immediate recall [32] .
According to most of the studies on conversion rates of MCI subtypes, single-domain aMCI is less likely to convert to AD compared to multiple-domain aMCI, because the memory component specific for AD and the multiplicity of cognitive deficits indicating the severity of brain destruction interact, which results in a higher risk of progression to dementia [3, 33–40] . This is in line with our results in the total cohort, but was not confirmed in the very mildly
Table 7. Inter-cluster differences in biomarkers
Biomarkers Complete sample (n = 485) MMSE28+ sample (n = 313)
differing clusters p differing clusters p
Aβ42 SCI vs. aMCIsingle 0.014 n.s. n.s.t-tau SCI vs. aMCIsingle 0.044 n.s. n.s.p-tau n.s. n.s. n.s. n.s.APOE ε4 n.s. n.s. naMCI28+ vs. aMCIsingle28+ 0.039MTA SCI vs. aMCIsingle <0.0001 SCI vs. aMCIsingle28+ <0.0001WML n.s. n.s. n.s. n.s.
To test for inter-cluster differences in the biomarkers Aβ42, t-tau, p-tau and APOE ε4, ANOVAs were computed. ANCOVAs were computed to test for inter-cluster differences in MTA and WML, as these variables were not age-corrected and age had to be entered as a covariate.
Dow
nloa
ded
by:
UB
der
LM
U M
ünch
en
129.
187.
254.
47 -
10/
20/2
014
2:36
:49
PM
16Dement Geriatr Cogn Disord 2013;36:1–19
DOI: 10.1159/000348354
Damian et al.: Single-Domain Amnestic MCI Identified by Cluster Analysis Predicts AD in the European Prospective DESCRIPA Study
www.karger.com/dem© 2013 S. Karger AG, Basel
impaired cohort. This supports the suggestion of Hughes et al. [41] that multiple-domain aMCI represents a more advanced disease state.
In the complete sample, the aMCIsingle cluster was associated with an AD-specific biomarker profile: decreased Aβ 42 , increased t-tau, and MTA, compared to subjects with only SCI. The biomarker differences might have been even more pronounced if healthy controls had been included in the study, as Visser et al. [19] could show in another study. In the MMSE ≥ 28 sample, CSF markers could not differentiate between any of the clusters, probably because CSF markers become abnormal very early, even in subjects who will in their lifetime never express symptoms of AD dementia, and do not change appreciably as the disease progresses [42] . WML did not differentiate between any of the clusters, whereas APOE ε4 differed between aMCIsingle and naMCI. However, MTA was the only biomarker which consistently and highly significantly differentiated between SCI and aMCIsingle both in the complete and in the MMSE ≥ 28 sample. This is in line with the hypothetical model of dynamic AD biomarkers of Jack et al. [42] , stating that the direct substrate of memory impairment is hippocampal atrophy (as measured by MRI) and not, for example, Aβ deposition.
The results of this study have to be seen in light of some limitations. As the study popu-lation was recruited from memory clinics, the results may not be generalized to other settings or to the general population. As the number of included cognitive tests was limited because of the multi-centre and naturalistic nature of the study, the study findings are specific to the tests that were selected. In addition, this study was carried out without a healthy control group, as the included subjects with no objective cognitive impairment all had subjective concerns and, hence, a higher risk of developing cognitive deficits and converting to dementia compared to truly healthy controls [15, 16] . Another problem of this and other studies comparing the conversion risk of aMCI versus naMCI subtypes could also have led to biased results: identifying clusters with memory impairment as the most susceptible ones to convert to AD could reflect a tautological problem. In order to diagnose dementia, i.e. to decide whether a subject has converted to dementia or not, memory impairment is, by definition, a necessary prerequisite. Hence, subjects with a baseline cognitive profile corresponding to naMCI are less probable to be judged as ‘converted’ (to dementia or AD) at follow-up, because they have to develop memory deficits in the first place. However, if only amnestic forms of MCI are taken into consideration, this problem concerns both multiple- and single-domain aMCI. Actually, it affects multiple-domain aMCI in particular, as memory impairment has to be accompanied by deficits in at least one additional cognitive domain in order to fulfil dementia criteria. Because single- and not multiple-domain aMCI was found to be the most susceptible to convert to AD, the aforementioned tautology does not explain this specific result. However, tautology problems have to be taken into consideration as a source of bias affecting results pertaining to the comparison between amnestic and non-amnestic clusters. Another limitation of this study is the lack of a measure of ‘cued recall’ like, for example, the Free and Cued Selective Reminding test, which has been found to correlate with CSF biomarkers of AD more strongly than CERAD delayed recall measures [43] and to accurately predict MTA, as semantic cuing draws upon hippocampal and entorhinal structures [44] . Furthermore, the study is limited by the fact that the MCI clusters were built on the basis of their cognitive profiles only, even if they could be correlated with AD-specific biomarkers afterwards. Finally, in all logistic regression models, sensitivity values were low (range = 0–35.2%), while accuracy (84.5–91.1%) and specificity (96.4–99.6%) of the various variables and clusters predicting incident AD were high. Hence, the cognitive variables used in the analyses were accurate in identifying subjects not at risk of developing AD, but they were not sensitive to detect those who are at risk. This is consistent with the results of Stephan et al. [45] , who found that ‘no MCI-derived threshold accurately identified an at-risk group with a 2-year progression rate greater than 20%’.
Dow
nloa
ded
by:
UB
der
LM
U M
ünch
en
129.
187.
254.
47 -
10/
20/2
014
2:36
:49
PM
17Dement Geriatr Cogn Disord 2013;36:1–19
DOI: 10.1159/000348354
Damian et al.: Single-Domain Amnestic MCI Identified by Cluster Analysis Predicts AD in the European Prospective DESCRIPA Study
www.karger.com/dem© 2013 S. Karger AG, Basel
Appendix
Clusters of the complete sample (n = 485)SCI Subjective cognitive impairmentaMCIatex Inattentive, and dysexecutive amnestic MCIaMCIexec Dysexecutive amnestic MCIaMCIsingle Single-domain amnestic MCI
Clusters of the MMSE ≥28 sample (n = 313)SCI28+ Subjective cognitive impairment (MMSE ≥28)aMCIsingle28+ Single-domain amnestic MCI (MMSE ≥28)atexMCI28+ Inattentive, and dysexecutive MCI with mild memory deficits (MMSE ≥28)naMCI28+ Non-amnestic MCI (MMSE ≥28)
To our knowledge, this is the first prospective study investigating the conversion rates of MCI subtypes defined on an empirical basis using HCA. This method was chosen to find homo-geneous groups having in common not only performance below specific cut-off points (as it is often the case when building MCI subtypes), but ‘real’ underlying cognitive profiles. According to analyses where a theoretical sub-classification of MCI subjects (using 1.5 SD as the cut-off) was compared with the empirical one (using cluster analyses as presented in this paper), the theoretically specified subtype with the highest conversion rate to AD was multiple-domain aMCI. In clinical routine, where the aforementioned cut-off is used to define impairment, this cognitive profile would, at least in neuropsychological terms, already meet criteria for dementia and identify subjects at risk too late. In fact, some subjects in this theo-retical subtype had particularly low baseline MMSE values.
In summary, our results are consistent with those of other investigators finding that amnestic forms of MCI are at higher risk of progressing to dementia or AD compared to non-amnestic forms of MCI [35] . Considering only subjects with baseline MMSE values ≥ 28, i.e. subjects with very mild MCI, single-domain aMCI was identified as the most susceptible form to progress to AD. This is consistent with our biomarker analyses and with the notion of hippocampal damage leading to isolated memory deficits. Furthermore, our results confirm that delayed recall measures and MTA are the most useful markers of conversion to AD [46] , and that today imaging data still seem to be better immediate predictors of conversion to AD than CSF markers [47] . According to the model of the AD pathological cascade in the study of Jack et al. [42] , MRI markers are more predictive of conversion to AD than CSF markers, as they are the last to become abnormal and the most proximate pathological substrate of cognitive symptoms.
The results of this study are also of clinical relevance. The pattern of cognitive weak-nesses and strengths of MCI subjects is predictive of AD, whether or not they perform below specific cut-off z-scores. Prodromal AD should already be taken into consideration in the presence of isolated memory impairment, even if the subject’s performance has not yet crossed specific cut-off points. This is supported by our preliminary biomarker analyses. However, further analyses are needed to corroborate this finding.
Acknowledgements
This work was supported by the 6th FP of the EU (www.descripa.eu), and the EVO grant from Kuopio University Hospital and Academy of Finland (H.S.).
Dow
nloa
ded
by:
UB
der
LM
U M
ünch
en
129.
187.
254.
47 -
10/
20/2
014
2:36
:49
PM
18Dement Geriatr Cogn Disord 2013;36:1–19
DOI: 10.1159/000348354
Damian et al.: Single-Domain Amnestic MCI Identified by Cluster Analysis Predicts AD in the European Prospective DESCRIPA Study
www.karger.com/dem© 2013 S. Karger AG, Basel
References
1 Petersen RC, Roberts RO, Knopman DS, Boeve BF, Geda YE, Ivnik RJ, Smith GE, Jack CR Jr: Mild cognitive impairment: ten years later. Arch Neurol 2009; 66: 1447–1455.
2 Nordlund A, Rolstad S, Klang O, Edman A, Hansen S, Wallin A: Two-year outcome of MCI subtypes and aeti-ologies in the Goteborg MCI study. J Neurol Neurosurg Psychiatry 2010; 81: 541–546.
3 Forlenza OV, Diniz BS, Nunes PV, Memória CM, Yassuda MS, Gattaz WF: Diagnostic transitions in mild cognitive impairment subtypes. Int Psychogeriatr 2009; 21: 1088–1095.
4 Petersen RC: Mild cognitive impairment as a diagnostic entity. J Intern Med 2004; 256: 183–194. 5 Winblad B, Palmer K, Kivipelto M, Jelic V, Fratiglioni L, Wahlund LO, et al: Mild cognitive impairment – beyond
controversies, towards a consensus: report of the International Working Group on Mild Cognitive Impairment. J Intern Med 2004; 256: 240–246.
6 Kochan N, Slavin M, Brodaty H, Crawford JD, Trollor JN, Draper B, Sachdev PS: Effect of different impairment criteria on prevalence of ‘objective’ mild cognitive impairment in a community sample. Am J Geriatr Psychiatry 2010; 18: 711–722.
7 Jak AJ, Bondi MW, Delano-Wood L, Wierenga C, Corey-Bloom J, Salmon DP, Delis DC: Quantification of five neuropsychological approaches to defining mild cognitive impairment. Am J Geriatr Psychiatry 2009; 17: 368–375.
8 Visser P, Verhey FJ: Mild cognitive impairment as predictor for Alzheimer’s disease in clinical practice: effect of age and diagnostic criteria. Psychol Med 2008; 38: 113–122.
9 Levy R: Aging-associated cognitive decline. Working Party of the International Psychogeriatric Association in collaboration with the World Health Organization. Int Psychogeriatr 1994; 6: 63–68.
10 Crook T, Bartus RT, Ferris SH, Whitehouse P, Cohen GD, Gershon S: Age-associated memory impairment. Proposed diagnostic criteria and measures of clinical change: report of a National Institute of Mental Health Work Group. Dev Neuropsychol 1986; 2: 261–276.
11 Reisberg B, Ferris SH, De Leon MJ, Crook T: The Global Deterioration Scale for assessment of primary degen-erative dementia. Am J Psychiatry 1982; 139: 1136–1139.
12 Dubois B, Albert ML: Amnestic MCI or prodromal Alzheimer’s disease? Lancet Neurol 2004, 3: 246–248. 13 Levey A, Lah J, Goldstein F, Steenland K, Bliwise D: Mild cognitive impairment: an opportunity to identify
patients at high risk for progression to Alzheimer’s disease. Clin Ther 2006; 28: 991–1001. 14 Visser PJ, Verhey FRJ, Boada M, Bullock R, De Deyn PP, Frisoni GB, et al: development of screening guidelines
and clinical criteria for predementia Alzheimer’s disease. Neuroepidemiology 2008; 30: 254–265. 15 Jessen F, Wiese B, Bachmann C, Eifflaender-Gorfer S, Haller F, Kölsch H, Bickel, H, et al: Prediction of dementia
by subjective memory impairment. Arch Gen Psychiatry 2010; 67: 414–422. 16 Reid L, MacLullich AM: Subjective memory complaints and cognitive impairment in older people. Dement
Geriatr Cogn Disord 2006; 22: 471–485. 17 American Psychiatric Association: Diagnostic and Statistical Manual of Mental Disorders, ed 4. Washington,
American Psychiatric Association, 1994. 18 McKhann G, Drachman D, Folstein M, Katzman R, Price D, Stadlan EM: Clinical diagnosis of Alzheimer’s disease:
report of the NINCDS-ADRDA Work Group under the auspices of the Department of Health and Human Services Task Force on Alzheimer’s disease. Neurology 1984; 34: 939–944.
19 Visser PJ, Verhey F, Knol DL, Scheltens P, Wahlund L-O, Freund-Levi Y, et al: Prevalence and prognostic value of CSF markers of Alzheimer’s disease pathology in patients with subjective cognitive impairment or mild cognitive impairment in the DESCRIPA study: a prospective cohort study. Lancet Neurol 2009; 8: 619–627.
20 Van der Elst W, van Boxtel MP, van Breukelen GJ, Jolles J: Rey’s verbal learning test: normative data for 1855 healthy participants aged 24–81 years and the influence of age, sex, education, and mode of presentation. J Int Neuropsychol Soc 2005; 11: 290–302.
21 Welsh KA, Butters N, Mohs RC, Beekly D, Edland S, Fillenbaum G, Heyman A: The consortium to establish a registry for Alzheimer’s disease (CERAD). Part V. A normative study of the neuropsychological battery. Neurology 1994; 44: 609–614.
22 Van der Elst W, Van Boxtel MP, Van Breukelen GJ, Jolles J: Normative data for the animal, profession and letter naming verbal fluency tests for Dutch-speaking participants and the effects of age, education, and sex. J Int Neuropsychol Soc 2006; 12: 80–89.
23 Reitan RM: Trail Making Test: Manual for Administration, Scoring and Interpretation. Indianapolis, Indiana University Press, 1956.
24 Rey A: L’examen psychologique dans les cas d’encephalopathie traumatique. Arch Psychol 1941; 28: 286–340. 25 Folstein MF, Folstein SE, McHugh PR: ‘Mini-mental state’. A practical method for grading the cognitive state of
patients for the clinician. J Psychiatr Res 1975; 12: 189–198. 26 Nobili F, Frisoni GB, Portet F, Verhey F, Rodriguez G, Caroli A, Touchon J, Calvini P, Morbelli S, De Carli F, Guerra
UP, Van de Pol LA, Visser PJ: Brain SPECT in subtypes of mild cognitive impairment. Findings from the DESCRIPA multicenter study. J Neurol 2008; 255: 1344–1353.
27 Van de Pol LA, Verhey F, Frisoni GB, Tsolaki M, Papapostolou P, Nobili F, et al: White matter hyperintensities and medial temporal lobe atrophy in clinical subtypes of mild cognitive impairment: the DESCRIPA study. J Neurol Neurosurg Psychiatry 2009; 80: 1069–1074.
Dow
nloa
ded
by:
UB
der
LM
U M
ünch
en
129.
187.
254.
47 -
10/
20/2
014
2:36
:49
PM
19Dement Geriatr Cogn Disord 2013;36:1–19
DOI: 10.1159/000348354
Damian et al.: Single-Domain Amnestic MCI Identified by Cluster Analysis Predicts AD in the European Prospective DESCRIPA Study
www.karger.com/dem© 2013 S. Karger AG, Basel
28 Wahlund LO, Barkhof F, Fazekas F, Bronge L, Augustin M, Sjögren M, Wallin A, Ader H, Leys D, Pantoni L, Pasquier F, Erkinjuntti T, Scheltens P: A new rating scale for age-related white matter changes applicable to MRI and CT. Stroke 2001; 32: 1318–1322.
29 Scheltens P, Leys D, Barkhof F, Huglo D, Weinstein HC, Vermersch P, Kuiper M, Steinling M, Wolters EC, Valk J: Atrophy of medial temporal lobes on MRI in ‘probable’ Alzheimer’s disease and normal ageing: diagnostic value and neuropsychological correlates. J Neurol Neurosurg Psychiatry 1992; 55: 967–972.
30 Bergs S: Optimalität bei Cluster-Analysen. Experimente zur Bewertung numerischer Klassifikationsverfahren; dissertation, Universität Münster, 1981.
31 Crum RM, Anthony JC, Bassett SS, Folstein MF: Population-based norms for the mini-mental state examination by age and educational level. JAMA 1993; 18: 2386–2391.
32 Welsh KA, Butters N, Hughes JP, Mohs RC, Heyman A: Detection and staging of dementia in Alzheimer’s disease. Use of the neuropsychological measures developed for the Consortium to Establish a Registry for Alzheimer’s Disease. Arch Neurol 1992; 49: 448–452.
33 Tabert MH, Manly JJ, Liu X, Pelton GH, Rosenblum S, Jacobs M, Zamora D, Goodkind M, Bell K, Stern Y, Devanand DP: Neuropsychological prediction of conversion to Alzheimer disease in patients with mild cognitive impairment. Arch Gen Psychiatry 2006; 63: 916–924.
34 Twamley EW, Ropacki SA, Bondi MW: Neuropsychological and neuroimaging changes in preclinical Alzheimer’s disease. J Int Neuropsychol Soc 2006; 12: 707–735.
35 Palmer K, Bäckman L, Winblad B, Fratiglioni L: Mild cognitive impairment in the general population: occur-rence and progression to Alzheimer disease. Am J Geriatr Psychiatry 2008; 16: 603–611.
36 Tabert MH, Manly JJ, Liu X, Pelton GH, Rosenblum S, Jacobs M, et al: Neuropsychological prediction of conversion to Alzheimer disease in patients with mild cognitive impairment. Arch Gen Psychiatry 2006; 63: 916–924.
37 Ritchie K, Artero S, Touchon J: Classification criteria for mild cognitive impairment. Neurology 2001; 56: 37–42.
38 Ritchie LJ, Tuokko H: Patterns of cognitive decline, conversion rates, and predictive validity for 3 models of MCI. Am J Alzheimers Dis Other Demen 2010; 25: 592–603.
39 Matthews FE, Stephan BC, McKeith IG, Bond J, Brayne C: Two-year progression from mild cognitive impairment to dementia: to what extent do different definitions agree? J Am Geriatr Soc 2008; 56: 1424–1433.
40 Nordlund A, Rolstad S, Göthlin M, Edman A, Hansen S, Wallin A: Cognitive profiles of incipient dementia in the Goteborg MCI study. Dement Geriatr Cogn Disord 2010; 30: 403–410.
41 Hughes TF, Snitz BE, Ganguli M: Should mild cognitive impairment be subtyped? Curr Opin Psychiatry 2011; 24: 237–242.
42 Jack CR Jr, Knopman DS, Jagust WJ, Shaw LM, Aisen PS, Weiner MW, Petersen RC, Trojanowski JQ: Hypothetical model of dynamic biomarkers of the Alzheimer’s pathological cascade. Lancet Neurol 2010; 9: 119–128.
43 Wagner M, Wolf S, Reischies FM, Daerr M, Wolfsgruber S, Jessen F, Popp J, Maier W, Hüll M, Frölich L, Hampel H, Perneczky R, Peters O, Jahn H, Luckhaus C, Gertz H-J, Schröder J, Pantel J, Lewczuk P, Kornhuber J, Wiltfang J: Biomarker validation of a cued recall memory deficit in prodromal Alzheimer disease. Neurology 2012; 78: 379–386.
44 Sarazin M, Chauviré V, Gerardin E, Colliot O, Kinkingnéhun S, de Souza LC, Hugonot-Diener L, Garnero L, Lehéricy S, Chupin M, Dubois B: The amnestic syndrome of hippocampal type in Alzheimer’s disease: an MRI study. J Alzheimers Dis 2010; 22: 285–294.
45 Stephan B, Savva G, Brayne C, Bond J, McKeith IG, Matthews FE: Optimizing mild cognitive impairment for discriminating dementia risk in the general older population. Am J Geriatr Psychiatry 2010; 18: 662–673.
46 Gomar JJ, Bobes-Bascaran MT, Conejero-Goldberg C, Davies P, Goldberg TE: Utility of combinations of biomarkers, cognitive markers, and risk factors to predict conversion from mild cognitive impairment to Alzheimer disease in patients in the Alzheimer’s Disease Neuroimaging Initiative. Arch Gen Psychiatry 2011; 68: 961–969.
47 Vemuri P, Wiste HJ, Weigand SD, Shaw LM, Trojanowski JQ, Weiner MW, Knopman DS, Petersen RC, Jack CR: MRI and CSF biomarkers in normal, MCI, and AD subjects. Predicting future clinical change. Neurology 2009; 73: 294–301.
Dow
nloa
ded
by:
UB
der
LM
U M
ünch
en
129.
187.
254.
47 -
10/
20/2
014
2:36
:49
PM


![Galantamine for Alzheimer's disease and mild cognitive impairment … · [Intervention Review] Galantamine for Alzheimer’s disease and mild cognitive impairment Clement Loy1, Lon](https://img.pdfslide.us/doc/110x75/5f171c96f6354220cc16d6f0/galantamine-for-alzheimers-disease-and-mild-cognitive-impairment-intervention.jpg)