Embed Size (px)
Citation preview
1
Abnormal amyloid load in mild cognitive impairment: The effect of reducing the PiB-PET threshold
Rola Ismail1, MD; Peter Parbo2, MD, PhD; Kim V. Hansen1; Jeppe L. Schaldemose1, MSc;
Rikke B. Dalby3, MD, PhD; Anna Tietze4, MD, PhD; Pernille L. Kjeldsen1, MSc; Sanne Hage
la Cour5; Per Qvist5, MSc. PhD; Hanne Gottrup6, MD, PhD; Simon F. Eskildsen3, MSc, PhD;
David J. Brooks MD, DSc, FRCP1,7,8
1 Dept. of Clinical Medicine, PET-Centre, Aarhus University, Denmark
2 Dept. of Nuclear Medicine and PET Centre Aarhus University Hospital, Denmark
3 Center of Functionally Integrative Neuroscience (CFIN), Aarhus University, Denmark
4 Institute of Neuroradiology, Charite – Universitätsmedizin Berlin, Germany
5 Department of Biomedicine, Centre for Integrative Sequencing (iSEQ), Aarhus University,
Denmark
6 Dept. of Neurology, Aarhus University Hospital, Denmark
7 Institute of Neuroscience, University of Newcastle upon Tyne, UK
8 Dept. of Medicine, Imperial College London, UK
Correspondence to:
Rola Ismail, MD, PhD-student
Email: [email protected]
Tel: +45 78463332
Fax: +45 7845 6220 Department of Nuclear Medicine and PET Centre (J320)
Aarhus University Hospital

2
DK-8200 Aarhus
Palle Juul-Jensen Boulevard 165,
Denmark
Running title: The effect of 11C-PiB PET threshold changes
Keywords: Amyloid-b; mild cognitive impairment; Alzheimer’s disease; positron emission
tomography; 11C-Pittsburgh compound-B
Acknowledgement and Disclosure We thank Anne Sofie Møller Andersen for great administrative support, consultants Petya
Hykkelsbjerg, Lene Wermuth and Bengt Olof Mikael Eriksson for referring subjects with
MCI.
The study was financially supported by a grant from the Danish Council for Independent
Research and the Lundbeck Foundation.
The authors declare that there are no conflicts of interest regarding the publication of this
paper.

3
Abstract Background and purpose: In vivo detection of b-amyloid (Ab) plaques in Alzheimer’s disease
(AD) is now possible with 11C-PiB positron emission tomography (PET). Conventionally, a
cortical:cerebellar PiB uptake ratio threshold of 1.4-1.5 has been used to categorise at-risk
subjects as ‘amyloid-positive’ and ‘amyloid-negative’. It has been suggested that this
threshold is too conservative and may miss early amyloid pathology. We investigated the
relationship between conventional and lower baseline 11C-PiB PET thresholds for raised
amyloid load and the subsequent clinical and radiological progression of mild cognitive
impairment (MCI) cases longitudinally.
Methods: We serially determined the cortical amyloid load with 11C-PiB PET of 44 MCI
subjects over two years and compared findings with those for 12 healthy controls (HC) and 5
AD cases.
Results: Twenty-four subjects were classified as normal Ab load at baseline with mean
cortical PiB standard uptake value ratios (SUVR) between 1.2-1.5. Their cognitive status
remained stable over time. Three of these cases increased their amyloid load above a
threshold of 1.5 over two years. Twenty-seven ‘raised Ab’ MCI cases with baseline cortical
SUVRs above 1.5, showed deteriorating cognition. 50% of these cases converted clinically to
AD during the follow-up period.
Conclusion: Use of a PiB SUVR threshold of >1.5 to categorise subjects as having raised
amyloid missed 14.3% of MCI cases who likely had Thal stage 1 or 2 pathology and showed
a progressive Ab load increase over two years. Lowering the threshold for abnormally raised
Ab to 1.3 abolished all false negatives but resulted in 75% of HCs being falsely diagnosed as
raised amyloid subjects.

4
Introduction Alzheimer’s disease (AD) is the most common form of dementia and is characterised
clinically by progressive impairment of cognitive function and altered behaviour in fully
conscious subjects.1 AD is characterised histopathologically by the presence of cerebral
extracellular fibrillary b-amyloid protein (Ab) deposits (plaques) and tau neurofibrillary
tangles (NFT).2,3 Identifying subjects with Ab deposition as early as possible is important to
better understand the time course of AD pathologies and for the development of early
therapeutic interventions.2
Positron emission tomography (PET) imaging of Ab fibrils has now become possible in vivo
using markers such as carbon-11 labelled Pittsburgh compound-B (11C-PiB), a neutral
thioflavin T analogue which crosses the blood-brain barrier and binds to Ab plaques in post-
mortem AD brain slices.4 Correct classification of individuals as raised and normal Ab load
with amyloid PET is clinically important as it can help support or reject a clinical diagnosis of
AD. PET can also detect aggregated Ab pathology in cases at higher risk of dementia such as
subjects with mild cognitive impairment (MCI) or who carry susceptibility genes. However,
different PET signal thresholds for defining amyloid-positivity have been used across centres
depending on the camera used and analytical approach for modelling tracer uptake.5–11
The pathological distribution of senile amyloid plaques has been described and rated
according to Thal staging based on histochemical methods in 5 phases, symptomatic AD
cases usually have a phase 3-5 extent of amyloid deposition.12
Conventionally, cortical:cerebellar PiB standard uptake ratios (SUVRs) above 1.4-1.5
measured 40-60 or 60-90 minutes after intravenous tracer administration have been taken as a
threshold for defining raised Ab load in subjects. However, it has been suggested by
Villeneuve and co-workers13 that using such a high PiB SUVR threshold may categorise early

5
Thal phase 1 and 2 amyloid cases as normal and that lower, more conservative thresholds are
needed in order to detect early AD pathology. Thal and colleagues concluded that
conventional amyloid PET analyses detect only phase 3 – phase 5 stages of Ab pathology as
having raised amyloid load in preclinical, prodromal, and established AD cases.14
The aim of our longitudinal PET study was to investigate how a cohort of MCI cases
categorised as either high amyloid load or normal using both conventional and lowered
baseline PiB SUVR thresholds subsequently progressed both clinically and with regard to
changes in amyloid load over the following two years. In view of the possibility of missing
early Thal phase 1 and 2 cases, the longitudinal findings for MCI subjects with baseline
cortical PiB SUVR values lying between 1.2-1.5 were particularly monitored.
Methods
Study subjects
Forty four MCI subjects and 12 healthy controls (HC) were enrolled into our longitudinal
study, recruited from Dementia/Memory clinics in Denmark and by advertisement. MCI
subjects with a history of worsening memory complaints corroborated by an informant were
recruited for the study, as reported previously.5 Subject age ranged between 50-85 years.
Enrolled subjects had a modified Hachinski Ischemic Scale score ≤4, and a Geriatric
Depression Scale (version with 15 questions) score ≤6. None had a neurological or psychiatric
disorder, were taking drugs associated with cognitive impairment or had any contraindication
for magnetic resonance imaging (MRI). The HCs had no complaints of memory decline.

6
Five AD subjects were recruited from Dementia clinics and were diagnosed according to the
ICD-10 Alzheimer’s disease criteria15 ; they fulfilled the same inclusion and exclusion criteria
as MCI subjects.
All subjects underwent 11C-PiB PET and were assessed with a standard neuropsychological
test battery along with general cognition (Mini-Mental State Examination (MMSE), Montreal
Cognitive Assessment (MoCA) and Clinical Dementia Rating (CDR) scores).
The study was approved by the Central Denmark Region Committees on Health Research
Ethics in accordance to the Declaration of Helsinki. All subjects provided written informed
consent prior to participating.
Image processing
MRI and PET were acquired as previously described.5 High-resolution 3D T1-weighted
magnetic resonance imaging (MRI) was performed on a 3T MRI scanner (Skyra Magnetom,
Siemens, Erlangen, Germany) and used for structural coregistration of PET and to define
cerebral grey matter masks. 11C-PiB PET scans were acquired with a High Resolution
Research Tomograph (ECAT HRRT; CTI/Siemens, Knoxville, TN) using a previously
published scan protocol.5 A target dose of 400 MBq 11C-PiB was intravenously injected over
10 seconds, followed by a 10 ml saline flush. PET emission data were acquired for 50
minutes in list mode 40-90 minutes post injection.
MINC software (http://en.wikibooks.org/wiki/MINC)16 was used to segment MRI volumes
into images of cerebral grey (GM) and white (WM) matter and cerebrospinal fluid (CSF).17
GM masks were convolved with a probabilistic atlas18 to define regions of interest (ROIs) on
each individual’s GM template. The spatially normalized PiB images were summed from 60-

7
90 minutes and voxel signals were divided by the mean signal from the cerebellar GM to
generate PiB SUVR images.19 To minimize spill-in/spill-out contamination, images were not
smoothed prior to sampling activity from the composite cortical volume of interest. The
composite cortical PiB SUVR was computed as a volume-weighted average of frontal, lateral,
posterior temporal, precuneus, parietal and posterior cingulate cortical ROIs.
Statistical analysis:
Data were statistically interrogated using STATA version 14.2 (StataCorp LP, Texas, USA).
Group differences in non-imaging variables were assessed using t-tests, Pearson’s c2 tests for
categorical variables, and Wilcoxon rank-sum tests for skewed ordinal variables. P-values <
0.05 were considered statistically significant.
Determining amyloid status:
The initial threshold used in this report to assign MCI cases to raised and normal amyloid
load categories was a composite cortical:cerebellar PiB SUVR of 1.5 as the baseline ratio
distribution was bimodal with a clear separation between raised MCI and control ranges at
this ratio.5 Following this initial analysis, the effects of lowering the SUVR threshold to 1.3 to
categorise groups as raised and normal amyloid was examined. Assignment of individuals to
a raised or normal amyloid load group was then compared with their clinical and PiB PET
outcomes after longitudinal follow-up for two years.

8
Results
Demographics and cognitive ratings are presented in Table 1. Forty-four MCIs and 12 HCs
had baseline PiB PET and 24 of these subjects (16 MCIs and 8 HC; mean baseline age 66
years; range 50-79 years), had baseline composite cortical PiB SUVRs ranging between 1.2-
1.5. Of these, 15 MCIs and 6 HCs completed their 2-year follow-up. Twenty-seven MCI
cases had a raised baseline composite cortical SUVR above 1.5 and 23 of these returned for
their 2-year follow-up PiB PET and neuropsychological assessment (figure 1).
When we surveyed the low PiB-uptake cases with baseline composite cortical SUVRs below
1.5, one subject was excluded from the analysis. Although initially diagnosed as MCI, this
subject developed clinical progressive supranuclear palsy (PSP) during follow-up, which is
usually due to a tauopathy rather than Alzheimer’s pathology.
Over two years 39 MCIs in total returned for their 2-year follow-up (24.5 ± 1.8 months). An
overall 0.15 ± 0.26 increase in mean PiB SUVR was seen across all 39 MCIs over two years
(P=0.0008), detailed regional cortical SUVR values are presented in table 2. A non-significant
mean increase (0.072 ± 0.14, P=0.15) was observed over two years for the HC group, in line
with previous findings.20 Individual changes and grouping of all subjects are presented in
figure 1.
Normal PiB group (SUVRs 1.2-1.5):
Individual changes in composite cortical PiB SUVR for the normal PiB cohort (MCIs and
HCs) are shown in figure 2A. Interrogating the combined composite cortical PiB SUVRs for
these 21 normal PiB SUVR subjects with a paired t-test showed no significant mean change
over two years (P=0.08).

9
However, three subjects (3 MCIs) individually changed their PET status over two years from
a normal composite cortical PiB SUVR below 1.5 to one raised above 1.5 (Fig. 2A). At
baseline, these three subjects all fell in the SUVR range of 1.3-1.5 and, of these three, one
MCI showed an increase in SUVR of more than 20% over two years. This subject also
showed deteriorating cognitive rating over two years (MMSE 26 to 24, MoCA 20 to 19,
CDR-SOB 3 to 4.5) and was an APOE4 carrier. The other two MCI cases also showed SUVR
increases greater than the reported 7% test-retest variability (9 and 11 %),21,22 although their
cognitive scores stayed stable.
1.4-1.5 SUVR subgroup (figure 2B): Four subjects had baseline PiB SUVRs lying between 1.4-1.5 (2 MCIs and 2 HC) - the two
MCIs have been described above. Changes in the two HC SUVRs over two years were within
the range of test-retest variability.
1.3-1.4 SUVR subgroup (figure 2C): Nine subjects (8 MCIs and 1 HC), Fig. 2C, fell in a PiB SUVR range of 1.3-1.4. The majority
of their SUVRs stayed stable and changes seen were in the range of test-retest variability.
Three MCIs had SUVRs that increased by 8 % or more but only 1 MCI, reached a threshold
of 1.5 - all were cognitively stable.
Below 1.3 SUVR subgroup (figure 2D): Eight subjects fell in this subgroup and two - both HCs - showed an 8-9% increase in SUVR
over two years (Fig. 2D). All the PiB-SUVRs remained below 1.4, and the cognitive status of
the group remained stable.

10
The mean cognitive ratings (MMSE, CDR-SOB, MoCA) remained stable for the normal
cohort (MCIs and HCs) with PiB SUVRs 1.2-1.5 over the 25.8 ± 3.1 months follow-up
assessments (P=0.07 for MoCA) (Figure 3). The three subjects whose PiB SUVRs rose above
a 1.5 threshold over two years are marked with unfilled triangles in figures 2 and 3. Two of
these three had stable cognitive ratings. The third subject showed a significantly lower
cognitive score along with their significant increase in amyloid load. A fourth subject in the
1.2-1.5 PiB SUVR group also showed a significant cognitive decline but their amyloid load
remained stable. Their worsening cognition, therefore, may reflect the presence of a
pathology other than AD.
High PiB Group (PiB SUVR >1.5):
Twenty-seven of our 44 MCIs had a baseline composite cortical SUVRs raised above 1.5 and
23 (85%) of these returned for follow-up PiB PET and neuropsychological assessment after
24.3 ± 1.2 months (Table 1). Four of our 12 HCs with normal cognitive scores had PiB SUVR
values raised above 1.5 at baseline and these increased over time suggestive of the presence of
preclinical AD. This finding is in line with previous reports.20,23–25
MCI cases with raised SUVRs above 1.5 deteriorated significantly in their mean cognitive
ratings (MMSE, MoCA and CDR SOB) over two years and the mean PiB SUVR value for
this group increased significantly (mean 0.211 ± 0.323 SUVR (8.4 %); P=0.0048) - Table 1.
The ApoE status was available for all but two of our subjects. Seventeen (63%) raised PiB
subjects were carriers of the ApoE4 allele compared with only 4 (25 %) of the normal PiB
group.

11
Figure 1 shows raised PiB group SUVR values over time in comparison with the normal PiB
SUVR HC and AD cases. There was a clear SUVR separation of the raised and normal PiB
MCI subgroups when using an SUVR threshold of 1.5 for abnormality at baseline. In our AD
comparator group, none of the subjects had an SUVR below 2.0.
Converters:
Over two years, 13 (56%) of the 23 MCI subjects who returned for follow-up from the raised
PiB group converted to clinical AD diagnosed according to ICD-10 criteria.15 The changes in
PiB SUVRs for the converters are seen in Fig. 1. All but one of the AD converters, had a
baseline PiB SUVR above 2.0 and nine (69%) were ApoE4 carriers.
There was a difference in the prevalence of raised and normal PiB SUVR subjects recruited
from dementia clinics and advertisements. Seventy-four percent of the raised PiB group
subjects were recruited from Dementia clinics and only 26 % by advertisement whereas only
35 % of the normal PiB group were recruited from Dementia clinics and 65 % came via
advertisement. Sixty-nine percent of MCIs that converted to AD were recruited from a
Dementia clinic.26
Discussion
A composite cortical SUVR value of 1.5 completely separated the normal range of MCI PiB
SUVRs from the range of Alzheimer PiB SUVRs. The MCI subjects fell into two clear
groups with raised and normal PiB SUVR using a 1.5 threshold for abnormality. However,
because of the risk that some of the MCI cases with normal PiB SUVRs 1.2-1.5 may have had

12
occult Thal stage 1 or 2 amyloid we investigated the effect of lowering the threshold for
abnormally raised amyloid from 1.5 to 1.3 and followed these subjects for two years. We
reasoned that MCI cases with possible early amyloid deposition corresponding to Thal stages
1 and 2 in our normal PiB uptake subjects would show increasing PiB SUVRs, possibly rising
above our threshold of 1.5, over a two-year time period.
We examined the changes in amyloid load and cognitive ratings over two years for 15 MCI
subjects who had cortical PiB SUVRs between 1.2 and 1.5 and found that 10 of the 15 MCIs
in this group showed no significant change in their amyloid load (≤8 % increase)21 or
cognitive status. This suggests that early prodromal AD in these ten cases was not being
missed using a 1.5 SUVR threshold. However, three normal PiB uptake MCIs, who fell in the
SUVR range of 1.3-1.5, had PiB SUVRs that increased to above 1.5 over two years. Here we
may have missed early AD pathology by using an SUVR threshold of 1.5 – one of these three
MCIs had a baseline composite PiB SUVR on the borderline of 1.5. All the HCs with normal
PiB SUVRs remained stable. Overall, the use of a PiB SUVR threshold of 1.5 led to 85.7 % -
(18 of 21) of the low PiB subjects being assigned a ‘correct’ amyloid normal diagnosis based
on a two-year follow-up findings.13 All the 27 MCI cases who were categorised as amyloid
positive with PiB SUVRs above 1.5 continued to show raised amyloid status and retained
their diagnosis of prodromal Alzheimer’s disease.
Three other cases with normal amyloid levels (2 MCIs and 1 HC) increased their cortical
SUVRs over two years to a greater extent than could be explained by test-retest variability
(>8 %),21,22 though none reached a PiB SUVR threshold of 1.5 (fig. 2A). It is possible that
with a longer follow-up these cases would have reached our 1.5 threshold and have been
recategorized as raised PiB SUVR and that they represent baseline Thal 1 or 2 phases.13

13
Against this conclusion, however, was the finding that their cognitive status did not
deteriorate.
Raising the threshold to above 1.5 – say 1.6-1.8 – does not improve specificity by reducing
false positives, but sensitivity decreases as the risk of missing raised amyloid cases increases,
in addition to categorising one clinical AD subject as normal (figure 1).
Dropping the PiB threshold from 1.5 to 1.4 eliminated two of the three potential false
negatives, but led to a further two HCs being scored as having raised amyloid. This would
lead to a total of 6 out of our 12 HCs (50 %) becoming categorized as having raised PiB, a
higher prevalence than reported by other series.20,23–25
Dropping the PiB SUVR threshold further to 1.3 eliminated all the potential false negatives in
our low PiB SUVR group, but 9 out of the 12 of the HCs (75%) now became scored as having
raised amyloid. Seven (58 %) of the normal PiB SUVR MCIs also became incorrectly
assigned as having raised amyloid based on follow-up clinical outcome. What is clear,
however, is that baseline assignment of MCI cases to raised or normal amyloid categories
becomes questionable if their PiB SUVR values lie close to a threshold value of 1.5 and both
imaging and clinical follow-up is required in these borderline cases.6,27 This conclusion of
course applies to findings using an HRRT PET camera. The optimal threshold for dividing
raised and normal PiB SUVRs is likely to be lower - say 1.4 – for centres using a lower
resolution PET-CT.
In this study we focussed on older MCI subjects. A PiB SUVR threshold of 1.5 to delineate
raised amyloid deposition may be too high when dealing with younger subjects. We also used
a time window of 60-90 minutes rather than 40-60 minutes as used in some centres. A 60-90
minute window will lead to a higher threshold for separating raised and normal PiB SUVRs
as the SUVR curves for PiB are still rising at 40 minutes.28 Additionally, PiB uptake by AD

14
cases is more prolonged than in HCs and plateaus later for subjects with significant PiB
uptake.28 The choice of time window thus is dependent on several parameters including the
scanner type, the injected dose and the population of interest.
The raised PiB MCI group showed a significant deterioration in their mean cognitive scores
over two years. Conversion to AD over time did not correlate with levels of amyloid load as
reflected by cortical SUVRs.29 The majority (two thirds) of subjects in the raised PiB group
were carriers of the ApoE4 allele as were 70% of the converters to AD, whereas only 25% of
the normal PiB MCI subjects were ApoE4 carriers. One of our subjects clinically converted to
AD with a PiB SUVR of 1.6 at baseline, which is low compared with all our other converters
and showed no SUVR change at follow-up. This case was a carrier of the ApoE4 gene.
Conversion of MCI to AD is based on clinical criteria, such as loss of independence and
progressing cognitive deficits.1,30 Conversion is, therefore, an individual judgement and this
could have led to a questionable AD classification here. Alternatively, the subject may have
had other pathology such as a tauopathy.
The raised PiB SUVR group showed a mean increase in PiB SUVR over time. Some of these
individuals showed decreases in PiB SUVR but these were all within the range of test-retest
variability (<7 %) with one exception where a decrease of 12 % was seen. The cerebellar
reference region activity for this subject remained stable over time.
A limitation of our study is the absence of partial volume corrections for atrophy effects on
PIB-SUVRs. Atrophy may have acted to lower PiB SUVRs by a few percent. No correlation
was seen between the changes in PiB SUVR and changes in composite cortical ROI volume.
Our use of a high resolution scanner will also have helped to minimise effects of atrophy over
time.31

15
Our longitudinal PiB PET study on MCI cases suggests that, while the use of a current
cortical SUVR threshold of 1.5 to define raised amyloid may lead to occasional false
negatives, over 80% of cases are correctly assigned to raised or normal amyloid categories. A
lowering of the threshold eliminated false negatives but resulted in a high percentage of false
positive cases and reduced the specificity of identifying true negatives. Where cases have PiB
SUVRs close to the cut off level of 1.4-1.5 then follow-up is required to make a confident
assignment to an amyloid positive or negative status. Overall setting an SUVR threshold is a
trade-off between eliminating false negatives generated and generating false positives by
lowering the threshold in our series.

16
References 1. Cummings JL, Wood AJJ. Alzheimer’s disease. N Engl J Med 2004;351:56–67.
2. Nordberg A. PET imaging of amyloid in Alzheimer’s disease. Lancet Neurol
2004;3:519–27.
3. Braak H, Braak E. Neuropathological stageing of Alzheimer-related changes. Acta
Neuropathol 1991;82:239–59.
4. Klunk WE, Engler H, Nordberg A, et al. Imaging brain amyloid in Alzheimer’s disease
with Pittsburgh Compound-B. Ann Neurol 2004;55:306–19.
5. Parbo P, Ismail R, Hansen K V., et al. Brain inflammation accompanies amyloid in the
majority of mild cognitive impairment cases due to Alzheimer’s disease. Brain
2017;140:2002–11.
6. Jack CR, Wiste HJ, Weigand SD, et al. Defining imaging biomarker cut points for
brain aging and Alzheimer’s disease. Alzheimer’s Dement 2017;13:205–16.
7. Rowe CC, Ellis KA, Rimajova M, et al. Amyloid imaging results from the Australian
Imaging, Biomarkers and Lifestyle (AIBL) study of aging. Neurobiol Aging
2010;31:1275–83.
8. Lopresti BJ, Klunk WE, Mathis CA, et al. Simplified quantification of Pittsburgh
Compound B amyloid imaging PET studies: a comparative analysis. J Nucl Med
2005;46:1959–72.
9. Pike KE, Savage G, Villemagne VL, et al. b-amyloid imaging and memory in non-
demented individuals: evidence for preclinical Alzheimer’s disease. Brain
2007;130:2837–44.
10. Jack CR, Lowe VJ, Senjem ML, et al. 11C PiB and structural MRI provide
complementary information in imaging of Alzheimer’s disease and amnestic mild
17
cognitive impairment. Brain 2008;13:665–80.
11. Wiley CA, Lopresti BJ, Venneti S, et al. Carbon 11-labeled Pittsburgh compound B
and carbon 11-labeled (R)-PK11195 positron emission tomographic imaging in
Alzheimer disease. Arch Neurol 2009;66:60–7.
12. Thal DR, Rüb U, Orantes M, et al. Phases of Ab-deposition in the human brain and its
relevance for the development of AD. Neurology 2002;58:1791–800.
13. Villeneuve S, Rabinovici GD, Cohn-Sheehy BI, et al. Existing Pittsburgh Compound-B
positron emission tomography thresholds are too high: statistical and pathological
evaluation. Brain 2015;138:2020–33.
14. Thal DR, Beach TG, Zanette M, et al. [18F]flutemetamol amyloid positron emission
tomography in preclinical and symptomatic Alzheimer’s disease: Specific detection of
advanced phases of amyloid-β pathology. Alzheimer’s Dement 2015;11:975–85.
15. World Health Organization. The ICD-10 Classification of Mental and Behavioural
Disorders. Diagnostic Criteria for Research. Geneva, Switzerland: World Health
Organization; 1993.
16. Vincent RD, Neelin P, Khalili-Mahani N, et al. MINC 2.0: A flexible format for multi-
modal images. Front Neuroinform 2016;10:35.
17. Zijdenbos AP, Dawant BM, Margolin RA, Palmer AC. Morphometric analysis of white
matter lesions in MR images: method and validation. IEEE Trans Med Imaging
1994;13:716–24.
18. Hammers A, Allom R, Koepp MJ, et al. Three-dimensional maximum probability atlas
of the human brain, with particular reference to the temporal lobe. Hum Brain Mapp
2003;19:224–47.
19. Edison P, Archer HA, Hinz R, et al. Amyloid, hypometabolism, and cognition in

18
Alzheimer disease: an [11C]PIB and [18F]FDG PET study. Neurology 2007;68:501–8.
20. Villemagne VL, Pike KE, Chételat G, et al. Longitudinal assessment of Aβ and
cognition in aging and Alzheimer disease. Ann Neurol 2011;69:181–92.
21. Engler H, Forsberg A, Almkvist O, et al. Two-year follow-up of amyloid deposition in
patients with Alzheimer’s disease. Brain 2006;129:2856–66.
22. Lopresti BJ, Klunk WE, Mathis CA, et al. Simplified quantification of Pittsburgh
Compound B amyloid imaging PET studies: a comparative analysis. J Nucl Med
2005;46:1959–72.
23. Kemppainen NM, Scheinin NM, Koivunen J, et al. Five-year follow-up of 11C-PIB
uptake in Alzheimer’s disease and MCI. Eur J Nucl Med Mol Imaging 2014;41:283–9.
24. Jack CR, Lowe VJ, Weigand SD, et al. Serial PIB and MRI in normal, mild cognitive
impairment and Alzheimer’s disease: implications for sequence of pathological events
in Alzheimer’s disease. Brain 2009;132:1355–65.
25. Scheinin NM, Aalto S, Koikkalainen J, et al. Follow-up of [11C]PIB uptake and brain
volume in patients with alzheimer disease and controls. Neurology 2009;73:1186–92.
26. Farias ST, Mungas D, Reed BR, Harvey D, DeCarli C. Progression of mild cognitive
impairment to dementia in clinic- vs community-based cohorts. Arch Neurol
2009;66:1151–7.
27. Fan Z, Brooks DJ, Okello A, Edison P. An early and late peak in microglial activation
in Alzheimer’s disease trajectory. Brain 2017;140:792-803.
28. McNamee RL, Yee S-H, Price JC, et al. Consideration of optimal time window for
Pittsburgh compound B PET summed uptake measurements. J Nucl Med 2009;50:348–
55.
29. Kemppainen N, Johansson J, Teuho J, et al. Brain amyloid load and its associations

19
with cognition and vascular risk factors in FINGER Study. Neurology 2018;90:e206–
13.
30. Tarawneh R, Holtzman DM. The clinical problem of symptomatic Alzheimer disease
and mild cognitive impairment. Cold Spring Harb Perspect Med 2012;2:1–16.
31. Mormino EC, Brandel MG, Madison CM, et al. Not quite PIB-positive, not quite PIB-
negative: Slight PIB elevations in elderly normal control subjects are biologically
relevant. Neuroimage 2012;59:1152–60.

20
Table 1: Participant characterisation MCI – normal PiB P value MCI – raised PiB P value Healthy control P value MCI (total) P value AD
Baseline
(n=17)
Follow up
(n=16)
Baseline
(n=27)
Follow up
(n=23)
Baseline
(n=12)
Follow up
(n=10)
Baseline
(n=44)
Follow up
(n=39)
Baseline
(n=5)
Age, years 66.2 ± 8.3 68.3 ± 8.5 73.3 ± 6.1 75.1 ± 5.9 68.8 ± 5.2 72.5 ± 4.4 70.6 ± 7.8 72.3 ± 7.8 96.8 ± 9.9
Males/females 9/8 9/7 9/18 7/16 7/12 5/10 26/18 23/16 3/2
Education, years 11.9 ± 3.5 12.5 ± 3.0 13.3 ± 2.5 12.3 ± 3.2 11.1 ± 2.7
MMSE 27.8 ± 1.8 26.5 ± 2.5 0.084 26.8 ± 1.8 24.3 ± 3.8 0.0008* 28.8 ± 1.2 28.2 ± 1.3 0.21 27.2 ± 1.8 25.2 ± 3.4 0.0002* 23.0 ± 5.4
CDR sum-of-boxes 1.0 [0.5; 2.5] 1.25 [0.0; 7.0] 0.099 3.5 [0.0;4.0] 5.5 [0.0;10.0] <0.0001* 0.0 [0.0;
0.0]
0.0 [0.0;
1.0]
0.5 1.5 [0.0; 4.0] 1.5 [0.0;
10.0]
<0.0001* 3.5 [2.5; 9.0]
MoCA 25.7 ± 2.8a 24.8 ± 3.7
0.040* 23.6 ± 3.8 21.4 ± 4.8
0.01* 26.5 ± 1.6
a 25.3 ± 2.8 0.33 24.4 ± 3.2
a 22.8 ± 4.7
0.0024* 18.2 ± 5.7
PiB dose, MBq 410 ± 24.5 418 ± 14.5 0.35 367 ± 78 390 ± 56 0.40 422 ± 27.5 401 ± 30.3 0.09 384 ± 66 401 ± 46 0.3 416 ± 18
PiB SUVR 1.325 ± 0.07 1.4 ± 0.15 0.013* 2.53 ± 0.53 2.71 ± 0.51 0.0048* 1.49 ± 0.32 1.60 ± 0.44 0.15 2.06 ± 0.73 2.17 ± 0.76 0.0008* 3.14 ± 0.88
Apoe E4, n (%) 4 (24 %)b
4 (25 %)b
17 (62 %)b
16 (69 %)b
3 (27 %)b
2 (22 %)b
21 (50 %)c
20 (51 %) 1 (30 %)a
Follow up (month) 24.8 ± 2.5 24.3 ± 1.2 26.1 ± 3.8 24.5 ± 1.8
Table 1: Participant characterisation. Normal and raised PiB defined as below and above 1.5 SUVR, respectively. Normally distributed data
are presented in mean ± SD. Not normally distributed data are presented in median and [range]. n = number; MMSE = minimental state
examination; CDR = clinical dementia rating; MoCA = Montreal Cognitive Assessment. P-values of paired tests between baseline and
follow up. * significant P values, a2 missing values, b1 missing value, c 6 missing values.

21
Table 2: Regional SUVR values
Normal PiB group High PiB group
Baseline Follow-up Baseline Follow-up
N 21 21 23 23
Frontal cortex 1.35 ± 0.069 1.42 ± 0.17 2.53 ± 0.58 2.74 ± 0.52*
Temporal cortex 1.17 ± 0.087 1.20 ± 0.10 1.96 ±0.39 2.13 ± 0.42*
Parietal cortex 1.41 ± 0.096 1.46 ± 0.16 2.51 ± 0.50 2.72 ± 0.48*
Anterior cingulate 1.41 ± 0.21 1.50 ± 0.11 2.70 ± 0.63 2.94 ± 0.60*
Posterior cingulate 1.46 ± 0.12 1.47 ± 0.19 2.78 ± 0.63 3.03 ± 0.60*
Precuneus 1.35± 0.089 1.42 ± 0.16 2.89 ± 0.69 3.14 ± 0.67*
Composite 1.33 ± 0.081 1.37 ± 0.14 2.50 ± 0.54 2.71 ± 0.51*
Table 2: Regional and composite PiB SUVR values in normal and high PiB group. N=
number. The baseline to follow up time is 2 years. Data presented in mean±SD. *Statistically
significant difference from baseline by two-sample t-test (p<0.05).

22
Figure 1:
Figure 1: Scatterplots showing individual baseline and follow-up PiB SUVR values in the HC, MCI, and AD groups. The time-range
between baseline and follow is 2 years. Blue lines and dots indicate normal-PiB cases. Red lines and dots indicate raised PiB cases. Purple
dashed line in the MCI group indicates one progressive supranuclear palsy subject. Black lines in the MCI group indicate the converters to
AD.
23
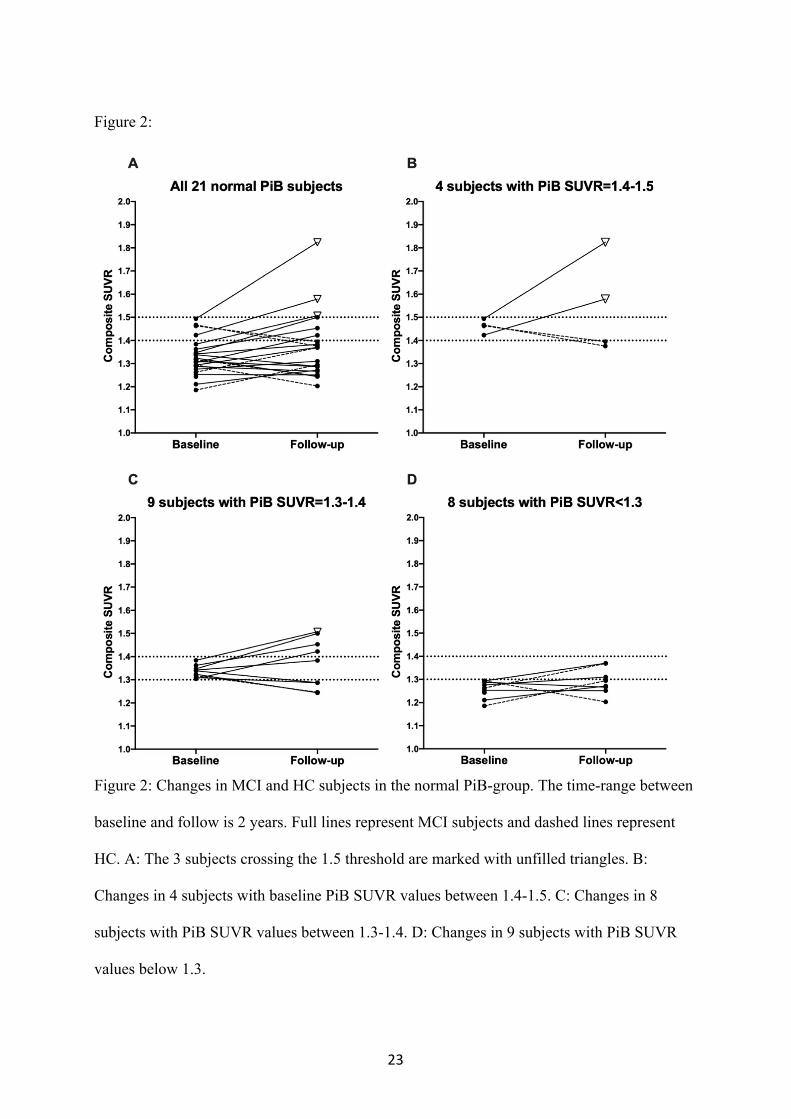
Figure 2:
Figure 2: Changes in MCI and HC subjects in the normal PiB-group. The time-range between
baseline and follow is 2 years. Full lines represent MCI subjects and dashed lines represent
HC. A: The 3 subjects crossing the 1.5 threshold are marked with unfilled triangles. B:
Changes in 4 subjects with baseline PiB SUVR values between 1.4-1.5. C: Changes in 8
subjects with PiB SUVR values between 1.3-1.4. D: Changes in 9 subjects with PiB SUVR
values below 1.3.

24
Figure 3:
Figure 3: Cognitive scores of MCI and HC subjects in the raised PiB- (circles) and normal PiB-group (triangles). Unfilled circles indicate
the AD-converters amongst the raised PiB-group. Unfilled triangles indicate the three subjects who crosses the 1.5 threshold. Time-range
between baseline and follow-up is 2 years. MoCA = Montreal Cognitive Assessment; CDR-SOB = clinical dementia rating – sum of boxes;
MMSE = minimental state examination.

25


![Colloid-amyloid Bodies in PUVA-treated Human Psoriatic ...Amyloid of primary cutaneous amyloidoses such as lichen amyloidosus [5, 17], macular amyloidosis [6] and amyloid dep- osition](https://img.pdfslide.us/doc/110x75/5e62f6a65098527daa05e73b/colloid-amyloid-bodies-in-puva-treated-human-psoriatic-amyloid-of-primary-cutaneous.jpg)