Embed Size (px)
Citation preview

SINGAPORE REPORTCONTRUCTION MARKET
QUARTERLY UPDATE
ISSUE NO. 73 | MARCH 2016
PINES HOTEL PROJECT FEATURE
|SINGAPORE REPORT
MARCH 2016
1 |
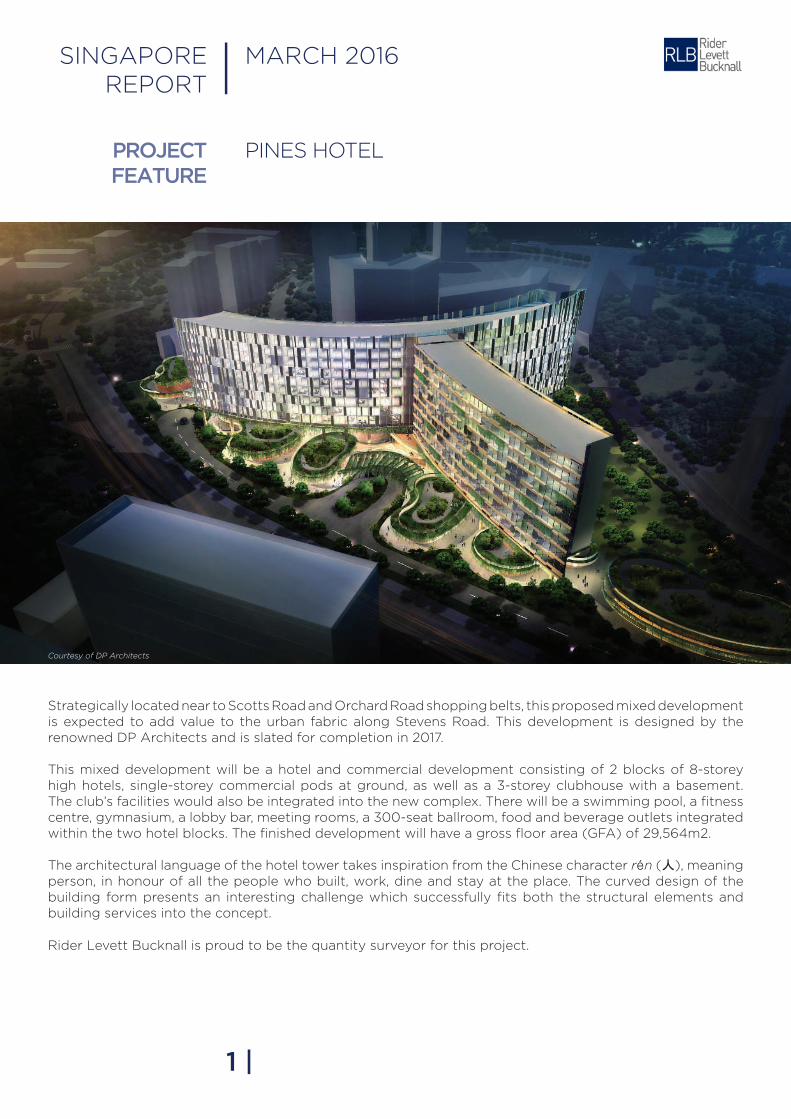
Courtesy of DP Architects
Strategically located near to Scotts Road and Orchard Road shopping belts, this proposed mixed development is expected to add value to the urban fabric along Stevens Road. This development is designed by the renowned DP Architects and is slated for completion in 2017.
This mixed development will be a hotel and commercial development consisting of 2 blocks of 8-storey high hotels, single-storey commercial pods at ground, as well as a 3-storey clubhouse with a basement. The club’s facilities would also be integrated into the new complex. There will be a swimming pool, a fitness centre, gymnasium, a lobby bar, meeting rooms, a 300-seat ballroom, food and beverage outlets integrated within the two hotel blocks. The finished development will have a gross floor area (GFA) of 29,564m2.
The architectural language of the hotel tower takes inspiration from the Chinese character rén (人), meaning person, in honour of all the people who built, work, dine and stay at the place. The curved design of the building form presents an interesting challenge which successfully fits both the structural elements and building services into the concept.
Rider Levett Bucknall is proud to be the quantity surveyor for this project.
MARKET TRENDS
SINGAPORE ECONOMY
SINGAPORE REPORT | MARCH 2016
2 |
For the whole of 2015, gross domestic product (GDP) grew a modest 2.0%, moderating from the 3.3% expansion in 2014. This is the weakest rate of growth since 2009. The Singapore economy grew by 1.8% on a year-on-year (y-o-y) basis in 4Q 2015, unchanged from the previous quarter.
With the persistently low commodity prices, the upturn of the US dollar and the weak global demand conditions, the Ministry of Trade and Industry (MTI) expects Singapore manufacturers to face further pressures in 2016 especially as the slow Chinese economy demands lesser imports. The global economic outlook the year ahead is expected to stay volatile. MTI maintains Singapore GDP growth forecast within the range of 1.0% to 3.0% for the year.
According to the Monetary Authority of Singapore (MAS), CPI-All Items inflation eased to -0.8% in February from -0.6% in January this year due to a steeper decline of private road transport and accommodation costs. The MAS Core Inflation, which excludes the costs of accommodation and private road transport, rose to 0.5% in February this year from 0.4% a month ago due to higher food inflation. External factors of inflation are likely to remain muted due to ample supply buffers in the major commodity markets.
However with the anticipated increase in the supply of Certificate of Entitlement (COEs) and newly-completed housing units this year, MAS expects car prices and housing rentals to dampen overall inflationary pressures. In addition, in
a recent survey by the Economist Intelligent Unit (EIU) found Singapore to be the most expensive city for the third consecutive year due to a combination of price inflation and currency fluctuations.
Annual average unemployment rate in 2015 fell marginally to 1.9% from 2.0% in 2014. There has been slower local workforce growth and tightened supply of foreign manpower as the economy slackened. Overall redundancy have been rising steadily since 2010 and rose to 15,580 in 2015.
Although there have been improvements, Singapore’s labour productivity remained poor as value-added per worker dipped 0.1% for 2015, better than a 0.5% fall in 2014. For 2016, MOM expects a modest labour demand which will be in line with the projected GDP growth.
In view of the continuation of the slowdown in global trade growth, as well as the structural challenges of an ageing workforce, rising redundancies, slowing growth and lower investment returns, the government announced a prudent Budget in March. While past Budgets had focused on strengthening the social fabric of Singapore’s society, Budget 2016’s main focus is to ensure that the country’s future economic position remains healthy. The government is committed to strengthen employment support to help displaced locals re-enter employment as well as reduce the over-reliance on foreign manpower on top of continued efforts to raise the productivity levels.
SINGAPORE REPORT | MARCH 2016
for March 2016 after China steel mills began restocking as a seasonal pick up in demand combined with surging real estate prices in its top tier cities, which sent a wave of positive sentiment through the steel industry, according to a recent Bloomberg report. While the global outlook for steel remains mixed, the World Steel Association (WSA) anticipates a recovery for steel demand from the developing economies amid China’s economic stabilisation before the end of 2016, Bloomberg further reported.
The levy increases for Work Permit holders and S-Pass holders in the construction sector will resume on 1 July 2016. Hiring for the construction sector is expected to be further restrained this year as sluggishness in private sector construction demand remains. As such, BCA has assured that there will be a sustained pipeline of projects and the public sector will take the lead in driving productivity improvements.
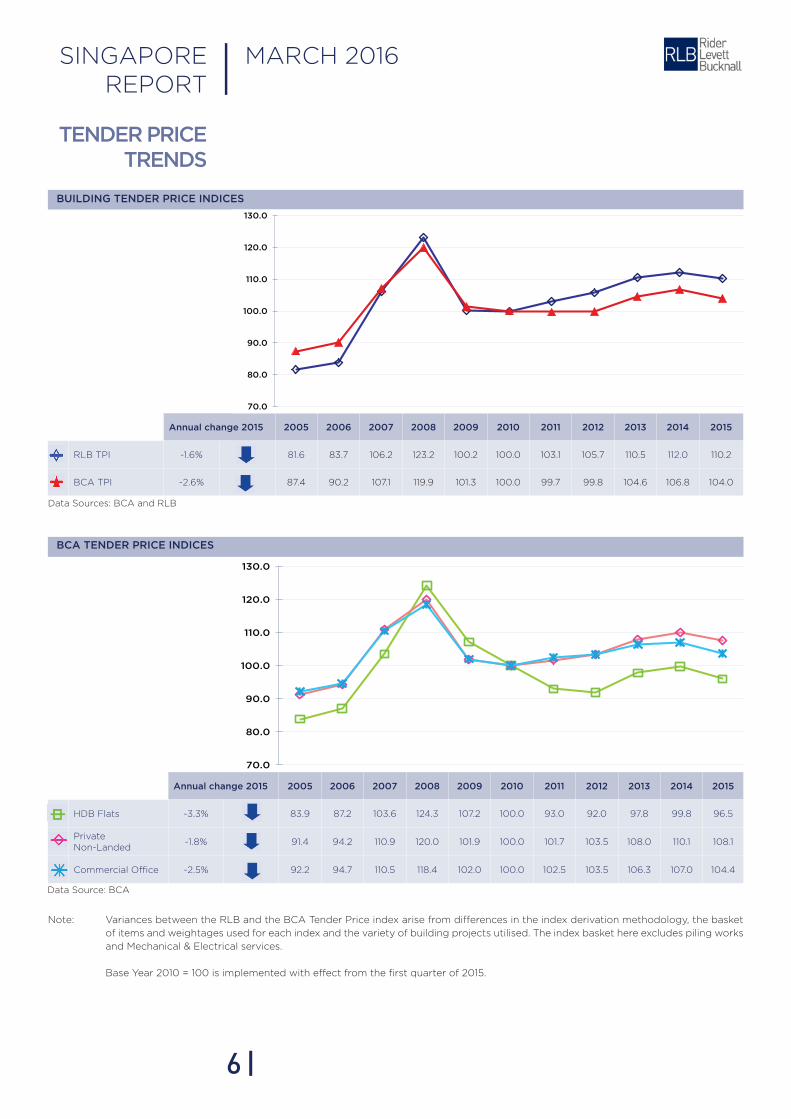
BCA’s Tender Price Index (TPI) registered its fifth consecutive quarter of year-on-year decline for 4Q 2015 as it fell 3.9% from 4Q 2014. On an annual basis, the index fell 2.6% in 2015. Similarly, RLB TPI also came down by 1.6% in 2015 from the previous year.
Industry sentiments remain sombre and construction tender prices are projected to weaken further in 1H 2016. Tenders are expected to consolidate and profit margins are anticipated to shrink in view of the continued intense local market competition and slowing construction demand.
The construction sector expanded by 4.9% in 4Q 2015, faster than the 3.0% growth in the previous quarter. On an annualised basis, less private industrial and residential building activity had caused growth in the construction sector to moderate to 2.5% from 3.5% in 2014.
Overall construction demand fell short of expectations for 2015. Due to the deferment of some major public contracts, particularly from the civil engineering sub-sector, public sector construction demand fell 31.0% to S$13 billion. Private sector construction demand for the whole of 2015 moderated from S$20 billion in 2014 to S$14 billion, even though private sector demand for civil engineering works rose by 16.0% to S$1.7 billion.
The Building and Construction Authority (BCA) forecasts a construction demand of between S$27 billion and S$34 billion for 2016. About 65% of the construction contracts are expected to come from the public sector. This would be the highest proportion of construction demand allocation from the sector since 2002. For 2017 and 2018, BCA projects the average construction demand to be sustained at between S$26 billion and S$35 billion with around 60% expected to come from public sector projects.
According to BCA, Grade 40 pump ready-mixed concrete decreased by 9.7% to a preliminary price of S$90.80/m3 from a year ago. Steel bar prices averaged S$449/tonne in 2H 2015, before falling to a low of S$392/tonne in January 2016. Steel bar prices bounced back to a preliminary price of S$446/tonne
3 |
MARKET TRENDS
SINGAPORE CONSTRUCTION MARKET
4 |
SINGAPORE REPORT | MARCH 2016
The private residential property market continued its downward trend in 4Q 2015 from the preceding quarter. Price decline was observed in Core Central Region (CCR) and Rest of Central Region (RCR) while non-landed properties in Outside Central Region (OCR) remained unchanged. For the whole of 2015, prices in CCR, RCR and OCR declined by 2.5%, 4.3% and 3.7% respectively, Urban Redevelopment Authority (URA) data showed.
The leasing market is also weak. Statistics reflect growing difficulties in securing tenants amid stiff competition among landlords. Across all segments of the private residential property market, rentals for non-landed properties in CCR, RCR and OCR declined by 3.8%, 4.9% and 5.6% respectively for the whole of 2015.
The recent hikes in the Singapore Interbank Offered Rate (SIBOR) rates have been pressuring mortgage rates to escalate and it is expected to dissuade homebuyers in their purchase decisions. Combined with falling rental rates, the rising mortgage rates are most likely to affect any homeowners who rely on rental income to finance their mortgage.
The residential property market is reportedly oversupplied, based on URA data. Vacancies of private homes at 7.1% equate to more than 21,000 empty units at the end of September 2015. Gauging from the expected completion dates reported by developers, there will be 26,467 units (including ECs) and another 17,234 units (including ECs) to be completed in 2016 and 2017 respectively, thus putting more pressure on the property market.
The macroeconomic growth, rising mortgage rates and the slide in residential home prices did not manage to persuade the government to lift the cooling measures in its Budget 2016 announcement. The government recently reiterated that it is still “too early” to remove these property curbs, therefore the ABSD (Additional Buyer’s Stamp Duty) and qualifying certificate rules shall remain.
The retail and office real estate segments have started to see big name retailers scale back their presence and big companies consolidating their office spaces in 2015. As at the end of 4Q 2015, there was a total supply of about 993,000m2 GFA of office space in the pipeline. Prices of office space decreased by 0.1% in the whole of 2015, the same as the preceding quarter and rentals fell by 6.5%. Island-wide office vacancy rates inched slightly down to 9.5% in the final quarter of the year as compared to 9.6% in 3Q 2015. Vacancy rates are expected to rise in 2016. Retail real estate prices and rental prices of retail space declined by 0.8% and 4.1% respectively for the whole of 2015. And retail space vacancies rose to 7.2% at the end of 4Q 2015 from 7.0% in 3Q 2015.
According to a recent Bloomberg report in January 2016, overall private home values dropped for the consecutive ninth quarter in 4Q 2015, posting the longest losing streak in 17 years. Bloomberg also referred to a recent market survey, which indicated Singapore, even after the slide in prices, as Asia’s second-most expensive luxury residential property market after Hong Kong.
MARKET TRENDS
SINGAPORE PROPERTY MARKET
5 |
The global economic activity was sluggish in 2015. Oil and commodity price movements remained volatile while China’s re-calibrating economy has put downward pressure on other global markets. The International Monetary Fund (IMF) estimates global growth at 3.2% in 2016 and 3.5% in 2017.
The US economy grew 2.4% for the whole of 2015, matching 2014’s performance. In 4Q 2015, the GDP expanded 1.4% on the back of stronger domestic spending but is still slower than the 2.0% growth in 3Q 2015. Inflation failed to meet the central bank’s target of 2.0%. Inflation had averaged 0.12% for 2015, only hiking to 1.4% in January 2016 and dropping to 1.0% in February 2016. Although business investments and overseas demand was tepid, unemployment rate improved to an eight-year low of 4.9% y-o-y in February 2016 falling from 5.5% y-o-y in February 2015.
The Fed Bank left the benchmark interest rate unchanged at 0.25%-0.5% range in the policy meetings at January and March this year. The central bank is expected to remain cautious about any further rate hikes for the rest of the year. For overall 2016, the central bank dimmed the economic growth outlook from 2.4% to 2.2% while the inflation forecast was revised from 1.6% to 1.2%.
Eurozone’s economic recovery crawled in 4Q 2015 as it recorded a meagre growth of 0.3%, the same as the previous quarter. The eurozone grew 1.5% y-o-y for the whole of 2015. On top of the gloomy economic climate in Europe, the European Union (EU) is currently fractured with the possibility of a ‘Brexit’ situation and continues to be plagued by the refugee crisis.
The sombre eurozone performance was burdened by Italy’s weak 0.1% expansion in 4Q 2015 as well as the Greek economy falling back into recession. Greece’s economy contracted 0.6% in 4Q 2015, following a 1.4% contraction in 3Q 2015. The European Central Bank (ECB) is expected to start its quantitative easing (QE) programme in March 2016 and would continue beyond September 2016. The ECB raised eurozone growth forecast for 2016 to 1.5%, up from 1.0% previously.
China’s GDP posted its weakest growth in 25 years for 2015. Its economy grew 6.9% y-o-y. The rebalancing of its economic activity away from investment and manufacturing toward consumption and services has affected other economies through its trade channels. As China’s economy slid, it created serious headwinds for countries with significant exposure to raw materials such as Australia and Brazil. Germany, whose exports of machinery and automobiles to China acts as a counterbalance to slow growth in Europe, is also affected.
In China’s real estate market, property investment growth eased to just 1.0% in 2015, the weakest in nearly seven years as developers slowed new construction due to oversupply, particularly in first-tier cities. Growth picked up, however to 3.0% in the first two months of 2016, after govt stimulus measures was put in place.
India’s economic growth outpaced China in fiscal year 2014-15 with a 7.5% growth y-o-y. Despite slacking global growth prospects, the IMF forecasts Indian GDP to perform higher than China’s by 1.3 percentage points on the back of private consumption in 2016-17. IMF, however, also cautioned India that sustaining growth would require labour reforms as well as reducing infrastructure bottlenecks.
SINGAPORE REPORT | MARCH 2016
MARKET TRENDS
GLOBAL ECONOMY
70.0
80.0
90.0
100.0
110.0
120.0
130.0
6 |
Data Sources: BCA and RLB
Variances between the RLB and the BCA Tender Price index arise from differences in the index derivation methodology, the basket
of items and weightages used for each index and the variety of building projects utilised. The index basket here excludes piling works
and Mechanical & Electrical services.
Base Year 2010 = 100 is implemented with effect from the first quarter of 2015.
Note:
Data Source: BCA
Annual change 2015 2005 2006 2007 2008 2009 2010 2011 2012 2013 2014 2015
RLB TPI -1.6% 81.6 83.7 106.2 123.2 100.2 100.0 103.1 105.7 110.5 112.0 110.2
BCA TPI -2.6% 87.4 90.2 107.1 119.9 101.3 100.0 99.7 99.8 104.6 106.8 104.0
BUILDING TENDER PRICE INDICES
Annual change 2015 2005 2006 2007 2008 2009 2010 2011 2012 2013 2014 2015
HDB Flats -3.3% 83.9 87.2 103.6 124.3 107.2 100.0 93.0 92.0 97.8 99.8 96.5
PrivateNon-Landed
-1.8% 91.4 94.2 110.9 120.0 101.9 100.0 101.7 103.5 108.0 110.1 108.1
Commercial Office -2.5% 92.2 94.7 110.5 118.4 102.0 100.0 102.5 103.5 106.3 107.0 104.4
MARCH 2016|SINGAPORE REPORT
70.0
80.0
90.0
100.0
110.0
120.0
130.0
TENDER PRICE TRENDS
BCA TENDER PRICE INDICES
350.0
400.0
450.0
500.0
550.0
600.0
650.0
1,450
1,500
1,550
1,600
1,650
1,700
1,750
1,800
1,850
3,000
4,000
5,000
6,000
7,000
8,000
9,000
10.0
20.0
30.0
40.0
50.0
60.0
70.0
80.0
CRUDE OIL PRICES
Data Source: BCA
Data Source: IMF
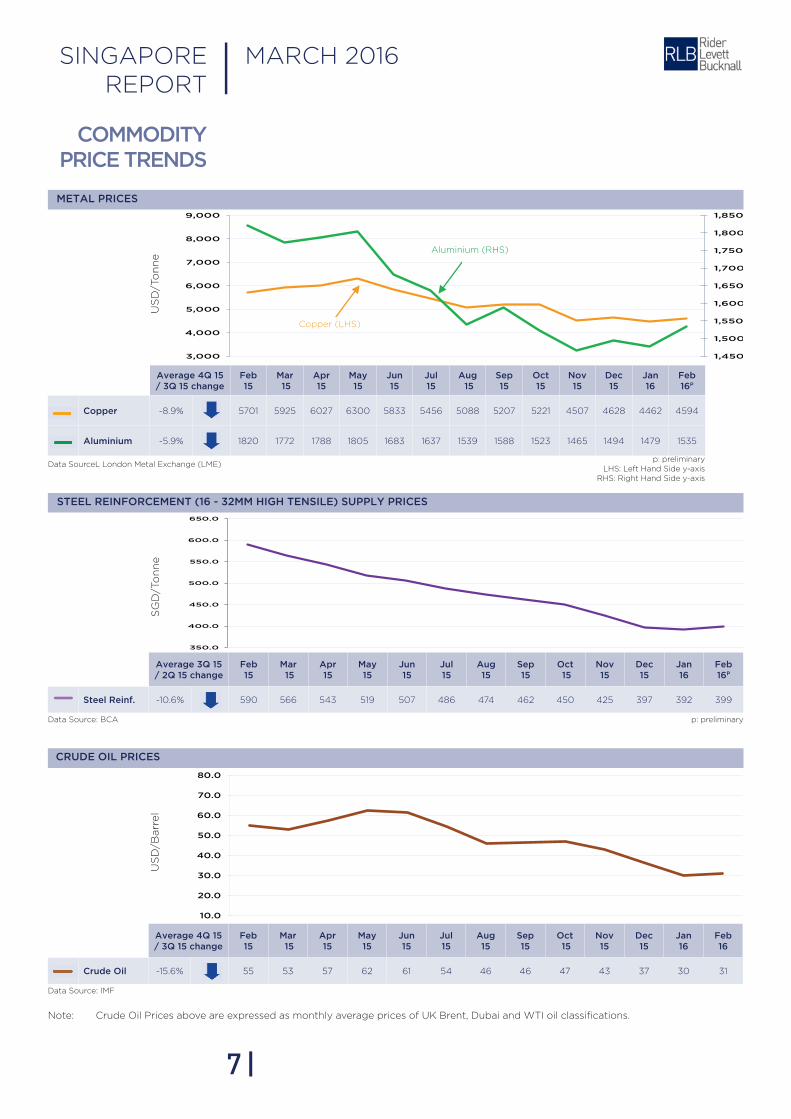
Note: Crude Oil Prices above are expressed as monthly average prices of UK Brent, Dubai and WTI oil classifications.
7 |
STEEL REINFORCEMENT (16 - 32MM HIGH TENSILE) SUPPLY PRICES
METAL PRICES
Average 4Q 15 / 3Q 15 change
Feb 15
Mar 15
Apr 15
May 15
Jun 15
Jul 15
Aug 15
Sep 15
Oct 15
Nov 15
Dec 15
Jan 16
Feb 16
Crude Oil -15.6% 55 53 57 62 61 54 46 46 47 43 37 30 31
US
D/B
arr
el
SG
D/T
on
ne
US
D/T
on
ne
p: preliminaryLHS: Left Hand Side y-axis
RHS: Right Hand Side y-axis
SINGAPORE REPORT | MARCH 2016
COMMODITY PRICE TRENDS
Average 3Q 15 / 2Q 15 change
Feb 15
Mar 15
Apr 15
May 15
Jun 15
Jul 15
Aug 15
Sep 15
Oct 15
Nov 15
Dec 15
Jan 16
Feb 16P
Steel Reinf. -10.6% 590 566 543 519 507 486 474 462 450 425 397 392 399
Average 4Q 15 / 3Q 15 change
Feb 15
Mar 15
Apr 15
May 15
Jun 15
Jul15
Aug 15
Sep 15
Oct 15
Nov 15
Dec 15
Jan 16
Feb 16P
Copper -8.9% 5701 5925 6027 6300 5833 5456 5088 5207 5221 4507 4628 4462 4594
Aluminium -5.9% 1820 1772 1788 1805 1683 1637 1539 1588 1523 1465 1494 1479 1535
Copper (LHS)
Aluminium (RHS)
p: preliminary
Data SourceL London Metal Exchange (LME)
50.0
100.0
150.0
0.0
20.0
40.0
60.0
80.0
100.0
120.0
Feb 15 Mar 15 Apr 15 May 15 Jun 15 Jul 15 Aug 15 Sep 15 Oct 15 Nov 15 Dec 15 Jan 16 Feb 16P
S$/m3S$/Tonne
BASIC CONSTRUCTION MATERIALS
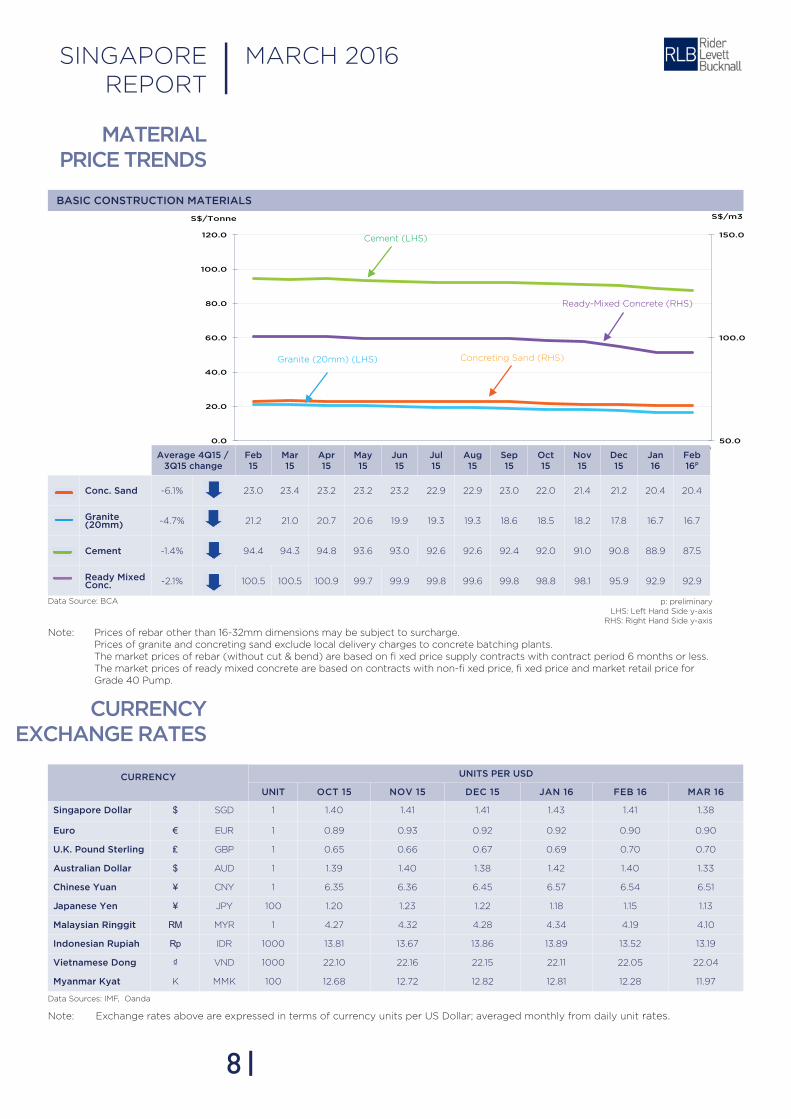
Data Source: BCA
Prices of rebar other than 16-32mm dimensions may be subject to surcharge.Prices of granite and concreting sand exclude local delivery charges to concrete batching plants.The market prices of rebar (without cut & bend) are based on fi xed price supply contracts with contract period 6 months or less.The market prices of ready mixed concrete are based on contracts with non-fi xed price, fi xed price and market retail price for Grade 40 Pump.
Note:
CURRENCYEXCHANGE RATES
Data Sources: IMF, Oanda
Note: Exchange rates above are expressed in terms of currency units per US Dollar; averaged monthly from daily unit rates.
8 |
CURRENCY UNITS PER USD
UNIT OCT 15 NOv 15 DEC 15 JAN 16 FEB 16 MAR 16
Singapore Dollar $ SGD 1 1.40 1.41 1.41 1.43 1.41 1.38
Euro € EUR 1 0.89 0.93 0.92 0.92 0.90 0.90
U.K. Pound Sterling ₤ GBP 1 0.65 0.66 0.67 0.69 0.70 0.70
Australian Dollar $ AUD 1 1.39 1.40 1.38 1.42 1.40 1.33
Chinese Yuan ¥ CNY 1 6.35 6.36 6.45 6.57 6.54 6.51
Japanese Yen ¥ JPY 100 1.20 1.23 1.22 1.18 1.15 1.13
Malaysian Ringgit RM MYR 1 4.27 4.32 4.28 4.34 4.19 4.10
Indonesian Rupiah Rp IDR 1000 13.81 13.67 13.86 13.89 13.52 13.19
vietnamese Dong ₫ VND 1000 22.10 22.16 22.15 22.11 22.05 22.04
Myanmar Kyat K MMK 100 12.68 12.72 12.82 12.81 12.28 11.97
Average 4Q15 /
3Q15 changeFeb 15
Mar 15
Apr 15
May 15
Jun 15
Jul 15
Aug 15
Sep 15
Oct 15
Nov 15
Dec 15
Jan 16
Feb 16P
Conc. Sand -6.1% 23.0 23.4 23.2 23.2 23.2 22.9 22.9 23.0 22.0 21.4 21.2 20.4 20.4
Granite (20mm) -4.7% 21.2 21.0 20.7 20.6 19.9 19.3 19.3 18.6 18.5 18.2 17.8 16.7 16.7
Cement -1.4% 94.4 94.3 94.8 93.6 93.0 92.6 92.6 92.4 92.0 91.0 90.8 88.9 87.5
Ready Mixed Conc. -2.1% 100.5 100.5 100.9 99.7 99.9 99.8 99.6 99.8 98.8 98.1 95.9 92.9 92.9
Cement (LHS)
Ready-Mixed Concrete (RHS)
Granite (20mm) (LHS) Concreting Sand (RHS)
SINGAPORE REPORT | MARCH 2016
MATERIAL PRICE TRENDS
p: preliminaryLHS: Left Hand Side y-axis
RHS: Right Hand Side y-axis
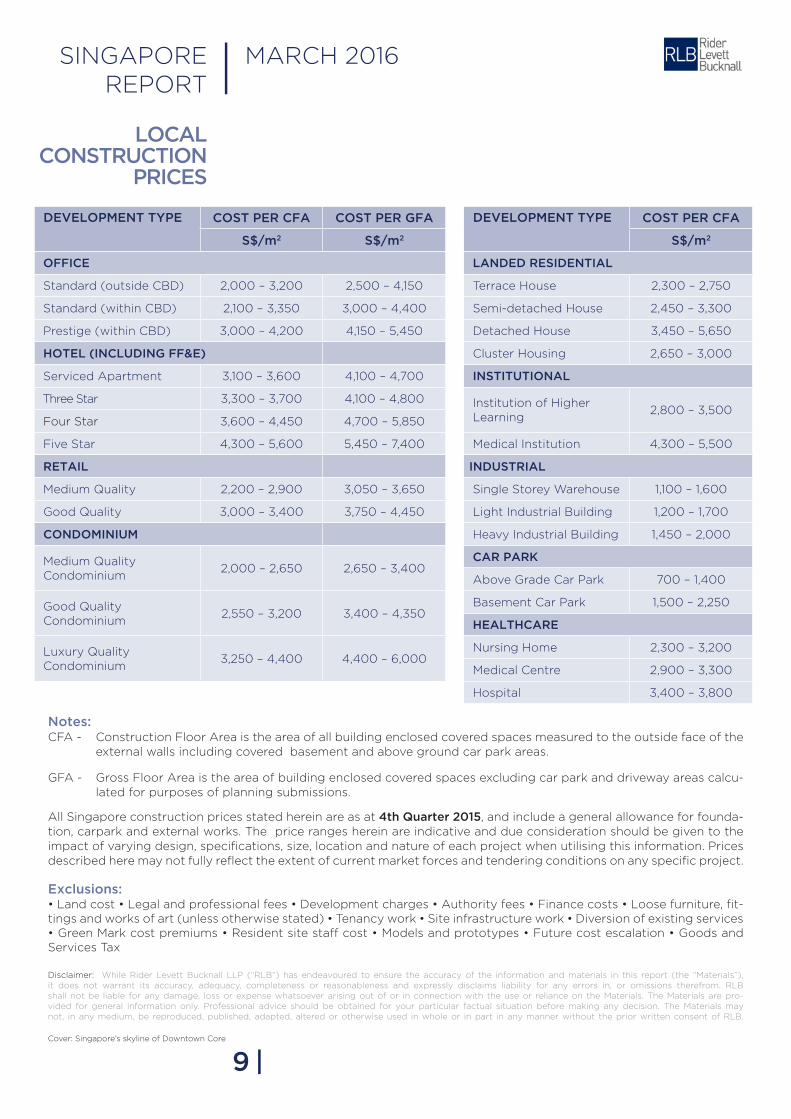
LOCALCONSTRUCTION
PRICES
Notes:CFA - Construction Floor Area is the area of all building enclosed covered spaces measured to the outside face of the external walls including covered basement and above ground car park areas.
GFA - Gross Floor Area is the area of building enclosed covered spaces excluding car park and driveway areas calcu- lated for purposes of planning submissions.
All Singapore construction prices stated herein are as at 4th Quarter 2015, and include a general allowance for founda-tion, carpark and external works. The price ranges herein are indicative and due consideration should be given to the impact of varying design, specifications, size, location and nature of each project when utilising this information. Prices described here may not fully reflect the extent of current market forces and tendering conditions on any specific project.
Exclusions:-
Services Tax
Disclaimer: While Rider Levett Bucknall LLP (“RLB”) has endeavoured to ensure the accuracy of the information and materials in this report (the “Materials”), it does not warrant its accuracy, adequacy, completeness or reasonableness and expressly disclaims liability for any errors in, or omissions therefrom. RLB shall not be liable for any damage, loss or expense whatsoever arising out of or in connection with the use or reliance on the Materials. The Materials are pro-vided for general information only. Professional advice should be obtained for your particular factual situation before making any decision. The Materials may not, in any medium, be reproduced, published, adapted, altered or otherwise used in whole or in part in any manner without the prior written consent of RLB.
9 |
DEvELOPMENT TYPE COST PER CFA
S$/m2
LANDED RESIDENTIAL
Terrace House 2,300 – 2,750
Semi-detached House 2,450 – 3,300
Detached House 3,450 – 5,650
Cluster Housing 2,650 – 3,000
INSTITUTIONAL
Institution of Higher Learning
2,800 – 3,500
Medical Institution 4,300 – 5,500
INDUSTRIAL
Single Storey Warehouse 1,100 – 1,600
Light Industrial Building 1,200 – 1,700
Heavy Industrial Building 1,450 – 2,000
CAR PARK
Above Grade Car Park 700 – 1,400
Basement Car Park 1,500 – 2,250
HEALTHCARE
Nursing Home 2,300 – 3,200
Medical Centre 2,900 – 3,300
Hospital 3,400 – 3,800
SINGAPORE REPORT | MARCH 2016
DEvELOPMENT TYPE COST PER CFA COST PER GFA
S$/m2 S$/m2
OFFICE
Standard (outside CBD) 2,000 – 3,200 2,500 – 4,150
Standard (within CBD) 2,100 – 3,350 3,000 – 4,400
Prestige (within CBD) 3,000 – 4,200 4,150 – 5,450
HOTEL (INCLUDING FF&E)
Serviced Apartment 3,100 – 3,600 4,100 – 4,700
Three Star 3,300 – 3,700 4,100 – 4,800
Four Star 3,600 – 4,450 4,700 – 5,850
Five Star 4,300 – 5,600 5,450 – 7,400
RETAIL
Medium Quality 2,200 – 2,900 3,050 – 3,650
Good Quality 3,000 – 3,400 3,750 – 4,450
CONDOMINIUM
Medium Quality Condominium
2,000 – 2,650 2,650 – 3,400
Good Quality Condominium
2,550 – 3,200 3,400 – 4,350
Luxury Quality Condominium
3,250 – 4,400 4,400 – 6,000
Cover: Singapore’s skyline of Downtown Core
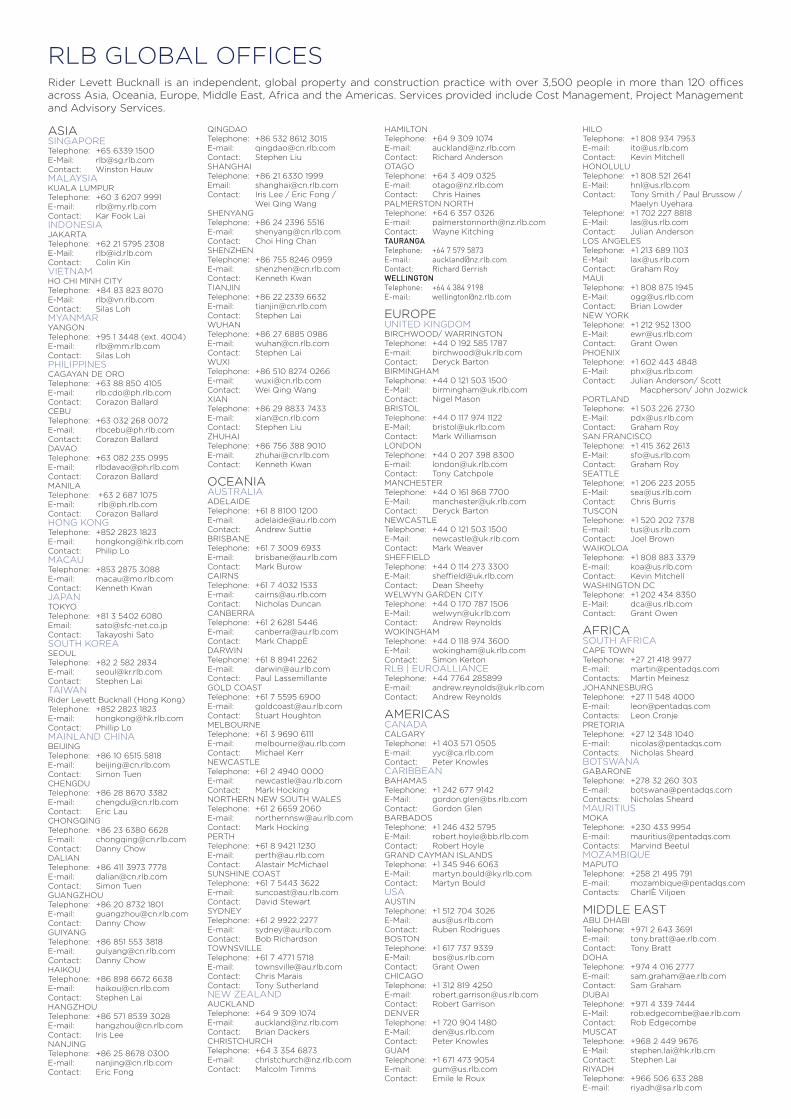
RLB GLOBAL OFFICESRider Levett Bucknall is an independent, global property and construction practice with over 3,500 people in more than 120 offices across Asia, Oceania, Europe, Middle East, Africa and the Americas. Services provided include Cost Management, Project Management and Advisory Services.
ASIASINGAPORETelephone: +65 6339 1500E-Mail: [email protected]: Winston HauwMALAYSIAKUALA LUMPURTelephone: +60 3 6207 9991E-mail: [email protected]: Kar Fook LaiINDONESIAJAKARTATelephone: +62 21 5795 2308E-Mail: [email protected]: Colin Kin VIETNAMHO CHI MINH CITYTelephone: +84 83 823 8070E-Mail: [email protected] Contact: Silas LohMYANMARYANGONTelephone: +95 1 3448 (ext. 4004)E-mail: [email protected]: Silas LohPHILIPPINESCAGAYAN DE OROTelephone: +63 88 850 4105E-mail: [email protected]: Corazon Ballard CEBUTelephone: +63 032 268 0072E-mail: [email protected]: Corazon BallardDAVAOTelephone: +63 082 235 0995E-mail: [email protected]: Corazon BallardMANILATelephone: +63 2 687 1075E-mail: [email protected]: Corazon BallardHONG KONG Telephone: +852 2823 1823E-mail: [email protected]: Philip LoMACAUTelephone: +853 2875 3088E-mail: [email protected]: Kenneth KwanJAPANTOKYOTelephone: +81 3 5402 6080Email: [email protected]: Takayoshi SatoSOUTH KOREASEOULTelephone: +82 2 582 2834E-mail: [email protected]: Stephen LaiTAIWANRider Levett Bucknall (Hong Kong)Telephone: +852 2823 1823E-mail: [email protected]: Phillip LoMAINLAND CHINABEIJINGTelephone: +86 10 6515 5818E-mail: [email protected]: Simon TuenCHENGDUTelephone: +86 28 8670 3382E-mail: [email protected]: Eric Lau CHONGQINGTelephone: +86 23 6380 6628E-mail: [email protected]: Danny ChowDALIANTelephone: +86 411 3973 7778E-mail: [email protected]: Simon TuenGUANGZHOUTelephone: +86 20 8732 1801E-mail: [email protected]: Danny ChowGUIYANGTelephone: +86 851 553 3818E-mail: [email protected]: Danny ChowHAIKOUTelephone: +86 898 6672 6638E-mail: [email protected]: Stephen LaiHANGZHOUTelephone: +86 571 8539 3028E-mail: [email protected]: Iris LeeNANJINGTelephone: +86 25 8678 0300E-mail: [email protected]: Eric Fong
QINGDAOTelephone: +86 532 8612 3015E-mail: [email protected]: Stephen LiuSHANGHAITelephone: +86 21 6330 1999Email: [email protected]: Iris Lee / Eric Fong / Wei Qing WangSHENYANGTelephone: +86 24 2396 5516E-mail: [email protected]: Choi Hing Chan SHENZHENTelephone: +86 755 8246 0959E-mail: [email protected] Contact: Kenneth KwanTIANJINTelephone: +86 22 2339 6632E-mail: [email protected] Contact: Stephen LaiWUHANTelephone: +86 27 6885 0986E-mail: [email protected]: Stephen LaiWUXITelephone: +86 510 8274 0266E-mail: [email protected] Contact: Wei Qing Wang XIANTelephone: +86 29 8833 7433E-mail: [email protected]: Stephen LiuZHUHAITelephone: +86 756 388 9010E-mail: [email protected]: Kenneth Kwan
OCEANIAAUSTRALIAADELAIDETelephone: +61 8 8100 1200E-mail: [email protected]: Andrew SuttieBRISBANETelephone: +61 7 3009 6933E-mail: [email protected]: Mark BurowCAIRNSTelephone: +61 7 4032 1533E-mail: [email protected]: Nicholas DuncanCANBERRATelephone: +61 2 6281 5446E-mail: [email protected]: Mark ChappÈ DARWINTelephone: +61 8 8941 2262E-mail: [email protected]: Paul LassemillanteGOLD COASTTelephone: +61 7 5595 6900E-mail: [email protected]: Stuart HoughtonMELBOURNETelephone: +61 3 9690 6111E-mail: [email protected]: Michael Kerr NEWCASTLETelephone: +61 2 4940 0000E-mail: [email protected]: Mark HockingNORTHERN NEW SOUTH WALESTelephone: +61 2 6659 2060E-mail: [email protected]: Mark HockingPERTHTelephone: +61 8 9421 1230E-mail: [email protected]: Alastair McMichael SUNSHINE COASTTelephone: +61 7 5443 3622E-mail: [email protected]: David StewartSYDNEYTelephone: +61 2 9922 2277E-mail: [email protected]: Bob RichardsonTOWNSVILLETelephone: +61 7 4771 5718E-mail: [email protected]: Chris MaraisContact: Tony SutherlandNEW ZEALANDAUCKLANDTelephone: +64 9 309 1074E-mail: [email protected]: Brian DackersCHRISTCHURCHTelephone: +64 3 354 6873E-mail: [email protected]: Malcolm Timms
HAMILTONTelephone: +64 9 309 1074E-mail: [email protected]: Richard Anderson OTAGOTelephone: +64 3 409 0325E-mail: [email protected]: Chris HainesPALMERSTON NORTHTelephone: +64 6 357 0326E-mail: [email protected]: Wayne KitchingTAURANGA
Telephone: +64 7 579 5873E-mail: [email protected]: Richard GerrishWELLINGTON
Telephone: +64 4 384 9198E-mail: [email protected]
EUROPEUNITED KINGDOMBIRCHWOOD/ WARRINGTONTelephone: +44 0 192 585 1787 E-mail: [email protected]: Deryck BartonBIRMINGHAMTelephone: +44 0 121 503 1500E-Mail: [email protected] Contact: Nigel MasonBRISTOLTelephone: +44 0 117 974 1122E-Mail: [email protected] Contact: Mark WilliamsonLONDONTelephone: +44 0 207 398 8300E-mail: [email protected]: Tony CatchpoleMANCHESTERTelephone: +44 0 161 868 7700E-Mail: [email protected]: Deryck BartonNEWCASTLETelephone: +44 0 121 503 1500 E-Mail: [email protected]: Mark WeaverSHEFFIELDTelephone: +44 0 114 273 3300E-Mail: [email protected]: Dean SheehyWELWYN GARDEN CITYTelephone: +44 0 170 787 1506E-Mail: [email protected] Contact: Andrew ReynoldsWOKINGHAMTelephone: +44 0 118 974 3600E-Mail: [email protected] Contact: Simon KertonRLB | EUROALLIANCETelephone: +44 7764 285899E-mail: [email protected]: Andrew Reynolds
AMERICASCANADACALGARYTelephone: +1 403 571 0505E-mail: [email protected]: Peter KnowlesCARIBBEANBAHAMAS Telephone: +1 242 677 9142E-Mail: [email protected]: Gordon GlenBARBADOSTelephone: +1 246 432 5795E-Mail: [email protected]: Robert HoyleGRAND CAYMAN ISLANDSTelephone: +1 345 946 6063E-Mail: [email protected]: Martyn BouldUSAAUSTINTelephone: +1 512 704 3026E-Mail: [email protected]: Ruben RodriguesBOSTONTelephone: +1 617 737 9339E-Mail: [email protected]: Grant OwenCHICAGOTelephone: +1 312 819 4250E-mail: [email protected]: Robert GarrisonDENVERTelephone: +1 720 904 1480E-Mail: [email protected]: Peter Knowles GUAMTelephone: +1 671 473 9054E-mail: [email protected]: Emile le Roux
HILOTelephone: +1 808 934 7953E-mail: [email protected]: Kevin MitchellHONOLULUTelephone: +1 808 521 2641E-Mail: [email protected]: Tony Smith / Paul Brussow / Maelyn UyeharaTelephone: +1 702 227 8818E-Mail: [email protected]: Julian Anderson LOS ANGELESTelephone: +1 213 689 1103E-Mail: [email protected]: Graham RoyMAUITelephone: +1 808 875 1945E-Mail: [email protected]: Brian LowderNEW YORKTelephone: +1 212 952 1300E-Mail: [email protected]: Grant OwenPHOENIXTelephone: +1 602 443 4848E-Mail: [email protected]: Julian Anderson/ Scott Macpherson/ John Jozwick PORTLANDTelephone: +1 503 226 2730E-Mail: [email protected]: Graham RoySAN FRANCISCOTelephone: +1 415 362 2613E-Mail: [email protected]: Graham RoySEATTLETelephone: +1 206 223 2055E-Mail: [email protected]: Chris BurrisTUSCONTelephone: +1 520 202 7378E-mail: [email protected]: Joel BrownWAIKOLOATelephone: +1 808 883 3379E-mail: [email protected]: Kevin MitchellWASHINGTON DCTelephone: +1 202 434 8350E-Mail: [email protected]: Grant Owen
AFRICASOUTH AFRICACAPE TOWNTelephone: +27 21 418 9977E-mail: [email protected]: Martin MeineszJOHANNESBURGTelephone: +27 11 548 4000E-mail: [email protected]: Leon CronjePRETORIATelephone: +27 12 348 1040E-mail: [email protected]: Nicholas Sheard BOTSWANAGABARONETelephone: +278 32 260 303E-mail: [email protected]: Nicholas SheardMAURITIUSMOKATelephone: +230 433 9954E-mail: [email protected]: Marvind BeetulMOZAMBIQUEMAPUTOTelephone: +258 21 495 791E-mail: [email protected]: CharlÈ Viljoen
MIDDLE EASTABU DHABITelephone: +971 2 643 3691E-mail: [email protected] Contact: Tony BrattDOHATelephone: +974 4 016 2777E-mail: [email protected]: Sam GrahamDUBAITelephone: +971 4 339 7444E-Mail: [email protected]: Rob EdgecombeMUSCATTelephone: +968 2 449 9676E-Mail: [email protected]: Stephen LaiRIYADHTelephone: +966 506 633 288E-mail: [email protected]

rlb.com
A Quarterly Publication from RLB Research of:
Rider Levett Bucknall LLP 150 Beach Road #09-01 Gateway West Singapore 189720 Tel: +65 6339 1500 | Fax: +65 6339 1521 | Web: www.rlb.com | E-mail: [email protected]
MCI (P) 140/06/2016