Embed Size (px)
Citation preview
1
SINGAPORE PRESS HOLDINGS LIMITED
Reg. No. 198402868E
(Incorporated in Singapore)
ANNOUNCEMENT UNAUDITED RESULTS* FOR THE PERIOD ENDED 29 FEBRUARY 2020
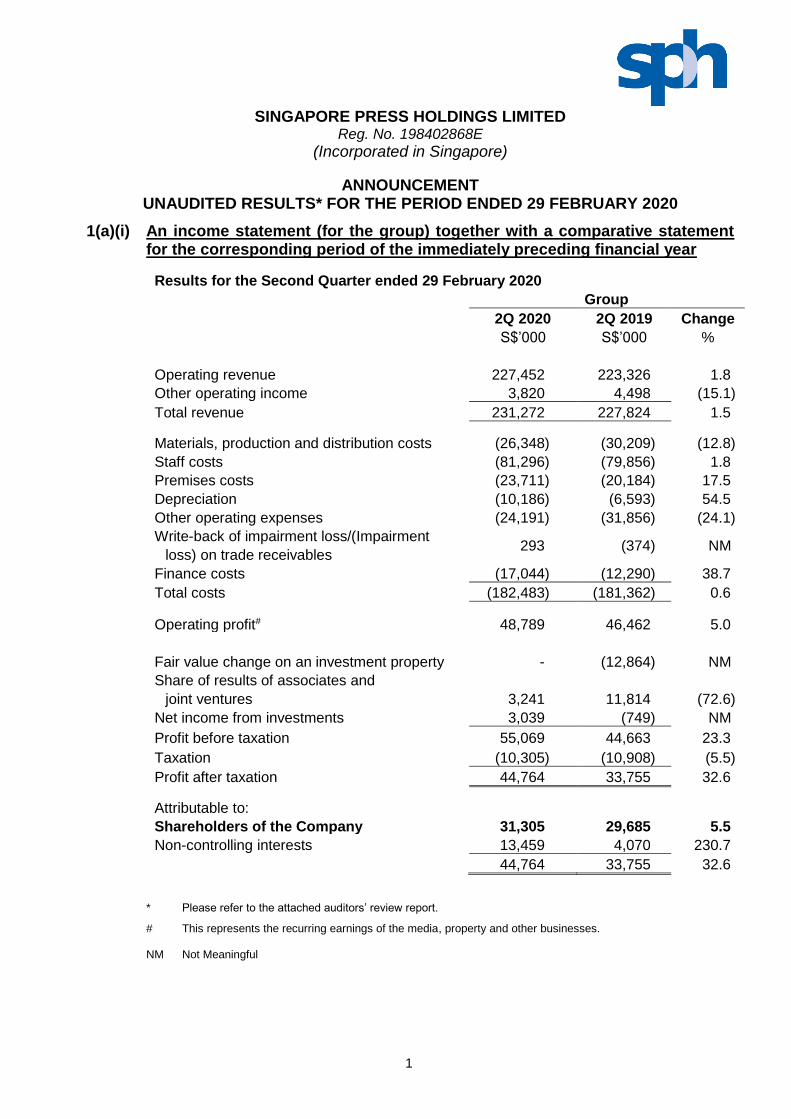
1(a)(i) An income statement (for the group) together with a comparative statement for the corresponding period of the immediately preceding financial year
Results for the Second Quarter ended 29 February 2020
Group
2Q 2020 2Q 2019 Change
S$’000 S$’000 %
Operating revenue 227,452 223,326 1.8
Other operating income 3,820 4,498 (15.1)
Total revenue 231,272 227,824 1.5
Materials, production and distribution costs (26,348) (30,209) (12.8)
Staff costs (81,296) (79,856) 1.8
Premises costs (23,711) (20,184) 17.5
Depreciation (10,186) (6,593) 54.5
Other operating expenses (24,191) (31,856) (24.1)
Write-back of impairment loss/(Impairment
loss) on trade receivables
293 (374) NM
Finance costs (17,044) (12,290) 38.7
Total costs (182,483) (181,362) 0.6
Operating profit# 48,789 46,462 5.0
Fair value change on an investment property - (12,864) NM
Share of results of associates and
joint ventures 3,241 11,814 (72.6)
Net income from investments 3,039 (749) NM
Profit before taxation 55,069 44,663 23.3
Taxation (10,305) (10,908) (5.5)
Profit after taxation 44,764 33,755 32.6
Attributable to:
Shareholders of the Company 31,305 29,685 5.5
Non-controlling interests 13,459 4,070 230.7
44,764 33,755 32.6
* Please refer to the attached auditors’ review report.
# This represents the recurring earnings of the media, property and other businesses.
NM Not Meaningful

2
1(a)(ii) Notes: Profit after taxation is arrived at after accounting for:
Group
2Q 2020 2Q 2019 Change
S$’000 S$’000 %
Write-back of allowance/(Allowance) for
stock obsolescence 287 (158) NM
Share-based compensation expense (851) (1,181) (27.9)
Profit on disposal of property, plant and
equipment 1,190 9 NM
Amortisation of intangible assets (1,848) (1,941) (4.8)
Loss on divestment of interest in associate - (426) NM
Interest income from treasury and operations 2,084 2,054 1.5
Net fair value changes on
- Investments at fair value through profit or loss
(“FVTPL”) 1,304 (1,389) NM
- Derivatives (foreign exchange forwards) (275) 1,058 NM
Net foreign exchange differences 1,674 (2,179) NM
Net over/(under)-provision of prior years’
taxation 31 (16) NM
3
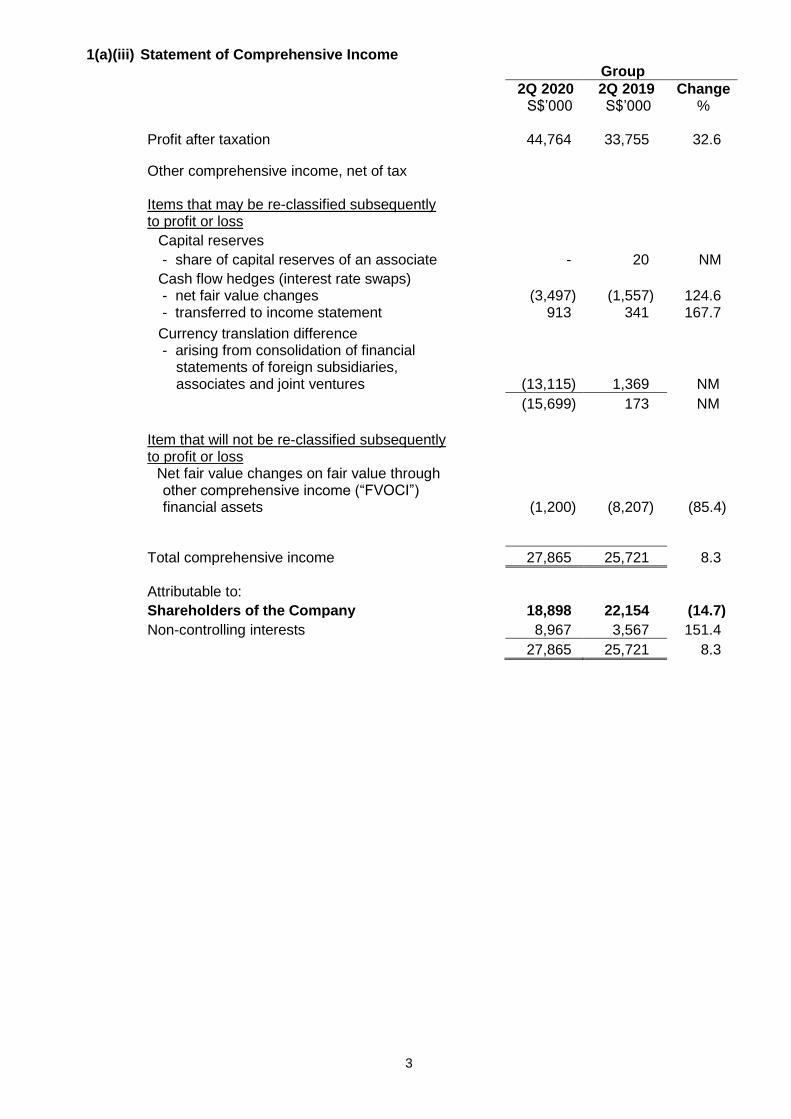
1(a)(iii) Statement of Comprehensive Income
Group
2Q 2020 2Q 2019 Change S$’000 S$’000 % Profit after taxation 44,764 33,755 32.6
Other comprehensive income, net of tax Items that may be re-classified subsequently to profit or loss
Capital reserves
- share of capital reserves of an associate - 20 NM
Cash flow hedges (interest rate swaps) - net fair value changes (3,497) (1,557) 124.6 - transferred to income statement 913 341 167.7
Currency translation difference - arising from consolidation of financial
statements of foreign subsidiaries, associates and joint ventures (13,115) 1,369 NM
(15,699) 173 NM
Item that will not be re-classified subsequently to profit or loss
Net fair value changes on fair value through other comprehensive income (“FVOCI”) financial assets (1,200) (8,207) (85.4)
Total comprehensive income 27,865 25,721 8.3
Attributable to:
Shareholders of the Company 18,898 22,154 (14.7)
Non-controlling interests 8,967 3,567 151.4
27,865 25,721 8.3
4
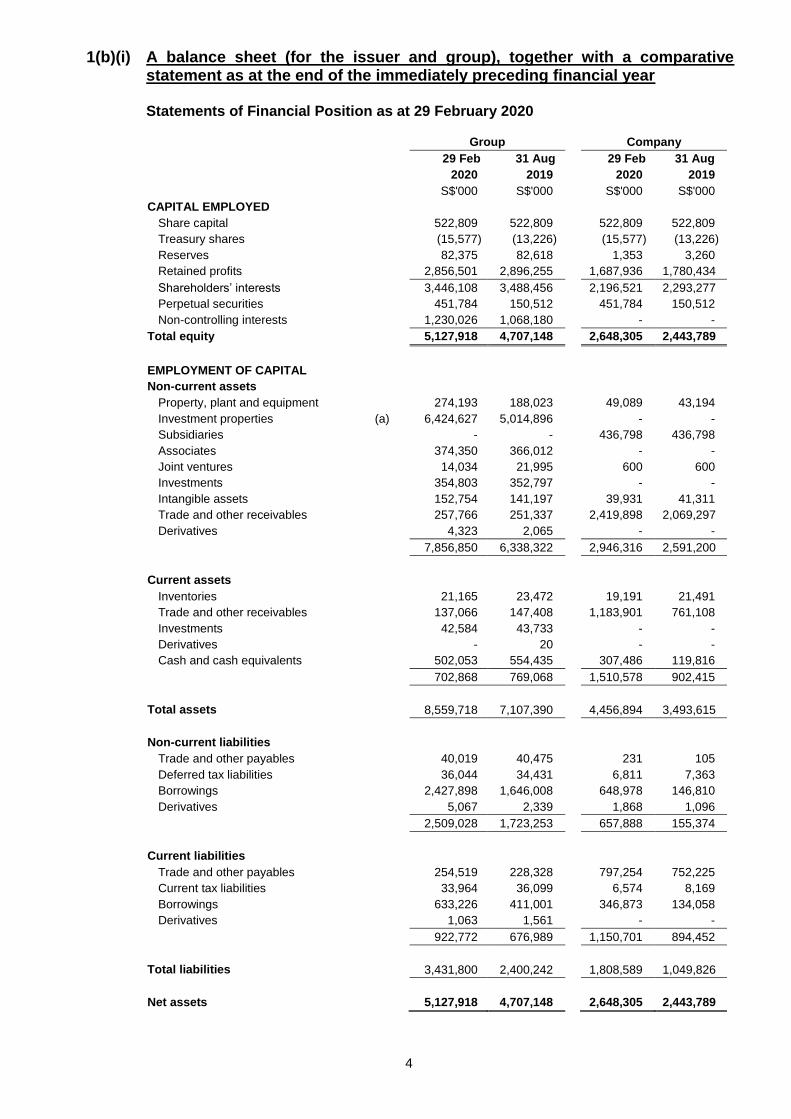
1(b)(i) A balance sheet (for the issuer and group), together with a comparative
statement as at the end of the immediately preceding financial year
Statements of Financial Position as at 29 February 2020
Group Company
29 Feb 31 Aug 29 Feb 31 Aug
2020 2019 2020 2019
S$'000 S$'000 S$'000 S$'000
CAPITAL EMPLOYED
Share capital 522,809 522,809 522,809 522,809
Treasury shares (15,577) (13,226) (15,577) (13,226)
Reserves 82,375 82,618 1,353 3,260
Retained profits 2,856,501 2,896,255 1,687,936 1,780,434
Shareholders’ interests 3,446,108 3,488,456 2,196,521 2,293,277
Perpetual securities 451,784 150,512 451,784 150,512
Non-controlling interests 1,230,026 1,068,180 - -
Total equity 5,127,918 4,707,148 2,648,305 2,443,789
EMPLOYMENT OF CAPITAL
Non-current assets
Property, plant and equipment 274,193 188,023 49,089 43,194
Investment properties (a) 6,424,627 5,014,896 - -
Subsidiaries - - 436,798 436,798
Associates 374,350 366,012 - -
Joint ventures 14,034 21,995 600 600
Investments 354,803 352,797 - -
Intangible assets 152,754 141,197 39,931 41,311
Trade and other receivables 257,766 251,337 2,419,898 2,069,297
Derivatives 4,323 2,065 - -
7,856,850 6,338,322 2,946,316 2,591,200
Current assets
Inventories 21,165 23,472 19,191 21,491
Trade and other receivables 137,066 147,408 1,183,901 761,108
Investments 42,584 43,733 - -
Derivatives - 20 - -
Cash and cash equivalents 502,053 554,435 307,486 119,816
702,868 769,068 1,510,578 902,415
Total assets 8,559,718 7,107,390 4,456,894 3,493,615
Non-current liabilities
Trade and other payables 40,019 40,475 231 105
Deferred tax liabilities 36,044 34,431 6,811 7,363
Borrowings 2,427,898 1,646,008 648,978 146,810
Derivatives 5,067 2,339 1,868 1,096
2,509,028 1,723,253 657,888 155,374
Current liabilities
Trade and other payables 254,519 228,328 797,254 752,225
Current tax liabilities 33,964 36,099 6,574 8,169
Borrowings 633,226 411,001 346,873 134,058
Derivatives 1,063 1,561 - -
922,772 676,989 1,150,701 894,452
Total liabilities 3,431,800 2,400,242 1,808,589 1,049,826
Net assets 5,127,918 4,707,148 2,648,305 2,443,789
5
Notes to the Balance Sheets (a) As at 31 August 2019, the carrying amount of the investment properties was based on
valuations performed by the independent external valuers. As at 29 February 2020, the carrying amount of the investment properties was based on assessments performed by the Group or independent valuers for assets newly acquired from 31 August 2019. The assessments were based on the discounted cash flow and income capitalisation methods. The key inputs used in the assessments such as the discount rate, terminal yield, capitalisation rate and vacancy assumptions were based on market data that has been adjusted for Group’s internal data.
Valuation of investment properties is subject to significant estimation uncertainty. The
outbreak of the Novel Coronavirus (“COVID-19”) has negatively affected the retail and student accommodation sector in countries where the Group’s investment properties are located. Given that the potential impact of COVID-19 is constantly evolving, significant market uncertainty exists. Therefore, the carrying amount of the investment properties assessed by the Group was current as at 29 February 2020 only. This carrying amount assessed may change significantly after the balance sheet date.
6
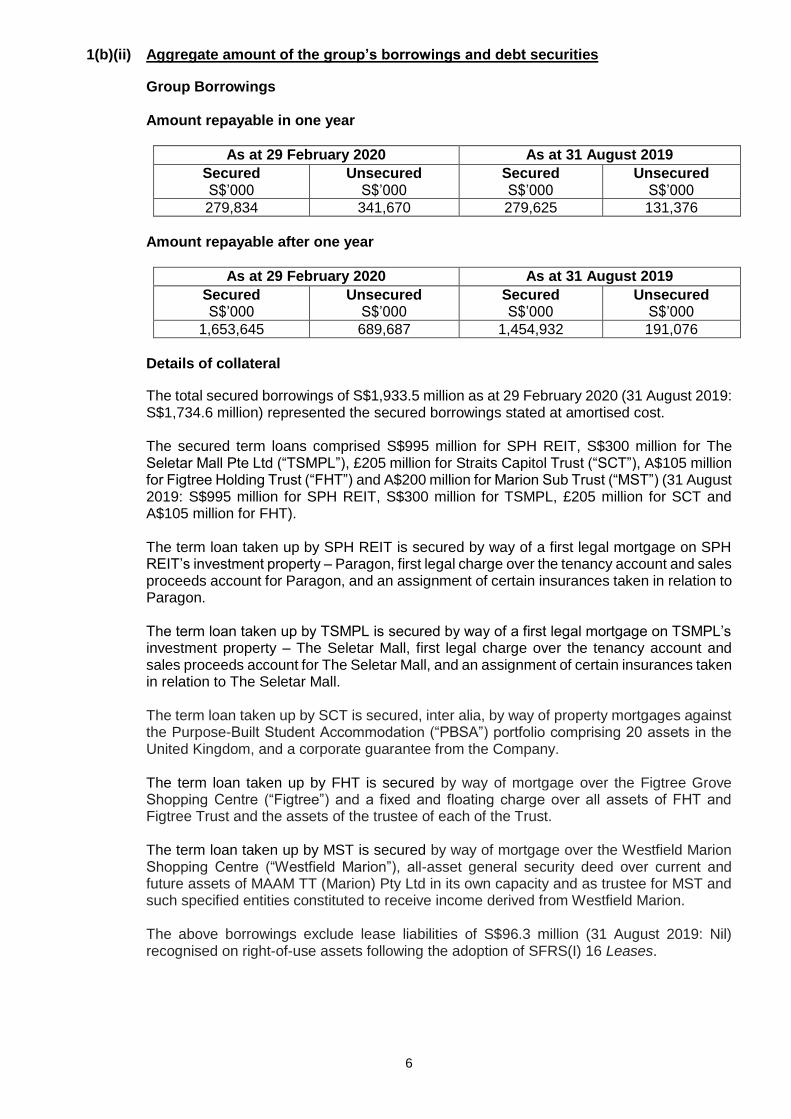
1(b)(ii) Aggregate amount of the group’s borrowings and debt securities
Group Borrowings Amount repayable in one year
As at 29 February 2020 As at 31 August 2019
Secured S$’000
Unsecured S$’000
Secured S$’000
Unsecured S$’000
279,834 341,670 279,625 131,376
Amount repayable after one year
As at 29 February 2020 As at 31 August 2019
Secured S$’000
Unsecured S$’000
Secured S$’000
Unsecured S$’000
1,653,645 689,687 1,454,932 191,076
Details of collateral
The total secured borrowings of S$1,933.5 million as at 29 February 2020 (31 August 2019: S$1,734.6 million) represented the secured borrowings stated at amortised cost.
The secured term loans comprised S$995 million for SPH REIT, S$300 million for The
Seletar Mall Pte Ltd (“TSMPL”), £205 million for Straits Capitol Trust (“SCT”), A$105 million for Figtree Holding Trust (“FHT”) and A$200 million for Marion Sub Trust (“MST”) (31 August 2019: S$995 million for SPH REIT, S$300 million for TSMPL, £205 million for SCT and A$105 million for FHT).
The term loan taken up by SPH REIT is secured by way of a first legal mortgage on SPH
REIT’s investment property – Paragon, first legal charge over the tenancy account and sales proceeds account for Paragon, and an assignment of certain insurances taken in relation to Paragon.
The term loan taken up by TSMPL is secured by way of a first legal mortgage on TSMPL’s
investment property – The Seletar Mall, first legal charge over the tenancy account and sales proceeds account for The Seletar Mall, and an assignment of certain insurances taken in relation to The Seletar Mall. The term loan taken up by SCT is secured, inter alia, by way of property mortgages against the Purpose-Built Student Accommodation (“PBSA”) portfolio comprising 20 assets in the United Kingdom, and a corporate guarantee from the Company.
The term loan taken up by FHT is secured by way of mortgage over the Figtree Grove Shopping Centre (“Figtree”) and a fixed and floating charge over all assets of FHT and Figtree Trust and the assets of the trustee of each of the Trust.
The term loan taken up by MST is secured by way of mortgage over the Westfield Marion
Shopping Centre (“Westfield Marion”), all-asset general security deed over current and future assets of MAAM TT (Marion) Pty Ltd in its own capacity and as trustee for MST and such specified entities constituted to receive income derived from Westfield Marion.
The above borrowings exclude lease liabilities of S$96.3 million (31 August 2019: Nil)
recognised on right-of-use assets following the adoption of SFRS(I) 16 Leases.
7
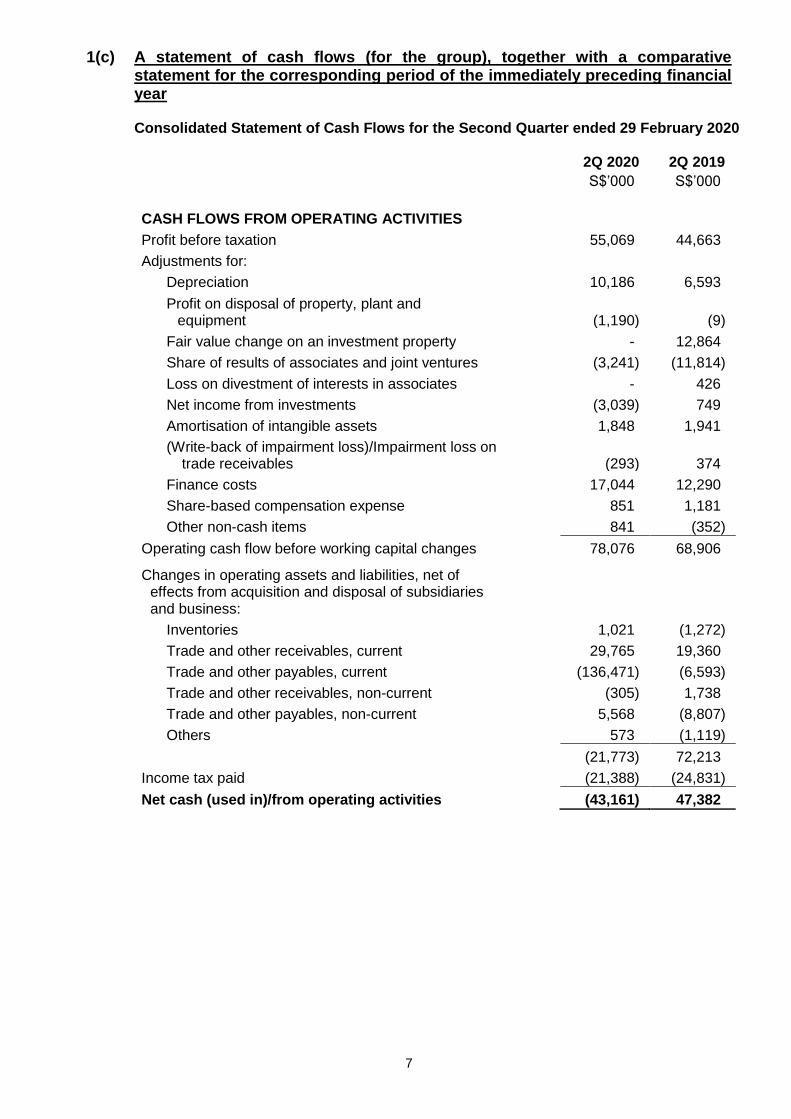
1(c) A statement of cash flows (for the group), together with a comparative
statement for the corresponding period of the immediately preceding financial year
Consolidated Statement of Cash Flows for the Second Quarter ended 29 February 2020
2Q 2020 2Q 2019
S$’000 S$’000
CASH FLOWS FROM OPERATING ACTIVITIES
Profit before taxation 55,069 44,663
Adjustments for:
Depreciation 10,186 6,593
Profit on disposal of property, plant and
equipment (1,190) (9)
Fair value change on an investment property - 12,864
Share of results of associates and joint ventures (3,241) (11,814)
Loss on divestment of interests in associates - 426
Net income from investments (3,039) 749
Amortisation of intangible assets 1,848 1,941
(Write-back of impairment loss)/Impairment loss on
trade receivables (293) 374
Finance costs 17,044 12,290
Share-based compensation expense 851 1,181
Other non-cash items 841 (352)
Operating cash flow before working capital changes 78,076 68,906
Changes in operating assets and liabilities, net of effects from acquisition and disposal of subsidiaries and business:
Inventories 1,021 (1,272)
Trade and other receivables, current 29,765 19,360
Trade and other payables, current (136,471) (6,593)
Trade and other receivables, non-current (305) 1,738
Trade and other payables, non-current 5,568 (8,807)
Others 573 (1,119)
(21,773) 72,213
Income tax paid (21,388) (24,831)
Net cash (used in)/from operating activities (43,161) 47,382

8
Consolidated Statement of Cash Flows for the Second Quarter ended 29 February 2020 (cont’d)
2Q 2020 2Q 2019
S$’000 S$’000
CASH FLOWS FROM INVESTING ACTIVITIES
Additions to property, plant and equipment (7,216) (7,238)
Proceeds from disposal of property, plant and equipment 1 15
Additions to investment properties (663,188) (233,717)
Acquisition of a subsidiary (net of cash acquired) (714,680) -
Acquisition of interests in associates - (12,566)
Proceeds from divestment of interests in an associate - 6
(Increase)/Decrease in amounts owing by associates/ joint ventures (614) 81
(Decrease)/Increase in amounts owing to associates/ joint ventures (20) 64
Purchase of investments, non-current (2,937) (5,180)
Purchase of investments, current (950) (108,870)
Proceeds from disposal of investments, non-current 4,392 4,654
Proceeds from disposal of investments, current 167,227 196,594
Dividends received 72 -
Interest received 1,394 665
Other investment income 501 (977)
Net cash used in investing activities (1,216,018) (166,469)
CASH FLOWS FROM FINANCING ACTIVITIES
Proceeds from issuance of medium term notes (net of transaction costs) 497,857 -
Proceeds from bank loans (net of transaction costs) 989,309 200,115
Repayment of bank loans (599,977) -
Payment for lease liabilities (4,135) -
Interest paid (12,637) (10,915)
Share buy-back (2,102) -
Proceeds from capital contribution by non-controlling interests 162,823 16,961
Dividends paid (104,710) (112,934)
Dividends paid (net) by subsidiaries to non-controlling interests (11,038) (10,678)
Distributions to perpetual securities holders (9,517) -
Net cash from financing activities 905,873 82,549
Net decrease in cash and cash equivalents (353,306) (36,538)
Cash and cash equivalents at beginning of period 855,359 379,941
Cash and cash equivalents at end of period 502,053 343,403

9
1(d)(i) A statement (for the issuer and group) showing either (i) all changes in equity or (ii) changes in equity other than those arising from capitalisation issues and distributions to shareholders, together with a comparative statement for the corresponding period of the immediately preceding financial year
Statements of Changes in Total Equity for the Second Quarter ended 29 February 2020
(a) Group
Attributable to Shareholders of the Company
Share
Capital
Treasury Shares
Capital
Reserve
Share-based Compensation
Reserve
Hedging Reserve
Fair Value
Reserve
Currency Translation
Reserve
Retained Profits
Total
Perpetual Securities
Non-controlling Interests
Total
Equity
S$’000 S$’000 S$’000 S$’000 S$’000 S$’000 S$’000 S$’000 S$’000 S$’000 S$’000 S$’000
Balance as at 1 December 2019 522,809 (15,055) (10,300) 4,864 (6,650) 109,575 (1,207) 2,835,393 3,439,429 447,220 1,068,974 4,955,623
Total comprehensive income for the quarter - - - - (1,899) (1,200) (9,308) 31,305 18,898 - 8,967 27,865
Realised profit on disposal of FVOCI
financial assets - - - - - (518) - 518 - - - -
Transactions with owners,
recognised directly in equity
Contributions by and distributions to owners
Share-based compensation - - - 851 - - - - 851 - - 851
Treasury shares re-issued - 1,580 - (2,811) - - - 1,196 (35) - - (35)
Share buy-back – held as treasury shares - (2,102) - - - - - - (2,102) - - (2,102)
Dividends and distribution - - - - - - - (6,553) (6,553) 4,564 (15,293) (17,282)
Changes in ownership interest in a
subsidiary without a change in control
Acquisition of additional interest in a subsidiary - - (3) - (1) - (1) 27 22 - (22) -
Dilution of interest in a subsidiary - - 752 - 181 - 50 (5,385) (4,402) - 4,577 175
Contribution by non-controlling interests - - - - - - - - - - 162,823 162,823
Balance as at 29 February 2020 522,809 (15,577) (9,551) 2,904 (8,369) 107,857 (10,466) 2,856,501 3,446,108 451,784 1,230,026 5,127,918

10
Statements of Changes in Total Equity for the Second Quarter ended 29 February 2020 (cont’d)
(a) Group (cont’d)
Attributable to Shareholders of the Company
Share
Capital
Treasury Shares
Capital Reserve
Share-based Compensation
Reserve
Hedging Reserve
Fair Value
Reserve
Currency Translation
Reserve
Retained Profits
Total
Non-controlling Interests
Total
Equity
S$’000 S$’000 S$’000 S$’000 S$’000 S$’000 S$’000 S$’000 S$’000 S$’000 S$’000
Balance as at 1 December 2018 522,809 (10,694) (10,284) 8,516 (1,743) 316,772 (2,149) 2,718,230 3,541,457 751,566 4,293,023
Total comprehensive income for the quarter - - 20 - (921) (8,207) 1,577 29,685 22,154 3,567 25,721
Realised profit on disposal of FVOCI financial assets - - - - - (219,601) - 219,601 - - -
Transactions with owners,
recognised directly in equity
Contributions by and distributions to owners
Share-based compensation - - - 1,181 - - - - 1,181 - 1,181
Treasury shares re-issued - 3,100 - (6,949) - - - 3,818 (31) - (31)
Dividends - - - - - - - (112,934) (112,934) (10,678) (123,612)
Changes in ownership interest in a subsidiary without a change in control
Acquisition of additional interest
in a subsidiary - - (4) - (1) - - 33 28 (28) -
Dilution of interest in a subsidiary - - - - - - - (3) (3) 61 58
Contribution by non-controlling interest - - - - - - - - - 16,961 16,961
Balance as at 28 February 2019 522,809 (7,594) (10,268) 2,748 (2,665) 88,964 (572) 2,858,430 3,451,852 761,449 4,213,301
11
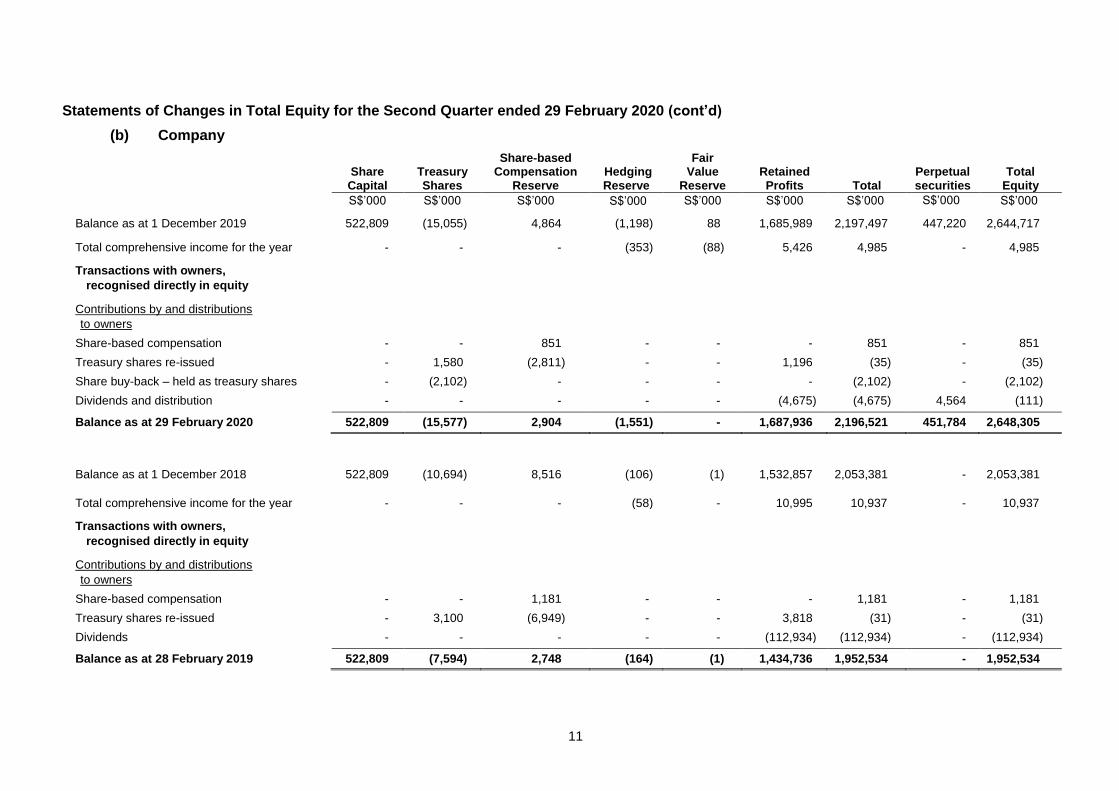
Statements of Changes in Total Equity for the Second Quarter ended 29 February 2020 (cont’d)
(b) Company
Share Capital
Treasury Shares
Share-based Compensation
Reserve Hedging Reserve
Fair Value
Reserve
Retained Profits
Total
Perpetual securities
Total
Equity
S$’000 S$’000 S$’000 S$’000 S$’000 S$’000 S$’000 S$’000 S$’000
Balance as at 1 December 2019 522,809 (15,055) 4,864 (1,198) 88 1,685,989 2,197,497 447,220 2,644,717
Total comprehensive income for the year - - - (353) (88) 5,426 4,985 - 4,985
Transactions with owners,
recognised directly in equity
Contributions by and distributions
to owners
Share-based compensation - - 851 - - - 851 - 851
Treasury shares re-issued - 1,580 (2,811) - - 1,196 (35) - (35)
Share buy-back – held as treasury shares - (2,102) - - - - (2,102) - (2,102)
Dividends and distribution - - - - - (4,675) (4,675) 4,564 (111)
Balance as at 29 February 2020 522,809 (15,577) 2,904 (1,551) - 1,687,936 2,196,521 451,784 2,648,305
Balance as at 1 December 2018 522,809 (10,694) 8,516 (106) (1) 1,532,857 2,053,381 - 2,053,381
Total comprehensive income for the year - - - (58) - 10,995 10,937 - 10,937
Transactions with owners,
recognised directly in equity
Contributions by and distributions
to owners
Share-based compensation - - 1,181 - - - 1,181 - 1,181
Treasury shares re-issued - 3,100 (6,949) - - 3,818 (31) - (31)
Dividends - - - - - (112,934) (112,934) - (112,934)
Balance as at 28 February 2019 522,809 (7,594) 2,748 (164) (1) 1,434,736 1,952,534 - 1,952,534

12
1(d)(ii) Details of any changes in the company's share capital arising from rights issue, bonus issue, share buy-backs, exercise of share options or warrants, conversion of other issues of equity securities, issue of shares for cash or as consideration for acquisition or for any other purpose since the end of the previous period reported on. State the number of shares that may be issued on conversion of all the outstanding convertibles, if any, against the total number of issued shares excluding treasury shares and subsidiary holdings of the issuer, as at the end of the current financial period reported on and as at the end of the corresponding period of the immediately preceding financial year. State also the number of shares held as treasury shares and the number of subsidiary holdings, if any, and the percentage of the aggregate number of treasury shares and subsidiary holdings held against the total number of shares outstanding in a class that is listed as at the end of the current financial period reported on and as at the end of the corresponding period of the immediately preceding financial year.
Performance Shares
(a) At the annual general meeting of the Company held on 1 December 2016, the Company’s shareholders approved the adoption of the SPH Performance Share Plan 2016 (“the 2016 Share Plan”). This replaced the SPH Performance Share Plan (“the Share Plan”), which was terminated.
(b) As at 29 February 2020, the number of shares granted and outstanding (being contingent award) under the 2016 Share Plan was 4,615,737 (28 February 2019: 3,594,631). Movements in the number of performance shares during the current quarter are summarised below:
Outstanding as at 01.12.19
Adjusted#
Granted*
Vested Outstanding
as at 29.02.20 (‘000) (‘000) (‘000) (‘000) (‘000)
3,582 (412) 2,155 (709) 4,616
# Adjusted at end of the performance period based on the level of achievement of pre-set performance conditions. * This included a special sign-on bonus of SPH shares.
Share Buy Back
Under the Share Buy Back Mandate (first approved by the Shareholders on 16 July 1999 and last renewed at the Annual General Meeting on 29 November 2019), the Company bought back 1.05 million ordinary shares during the current quarter. These shares are held as treasury shares. The amount paid, including brokerage fees, totalled S$2.1 million and was deducted against shareholders’ equity.
Share Capital and Treasury Shares
As at 29 February 2020, the Company had 1,594,222,297 ordinary shares, 16,361,769 management shares and 6,426,824 treasury shares (28 February 2019: 1,598,079,180 ordinary shares, 16,361,769 management shares and 2,569,941 treasury shares).
The treasury shares held represent 0.4% (28 February 2019: 0.2%) of the total number of issued shares (excluding treasury shares).
The Company has no subsidiary holdings as at 29 February 2020 and 28 February 2019.
13
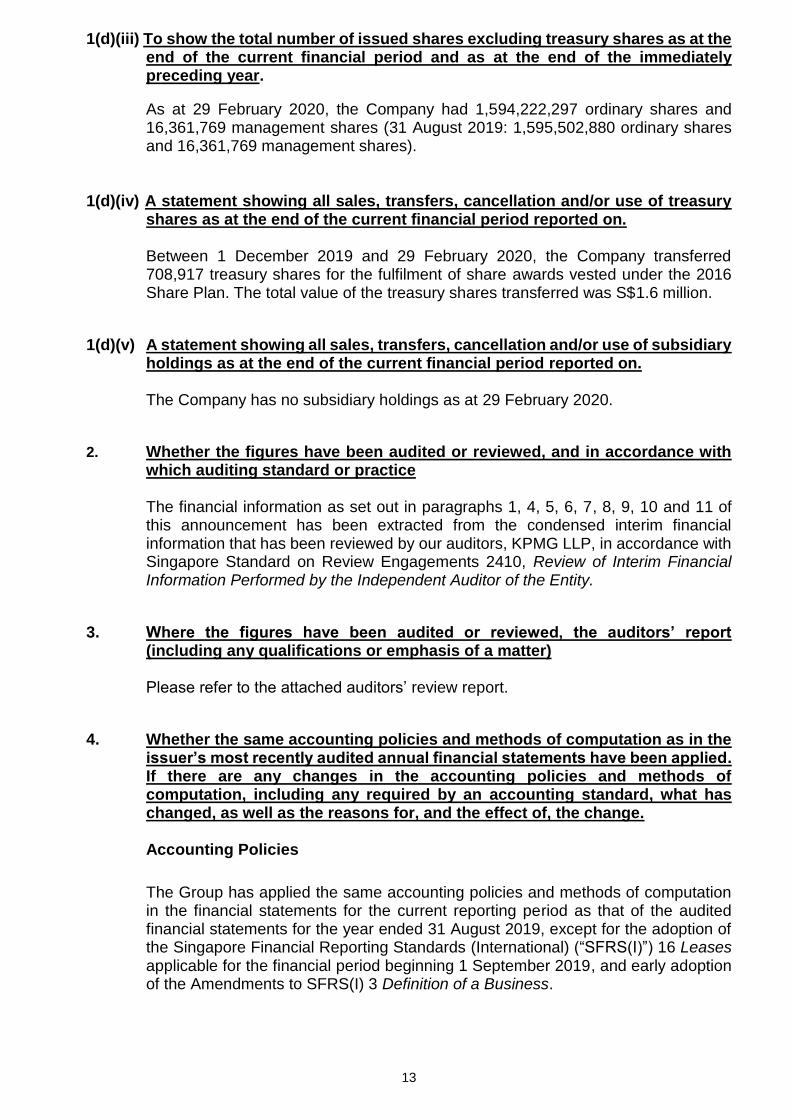
1(d)(iii) To show the total number of issued shares excluding treasury shares as at the end of the current financial period and as at the end of the immediately preceding year.
As at 29 February 2020, the Company had 1,594,222,297 ordinary shares and 16,361,769 management shares (31 August 2019: 1,595,502,880 ordinary shares and 16,361,769 management shares).
1(d)(iv) A statement showing all sales, transfers, cancellation and/or use of treasury
shares as at the end of the current financial period reported on.
Between 1 December 2019 and 29 February 2020, the Company transferred 708,917 treasury shares for the fulfilment of share awards vested under the 2016 Share Plan. The total value of the treasury shares transferred was S$1.6 million.
1(d)(v) A statement showing all sales, transfers, cancellation and/or use of subsidiary holdings as at the end of the current financial period reported on.
The Company has no subsidiary holdings as at 29 February 2020.
2. Whether the figures have been audited or reviewed, and in accordance with which auditing standard or practice
The financial information as set out in paragraphs 1, 4, 5, 6, 7, 8, 9, 10 and 11 of this announcement has been extracted from the condensed interim financial information that has been reviewed by our auditors, KPMG LLP, in accordance with Singapore Standard on Review Engagements 2410, Review of Interim Financial Information Performed by the Independent Auditor of the Entity.
3. Where the figures have been audited or reviewed, the auditors’ report (including any qualifications or emphasis of a matter)
Please refer to the attached auditors’ review report.
4. Whether the same accounting policies and methods of computation as in the issuer’s most recently audited annual financial statements have been applied. If there are any changes in the accounting policies and methods of computation, including any required by an accounting standard, what has changed, as well as the reasons for, and the effect of, the change.
Accounting Policies
The Group has applied the same accounting policies and methods of computation in the financial statements for the current reporting period as that of the audited financial statements for the year ended 31 August 2019, except for the adoption of the Singapore Financial Reporting Standards (International) (“SFRS(I)”) 16 Leases applicable for the financial period beginning 1 September 2019, and early adoption of the Amendments to SFRS(I) 3 Definition of a Business.

14
SFRS(I) 16 SFRS(I) 16 introduces a single, on-balance sheet lease accounting model for lessees. A lessee recognises a right-of-use (ROU) asset representing its right to use the underlying asset and a lease liability representing its obligation to make lease payments. There are recognition exemptions for short-term leases and leases of low-value items. Lessor accounting remains similar to the current standard – i.e. lessors continue to classify leases as finance or operating leases.
The Group and the Company applied SFRS(I) 16 on 1 September 2019, using the modified retrospective approach, with no restatement of comparative information. The Group and the Company applied the practical expedient to grandfather the definition of a lease on transition. This means that they will apply SFRS(I) 16 to all contracts entered into before 1 September 2019 and identified as leases in accordance with SFRS(I) 1-17 Leases and SFRS(I) INT 4 Determining whether an Arrangement contains a Lease.
On 1 September 2019, the Group recognised ROU assets of S$93.1 million, financial lease receivables of S$3.8 million from sub-lease arrangements, and lease liabilities of S$96.6 million. Amendments to SFRS(I) 3 Definition of a Business The Group has elected to early adopt the Amendments to SFRS(I) 3 Definition of a Business, effective for periods beginning on or after 1 January 2020. The amendments clarify the definition of a business, with the objective of assisting entities to determine whether a transaction should be accounted for as a business combination or as an asset acquisition. On 20 December 2019, the Group acquired all the shares in 17 companies in UK
for a consideration of £411 million (including discharge of the companies debt owing to a financial institution of £131.9 million). Arising from the acquisition, the Group acquired a portfolio of PBSA properties and a property management services operator. Based on the concentration test, substantially all of the fair values of the gross assets is concentrated in investment properties. As such, the transaction was accounted for as an asset acquisition.

15
5. Earnings per ordinary share of the group for the current financial period reported on and the corresponding period of the immediately preceding financial year, after deducting any provision for preference dividends
Earnings Per Share for the Second Quarter ended 29 February 2020
Group
2Q 2020 2Q 2019 (a) Based on the weighted average
number of shares on issue (S$) 0.02 0.02
(b) On fully diluted basis (S$) 0.02 0.02
Earnings per share was calculated based on profit after taxation attributable to shareholders of the Company less accrued distribution for perpetual securities, divided by the weighted average number of shares (excluding treasury shares).
6. Net asset value (for the issuer and group) per ordinary share based on the total number of issued shares excluding treasury shares of the issuer at the end of the (a) current financial period reported on; and (b) immediately preceding financial year
Net Asset Value Per Share
Group Company
29 Feb 2020
31 Aug 2019
29 Feb 2020
31 Aug 2019
Net asset value per share
based on total number of issued shares at the end of period/year (S$)
2.14
2.16
1.36
1.42
Net asset value per share was calculated based on shareholders’ interests, divided by the number of shares (excluding treasury shares) as at the reporting date.
7. A review of the performance of the group, to the extent necessary for a reasonable understanding of the group’s business. It must include a discussion of any significant factors that affected the turnover, costs, and earnings of the group for the current financial period reported on, including (where applicable) seasonal or cyclical factors; and any material factors that affected the cash flow, working capital, assets or liabilities of the group during the current financial period reported on
Review of Results for the Second Quarter ended 29 February 2020 (“2Q 2020”)
compared with the Second Quarter ended 28 February 2019 (“2Q 2019”) 7.1 Income Statement
7.1.1 Group operating revenue comprised mainly advertisement and circulation revenue (print and digital), rental income from retail malls and student accommodation, and income from other businesses (including aged care, events and exhibitions and education). The increase in group operating revenue of S$4.1 million (1.8%), from S$223.3 million in 2Q 2019 to S$227.5 million in 2Q 2020, was due to higher revenue of S$23.9 million (33%) from the Property segment offset by the decline in advertisement and circulation revenue of S$17.5 million (18.3%) and S$2.2 million (6.5%) respectively.
16
Other operating income included sales of production waste and other scrap materials, distribution service fees for third party periodicals, and income from branding events. Other operating income of 2Q 2020 decreased by S$0.7 million (15.1%), from S$4.5 million in 2Q 2019 to S$3.8 million in 2Q 2020.
Total revenue of S$231.3 million in 2Q 2020 was higher by S$3.4 million (1.5%) compared to S$227.8 million in 2Q 2019.
7.1.2 Materials, production and distribution costs included newsprint and other material
costs, factory overheads and distribution costs for the media business, and production costs and supplies for the events and exhibitions and aged care businesses. The reduction in materials, production and distribution costs by S$3.9 million (12.8%), from S$30.2 million in 2Q 2019 to S$26.3 million in 2Q 2020, was in line with lower revenue of the media business.
Staff costs comprised salaries, bonuses, allowances, employers’ contribution to defined contribution plans and share-based compensation expense. The increase in staff costs of S$1.4 million (1.8%), from S$79.9 million in 2Q 2019 to S$81.3 million in 2Q 2020, was mainly due to headcount of the newly acquired businesses. Premises costs relate mainly to rental expenses, property tax, building maintenance costs and utility charges, and are primarily incurred for the retail malls, student accommodation, media and aged care businesses. Premises costs increased S$3.5 million (17.5%), from S$20.2 million in 2Q 2019 to S$23.7 million in 2Q 2020. This quarter saw higher costs of S$3.5 million (151.2%) from the PBSA portfolio due to increased scale of operations, and costs of S$4.7 million from Westfield Marion which was acquired in December 2019. These were substantially offset by lower rental expenses of S$4.3 million (85.6%) with rental expenses being replaced by depreciation expense recognised for right-of-use (ROU) assets and finance charges on lease liabilities following the adoption of SFRS(I) 16 Leases. Depreciation costs increased by S$3.6 million (54.5%) from S$6.6 million in 2Q 2019 to S$10.2 million in 2Q 2020, mainly due to the depreciation of ROU assets. Other operating expenses included business promotion expenses, articles and news agencies’ fees, computer system maintenance and software licence fees, amortisation of intangibles assets, foreign exchange differences and other expenses in line with business activities. Other operating expenses decreased S$7.7 million (24.1%), from S$31.9 million in 2Q 2019 to S$24.2 million in 2Q 2020 due partly to lower business promotion costs of S$4.7 million (61.1%). Finance costs increased by S$4.8 million (38.7%), from S$12.3 million in 2Q 2019 to S$17 million in 2Q 2020, mainly due to interest costs on Medium Term Notes issued in January 2020 and loan facilities taken up to fund the acquisition of new assets in the PBSA portfolio and Westfield Marion. Overall, total costs increased by S$1.1 million (0.6%) from S$181.4 million in 2Q 2019 to S$182.5 million in 2Q 2020.
7.1.3 As a result of the foregoing, operating profit of S$48.8 million in 2Q 2020 was S$2.3 million (5%) higher compared to S$46.5 million in 2Q 2019.

17
7.1.4 Fair value loss on an investment property of S$12.9 million in 2Q 2019 relates mainly
to expensing of stamp duty for Figtree.
7.1.5 Share of results of associates and joint ventures was S$8.6 million (72.6%) lower, from S$11.8 million in 2Q 2019 to S$3.2 million in 2Q 2020, mainly due to the absence of a S$13.9 million fair value gain from Chinatown point recognised last year partially cushioned by the share of profits of S$3.7 million from Konnectivity this year.
7.1.6 Investment income comprised fair value changes on investments and derivatives, foreign exchange differences, and dividend and interest income from the investment portfolio. Investment income for the quarter was a gain of S$3 million against a loss of S$0.7 million in the same quarter last year, mainly due to fair value gains on portfolio investments.
7.1.7 Taxation charge of S$10.3 million in 2Q 2020 was based on the statutory tax rate,
taking into account non-deductible expenses and non-taxable income.
7.1.8 After accounting for non-controlling interests, net profit attributable to shareholders of S$31.3 million in 2Q 2020 was S$1.6 million (5.5%) higher compared to S$29.7 million in 2Q 2019.
18
7.2 Statements of Financial Position
Equity
7.2.1 Equity comprised share capital, treasury shares, reserves and retained profits of the Company’s shareholders, perpetual securities and non-controlling interests. The increase in equity by S$420.8 million (8.9%) from S$4,707.1 million as at 31 August 2019 to S$5,127.9 million as at 29 February 2020 was attributable to S$300 million of perpetual securities issued by the Company and S$162.8 million contribution from non-controlling interests due to the issuance of SPH REIT units.
Non-current assets
7.2.2 Non-current assets comprised property, plant and equipment, investment properties, interests in associates and joint ventures, investments, intangible assets, trade and other receivables, and derivatives. The increase in non-current assets by S$1,518.5 million (24%) from S$6,338.3 million as at 31 August 2019 to S$7,856.9 million as at 29 February 2020 was mainly due to increases in property, plant & equipment, investment properties and intangible assets.
7.2.3 Property, plant and equipment comprised of leasehold land and buildings, plant and equipment, furniture and fittings, and motor vehicles. The increase in property, plant and equipment by S$86.2 million (45.8%), from S$188 million as at 31 August 2019 to S$274.2 million as at 29 February 2020, was attributed to additions of S$6.6 million and the recognition of ROU assets of S$99.5 million following the adoption of SFRS(I) 16 Leases, partially offset by depreciation of S$20.2 million.
7.2.4 Investment properties comprised mainly retail malls and student accommodation assets. The increase in investment properties of S$1,409.7 million (28.1%), from S$5,014.9 million as at 31 August 2019 to S$6,424.6 million as at 29 February 2020, arose mainly from the acquisition of PBSA assets of S$765 million in the United Kingdom and Germany, and retail asset Westfield Marion of S$627.7 million in Australia.
7.2.5 Intangible assets included goodwill, technology, trademarks, licences and mastheads that are acquired mainly through business acquisitions. The increase in intangible assets of S$11.6 million (8.2%), from S$141.2 million as at 31 August 2019 to S$152.8 million as at 29 February 2020, arose mainly from the acquisition of PBSA assets. Current assets
7.2.6 Current assets comprised inventories, trade and other receivables, investments, derivatives, and cash and cash equivalents. The decrease in current assets of S$66.2 million (8.6%) from S$769.1 million as at 31 August 2019 to S$702.9 million as at 29 February 2020, was mainly due to decrease in trade and other receivables, and cash and cash equivalents.
7.2.7 Current trade and other receivables decreased by S$10.3 million (7%), from S$147.4 million as at 31 August 2019 to S$137.1 million as at 29 February 2020. This was mainly due to receipt of proceeds due from disposal of investments partially offset by increased receivables from the expanded PBSA portfolio.
19
7.2.8 Cash and cash equivalents decreased by S$52.4 million (9.4%) from S$554.4 million as at 31 August 2019 to S$502.1 million as at 29 February 2020. Details of the movements are set out in the Consolidated Statement of Cash Flows in paragraph 8(b) and paragraph 10.2. Non-current liabilities
7.2.9 Non-current liabilities comprised trade and other payables, deferred tax liabilities, borrowings, and derivatives. The increase in non-current liabilities by S$785.8 million (45.6%), from S$1,723.3 million as at 31 August 2019 to S$2,509 million as at 29 February 2020 was attributed to increase in borrowings.
7.2.10 Non-current borrowings increased by S$781.9 million (47.5%), from S$1,646 million as at 31 August 2019 to S$2,427.9 million as at 29 February 2020. The increase relates mainly to the net proceeds of S$497.9 million from the issuance of S$500 million Medium Term Notes by the Company, and bank loans of S$185.4 million (A$200 million) taken up to partially fund the acquisition of Westfield Marion. In addition, long-term lease liabilities of S$84.6 million was recognised following the adoption of SFRS(I) 16 Leases.
Current liabilities
7.2.11 Current liabilities comprised trade and other payables, current tax liabilities, borrowings and derivatives. The increase in current liabilities by S$245.8 million (36.3%) from S$677 million as at 31 August 2019 to S$922.8 million as at 29 February 2020, was due to increase in trade and other payables and borrowings.
7.2.12 Current trade and other payables increased by S$26.2 million (11.5%), from S$228.3 million as at 31 August 2019 to S$254.5 million as at 29 February 2020, due to increased collections in advance and payables from the expanded PBSA portfolio.
7.2.13 Current borrowings increased by S$222.2 million (54.1%), from S$411 million as at 31 August 2019 to S$633.2 million as at 29 February 2020. This increase was mainly due to the net drawdown of short-term facilities of S$205 million, largely to fund the acquisition of PBSA assets. In addition, short-term lease liabilities of S$11.7 million was recognised following the adoption of SFRS(I) 16 Leases.
7.2.14 As at 29 February 2020, the Group is in a net current liabilities position of S$219.9 million mainly due to the maturity of loans within the next 12 months. This included a secured term loan of S$280 million taken up by SPH REIT which will be re-financed.
20
7.3 Statement of Cash Flows 2Q 2020 7.3.1 Net cash used in operating activities of S$43.2 million was due to working capital
changes of S$99.8 million and income tax paid of S$21.4 million, partially offset by operating cash inflow of S$78.1 million.
7.3.2 Net cash used in investing activities of S$1,216 million was due to acquisition of
investment properties of S$663.2 million mainly Westfield Marion and acquisition of a subsidiary of S$714.7 million for the PBSA portfolio. These were partially offset by net proceeds from the purchase and disposal of treasury investments of S$167.7 million.
7.3.3 Net cash from financing activities of S$905.9 million was attributed to proceeds (net
of transaction costs) from the issuance of Medium Term Notes of S$497.9 million, drawdown of loan facilities of S$389.3 million (net of repayments), and contribution of S$162.8 million from the non-controlling interests arising from the issuance of SPH REIT units. These were partially offset by dividends and distributions paid of S$125.3 million.
21
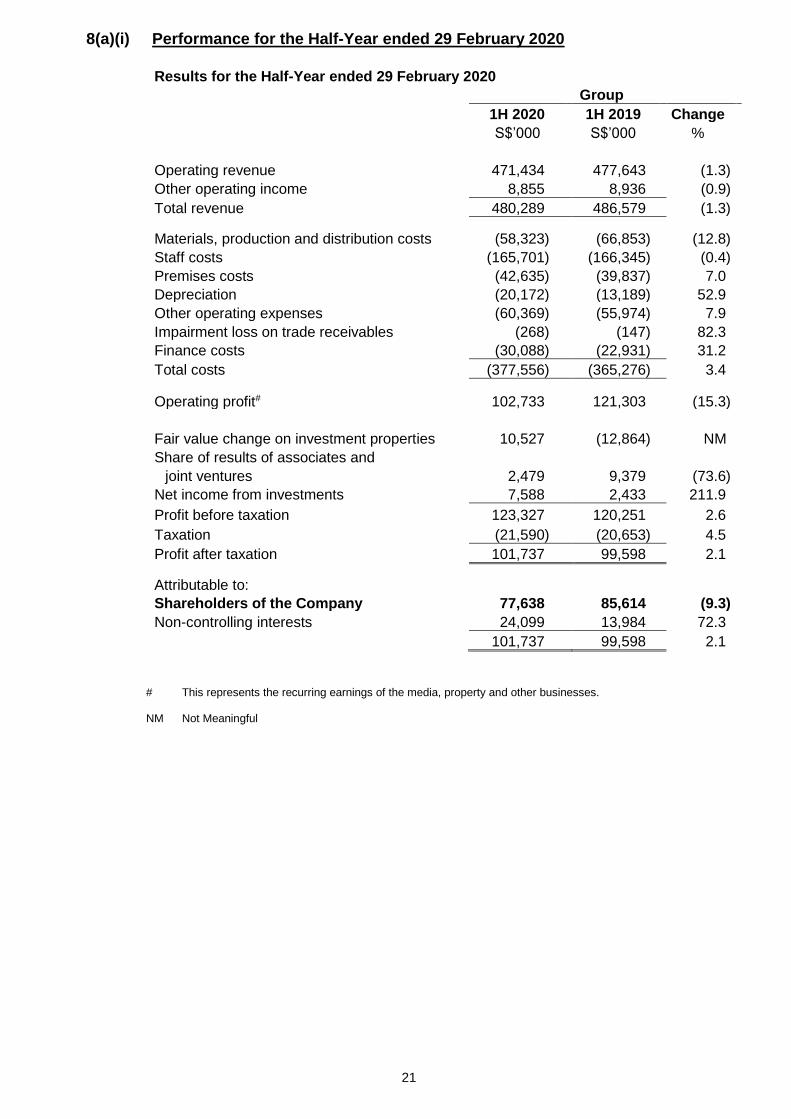
8(a)(i) Performance for the Half-Year ended 29 February 2020
Results for the Half-Year ended 29 February 2020
Group
1H 2020 1H 2019 Change
S$’000 S$’000 %
Operating revenue 471,434 477,643 (1.3)
Other operating income 8,855 8,936 (0.9)
Total revenue 480,289 486,579 (1.3)
Materials, production and distribution costs (58,323) (66,853) (12.8)
Staff costs (165,701) (166,345) (0.4)
Premises costs (42,635) (39,837) 7.0
Depreciation (20,172) (13,189) 52.9
Other operating expenses (60,369) (55,974) 7.9
Impairment loss on trade receivables (268) (147) 82.3
Finance costs (30,088) (22,931) 31.2
Total costs (377,556) (365,276) 3.4
Operating profit# 102,733 121,303 (15.3)
Fair value change on investment properties 10,527 (12,864) NM
Share of results of associates and
joint ventures 2,479 9,379 (73.6)
Net income from investments 7,588 2,433 211.9
Profit before taxation 123,327 120,251 2.6
Taxation (21,590) (20,653) 4.5
Profit after taxation 101,737 99,598 2.1
Attributable to:
Shareholders of the Company 77,638 85,614 (9.3)
Non-controlling interests 24,099 13,984 72.3
101,737 99,598 2.1
# This represents the recurring earnings of the media, property and other businesses.
NM Not Meaningful

22
8(a)(ii) Notes: Profit after taxation is arrived at after accounting for:
Group
1H 2020 1H 2019 Change
S$’000 S$’000 %
Write-back of allowance/(Allowance) for
stock obsolescence 459 (347) NM
Share-based compensation expense (1,545) (1,914) (19.3)
Retrenchment costs (7,209) - NM
Profit on disposal of property, plant and
equipment 1,236 118 947.5
Amortisation of intangible assets (3,721) (4,068) (8.5)
Gain on divestment of interests in subsidiaries - 396 NM
Gain/(Loss) on divestment of interests in
associates 477 (426) NM
Interest income from treasury and operations 5,201 3,783 37.5
Net fair value changes on
- Investments at fair value through profit or loss
(“FVTPL”) (151) (647) (76.7)
- Derivatives (foreign exchange forwards) 164 786 (79.1)
Net foreign exchange differences 1,085 (474) NM
Net (under)/over-provision of prior years’
taxation (285) 184 NM
23
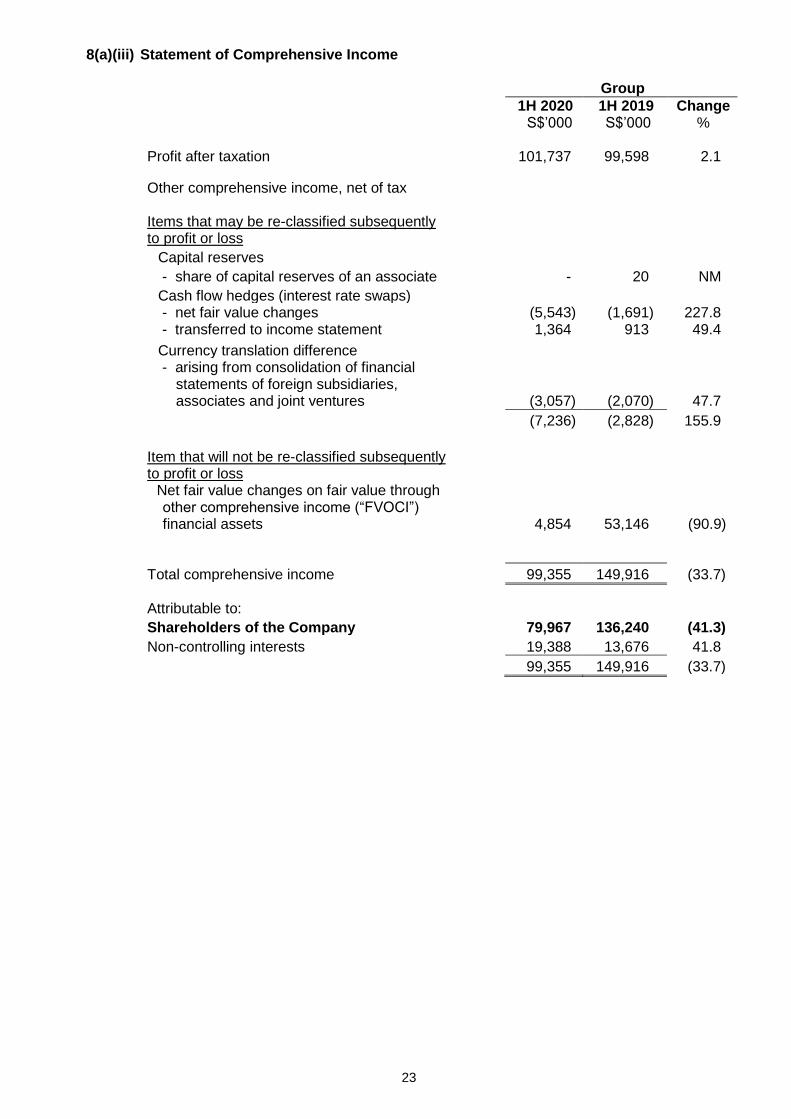
8(a)(iii) Statement of Comprehensive Income
Group
1H 2020 1H 2019 Change S$’000 S$’000 % Profit after taxation 101,737 99,598 2.1
Other comprehensive income, net of tax Items that may be re-classified subsequently to profit or loss
Capital reserves
- share of capital reserves of an associate - 20 NM
Cash flow hedges (interest rate swaps) - net fair value changes (5,543) (1,691) 227.8 - transferred to income statement 1,364 913 49.4
Currency translation difference - arising from consolidation of financial
statements of foreign subsidiaries, associates and joint ventures (3,057) (2,070) 47.7
(7,236) (2,828) 155.9
Item that will not be re-classified subsequently to profit or loss
Net fair value changes on fair value through other comprehensive income (“FVOCI”) financial assets 4,854 53,146 (90.9)
Total comprehensive income 99,355 149,916 (33.7)
Attributable to:
Shareholders of the Company 79,967 136,240 (41.3)
Non-controlling interests 19,388 13,676 41.8
99,355 149,916 (33.7)

24
8(b) A statement of cash flows (for the group), together with a comparative
statement for the corresponding period of the immediately preceding financial year
Consolidated Statement of Cash Flows for the Half Year ended 29 February 2020
1H 2020 1H 2019
S$’000 S$’000
CASH FLOWS FROM OPERATING ACTIVITIES
Profit before taxation 123,327 120,251
Adjustments for:
Depreciation 20,172 13,189
Profit on disposal of property, plant and
equipment (1,236) (118)
Fair value change on investment properties (10,527) 12,864
Share of results of associates and joint ventures (2,479) (9,379)
Gain on divestments of interests in subsidiaries - (396)
(Gain)/Loss on divestment of interests in associates (477) 426
Net income from investments (7,588) (2,433)
Amortisation of intangible assets 3,721 4,068
Impairment loss on trade receivables 268 147
Finance costs 30,088 22,931
Share-based compensation expense 1,545 1,914
Other non-cash items 1,373 (340)
Operating cash flow before working capital changes 158,187 163,124
Changes in operating assets and liabilities, net of effects from acquisition and disposal of subsidiaries and business:
Inventories 2,307 (6,180)
Trade and other receivables, current 1,685 (8,629)
Trade and other payables, current (29,146) 4,996
Trade and other receivables, non-current 217 983
Trade and other payables, non-current (456) (5,400)
Others 453 (4,365)
133,247 144,529
Income tax paid (22,271) (25,565)
Net cash from operating activities 110,976 118,964
25
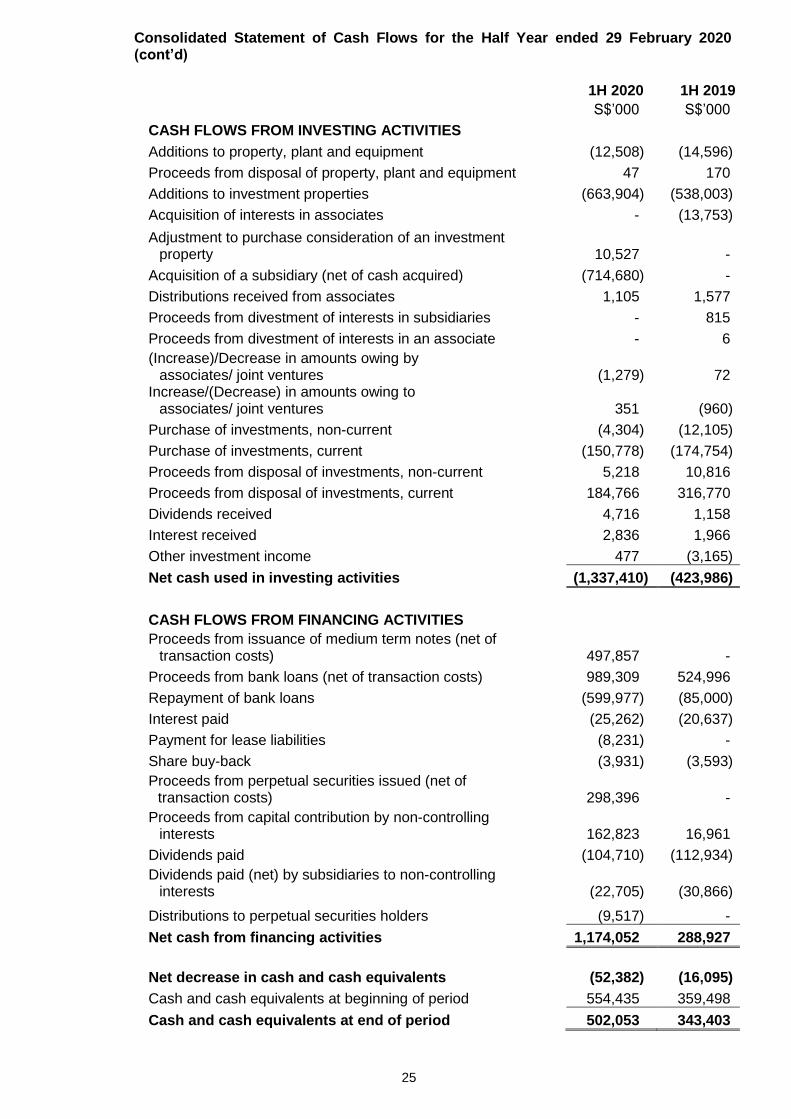
Consolidated Statement of Cash Flows for the Half Year ended 29 February 2020 (cont’d)
1H 2020 1H 2019
S$’000 S$’000
CASH FLOWS FROM INVESTING ACTIVITIES
Additions to property, plant and equipment (12,508) (14,596)
Proceeds from disposal of property, plant and equipment 47 170
Additions to investment properties (663,904) (538,003)
Acquisition of interests in associates - (13,753)
Adjustment to purchase consideration of an investment property 10,527 -
Acquisition of a subsidiary (net of cash acquired) (714,680) -
Distributions received from associates 1,105 1,577
Proceeds from divestment of interests in subsidiaries - 815
Proceeds from divestment of interests in an associate - 6
(Increase)/Decrease in amounts owing by associates/ joint ventures (1,279) 72
Increase/(Decrease) in amounts owing to associates/ joint ventures 351 (960)
Purchase of investments, non-current (4,304) (12,105)
Purchase of investments, current (150,778) (174,754)
Proceeds from disposal of investments, non-current 5,218 10,816
Proceeds from disposal of investments, current 184,766 316,770
Dividends received 4,716 1,158
Interest received 2,836 1,966
Other investment income 477 (3,165)
Net cash used in investing activities (1,337,410) (423,986)
CASH FLOWS FROM FINANCING ACTIVITIES
Proceeds from issuance of medium term notes (net of transaction costs) 497,857 -
Proceeds from bank loans (net of transaction costs) 989,309 524,996
Repayment of bank loans (599,977) (85,000)
Interest paid (25,262) (20,637)
Payment for lease liabilities (8,231) -
Share buy-back (3,931) (3,593)
Proceeds from perpetual securities issued (net of transaction costs) 298,396 -
Proceeds from capital contribution by non-controlling interests 162,823 16,961
Dividends paid (104,710) (112,934)
Dividends paid (net) by subsidiaries to non-controlling interests (22,705) (30,866)
Distributions to perpetual securities holders (9,517) -
Net cash from financing activities 1,174,052 288,927
Net decrease in cash and cash equivalents (52,382) (16,095)
Cash and cash equivalents at beginning of period 554,435 359,498
Cash and cash equivalents at end of period 502,053 343,403
26
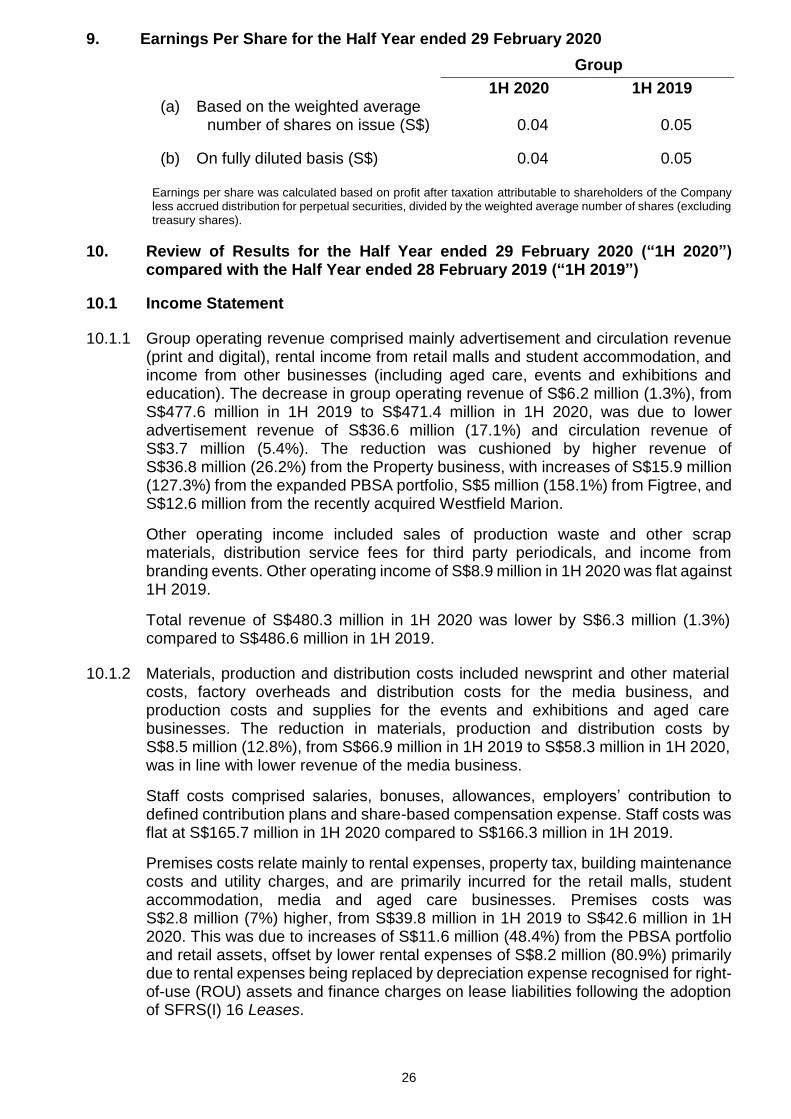
9. Earnings Per Share for the Half Year ended 29 February 2020
Group
1H 2020 1H 2019 (a) Based on the weighted average
number of shares on issue (S$) 0.04 0.05
(b) On fully diluted basis (S$) 0.04 0.05
Earnings per share was calculated based on profit after taxation attributable to shareholders of the Company less accrued distribution for perpetual securities, divided by the weighted average number of shares (excluding treasury shares).
10. Review of Results for the Half Year ended 29 February 2020 (“1H 2020”) compared with the Half Year ended 28 February 2019 (“1H 2019”)
10.1 Income Statement
10.1.1 Group operating revenue comprised mainly advertisement and circulation revenue (print and digital), rental income from retail malls and student accommodation, and income from other businesses (including aged care, events and exhibitions and education). The decrease in group operating revenue of S$6.2 million (1.3%), from S$477.6 million in 1H 2019 to S$471.4 million in 1H 2020, was due to lower advertisement revenue of S$36.6 million (17.1%) and circulation revenue of S$3.7 million (5.4%). The reduction was cushioned by higher revenue of S$36.8 million (26.2%) from the Property business, with increases of S$15.9 million (127.3%) from the expanded PBSA portfolio, S$5 million (158.1%) from Figtree, and S$12.6 million from the recently acquired Westfield Marion.
Other operating income included sales of production waste and other scrap materials, distribution service fees for third party periodicals, and income from branding events. Other operating income of S$8.9 million in 1H 2020 was flat against 1H 2019.
Total revenue of S$480.3 million in 1H 2020 was lower by S$6.3 million (1.3%) compared to S$486.6 million in 1H 2019.
10.1.2 Materials, production and distribution costs included newsprint and other material costs, factory overheads and distribution costs for the media business, and production costs and supplies for the events and exhibitions and aged care businesses. The reduction in materials, production and distribution costs by S$8.5 million (12.8%), from S$66.9 million in 1H 2019 to S$58.3 million in 1H 2020, was in line with lower revenue of the media business.
Staff costs comprised salaries, bonuses, allowances, employers’ contribution to defined contribution plans and share-based compensation expense. Staff costs was flat at S$165.7 million in 1H 2020 compared to S$166.3 million in 1H 2019.
Premises costs relate mainly to rental expenses, property tax, building maintenance costs and utility charges, and are primarily incurred for the retail malls, student accommodation, media and aged care businesses. Premises costs was S$2.8 million (7%) higher, from S$39.8 million in 1H 2019 to S$42.6 million in 1H 2020. This was due to increases of S$11.6 million (48.4%) from the PBSA portfolio and retail assets, offset by lower rental expenses of S$8.2 million (80.9%) primarily due to rental expenses being replaced by depreciation expense recognised for right-of-use (ROU) assets and finance charges on lease liabilities following the adoption of SFRS(I) 16 Leases.
27
Depreciation costs increased by S$7 million (52.9%) from S$13.2 million in 1H 2019 to S$20.2 million in 1H 2020, mainly due to the depreciation of ROU assets. Other operating expenses included business promotion expenses, articles and news agencies’ fees, computer system maintenance and software licence fees, amortisation of intangibles assets, foreign exchange differences and other expenses in line with business activities. Other operating expenses increased S$4.4 million (7.9%), from S$56 million in 1H 2019 to S$60.4 million in 1H 2020. This was due to retrenchment costs of S$7.2 million. Finance costs increased by S$7.2 million (31.2%), from S$22.9 million in 1H 2019 to S$30.1 million in 1H 2020, mainly due to interest costs on Medium Term Notes issued in January 2020 and loan facilities taken up to fund the acquisition of new assets in the PBSA portfolio, Figtree and Westfield Marion. Overall, total costs increased by S$12.3 million (3.4%) from S$365.3 million in 1H 2019 to S$377.6 million in 1H 2020.
10.1.3 As a result of the foregoing, operating profit of S$102.7 million in 1H 2020 was
S$18.6 million (15.3%) lower compared to S$121.3 million in 1H 2019.
10.1.4 Fair value gain on investment properties of S$10.5 million in 1H 2020 arose from an adjustment to the purchase consideration of an asset in the PBSA portfolio. Fair value loss on investment properties of S$12.9 million in 1H 2019 relates mainly to expensing of stamp duty for Figtree.
10.1.5 The share of results of associates and joint ventures was S$6.9 million (73.6%)
lower, from S$9.4 million in 1H 2019 to S$2.5 million in 1H 2020. This was mainly due to the absence of a S$13.9 million fair value gain from Chinatown Point recognised last year, partially cushioned by share of profit of S$6 million from Konnectivity this year.
10.1.6 Investment income comprised fair value changes on investments and derivatives,
foreign exchange differences, and dividend and interest income from the investment portfolio. Investment income increased S$5.2 million (211.9%), from S$2.4 million in 1H 2019 to S$7.6 million in 1H 2020. This was due to higher dividend income this year and absence of foreign exchange losses recognised last year.
10.1.7 Taxation charge of S$21.6 million in 1H 2020 was based on the statutory tax rate, taking into account non-deductible expenses and non-taxable income. This included an amount of S$0.3 million for under-provision of taxation in respect of prior years.
10.1.8 After accounting for non-controlling interests, net profit attributable to shareholders of S$77.6 million in 1H 2020 was S$8 million (9.3%) lower compared to S$85.6 million in 1H 2019.
28
10.2 Statement of Cash Flows 1H 2020
10.2.1 Net cash from operating activities of S$111 million was due to cash inflow from
operating activities of S$158.2 million, partially offset by working capital changes of S$24.9 million and income tax paid of S$22.3 million.
10.2.2 Net cash used in investing activities of S$1,337.4 million was due to additions to
investment properties of S$663.9 million mainly Westfield Marion and acquisition of a subsidiary of S$714.7 million for the PBSA portfolio. These were partially offset by net proceeds from the purchase and disposal of treasury investments of S$34.9 million.
10.2.3 Net cash from financing activities of S$1,174.1 million was attributed to proceeds
(net of transaction costs) from the issuance of Medium Term Notes of S$497.9 million and perpetual securities of S$298.4 million by the Company, drawdown of loan facilities of S$389.3 million (net of repayments), and contribution of S$162.8 million from the non-controlling interests arising from the issuance of SPH REIT units. These were partially offset by dividends and distributions paid of S$136.9 million and interest payment of S$25.3 million.

29
11. Segmental information (of the group) for the Half Year ended 29 February 2020
Business Segments
The Group is organised into three major operating segments, namely Media, Property, and Others. The Media segment is involved in the production of content for distribution on print and other media platforms. The Property segment holds, manages and develops properties in the retail, student accommodation and residential sectors. Other operations under the Group, which are currently not significant to be reported separately, are included under “Others”. These include the Group’s businesses and investments in online classifieds, aged care, events and exhibitions, education, New Media Fund, Treasury and Investment and other business adjacencies.
Group Segmental Information
1H 2020 Media Property Others Eliminations Consolidated
S$’000 S$’000 S$’000 S$’000 S$’000 Operating revenue External sales 253,854 177,087 40,493 - 471,434 Inter-segmental sales 1,928 1,583 807 (4,318) -
Total operating revenue 255,782 178,670 41,300 (4,318) 471,434
Result Segment result 11,436 126,744 2,229 - 140,409 Finance costs (1,097) (28,453) (538) - (30,088) Fair value change on
investment properties - 10,527 - - 10,527 Share of results of associates and joint ventures - (3,965) 6,444 - 2,479
Profit before taxation 10,339 104,853 8,135 - 123,327
1H 2019
Media Property Others Eliminations Consolidated S$’000 S$’000 S$’000 S$’000 S$’000 Operating revenue External sales 296,162 140,331 41,150 - 477,643 Inter-segmental sales 1,816 1,074 683 (3,573) -
Total operating revenue 297,978 141,405 41,833 (3,573) 477,643
Result Segment result 42,397 106,074 (1,804) - 146,667 Finance costs - (22,830) (101) - (22,931) Fair value change on
investment properties - (12,864) - - (12,864) Share of results of associates and joint ventures (325) 9,401 303 - 9,379
Profit/(Loss) before taxation
42,072 79,781 (1,602) - 120,251
30
Group Segmental Review Media Revenue for the Media business declined S$42.3 million (14.3%), from S$296.2 million in 1H 2019 to S$253.9 million in 1H 2020. Media advertisement revenue fell by S$37.9 million (18.5%) with Newspaper print advertisement revenue declining by S$32.2 million (20.4%). Newspaper digital advertisement revenue reported growth of S$0.5 million (3.7%) year-on-year. Circulation revenue fell S$3.7 million (5.4%) as daily average newspaper print sales decreased by 53,109 copies (10.7%), while daily average newspaper digital sales increased by 110,355 copies (50.2%) excluding copies relating to a barter agreement which has ended. Profit before tax was S$31.7 million (75.4%) lower year-on-year, from S$42.1 million in 1H 2019 to S$10.3 million in 1H 2020. The decrease was due to revenue decline of S$42.3 million (14.3%) and retrenchment costs of S$7.2 million recognised in 1H 2020, partially cushioned by reduction in materials, production and distribution costs of S$9.1 million (13.9%), staff costs of S$4.2 million (3%) and business promotion costs of S$4.2 million (41.9%).
Property
Revenue for the Property segment rose by S$36.8 million (26.2%), from S$140.3 million in 1H 2019 to S$177.1 million in 1H 2020. The PBSA portfolio recorded higher revenue of S$15.9 million (127.3%) attributable to assets acquired subsequent to 1H 2019. There was also higher revenue of S$5 million (158.1%) from Figtree which was acquired in December 2018. In addition, the acquisition of Westfield Marion in December 2019 contributed revenue of S$12.6 million in 1H 2020. Profit before tax increased by S$25.1 million (31.4%), from S$79.8 million in 1H 2019 to S$104.9 million in 1H 2020. Operating profit was S$15 million (18.1%) higher compared to 1H 2019. In addition, the Group recognised a fair value gain of S$10.5 million arising from an adjustment to the purchase consideration of an asset in the PBSA portfolio. In the corresponding period last year, the Group recorded a fair value loss on an investment property of S$12.9 million relating mainly to the stamp duty expense for Figtree, and a S$13.9 million fair value gain on Chinatown Point.
Others Revenue for the Others segment decreased by S$0.7 million (1.6%), from S$41.2 million in 1H 2019 to S$40.5 million in 1H 2020. Profit before tax was S$8.1 million in 1H 2020 against a loss of S$1.6 million in 1H 2019. The increase was mainly due to share of profit from an associate, Konnectivity Pte Ltd.
31
12. Where a forecast, or a prospect statement, has been previously disclosed to
shareholders, any variance between it and the actual results
No forecast was made previously. 13. A commentary at the date of announcement of the significant trends and
competitive conditions of the industry in which the group operates and any known factors or events that may affect the group in the next reporting period and the next 12 months
Post 1HFY20 – Covid-19 impact 13.1 The 1HFY20’s results reflect the initial impact of the Covid-19 outbreak on the Group’s
business segments. In the Media segment, advertising was affected across most sectors with the exception of government spending.
13.2 The Group’s other business segments have since been similarly disrupted. In the
Property segment, tenants in the retail malls in Singapore and Australia have been affected by lower footfall due to strict social distancing measures. The latest ‘circuit breaker’ measures in Singapore are the most recent examples. SPH REIT has responded with the offer of rental rebates to tenants as well as targeted assistance. It will also be fully passing on the total property tax rebates given by the Inland Revenue Authority of Singapore to its tenants.
13.3 The PBSA business has also been affected by UK university closures and students
returning home. Students who leave do not have to pay rent for the remainder of the AY19/20. The duration of the university closures is unknown.
13.4 The Group will continue to provide reliable reporting on the Covid-19 situation and to
progress its digital transformation initiatives. With the uncertainty over the depth and duration of the Covid-19 pandemic, the Group will need to adopt a prudent approach in managing its cashflows and investment activities.
Post 1HFY20 – Changes in Financial Reporting Frequency 13.5 Going forward, SPH will be adopting the option of semi-annual reporting. The Group
believes that this will encourage investors to take a longer-term view of the business. However, the Group will provide a business commentary on the first and third quarter performance, to update investors between the half-yearly reports while continuing to comply with its continuing disclosure obligations.
32
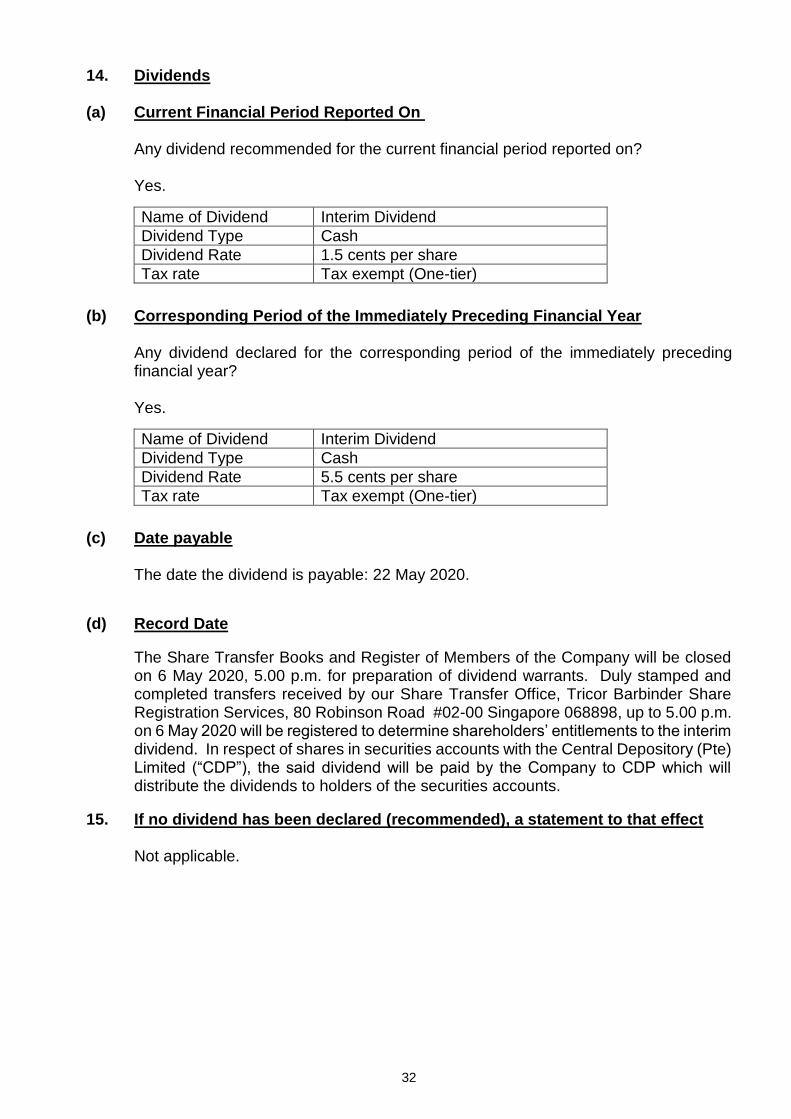
14. Dividends (a) Current Financial Period Reported On Any dividend recommended for the current financial period reported on? Yes.
Name of Dividend Interim Dividend
Dividend Type Cash
Dividend Rate 1.5 cents per share
Tax rate Tax exempt (One-tier)
(b) Corresponding Period of the Immediately Preceding Financial Year Any dividend declared for the corresponding period of the immediately preceding
financial year? Yes.
Name of Dividend Interim Dividend
Dividend Type Cash
Dividend Rate 5.5 cents per share
Tax rate Tax exempt (One-tier)
(c) Date payable The date the dividend is payable: 22 May 2020.
(d) Record Date
The Share Transfer Books and Register of Members of the Company will be closed on 6 May 2020, 5.00 p.m. for preparation of dividend warrants. Duly stamped and completed transfers received by our Share Transfer Office, Tricor Barbinder Share Registration Services, 80 Robinson Road #02-00 Singapore 068898, up to 5.00 p.m. on 6 May 2020 will be registered to determine shareholders’ entitlements to the interim dividend. In respect of shares in securities accounts with the Central Depository (Pte) Limited (“CDP”), the said dividend will be paid by the Company to CDP which will distribute the dividends to holders of the securities accounts.
15. If no dividend has been declared (recommended), a statement to that effect
Not applicable.

33
16. If the group has obtained a general mandate from shareholders for Interested Person Transactions, the aggregate value of such transactions as required under Rule 920(1)(a)(ii). If no IPT mandate has been obtained, a statement to that effect.
The Company has not obtained a general mandate from shareholders for Interested
Person Transactions.
17. Please disclose a confirmation that the Company has procured undertakings from all its directors and executive officers (in the format set out in Appendix 7.7) under Rule 720(1).
The Company confirms that it has procured undertakings from all its Directors and Executive Officers pursuant to Rule 720(1) of the SGX Listing Manual.
BY ORDER OF THE BOARD
Ginney Lim May Ling Khor Siew Kim
Company Secretaries
Singapore, 7 April 2020