Embed Size (px)
Citation preview
139W P 6: TRAINING & EDUCATIONF. GUTIÉRREZ-SOLANAS. CICEROJ.A. ALVAREZR. LACALLE
G1RT-CT-2001-05071
D. EXAMPLES
W P 6: TRAINING & EDUCATION

140W P 6: TRAINING & EDUCATIONF. GUTIÉRREZ-SOLANAS. CICEROJ.A. ALVAREZR. LACALLE
G1RT-CT-2001-05071
VALIDATION EXAMPLE
Planar Wide Plates•Introduction
•Geometry and Imput Data
•Materials
•Toughness
•Formulation and Calculus
•Diagrams
•Results
•Analysis
•Bibliography/References
W P 6: TRAINING & EDUCATION
141W P 6: TRAINING & EDUCATIONF. GUTIÉRREZ-SOLANAS. CICEROJ.A. ALVAREZR. LACALLE
G1RT-CT-2001-05071
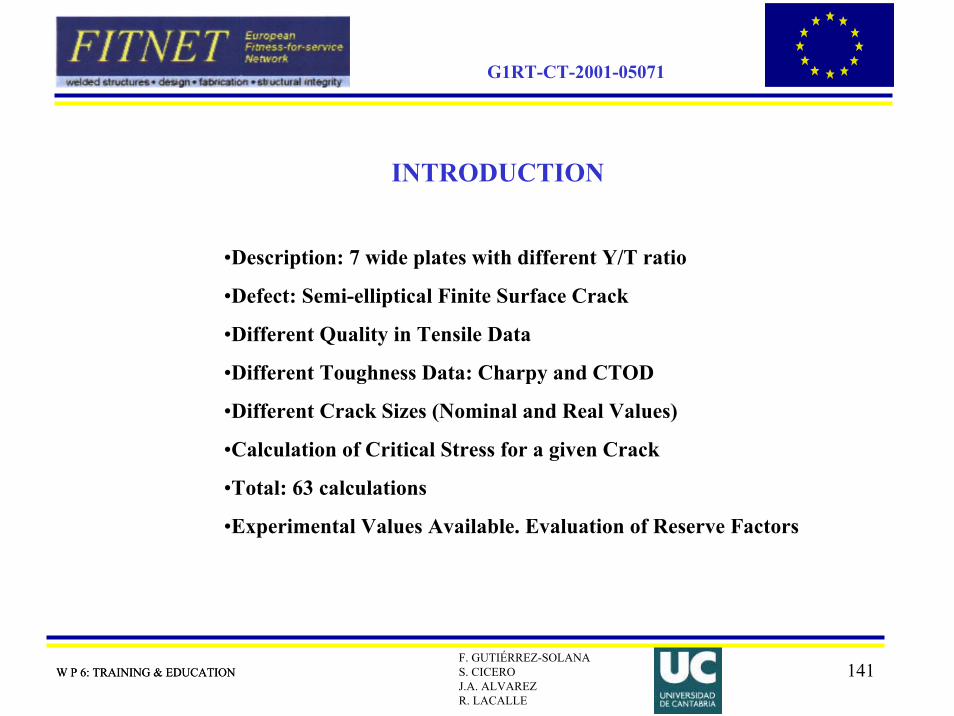
INTRODUCTION
•Description: 7 wide plates with different Y/T ratio
•Defect: Semi-elliptical Finite Surface Crack
•Different Quality in Tensile Data
•Different Toughness Data: Charpy and CTOD
•Different Crack Sizes (Nominal and Real Values)
•Calculation of Critical Stress for a given Crack
•Total: 63 calculations
•Experimental Values Available. Evaluation of Reserve Factors
W P 6: TRAINING & EDUCATION
142W P 6: TRAINING & EDUCATIONF. GUTIÉRREZ-SOLANAS. CICEROJ.A. ALVAREZR. LACALLE
G1RT-CT-2001-05071
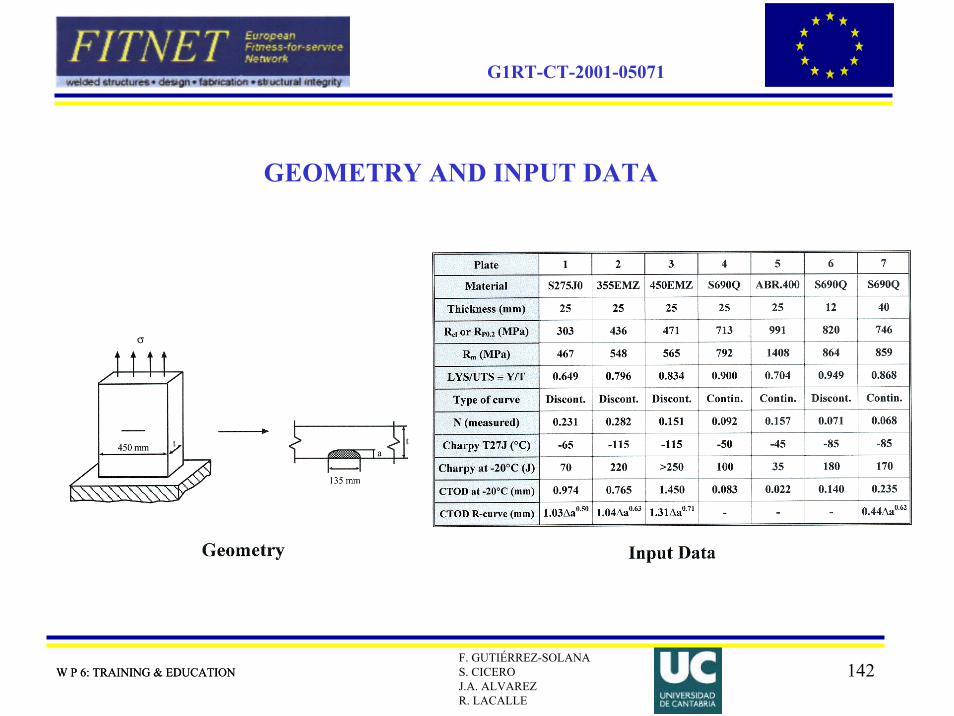
GEOMETRY AND INPUT DATA
W P 6: TRAINING & EDUCATION
143W P 6: TRAINING & EDUCATIONF. GUTIÉRREZ-SOLANAS. CICEROJ.A. ALVAREZR. LACALLE
G1RT-CT-2001-05071
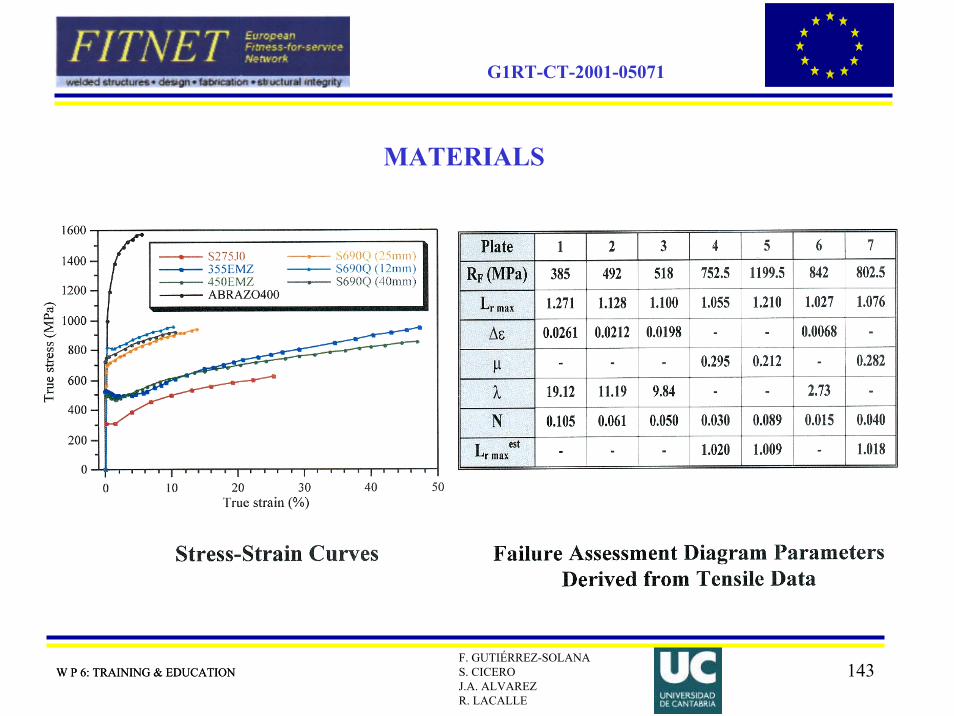
MATERIALS
W P 6: TRAINING & EDUCATION
144W P 6: TRAINING & EDUCATIONF. GUTIÉRREZ-SOLANAS. CICEROJ.A. ALVAREZR. LACALLE
G1RT-CT-2001-05071
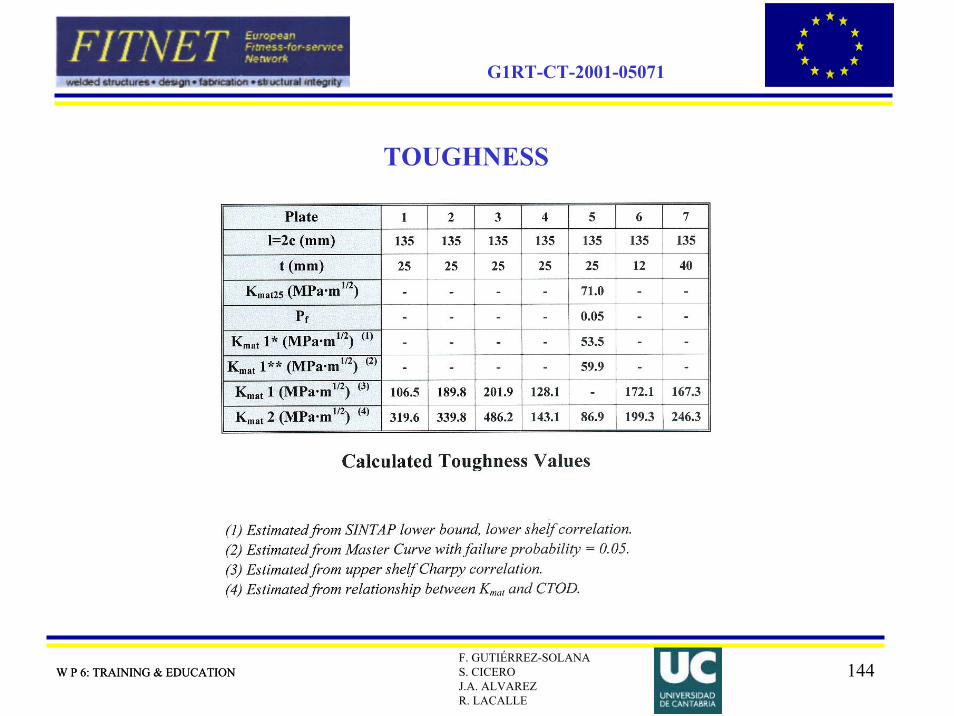
TOUGHNESS
W P 6: TRAINING & EDUCATION
145W P 6: TRAINING & EDUCATIONF. GUTIÉRREZ-SOLANAS. CICEROJ.A. ALVAREZR. LACALLE
G1RT-CT-2001-05071
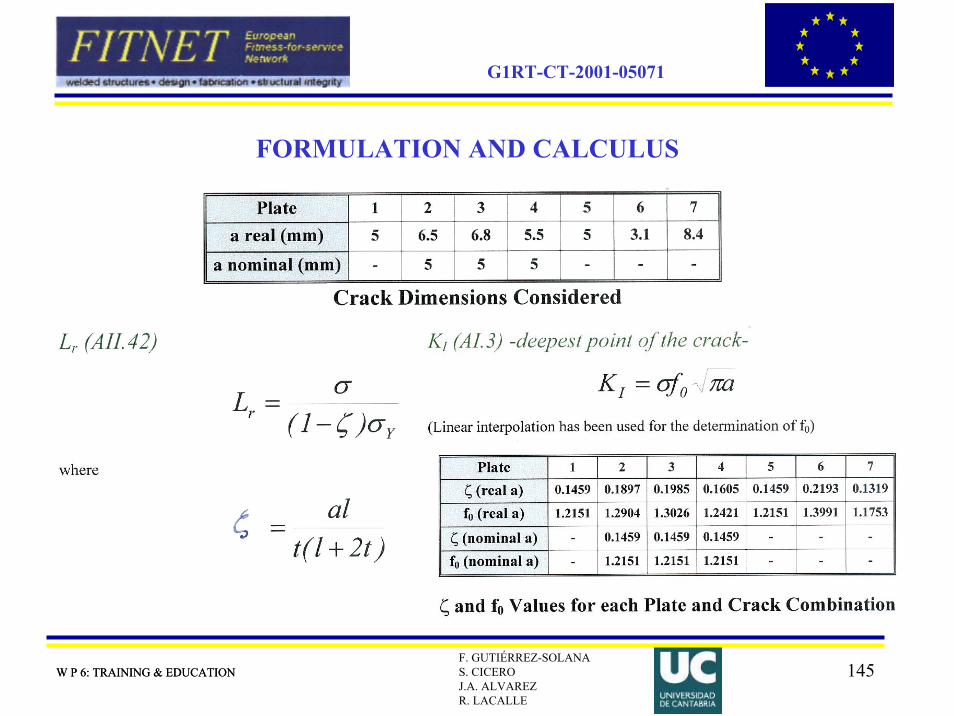
FORMULATION AND CALCULUS
W P 6: TRAINING & EDUCATION
146W P 6: TRAINING & EDUCATIONF. GUTIÉRREZ-SOLANAS. CICEROJ.A. ALVAREZR. LACALLE
G1RT-CT-2001-05071
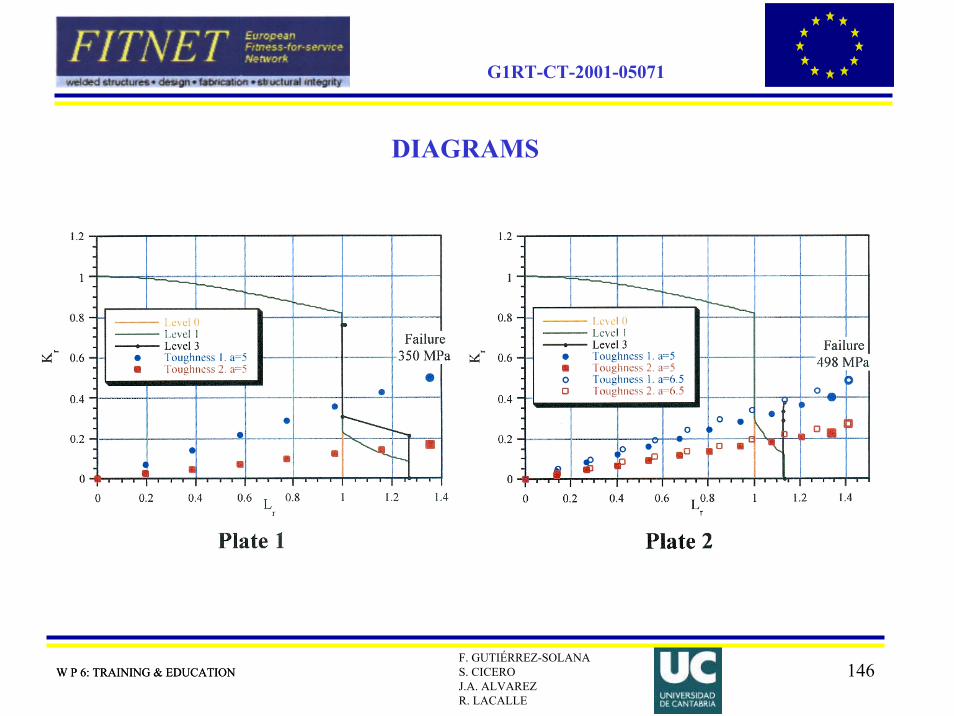
DIAGRAMS
W P 6: TRAINING & EDUCATION

147W P 6: TRAINING & EDUCATIONF. GUTIÉRREZ-SOLANAS. CICEROJ.A. ALVAREZR. LACALLE
G1RT-CT-2001-05071
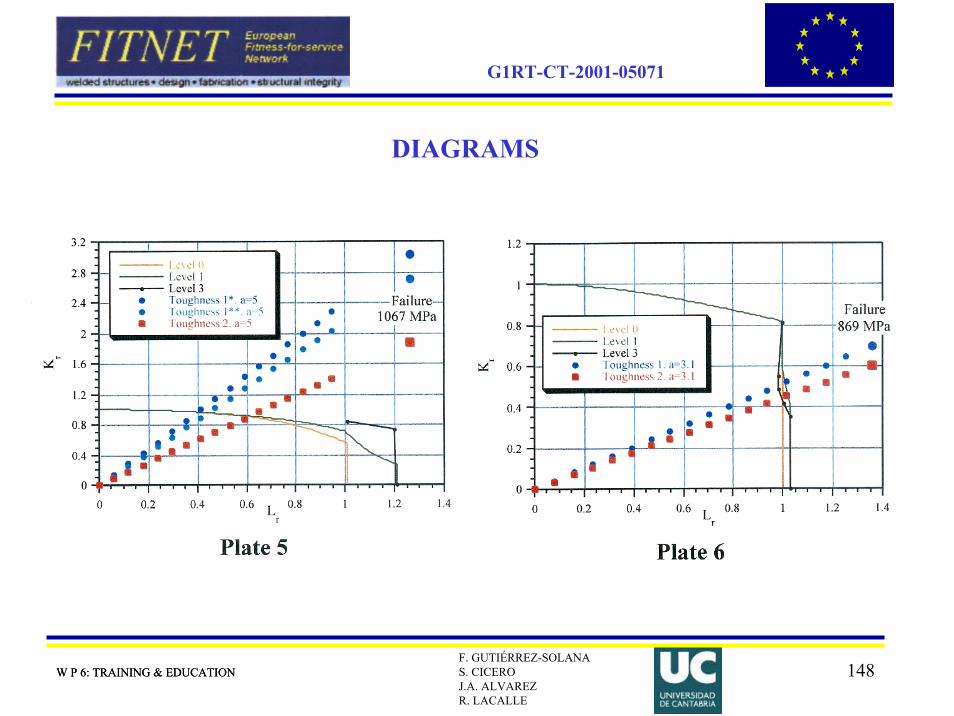
DIAGRAMS
W P 6: TRAINING & EDUCATION
148W P 6: TRAINING & EDUCATIONF. GUTIÉRREZ-SOLANAS. CICEROJ.A. ALVAREZR. LACALLE
G1RT-CT-2001-05071
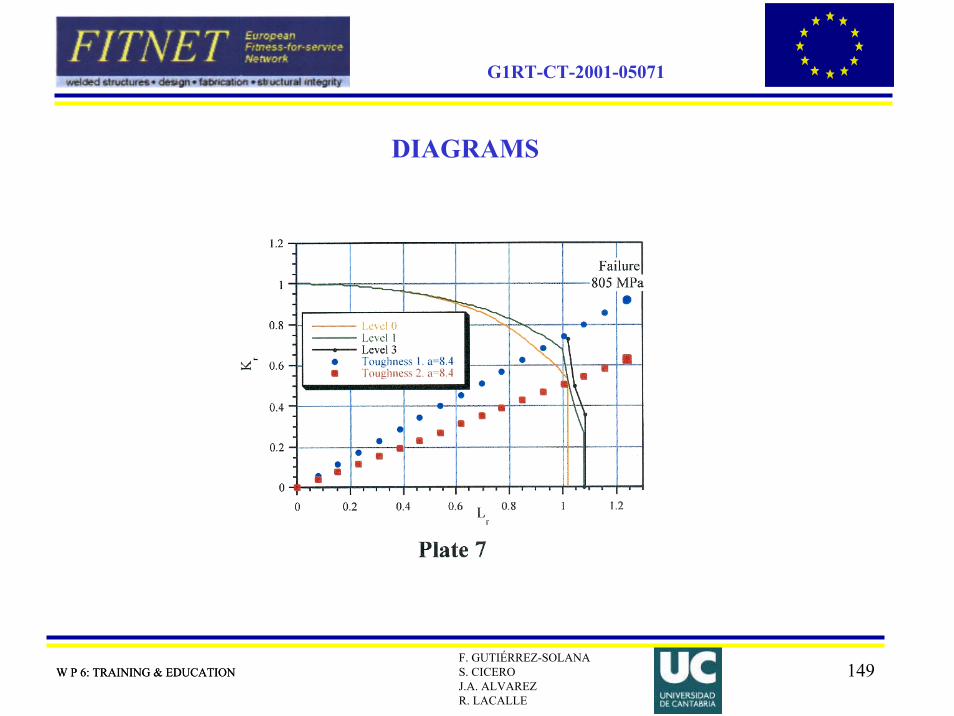
DIAGRAMS
W P 6: TRAINING & EDUCATION
149W P 6: TRAINING & EDUCATIONF. GUTIÉRREZ-SOLANAS. CICEROJ.A. ALVAREZR. LACALLE
G1RT-CT-2001-05071
DIAGRAMS
W P 6: TRAINING & EDUCATION

150W P 6: TRAINING & EDUCATIONF. GUTIÉRREZ-SOLANAS. CICEROJ.A. ALVAREZR. LACALLE
G1RT-CT-2001-05071
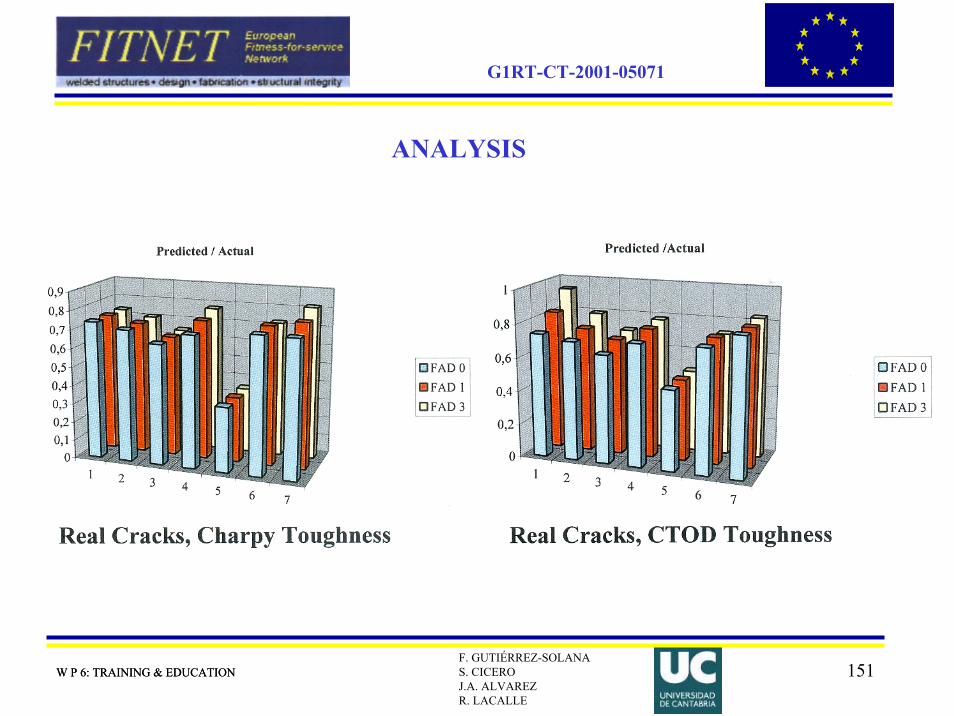
RESULTS
W P 6: TRAINING & EDUCATION
151W P 6: TRAINING & EDUCATIONF. GUTIÉRREZ-SOLANAS. CICEROJ.A. ALVAREZR. LACALLE
G1RT-CT-2001-05071
ANALYSIS
W P 6: TRAINING & EDUCATION
152W P 6: TRAINING & EDUCATIONF. GUTIÉRREZ-SOLANAS. CICEROJ.A. ALVAREZR. LACALLE
G1RT-CT-2001-05071
BIBLIOGRAPHY / REFERENCES
• Ruiz Ocejo J. and Gutiérrez-Solana F., “SINTAP Validation Report”, June 1999
W P 6: TRAINING & EDUCATION

153W P 6: TRAINING & EDUCATIONF. GUTIÉRREZ-SOLANAS. CICEROJ.A. ALVAREZR. LACALLE
G1RT-CT-2001-05071
CASE STUDY EXAMPLE
Hip Implant
• Introduction: The Case Study
• Geometry
• Material Properties
• Objectives
• Failure Analysis
• Summary
W P 6: TRAINING & EDUCATION
154W P 6: TRAINING & EDUCATIONF. GUTIÉRREZ-SOLANAS. CICEROJ.A. ALVAREZR. LACALLE
G1RT-CT-2001-05071
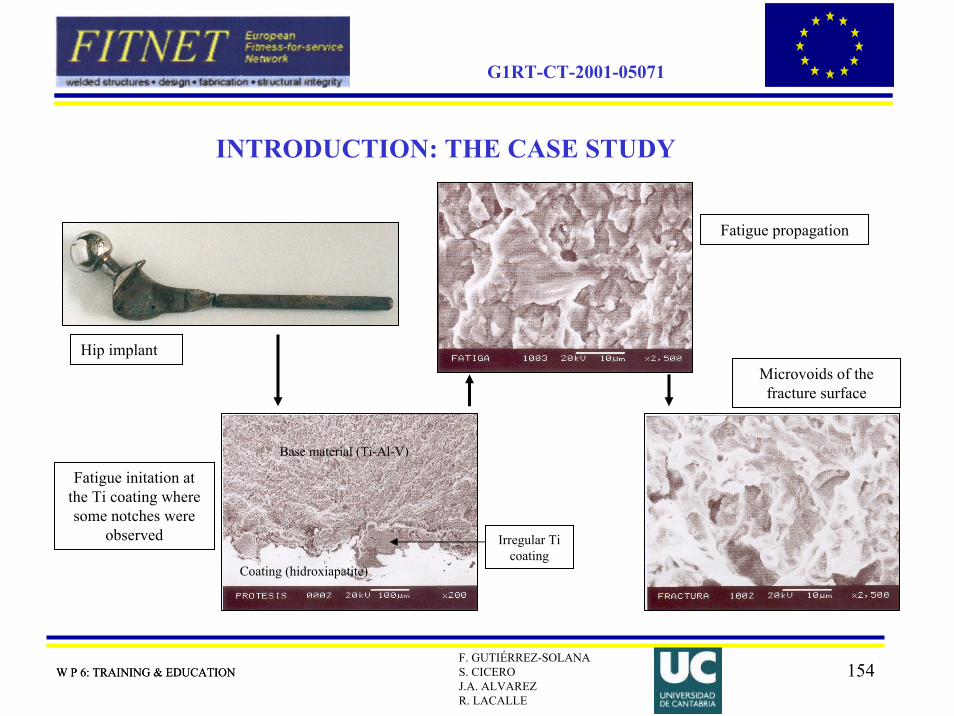
INTRODUCTION: THE CASE STUDY
Hip implant
Fatigue initation atthe Ti coating wheresome notches were
observed
Coating (hidroxiapatite)
Fatigue propagation
Microvoids of thefracture surface
Base material (Ti-Al-V)
Irregular Ti coating
W P 6: TRAINING & EDUCATION
155W P 6: TRAINING & EDUCATIONF. GUTIÉRREZ-SOLANAS. CICEROJ.A. ALVAREZR. LACALLE
G1RT-CT-2001-05071
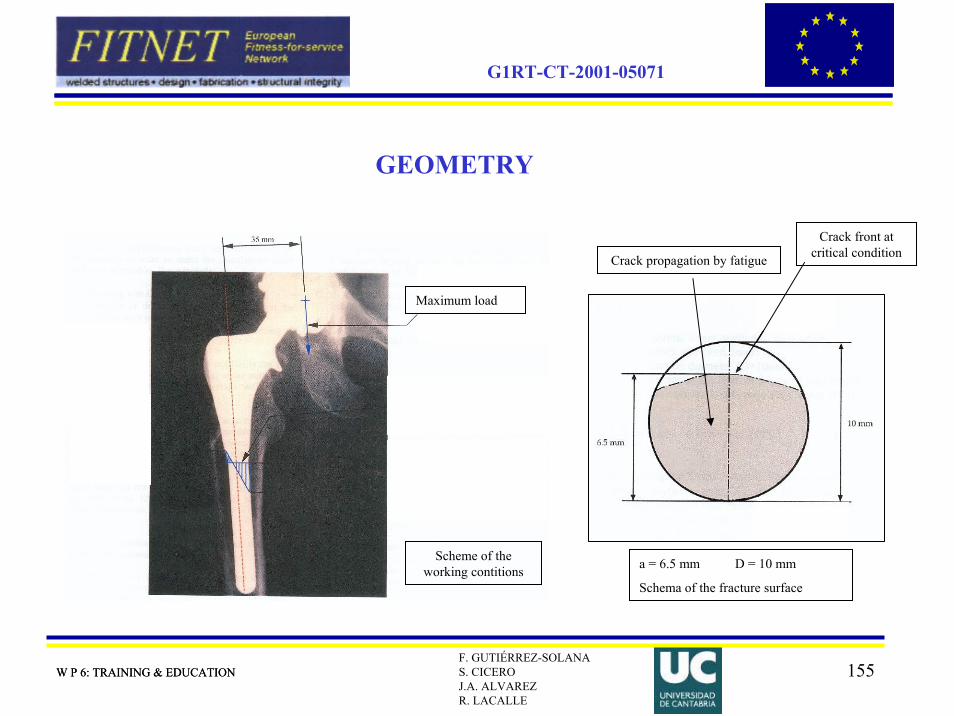
a = 6.5 mm D = 10 mm
Schema of the fracture surface
Maximum load
Scheme of theworking contitions
Crack propagation by fatigue
Crack front atcritical condition
GEOMETRY
W P 6: TRAINING & EDUCATION
156W P 6: TRAINING & EDUCATIONF. GUTIÉRREZ-SOLANAS. CICEROJ.A. ALVAREZR. LACALLE
G1RT-CT-2001-05071
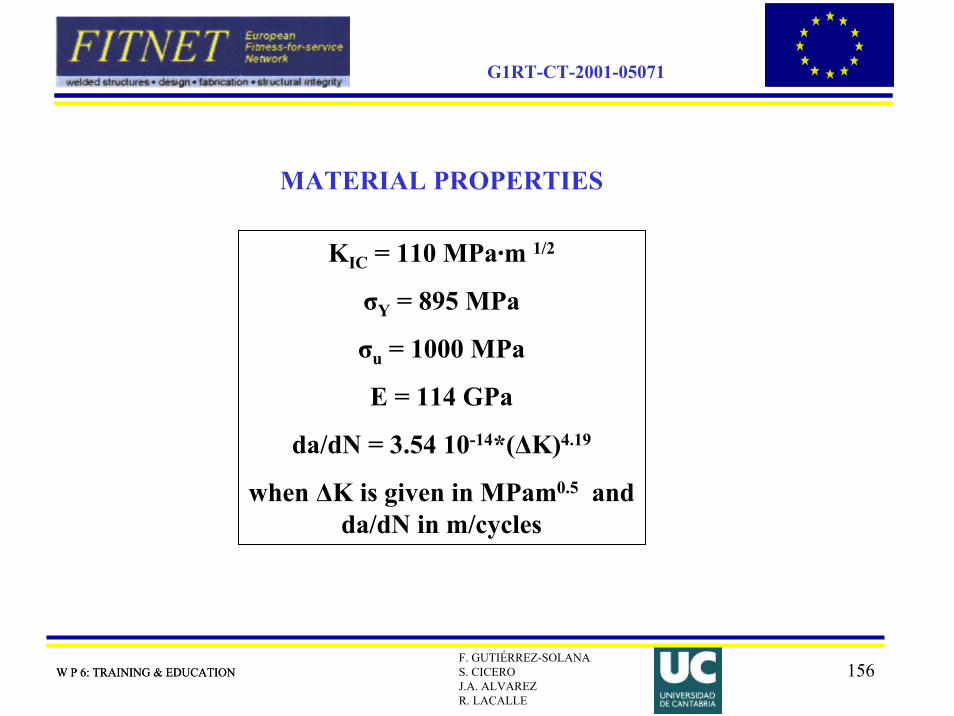
MATERIAL PROPERTIES
KIC = 110 MPa·m 1/2
σY = 895 MPa
σu = 1000 MPa
E = 114 GPa
da/dN = 3.54 10-14*(ΔK)4.19
when ΔK is given in MPam0.5 and da/dN in m/cycles
W P 6: TRAINING & EDUCATION

157W P 6: TRAINING & EDUCATIONF. GUTIÉRREZ-SOLANAS. CICEROJ.A. ALVAREZR. LACALLE
G1RT-CT-2001-05071
OBJECTIVES:
- FAILURE ANALYSIS
- NUMBER OF CYCLES BEFORE FAILURE CONSIDERING AN
INITIAL DEFFECT OF O.1 mm.
W P 6: TRAINING & EDUCATION
158W P 6: TRAINING & EDUCATIONF. GUTIÉRREZ-SOLANAS. CICEROJ.A. ALVAREZR. LACALLE
G1RT-CT-2001-05071
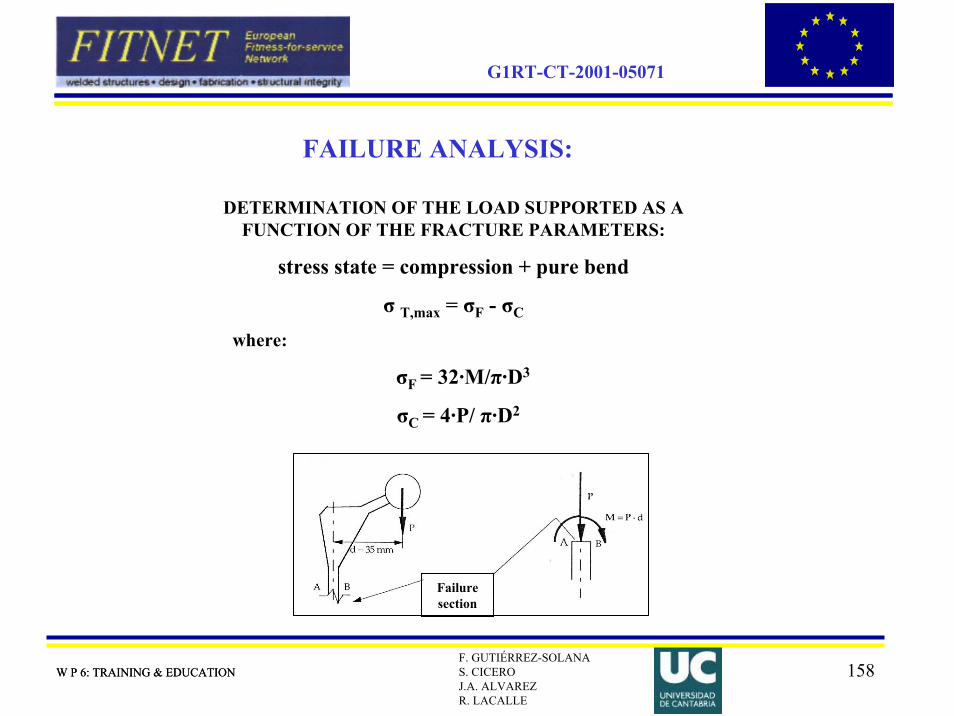
DETERMINATION OF THE LOAD SUPPORTED AS A FUNCTION OF THE FRACTURE PARAMETERS:
stress state = compression + pure bend
σ T,max = σF - σC
where:
σF = 32·M/π·D3
σC = 4·P/ π·D2
Failuresection
FAILURE ANALYSIS:
W P 6: TRAINING & EDUCATION
159W P 6: TRAINING & EDUCATIONF. GUTIÉRREZ-SOLANAS. CICEROJ.A. ALVAREZR. LACALLE
G1RT-CT-2001-05071
Many studies have been developed in order to know the peak forces that appear in a hip implantwhen the patient is walking. A value of 2.5 BW (Body Weight) seems to be reasonable.
Three different steps are distinguished during the process that starts with the operation andfinishes with the failure of the hip implant:
•Crack nucleation: It is considered very short, because there are defects at t = 0
•Quick propagation: We are going to consider that the patient has a “normal” activity. We will supose that he/she walks 2 hours per day with 1 step per second (0.5 cycles/second). Peak forces are 2.5 BW.
•“Slow” propagation: After the propagation of the second step, the patient starts to suffer pain. Therefore, he/she reduces his/her activity (1 hour/day) and uses crutches. Peak forces are now 1.0 BW. Failure occurs in this step, so if we want to obtain the load that produces it, no dynamic effect has to be considered.
The whole process takes 9 months.
FAILURE ANALYSIS:
W P 6: TRAINING & EDUCATION
160W P 6: TRAINING & EDUCATIONF. GUTIÉRREZ-SOLANAS. CICEROJ.A. ALVAREZR. LACALLE
G1RT-CT-2001-05071
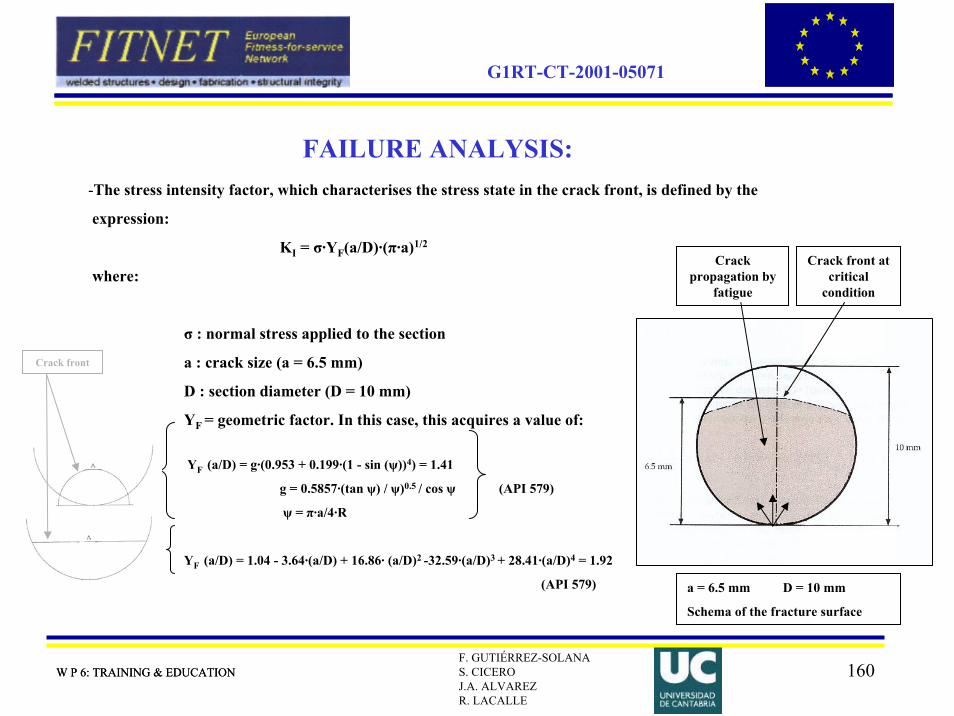
-The stress intensity factor, which characterises the stress state in the crack front, is defined by the
expression:
KI = σ·YF(a/D)·(π·a)1/2
where:
σ : normal stress applied to the section
a : crack size (a = 6.5 mm)
D : section diameter (D = 10 mm)
YF = geometric factor. In this case, this acquires a value of:
YF (a/D) = g·(0.953 + 0.199·(1 - sin (ψ))4) = 1.41
g = 0.5857·(tan ψ) / ψ)0.5 / cos ψ (API 579)
ψ = π·a/4·R
YF (a/D) = 1.04 - 3.64·(a/D) + 16.86· (a/D)2 -32.59·(a/D)3 + 28.41·(a/D)4 = 1.92
(API 579) a = 6.5 mm D = 10 mm
Schema of the fracture surface
Crack propagation by
fatigue
Crack front atcritical
condition
Crack front
FAILURE ANALYSIS:
W P 6: TRAINING & EDUCATION

161W P 6: TRAINING & EDUCATIONF. GUTIÉRREZ-SOLANAS. CICEROJ.A. ALVAREZR. LACALLE
G1RT-CT-2001-05071
- CLASSIC LEFM.
Some simplifications have been established for this analysis in order to make the calculations easier and
more accesible. These include:
- Working with the piece in projection
- Analysis of the stress intensity factor as if the element were working in pure bend
- Fracture toughness of the material according to reference value
KI = KIC
σ· Y(a/D)·(π·0.0065)1/2 = 110 σ = 401 MPa σ = 546 MPa
σ = 32·M/π·D3 - 4·P/ π·D2 P = 1.17 kN P = 1.66 kN
However, these simplifications do not justify the high value resulting from load P (1.66 kN / 1.17 kN) at the
moment of fracture, with reference to the average weight of a person (0.75 kN).
FAILURE ANALYSIS:
W P 6: TRAINING & EDUCATION
162W P 6: TRAINING & EDUCATIONF. GUTIÉRREZ-SOLANAS. CICEROJ.A. ALVAREZR. LACALLE
G1RT-CT-2001-05071
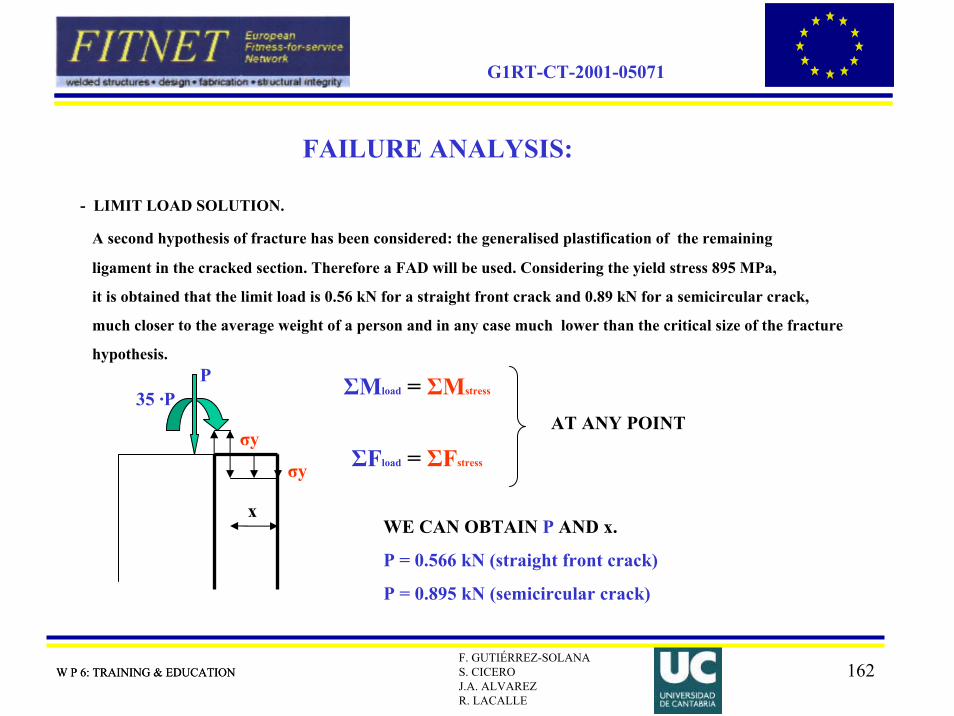
- LIMIT LOAD SOLUTION.
A second hypothesis of fracture has been considered: the generalised plastification of the remaining
ligament in the cracked section. Therefore a FAD will be used. Considering the yield stress 895 MPa,
it is obtained that the limit load is 0.56 kN for a straight front crack and 0.89 kN for a semicircular crack,
much closer to the average weight of a person and in any case much lower than the critical size of the fracture
hypothesis.P
35 ·P ΣMload = ΣMstress
σyΣFload = ΣFstress
AT ANY POINT
WE CAN OBTAIN P AND x.
P = 0.566 kN (straight front crack)
P = 0.895 kN (semicircular crack)
x
σy
FAILURE ANALYSIS:
W P 6: TRAINING & EDUCATION

163W P 6: TRAINING & EDUCATIONF. GUTIÉRREZ-SOLANAS. CICEROJ.A. ALVAREZR. LACALLE
G1RT-CT-2001-05071
FAD:
Default level: P = 0,566 kN P = 0.895 kN
Level 1: P = 0,582 kN P = 0.915 kN
1) Loading critical conditions accordingto normal weight (real situation: 0.735 kN).
2) Final failure due to plastic collapse ofresidual ligament.
3) Good agreement with fractographicanalisys and common sense.
FAILURE ANALYSIS:
W P 6: TRAINING & EDUCATION
164W P 6: TRAINING & EDUCATIONF. GUTIÉRREZ-SOLANAS. CICEROJ.A. ALVAREZR. LACALLE
G1RT-CT-2001-05071
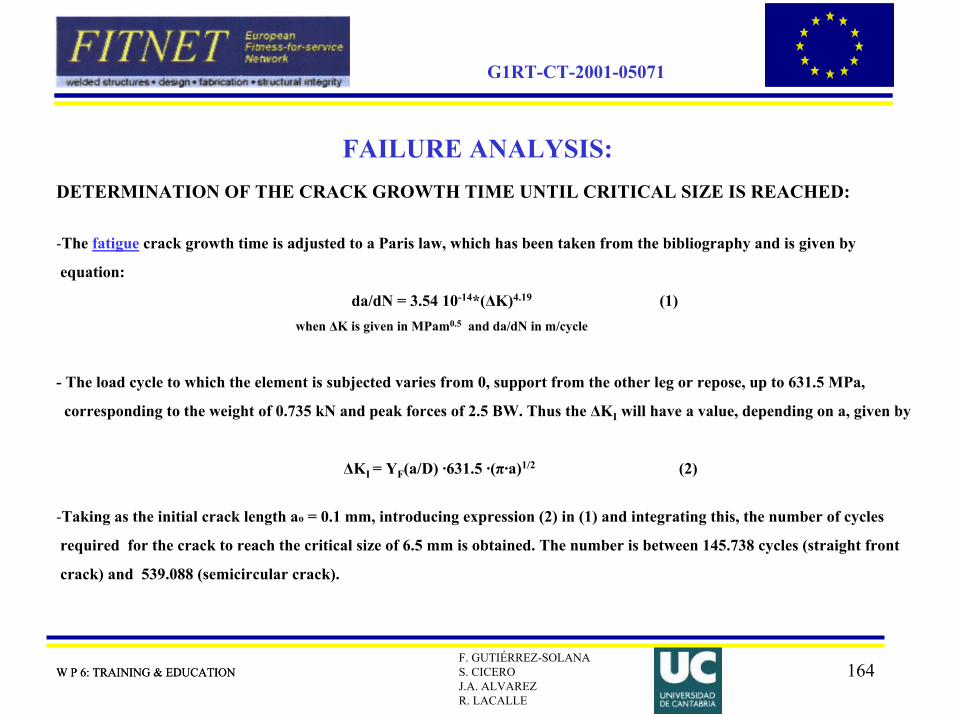
DETERMINATION OF THE CRACK GROWTH TIME UNTIL CRITICAL SIZE IS REACHED:
-The fatigue crack growth time is adjusted to a Paris law, which has been taken from the bibliography and is given by
equation:
da/dN = 3.54 10-14*(ΔK)4.19 (1)when ΔK is given in MPam0.5 and da/dN in m/cycle
- The load cycle to which the element is subjected varies from 0, support from the other leg or repose, up to 631.5 MPa,
corresponding to the weight of 0.735 kN and peak forces of 2.5 BW. Thus the ΔKI will have a value, depending on a, given by
ΔKI = YF(a/D) ·631.5 ·(π·a)1/2 (2)
-Taking as the initial crack length ao = 0.1 mm, introducing expression (2) in (1) and integrating this, the number of cycles
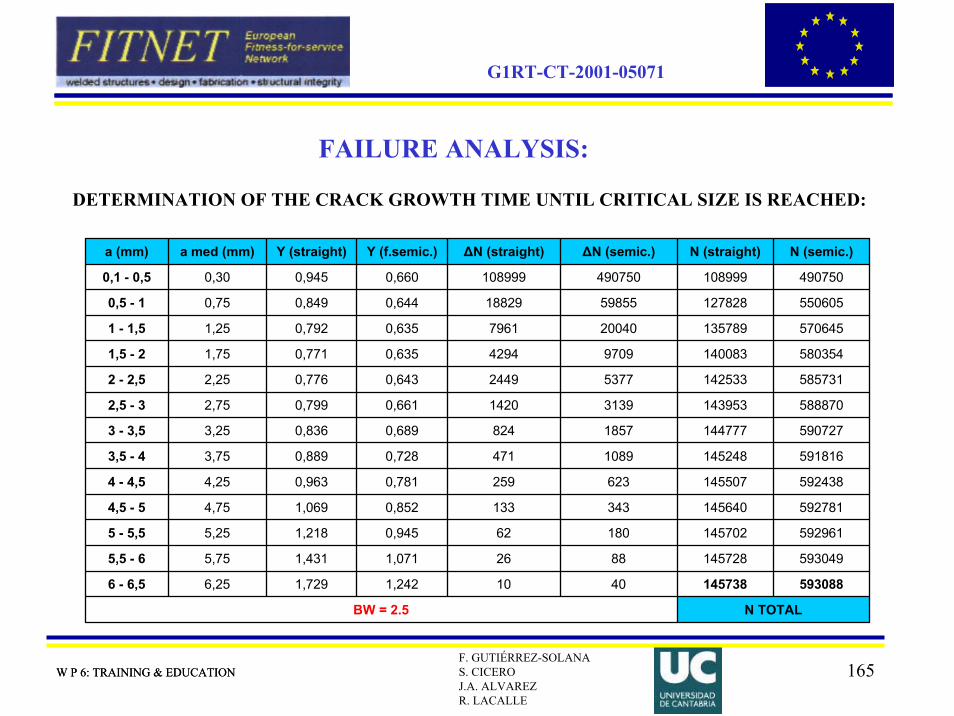
required for the crack to reach the critical size of 6.5 mm is obtained. The number is between 145.738 cycles (straight front
crack) and 539.088 (semicircular crack).
FAILURE ANALYSIS:
W P 6: TRAINING & EDUCATION
165W P 6: TRAINING & EDUCATIONF. GUTIÉRREZ-SOLANAS. CICEROJ.A. ALVAREZR. LACALLE
G1RT-CT-2001-05071
DETERMINATION OF THE CRACK GROWTH TIME UNTIL CRITICAL SIZE IS REACHED:
FAILURE ANALYSIS:
W P 6: TRAINING & EDUCATION
a (mm) a med (mm) Y (straight) Y (f.semic.) ΔN (straight) ΔN (semic.) N (straight) N (semic.)
0,1 - 0,5 0,30 0,945 0,660 108999 490750 108999 490750
0,5 - 1 0,75 0,849 0,644 18829 59855 127828 550605
1 - 1,5 1,25 0,792 0,635 7961 20040 135789 570645
1,5 - 2 1,75 0,771 0,635 4294 9709 140083 580354
2 - 2,5 2,25 0,776 0,643 2449 5377 142533 585731
2,5 - 3 2,75 0,799 0,661 1420 3139 143953 588870
3 - 3,5 3,25 0,836 0,689 824 1857 144777 590727
3,5 - 4 3,75 0,889 0,728 471 1089 145248 591816
4 - 4,5 4,25 0,963 0,781 259 623 145507 592438
4,5 - 5 4,75 1,069 0,852 133 343 145640 592781
5 - 5,5 5,25 1,218 0,945 62 180 145702 592961
5,5 - 6 5,75 1,431 1,071 26 88 145728 593049
6 - 6,5 6,25 1,729 1,242 10 40 145738 593088
BW = 2.5 N TOTAL
166W P 6: TRAINING & EDUCATIONF. GUTIÉRREZ-SOLANAS. CICEROJ.A. ALVAREZR. LACALLE
G1RT-CT-2001-05071
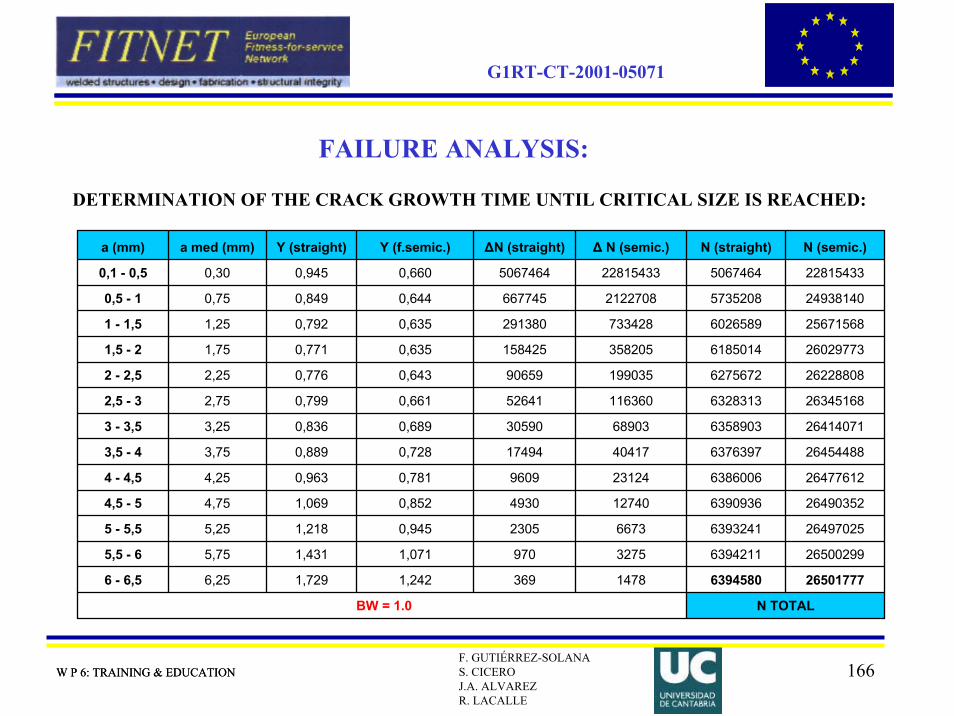
DETERMINATION OF THE CRACK GROWTH TIME UNTIL CRITICAL SIZE IS REACHED:
FAILURE ANALYSIS:
W P 6: TRAINING & EDUCATION
a (mm) a med (mm) Y (straight) Y (f.semic.) ΔN (straight) Δ N (semic.) N (straight) N (semic.)
0,1 - 0,5 0,30 0,945 0,660 5067464 22815433 5067464 22815433
0,5 - 1 0,75 0,849 0,644 667745 2122708 5735208 24938140
1 - 1,5 1,25 0,792 0,635 291380 733428 6026589 25671568
1,5 - 2 1,75 0,771 0,635 158425 358205 6185014 26029773
2 - 2,5 2,25 0,776 0,643 90659 199035 6275672 26228808
2,5 - 3 2,75 0,799 0,661 52641 116360 6328313 26345168
3 - 3,5 3,25 0,836 0,689 30590 68903 6358903 26414071
3,5 - 4 3,75 0,889 0,728 17494 40417 6376397 26454488
4 - 4,5 4,25 0,963 0,781 9609 23124 6386006 26477612
4,5 - 5 4,75 1,069 0,852 4930 12740 6390936 26490352
5 - 5,5 5,25 1,218 0,945 2305 6673 6393241 26497025
5,5 - 6 5,75 1,431 1,071 970 3275 6394211 26500299
6 - 6,5 6,25 1,729 1,242 369 1478 6394580 26501777
BW = 1.0 N TOTAL
167W P 6: TRAINING & EDUCATIONF. GUTIÉRREZ-SOLANAS. CICEROJ.A. ALVAREZR. LACALLE
G1RT-CT-2001-05071
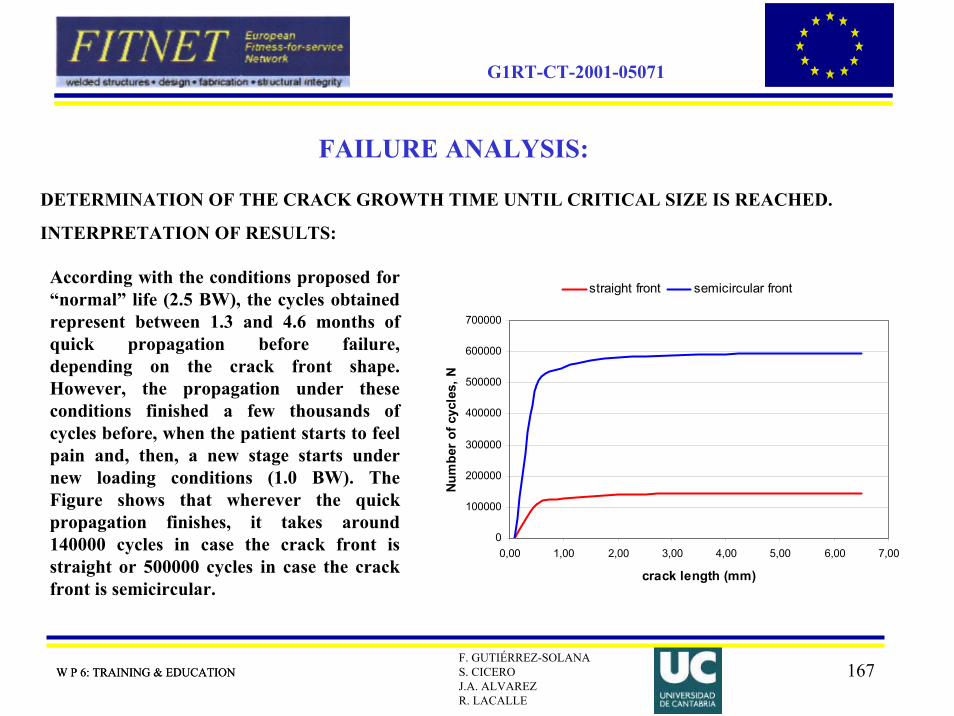
DETERMINATION OF THE CRACK GROWTH TIME UNTIL CRITICAL SIZE IS REACHED.
INTERPRETATION OF RESULTS:
FAILURE ANALYSIS:
W P 6: TRAINING & EDUCATION
According with the conditions proposed for “normal” life (2.5 BW), the cycles obtained represent between 1.3 and 4.6 months of quick propagation before failure, depending on the crack front shape. However, the propagation under these conditions finished a few thousands of cycles before, when the patient starts to feel pain and, then, a new stage starts under new loading conditions (1.0 BW). The Figure shows that wherever the quick propagation finishes, it takes around 140000 cycles in case the crack front is straight or 500000 cycles in case the crack front is semicircular.
0
100000
200000
300000
400000
500000
600000
700000
0,00 1,00 2,00 3,00 4,00 5,00 6,00 7,00
crack length (mm)
Num
ber
of c
ycle
s, N
straight front semicircular front
168W P 6: TRAINING & EDUCATIONF. GUTIÉRREZ-SOLANAS. CICEROJ.A. ALVAREZR. LACALLE
G1RT-CT-2001-05071
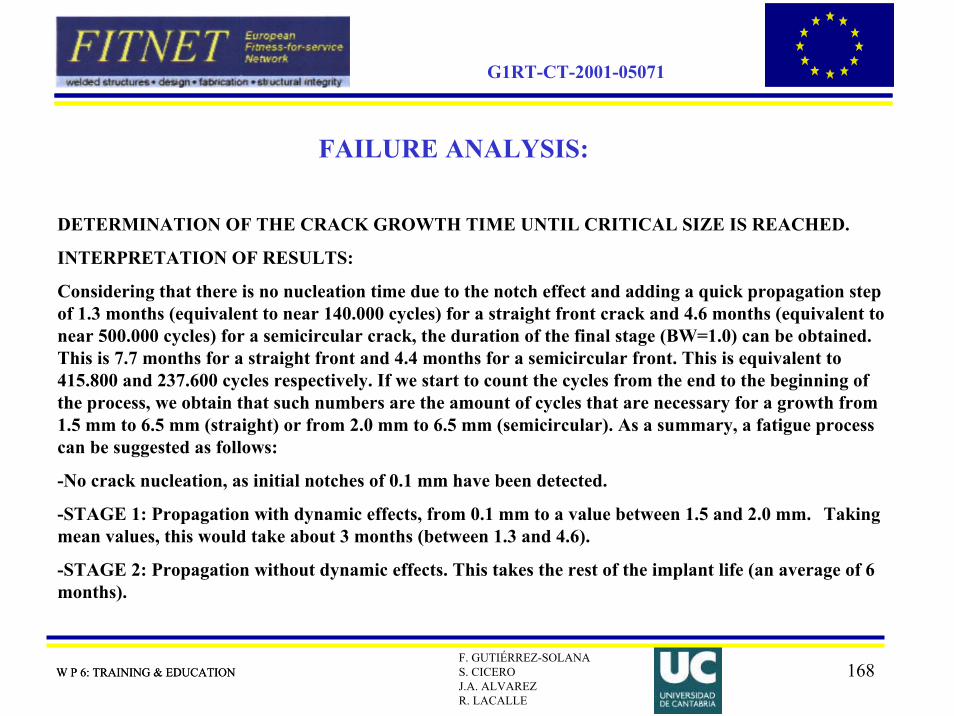
DETERMINATION OF THE CRACK GROWTH TIME UNTIL CRITICAL SIZE IS REACHED.
INTERPRETATION OF RESULTS:
Considering that there is no nucleation time due to the notch effect and adding a quick propagation step of 1.3 months (equivalent to near 140.000 cycles) for a straight front crack and 4.6 months (equivalent to near 500.000 cycles) for a semicircular crack, the duration of the final stage (BW=1.0) can be obtained. This is 7.7 months for a straight front and 4.4 months for a semicircular front. This is equivalent to 415.800 and 237.600 cycles respectively. If we start to count the cycles from the end to the beginning of the process, we obtain that such numbers are the amount of cycles that are necessary for a growth from 1.5 mm to 6.5 mm (straight) or from 2.0 mm to 6.5 mm (semicircular). As a summary, a fatigue process can be suggested as follows:
-No crack nucleation, as initial notches of 0.1 mm have been detected.
-STAGE 1: Propagation with dynamic effects, from 0.1 mm to a value between 1.5 and 2.0 mm. Taking mean values, this would take about 3 months (between 1.3 and 4.6).
-STAGE 2: Propagation without dynamic effects. This takes the rest of the implant life (an average of 6 months).
FAILURE ANALYSIS:
W P 6: TRAINING & EDUCATION

169W P 6: TRAINING & EDUCATIONF. GUTIÉRREZ-SOLANAS. CICEROJ.A. ALVAREZR. LACALLE
G1RT-CT-2001-05071
SUMMARY:
Incubation
Quick propagation
Propagation
without dynamic effect
STRAIGHT
FRONT CRACK
0 months
1.3 months/
1.5 mm
7.7 months/
6.5 mm
SEMICIRCULAR CRACK
0 months
4.5 months/
2.0 mm
4.5 months/
6.5 mm
W P 6: TRAINING & EDUCATION
170W P 6: TRAINING & EDUCATIONF. GUTIÉRREZ-SOLANAS. CICEROJ.A. ALVAREZR. LACALLE
G1RT-CT-2001-05071
CASE STUDY EXAMPLE
Forklift
• Introduction: The Case Study
• Geometry
• Material Properties
• Failure Analysis
• Conclusions
• Bibliography
171W P 6: TRAINING & EDUCATIONF. GUTIÉRREZ-SOLANAS. CICEROJ.A. ALVAREZR. LACALLE
G1RT-CT-2001-05071
INTRODUCTION: THE CASE STUDY
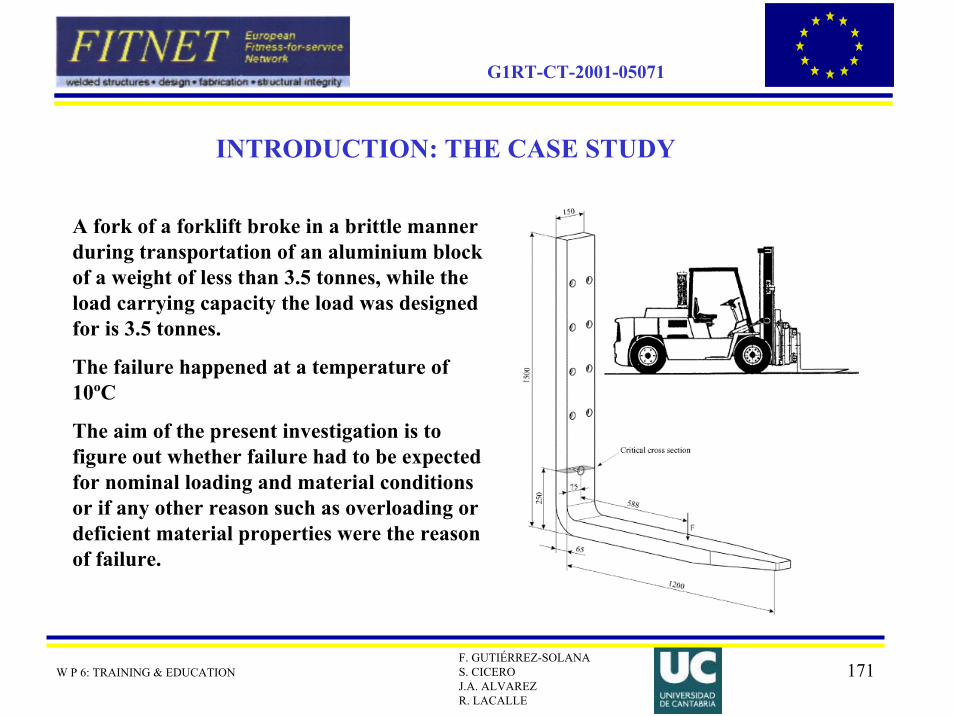
A fork of a forklift broke in a brittle manner during transportation of an aluminium block of a weight of less than 3.5 tonnes, while the load carrying capacity the load was designed for is 3.5 tonnes.
The failure happened at a temperature of 10ºC
The aim of the present investigation is to figure out whether failure had to be expected for nominal loading and material conditions or if any other reason such as overloading or deficient material properties were the reason of failure.
172W P 6: TRAINING & EDUCATIONF. GUTIÉRREZ-SOLANAS. CICEROJ.A. ALVAREZR. LACALLE
G1RT-CT-2001-05071
GEOMETRY
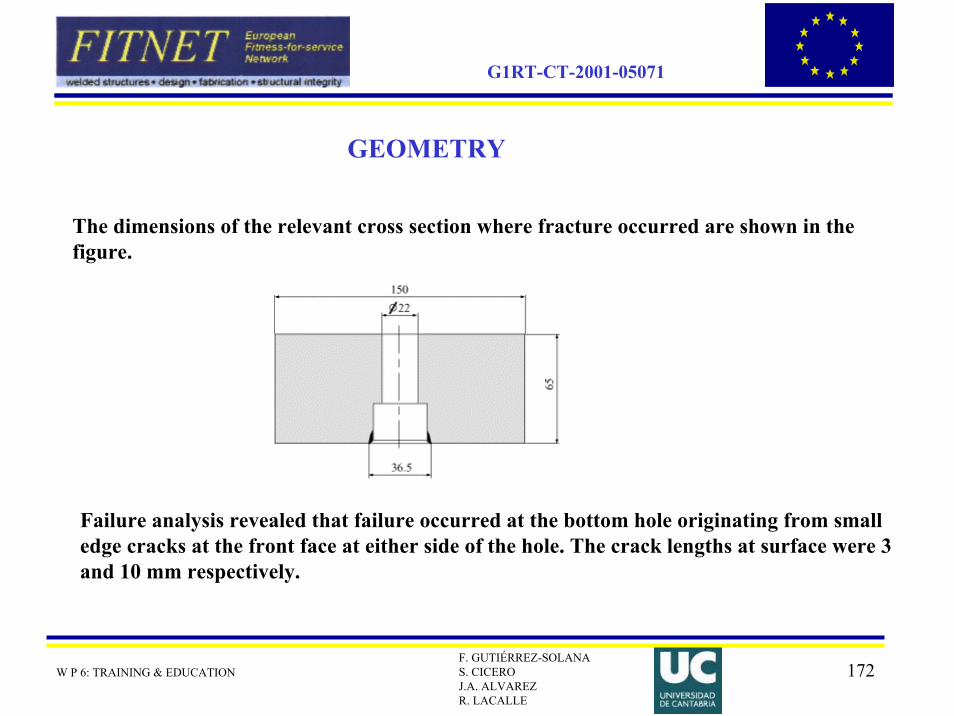
The dimensions of the relevant cross section where fracture occurred are shown in the figure.
Failure analysis revealed that failure occurred at the bottom hole originating from small edge cracks at the front face at either side of the hole. The crack lengths at surface were 3 and 10 mm respectively.
173W P 6: TRAINING & EDUCATIONF. GUTIÉRREZ-SOLANAS. CICEROJ.A. ALVAREZR. LACALLE
G1RT-CT-2001-05071
MATERIAL PROPERTIES
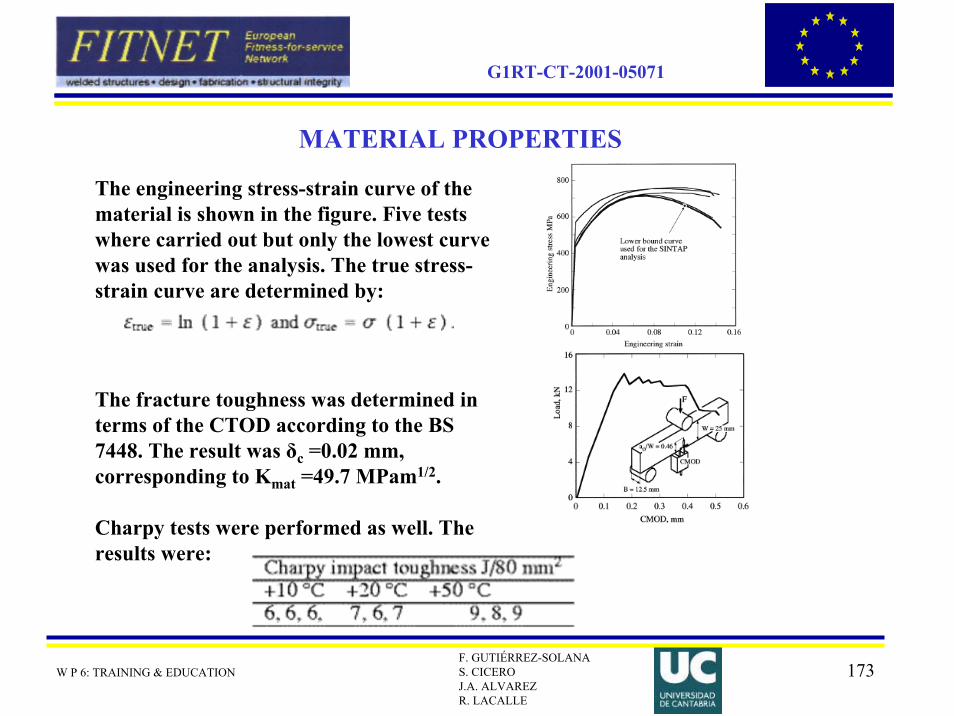
The engineering stress-strain curve of the material is shown in the figure. Five tests where carried out but only the lowest curve was used for the analysis. The true stress-strain curve are determined by:
The fracture toughness was determined in terms of the CTOD according to the BS 7448. The result was δc =0.02 mm, corresponding to Kmat =49.7 MPam1/2.
Charpy tests were performed as well. The results were:
174W P 6: TRAINING & EDUCATIONF. GUTIÉRREZ-SOLANAS. CICEROJ.A. ALVAREZR. LACALLE
G1RT-CT-2001-05071
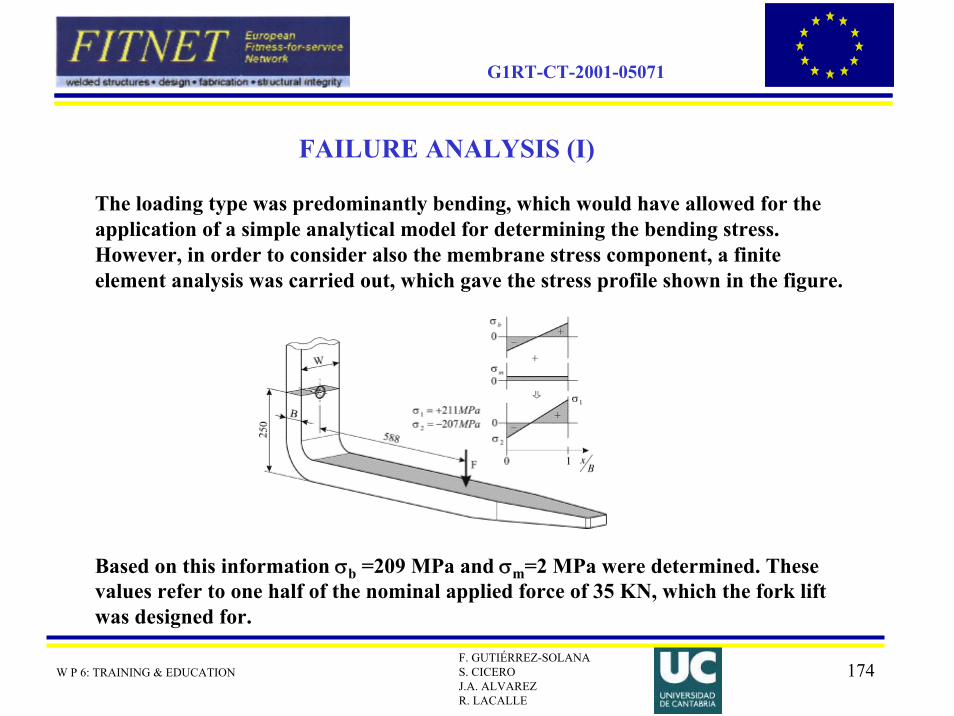
FAILURE ANALYSIS (I)
The loading type was predominantly bending, which would have allowed for the application of a simple analytical model for determining the bending stress. However, in order to consider also the membrane stress component, a finite element analysis was carried out, which gave the stress profile shown in the figure.
Based on this information σb =209 MPa and σm=2 MPa were determined. These values refer to one half of the nominal applied force of 35 KN, which the fork lift was designed for.

175W P 6: TRAINING & EDUCATIONF. GUTIÉRREZ-SOLANAS. CICEROJ.A. ALVAREZR. LACALLE
G1RT-CT-2001-05071
FAILURE ANALYSIS (II)
The two edge cracks are substituted by one through crack whose dimensions include the hole diameter as demonstrated in the figure. For simplicity the crack is assumed to be of constant length 2c over the wall thickness.
176W P 6: TRAINING & EDUCATIONF. GUTIÉRREZ-SOLANAS. CICEROJ.A. ALVAREZR. LACALLE
G1RT-CT-2001-05071
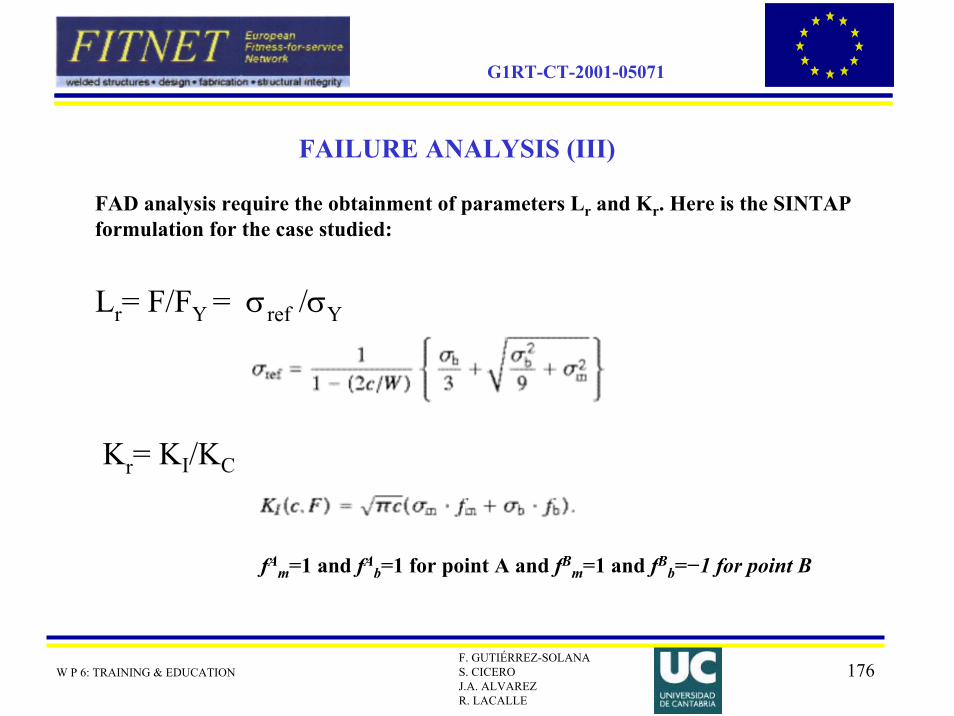
FAILURE ANALYSIS (III)
FAD analysis require the obtainment of parameters Lr and Kr. Here is the SINTAP formulation for the case studied:
Lr= F/FY = σref /σY
Kr= KI/KC
fAm=1 and fA
b=1 for point A and fBm=1 and fB
b=−1 for point B
177W P 6: TRAINING & EDUCATIONF. GUTIÉRREZ-SOLANAS. CICEROJ.A. ALVAREZR. LACALLE
G1RT-CT-2001-05071
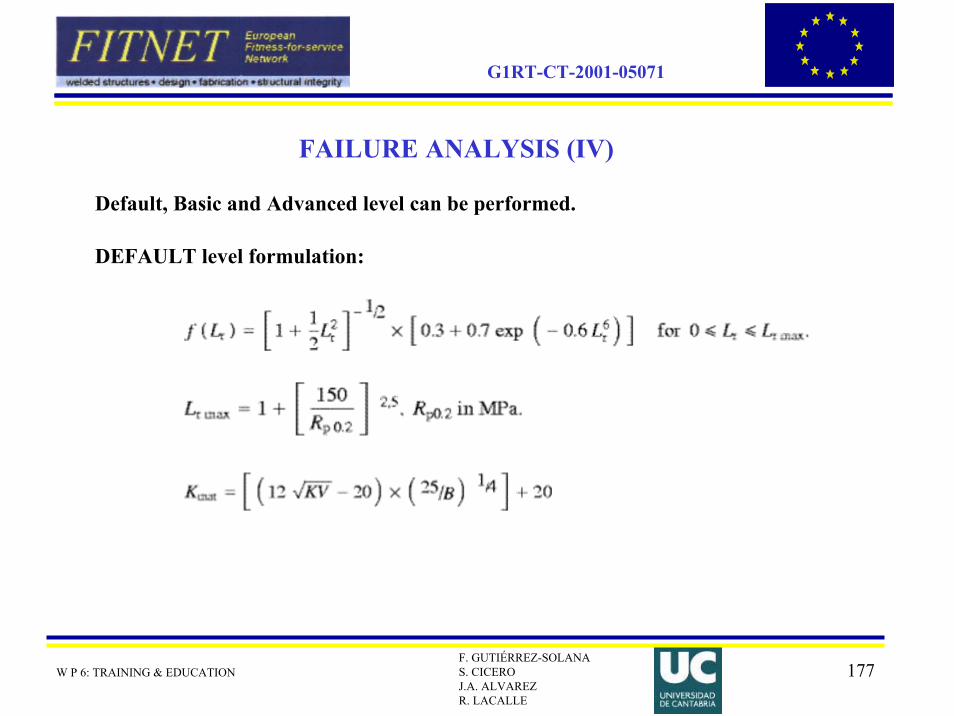
FAILURE ANALYSIS (IV)
Default, Basic and Advanced level can be performed.
DEFAULT level formulation:
178W P 6: TRAINING & EDUCATIONF. GUTIÉRREZ-SOLANAS. CICEROJ.A. ALVAREZR. LACALLE
G1RT-CT-2001-05071
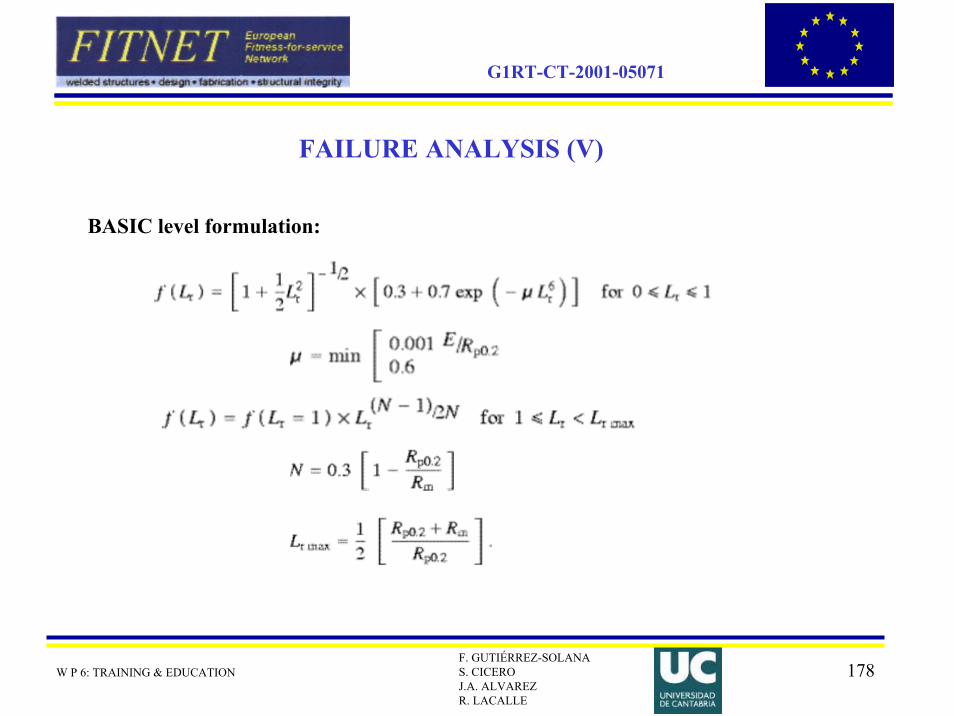
FAILURE ANALYSIS (V)
BASIC level formulation:

179W P 6: TRAINING & EDUCATIONF. GUTIÉRREZ-SOLANAS. CICEROJ.A. ALVAREZR. LACALLE
G1RT-CT-2001-05071
FAILURE ANALYSIS (VI)
ADVANCED level formulation:
180W P 6: TRAINING & EDUCATIONF. GUTIÉRREZ-SOLANAS. CICEROJ.A. ALVAREZR. LACALLE
G1RT-CT-2001-05071
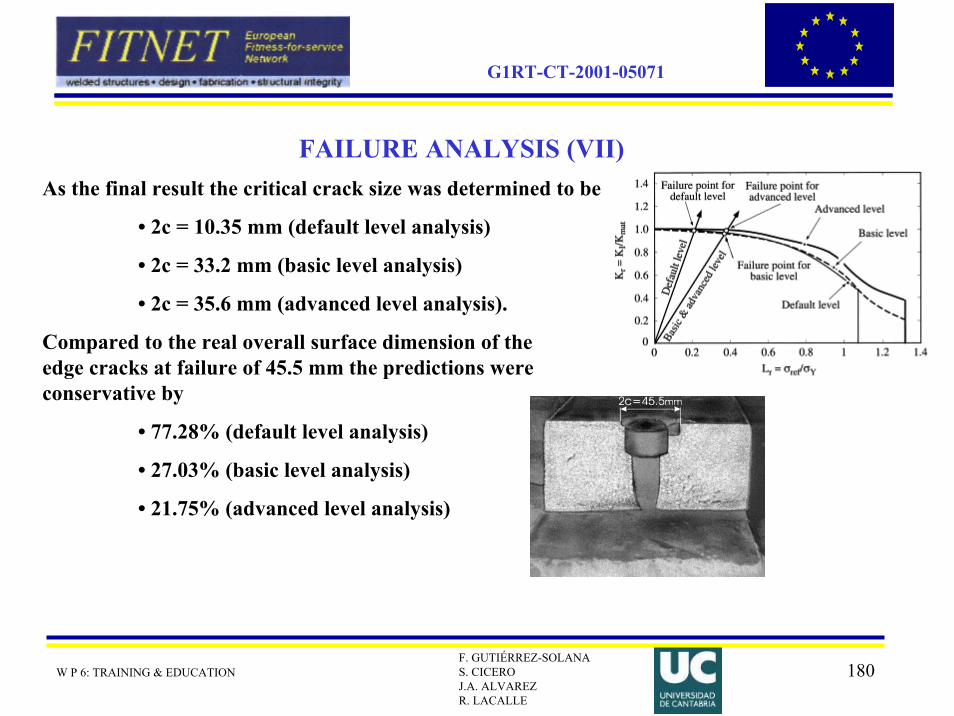
FAILURE ANALYSIS (VII)As the final result the critical crack size was determined to be
• 2c = 10.35 mm (default level analysis)
• 2c = 33.2 mm (basic level analysis)
• 2c = 35.6 mm (advanced level analysis).
Compared to the real overall surface dimension of the edge cracks at failure of 45.5 mm the predictions were conservative by
• 77.28% (default level analysis)
• 27.03% (basic level analysis)
• 21.75% (advanced level analysis)
181W P 6: TRAINING & EDUCATIONF. GUTIÉRREZ-SOLANAS. CICEROJ.A. ALVAREZR. LACALLE
G1RT-CT-2001-05071
CONCLUSIONS
In conclusion, it can be stated that the failure occurred as theconsequence of inadequate design and not of inadmissible handling such as overloading. The failure could have been avoided by applying fracture mechanics in the design stage. The SINTAP algorithm was shown to be an easy but suitable tool for this purpose
182W P 6: TRAINING & EDUCATIONF. GUTIÉRREZ-SOLANAS. CICEROJ.A. ALVAREZR. LACALLE
G1RT-CT-2001-05071
BIBLIOGRAPHY
Gubeljak, N., Zerbst, U., Predan, J., and Oblak, M., “Application of the european SINTAP procedure to the failure analysis of a broken forklift”, Engineering Failure Analysis, Vol. 11, pp. 33-47, 2004