Embed Size (px)
Citation preview

Research Article
Simultaneous determination of Prasugrel and Aspirin by
second order and ratio first order derivative ultraviolet
spectrophotometry
Shahabuddin N. Alvi*, Mehul N. Patel, Prakash B. Kathiriya, Bhavna A. Patel, Shraddha J.
Parmar
Post Graduate Department of Pharmaceutical Sciences, Sardar Patel University, Vallabh
Vidyanagar, District – Anand 388 120, Gujarat, India.
*Corresponding author
Email address: [email protected]

Abstract:
Two simple, accurate and precise UV derivative spectrophotometric methods for the
simultaneous determination of Prasugrel and Aspirin in synthetic mixture form have been
developed. The first method involves measurement of second order derivative spectra of
Prasugrel and Aspirin. The zero crossing wavelengths 267.62 nm and 252.40 nm were
selected for estimation of Prasugrel and Aspirin respectively. In the second method, the first
order derivative of ratio spectra were calculated and used for the determination of Prasugrel
and Aspirin by measuring the peak intensity at 268 nm and 290 nm respectively. The
methods were validated as per the ICH Guideline Q2 (R1). Beer’s law is followed in the
range of 5-45 µg/mL for Prasugrel and 25–150 µg/mL for Aspirin by second order derivative
method and 6-22 µg/mL for Prasugrel and 45–165 µg/mL for Aspirin by ratio first order
derivative method. The recovery studies confirmed the accuracy of the methods. Relative
standard deviations for repeatability, inter and intraday assays were less than 2%. Hence, the
described derivative spectrophotometric methods are simple, accurate, precise and excellent
alternative to sophisticated chromatographic techniques and can be potentially used for the
simultaneous determination of Prasugrel and Aspirin in combined dosage form.
1. Introduction:
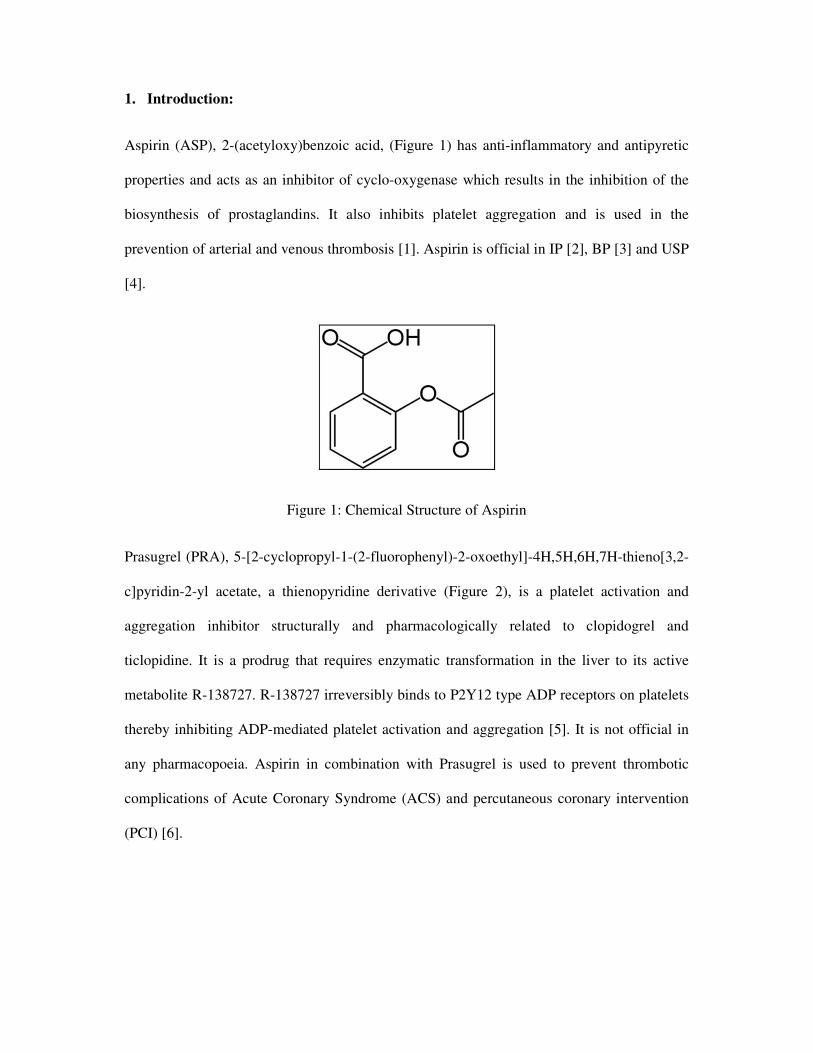
Aspirin (ASP), 2-(acetyloxy)benzoic acid, (Figure 1) has anti-inflammatory and antipyretic
properties and acts as an inhibitor of cyclo-oxygenase which results in the inhibition of the
biosynthesis of prostaglandins. It also inhibits platelet aggregation and is used in the
prevention of arterial and venous thrombosis [1]. Aspirin is official in IP [2], BP [3] and USP
[4].
Figure 1: Chemical Structure of Aspirin
Prasugrel (PRA), 5-[2-cyclopropyl-1-(2-fluorophenyl)-2-oxoethyl]-4H,5H,6H,7H-thieno[3,2-
c]pyridin-2-yl acetate, a thienopyridine derivative (Figure 2), is a platelet activation and
aggregation inhibitor structurally and pharmacologically related to clopidogrel and
ticlopidine. It is a prodrug that requires enzymatic transformation in the liver to its active
metabolite R-138727. R-138727 irreversibly binds to P2Y12 type ADP receptors on platelets
thereby inhibiting ADP-mediated platelet activation and aggregation [5]. It is not official in
any pharmacopoeia. Aspirin in combination with Prasugrel is used to prevent thrombotic
complications of Acute Coronary Syndrome (ACS) and percutaneous coronary intervention
(PCI) [6].

Figure 2: Chemical Structure of Prasugrel
Literature survey reveals that some analytical methods have been reported for determination
of PRA [7-11] and ASP [12-14] individually and aspirin in combination with other drugs [15-
17]. HPLC and UV simultaneous methods are available for estimation of PRA and ASP in
their combined dosage form [18-19]. The objective of the current study was to develop
simple, accurate and reproducible second order derivative and ratio first order derivative
analytical methods for the simultaneous estimation of Prasugrel and Aspirin in presence of
excipients. The methods have advantage over other methods that it completely eliminates the
spectral interference from one of the two drugs while estimating the other drug at selected
wavelength. The second order derivative method eliminates interference by selection of zero
crossing point (ZCP), while the ratio first order derivative method eliminates it by dividing
the zero order spectra of mixture with one of the two drugs and transforming into first order
spectra to estimate the other drug. The methods were developed and validated as per ICH
guideline Q2 (R1) [20].

2. Materials and Methods:
2.1 Instruments and chemicals
A Double beam UV-Visible spectrophotometer (Shimadzu, UV1800) having two matched
quartz cells with 1 cm pathlength, UVProbe v2.35 software, Ultrasonic Cleaner (Electroquip)
and Electronic analytical balance (Denver SI 234) were used. Calibrated volumetric flasks,
pipettes of borosilicate glasses, Whatman Grade No. 3 filter paper were used throughout the
experiment. Methanol AR grade was procured from Sisco Research Laboratories Pvt. Ltd.
Lactose, Corn Starch, Magnesium Stearate were procured from SD Fine Chem Ltd.
2.2 Preparation of Standard Stock Solution:
Accurately weighed quantities of PRA (25 mg) and ASP (62.5 mg) were transferred
separately to 25 mL volumetric flasks, dissolved and diluted upto the mark with methanol to
get 1000 µg/mL PRA and 2500 µg/mL ASP. The working standard solutions of the respective
drugs were prepared by serial dilution in methanol.
2.3 Sample preparation:
Synthetic mixture of PRA and ASP was prepared by using common excipients like Corn
Starch, Lactose and Magnesium Stearate by calculating formula for 20 Tablets having label
claim for PRA and ASP 10 mg and 75 mg respectively. From this mixture, powder equivalent
to 10 mg Prasugrel and 75 mg Aspirin was dissolved in 100 mL methanol and then sonicated
for 15 min. and filtered through Whatman filter paper. From this solution, 1 mL aliquot was
taken in 10 mL volumetric flask and diluted upto the mark with methanol to make final
concentration of PRA and ASP 10 µg/mL and 75 µg/mL respectively which was used for
Assay.

3. Method Development:
3.1 Method D2 - Second Order UV Spectrophotometric Method (Determination of zero
crossing point (ZCP)):
In the second order derivative method, aliquots of PRA and ASP standard stock solutions
were accurately transferred into 10 mL volumetric flasks, separately and volumes were made
upto the mark with methanol. Each of the working standard solutions was scanned between
400 – 200 nm at a medium scanning speed. It showed wavelength maxima at 254 nm for
PRA and 276 nm for ASP. All the zero order spectra were then transformed to their
respective second order derivative spectra (D2) using the UVProbe v2.35 software with
∆λ=10 nm and ZCP of PRA and ASP were found to be at 252.40 nm and 267.62 nm
respectively. Responses of each of the above solutions were measured for PRA and ASP at
267.62 nm and 252.40 nm respectively. The calibration curves were constructed and the
concentration of individual drug present in the mixture was determined against the calibration
curve.
3.2 Method RD1 - First order derivative of the ratio spectra:
Previously scanned absorption spectra of PRA solutions prepared at different concentrations
(6 - 22 µg/mL) in its binary mixture with ASP was divided by the spectrum of the standard
solution of ASP (75 µg/mL in methanol) to get the ratio spectra of PRA. The first derivative
of the ratio spectra were than calculated. The amount of PRA was determined by measuring
the first derivative signal at 268 nm (minima). A similar procedure was followed for different
concentrations of ASP (45 - 165 µg/mL) with PRA and for division spectrum of the standard
solution of PRA (10 µg/mL in methanol) was used. Similarly, content of ASP was
determined by measuring the first derivative signal at 290 nm (minima).
3.3 Assay of synthetic mixture:

Method D2- In the second order derivative method, the absorption spectrum was recorded
against methanol as a blank for the solution prepared in methanol from the synthetic mixture
of PRA and ASP. The resulting zero order spectra was transformed to its second order
derivative spectra. The intensity of the second derivative spectra of the mixture were
measured at 267.62 nm and 252.40 nm for estimation of PRA and ASP respectively. The
procedure was repeated 2 more times. The concentrations of PRA and ASP were calculated
from their corresponding regression equations and % amount was determined.
Method RD1- In the ratio first order derivative method, the previously scanned zero order
absorption spectra for the mixture were divided by the spectrum of ASP (75 µg/mL) and by
spectrum of PRA (10 µg/mL) separately for the determination of PRA and ASP respectively.
The concentrations of PRA and ASP were calculated from their corresponding regression
equations measuring the intensity of signals at 268 nm and 290 nm respectively and %
amount was determined.
4. Validation of the methods:
Newly developed methods were validated for specificity, linearity, accuracy, precision, limits
of quantitation and limits of detection according to the ICH guideline Q2 (R1).
4.1 Linearity and Range (n=5):
For the second order derivative method, the linearity response was determined by analyzing 5
independent calibration curves in the range of 5 - 45 µg/mL (5, 15, 25, 35 and 45 µg/mL) for
PRA and 25 - 150 µg/mL (25, 50, 75, 100, 125 and 150 µg/mL) for ASP. In the ratio first
order derivative method, the linearity reponse was determined in the range of 6 – 22 µg/mL
(6, 10, 14, 18 and 22 µg/mL) for PRA and 45 - 165 µg/mL (45, 75, 105, 135 and 165 µg/mL)

for ASP. Correlation coefficient and regression line equations for PRA and ASP were
calculated for both the methods.
4.2 Accuracy (n = 3):
It was carried out to determine the suitability and reliability of the proposed methods.
Accuracy was determined by calculating the % Recovery of PRA and ASP from the synthetic
mixture by the standard addition method in which, known amounts of standards samples of
PRA and ASP at 80%, 100% and 120% levels were added to the pre-analysed samples. The
procedure was repeated 2 more times and the recovered amounts of PRA and ASP were
calculated at each level and % Recovery was reported as % recovery = ((Ctotal -
Cassay)/Cadded)*100, where Ctotal is the total drug concentration found after standard addition;
Cassay is the drug concentration in the formulation mixture; Cadded is the concentration of
standard added.
4.3 Precision:
Repeatability (n = 6):
The repeatability was checked by scanning and measurement of the responses of solutions of
PRA (10 µg/mL) and ASP (75 µg/mL) without changing the parameters of the proposed
methods. The procedure was repeated six times and % RSD was calculated.
Intermediate Precision (n = 3):
The intra-day and inter-day precisions of the second order derviative method was determined
by analyzing corresponding responses in triplicate on the same day and on 3 different days
over a period of 1 week for 3 different concentrations of standard solutions of PRA (5, 10 and
15 µg/mL) and ASP (50, 75 and 100 µg/mL). Similarly, the intra-day and inter-day precisions

of ratio first order derivative method was determined by taking mixtures having concentration
of PRA (10, 14 and 18 µg/mL) and that of ASP (75, 105 and 135 µg/mL).
4.4 Limit of Detection (LOD) and Limit of Quantitation (LOQ):
ICH guideline describes several approaches to determine the detection and quantitation
limits. These include visual evaluation, signal-to-noise ratio and the use of standard deviation
of the response and the slope of the calibration curve. In the present study, the LOD and LOQ
were based on the third approach and were calculated according to the 3.3σ/S and 10σ/S
equations respectively; where, σ is the standard deviation of y-intercepts of regression lines
and S is the slope of the calibration curve.

5. Results and discussion:
Prasugrel and Aspirin both possess good solubility and considerable UV absorption in
methanol. Thus methanol was selected as solvent for the present work. From the zero order
overlain UV spectra of PRA (10 µg/mL) and ASP (75 µg/mL) and their mixture, it was
observed that the spectra are overlapping each other, demonstrating the complexity in
measuring these drugs by direct UV absorption measurement in a binary mixture.
5.1 Second Order derivative method:
The UV derivative method has advantage that it eliminates the spectral interference from one
of the two drugs while estimating the other drug by selecting zero crossing point in the
derivative spectra of each drug at selected wavelength. The zero order spectra of PRA and
ASP were transformed to first and second order derivative spectra with help of UVProbe
software (∆λ=10 nm). The first order spectra of PRA did not show any zero crossing points
(ZCP), while the second order spectra of both the drugs showed ZCPs with considerable
sensitivity for the estimation of respective drugs on each other’s ZCPs. Hence second order
derivative method was used in the present work. The ZCPs for PRA and ASP were found to
be 252.40 nm and 267.62 nm respectively. Hence, the estimation of PRA was done at 267.62
nm (Figure 3) while that of ASP was done at 252.40 nm (Figure 4). Calibration graphs were
established for PRA and ASP in the concentration range of 5 to 45 µg/mL (Figure 5) and 25
to 150 µg/mL (Figure 6) respectively with good correlation.

Figure 3: Second order derivative UV absorption overlain spectra of PRA (5-45 µg/mL).
Figure 4: Second order derivative UV absorption overlain spectra of ASP (25-150 µg/mL).

Figure 5: Calibration curve of Prasugrel (5-45 µg/mL) by second order derivative method.
Figure 6: Calibration curve of Aspirin (25-150 µg/mL) by second order derivative method.
5.2 Ratio First Order derivative method:
The ratio first order derivative method (RD1) permits the determination of each component in
their mixture at the wavelengths corresponding to a maximum or minimum. The main
advantage of this method is the chance of easy measurements in correspondence to peaks so
y = 0.000028x + 0.000181
R² = 0.99909
0.00000
0.00020
0.00040
0.00060
0.00080
0.00100
0.00120
0.00140
0.00160
0 10 20 30 40 50
Ab
sorb
an
ce
Concentration (µg/mL)
Calibration Curve of Prasugrel
y = 0.000059x - 0.000276
R² = 0.99914
0.00000
0.00100
0.00200
0.00300
0.00400
0.00500
0.00600
0.00700
0.00800
0.00900
0.01000
0 50 100 150 200
Ab
sorb
an
ce
Concentration (µg/mL)
Calibration Curve of Aspirin

it permits the use of the wavelength of highest value of analytical signals (maximum or
minimum). Moreover, the presence of a lot of maxima and minima is another advantage by
the fact that these wavelengths give an opportunity for the determination of active
compounds in presence of other active compounds or excipients which possibly interfere with
the analysis. Determination of PRA was done by using spectrum of 75 µg/mL of ASP as a
divisor (Figure 7). The corresponding ratio spectra of PRA were then transformed to first
order derivative spectra and PRA was estimated at wavelength minima 268 nm (Figure 8).
Similarly, determination of ASP was done by using spectrum of 10 µg/mL of PRA as a
divisor (Figure 9) and converting these spectra into their respective first order derivative
(Figure 10). ASP was estimated at wavelength 290 nm (minima). The calibration curves were
constructed in the range of 6 to 22 µg/mL for PRA (Figure 11) and 45 to 165 µg/mL for ASP
(Figure 12) with good correlation.
Figure 7: Ratio spectra of PRA (6-22 µg/mL) using 75 µg/mL solution of ASP as divisor.

Figure 8: First derivative Ratio spectra of PRA (6-22 µg/mL).
Figure 9: Ratio spectra of ASP (45-165 µg/mL) using 10 µg/mL solution of PRA as divisor.

Figure 10: First derivative Ratio spectra of ASP (45-165 µg/mL).
Figure 11: Calibration curve of Prasugrel (6-22 µg/mL) by ratio first order derivative method.
y = 0.00228x + 0.00476
R² = 0.99975
0
0.01
0.02
0.03
0.04
0.05
0.06
0 5 10 15 20 25
Ab
sorb
an
ce
Concentration (µg/mL)
Calibration Curve of Prasugrel
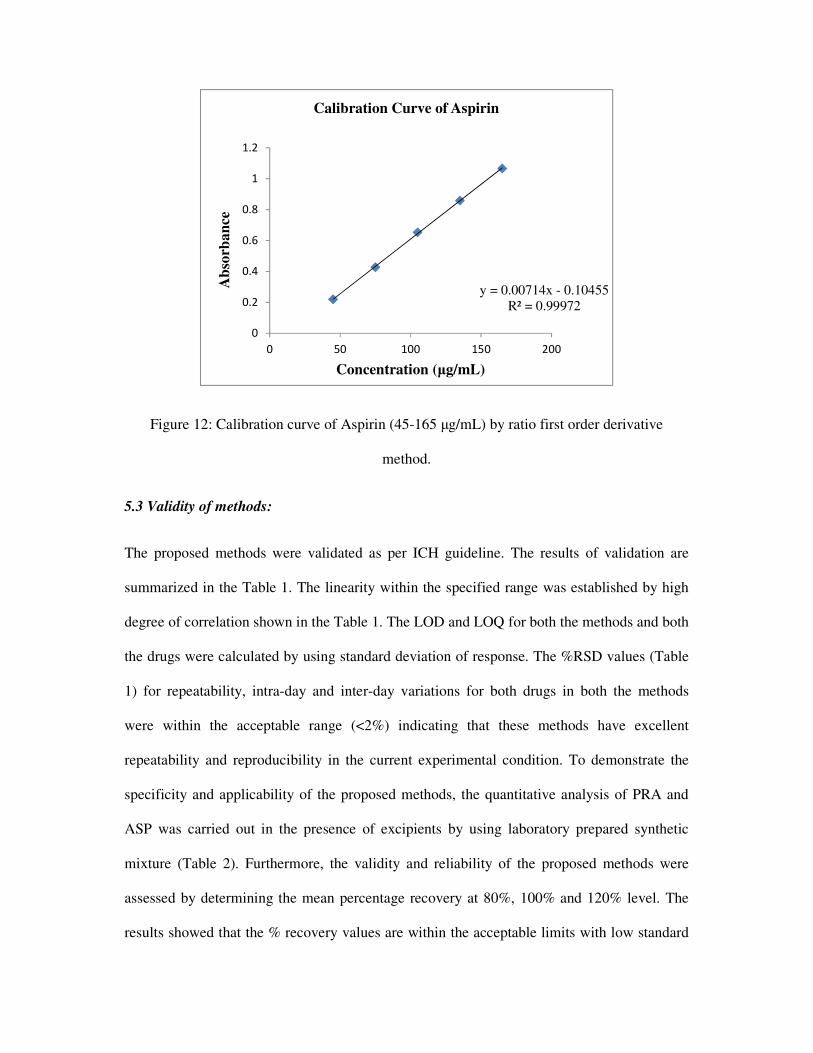
Figure 12: Calibration curve of Aspirin (45-165 µg/mL) by ratio first order derivative
method.
5.3 Validity of methods:
The proposed methods were validated as per ICH guideline. The results of validation are
summarized in the Table 1. The linearity within the specified range was established by high
degree of correlation shown in the Table 1. The LOD and LOQ for both the methods and both
the drugs were calculated by using standard deviation of response. The %RSD values (Table
1) for repeatability, intra-day and inter-day variations for both drugs in both the methods
were within the acceptable range (<2%) indicating that these methods have excellent
repeatability and reproducibility in the current experimental condition. To demonstrate the
specificity and applicability of the proposed methods, the quantitative analysis of PRA and
ASP was carried out in the presence of excipients by using laboratory prepared synthetic
mixture (Table 2). Furthermore, the validity and reliability of the proposed methods were
assessed by determining the mean percentage recovery at 80%, 100% and 120% level. The
results showed that the % recovery values are within the acceptable limits with low standard
y = 0.00714x - 0.10455
R² = 0.99972
0
0.2
0.4
0.6
0.8
1
1.2
0 50 100 150 200
Ab
sorb
an
ce
Concentration (µg/mL)
Calibration Curve of Aspirin

deviation indicating high accuracy of the proposed analytical methods. The average %
recoveries by both the methods are presented in Table 3a and 3b.
Table 1 Validation parameters for second order and ratio first order derivative
spectrophotometric methods
Validation Parameters Method D2* Method RD1**
PRA ASP PRA ASP
Linearity and Range
(µg/mL) 5 – 45 25 -150 6 - 22 45 – 165
Wavelength (nm) 267.62 252.40 268 290
Correlation Coefficient
(r2)
0.99909 0.99914 0.99975 0.99972
Slope 0.000028 0.000059 0.00228 0.00714
Intercept 0.000181 -0.000276 0.00476 -0.10455
Precision (%RSD)
Repeatabilty
Intraday Precision
Interday Precision
1.13%
0.94% - 1.88%
0.92% - 1.90%
0.91%
1.09% - 1.31%
0.54% - 1.96%
0.88%
0.56% - 1.78%
1.05% - 1.69%
0.72%
1.14% - 1.52%
1.27% - 1.50%
Accuracy (%Recovery) 98.81% –
100.19%
99.53% -
100.04%
100.07% -
100.75%
99.48% -
101.6%
LOD (µg/mL) 0.73 2.35 0.44 1.31
LOQ (µg/mL) 2.22 7.12 1.35 3.95
* Second order derivative method. **Ratio First order derivative method
PRA – Prasugrel, ASP - Aspirin. %RSD : Percent Relative Standard Deviation.

Table 2: Analysis of Synthetic Mixture
Drug Amount of drug
(mg)
Method D2 (n=3) Method RD1 (n=3)
% Amount found
(Mean% ± SD)
% Amount found
(Mean% ± SD)
Prasugrel 10 100.83% ± 2.06% 100.39% ± 0.58%
Aspirin 75 101.38% ± 0.67% 101.48% ± 0.77%
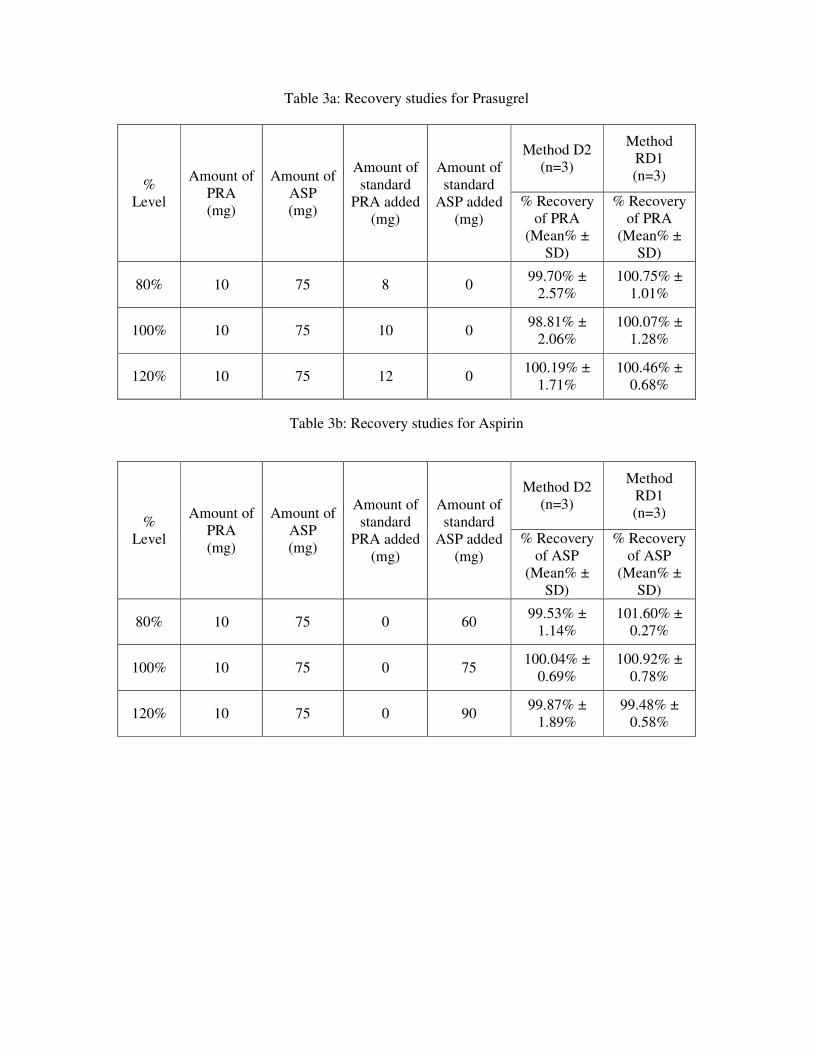
Table 3a: Recovery studies for Prasugrel
%
Level
Amount of
PRA
(mg)
Amount of
ASP
(mg)
Amount of
standard
PRA added
(mg)
Amount of
standard
ASP added
(mg)
Method D2
(n=3)
Method
RD1
(n=3)
% Recovery
of PRA
(Mean% ±
SD)
% Recovery
of PRA
(Mean% ±
SD)
80% 10 75 8 0 99.70% ±
2.57%
100.75% ±
1.01%
100% 10 75 10 0 98.81% ±
2.06%
100.07% ±
1.28%
120% 10 75 12 0 100.19% ±
1.71%
100.46% ±
0.68%
Table 3b: Recovery studies for Aspirin
%
Level
Amount of
PRA
(mg)
Amount of
ASP
(mg)
Amount of
standard
PRA added
(mg)
Amount of
standard
ASP added
(mg)
Method D2
(n=3)
Method
RD1
(n=3)
% Recovery
of ASP
(Mean% ±
SD)
% Recovery
of ASP
(Mean% ±
SD)
80% 10 75 0 60 99.53% ±
1.14%
101.60% ±
0.27%
100% 10 75 0 75 100.04% ±
0.69%
100.92% ±
0.78%
120% 10 75 0 90 99.87% ±
1.89%
99.48% ±
0.58%
6. Conclusion:
Two new, simple, accurate, and precise derivative UV spectroscopic methods were developed
for the simultaneous estimation of PRA and ASP in bulk drugs and in the presence of tablet
excipients. The recovery studies suggested non-interference of formulations excipients in the
estimation. Moreover, the methods have advantage over other methods that it completely
eliminates the spectral interference from one of the two drugs while estimating the other drug
at selected wavelength, hence the proposed methods can be used for the quality control of the
cited drugs and can be extended for routine analysis of the drugs in their pharmaceutical
preparations.

7. Acknowledgement:
The authors are thankful to Post Graduate Department of Pharmaceutical Sciences, Sardar
Patel University, Vallabh Vidyanagar, Gujarat, India for providing facilities to carry out
research work.
8. References:
1. Aspirin. DrugBank 3.0, Open data drug and drug target database. [cited 2013 Feb 20].
Available from: http://www.drugbank.ca/drugs/DB00945
2. “The Indian Pharmacopoeia,” The Indian Pharmacopoeia Commission, vol. II, pp.
842-843, 2010.
3. “British Pharmacopoeia,” British Pharmacopoeia Commission Office, vol. II, pp. 182-
183, 2378-2379, 2010.
4. “United States Pharmacopeia, National Formulary USP34 NF29,” United States
Pharmacopoeial Convention Inc., vol. 2, pp. 1931-1935, 2011.
5. Prasugrel. DrugBank 3.0, Open data drug and drug target database. [cited 2013 Feb
20]. Available from: http://www.drugbank.ca/drugs/DB06209
6. S. D. Wiviott, E. Braunwald, C. H. McCabe, G. Montalescot, W. Ruzyllo, S.
Gottlieb, et al, “Prasugrel versus clopidogrel in patients with acute coronary
syndromes,” N. Engl. J. Med., vol. 357, pp. 2001-2015, 2007.
7. B. Harshini, S. Alekhya, G. Manasa, K. P. Vanitha, “Extractive Spectrophotometric
Estimation of Prasugrel in Pharmaceutical Formulation,” Research Journal of
Pharmaceutical Biological and Chemical Sciences, vol. 2, no.3, pp. 426-430, 2011.
8. B. B. Kumar, A. A. Kumar, M. Laxmiram, G. Swamy, R. Das, G. Sankar,
“Spectrometric Determination Of Prasugrel In Bulk And In Its Pharmaceutical
Formulation By UV Method,” Pharmanest, vol. 2, no. 1, pp.55-57, 2011.

9. K. V. Prakash, B. M. Ishaq, G. K. Mohan, “Development and validation of HPLC
method for determination of Prasugrel in bulk and its pharmaceutical formulation,” J.
Chem. Pharm. Res., vol. 3, no. 4, pp. 404-409, 2011.
10. A. E. Prabahar, N. RamaRao, K. R. S. SambasivaRao, P. VijayarajKumar, “Method
development and validation for the HPLC potency assay of prasugrel tablets,” J.
Pharm. Res., vol. 4, no. 4, pp. 980-982, 2011.
11. M. C. Damle, T. C. Borole, R. Mehendre, K. G. Bothara, “Development and
validation of stability indicating HPTLC method for determination of Prasugrel,” J.
Chem. Pharm. Res., vol. 2, no. 4, pp. 907-913, 2012.
12. A. Verstraeten, E. Roets, J. Hoogmartens, “Quantitative determination by high-
performance liquid chromatography of acetylsalicylic acid and related substances in
tablets,” J. Chromatography A., vol. 388, pp. 201-216, 1987.
13. L. D. Jamadar, S. S. Kumar, K. Bhat, P. B. Musmade, S. G. Vasantharaju, N. Udupa,
“Analytical method development and validation for Aspirin,” Int. J. ChemTech Res.,
vol. 2, no.1, pp. 389-399, 2010.
14. M. Ahmed, M. H. U. Biswas, M. M. Rahman, M. S. A. Bhuiyan, M. A. H. M. Kamal,
G. Sadik, “Development of a spectrometric method for the determination of aspirin in
blood samples,” J. Med. Sci., vol. 1, no. 2, pp. 61-62, 2001.
15. P. Mishra, A. Dolly, “Simultaneous determination of Clopidogrel and Aspirin in
pharmaceutical dosage form,” Indian J. Pharma. Sci., vol. 68, no. 3, pp. 365-368,
2006.

16. K. Anandakumar, T. Ayyappan, V. R. Raman, T. Vetrichelvan, A. S. K. Sankar, D.
Nagavalli, “RP-HPLC analysis of aspirin and clopidogrel bisulphate in combination,”
Indian J. Pharm. Sci., vol. 69, pp. 597-599, 2007.
17. C. G. Shraddha, R. S. Aditi, C. J. Swati, A. D. Prasanna, P. C. Vishnu, S. K.
Bhanudas, “Spectrophotometric simultaneous determination of Aspirin and
Ticlopidine in combined tablet dosage form by first order derivative spectroscopy,
area under curve (AUC) and ratio derivative spectrophotometric methods,” Int. J.
Pharma. Sci. Review Res., vol. 3, no. 1, pp. 115-119, 2010.
18. D. K. Jain, N. Jain, J. Verma, “RP-HPLC Method for Simultaneous Estimation of
Aspirin and Prasugrel in Binary Combination,” International Journal of
Pharmaceutical Sciences and Drug Research, vol. 4, no. 3, pp. 218-221, 2012.
19. S. M. Patel, C. N. Patel, V. B. Patel, “Development and Validation of
Spectrophotometric Methods for Simultaneous Estimation of Prasugrel and Aspirin in
Tablet Dosage Form,” American Journal of PharmTech Research, vol. 2, no. 3, pp.
818-827, 2012.
20. Q2 (R1), “Validation of Analytical Procedures: Text and Methodology,” International
conference on Harmonization, pp. 1-13, 2005.