Embed Size (px)
Citation preview
Old Dominion UniversityODU Digital Commons
Bioelectrics Publications Frank Reidy Research Center for Bioelectrics
2005
Simulations of Nanopore Formation andPhosphatidylserine Externalization in LipidMembranes Subjected to a High-Intensity,Ultrashort Electric PulseQ. HuOld Dominion University
R. P. JoshiOld Dominion University
K. H. SchoenbachOld Dominion University
Follow this and additional works at: https://digitalcommons.odu.edu/bioelectrics_pubs
Part of the Biomedical Commons, Cell Anatomy Commons, Organic Chemistry Commons, andthe Radiation Medicine Commons
This Article is brought to you for free and open access by the Frank Reidy Research Center for Bioelectrics at ODU Digital Commons. It has beenaccepted for inclusion in Bioelectrics Publications by an authorized administrator of ODU Digital Commons. For more information, please [email protected].
Repository CitationHu, Q.; Joshi, R. P.; and Schoenbach, K. H., "Simulations of Nanopore Formation and Phosphatidylserine Externalization in LipidMembranes Subjected to a High-Intensity, Ultrashort Electric Pulse" (2005). Bioelectrics Publications. 235.https://digitalcommons.odu.edu/bioelectrics_pubs/235
Original Publication CitationHu, Q., Joshi, R. P., & Schoenbach, K. H. (2005). Simulations of nanopore formation and phosphatidylserine externalization in lipidmembranes subjected to a high-intensity, ultrashort electric pulse. Physical Review E, 72(3), 031902. doi:10.1103/PhysRevE.72.031902
Simulations of nanopore formation and phosphatidylserine externalization in lipid membranessubjected to a high-intensity, ultrashort electric pulse
Q. Hu, R. P. Joshi, and K. H. SchoenbachDepartment of Electrical and Computer Engineering, Old Dominion University, Norfolk, Virginia 23529-0246, USA
�Received 24 March 2005; published 8 September 2005�
A combined MD simulator and time dependent Laplace solver are used to analyze the electrically drivenphosphatidylserine externalization process in cells. Time dependent details of nanopore formation at cellmembranes in response to a high-intensity �100 kV/cm�, ultrashort �10 ns� electric pulse are also probed. Ourresults show that nanosized pores could typically be formed within about 5 ns. These predictions are in verygood agreement with recent experimental data. It is also demonstrated that defect formation and PS external-ization in membranes should begin on the anode side. Finally, the simulations confirm that PS externalizationis a nanopore facilitated event, rather than the result of molecular translocation across the trans-membraneenergy barrier.
DOI: 10.1103/PhysRevE.72.031902 PACS number�s�: 87.15.Aa, 87.50.Rr, 87.50.�a, 87.17.Aa
I. INTRODUCTION
The use of very high electric fields ��100 kV/cm orhigher� with pulse durations in the nanosecond range �1–3�has been a very recent development in bioelectrics. Tradi-tionally, most electroporation studies have focused on rela-tively low external electric fields �less than a kilovolt percentimeter�, applied over time periods ranging from severaltens of microseconds to milliseconds �4�. From a practicalstandpoint, nanosecond pulsed electric fields �nsPEFs� couldbe useful for various biological applications ranging fromcellular electroporation �5–7�, the production of hybridomas�8,9�, injection of xenomolecules such as hormones, proteins,RNA, DNA and chromosomes �10–16�, the electrofusion ofdielectrophoretically aligned cells �17,18�, and the nonther-mal destruction of microorganisms �19–21�. In ex vivo stud-ies, electroporation has been used to load drugs. Manipula-tion of the oxygen binding capability �22� and theelectroinsertion of proteins �23� have also been carried out.In vivo applications have included the delivery of potent an-ticancer drugs into solid tumors �24,25�.
There appear to be inherent advantages in using shortelectric pulses. These include: �i� Negligible thermal heating,�ii� the ability to develop large electric fields and peak pow-ers, with a lower energy input, and most importantly, �iii� thecapacity to create large transmembrane potentials across sub-cellular organelles, such as the mitochondria. As has beenrecently reported, voltage variations across the mitochondrialmembrane can induce cytochrome c release via a two-stepprocess �26,27�. The likely channel involves a field-induceddisruption in the electrostatic binding of cytochrome c withthe inner mitochondrial membrane. The details have not beenstudied, and the dynamics remain unclear. However, this re-lease does trigger the activation of various caspases, and apo-ptotic cell death ultimately results. Thus, deliberate and tar-geted apoptotic cell killing �e.g., of tumor cells� canpotentially be achieved through the use of an ultrashort,high-intensity electrical pulse.
The following salient features have emerged from variousrecent studies of cellular responses to high-intensity
��100 kV/cm�, nanosecond electric pulses. �i� Apoptosishas been observed �28,29� for cells with the behavior de-pending on pulse duration. Thus, for example, cells subjectedto various external electric fields at a constant energy level,showed strongest apoptosis markers for the longer��300 ns� pulses, less at the shorter ��60 ns� durations, andalmost negligible effects for a short 10 ns pulse �29�. A re-cent model based on an energy-landscape approach �30�yielded results qualitatively in keeping with these observa-tions. �ii� Multiple pulses have been observed to do moreirreversible damage than single-shot electric shocks. �iii� Ex-ternalization of phosphatidylserine �PS� was shown to occurin response to a nanosecond pulse for average electric fieldsabove 2 MV/m �31,32�. A distinct polarity effect has beenobserved, with the externalization predominantly occurringat the anode end. PS is an acidic phospholipid that is nor-mally located on the inner leaflet of the lipid bilayer. The PStranslocation event essentially marks cells for macrophagescavenging and ultimate death. However, the mechanism re-mains to be studied, and the dynamical process details willbe addressed here. �iv� Calcium is released from the intrac-ellular endoplasmic reticulum in response to external voltagepulses �6,33–35�. This could be a vital element in inductionor possible suppression of cell signaling.
Much of the biophysical analysis related to such field-dependent phenomena has generally been based on static,continuum models. For example, predictions of pore growthand evolution utilize a voltage controlled, pore formationenergy function that is spatially independent �3,36,37�, anddoes not account for structural changes. Similarly, static en-ergy barrier concepts �e.g., the Born energy �38� are invokedfor ion transport across membranes, and for PS flip-flop tran-sitions occurring in lipid bilayers �39�. Such a static pictureis inaccurate because of the inherent fluctuations andvoltage-driven dynamical changes in the molecular structure.Furthermore, since such external field driven processes occurunder highly nonequilibrium conditions, the application ofsimple thermodynamics and Markovian response breaksdown.
An essential task here is to accurately model the collec-tive physics at the molecular level due to the externally ap-
PHYSICAL REVIEW E 72, 031902 �2005�
1539-3755/2005/72�3�/031902�10�/$23.00 ©2005 The American Physical Society031902-1
plied, high-field, short-duration macrovoltages. For realisticsimulations it is important to address two aspects simulta-neously. First, the time dependent electric fields, created atthe cell membrane by the external voltage waveform appliedto remote electrodes, need to be obtained. This field providesthe dynamic driving force for the membrane molecules, in-ternal dipoles and surrounding water. Second, the dynamicalevolution of the membrane nanostructure under the influenceof this dynamic field and the many-body interactions need tobe adequately treated. Here, the first aspect has been ad-dressed through a Laplace solver coupled with the Smolu-chowski equation for the time dependent potential distribu-tion. This yields a dynamic electric field and transmembranevoltage at a membrane patch. A molecular dynamics ap-proach has then been applied to the membrane patch �takento correspond with the polar region of a cell� to evaluate themolecular response. In most other simulations of this typefor chemical and biological applications �40–42�, there is noexternally applied voltage. Only a few recent reports �43,44�have considered the effect of electric fields on biomem-branes. However, in those cases, a constant electric field hadbeen assumed. In the present context, actual nanosecond��10 ns� pulses are routinely applied in our laboratory�29,35�, and so any realistic modeling necessitates the inclu-sion of time-varying transmembrane voltages.
An important goal of this contribution is the analysis ofPS externalization that has been observed with nsPEF appli-cation. In healthy cells, PS is almost exclusively located onthe inner plasma membrane of eukaryotic cells �45�. Thisskewed spatial distribution is maintained by a Ca2+ inhibited,adenosine triphosphate �ATP� -dependent aminophospholipidtranslocase �46�, and a Ca2+ dependent aminophospholipidscramblase �47,48�. The translocation of PS on the outerleaflet is an important physiological signal that marks the cellfor phagocytosis, and even plays a role in platelet activationand blood coagulation �49�. The physical mechanism re-mains unclear, though a calcium-aided process �34�, a pos-sible nonporative dipole interaction mechanism �50�, and po-rative diffusion �51� have all been suggested. Here it isdemonstrated that the PS externalization process for the ul-trashort, high-intensity situation is simply the result ofnanopore formation in the plasma membrane, followed bythe drift and diffusion of the charged PS molecules. Theanodic-side externalization can be understood as arising fromthe anode-side preference for nanopore formation. The direc-tionality of electrical forces on the negatively charged PSmolecules also contributes. Though there could well be otherchemically driven processes �34,50�, including interactionsbetween PS and reactive oxygen species �52�, here we focuspurely on the electrical pathway.
II. MODELING DETAILS
In order to facilitate meaningful comparisons with actualexperiments, two important aspects have to be considered.First, the microscopic electric field across an actual mem-brane has to be determined from an experimentally averagedvalue representing the global voltage applied across the en-tire sample. Typically, such electric-pulse experiments are
carried out by placing a buffered mixture containing the cellsin a microcuvette. Thus only the spatially averaged electricfield is known from the applied voltage input and physicalseparation between electrodes. The task of determining themicroscopic membrane voltage at a microscopic patch fromthe global value was carried out here by an analytical model,as discussed in the next section. A second important point isthat the microscopic membrane field is time dependent andhence, the temporal details need to be included within theMD simulations. Here, this was obtained dynamically bycoupling a Laplace solver with the Smoluchowski equation.This yielded a dynamic transmembrane voltage, which wasdiscretized in time as a step function, and used as an input tothe MD code.
A. Time dependent transmembrane potential calculations
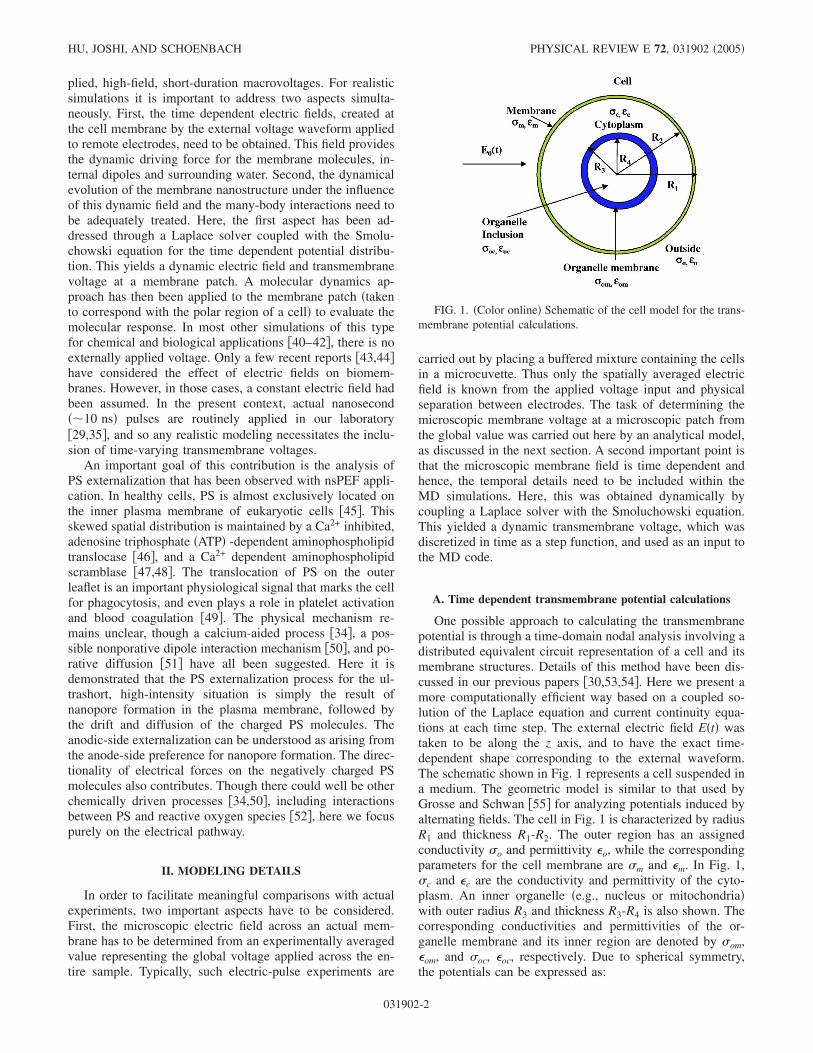
One possible approach to calculating the transmembranepotential is through a time-domain nodal analysis involving adistributed equivalent circuit representation of a cell and itsmembrane structures. Details of this method have been dis-cussed in our previous papers �30,53,54�. Here we present amore computationally efficient way based on a coupled so-lution of the Laplace equation and current continuity equa-tions at each time step. The external electric field E�t� wastaken to be along the z axis, and to have the exact time-dependent shape corresponding to the external waveform.The schematic shown in Fig. 1 represents a cell suspended ina medium. The geometric model is similar to that used byGrosse and Schwan �55� for analyzing potentials induced byalternating fields. The cell in Fig. 1 is characterized by radiusR1 and thickness R1-R2. The outer region has an assignedconductivity �o and permittivity �o, while the correspondingparameters for the cell membrane are �m and �m. In Fig. 1,�c and �c are the conductivity and permittivity of the cyto-plasm. An inner organelle �e.g., nucleus or mitochondria�with outer radius R3 and thickness R3-R4 is also shown. Thecorresponding conductivities and permittivities of the or-ganelle membrane and its inner region are denoted by �om,�om, and �oc, �oc, respectively. Due to spherical symmetry,the potentials can be expressed as:
FIG. 1. �Color online� Schematic of the cell model for the trans-membrane potential calculations.
HU, JOSHI, AND SCHOENBACH PHYSICAL REVIEW E 72, 031902 �2005�
031902-2
Cell
Organelle membrane 0 0111, £om
�nc�r,t� = �i=0
�
Ai�t�riPi, �1a�
�ne�r,t� = �i=0
�
B3i�t�riPi + C3i�t�Pi/ri+1, �1b�
�c�r,t� = �i=0
�
B2i�t�riPi + C2i�t�Pi/ri+1, �1c�
�m�r,t� = �i=0
�
B1i�t�riPi + C1i�t�Pi/ri+1, �1d�
�o�r,t� = − E0�t� + �i=0
�
Di�t�Pi/ri+1, �1e�
where �o�r , t�, �m�r , t�, �c�r , t�, �om�r , t� and �oc�r , t� are thepotentials at the outer region, the plasma membrane, the cy-toplasm, the organelle membrane, and the organelle interior.Pj is the jth order Legendre polynomial, and E0�t� the exter-nally applied electric field. Also, Ai�t�, B1i�t�, B2i�t�, B3i�t�,C1i�t�, C2i�t�, C3i�t�, and Di�t� are the coefficients of the Leg-endre series expansions that can be determined by applyingmatching boundary conditions at the interfaces of the threeregions. Here, the Laplace �instead of Poisson’s equation�has been used on the assumption that charge inequalitiesarising from ionic transport during electroporation processcan be ignored on the short time scales. As will be shownlater, the current flows are not very large and so charge trans-fer during the ultrashort time scales of interest here��5 ns�, are indeed minimal. Invoking continuity in the po-tential and current density then leads to the following bound-ary conditions:
�o��r,t��R1= �m��r,t��R1
, �2a�
�m��r,t��R2= �c��r,t��R2
, �2b�
�c��r,t��R3= �om��r,t��R3
, �2c�
�om��r,t��R4= �oc��r,t��R4
, �2d�
�oEro�t� + �o� �Er
o�t��t
�R1
= �mErm�t� + �m� �Er
m�t��t
�R1
,
�2e�
�mErm�t� + �m� �Er
m�t��t
�R2
= �cErc�t� + �c� �Er
c�t��t
�R2
,
�2f�
�cErc�t� + �c� �Er
c�t��t
�R3
= �omErom�t� + �om� �Er
om�t��t
�R3
,
�2g�
�omErom�t� + �om� �Er
om�t��t
�R4
= �ocEroc�t� + �oc� �Er
oc�t��t
�R4
.
�2h�
Here Er=−�� /�t is the radial electric field. Due to elec-troporation, the parameters �m�t�, �m�t�, �om�t�, and �oc�t� areall time dependent. For self-consistency, the time depen-dence of these electrical transport parameters has to be ob-tained and taken into consideration. This was carried out hereby coupling the Smoluchowski equation �SE� for the growthand decay of pores. Details of the SE, its application to elec-troporation and dynamical conductivity have been addressedin a series of recent papers �30,53,54� by our group, and willnot be reviewed here. In essence, the pore area and effectivemembrane conductivity �=�m�t�� become time dependent.Taking this into account, Eq. �1� and Eq. �2� can finally becast into the following form:
KA�t + �t�B1�t + �t�B2�t + �t�B3�t + �t�
=f1�t�f2�t�f3�t�f4�t�
, �3�
where K is a 4�4 coefficient matrix, while Cj�t+�t� andD�t+�t� are updated at each time step based on the variousvalues A�t+�t� and Bj�t+�t�, for j=1,2 ,3. The vector f�t�on the right side of Eq. �3�, are known functions that areupdated every time step.
Solving Eqs. �2a�–�2h� and �3� yields the transmembranepotential and electric field at a chosen “patch” on the cellmembrane. In the present case, the patch was taken to be onthe polar axis.
B. Molecular dynamics simulations
The molecular dynamics �MD� scheme was used to probeelectric-field-induced effects on a typical membrane. Thismethod is superior to continuum approaches. Some of theadvantages are as follows: �i� Inclusion of the collective,many-body interaction potentials at the nanoscale level, �ii�dynamical screening, �iii� avoidance of the “mean-field” ap-proximations, �iv� a natural inclusion of noise and statisticalfluctuations, �v� self-consistent and dynamical transport cal-culations without arbitrary fitting parameters, and �vi� easyincorporation of arbitrary defects and nonuniformities, aswell as complex geometries.
In early work, Veneble et al. �56� and Egberts et al. �57�applied this technique to dipalmitoylphosphatidylcholine�DPPC� bilayers. Various other studies of lipid bilayer sys-tems have since been reported �58–61�. MD simulations relyon the application of classical Newtonian mechanics for thedynamical movement of ions and neutral atoms, taking ac-count of the many-body interactions within a realistic mo-lecular representation of the biosystem �62–65�. Thus, forexample, a segment of the lipid bilayer membrane or a chan-nel protein is first constructed taking account of the initialgeometric arrangement of all the atoms and their bondingangles. Regions of water containing user-specified ion den-
SIMULATIONS OF NANOPORE FORMATION AND… PHYSICAL REVIEW E 72, 031902 �2005�
031902-3
sities are then defined on either side of the membrane to formthe total simulation space. In water-lipid system, simplepoint charge �SPC� is preferred as the water model because ithas a better chemical potential in mixed systems.
Initial velocities, temperature and pressure are set for allparticles. In order to prevent the system energies from in-creasing with time due to the dynamic acceleration, veloci-ties are typically rescaled periodically by coupling the sys-tem to a constant temperature bath �66�.
In our study, the GROMACS �Groningen Machine forChemical Simulations� package in NpT ensemble �67–69�was used for the MD simulations of field-induced membraneeffects. The dipalmitoyl-phosphatidyl-choline �DPPC� mem-brane was chosen, and the force fields for membrane molecu-lar motion taken from the literature �65�. The system wascoupled using a semi-isotropic Berendsen pressure couplingof 1 atmosphere with compressibility of 4�10−5 on x and ydirection, and zero on z direction. A heat bath of 323 K ischosen to retain the liquid phase of the membrane �70�. Thealgorithms for pressure and temperature control were thosediscussed by Allen and Tildesly �62�. A 4 fs time step wasused with algorithm outlined by Berendsen et al. �71,72� toconstrain all the bond lengths within the lipids and on thewater geometry. A group based twin cutoff scheme was em-ployed for the nonbonded interactions, with cutoff radii of0.9 nm for both the Lennard-Jones and Van der Waals inter-action calculations. The particle-mesh Ewald �PME� schemewas applied for long-range electrostatic interactions. Periodicboundaries were applied, and the simulations carried out un-der constant pressure conditions. This method �66� allowsthe simulation box size to change so that the internal virialmatches the external pressure.
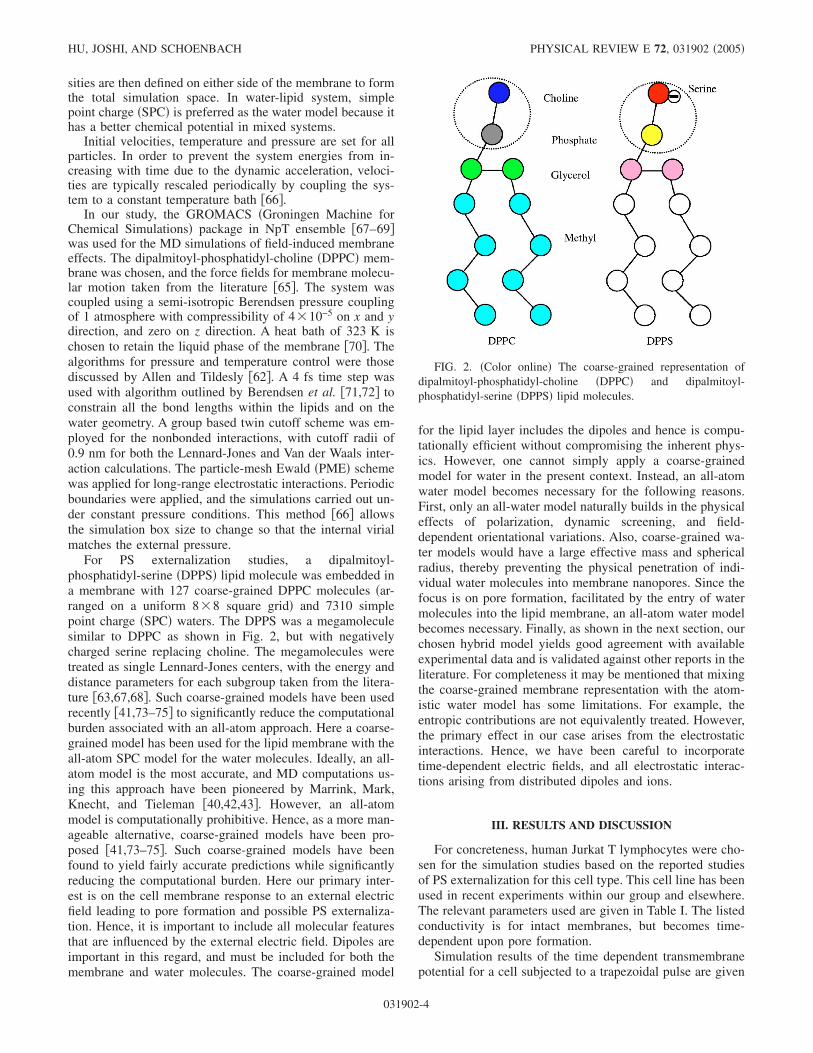
For PS externalization studies, a dipalmitoyl-phosphatidyl-serine �DPPS� lipid molecule was embedded ina membrane with 127 coarse-grained DPPC molecules �ar-ranged on a uniform 8�8 square grid� and 7310 simplepoint charge �SPC� waters. The DPPS was a megamoleculesimilar to DPPC as shown in Fig. 2, but with negativelycharged serine replacing choline. The megamolecules weretreated as single Lennard-Jones centers, with the energy anddistance parameters for each subgroup taken from the litera-ture �63,67,68�. Such coarse-grained models have been usedrecently �41,73–75� to significantly reduce the computationalburden associated with an all-atom approach. Here a coarse-grained model has been used for the lipid membrane with theall-atom SPC model for the water molecules. Ideally, an all-atom model is the most accurate, and MD computations us-ing this approach have been pioneered by Marrink, Mark,Knecht, and Tieleman �40,42,43�. However, an all-atommodel is computationally prohibitive. Hence, as a more man-ageable alternative, coarse-grained models have been pro-posed �41,73–75�. Such coarse-grained models have beenfound to yield fairly accurate predictions while significantlyreducing the computational burden. Here our primary inter-est is on the cell membrane response to an external electricfield leading to pore formation and possible PS externaliza-tion. Hence, it is important to include all molecular featuresthat are influenced by the external electric field. Dipoles areimportant in this regard, and must be included for both themembrane and water molecules. The coarse-grained model
for the lipid layer includes the dipoles and hence is compu-tationally efficient without compromising the inherent phys-ics. However, one cannot simply apply a coarse-grainedmodel for water in the present context. Instead, an all-atomwater model becomes necessary for the following reasons.First, only an all-water model naturally builds in the physicaleffects of polarization, dynamic screening, and field-dependent orientational variations. Also, coarse-grained wa-ter models would have a large effective mass and sphericalradius, thereby preventing the physical penetration of indi-vidual water molecules into membrane nanopores. Since thefocus is on pore formation, facilitated by the entry of watermolecules into the lipid membrane, an all-atom water modelbecomes necessary. Finally, as shown in the next section, ourchosen hybrid model yields good agreement with availableexperimental data and is validated against other reports in theliterature. For completeness it may be mentioned that mixingthe coarse-grained membrane representation with the atom-istic water model has some limitations. For example, theentropic contributions are not equivalently treated. However,the primary effect in our case arises from the electrostaticinteractions. Hence, we have been careful to incorporatetime-dependent electric fields, and all electrostatic interac-tions arising from distributed dipoles and ions.
III. RESULTS AND DISCUSSION
For concreteness, human Jurkat T lymphocytes were cho-sen for the simulation studies based on the reported studiesof PS externalization for this cell type. This cell line has beenused in recent experiments within our group and elsewhere.The relevant parameters used are given in Table I. The listedconductivity is for intact membranes, but becomes time-dependent upon pore formation.
Simulation results of the time dependent transmembranepotential for a cell subjected to a trapezoidal pulse are given
FIG. 2. �Color online� The coarse-grained representation ofdipalmitoyl-phosphatidyl-choline �DPPC� and dipalmitoyl-phosphatidyl-serine �DPPS� lipid molecules.
HU, JOSHI, AND SCHOENBACH PHYSICAL REVIEW E 72, 031902 �2005�
031902-4
Phosphate
Methyl
DPPC DPPS
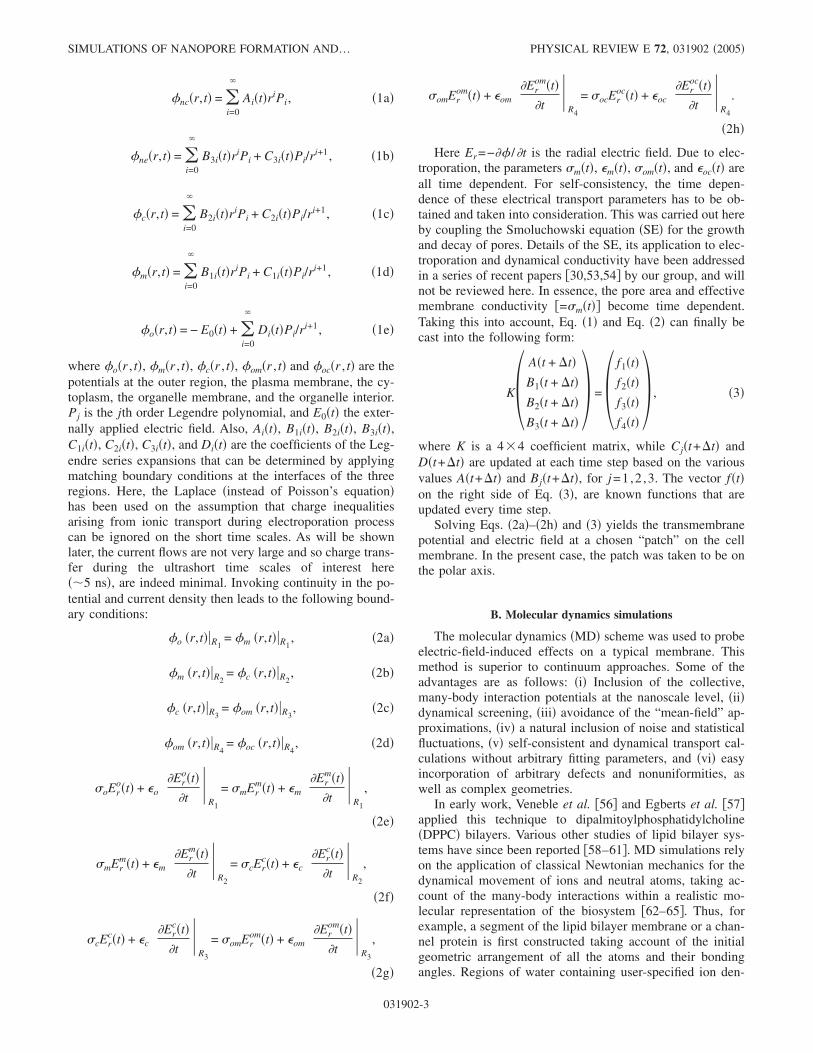
in Fig. 3. A coupled scheme based on the Laplace andSmoluchowski equations was used for the calculations. Theexternal, averaged electric field pulse was taken to be0.01 V/nm in magnitude, with rise and fall times of 1.5 nsand 1.5 ns, respectively, and a 10 ns ON-time. Such pulsesare routinely used for experimental research in our group�2,29�. During the initial 500 ns of the simulation �as shownin Fig. 3�, no external pulse was applied. This was done toallow the system to reach an initial steady state with an equi-librium distribution of nanopores within the membranes inkeeping with the Smoluchowski-based continuum model�29,53�. A transient overshoot of the transmembrane poten-tial is predicted in Fig. 3. The overshoot trend agrees verywell with a recent experimental report �76�. The time-
dependent electric field values across the plasma membraneobtained from these time-dependent results were used as re-alistic inputs for the MD simulations. Thus, this approacheffectively connected our macroscopic, time dependenttransmembrane voltage to the MD scheme, allowing for ac-curate nanoscale study of membrane breakdown by a largeexternal voltage.
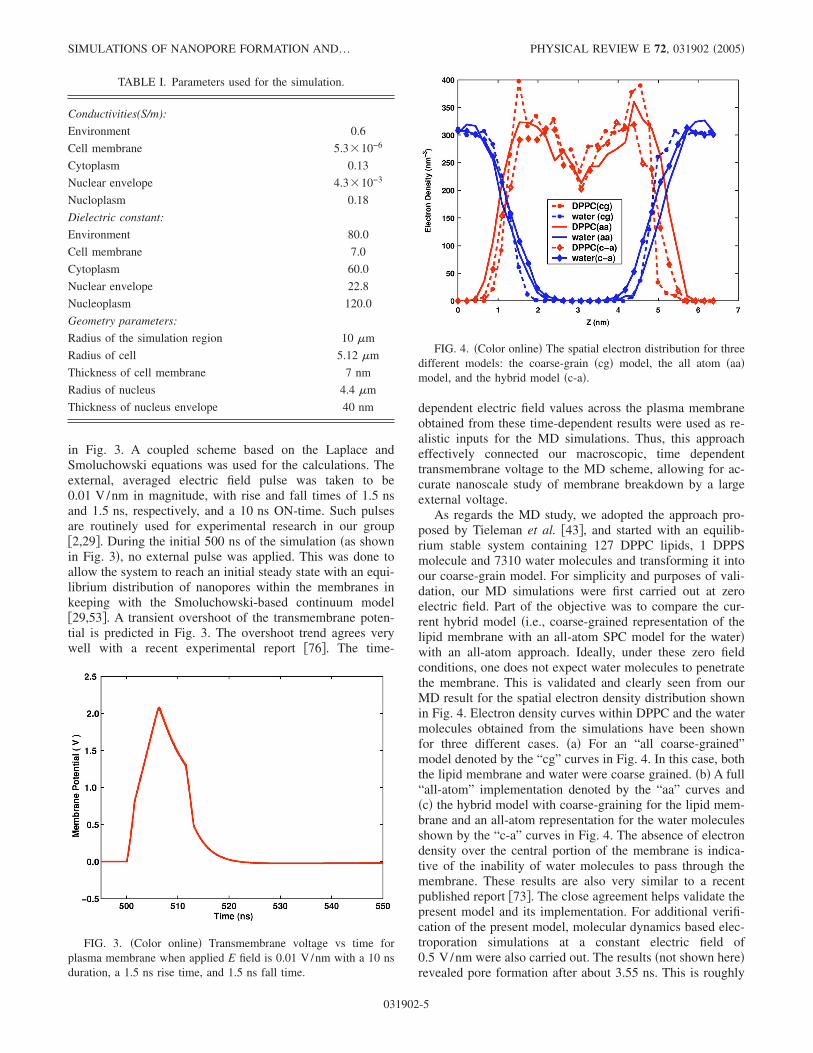
As regards the MD study, we adopted the approach pro-posed by Tieleman et al. �43�, and started with an equilib-rium stable system containing 127 DPPC lipids, 1 DPPSmolecule and 7310 water molecules and transforming it intoour coarse-grain model. For simplicity and purposes of vali-dation, our MD simulations were first carried out at zeroelectric field. Part of the objective was to compare the cur-rent hybrid model �i.e., coarse-grained representation of thelipid membrane with an all-atom SPC model for the water�with an all-atom approach. Ideally, under these zero fieldconditions, one does not expect water molecules to penetratethe membrane. This is validated and clearly seen from ourMD result for the spatial electron density distribution shownin Fig. 4. Electron density curves within DPPC and the watermolecules obtained from the simulations have been shownfor three different cases. �a� For an “all coarse-grained”model denoted by the “cg” curves in Fig. 4. In this case, boththe lipid membrane and water were coarse grained. �b� A full“all-atom” implementation denoted by the “aa” curves and�c� the hybrid model with coarse-graining for the lipid mem-brane and an all-atom representation for the water moleculesshown by the “c-a” curves in Fig. 4. The absence of electrondensity over the central portion of the membrane is indica-tive of the inability of water molecules to pass through themembrane. These results are also very similar to a recentpublished report �73�. The close agreement helps validate thepresent model and its implementation. For additional verifi-cation of the present model, molecular dynamics based elec-troporation simulations at a constant electric field of0.5 V/nm were also carried out. The results �not shown here�revealed pore formation after about 3.55 ns. This is roughly
TABLE I. Parameters used for the simulation.
Conductivities(S/m):
Environment 0.6
Cell membrane 5.3�10−6
Cytoplasm 0.13
Nuclear envelope 4.3�10−3
Nucloplasm 0.18
Dielectric constant:
Environment 80.0
Cell membrane 7.0
Cytoplasm 60.0
Nuclear envelope 22.8
Nucleoplasm 120.0
Geometry parameters:
Radius of the simulation region 10 �m
Radius of cell 5.12 �m
Thickness of cell membrane 7 nm
Radius of nucleus 4.4 �m
Thickness of nucleus envelope 40 nm
FIG. 3. �Color online� Transmembrane voltage vs time forplasma membrane when applied E field is 0.01 V/nm with a 10 nsduration, a 1.5 ns rise time, and 1.5 ns fall time.
FIG. 4. �Color online� The spatial electron distribution for threedifferent models: the coarse-grain �cg� model, the all atom �aa�model, and the hybrid model �c-a�.
SIMULATIONS OF NANOPORE FORMATION AND… PHYSICAL REVIEW E 72, 031902 �2005�
031902-5
2.5 ~-~---~----~---~----~---~
2.0
> :::: 1.5 "' E !!! 0 o.. 1.0 Q) C
~ .c
~ 0.5 :;
-o.5~-~----~---~----~----~---~ 500 510 520
Time (ns) 530 540 550
400
350
300
'7-E 250 .s :!' "iii C: 200 " 0 C: e ti 150
" w 100
50
0
n II 11
-• DPPC(cg) -• water (cg) - DPPC(aa) - water (aa) -• DPPC(c-a) -+- water(c-a)
0 2 3 4 5 6 7
Z (n m)
in keeping with a recent report by Tieleman et al. �43� basedon a more sophisticated all-atom model fordioleoylphosphatidyl-choline. This lends an additional test ofour present method.
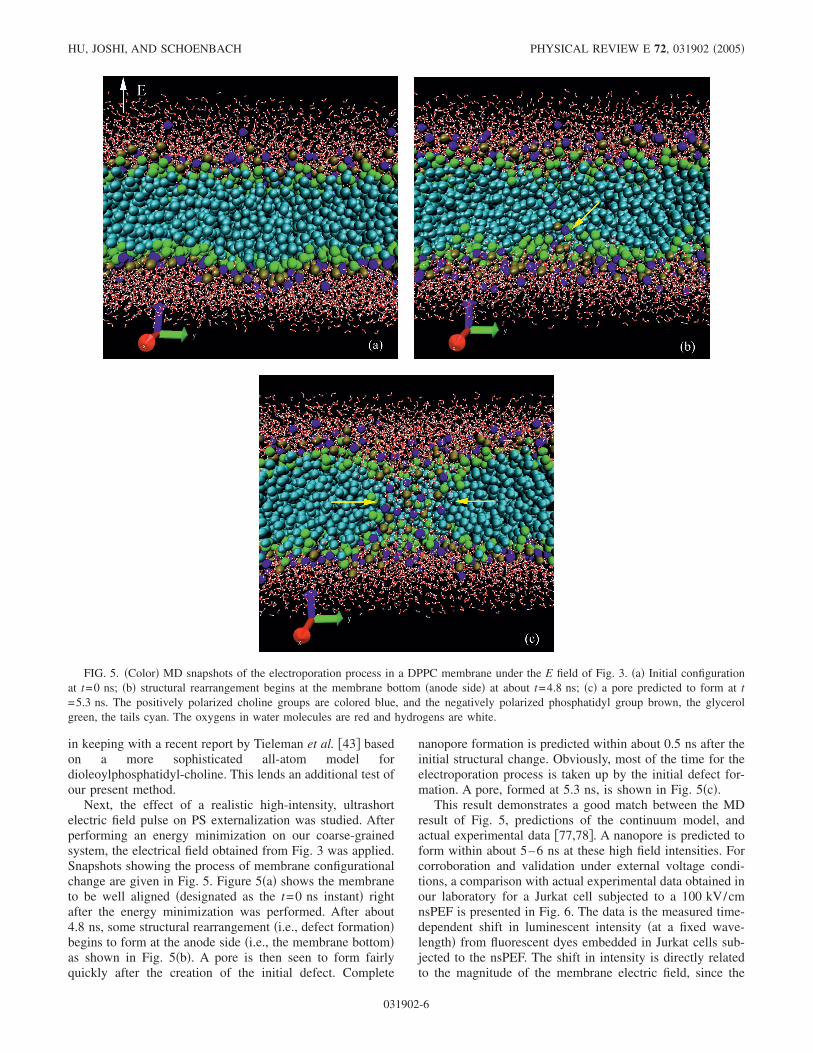
Next, the effect of a realistic high-intensity, ultrashortelectric field pulse on PS externalization was studied. Afterperforming an energy minimization on our coarse-grainedsystem, the electrical field obtained from Fig. 3 was applied.Snapshots showing the process of membrane configurationalchange are given in Fig. 5. Figure 5�a� shows the membraneto be well aligned �designated as the t=0 ns instant� rightafter the energy minimization was performed. After about4.8 ns, some structural rearrangement �i.e., defect formation�begins to form at the anode side �i.e., the membrane bottom�as shown in Fig. 5�b�. A pore is then seen to form fairlyquickly after the creation of the initial defect. Complete
nanopore formation is predicted within about 0.5 ns after theinitial structural change. Obviously, most of the time for theelectroporation process is taken up by the initial defect for-mation. A pore, formed at 5.3 ns, is shown in Fig. 5�c�.
This result demonstrates a good match between the MDresult of Fig. 5, predictions of the continuum model, andactual experimental data �77,78�. A nanopore is predicted toform within about 5–6 ns at these high field intensities. Forcorroboration and validation under external voltage condi-tions, a comparison with actual experimental data obtained inour laboratory for a Jurkat cell subjected to a 100 kV/cmnsPEF is presented in Fig. 6. The data is the measured time-dependent shift in luminescent intensity �at a fixed wave-length� from fluorescent dyes embedded in Jurkat cells sub-jected to the nsPEF. The shift in intensity is directly relatedto the magnitude of the membrane electric field, since the
FIG. 5. �Color� MD snapshots of the electroporation process in a DPPC membrane under the E field of Fig. 3. �a� Initial configurationat t=0 ns; �b� structural rearrangement begins at the membrane bottom �anode side� at about t=4.8 ns; �c� a pore predicted to form at t=5.3 ns. The positively polarized choline groups are colored blue, and the negatively polarized phosphatidyl group brown, the glycerolgreen, the tails cyan. The oxygens in water molecules are red and hydrogens are white.
HU, JOSHI, AND SCHOENBACH PHYSICAL REVIEW E 72, 031902 �2005�
031902-6
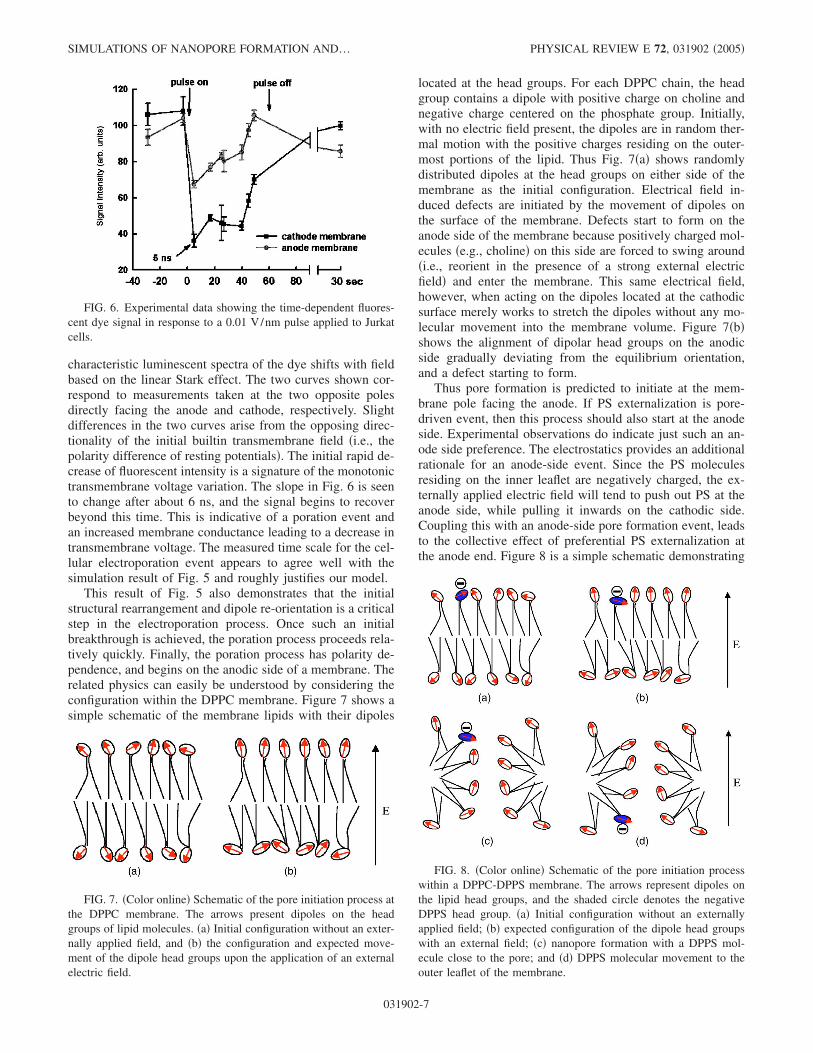
characteristic luminescent spectra of the dye shifts with fieldbased on the linear Stark effect. The two curves shown cor-respond to measurements taken at the two opposite polesdirectly facing the anode and cathode, respectively. Slightdifferences in the two curves arise from the opposing direc-tionality of the initial builtin transmembrane field �i.e., thepolarity difference of resting potentials�. The initial rapid de-crease of fluorescent intensity is a signature of the monotonictransmembrane voltage variation. The slope in Fig. 6 is seento change after about 6 ns, and the signal begins to recoverbeyond this time. This is indicative of a poration event andan increased membrane conductance leading to a decrease intransmembrane voltage. The measured time scale for the cel-lular electroporation event appears to agree well with thesimulation result of Fig. 5 and roughly justifies our model.
This result of Fig. 5 also demonstrates that the initialstructural rearrangement and dipole re-orientation is a criticalstep in the electroporation process. Once such an initialbreakthrough is achieved, the poration process proceeds rela-tively quickly. Finally, the poration process has polarity de-pendence, and begins on the anodic side of a membrane. Therelated physics can easily be understood by considering theconfiguration within the DPPC membrane. Figure 7 shows asimple schematic of the membrane lipids with their dipoles
located at the head groups. For each DPPC chain, the headgroup contains a dipole with positive charge on choline andnegative charge centered on the phosphate group. Initially,with no electric field present, the dipoles are in random ther-mal motion with the positive charges residing on the outer-most portions of the lipid. Thus Fig. 7�a� shows randomlydistributed dipoles at the head groups on either side of themembrane as the initial configuration. Electrical field in-duced defects are initiated by the movement of dipoles onthe surface of the membrane. Defects start to form on theanode side of the membrane because positively charged mol-ecules �e.g., choline� on this side are forced to swing around�i.e., reorient in the presence of a strong external electricfield� and enter the membrane. This same electrical field,however, when acting on the dipoles located at the cathodicsurface merely works to stretch the dipoles without any mo-lecular movement into the membrane volume. Figure 7�b�shows the alignment of dipolar head groups on the anodicside gradually deviating from the equilibrium orientation,and a defect starting to form.
Thus pore formation is predicted to initiate at the mem-brane pole facing the anode. If PS externalization is pore-driven event, then this process should also start at the anodeside. Experimental observations do indicate just such an an-ode side preference. The electrostatics provides an additionalrationale for an anode-side event. Since the PS moleculesresiding on the inner leaflet are negatively charged, the ex-ternally applied electric field will tend to push out PS at theanode side, while pulling it inwards on the cathodic side.Coupling this with an anode-side pore formation event, leadsto the collective effect of preferential PS externalization atthe anode end. Figure 8 is a simple schematic demonstrating
FIG. 6. Experimental data showing the time-dependent fluores-cent dye signal in response to a 0.01 V/nm pulse applied to Jurkatcells.
FIG. 7. �Color online� Schematic of the pore initiation process atthe DPPC membrane. The arrows present dipoles on the headgroups of lipid molecules. �a� Initial configuration without an exter-nally applied field, and �b� the configuration and expected move-ment of the dipole head groups upon the application of an externalelectric field.
FIG. 8. �Color online� Schematic of the pore initiation processwithin a DPPC-DPPS membrane. The arrows represent dipoles onthe lipid head groups, and the shaded circle denotes the negativeDPPS head group. �a� Initial configuration without an externallyapplied field; �b� expected configuration of the dipole head groupswith an external field; �c� nanopore formation with a DPPS mol-ecule close to the pore; and �d� DPPS molecular movement to theouter leaflet of the membrane.
SIMULATIONS OF NANOPORE FORMATION AND… PHYSICAL REVIEW E 72, 031902 �2005�
031902-7
~ "' ~ .S 60 oi C: C)
en 40 -- cathode membrane
6 ns· / -- anode membrane
20 .____.______.__~ -40 -20 0 20 40 60 80 ~ sec
e
}rtKtl )J~ttK J 1111~ jt,~iiu E ~, (~
1~11~ JU'LiV {c) J~ d) i (a) (b)
the dynamics. Initially �Fig. 8�a��, the dipoles at the DPPClipids �shown as arrows� are randomly located, with a nega-tive PS on the inner leaflet. With application of the electricfield, the dipoles on the outer layer �anode-side� reorientleading to defect initiation at the outer membrane surface.Eventually a pore forms �Fig. 8�c��, and the negativelycharged PS begins to drift and diffuse towards the exteriorsurface.
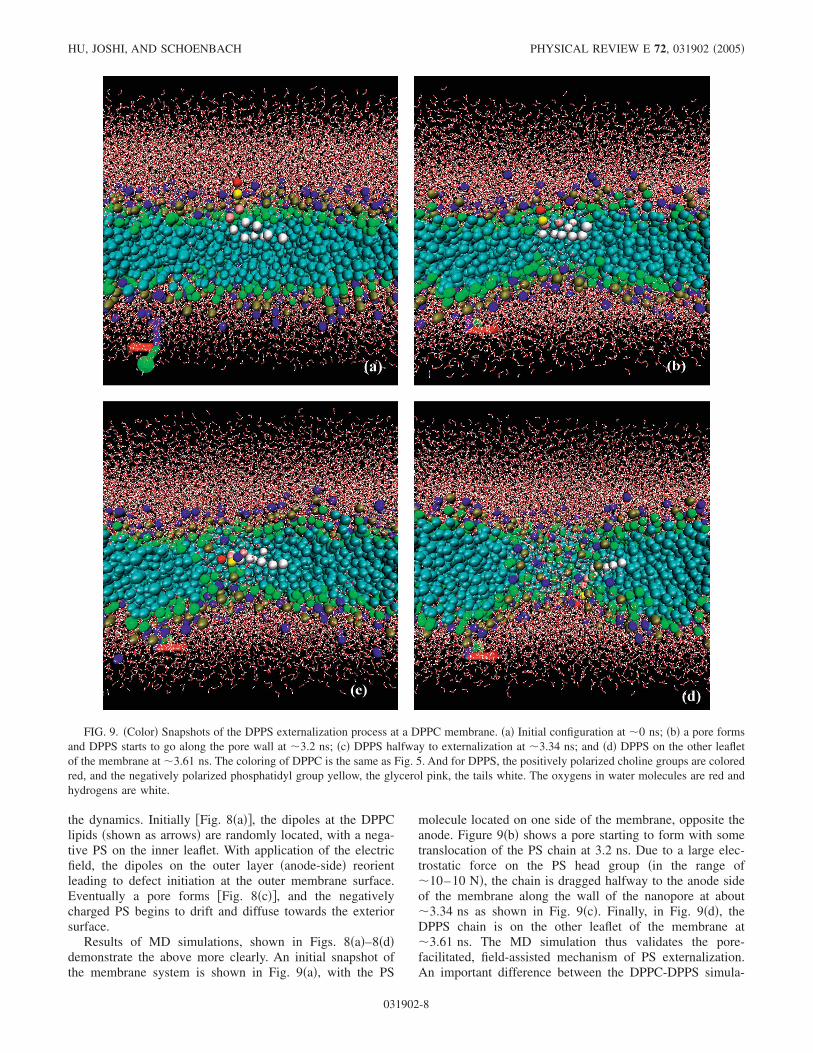
Results of MD simulations, shown in Figs. 8�a�–8�d�demonstrate the above more clearly. An initial snapshot ofthe membrane system is shown in Fig. 9�a�, with the PS
molecule located on one side of the membrane, opposite theanode. Figure 9�b� shows a pore starting to form with sometranslocation of the PS chain at 3.2 ns. Due to a large elec-trostatic force on the PS head group �in the range of�10–10 N�, the chain is dragged halfway to the anode sideof the membrane along the wall of the nanopore at about�3.34 ns as shown in Fig. 9�c�. Finally, in Fig. 9�d�, theDPPS chain is on the other leaflet of the membrane at�3.61 ns. The MD simulation thus validates the pore-facilitated, field-assisted mechanism of PS externalization.An important difference between the DPPC-DPPS simula-
FIG. 9. �Color� Snapshots of the DPPS externalization process at a DPPC membrane. �a� Initial configuration at �0 ns; �b� a pore formsand DPPS starts to go along the pore wall at �3.2 ns; �c� DPPS halfway to externalization at �3.34 ns; and �d� DPPS on the other leafletof the membrane at �3.61 ns. The coloring of DPPC is the same as Fig. 5. And for DPPS, the positively polarized choline groups are coloredred, and the negatively polarized phosphatidyl group yellow, the glycerol pink, the tails white. The oxygens in water molecules are red andhydrogens are white.
HU, JOSHI, AND SCHOENBACH PHYSICAL REVIEW E 72, 031902 �2005�
031902-8
tions of Fig. 9 and results for a pure DPPC membrane �Fig.5� is the shorter time duration for pore formation. Inclusionof a membrane defect in the form of a substitutional DPPSmolecule, and the additional membrane force associated withthe negative PS charge collectively contribute to the quickerporation.
IV. SUMMARY AND CONCLUSIONS
A combined MD simulator and the time dependentLaplace solver were used to predict the self-consistent cell-membrane response to an ultrashort and high intensity exter-nal electric field. The primary goal was to probe the electri-cally driven PS externalization process. An additionalobjective was to develop the computational capability oftreating the dynamical aspects at the molecular level, withoutresorting to an all-atom model. The realistic inclusion of atime-dependent electric field in to MD simulations was alsoachieved. The DPPC and DPPS lipid molecules were repre-sented. Essential features such as the hydrophilic and hydro-phobic nature of the lipid chain interactions were included,as were the clustering of water molecules around ions due tothe electric field gradients at the microscopic level.
Time dependent details of nanopore formation at mem-branes in response to a variable electric field were probed.Details of the variable membrane field were computed froma distributed current model applied to the entire cell. Ourresults showed that nanosized pores could typically be
formed within 5–6 ns for spatially averaged external fieldsof about 0.01 V/nm. The predictions were in very goodagreement with recent experimental data. It was shown thatdefect formation on membranes would begin on the anodeside. Finally, it was shown that PS translocation would be ananopore facilitated event, rather than the result of molecularmovement across the transmembrane energy barrier. For highelectric fields, the pore could form before the pulse extinc-tion. Under these conditions, both drift and diffusion of thePS molecules from the anode-side, inner leaflet are predictedto occur. At lower intensities or shorter pulse durations, theelectric field could still help trigger PS externalization. Insuch cases, the immediate consequence would be a structuralchange at the anodic pole. Subsequent molecular diffusivemotion aided by the hydrophobic interaction between incom-ing water and the lipid tails, could then result in a gradual PSleakout to the membrane exterior at longer times.
ACKNOWLEDGMENTS
This work was sponsored in part by the Air Force Officeof Scientific Research �No. F49620-01-1-0506� on Bio-Inspired Concepts and an AFOSR-MURI grant �No. F49620-02-1-0320� on Subcellular Responses to Narrowband andWideband Radio Frequency Radiation. The authors wouldalso like to acknowledge useful and stimulating discussionswith J. Weaver �MIT�, D. P. Tieleman �Univ. Calgary�, E.Neumann �University of Bielefeld�, and P. T. Vernier �Univ.S. California�.
�1� K. H. Schoenbach, F. E. Peterkin, R. W. Alden, and S. J.Beebe, IEEE Trans. Plasma Sci. 25, 284 �1997�.
�2� K. H. Schoenbach, S. J. Beebe, and E. S. Buescher, Bioelec-tromagnetics �N.Y.� 22, 440 �2001�.
�3� R. P. Joshi, Q. Hu, R. Aly, K. H. Schoenbach, and H. P. Hjal-marson, Phys. Rev. E 64, 011913 �2001�.
�4� H. Huelsheger, J. Potel, and E. G. Niemann, Radiat. Environ.Biophys. 20, 53 �1981�.
�5� J. C. Weaver, IEEE Trans. Plasma Sci. 28, 24 �2000�.�6� U. Zimmermann and G. A. Neil, Electromanipulation of Cell
�CRC, Boca Raton, FL, 1996�.�7� U. Zimmermann, J. Vienken, and G. Pilwat, Bioelectrochem.
Bioenerg. 7, 553 �1980�.�8� M. M. Lo, T. Y. Tsong, M. K. Conrad, S. M. Strittmatter, L. D.
Hester, and S. H. Snyder, Nature �London� 310, 792 �1984�.�9� L. H. Li, M. L. Hensen, Y. L. Zhao, and S. W. Hui, Biophysics
�Engl. Transl.� 71, 479 �1996�.�10� A. K. Banga and M. R. Prausnitz, Trends Biotechnol. 16, 408
�1998�.�11� E. Eksioglu-Demiralp, S. Kitada, D. Carson, J. Garland, A.
Andreef, and J. C. Reed, J. Immunol. Methods 275, 41 �2003�.�12� M. F. Kalady, M. W. Onaitis, K. M. Padilla, S. Emani, D. S.
Tyler, and S. K. Pruitt, Surg. Forum 52, 225 �2001�.�13� G. Mellitzer, M. Hallonet, L. Chen, and S. L. Ang, Mech. Dev.
118, 57 �2002�.�14� R. L. Harrison, B. J. Byrne, and L. Tung, FEBS Lett. 435, 1
�1998�.�15� R. Langer, Nature �London� 392, s5 �1998�.�16� L. Zhang, L. Li, G. Hoffmann, and R. Hoffman, Biochem.
Biophys. Res. Commun. 220, 633 �1996�.�17� H. Mekid and L. M. Mir, Biochim. Biophys. Acta 1524, 118
�2001�.�18� C. Ramos and J. Teissie, Biochimie 82, 511 �2000�.�19� K. H. Schoenbach, R. P. Joshi, R. H. Stark, F. C. Dobbs, and S.
J. Beebe, IEEE Trans. Dielectr. Electr. Insul. 7, 637 �2000�.�20� A. J. H. Sale and W. A. Hamilton, Biochim. Biophys. Acta
148, 781 �1967�.�21� A. J. H. Sale and W. A. Hamilton, Biochim. Biophys. Acta
163, 37 �1967�.�22� U. Broggemann, E. C. Roux, J. Hanning, and C. Nicolau,
Transfusion �Bethesda, Md.� 35, 478 �1995�.�23� M. Zeira, P. F. Tosi, Y. Mouneimne, J. Lazarte, L. Sneed, D. J.
Volsky, and C. Nicolau, Proc. Natl. Acad. Sci. U.S.A. 88,4409 �1991�.
�24� L. M. Mir, S. Orlowski, J. B. Jr, and C. Paoletti, Eur. J. Cancer27, 68 �1991�.
�25� F. Lohr, D. Y. Lo, D. A. Zaharoff, K. Hu, X. Zhang, Y. Li, Y.Zhao, M. W. Dewhirst, F. Yuan, and C. Y. Li, Cancer Res. 61,3281 �1984�.
�26� M. Ott, J. D. Robertson, V. Gogvadze, B. Zhivotovsky, and S.Orrenius, Proc. Natl. Acad. Sci. U.S.A. 99, 1259 �2002�.
�27� L. Piccotti, M. Buratta, S. Giannini, P. Gresele, R. Roberti, and
SIMULATIONS OF NANOPORE FORMATION AND… PHYSICAL REVIEW E 72, 031902 �2005�
031902-9

L. Corazzi, J. Membr. Biol. 198, 43 �2004�.�28� S. J. Beebe, P. M. Fox, L. J. Rec, K. Somers, R. H. Stark, and
K. H. Schoenbach, IEEE Trans. Plasma Sci. 30, 286 �2002�.�29� S. J. Beebe, P. M. Fox, L. J. Rec, L. K. Willis, and K. H.
Schoenbach, FASEB J. 17, 1493 �2003�.�30� R. P. Joshi, Q. Hu, K. H. Schoenbach, and S. J. Beebe, Phys.
Rev. E 69, 051901 �2004�.�31� P. T. Vernier, Y. Sun, L. Marcu, C. M. Craft, and M. A. Gun-
dersen, Biophys. J. 86, 4040 �2004�.�32� P. T. Vernier, Y. Sun, L. Marcu, C. M. Craft, and M. A. Gun-
dersen, FEBS Lett. 572, 103 �2004�.�33� J. Deng, K. H. Schoenbach, E. S. Buescher, P. S. Hair, P. M.
Fox, and S. J. Beebe, Biophys. J. 84, 2709 �2003�.�34� P. T. Vernier, Y. Sun, L. Marcu, S. Salemi, C. M. Craft, and M.
A. Gundersen, Biochem. Biophys. Res. Commun. 310, 286�2003�.
�35� S. J. Beebe, P. F. Blackmore, J. White, R. P. Joshi, and K. H.Schoenbach, Physiol. Meas 25, 1077 �2004�.
�36� V. F. Pastushenko, Y. A. Chhizmadzhev, and V. B. Arakelyan,Bioelectrochem. Bioenerg. 6, 53 �1979�.
�37� A. Barnett and J. C. Weaver, Bioelectrochem. Bioenerg. 25,163 �1991�.
�38� V. A. Parsegian, Nature �London� 221, 844 �1969�.�39� J. Marti and F. S. Csajka, Europhys. Lett. 61, 409 �2003�.�40� S. J. Marrink, E. Lindahl, O. Edholm, and A. E. Mark, J. Am.
Chem. Soc. 123, 8638 �2004�.�41� S. J. Marrink, A. H. de Vries, and A. E. Mark, J. Phys. Chem.
108, 750 �2004�.�42� V. Knecht, M. Muller, M. Bonn, S. J. Marrink, and A. Mark, J.
Chem. Phys. 122, 024704 �2005�.�43� D. P. Tieleman, H. Leontiadou, A. E. Mark, and S. J. Marrink,
Comput. Phys. Commun. 125, 6382 �2003�.�44� Q. Hu, S. Viswanadham, R. P. Joshi, K. H. Schoenbach, S. J.
Beebe, and P. F. Blackmore, Phys. Rev. E 71, 031914 �2005�.�45� B. Verhoven, R. A. Schlegel, and P. Williamson, J. Exp. Med.
182, 1597 �1995�.�46� M. Seigneuret and P. F. Devaux, Proc. Natl. Acad. Sci. U.S.A.
81, 3751 �1984�.�47� F. Basse, J. G. Stout, P. J. Sims, and T. Wiedmer, J. Biol.
Chem. 271, 17205 �1996�.�48� P. Comfurius, P. Williamson, E. F. Smeets, R. A. Schlegel, E.
M. Bevers, and R. F. Zwaal, Biochemistry 35, 7631 �1996�.�49� K. Balasubramaniun and A. J. Schroit, Annu. Rev. Physiol.
65, 701 �2003�.�50� I. R. Miller, Bioelectrochemistry 57, 138 �2002�.�51� D. Popescu and G. Victor, Bioelectrochem. Bioenerg. 25, 105
�1983�.�52� J. Jiang, B. F. Serinkan, Y. Y. Tyurina, G. G. Borisenko, Z. Mi,
P. D. Robbins, A. J. Schroit, and V. E. Kagan, Free Radic Biol.Med. 35, 814 �2003�.
�53� R. P. Joshi, Q. Hu, K. H. Schoenbach, and H. P. Hjalmarson,Phys. Rev. E 65, 041920 �2002�.
�54� R. P. Joshi, Q. Hu, and K. H. Schoenbach, IEEE Trans. PlasmaSci. 32, 1677 �2004�.
�55� C. Grosse and H. P. Schwan, Biophys. J. 63, 1632 �1992�.�56� R. M. Venable, Y. Zhang, B. J. Hardy, and R. W. Pastor, Sci-
ence 262, 223 �1993�.�57� E. Egberts, S. Marrink, and H. J. C. Berendsen, Eur. Biophys.
J. 22, 423 �1993�.�58� H. E. Alper, D. Bassolino, and T. R. Stouch, J. Chem. Phys.
98, 9798 �1993�.�59� H. Heller, M. Schaefer, and K. Schulten, J. Phys. Chem. 97,
8343 �1993�.�60� J. J. L. Cascales, J. G. de la Torre, S. J. Marrink, and H. J. C.
Berendsen, J. Chem. Phys. 104, 2713 �1996�.�61� D. P. Tieleman and H. J. C. Berendsen, J. Chem. Phys. 105,
4871 �1996�.�62� M. P. Allen and D. J. Tildesley, Computer Simulations of Liq-
uids �Clarendon Press, Oxford, 1987�.�63� E. Egberts and H. J. C. Berendsen, J. Chem. Phys. 89, 3718
�1988�.�64� W. F. van Gunsteren and H. J. C. Berendsen, Angew. Chem.,
Int. Ed. Engl. 29, 992 �1990�.�65� H. J. C. Berendsen, J. P. M. Postma, W. F. Gunsteren, and J.
Hermans, Intermolecular Forces, edited by B. Pullman �Re-idel, Dordrecht, 1981�.
�66� H. J. C. Berendsen, J. P. M. Straatsma, W. F. van Gunsteren, A.DiNola, and J. R. Haak, J. Phys. Chem. 81, 3684 �1984�.
�67� D. van der Spoel, A. R. van Buuren, E. Apol, P. J. Meulenhoff,D. P. Tieleman, A. L. Sijbers, R. van Drunen, and H. J. C.Berendsen, Gromacs User Manual Version 1.2, 1996.
�68� H. J. C. Berendsen, D. van der Spoel, and R. van Drumen,Comput. Phys. Commun. 91, 43 �1995�.
�69� E. Lindahl, B. Hess, and D. van der Spoel, J. Mol. Model. 7,306 �2001�.
�70� D. Tieleman, S. J. Marrink, and H. J. C. Berendsen, Biochim.Biophys. Acta 1331, 235 �1997�.
�71� W. F. van Gunsteren and H. J. C. Berendsen, Mol. Phys. 34,1131 �1977�.
�72� J. P. Ryckaert, G. Ciccotti, and H. J. C. Berendsen, J. Comput.Phys. 25, 327 �1977�.
�73� C. F. Lopez, P. B. Moore, J. C. Shelley, M. Y. Shelley, and M.L. Klein, Comput. Phys. Commun. 147, 1 �2002�.
�74� M. Muller, K. Katsov, and M. Schick, J. Polym. Sci., Part B:Polym. Phys. 41, 1441 �2003�.
�75� B. Smit, P. A. Hilbers, K. Esselink, L. A. M. Rupert, N. M. V.Os, and A. G. Schlijper, Nature �London� 348, 624 �1990�.
�76� W. Meier, A. Graff, A. Diederich, and M. Winterhalter, Phys.Chem. Chem. Phys. 2, 4559 �2000�.
�77� J. Kolb �private communication�.�78� W. Frey, J. A. White, R. O. Price, P. F. Blackmore, R. P. Joshi,
S. J. Beebe, R. Nuccitelli, K. H. Schoenbach, and J. F. Kolb�unpublished�.
HU, JOSHI, AND SCHOENBACH PHYSICAL REVIEW E 72, 031902 �2005�
031902-10