Embed Size (px)
Citation preview
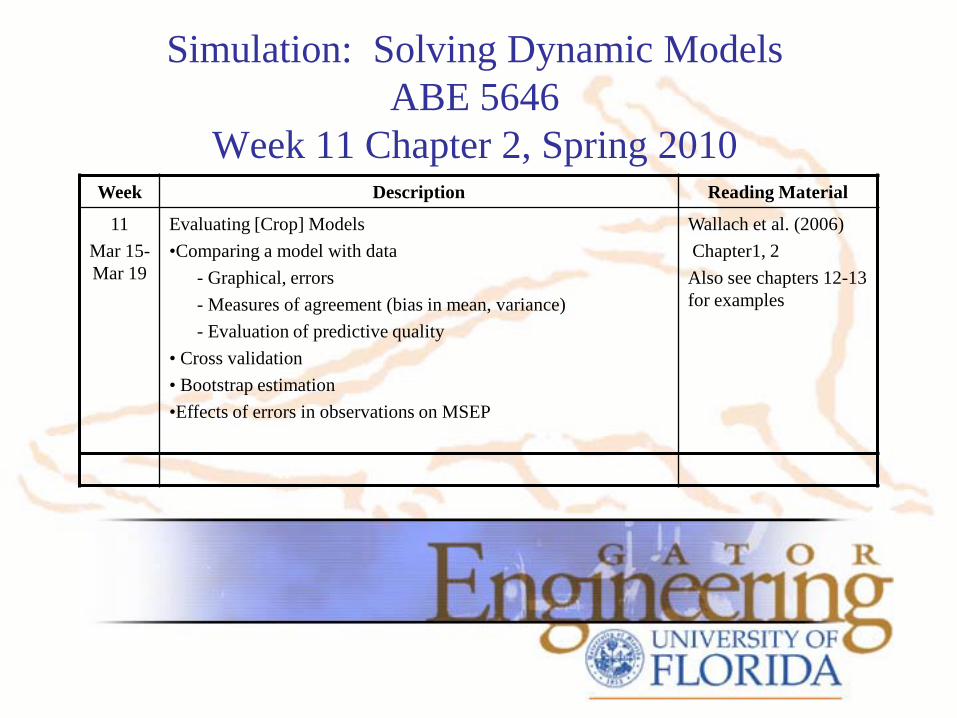
Simulation: Solving Dynamic ModelsABE 5646
Week 11 Chapter 2, Spring 2010Week Description Reading Material
11 Mar 15-Mar 19
Evaluating [Crop] Models•Comparing a model with data
- Graphical, errors- Measures of agreement (bias in mean, variance)- Evaluation of predictive quality
• Cross validation• Bootstrap estimation•Effects of errors in observations on MSEP
Wallach et al. (2006)Chapter1, 2Also see chapters 12-13 for examples
Weeks 11-Ch 2 Objectives
1) Learn basic methods for evaluating dynamic biophysical models
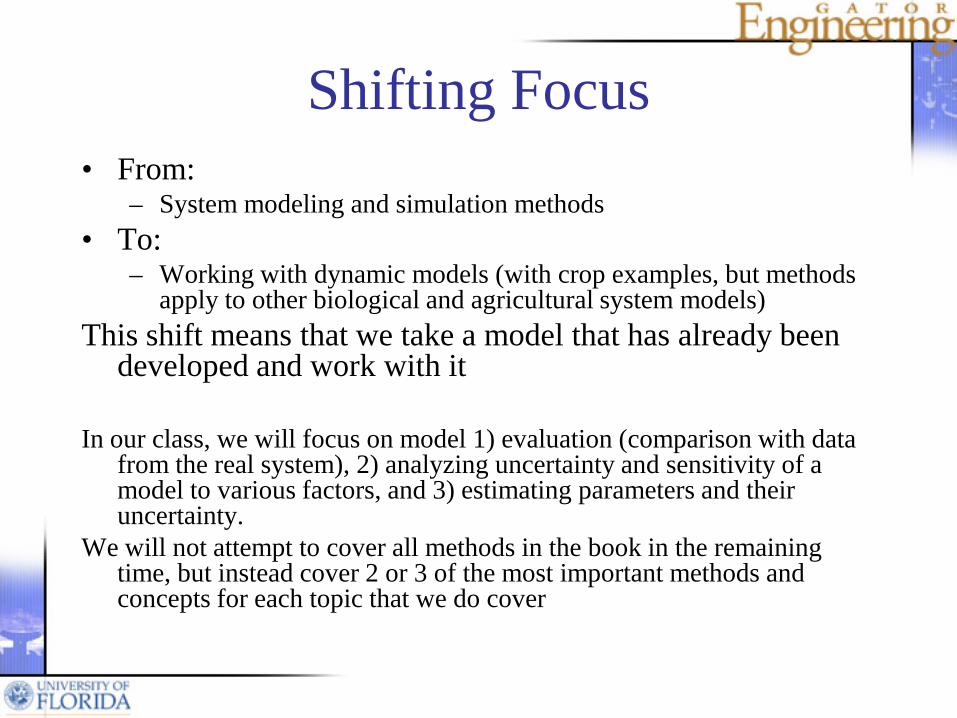
Shifting Focus• From:
– System modeling and simulation methods• To:
– Working with dynamic models (with crop examples, but methods apply to other biological and agricultural system models)
This shift means that we take a model that has already been developed and work with it
In our class, we will focus on model 1) evaluation (comparison with data from the real system), 2) analyzing uncertainty and sensitivity of a model to various factors, and 3) estimating parameters and their uncertainty.
We will not attempt to cover all methods in the book in the remaining time, but instead cover 2 or 3 of the most important methods and concepts for each topic that we do cover
Evaluating Dynamic Models
• Evaluation vs. validation• Importance• Some steps
– Objective of model, criteria for evaluation– Model equations, implementation accuracy– Sensitivity analysis, parameter estimation– Comparison with data
• Methods
Evaluating Model Agreement with Measurements
• Test whether model is a good representation of the real system
• In many cases, measurements are used to estimate parameters, similar to fitting a model to particular experimental results
• The main issue here is whether measurements used in an evaluation are independent
• When the predictive quality of a model is to be evaluated, comparisons must be with data not used to develop or parameterize the model. This will be considered after examining measures for comparisons
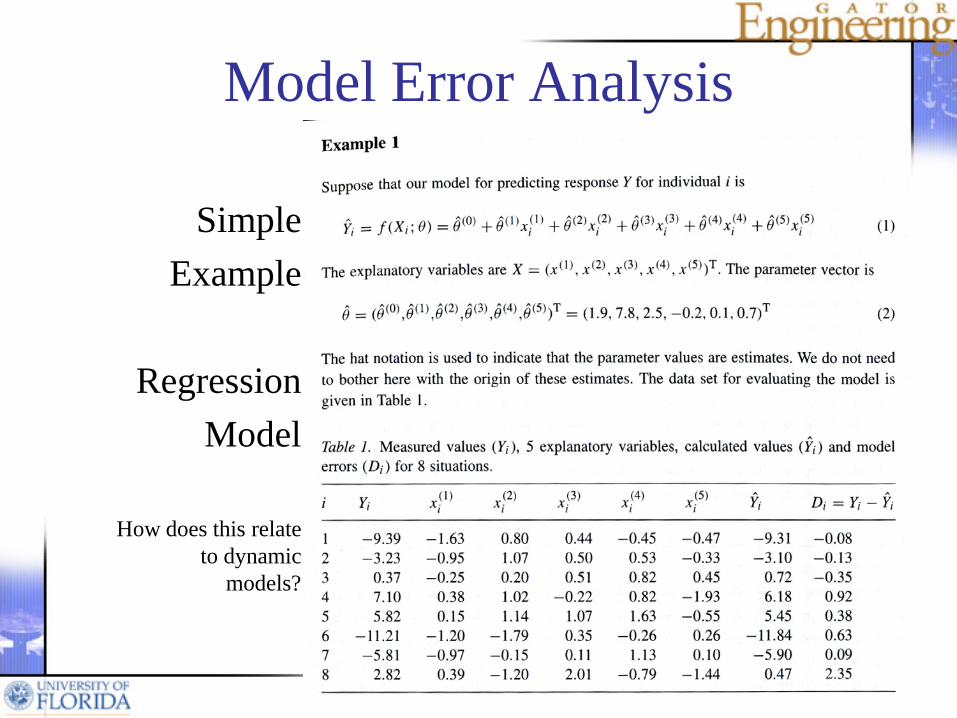
Model Error Analysis
Simple Example
RegressionModel
How does this relate to dynamic
models?
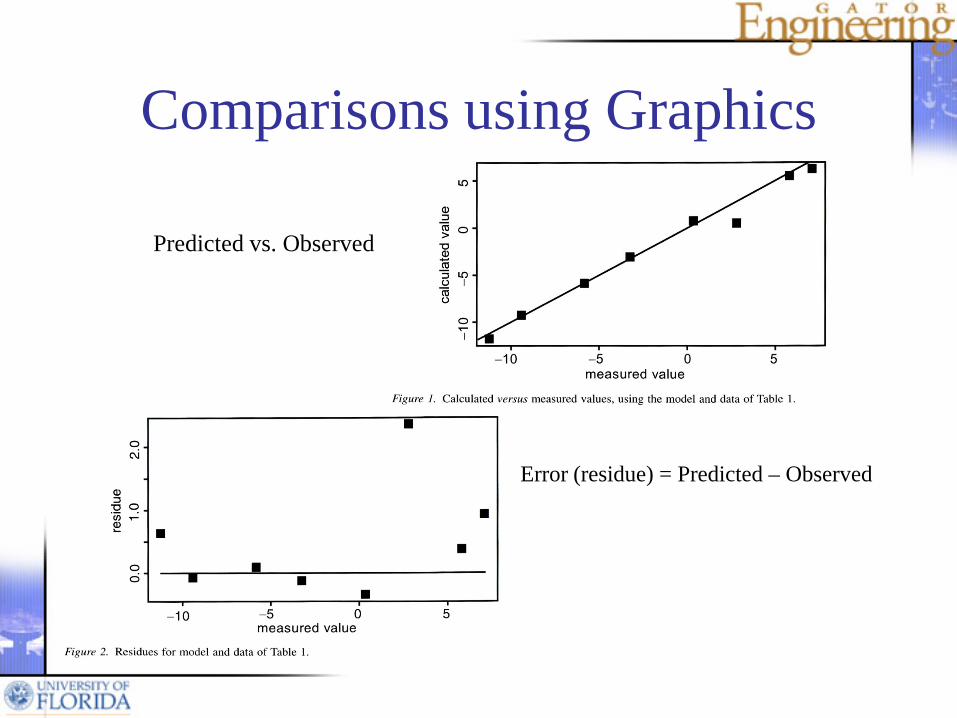
Comparisons using Graphics
Predicted vs. Observed
Error (residue) = Predicted – Observed
0
2000
4000
6000
8000
Dry W
eight
(kg/ha
)
175 200 225 250 275 300 Day of Year
Total Crop - IRRIGATED Grain - IRRIGATED
Total Crop - NOT IRRIGATED Grain - NOT IRRIGATED
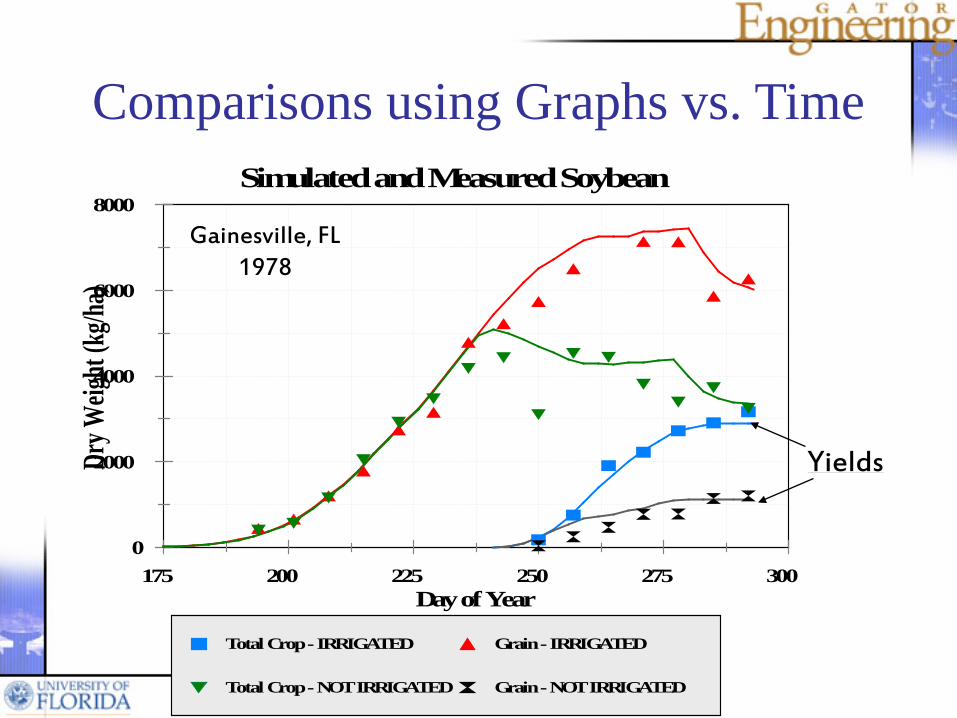
Simulated and Measured Soybean
Gainesville, FL1978
Yields
Comparisons using Graphs vs. Time
0
24
6
8
1012
14
16
0 2 4 6 8 10 12 14 16
Observed yield (t/ha)
Pre
dict
ed y
ield
(t/h
a)
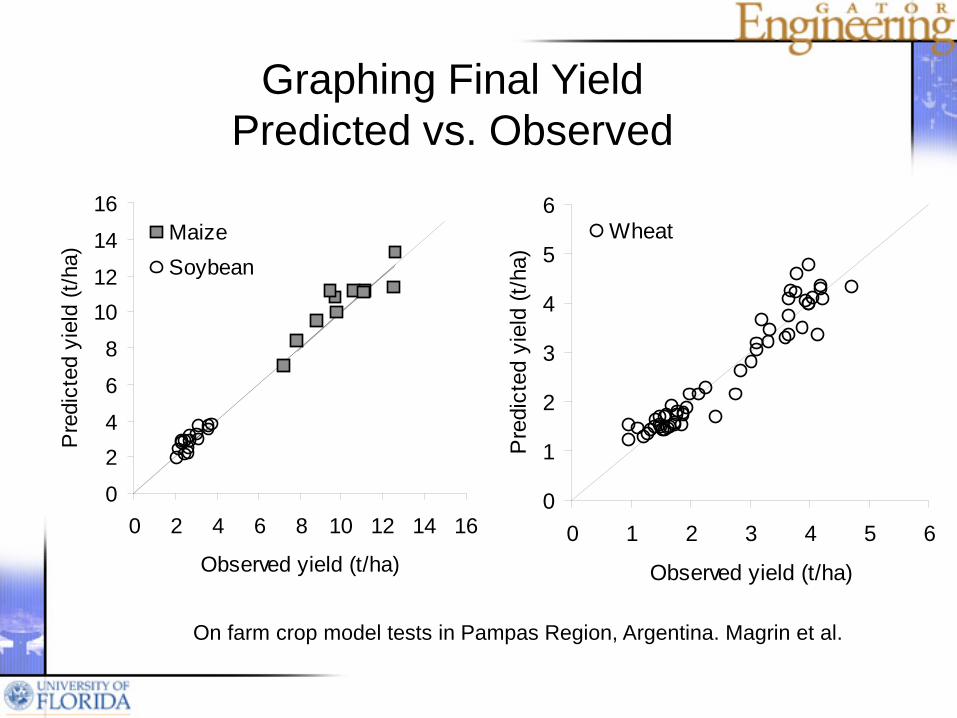
MaizeSoybean
0
1
2
3
4
5
6
0 1 2 3 4 5 6
Observed yield (t/ha)
Pre
dict
ed y
ield
(t/h
a)
Wheat
Graphing Final YieldPredicted vs. Observed
On farm crop model tests in Pampas Region, Argentina. Magrin et al.
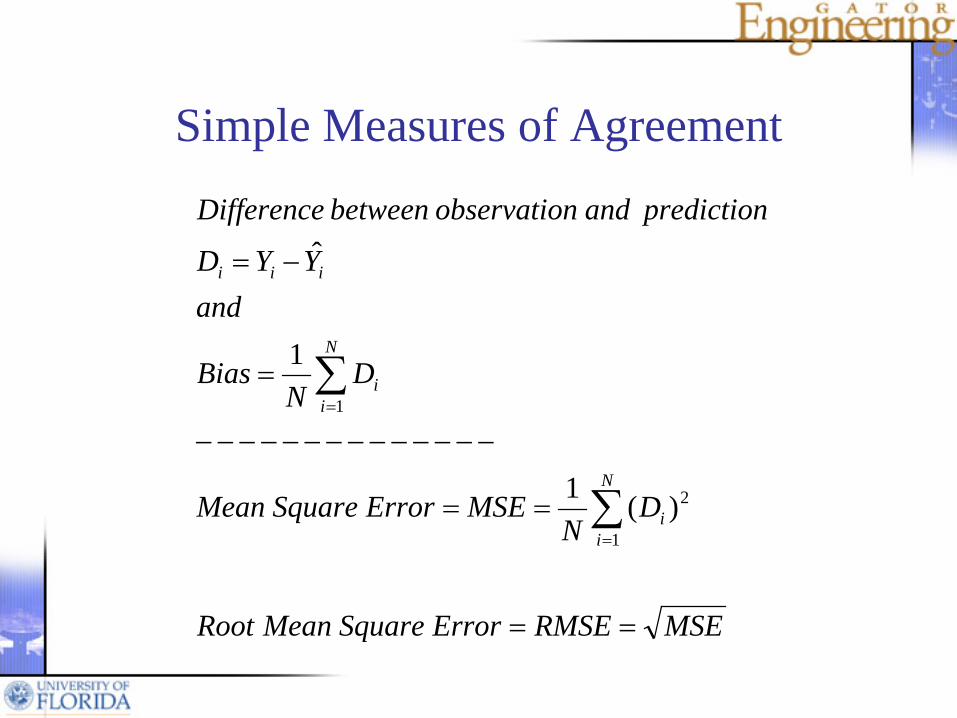
Simple Measures of Agreement
MSERMSEErrorSquareMeanRoot
DN
MSEErrorSquareMean
DN
Bias
andYYD
predictionandnobservatiobetweenDifference
N
ii
N
ii
iii
==
==
−−−−−−−−−−−−−−
=
−=
∑
∑
=
=
1
2
1
)(1
1
ˆ
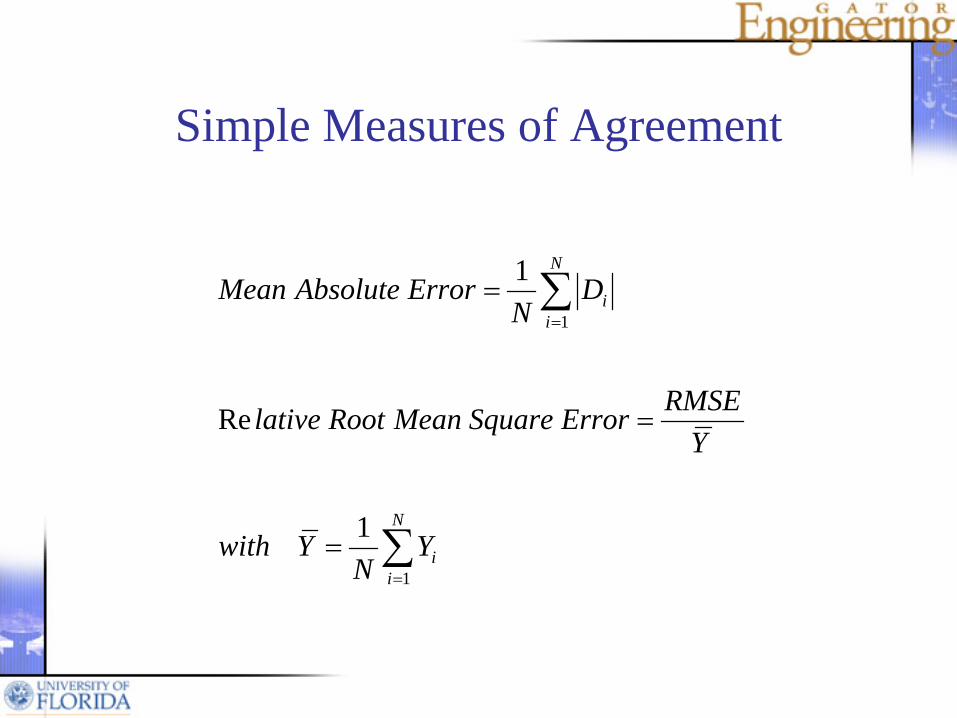
Simple Measures of Agreement
∑
∑
=
=
=
=
=
N
ii
N
ii
YN
Ywith
YRMSEErrorSquareMeanRootlative
DN
ErrorAbsoluteMean
1
1
1
Re
1
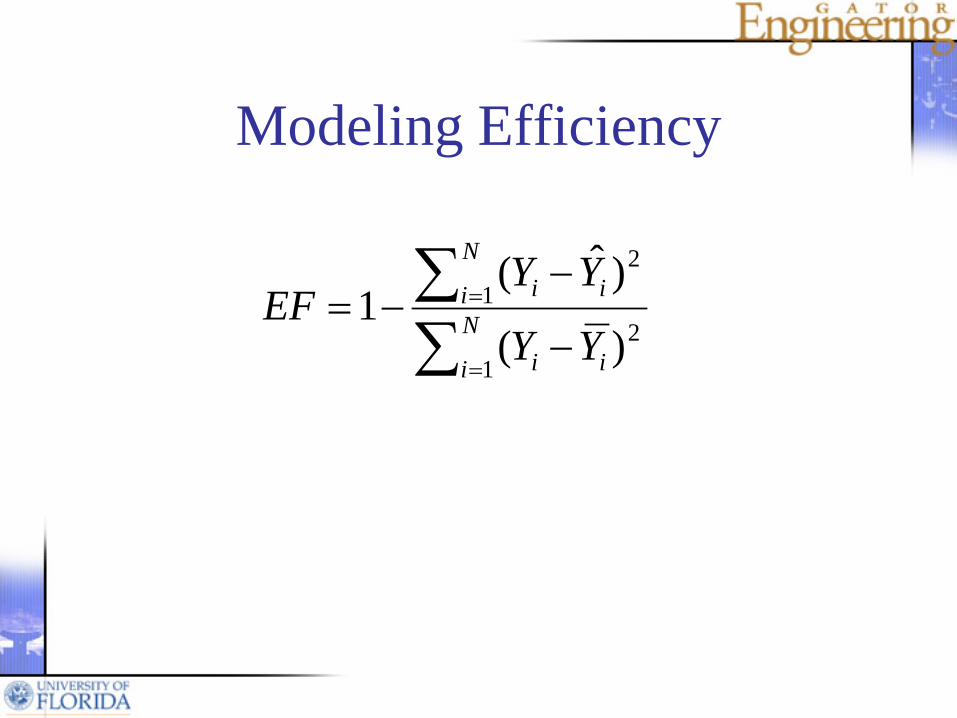
Modeling Efficiency
∑∑
=
=
−
−−= N
i ii
N
i ii
YY
YYEF
12
12
)(
)ˆ(1
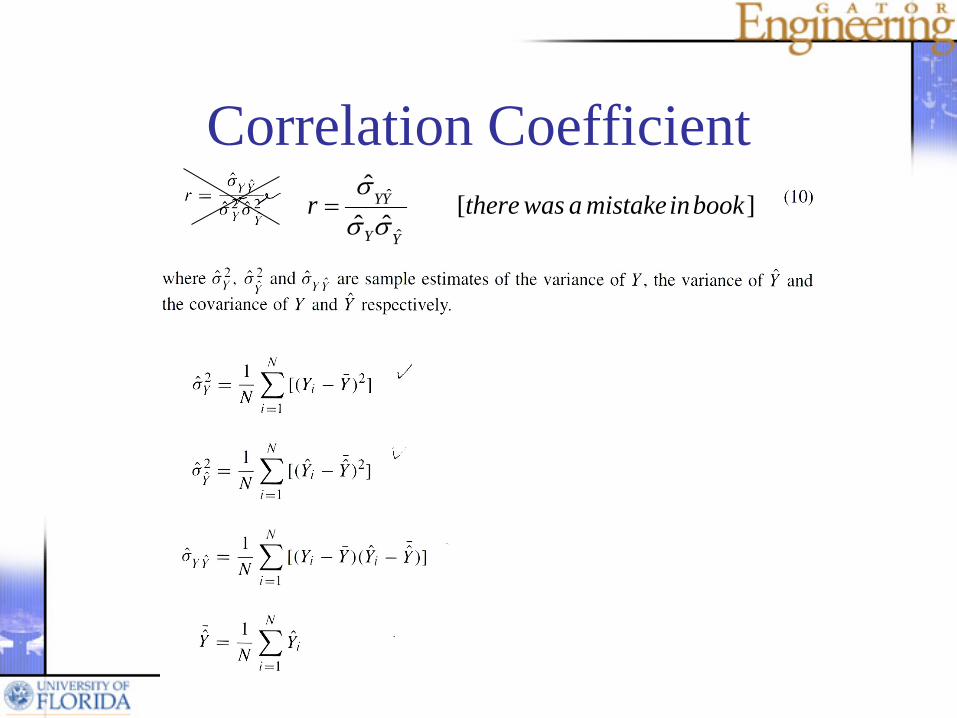
Correlation Coefficient][
ˆˆˆ
ˆ
ˆ bookinmistakeawasthererYY
YY
σσσ
=
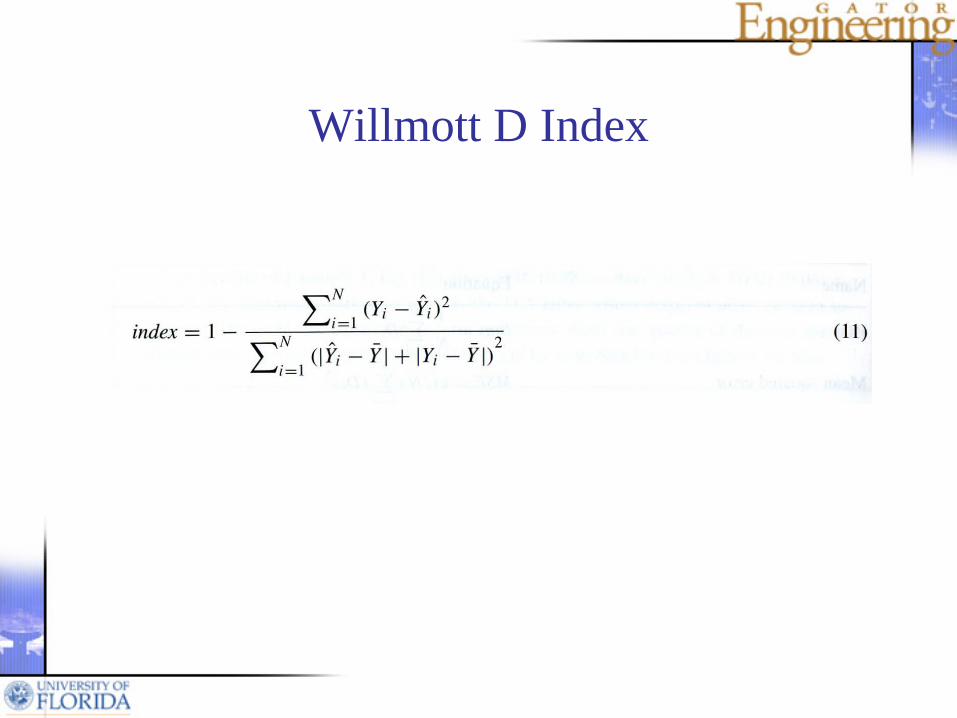
Willmott D Index
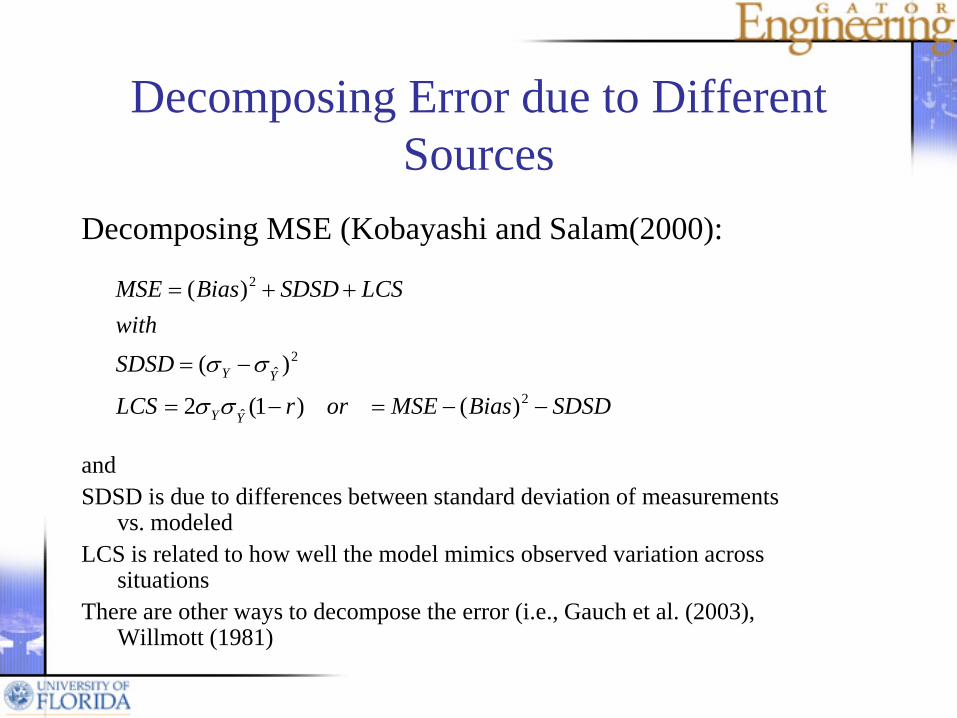
Decomposing Error due to Different Sources
Decomposing MSE (Kobayashi and Salam(2000):
andSDSD is due to differences between standard deviation of measurements
vs. modeledLCS is related to how well the model mimics observed variation across
situationsThere are other ways to decompose the error (i.e., Gauch et al. (2003),
Willmott (1981)
SDSDBiasMSEorrLCS
SDSDwith
LCSSDSDBiasMSE
YY
YY
−−=−=
−=
++=
2ˆ
2ˆ
2
)()1(2
)(
)(
σσ
σσ
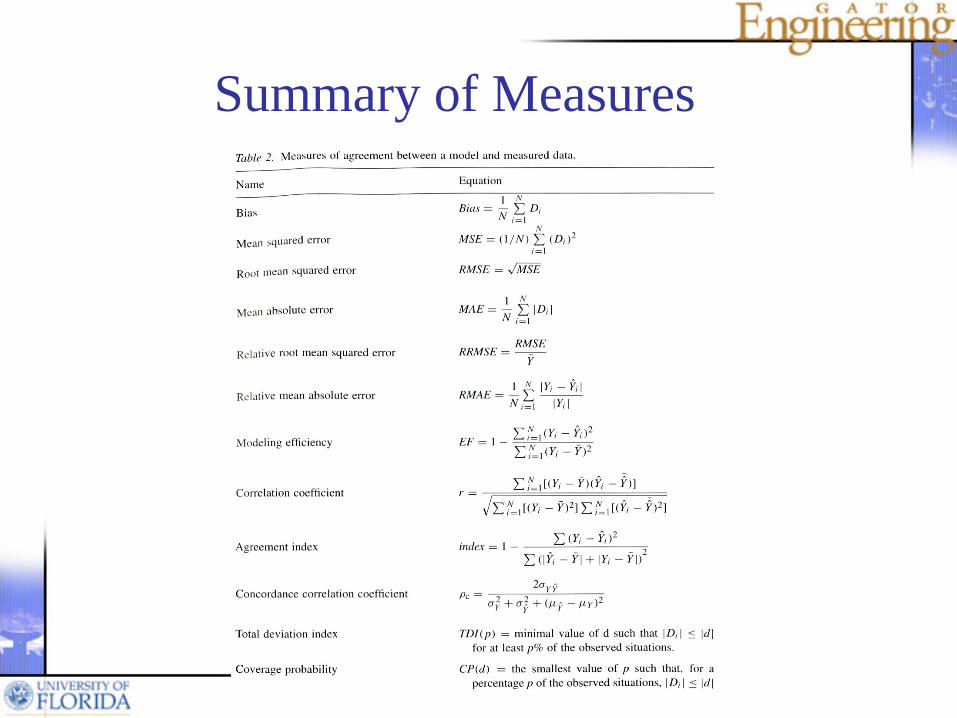
Summary of Measures
Evaluating the Predictive Quality of a Model
• When parameters are fixed, a model can be used to predict independent observations
• MSEP is the Mean Square Error of Prediction• MSEP is not equal to MSE
– MSE may include data that were used to develop a model or to estimate its parameters
– Data used to compute MSE may not represent the full range of interest for the model purposes
– MSE may be a poor estimator of MSEP
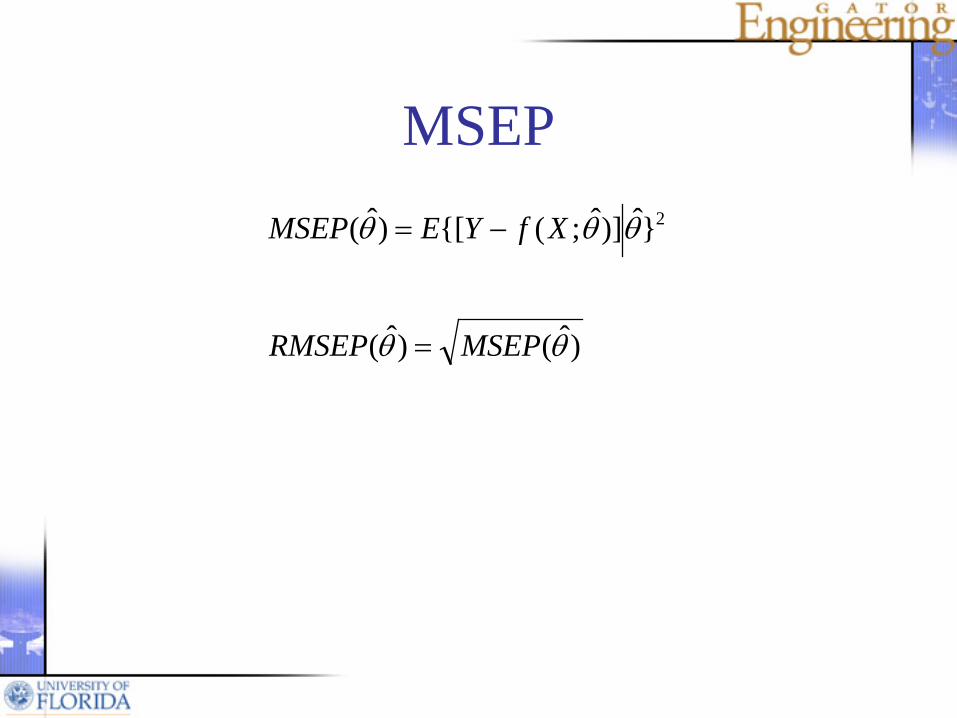
MSEP
)ˆ()ˆ(
}ˆ)]ˆ;({[)ˆ( 2
θθ
θθθ
MSEPRMSEP
XfYEMSEP
=
−=
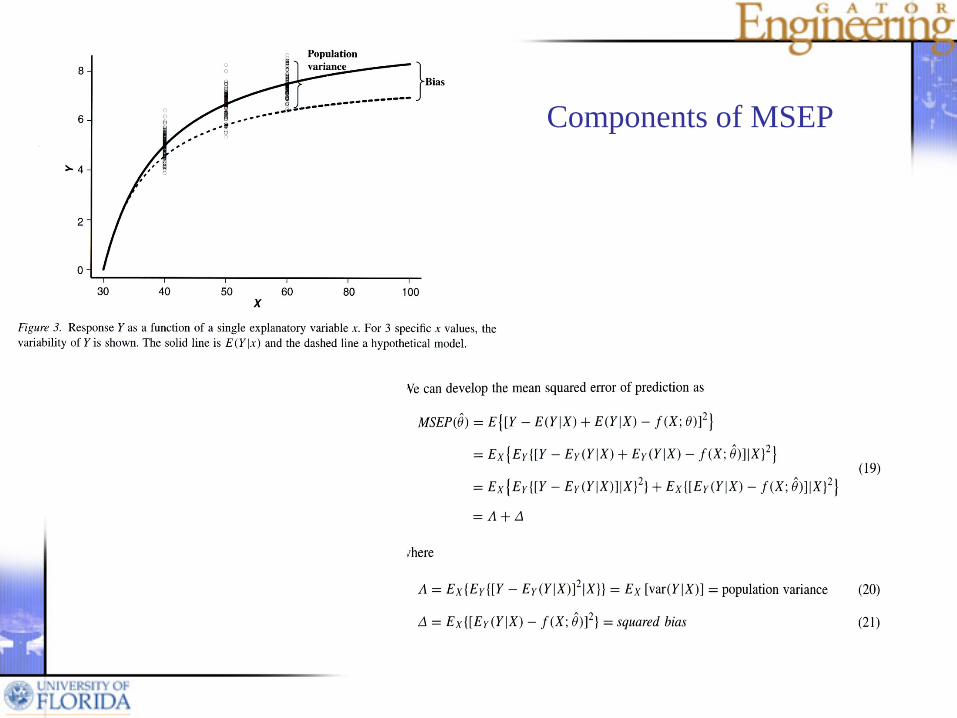
Components of MSEP
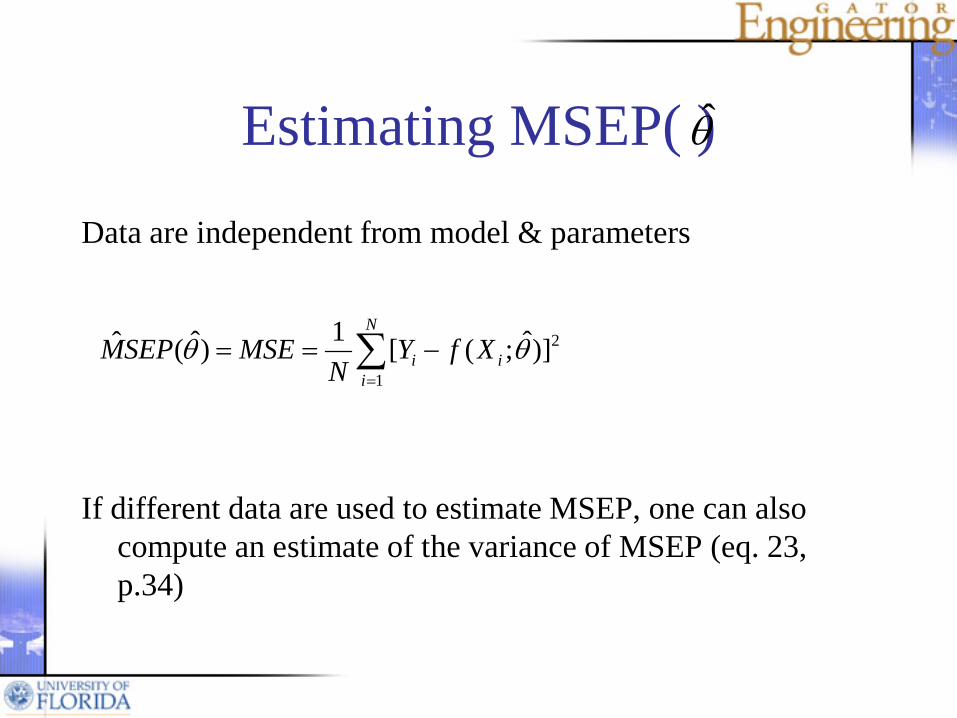
Estimating MSEP( )
Data are independent from model & parameters
If different data are used to estimate MSEP, one can also compute an estimate of the variance of MSEP (eq. 23, p.34)
∑=
−==N
iii XfY
NMSESEPM
1
2)]ˆ;([1)ˆ(ˆ θθ
θ̂
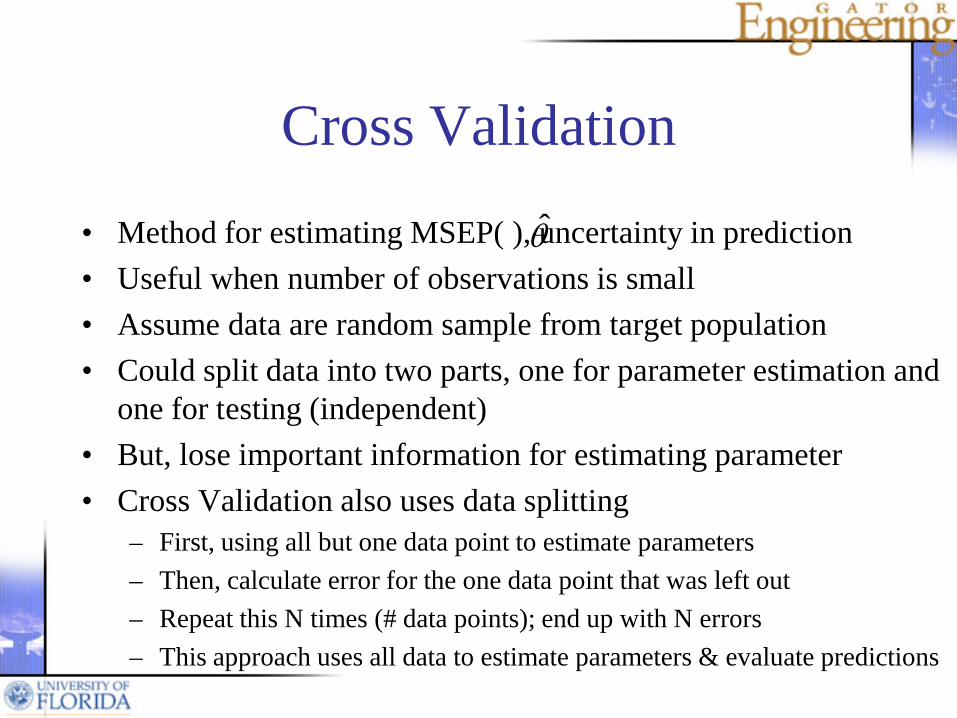
Cross Validation
• Method for estimating MSEP( ), uncertainty in prediction• Useful when number of observations is small• Assume data are random sample from target population• Could split data into two parts, one for parameter estimation and
one for testing (independent)• But, lose important information for estimating parameter• Cross Validation also uses data splitting
– First, using all but one data point to estimate parameters– Then, calculate error for the one data point that was left out– Repeat this N times (# data points); end up with N errors– This approach uses all data to estimate parameters & evaluate predictions
θ̂
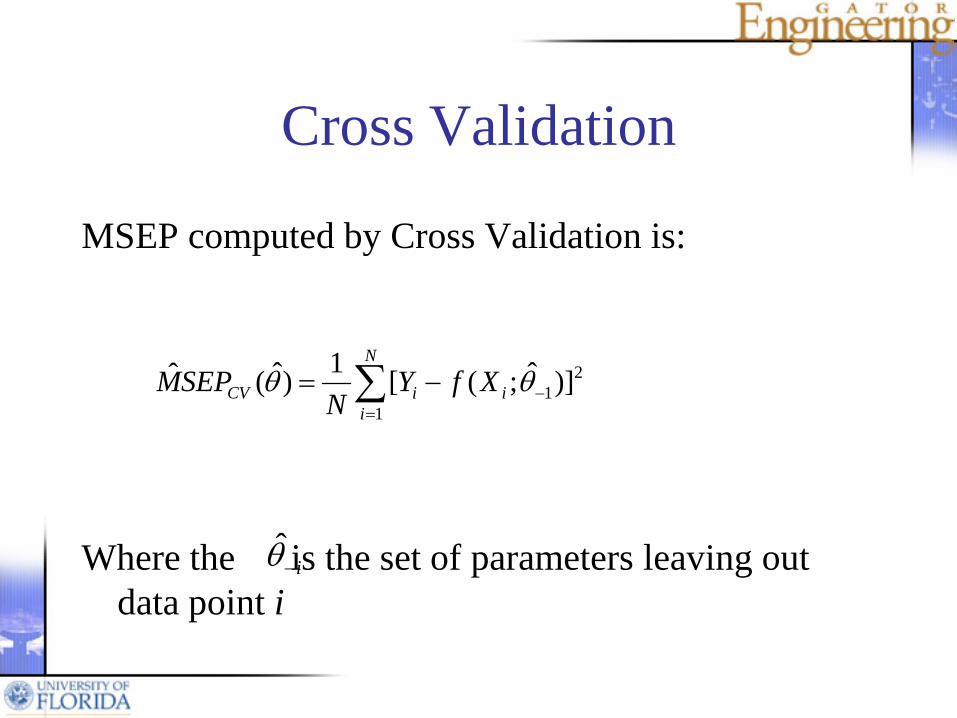
Cross Validation
MSEP computed by Cross Validation is:
Where the is the set of parameters leaving out data point i
∑=
−−=N
iiiCV XfY
NSEPM
1
21)]ˆ;([1)ˆ(ˆ θθ
i−θ̂
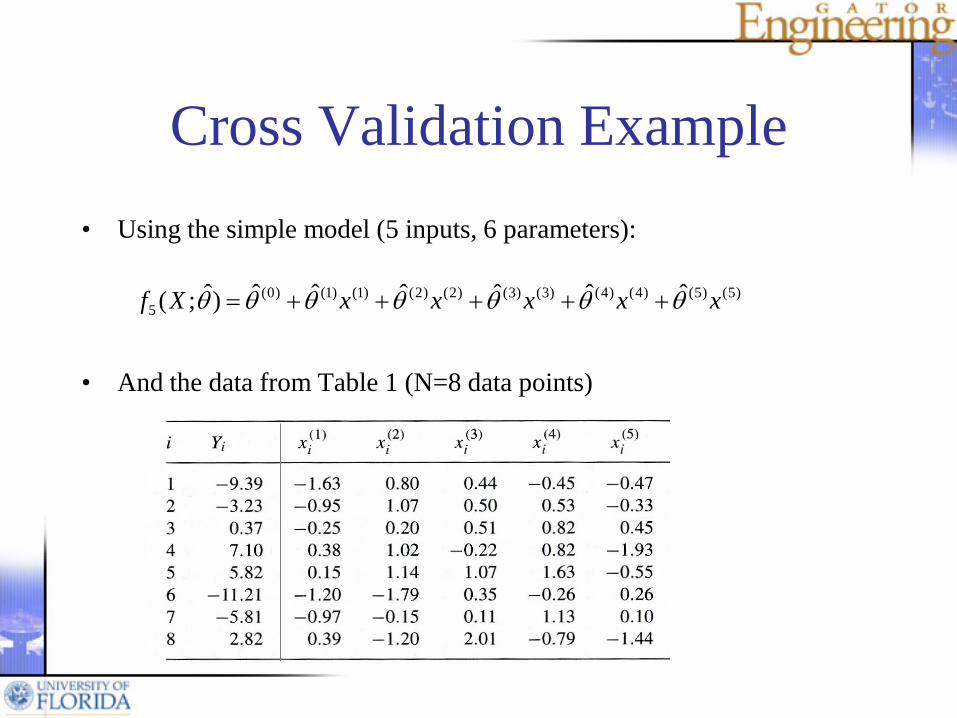
Cross Validation Example• Using the simple model (5 inputs, 6 parameters):
• And the data from Table 1 (N=8 data points)
)5()5()4()4()3()3()2()2()1()1()0(5
ˆˆˆˆˆˆ)ˆ;( xxxxxXf θθθθθθθ +++++=
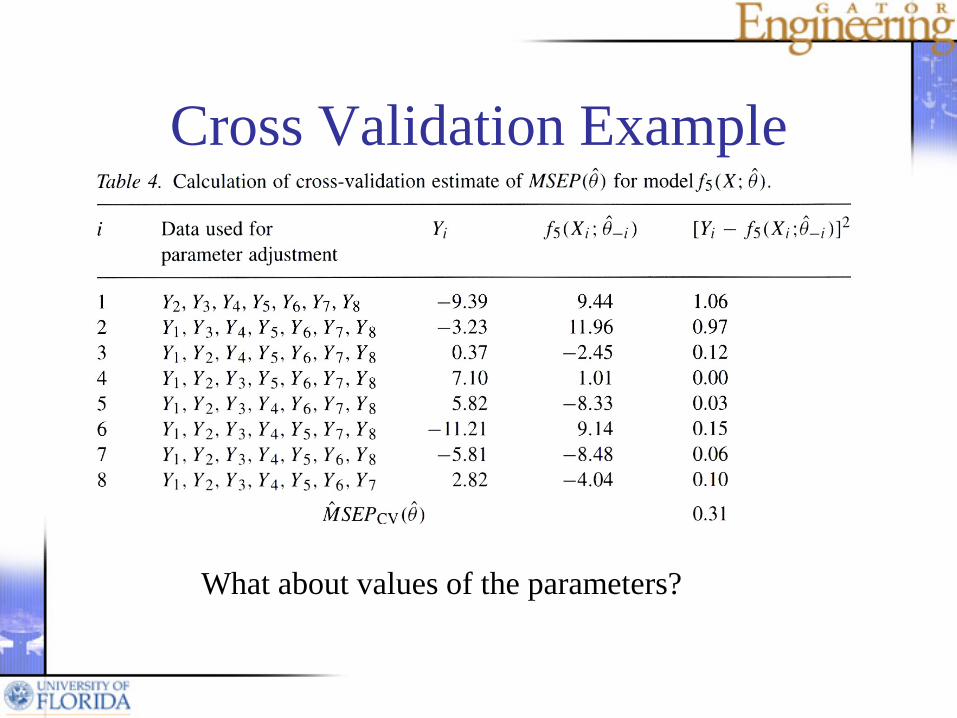
Cross Validation Example
What about values of the parameters?
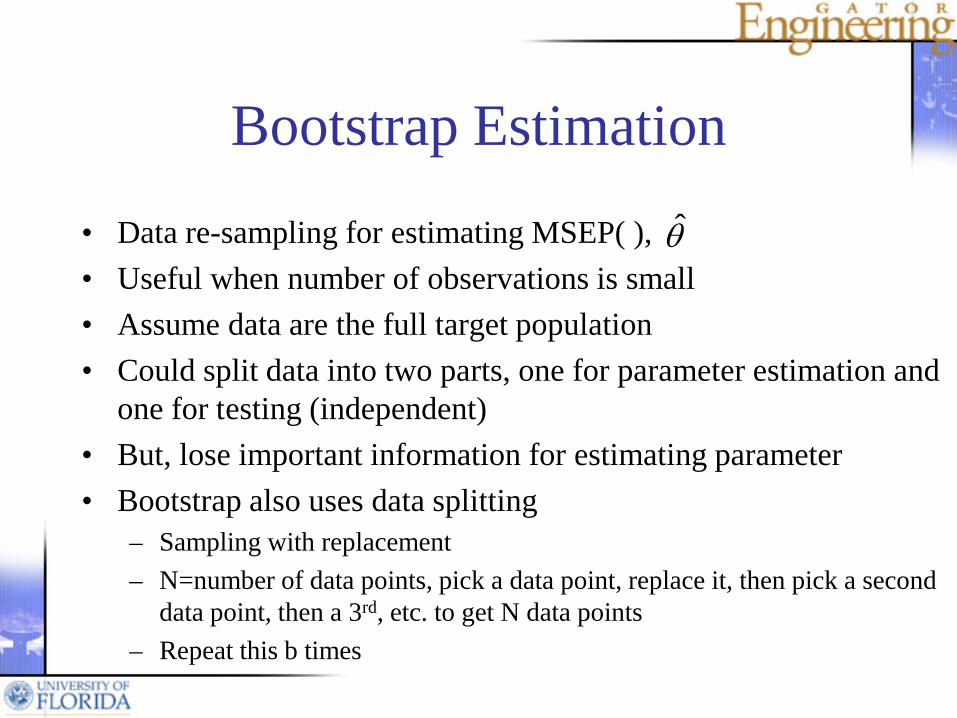
Bootstrap Estimation
• Data re-sampling for estimating MSEP( ), • Useful when number of observations is small• Assume data are the full target population• Could split data into two parts, one for parameter estimation and
one for testing (independent)• But, lose important information for estimating parameter• Bootstrap also uses data splitting
– Sampling with replacement – N=number of data points, pick a data point, replace it, then pick a second
data point, then a 3rd, etc. to get N data points– Repeat this b times
θ̂
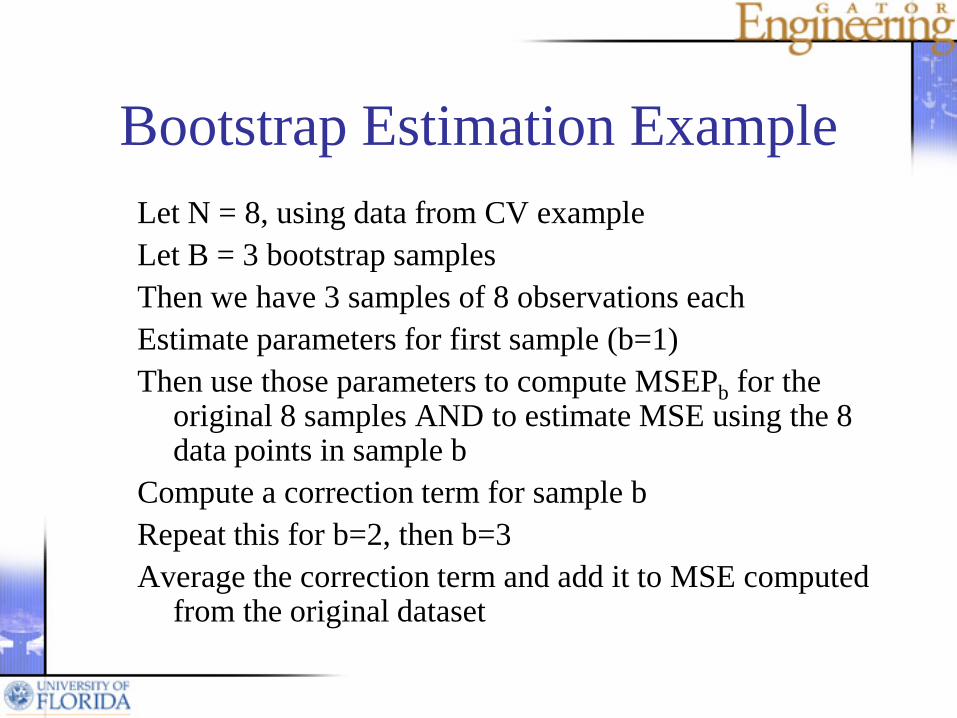
Bootstrap Estimation ExampleLet N = 8, using data from CV exampleLet B = 3 bootstrap samplesThen we have 3 samples of 8 observations eachEstimate parameters for first sample (b=1)Then use those parameters to compute MSEPb for the
original 8 samples AND to estimate MSE using the 8 data points in sample b
Compute a correction term for sample bRepeat this for b=2, then b=3Average the correction term and add it to MSE computed
from the original dataset
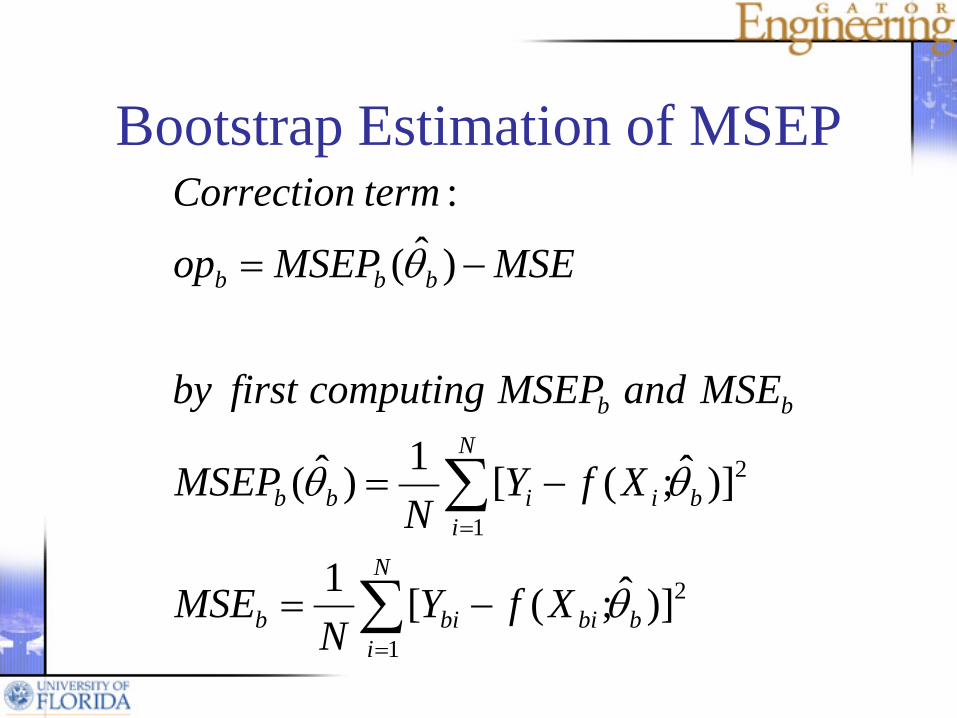
Bootstrap Estimation of MSEP
2
1
2
1
)]ˆ;([1
)]ˆ;([1)ˆ(
)ˆ(
:
b
N
ibibib
b
N
iiibb
bb
bbb
XfYN
MSE
XfYN
MSEP
MSEandMSEPcomputingfirstby
MSEMSEPop
termCorrection
θ
θθ
θ
∑
∑
=
=
−=
−=
−=
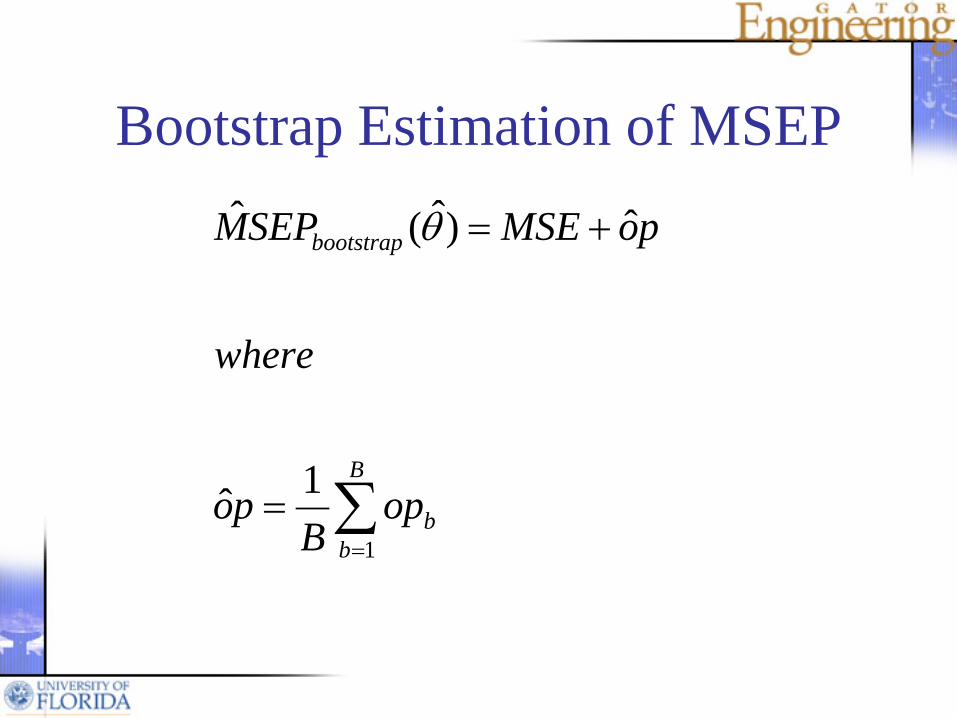
Bootstrap Estimation of MSEP
∑=
=
+=
B
bb
bootstrap
opB
po
where
poMSESEPM
1
1ˆ
ˆ)ˆ(ˆ θ
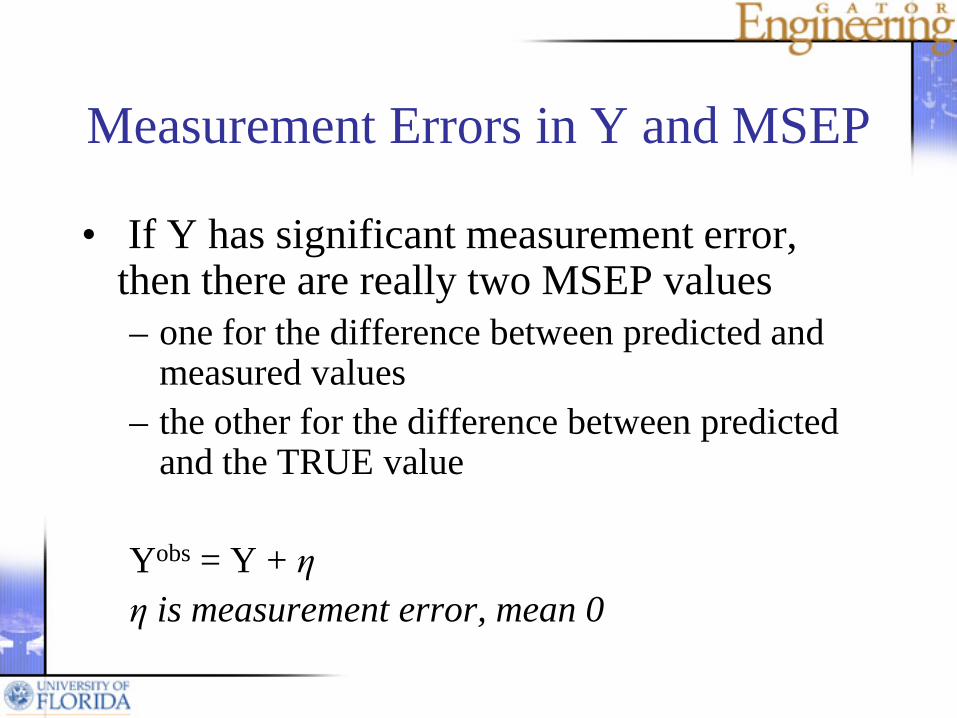
Measurement Errors in Y and MSEP
• If Y has significant measurement error, then there are really two MSEP values– one for the difference between predicted and
measured values– the other for the difference between predicted
and the TRUE value
Yobs = Y + ηη is measurement error, mean 0
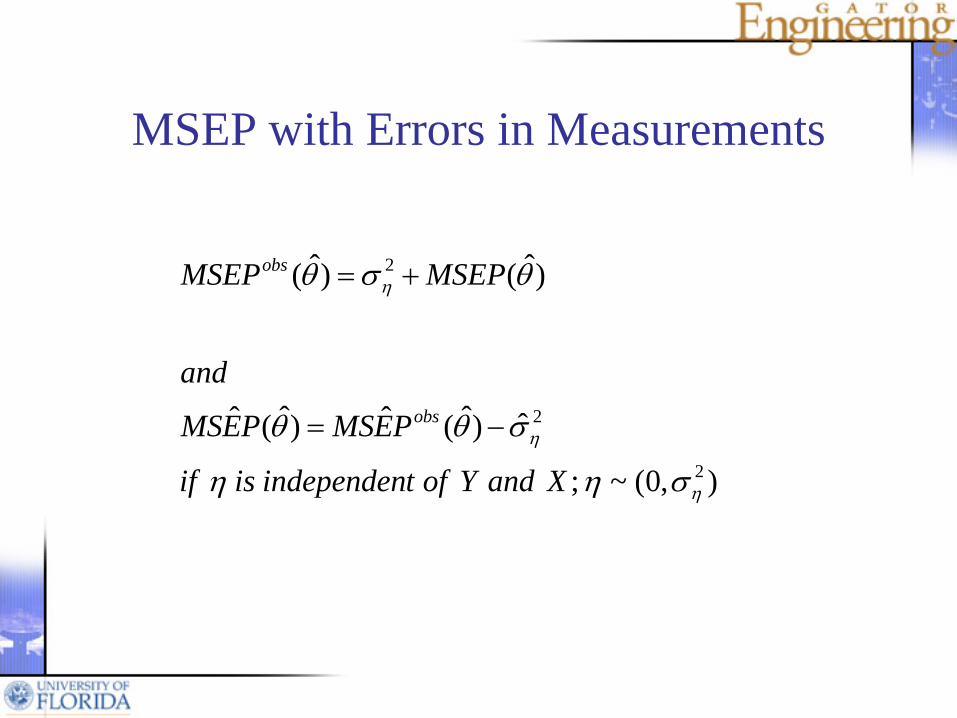
MSEP with Errors in Measurements
),0(~;
ˆ)ˆ(ˆ)ˆ(ˆ
)ˆ()ˆ(
2
2
2
η
η
η
σηη
σθθ
θσθ
XandYoftindependenisif
PEMSPEMS
and
MSEPMSEP
obs
obs
−=
+=
Discussion• Random sampling for stochastic models• Comparing a model with data
- Graphical, errors- Measures of agreement (bias in mean, variance)- Evaluation of predictive quality
• Cross validation• Bootstrap • Errors in measurements

Homework Chapter 2
• Chapter 2 in Wallach et al.– Problem 1– Problem 4
• Due on March 25