Embed Size (px)
Citation preview
JME Journal of Mining & Environment, Vol.9, No.1, 2018, 53-60.
DOI: 10.22044/jme.2017.5707.1384
Simulation of tunnel boring machine utilization: A case study
S. Moosazadeh
1, H. Aghababaie
1*, S.H. Hoseinie
2 and B. Ghodrati
3
1. Faculty of Mining Engineering, Sahand University of Technology, Tabriz, Iran
2. Department of Mining Engineering, Isfahan University of Technology, Isfahan, Iran 3. Division of Operation & Maintenance Engineering, Luleå University of Technology, Lulea, Sweden
Received 10 May 2017; received in revised form 26 September 2017; accepted 3 December 2017
*Corresponding author: [email protected] (H. Aghababaie).
Abstract
Utilization is one of the main managerial factors that is applied for construction process analysis well. It
directly affects the project duration and construction costs. Therefore, a utilization study in tunneling projects
is essential. In this work, the utilization of an earth pressure balance Tunnel Boring Machine (TBM) in
Tabriz urban railway project was studied using the Monte Carlo simulation approach. For this purpose, the
unit operation during one working shift such as boring time, ring building time, and locomotive travel time
was recorded and saved in data base. In addition, the general down times such as TBM and back-up system
maintenance, surface and tunnel logistic maintenance, cutting tools’ replacement, and locomotive delay
times were recorded and considered in simulation. The results of this work show that the mean simulated
project duration time of case study TBM is approximately 859 shifts and close to the real data with a
difference of 0.92%. Finally, the average estimated utilization factor was found to be approximately 14%.
Keywords: Tunnel Boring Machine, Utilization, Simulation, Down Time.
1. Introduction Tunnel boring machines (TBMs) are large, heavy,
and so capital intensive equipment. In mechanized
tunneling, the economic and technical condition
of projects is directly dependent on TBM
performance and utilization. Performance and
utilization are two dominant measures that enable
us to study the tunneling process well, and lead
the project designers to get better operational
condition. So far, many studies have been done on
developing practical models for performance
prediction of TBMs. The main focus of
performance prediction studies is the prediction of
the TBMs’ advance rate (AR). These studies have
mainly tried to find out the relationship between
the rock mass characteristics and the machine
performance. For instance, Bieniawski et al.
(2006) have proposed a rock mass excavability
(RME) system to be applied for the direct
estimation of AR [1]. A similar approach has also
been introduced by Barton (1999, 2011) through
the use of QTBM system, which has been applied
successfully during the past decade. Shaheen et al.
(2009) have develop a system to calculate the
advance rate of TBM, considering various factors
including the parameters of soil, machine,
operator experience, and shift organization. The
influence of all the mentioned parameters has
been evaluated with a fuzzy logic expert system to
predict the advance rate of a TBM project [2].
Donghai et al. (2010) have estimated the
penetration rate of the tunnel excavation based on
the rock mass classification. They studied the
TBM system under different geological
conditions, and the impacts of different cutter
head thrusts, which have been chosen in a
reasonable range according to previous
experiences, have been analyzed [3]. Frough et al.
(2013) have applied Rock Engineering System
(RES) to calculate the geology and rock mass
related downtimes index (GRDi) [4]. Copur et al.
(2014) have presented a model to predict daily
advance rates of EPB-TBMs in a complex
geology in Istanbul [5]. Khademi et al. (2010)
have developed semi-theoretical and empirical
Moosazadeh et al./ Journal of Mining & Environment, Vol.9, No.1, 2018
54
models to incorporate the impact of joints and
rock mass characteristics in the estimation of
advance rate [6].
In research works with focus on utilization,
logistical processes, interdependencies, and
downtime of the whole construction operations
have been generally studied and analyzed. As
outstanding research works, Duhme et al. (2013)
have developed a generalized function model
based on a functional analysis of different projects
[7]. Sadri et al. (2013) have presented the
simulation of a TBM supply chain to develop a
tool for evaluating the effects of disturbance
factors e.g. damaged train and segment transport
to the working face on productivity of TBM [8].
Dehghani et al. (2016) have built up a wide
database and applied the dimensional analysis
method to develop a comprehensive mathematical
equation to calculate the TBM penetration rates.
Finally, the probability distribution function of the
TBM penetration rate was calculated using the
Monte Carlo simulation method [9].
Uncertainties in production cycles and other
activities make that the mechanized tunneling is a
stochastic process. Therefore, in order to better
study these systems, the simulation approach
could provide better results for analysis and
predictions. Simulation generally offers
significant opportunities to model probabilistic
phenomena that are often encountered in
construction. Activity durations, random resource
branching, breakdown of equipment, arrival
processes e.g. weather, material delivery, work
orders, design drawings, availability of crews, and
quality of work completed are only a few of the
processes that can be probabilistically modeled
[10]. In addition, when flexibility in modeling
logic and knowledge is required to formulate a
model and find out the integrated solution in
complex systems, simulation can be an efficient
and effective method [11-13].
Tunnel construction operation can be suited with
the Monte Carlo simulation method because this
construction process is based upon the input
parameters that are likely to vary within a range of
values that depend on unpredicted events. As one
of the unique approaches, Roy and Mohammad
(2007) have suggested a simulation model for
application in an actual micro-tunneling project
conducted at Louisiana Tech University. The aim
of this work was to evaluate the effects of
different soil conditions on the productivity of
micro-tunneling operations [14].
In this research work, a simulation-based
approach is presented to analyze the utilization of
TBM. The aim is to find the distribution function
of TBM utilization during the whole tunneling
project life to predict it in future applications. The
applied data is collected from an Erath Pressure
Balance (EPB) TBM from Tabriz urbane railway
project in Iran.
2. TBM operation and downtimes
Tunneling projects are constructed in various
geological conditions varying from hard massive
rocks to very soft sedimentary layers. Tunneling is
a cycle process that consists of excavation, ground
support, mucking, and lining [14, 15]. When a
shield machine is used in unstable soil containing
water, instability of the face must be avoided by
applying a support pressure [16]. Tunneling
machines with earth pressure balance support
provide support to the face through removed
excavated soil. The excavation chamber of the
shield is closed from the tunnel by a pressure
bulkhead. In stable ground, the earth pressure
balance machines (EPBM) can also be operated in
open mode without pressurization with a
partially-filled excavation chamber [15].
Excavated materials should be transferred to the
shaft with muck removal system. The main
options in mechanized tunneling for muck
removal are the muck car/rail method and
continuous conveyor. In a muck car system, muck
cars are loaded with the excavated material and
these muck cars are pulled to the shaft by a
locomotive on the rail system. In a continuous
conveyor belt system, a conveyor belt runs the
entire length of the tunnel and transfers the
excavated material to the shaft.
As mentioned earlier, one of the powerful
measures for evaluation of tunneling process is
the utilization of TBM. Utilization is one of the
key performance indicators that is mostly affected
by the type of operation, management,
maintenance, and geological conditions [4]. The
TBM utilization factor (U) has a direct impact on
the total project duration and costs, and is
calculated by Equation (1).
b
i
TBoring Time
Total ti(%)
me T
U (1)
The total time iT is the summation of the main
activities duration and down times in tunneling
process [17]. In many cases, the working days
(number of days planned for working, which is
generally the total calendar days minus holidays)
are used for calculating AR and the Utilization
Moosazadeh et al./ Journal of Mining & Environment, Vol.9, No.1, 2018
55
(U). The relationship between ROP (rate of
penetration), AR and, U can be simply stated as:
AR ROP U T (2)
where T is the total time per shift or working day
and ROP is the rate of penetration in meters per
hours ( ⁄ ). This simply shows that any increase
in utilization can directly influence the advance
rate. It also means that even in operations where
high ROP can be achieved, the tunneling rate
could still fall short of expectations if the machine
utilization is low [18].
In this work, to simulate the EPB mechanized
tunneling system, this process is broken down to
production cycles in one working shift.
Depending on the type of machine, production
cycle will be different in each shift. The basic
operation in EPB tunneling with one train
transportation system consists of the following
times:
Tb: TBM advance or boring time
Tr: ring building time (installing support
segments)
Tloc: locomotive travel time (transfer of
excavated material from the face to the shaft
and transfer of segments and other materials
used in the construction of tunnels to TBM)
TDloc: locomotive delay time
Locomotive travel time Tloc for each cycle can be
calculated by Equation (3):
loc loc
1 2
1 1T X TD
V V
(3)
where X is distance from shaft, V1 is locomotive
speed when travel to TBM and V2 is locomotive
speed when travel to shaft. In addition to the main
operations done per cycle in each working shift,
other down times also exist as fallow:
Tmain: TBM and backup system
maintenance down time
Tlog: surface and tunnel logistics
maintenance down time (portal crane, concrete
batching Plant, tunnel dewatering system,
locomotive, and train system)
Tcut: cutting tool change down time
Tgta: general tunneling activities time
(mapping, cleaning, lunch break, shift change,
rail, and service line extension)
According to the data collected from each
working shift, TBM and logistics system
maintenance down times are calculated for each
cycle as minute/cycle or minute/ring, and are
added to the time of each cycle. Cutting tool
changing down time is another important activity
that can affect the total project time. The cutting
tool change operations of EPBs are performed by
means of hyperbaric interventions. The total
downtimes for the changing of the cutting tools in
hyperbaric intervention includes preparation,
cutting tool changing, and post-process activities.
In this work, the reliability and maintainability
functions are used to predict the number of
stoppages and the total downtime due to the
cutting tool change. The reliability and
maintainability characteristics can be determined
by the analysis of ring between stoppage (RBS)
and time to repair (TTR) historical datasets.
In summary, all of the mentioned variables are
important to calculate the utilization of the
mechanized tunneling system. Therefore, the total
time, which is equal to the summation of the main
activity duration and down times, is calculated by
Equation (4):
b r loc main log gta cutTi T T T T T T T (4)
A discrete-event simulation (DES) model was
used to simulate the tunneling process. For this
purpose, probability density functions of the
advance time, ring build time, general tunneling
activity times, and locomotive delay time for the
one operating cycle time are determined using the
available data. During the simulation iterations,
random values are generated and assigned to each
input parameter according to their specified
cumulative probability distribution function. The
simulated utilization value for each iteration
number is calculated and saved for the rest of
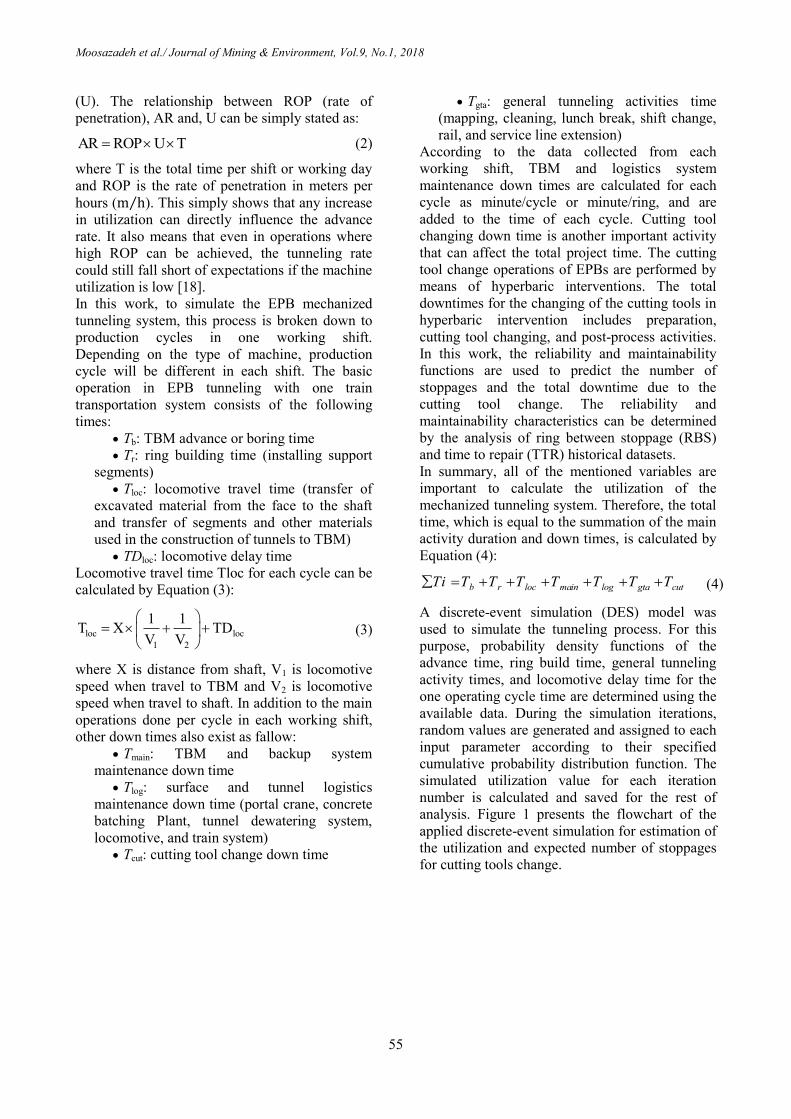
analysis. Figure 1 presents the flowchart of the
applied discrete-event simulation for estimation of
the utilization and expected number of stoppages
for cutting tools change.
Moosazadeh et al./ Journal of Mining & Environment, Vol.9, No.1, 2018
56
Figure 1. Flowchart of applied discrete-event simulation.
3. Simulation of TBM utilization: case study in
Tabriz urban railway
The case study of this research work was done on
EPBTBM in the Tabriz urban railway project. The
applied data for simulation was collected from
shift reports during the excavation of a tunnel with
a length of 3360 m and a diameter of 6.88 m
including 2400 rings. These rings will be formed
by five normal segments and one key segment
(5+1).
The working schedule was two shifts per day and
12 hours per shift. The tunnels are going through
the geological structures, which are mainly
composed of the gravely-sand, sandy-silt,
clay-sand, and silty-sand formations.
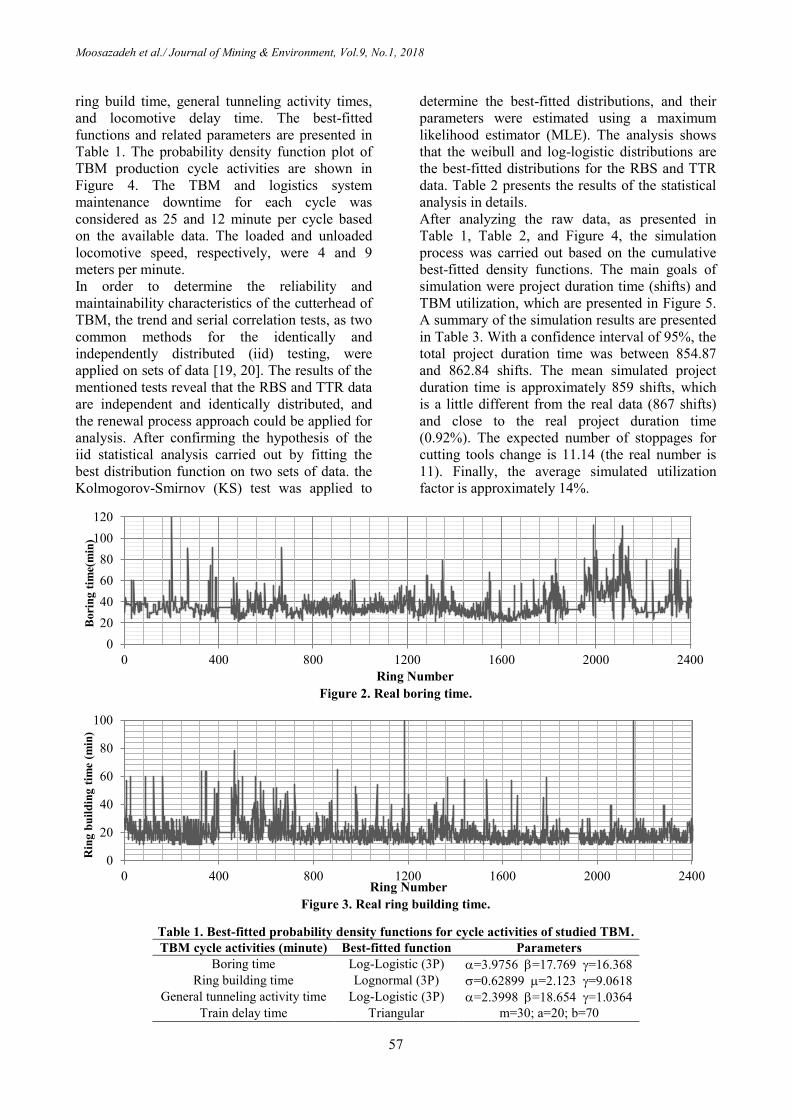
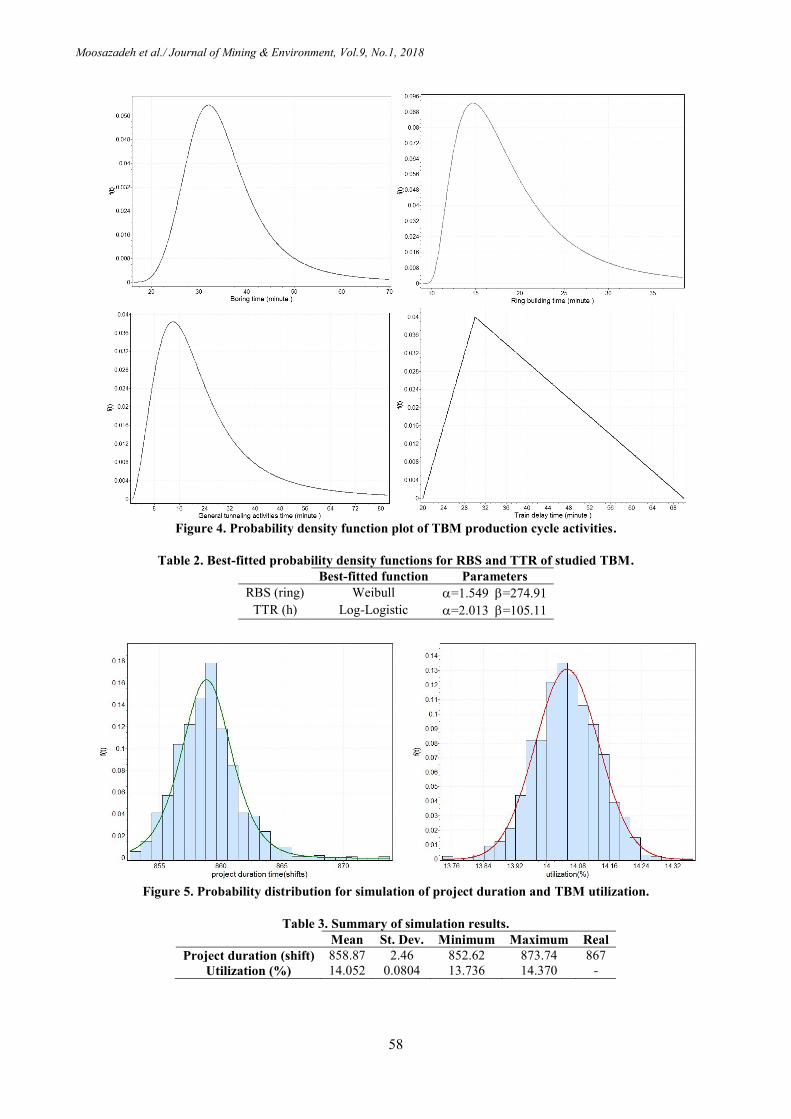
After data collection, preliminary statistical
analysis was carried out on the raw data to filter
out and clarify the available data. For instance, as
shown in Figures 2 and 3, the actual values for the
advance time and ring building time in each
operational tunneling cycle varied from 22 to 125
minutes and 11 to 100 minutes, respectively.
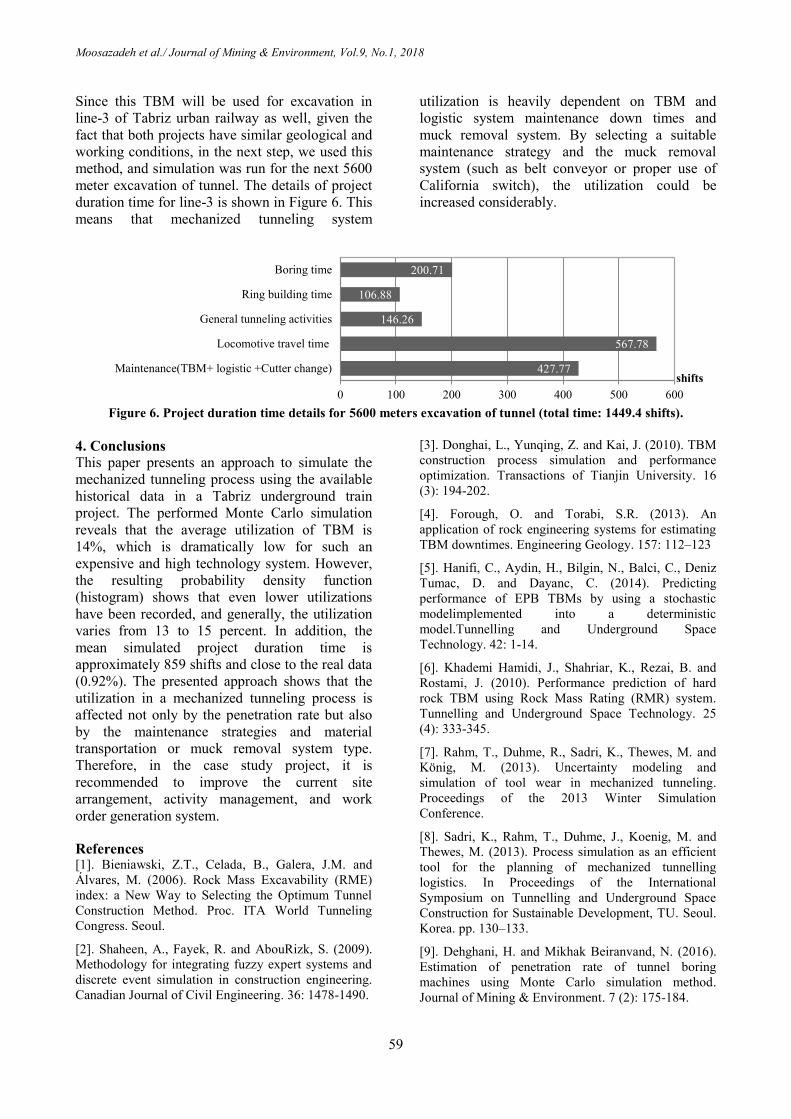
In order to build up the simulation process, the
analysis was continued by fitting the best
probability density functions on the basic
utilization parameters such as the advance time,
Variables: z: number of simulation, R: total ring number, U(i): utilization factor, N(i): number of stoppage,
r: number of ring between stoppage, XTTR: time to repair for cutting tools change, x1, x2, x3. t4
Moosazadeh et al./ Journal of Mining & Environment, Vol.9, No.1, 2018
57
ring build time, general tunneling activity times,
and locomotive delay time. The best-fitted
functions and related parameters are presented in
Table 1. The probability density function plot of
TBM production cycle activities are shown in
Figure 4. The TBM and logistics system
maintenance downtime for each cycle was
considered as 25 and 12 minute per cycle based
on the available data. The loaded and unloaded
locomotive speed, respectively, were 4 and 9
meters per minute.
In order to determine the reliability and
maintainability characteristics of the cutterhead of
TBM, the trend and serial correlation tests, as two
common methods for the identically and
independently distributed (iid) testing, were
applied on sets of data [19, 20]. The results of the
mentioned tests reveal that the RBS and TTR data
are independent and identically distributed, and
the renewal process approach could be applied for
analysis. After confirming the hypothesis of the
iid statistical analysis carried out by fitting the
best distribution function on two sets of data. the
Kolmogorov-Smirnov (KS) test was applied to
determine the best-fitted distributions, and their
parameters were estimated using a maximum
likelihood estimator (MLE). The analysis shows
that the weibull and log-logistic distributions are
the best-fitted distributions for the RBS and TTR
data. Table 2 presents the results of the statistical
analysis in details.
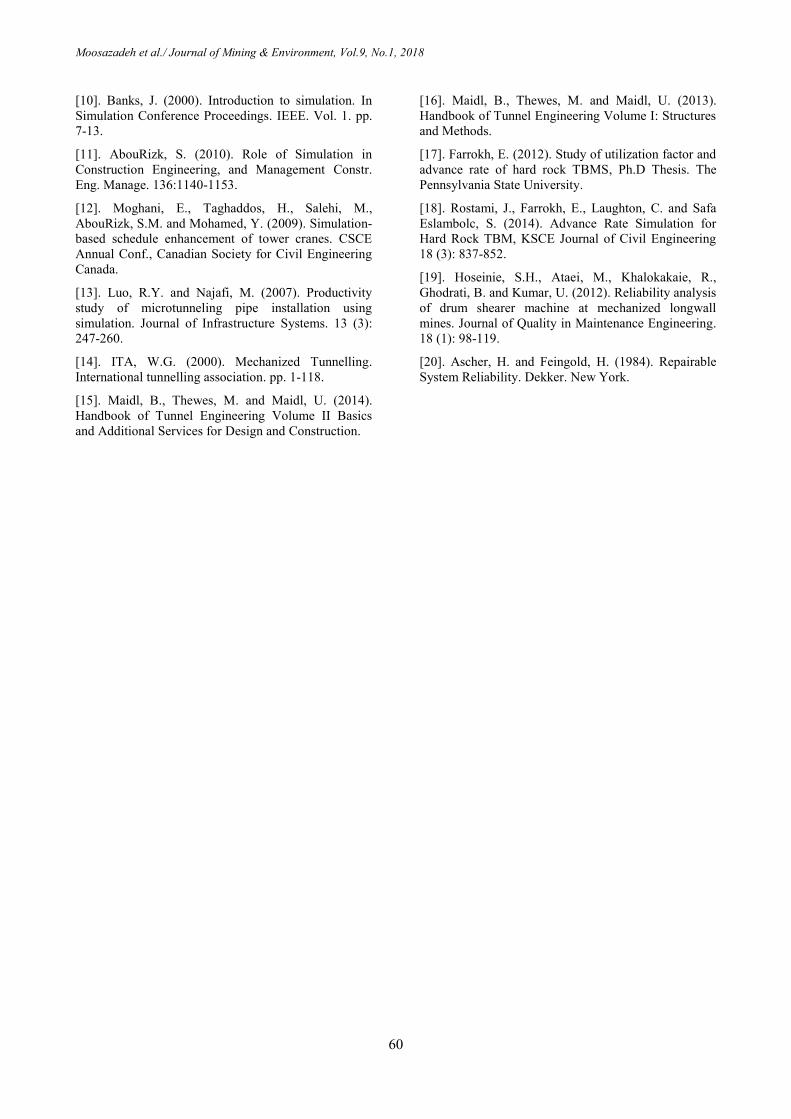
After analyzing the raw data, as presented in
Table 1, Table 2, and Figure 4, the simulation
process was carried out based on the cumulative
best-fitted density functions. The main goals of
simulation were project duration time (shifts) and
TBM utilization, which are presented in Figure 5.
A summary of the simulation results are presented
in Table 3. With a confidence interval of 95%, the
total project duration time was between 854.87
and 862.84 shifts. The mean simulated project
duration time is approximately 859 shifts, which
is a little different from the real data (867 shifts)
and close to the real project duration time
(0.92%). The expected number of stoppages for
cutting tools change is 11.14 (the real number is
11). Finally, the average simulated utilization
factor is approximately 14%.
Figure 2. Real boring time.
Figure 3. Real ring building time.
Table 1. Best-fitted probability density functions for cycle activities of studied TBM.
Parameters Best-fitted function TBM cycle activities (minute)
=3.9756 =17.769 =16.368 Log-Logistic (3P) Boring time
=0.62899 =2.123 =9.0618 Lognormal (3P) Ring building time
=2.3998 =18.654 =1.0364 Log-Logistic (3P) General tunneling activity time
m=30; a=20; b=70 Triangular Train delay time
0
20
40
60
80
100
120
0 400 800 1200 1600 2000 2400
Bori
ng
tim
e(m
in)
Ring Number
0
20
40
60
80
100
0 400 800 1200 1600 2000 2400
Rin
g b
uil
din
g t
ime
(min
)
Ring Number
Moosazadeh et al./ Journal of Mining & Environment, Vol.9, No.1, 2018
58
Figure 4. Probability density function plot of TBM production cycle activities.
Table 2. Best-fitted probability density functions for RBS and TTR of studied TBM.
Parameters Best-fitted function
=1.549 =274.91 Weibull RBS (ring)
=2.013 =105.11 Log-Logistic TTR (h)
Figure 5. Probability distribution for simulation of project duration and TBM utilization.
Table 3. Summary of simulation results.
Mean St. Dev. Minimum Maximum Real
Project duration (shift) 858.87 2.46 852.62 873.74 867
Utilization (%) 14.052 0.0804 13.736 14.370 -
Moosazadeh et al./ Journal of Mining & Environment, Vol.9, No.1, 2018
59
Since this TBM will be used for excavation in
line-3 of Tabriz urban railway as well, given the
fact that both projects have similar geological and
working conditions, in the next step, we used this
method, and simulation was run for the next 5600
meter excavation of tunnel. The details of project
duration time for line-3 is shown in Figure 6. This
means that mechanized tunneling system
utilization is heavily dependent on TBM and
logistic system maintenance down times and
muck removal system. By selecting a suitable
maintenance strategy and the muck removal
system (such as belt conveyor or proper use of
California switch), the utilization could be
increased considerably.
Figure 6. Project duration time details for 5600 meters excavation of tunnel (total time: 1449.4 shifts).
4. Conclusions
This paper presents an approach to simulate the
mechanized tunneling process using the available
historical data in a Tabriz underground train
project. The performed Monte Carlo simulation
reveals that the average utilization of TBM is
14%, which is dramatically low for such an
expensive and high technology system. However,
the resulting probability density function
(histogram) shows that even lower utilizations
have been recorded, and generally, the utilization
varies from 13 to 15 percent. In addition, the
mean simulated project duration time is
approximately 859 shifts and close to the real data
(0.92%). The presented approach shows that the
utilization in a mechanized tunneling process is
affected not only by the penetration rate but also
by the maintenance strategies and material
transportation or muck removal system type.
Therefore, in the case study project, it is
recommended to improve the current site
arrangement, activity management, and work
order generation system.
References [1]. Bieniawski, Z.T., Celada, B., Galera, J.M. and
Álvares, M. (2006). Rock Mass Excavability (RME)
index: a New Way to Selecting the Optimum Tunnel
Construction Method. Proc. ITA World Tunneling
Congress. Seoul.
[2]. Shaheen, A., Fayek, R. and AbouRizk, S. (2009).
Methodology for integrating fuzzy expert systems and
discrete event simulation in construction engineering.
Canadian Journal of Civil Engineering. 36: 1478-1490.
[3]. Donghai, L., Yunqing, Z. and Kai, J. (2010). TBM
construction process simulation and performance
optimization. Transactions of Tianjin University. 16
(3): 194-202.
[4]. Forough, O. and Torabi, S.R. (2013). An
application of rock engineering systems for estimating
TBM downtimes. Engineering Geology. 157: 112–123
[5]. Hanifi, C., Aydin, H., Bilgin, N., Balci, C., Deniz
Tumac, D. and Dayanc, C. (2014). Predicting
performance of EPB TBMs by using a stochastic
modelimplemented into a deterministic
model.Tunnelling and Underground Space
Technology. 42: 1-14.
[6]. Khademi Hamidi, J., Shahriar, K., Rezai, B. and
Rostami, J. (2010). Performance prediction of hard
rock TBM using Rock Mass Rating (RMR) system.
Tunnelling and Underground Space Technology. 25
(4): 333-345.
[7]. Rahm, T., Duhme, R., Sadri, K., Thewes, M. and
König, M. (2013). Uncertainty modeling and
simulation of tool wear in mechanized tunneling.
Proceedings of the 2013 Winter Simulation
Conference.
[8]. Sadri, K., Rahm, T., Duhme, J., Koenig, M. and
Thewes, M. (2013). Process simulation as an efficient
tool for the planning of mechanized tunnelling
logistics. In Proceedings of the International
Symposium on Tunnelling and Underground Space
Construction for Sustainable Development, TU. Seoul.
Korea. pp. 130–133.
[9]. Dehghani, H. and Mikhak Beiranvand, N. (2016).
Estimation of penetration rate of tunnel boring
machines using Monte Carlo simulation method.
Journal of Mining & Environment. 7 (2): 175-184.
427.77
567.78
146.26
106.88
200.71
0 100 200 300 400 500 600
Maintenance(TBM+ logistic +Cutter change)
Locomotive travel time
General tunneling activities
Ring building time
Boring time
shifts
Moosazadeh et al./ Journal of Mining & Environment, Vol.9, No.1, 2018
60
[10]. Banks, J. (2000). Introduction to simulation. In
Simulation Conference Proceedings. IEEE. Vol. 1. pp.
7-13.
[11]. AbouRizk, S. (2010). Role of Simulation in
Construction Engineering, and Management Constr.
Eng. Manage. 136:1140-1153.
[12]. Moghani, E., Taghaddos, H., Salehi, M.,
AbouRizk, S.M. and Mohamed, Y. (2009). Simulation-
based schedule enhancement of tower cranes. CSCE
Annual Conf., Canadian Society for Civil Engineering
Canada.
[13]. Luo, R.Y. and Najafi, M. (2007). Productivity
study of microtunneling pipe installation using
simulation. Journal of Infrastructure Systems. 13 (3):
247-260.
[14]. ITA, W.G. (2000). Mechanized Tunnelling.
International tunnelling association. pp. 1-118.
[15]. Maidl, B., Thewes, M. and Maidl, U. (2014).
Handbook of Tunnel Engineering Volume II Basics
and Additional Services for Design and Construction.
[16]. Maidl, B., Thewes, M. and Maidl, U. (2013).
Handbook of Tunnel Engineering Volume I: Structures
and Methods.
[17]. Farrokh, E. (2012). Study of utilization factor and
advance rate of hard rock TBMS, Ph.D Thesis. The
Pennsylvania State University.
[18]. Rostami, J., Farrokh, E., Laughton, C. and Safa
Eslambolc, S. (2014). Advance Rate Simulation for
Hard Rock TBM, KSCE Journal of Civil Engineering
18 (3): 837-852.
[19]. Hoseinie, S.H., Ataei, M., Khalokakaie, R.,
Ghodrati, B. and Kumar, U. (2012). Reliability analysis
of drum shearer machine at mechanized longwall
mines. Journal of Quality in Maintenance Engineering.
18 (1): 98-119.
[20]. Ascher, H. and Feingold, H. (1984). Repairable
System Reliability. Dekker. New York.
6931اول، سال م، شماره نهدوره زیست، پژوهشی معدن و محیط -و همکاران/ نشریه علمی موسی زاده
دستگاه حفاری تمام مقطع تونل: مطالعه موردی وری بهره سازی شبیه
3و بهزاد قدرتی 2، سید هادی حسینی*1، حمید آقابابایی1موسی زاده نیالد فیس
، دانشگاه صنعتی سهند تبریز، ایراندانشکده مهندسی معدن -1
مهندسی معدن، دانشگاه صنعتی اصفهان، ایران دانشکده 2
بخش مهندسی تعمیر و نگهداری دانشگاه صنعتی لولئو، سوئد -3
9/67/7162، پذیرش61/5/7162ارسال
[email protected]* نویسنده مسئول مکاتبات:
چکیده:
مستقیم بر روی طور به وری گیرد. مقدار بهره مییند ساخت و ساز مورد استفاده قرار آکه در تجزیه و تحلیل فر است عوامل مدیریتی ترین مهمیکی از وری بهره
وری بهرهحاضر پژوهشدر است. و الزم سازی ضروریتونل های پروژه در وری بهرهبنابراین، مطالعه گذارد. تأثیر می نهایی ساخت های هزینهمدت زمان کل پروژه و
کارلو مونت ساز شبیهکارگیری ه با ب قرار گرفته است، در پروژه تونل قطار شهری تبریز مورد استفادهکه دستگاه حفاری تمام مقطع تونل از نوع فشار تعادلی زمین
گذاری و زمان الزم برای مربوط به عملیات اصلی تونل سازی شامل زمان حفاری، زمان رینگهای سازی، داده برای شبیه قرار گرفته است. و ارزیابی مورد بررسی
های توقف دیگر مانند زمان تعمیر های مربوط به عملیات اصلی، زمان آوری شد. عالوه بر زمان حرکت سیستم حمل و نقل لوکوموتیو در طول هر شیفت کاری جمع
های تدارکات موجود در داخل تونل و سطح زمین، زمان الزم برای جایگزینی ابزار ن دستگاه، زمان تعمیرات سیستمو سیستم پشتیبا TBMو نگهداری دستگاه
الزم برای اتمام پروژه مورد مطالعه نشان داد که زمان سازی شبیهشد. نتایج گرفته در نظر سازی آوری شده و در شبیه برش و تاخیرات سیستم لوکوموتیو نیز جمع
61سیستم تونل سازی حدود % دهی بهرهدر نهایت میانگین ضریب های واقعی دارد. ( با داده37/1شیفت کاری است و تفاوت بسیار کمی )حدود % 953حدود
تخمین زده شد.
.سازی، زمان توقف وری، شبیه حفاری تمام مقطع تونل، بهرهدستگاه کلمات کلیدی: