Embed Size (px)
Citation preview
1
Simulation of Small-Scale Coronal Explosives due to Magnetic Reconnections
FAN Quan-Lin, FENG Xue-Shang, XIANG Chang-Qing, and ZHONG Ding-Kun
SIGMA Weather Group, Laboratory for Space Weather, Center for Space Science and Applied Research
Chinese Academy of Sciences, P.O.Box 8701, Beijing 100080, China
Abstract The dynamics of small-scale explosive phenomena in the lower corona have been simulated by solving the compressible magnetohydrodynamic equations. Numerical results show that the magnetic reconnections in a long coronal current sheet consist of a series of discrete small reconnection events, coalescence of magnetic islands, and plasmoid ejections, corresponding to the explosive events occurring intermittently and as bursts in a mentioned observational case. The generation of magnetic islands via multiple-X-point reconnection and their coalescence processes, to some extent, are qualitatively similar to the sequence of brightenings in the active region NOAA 8668. The strong ejections are possibly related to the recorded EUV-emitting structures. Morphological comparison and quantitative check of the plasma parameters support this candidate mechanism, and the idea that explosive events that appear to last long may not be single events, but a succession of explosive events either resolved or unresolved. The temporal energy conversion process is also examined. PACS: 52.35.Vd, 52.65.Kj, 96.60.Rd E-mail: [email protected]
2
.Ⅰ INTRODUCTION Besides the large-scale eruptive phenomena occurring in the solar atmosphere,1 namely coronal mass
ejections (CMEs), prominence eruptions, and large two-ribbon flares, there is a host of small-scale impulsive
phenomena in the corona and chromosphere,2-4 including small flares, X-ray bright points, transition-region
explosive events, surges and sprays. These small-spatial events have gained much attention, especially those in
the solar transition region,5-8 since they are now widely believed to involve coronal heating, particle acceleration
etc. Accordingly, the main features of the small-scale explosive events derived from these studies can be
summarized to have an average size along the slit equal to 2 arcsec (1500km) approximately, the observed
velocities ranging between ± 250 km s-1 and ± 50 km s-1, and the lifetime distribution ranging between 20~200s
with an average value of 40s.
Nowadays, solar explosive events are believed to be a manifestation of magnetic reconnection on the Sun
and the concept of current sheet is a general recourse in explaining such phenomena. It is difficult to maintain a
current sheet and thus store energy in it because a variety of magnetohydrodynamic (MHD) and kinetic plasma
instabilities can convert the stored magnetic energy to other types of energy through magnetic reconnection,
leading to a series of solar explosive events ranging from non-resolvable events (‘nanoflares’) up to the largest
flares. For example, it is suggested that the ongoing magnetic reconnection has produced the blue- and
red-shifted Doppler components observed during explosive events, represented by the bi-directional outflow
jets.2 The idea that the asymmetric reconnection between newly emerging intranetwork magnetic field flux and
pre-existing network flux causes the explosive events in the solar atmosphere has been explored in a
two-dimensional (2D) numerical experiment.5 In another series of related investigations, explosive events in the
solar transition region in a 2D environment have been numerically studied under the assumption of
non-equilibrium ionization.6-8 To date, several numerical work have successfully predicted some signatures of
violent flares in the corona, involving fast magnetic reconnection model with a current sheet.9-11 Attempts to
associate a pulsating decimetric continuum solar flare radio burst event with a 2D MHD magnetic reconnection
model have proved to be successful, where the highly dynamic reconnection processes are consistent with the
observed irregular or quasi-periodic emissions.12 However, MHD simulations without Ohmic heating and other
heat sources2,5 need improvements for understanding the intrinsic nature of small explosives. The previous
related MHD studies 6-8 would be more satisfactory if a sufficiently realistic initial physical condition
representing solar transition region had been adopted. It should also be pointed out that the results on large
two-ribbon flares or flaring loops can not readily extended to the small-scale explosive events.9,10 It is worth
exploring these small-scale explosions in depth, and thus giving a firm answer about their true nature.
In the present paper we intend to model small-scale coronal eruptive events using the 2D dissipative MHD.
In section 2 the simulation model, the boundary and initial conditions are described. In section 3 the basic
features of the current sheet evolution, comparisons with observations are shown. Finally we summarize our
principal conclusions and discuss the strengths and weaknesses of the models.
Ⅱ. PHYSICAL DESCRIPTION OF THE PROBLEM Here we consider a lower coronal atmosphere represented by an inviscid perfect gas with a specific heat
ratio of 3/5=γ in the presence of magnetic field. The weakly ionized plasma is approximately described by
the one-fluid model, which is justified when the coupling between ions and neutrals is very strong.13 For
simplicity, gravitational acceleration is ignored. Then we numerically solve the nonlinear, time dependent,
3
resistive compressible MHD equations in conservative form in (x, y) 2D Cartesian coordinates. The Ohmic
heating has been added. The anisotropic heat conduction effects working only in the direction along the magnetic
field line are taken into account. The conduction coefficient is taken to be the classical Spitzer type, i.e.,
proportional to 2/5T , where T is temperature.
The initial magnetic configuration has a current sheet at y=0 with a characteristic width 0L . The field is
parallel to the x-axis and varies only along the y-axis. The background plasma is in magneto-hydrostatic
equilibrium and the initial density distribution is assumed to be uniform everywhere, ∞= ρρ0 . ∞∞ T ,ρ are
the plasma density and temperature at x=0 and 0Ly >> (far from the current sheet). The plasma beta at
0Ly >> is defined as )2( 02 µβ ∞∞= BP , which is equal to 0.056 in our simulations based on the
observations.14 VA∞ is the Alfvén speed defined by VA∞ = B∞/ ∞ρµ0 and the characteristic time t∞ = L0/VA∞.
An anomalous resistivity model (similar to that of Schumacher et al.15,16) is introduced into the current sheet,
where an infinite chain of spots of locally enhanced resistivity with scattered amplitudes are adopted as the initial
driver of magnetic reconnection. The anomalous resistivity is then determined self-consistently from the local
value of the current density if a threshold for onset is exceeded. The background resistivity 0η is set equal to
0.0005 in view of conditions in the lower corona.
The simulations are performed on uniform grids with 132161 × points and ∆x=5×∆y=0.25L0 in a
rectangular computation box of size 040 0 Lx ≤≤ , 00 88 LyL ≤≤− . The improved high order
Lax-Friedrichs TVD finite difference model17 is used to solve the equations, which has the advantage of quick
convergence as well as robust ability of high resolution.18 A projection scheme employing an iterative Poisson
solver maintains the 0=⋅∇ B constraint numerically.19 A fractional time-stepping technique is then adopted
for the heat conduction part. Though the problem is assumed to be symmetrical about the x-axis2, 9-11 or y-axis,15,
16 calculation has been performed in the whole region for the sake of avoiding non-physical effects caused by
numerical symmetry boundary assumption in the time-dependent process.20 Open boundary conditions are
chosen at the four boundaries, where the normal derivative of all variables vanishes, except for the normal
component of B, which is determined from the solenoidal condition. In practice, all the calculations are carried
out in the non-dimensional form based on several physical parameters listed in Table I.
Ⅲ. NUMERICAL RESULTS AND DISCUSSIONS A. General dynamic development
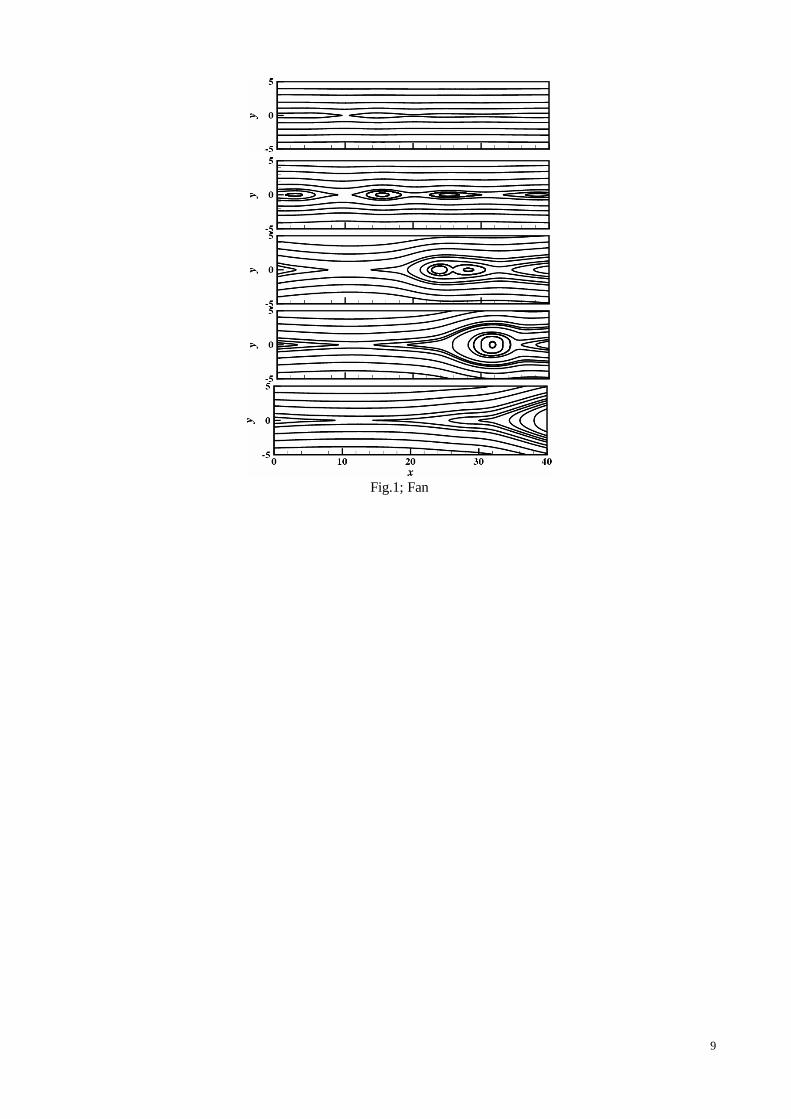
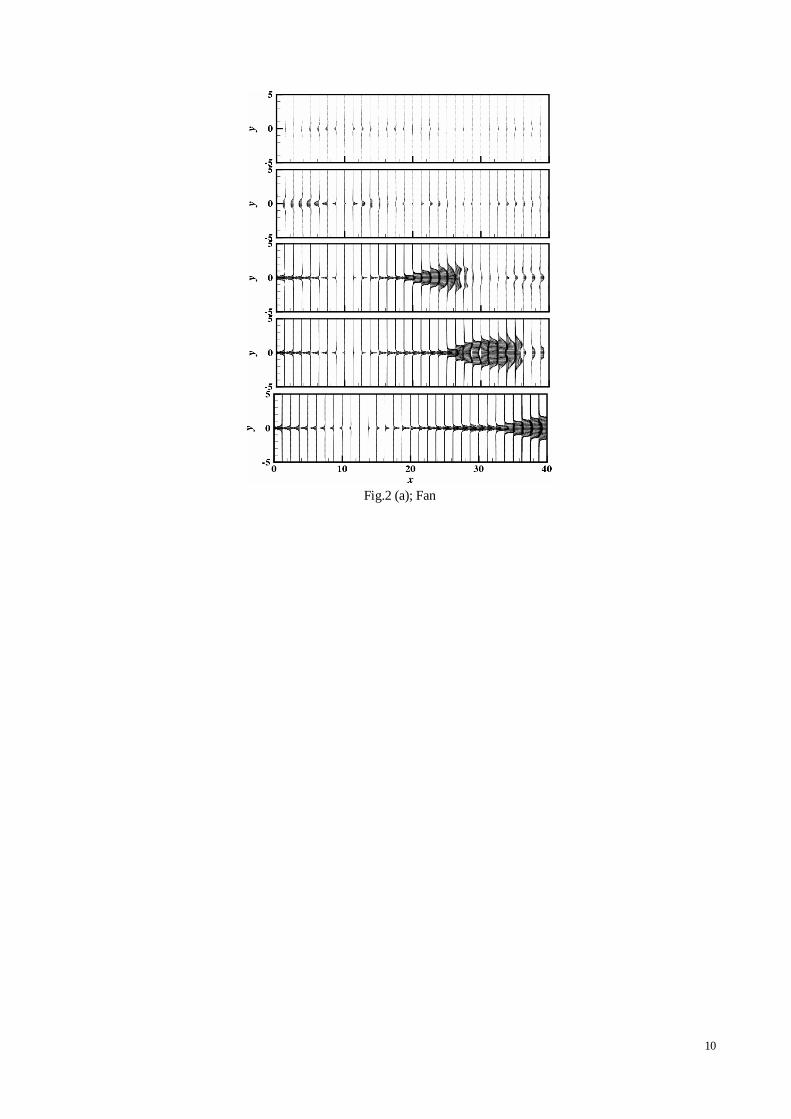
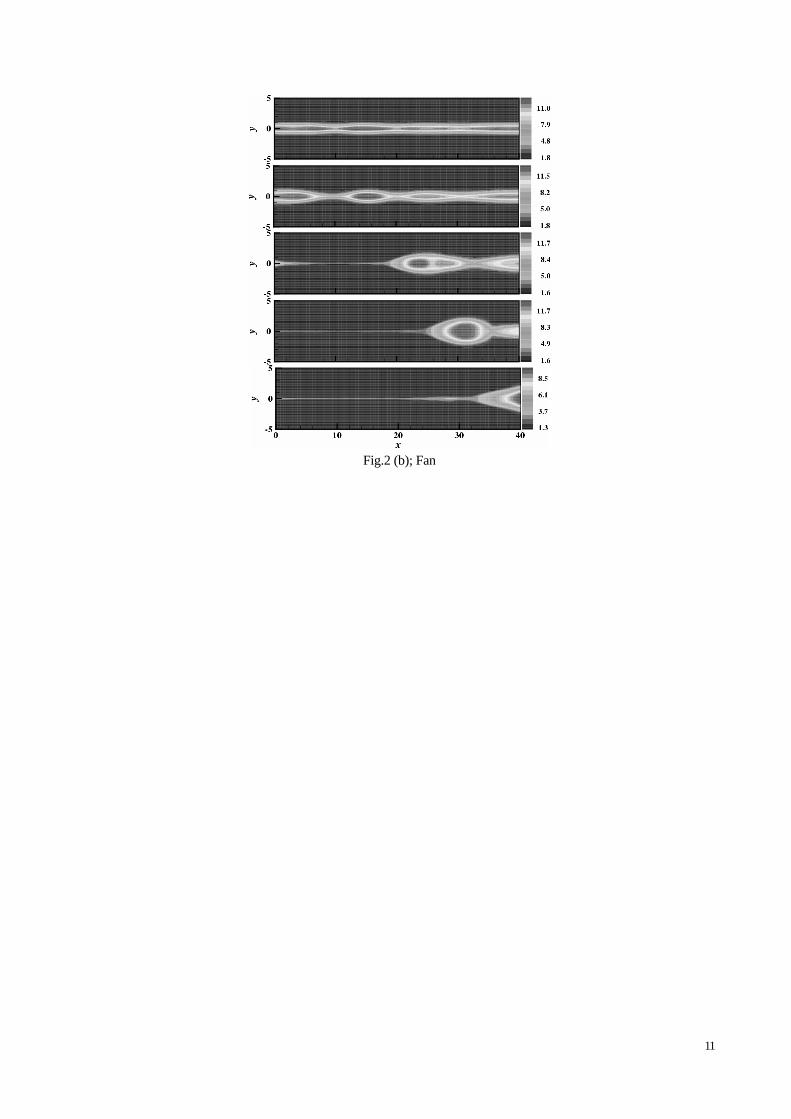
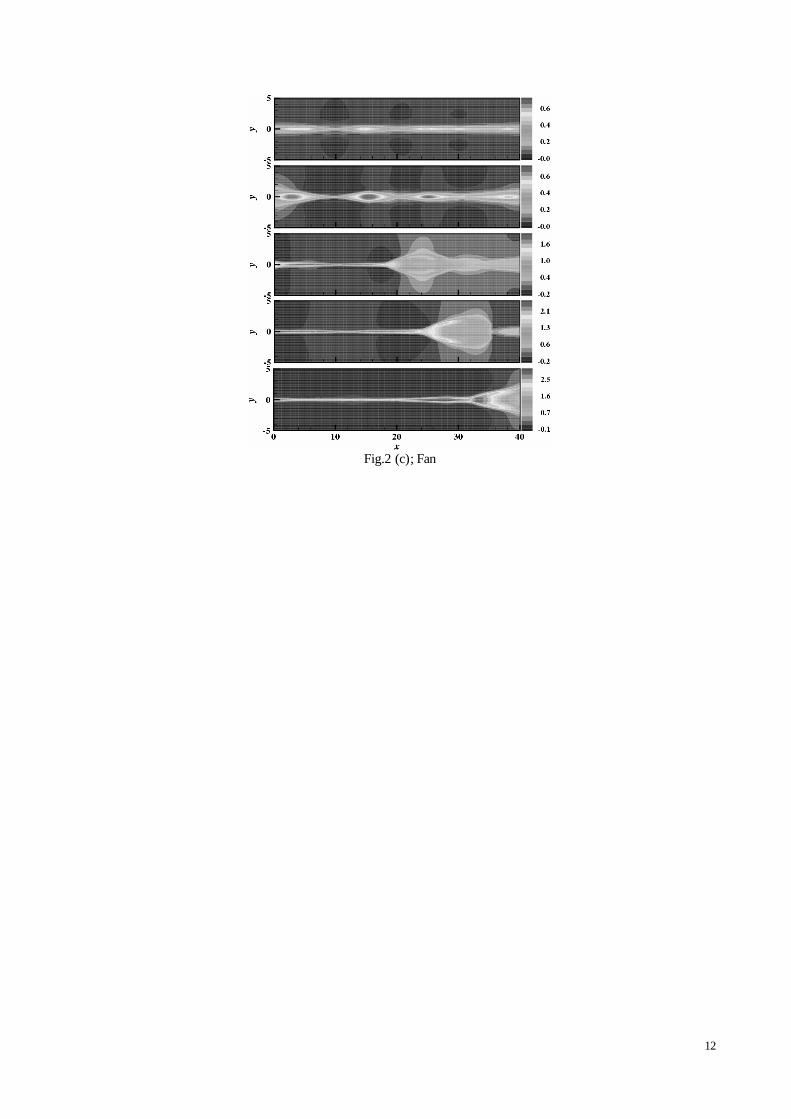
The typical evolution of the magnetic field lines are described in Fig.1, showing tearing, reconnection, and coalescence in the current sheet, while Fig.2 shows the corresponding images of the temporal development of
plasma velocity, temperature, and relative mass density changes. The ad hoc localized resistivity causes current dissipation and forces the magnetic field line in the diffusion
region to start reconnecting. An X-point topology can be found at the point of largest resistivity value at t=40 in the left part of the domain ( 155 << x ). The unequal amplitudes of the resistivity have induced different magnetic diffusion along the current sheet, resulting in spatio-temporal reconnections owe to tearing instability,
though the initial driver has been switched off after 30 =t . As a dynamical consequence of this, a multi-X
pattern has been developed at t=55. While in another point of view the close-up of the magnetic field lines of adjacent
4
X-points reveals the formation of magnetic islands, or plasmoid, which could be attributed to the “induced tearing”
mechanism15, 16 or a pitchfork bifurcation of the magnetic field line topology.21 However, the system is intrinsically
instable. At t=80, the coalescence instability has been initiated. The outflows in the x-direction have transported the
left/right outer plasmoid out of the domain in Fig.2a. The magnetic island coalescence, or annihilation of weak
X-point has ended at t=90 (Fig.1). Afterwards the plasmoid is accelerated to a substantial fraction of the Alfvén
velocity and ejected across the right-hand open boundary of the computation box (see t=105 in Fig.2), leading to an
asymmetric Petschek-like fast reconnection configuration. The role of anomalous resistivity model in the fast
reconnection mechanism and related parameter tests are beyond the focus of present study, which can be referred to
the former numerical investigations.22, 23
B. Qualitative comparison with an observational evidence We have noticed that the simulated scenario above might be relevant and consistent with a recent
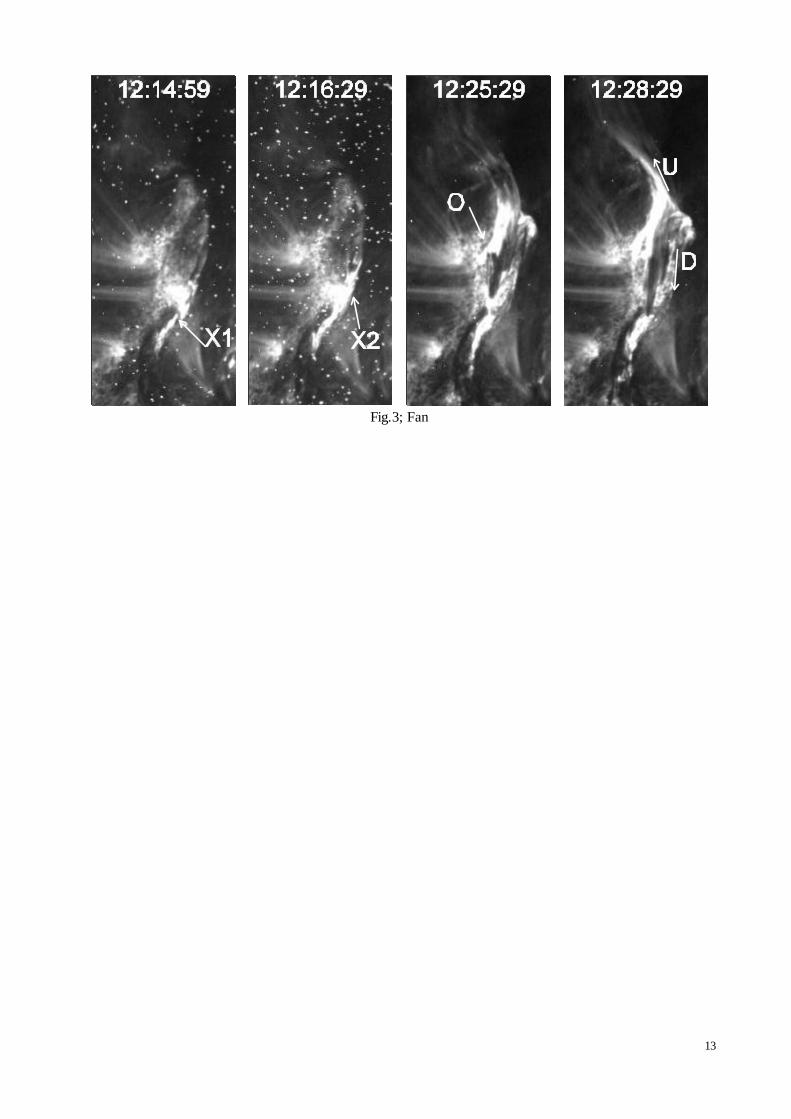
observational case to some extent. In August, 1999, the active region NOAA 8668 located at N22E54 was jointly observed by the Solar and Heliospheric Observatory (SOHO), the Transition Region and Coronal Explorer (TRACE) and the Big Bear Solar Observatory for several days.14, 24 Figure 3 illustrates the morphology and dynamics of a typical eruption at EUV 171Å (characteristic of emission from gas at 106K), by TRACE in the upper atmosphere above NOAA 8668. It displays many small-scale UV/EUV brightenings that are scattered both in space and time. Specifically, a brightening was first seen at X1 which is a small site of magnetic reconnection (12:14:59 UT). Within a few minutes before its full development, however, a second jet-like brightening occurred at X2, another site of flux cancellation (12:16:29 UT). An EUV-emitting structure possessing a huge amount of mass as indicated by O (12:25:29 UT) is formed and lifted as a result of the nearly simultaneous detachments of magnetic field lines at the two sites, X1 and X2 (for more details see Ref. 14, 24 and related publications therein).
In respect of these observations the magnetic field configurations developed in Fig.1 and the distributions of plasma parameters in Fig.2 are helpful for their possible interpretations. It might be reasonable to associate the
brightenings with the spatio-temporal establishment of the X-pattern in the current sheet. Plasma heating (see Fig.2b) and compressing (see Fig.2c) take place at these sites following the reconnection, which result in an increase in both the plasma thermal energy and mass density. These X-points, or later the plasmoid, is possibly responsible for the occurrence of the brightenings at X1 and X2 in Fig.3. The normalized temperature of the chief plasmoid formed at ( 2010 << x ) at t=55 is as high as 13.0 T∞ , i.e. 3.2×10⁶ K. Relative mass density variance is usually positive at the sites of reconnections or magnetic islands, meaning that compression happened there. As 40 computational time units pass (about 520s in dimension, where t∞=13s as listed in Table I), the large island formed by coalescence at t=90 has gained certain thermal energy due to heating relevant to the dynamics (see Fig.2b). It is corresponding to the structure O of EUV-emitting features. According to the TRACE EUV emission Chae14 concluded that the lifted materials either moving upward along the apparently open field lines (as indicated by U) or falling down (as indicated by D) possess a speed ranging between 80km s-1 and 250 km s-1 (see Fig.3. at 12:28:29 UT). Further checking the velocity vector at t=55 and t=90 in Fig.2a we have found that the left-hand plasma moved at a slower speed of about 0.32 VA∞ whereas its counterpart in the right moved at a speed of 0.61 VA∞ passing the boundary. They are rather acceptable if transformed into the dimensional ones with the conditions specified above, 120.0 km s-1 and 235.0 km s-1, respectively. This proves the physical reasonableness of the present simulations. C. Energy conversion
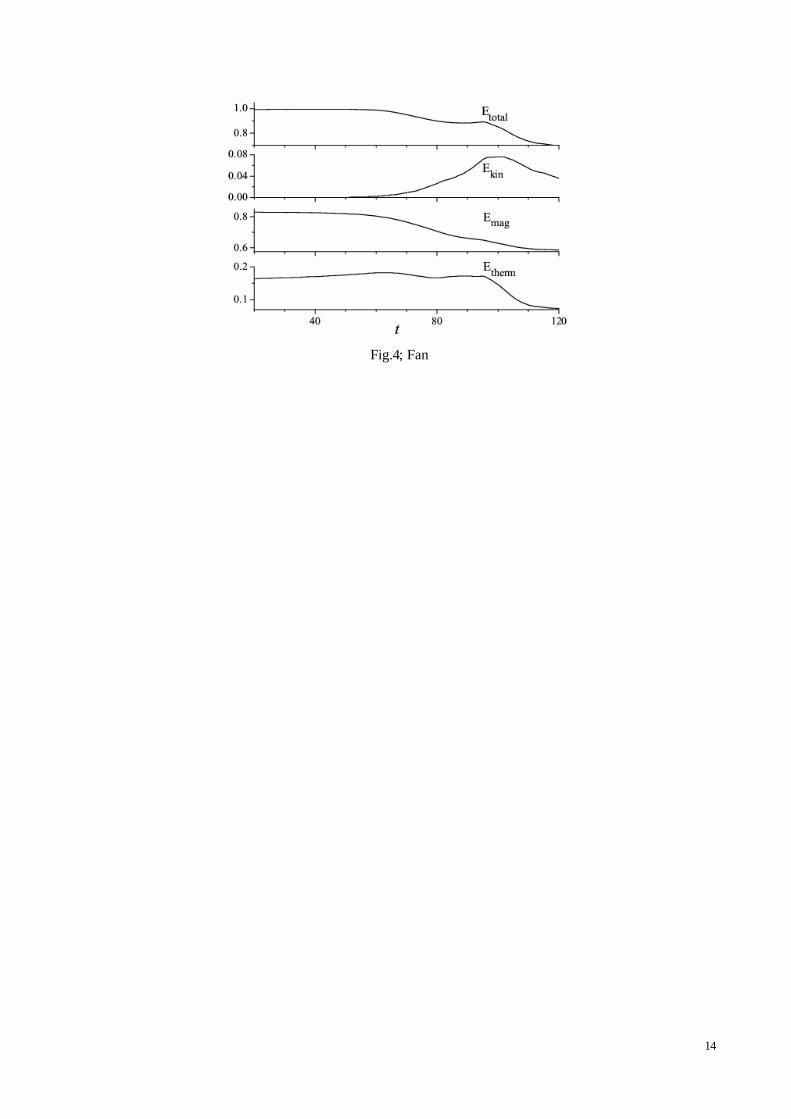
It is of interest to examine the temporal behavior of the kinetic, magnetic, thermal, and total energy, normalized by the total energy at t=0 after being integrated over the whole simulation box shown in Fig.4. The generation of series of magnetic islands in the current sheet mainly results in the plasma heating before t=75, when only small kinetic energy enhancement has fulfilled. The obvious monotonous increase of the kinetic energy during t=80~110 is due to the enhancing reconnection driven by the coalescence instability.25 The
5
conversion of magnetic energy into kinetic energy is strongest, exceeding the Ohmic heating and resulting in the strong bulk acceleration of the plasmoid. Note that the magnetic energy is continuously decreasing, which reveals that the re-organization of the magnetic field lines is associated with a series of magnetic reconnection events, including multiple reconnection, coalescence of magnetic islands, and acceleration of the ejections. The facts simulated contribute to understanding the observations of nearly simultaneous, multi-site magnetic reconnection in the transition zone in Fig.3. It is not surprising that almost constant total energy is destroyed after t=75 when the free outflows or persistent inflows across the open boundaries also take or bring certain thermal and magnetic energies. Ⅳ. SUMMARY AND FUTURE WORK
We have investigated the dynamics of small-scale explosive phenomena in a lower coronal environment. The initial state is in magneto-hydrostatic equilibrium including a current sheet. Magnetic reconnection is initiated through ad hoc enhanced resistivity during the early phase of the reconnection process. Inclusion of anomalous resistivity is then set in when some critical state is reached after the initial driver is turned off.
Our numerical results prove that a series of many discrete small magnetic reconnection events along the long, compressible current sheet might correspond to the explosive events occurring intermittently and as brightenings or bursts in the mentioned observational case. This candidate mechanism can principally explain some observational features of NOAA 8668 discovered by TRACE. The generation of magnetic islands via multiple-X-point reconnection and their coalescence processes may be regarded to constitute the sequence of brightenings in the upper atmosphere at the region of canceling magnetic features. The strong ejections are possibly related to the recorded EUV-emitting structures. Morphological comparison and quantitative check of the plasma velocity, temperature, and density support the idea that explosive events that appear to last long may not be single events, but a succession of explosive events that are either resolved or unresolved. Meanwhile, the temporal energy conversion process is also examined.
It should be mentioned that our model situation involved only an unstratified atmosphere without the inclusion of gravity, which might have a non-trivial role in constructing the initial magneto-hydrostatic configuration.26 On the other hand our purely 2D MHD modeling could not discriminate the variations along the solar radius, while the bi-directional outflow jet velocities of the observations are derived from a projection component. Conventionally, the emission measure from related observations represents the integrated density square along the line-of sight. In this context, there are some differences between parameters of the plasmoid simulated and the observed structures although the results provide essential information about the fine structure of the reconnection event. With these in mind, the three-dimensional (3D) effects of magnetic reconnection analyzed by former MHD numerical investigations of linkage induced reconnection of two magnetic flux tubes,27 spontaneous reconnection model with strongly anisotropic initial perturbation28, 29 might alleviate the above discrepancies, which are beyond the scope and intention of the present study.
In conclusion we believe that the results presented here could give a physical insight into the dynamics of small-scale explosives in the lower corona despite the simplicity of the model examined here. In the coming work we are challenged to further explore this physical process and its implications, since it is of fundamental importance in discovering the substantial nature of corona heating. ACKNOWLEDGEMENTS
We gratefully acknowledge suggestion and assistance by Dr. J. Chae and the valuable comments by the anonymous referees. This work is jointly supported by the National Natural Science Foundation of China (Grant Nos: 40104006, 40204010, and 49925412). The open data policy from the TRACE team is acknowledged.
6
REFERENCES 1. J. Lin, W. Soon, and S. Baliunas, Chin. Sci. Bull. 47, 1601 (2002) 2. D. E. Innes and G. Tóth, Solar Phys. 185, 127 (1999) 3. M. E. Pérez, J. G. Doyle, R. Erdélyi, and L. M. Sarro, Astronomy and Astrophys. 342, 279 (1999) 4. L. M. Sarro, R. Erdélyi, J. G. Doyle, and M. E. Pérez, Astronomy and Astrophys. 351, 721 (1999) 5. S. P. Jin, B. Inhester, and D. E. Innes, Solar Phys. 168, 279 (1996) 6. I. Roussev, K. Galsgaard, R. Erdélyi, and J. G. Doyle, Astronomy and Astrophys. 370, 298 (2001) 7. I. Roussev, K. Galsgaard, R. Erdélyi, and J. G. Doyle, Astronomy and Astrophys. 375, 228 (2001) 8. I. Roussev, J. G. Doyle, K. Galsgaard, and R. Erdélyi, Astronomy and Astrophys. 380, 719 (2001) 9. P. F. Chen, C. Fang, Y. H. Tang, and M. D. Ding, Astrophys. J. 513, 516 (1999) 10. P. F. Chen, C. Fang, M. D. Ding, and Y. H. Tang, Astrophys. J. 520, 853 (1999) 11. Y. Q. Hu, ACTA Astrophys. Sinica 19(2), 156 (1999) 12. B. Kliem, M. Karlický, and A. O. Benz, Astronomy and Astrophys. 360, 715 (2000) 13. E. G. Zweibel, Astrophys. J. 340, 550 (1989) 14. J. Chae, Astrophys. J. 584, 1084 (2003) 15. J. Schumacher and B. Kliem, Phys. Plasmas 3, 4703 (1996) 16. J. Schumacher and B. Kliem, Phys. Plasmas 4, 3533 (1997) 17. X. S. Feng, S. T. Wu, Q. L. Fan, and F. S. Wei, Chin. J. of Space Sci. 22(4), 300 (2002) 18. Q. L. Fan, F. S. Wei, and X. S. Feng, Commun. Theor. Phys. 40, 247 (2003) 19. G. Tóth, J. Comput. Phys. 161, 605 (2000) 20. Q. L. Fan, H. Q. Zhang, Y. C. Guo, and X. L. Wang, Proceedings of ASME Fluids Engineering Division
Summer Meeting, Boston, 2000, # FEDSM00-11171, CD-ROM 21. E. R. Priest, D. P. Lonie, and V. S. Titov, J. Plasma Phys. 56, 507 (1996) 22. T. Yokoyama and K. Shibata, Astrophys. J. 436, L197 (1994) 23. M. Ugai, Phys. Plasmas 2, 388 (1995) 24. J. Chae, C. Denker, T. J. Spirock, H. M. Wang, and P. R. Goode, Solar Phys. 195, 333 (2000) 25. C. Marliani and H. R. Strauss, Phys. Plasmas 6, 495 (1999) 26. K. Galsgaard and I. Roussev, Astronomy and Astrophys. 383, 685 (2002) 27. A. Otto, J. Geophys. Res. 100, 11863 (1995) 28. M. Ugai and T. Shimizu, Phys. Plasmas 3, 853 (1996) 29. J. Schumacher, B. Kliem and N. seehafer, Phys. Plasmas 7, 108 (2000)
7
TableⅠ Characteristic values of mentioned parameters
Physical quantities* Notation Values Physical quantities Notation Values
Magnetic field B∞ 2.5×10⁻³ T Length L0 5.0×10⁶ m Density ρ∞ 3.35×10⁻¹¹ kg m-3 Velocity VA∞ 3.85×10⁵ m s-1
Temperature T∞ 2.5×10⁵ K Time t∞ 13.0 s
* NOTE—Observational values of physical quantities based on the TRACE EUV data and SOHO/MDI Observations. 14
8
FIGURES Fig. 1. Series of magnetic reconnection events occurred during the dynamic current sheet evolution. Magnetic filed lines are shown at t=40, 55, 80, 90, and 105, respectively (from the top to the bottom). Fig. 2. Temporal development of plasma velocity, temperature, and relative changes in mass density, (ρ - ρ0)/ρ0, are shown. The adjacent panels from top to bottom in each column are corresponding to those in Fig.1 at the five times.
(a) Velocity vector field
(b) Plasma temperature distribution (c) Relative mass density, (ρ - ρ0)/ρ0 Fig. 3. The August 16 1999 eruptions observed at EUV Fe IX/X 171Å by TRACE. Fig. 4. Temporal evolution of the total energy, Etotal, kinetic energy, Ekin, magnetic energy, Emag, and plasma thermal energy, Etherm, in the computational domain. Normalized by the total energy at t=0.
9
Fig.1; Fan
10
Fig.2 (a); Fan
11
Fig.2 (b); Fan
12
Fig.2 (c); Fan
13
Fig.3; Fan
14
Fig.4; Fan


![MSK CT PROTOCOL[2] - jefferson.edu · AC joint. SHOULDER Coronal Imaging Plane Coronal Imaging Plane •Prescribe coronal plane off of axial images parallel to supraspinatus muscle](https://img.pdfslide.us/doc/110x75/5d645f8588c9930e728b6075/msk-ct-protocol2-ac-joint-shoulder-coronal-imaging-plane-coronal-imaging.jpg)