Embed Size (px)
Citation preview
P a g e | 1
Simulation of Methanol Production from Synthesis Gas
Dr. Ruhul Amin, Imran Hassan, Avijit Das, RabetaYeasmin, Taslima Rahman, Tania Hossain
Department of Chemical Engineering
Bangladesh University of Engineering and Technology, Dhaka-1000, Bangladesh.
Abstract
An innovative process scheme to produce methanol from carbon monoxide and carbon dioxide is
here presented and accessed via simulation.In this configuration, the synthesis gas stream,
composed by CO, CO2, and H2 and fed to the methanol synthesis reactor, is produced by means
of a reverse-water–gas-shift by which a CO stream is partially converted in carbon dioxide.
A simulation model is applied to define the proper operating conditions to achieve synthesis gas
composition targets. The simulation results show that the plant configuration represents a
feasible way to produce methanol using carbon dioxide, competitively with the traditional
process in which the synthesis gas is produced by a natural gas steam reforming unit.From the
simulation, some graphs were plotted. These graphs showed the dependency of simulation on
variables (temperature, pressure etc).This were useful to understand the changes that will occur if
properties of each unit were changed. Since pilot plants are expensive for this type of case,
HYSYS gives us an opportunity to observe and realize the plant and the process happening
inside. From the plots, optimum conditions for methanol production are found to be reactor
temperature 200-300oC, reactor pressure 40-50atm.
Keywords:Methanol; Synthesis Gas; Production of methanol; Purification; Simulation; Recycling.
P a g e | 2
1. Introduction
Methanol, also known as methyl alcohol, wood alcohol, wood naphtha or wood spirits, is
a chemical with the formula C H 3O H . Methanol acquired the name "wood alcohol" because it
was once produced chiefly as a byproduct of the destructive distillation of wood. At room
temperature, it is a polar liquid, and is used as an antifreeze, solvent, fuel, and as
a denaturant for ethanol. It is also used for producing biodiesel via transesterification reaction.
From paints and plastics, furniture and carpeting, to car parts and windshield wash fluid,
methanol is a chemical building block used in making hundreds of products that touch our daily
lives.
Methanol is a light, colorless, flammable liquid at room temperature, and contains less carbon
and more hydrogen than any other liquid fuel. It is a stable biodegradable chemical that is
produced and shipped around the globe everyday for a number of industrial and commercial
applications. Methanol occurs naturally in the environment, and quickly breaks down in both
aerobic and anaerobic conditions. The methanol industry spans the entire globe, with production
in Asia, North and South America, Europe, Africa and the Middle East. Worldwide, over 100
methanol plants have a combined production capacity of about 100 million metric tons (33
billion gallons or 125 billion liters), and each day more than 180,000 tons of methanol is used as
a chemical feedstock or as a transportation fuel (60 million gallons or 225 million liters). The
global methanol industry generates $36 billion in economic activity each year, while creating
over 100,000 jobs around the globe.
Methanol is produced naturally in the anaerobic metabolism of many varieties of bacteria, and is
commonly present in small amounts in the environment. As a result, there is a small fraction of
methanol vapor in the atmosphere. Over the course of several days, atmospheric methanol
is oxidized with the help of sunlight to carbon dioxide and water. [1]
In a typical plant, methanol production is carried out in three steps. The first step is to convert the
feedstock natural gas into a synthesis gas stream consisting of CO, CO2, H2O and hydrogen. This
is usually accomplished by the catalytic reforming of feed gas and steam. Partial oxidation is
another possible route. The second step is the catalytic synthesis of methanol from the synthesis
gas. Each of these steps can be carried out in a number of ways and various technologies offer a
P a g e | 3
spectrum of possibilities which may be most suitable for any desired application. And, the final
step is distillation of the final product to obtain required product specification. [2][4]
Computer based simulation has been popular now-a-days for different chemical engineering
purposes. Though our task was to represent production of methanol in renowned aspen HYSYS
software, making some assumptions and using hypothetical reactors we have performed the
methanol production simulation. Though it does not give the real world performance or the real
life production environment, but it can give relief from making wide range of experiment
without making the small scale reactors or plant. Here, a short literature review of methanol
synthesis and its kinetics and modeling is presented. The simulators for the process are
developed based on the models from the literature. The simulators are used to evaluate the steady
state behavior of the process even though the mutual agreement about the reaction mechanism
has not been established and thus the reliability of the results cannot be evaluated. The evaluation
of the results will be carried out later when the applicability of the models found from the
literature will be studied with the process data.
P a g e | 4
2. Methodology
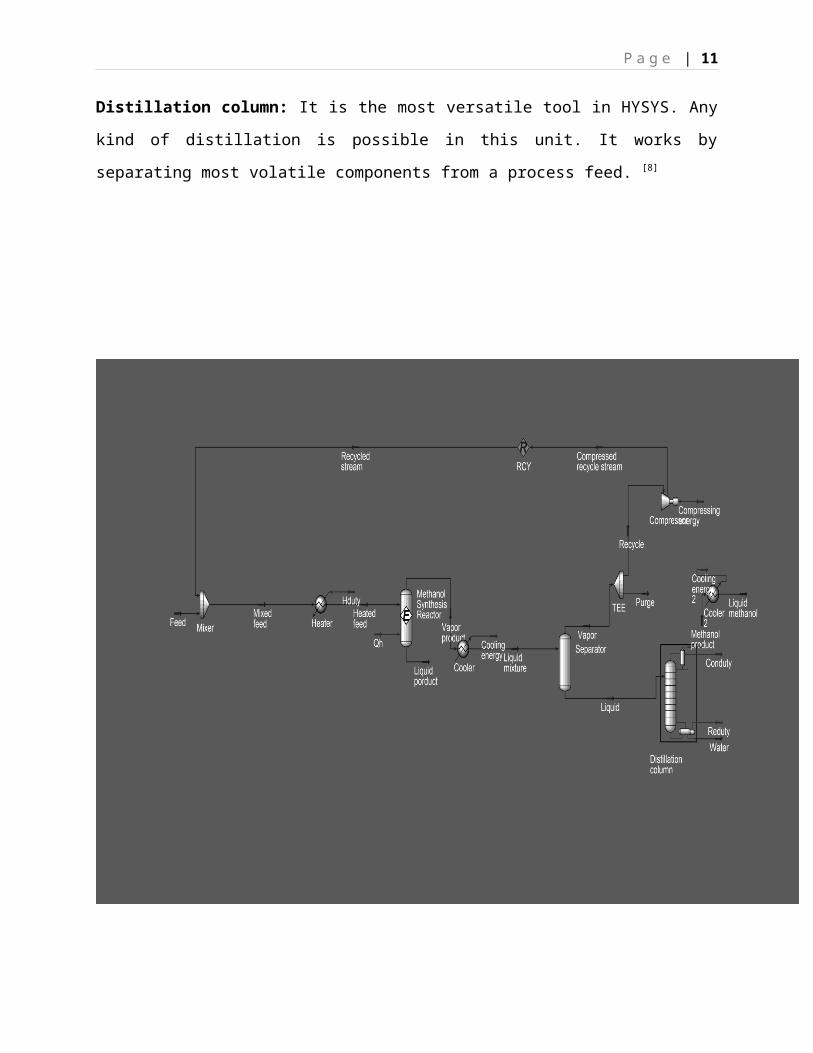
2.1 Process Description
The process chain for producing methanol is rather simple including the following phases
• Production of synthesis gas
• Conversion of synthesis gas to methanol and
• Distillation of the final product to obtain required product specification. [3]
2.2 Production of synthesis gas
Synthesis gas is a fuel gas mixture consisting primarily of hydrogen, carbon monoxide, and very
often some carbon dioxide. CO, CO2 and H2 produced from various sources through steam
reforming, partial oxidation, CO2 reforming or auto thermal reforming [Lovik 2001]. Originally,
synthesis gas for the production of methanol came from coal. Today, synthesis gas is most
commonly produced from the methane component in natural gas, because natural gas contains
hydrogen. Three processes are commercially practiced. At moderate pressures of 4 MPa (40 atm)
and high temperatures (around 850 °C), methane reacts with steam on a nickel catalyst to
produce synthesis gas according to the chemical equation:
CH4 + H2O → CO + 3 H2
This reaction, commonly called steam-methane reforming or SMR, is endothermic, and the heat
transfer limitations place limits on the size of and pressure in the catalytic reactors used. Methane
can also undergo partial oxidation with molecular oxygen (at atmospheric pressure) to produce
synthesis gas, as the following equation shows:
2 CH4 + O2 → 2 CO + 4 H2
This reaction is exothermic, and the heat given off can be used in-situ to drive the steam-methane
reforming reaction. When the two processes are combined, it is referred to as autothermal
reforming. The high pressures and high temperatures needed for steam-reforming require a
greater capital investment in equipment than is needed for a simple partial-oxidation process;
however, the energy-efficiency of steam-reforming is higher than for partial-oxidation, unless the
waste-heat from partial-oxidation is used. [5][6]
In methanol synthesis, either CO or CO2 or both hydrogenates to methanol. The reactions are
[Klier 1982]
P a g e | 5
CO + 2H2↔CH3OH (1)
CO2+ 3H2 ↔CH3OH + H2O (2)
Also the water gas shift reaction may occur [Skrzypek 1995].The water gas shift reaction is
CO + H2O → CO2 + H2 (3) [7]
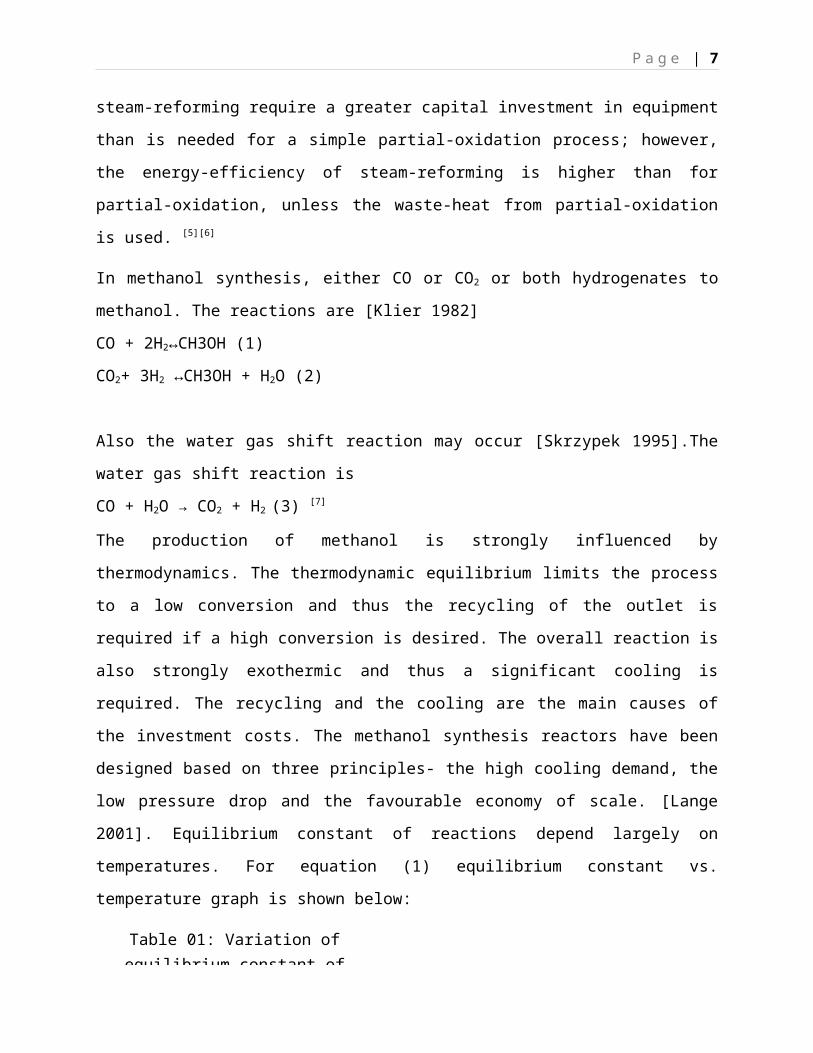
The production of methanol is strongly influenced by thermodynamics. The thermodynamic
equilibrium limits the process to a low conversion and thus the recycling of the outlet is required
if a high conversion is desired. The overall reaction is also strongly exothermic and thus a
significant cooling is required. The recycling and the cooling are the main causes of the
investment costs. The methanol synthesis reactors have been designed based on three principles-
the high cooling demand, the low pressure drop and the favourable economy of scale. [Lange
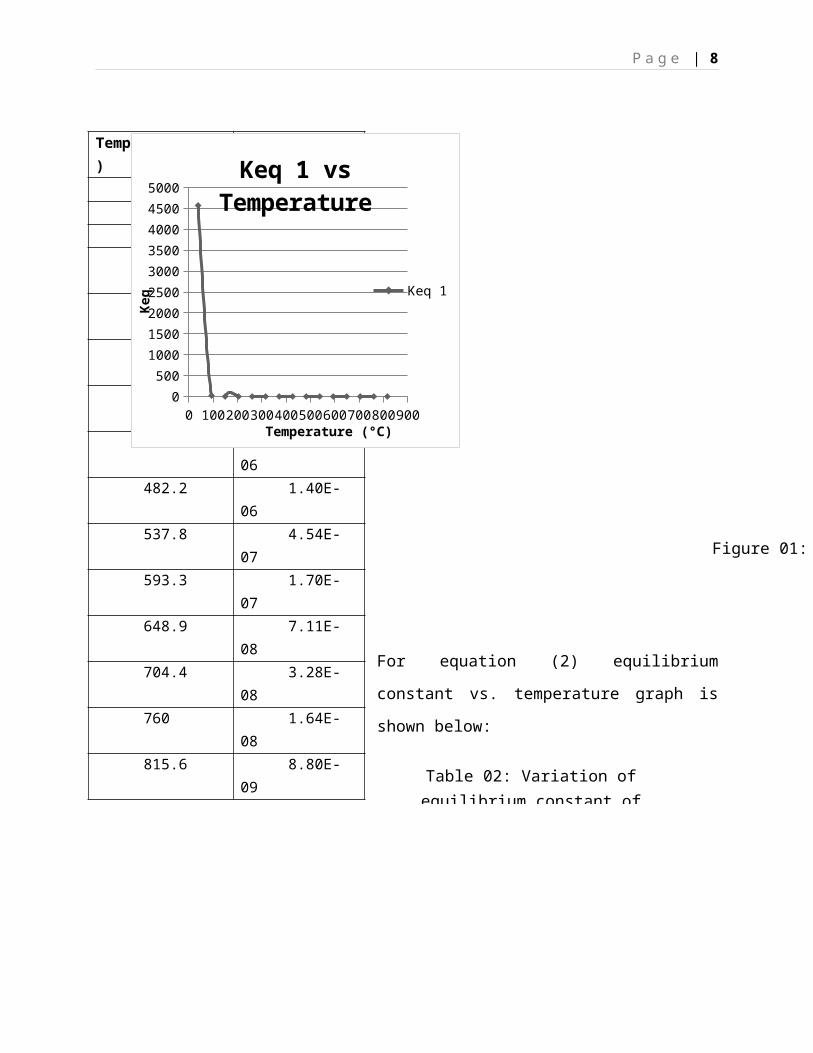
2001]. Equilibrium constant of reactions depend largely on temperatures. For equation (1)
equilibrium constant vs. temperature graph is shown below:
0 100 200 300 400 500 600 700 800 9000
500100015002000250030003500400045005000
Keq 1 vs Temperature
Keq 1
Temperature (°C)
Keq
Table 01: Variation of equilibrium constant of reaction 1 with temperature
Figure 01: Keq1 vs. Temperature plot
Temperature(°C) Keq 137.8 457493.3 20.5148.9 0.349204.4 1.44E-02260 1.11E-03315.6 1.34E-04371.1 2.29E-05426.7 5.09E-06482.2 1.40E-06537.8 4.54E-07593.3 1.70E-07648.9 7.11E-08704.4 3.28E-08760 1.64E-08815.6 8.80E-09
P a g e | 6
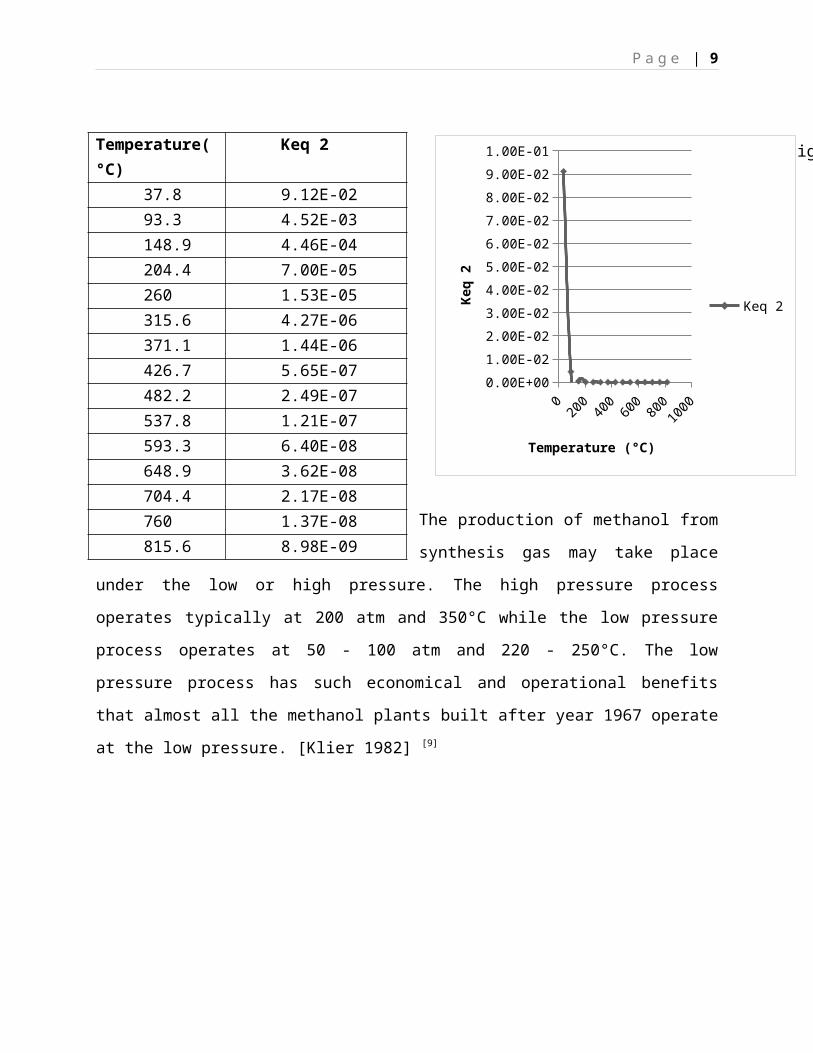
For equation (2) equilibrium constant vs. temperature graph is shown below:
The production of methanol from synthesis gas may take place under the low or high pressure.
The high pressure process operates typically at 200 atm and 350°C while the low pressure
process operates at 50 - 100 atm and 220 - 250°C. The low pressure process has such economical
and operational benefits that almost all the methanol plants built after year 1967 operate at the
low pressure. [Klier 1982] [9]
0 200 400 600 800 10000.00E+00
1.00E-02
2.00E-02
3.00E-02
4.00E-02
5.00E-02
6.00E-02
7.00E-02
8.00E-02
9.00E-02
1.00E-01
Keq 2
Temperature (°C)
Keq
2
Table 02: Variation of equilibrium constant of reaction 2 with temperature
Temperature(°C) Keq 237.8 9.12E-0293.3 4.52E-03148.9 4.46E-04204.4 7.00E-05260 1.53E-05315.6 4.27E-06371.1 1.44E-06426.7 5.65E-07482.2 2.49E-07537.8 1.21E-07593.3 6.40E-08648.9 3.62E-08704.4 2.17E-08760 1.37E-08815.6 8.98E-09
P a g e | 7
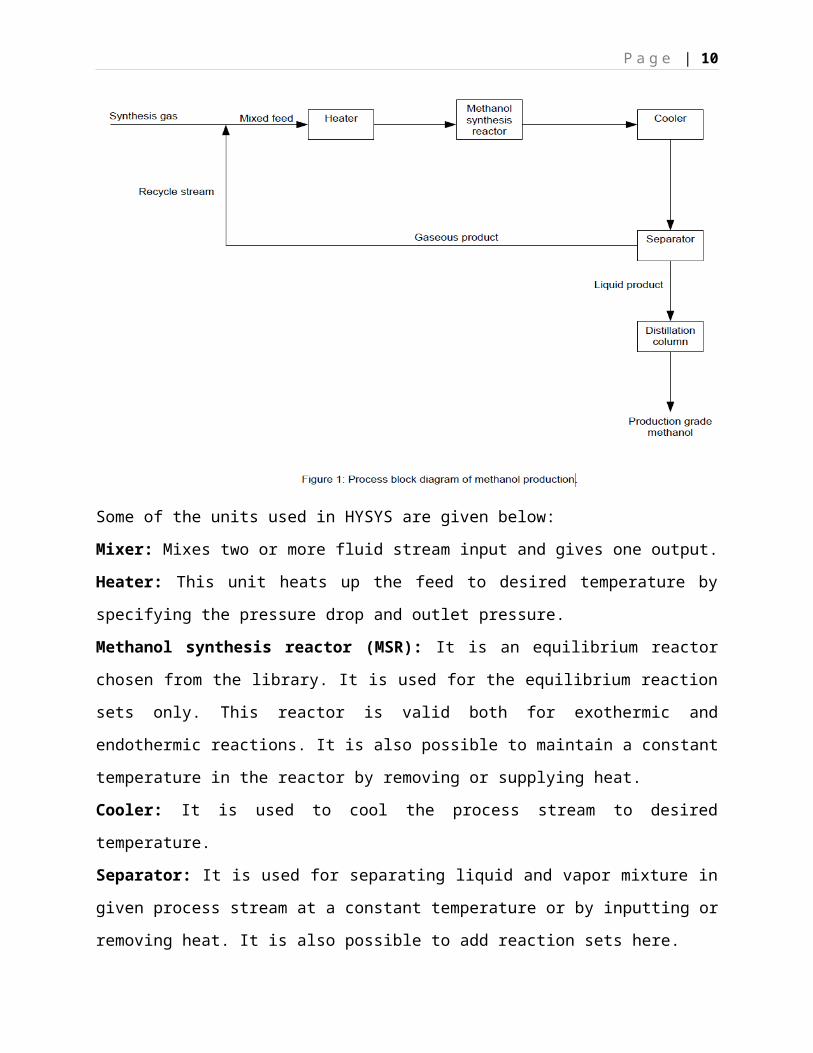
Some of the units used in HYSYS are given below:
Mixer: Mixes two or more fluid stream input and gives one output.
Heater: This unit heats up the feed to desired temperature by specifying the pressure drop and
outlet pressure.
Methanol synthesis reactor (MSR): It is an equilibrium reactor chosen from the library. It is
used for the equilibrium reaction sets only. This reactor is valid both for exothermic and
endothermic reactions. It is also possible to maintain a constant temperature in the reactor by
removing or supplying heat.
Cooler: It is used to cool the process stream to desired temperature.
Separator: It is used for separating liquid and vapor mixture in given process stream at a
constant temperature or by inputting or removing heat. It is also possible to add reaction sets
here.
Distillation column: It is the most versatile tool in HYSYS. Any kind of distillation is possible
in this unit. It works by separating most volatile components from a process feed. [8]
P a g e | 8
P a g e | 9
3. Result and Discussions
After performing the simulation we have found that the production of methanol (purity and production rate) depends on different parameters of the process. So by controlling these parameters optimum methanol production can be obtained. [11]
From the simulation result we have observed the effect of several parameters on production. Those effects are described in below-
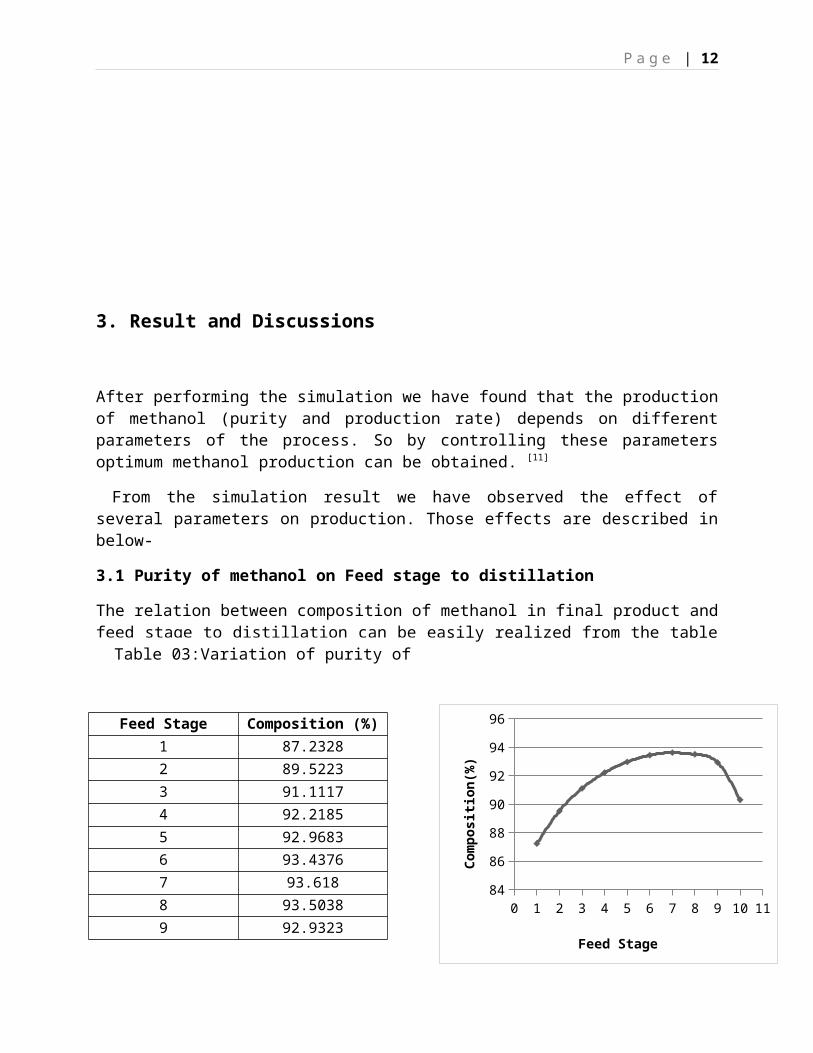
3.1 Purity of methanol on Feed stage to distillation
The relation between composition of methanol in final product and feed stage to distillation can be easily realized from the table and plot given below-
Feed Stage Composition (%)1 87.23282 89.52233 91.11174 92.21855 92.96836 93.43767 93.6188 93.50389 92.9323
10 90.3068
From the table and plot, it is observed that purity of methanol increases in higher feed stage from top and reaches at maximum and then again decreases. For this synthesis, optimum feed stage is 6th stage.
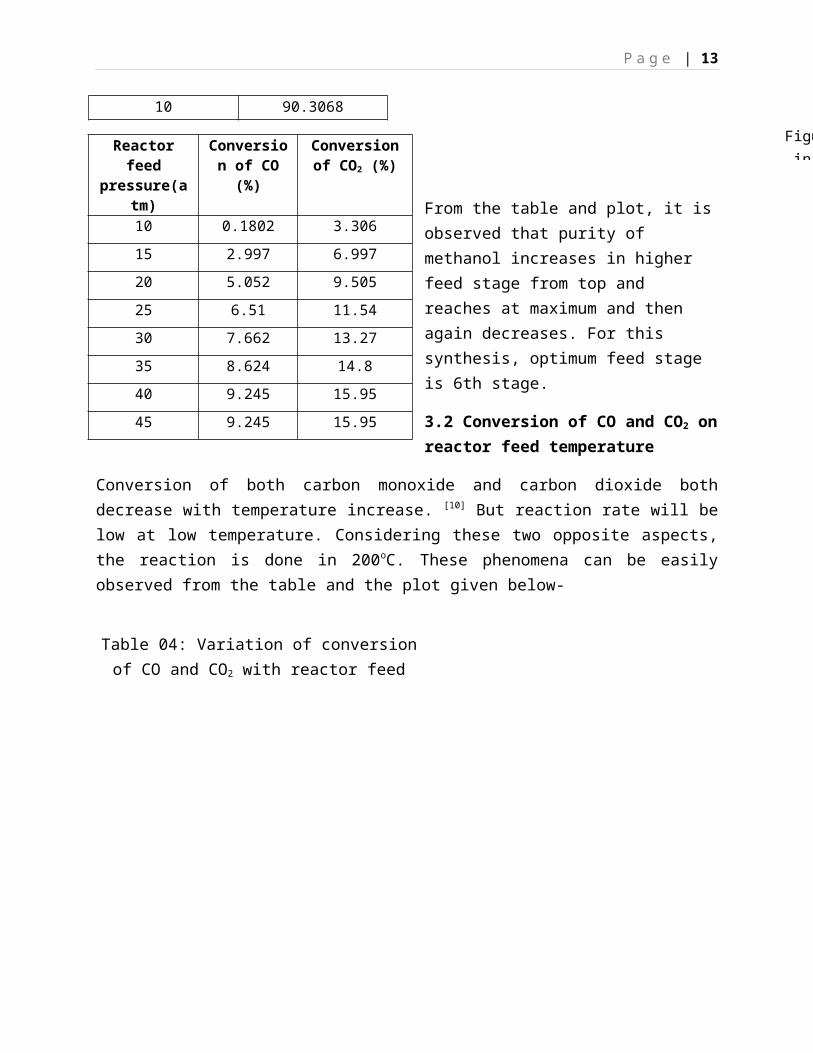
3.2 Conversion of CO and CO2 on reactor feed temperature
Conversion of both carbon monoxide and carbon dioxide both decrease with temperature increase. [10] But reaction rate will be low at low temperature. Considering these two opposite aspects, the reaction is done in 200oC. These phenomena can be easily observed from the table and the plot given below-
Figure03: Composition of methanol in product versus feed stage of distillation.
0 1 2 3 4 5 6 7 8 9 10 1184
86
88
90
92
94
96
Feed Stage
Com
positi
on(%
)
Table 03:Variation of purity of methanol with feed stage.
P a g e | 10
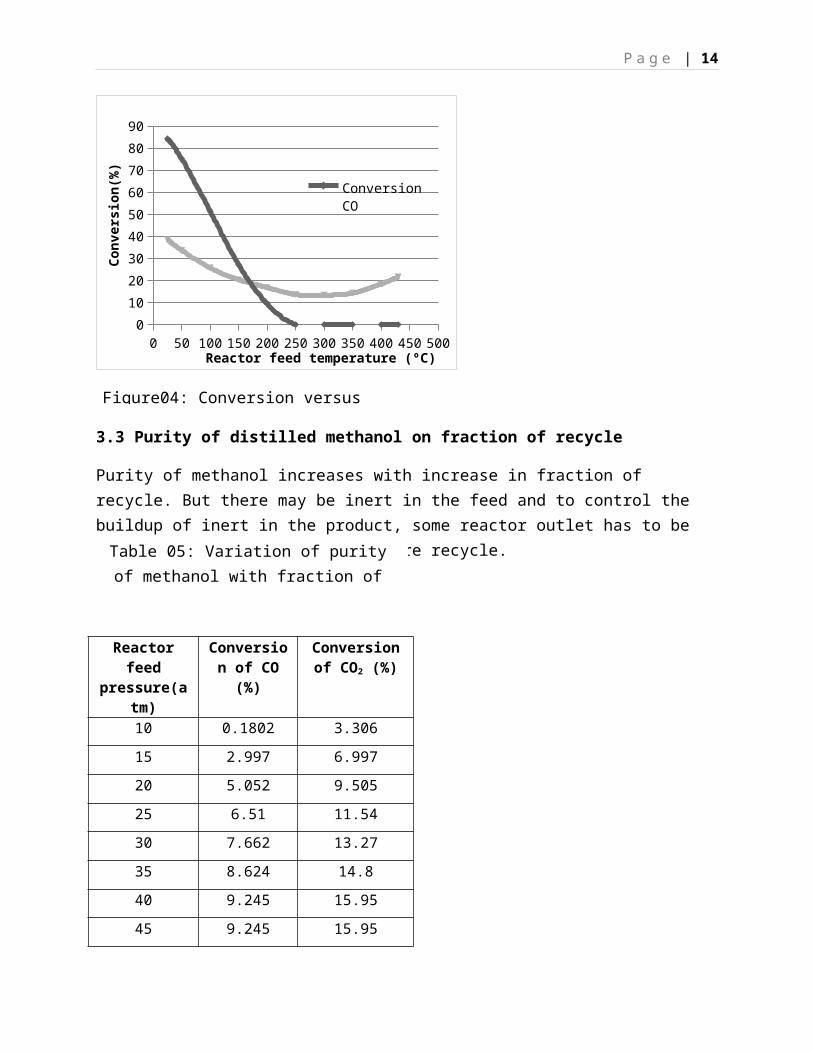
0 50 100 150 200 250 300 350 400 450 5000
10
20
30
40
50
60
70
80
90
Conversion COConversion CO2
Reactor feed temperature (ºC)
Conv
ersio
n(%
)
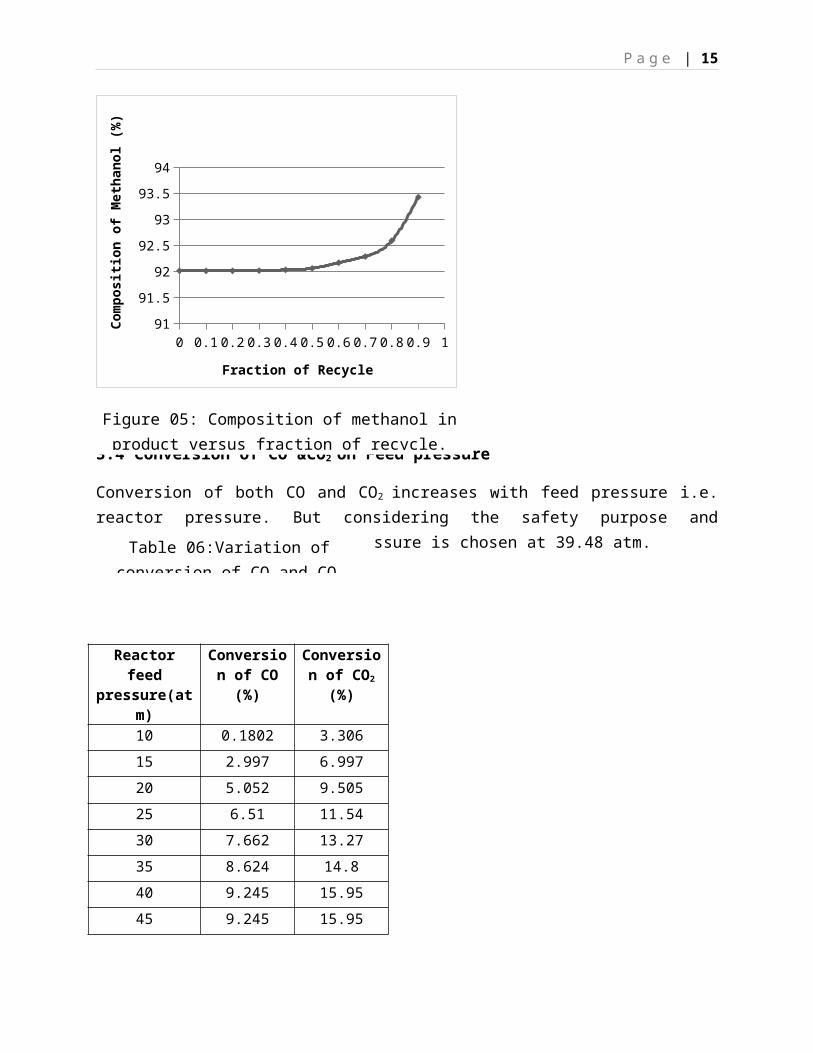
3.3 Purity of distilled methanol on fraction of recycle
Purity of methanol increases with increase in fraction of recycle. But there may be inert in the feed and to control the buildup of inert in the product, some reactor outlet has to be purged after separation and before recycle.
Table 05: Variation of purity of methanol with fraction of recycle.
Figure04: Conversion versus reactor feed
Table 04: Variation of conversion of CO and CO2
with reactor feed temperature.
Reactor feed pressure(atm)
Conversion of CO (%)
Conversion of CO2 (%)
10 0.1802 3.306
15 2.997 6.997
20 5.052 9.505
25 6.51 11.54
30 7.662 13.27
35 8.624 14.8
40 9.245 15.95
45 9.245 15.95
P a g e | 11
0 0.1 0.2 0.3 0.4 0.5 0.6 0.7 0.8 0.9 191
91.5
92
92.5
93
93.5
94
Fraction of Recycle
Com
positi
on o
f Met
hano
l (%
)
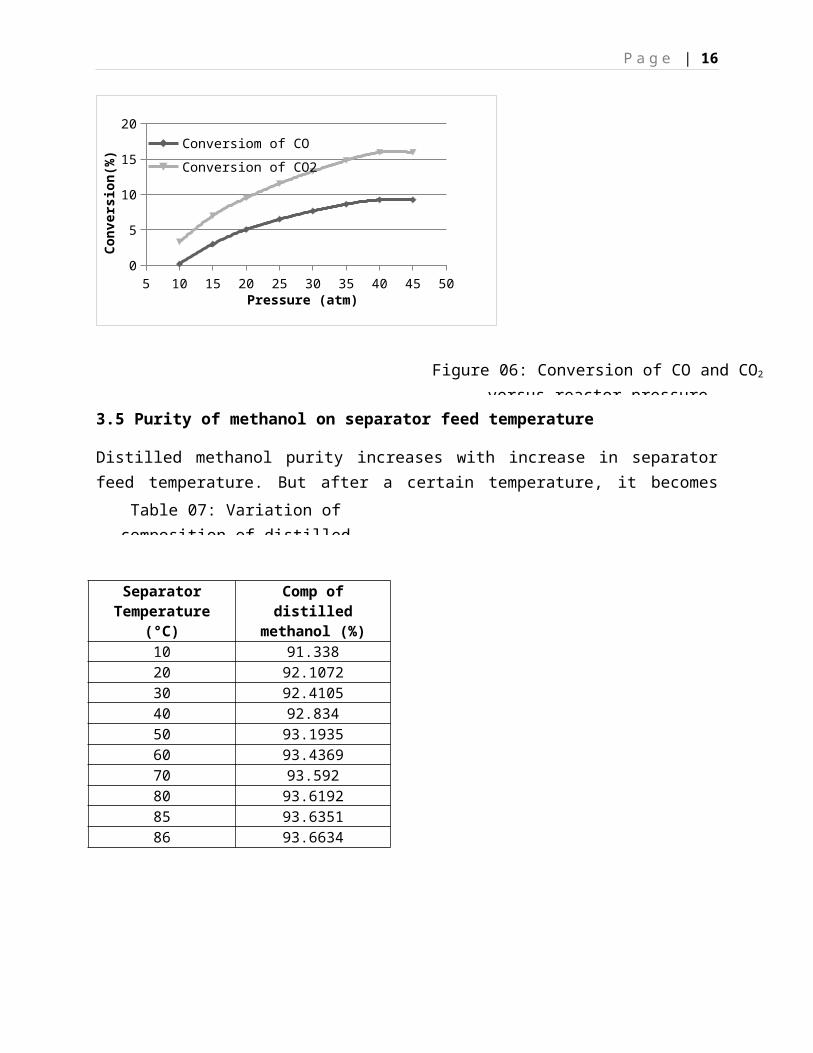
3.4 Conversion of CO &CO2 on Feed pressure
Conversion of both CO and CO2 increases with feed pressure i.e. reactor pressure. But considering the safety purpose and operational cost, optimum pressure is chosen at 39.48 atm.
Figure 05: Composition of methanol in product versus fraction of recycle.
Table 06:Variation of conversion of CO and CO2 with reactor pressure.
Reactor feed pressure(atm)
Conversion of CO (%)
Conversion of CO2 (%)
10 0.1802 3.306
15 2.997 6.997
20 5.052 9.505
25 6.51 11.54
30 7.662 13.27
35 8.624 14.8
40 9.245 15.95
45 9.245 15.95
P a g e | 12
5 10 15 20 25 30 35 40 45 5002468
1012141618
Conversiom of CO
Conversion of CO2
Pressure (atm)
Conv
ersio
n(%
)
3.5 Purity of methanol on separator feed temperature
Distilled methanol purity increases with increase in separator feed temperature. But after a certain temperature, it becomes constant.
Figure 06: Conversion of CO and CO2 versus reactor pressure
Table 07: Variation of composition of distilled methanol with separator temperature.
Reactor feed pressure(atm)
Conversion of CO (%)
Conversion of CO2 (%)
10 0.1802 3.306
15 2.997 6.997
20 5.052 9.505
25 6.51 11.54
30 7.662 13.27
35 8.624 14.8
40 9.245 15.95
45 9.245 15.95
P a g e | 13
0 10 20 30 40 50 60 70 80 90 10090
90.591
91.592
92.593
93.594
Separator temperature (°C)
Com
positi
on(%
)
Figure 07: Composition of distilled methanol versus separator feed temperature.
Separator Temperature (°C)
Comp of distilled methanol (%)
10 91.33820 92.107230 92.410540 92.83450 93.193560 93.436970 93.59280 93.619285 93.635186 93.6634
P a g e | 14
3.6 Methanol production rate on reactor feed temperature
Methanol production rate decrease with increase in reactor feed temperature.
Temperature,(°C) Production flow rate, (kgmole/hr)
25 222.750 217
100 204.6150 186200 161250 125.2300 75.89350 30.06400 5.32430 0.6258
3.7 Methanol production rate on Feed pressure
Methanol production rateincreases with feed pressure i.e. reactor pressure. But considering the safety purpose and operational cost, optimum pressure is chosen at 39.48 atm.
Table 08: Variation of methanol production with reactor feed temperature.
0 50 100 150 200 250 300 350 400 450 5000
255075
100125150175200225250
Methanol production rate vs. reactor feed tempera-
ture
Reactor feed temperature(ºC)
Met
hano
l pro
ducti
on ra
te(k
mol
e/hr
)
Figure 08: Methanol production rate versus reactor feed temperature.
Table 09: Methanol production rate with reactor pressure.
5 10 15 20 25 30 35 40 450
50
100
150
200
250
Production Rate vs. Feed Pressure
Feed Pressure (atm)
Prod
uctio
n Ra
te (K
mol
e/Hr
)
Figure 09: Methanol production rate versus feed pressure.
Pressure of Feed (atm) Production Rate (kmole/hr)
10 65.1615 142.920 174.225 191.130 203.435 211.336 212.937 216.238 213.739 216.640 217.1
P a g e | 15
4. Conclusion
Methanol synthesis is an important chemical process. In our paper, we have generated data based
on the simulation performed in HYSYS. This data can help us understand the process in different
situation in industrial practice. By varying the different parameters in this simulation
environment, the effects of these parameters on methanol production are observed and the results
are shown in graphical and tabular form. Using the plots, the optimum conditions for methanol
production can be easily found out.
P a g e | 16
References
1. Kurtz M., Wilmer H., Genger T., Hinrichsen O. and Muhler M. (2003) Deactivation of
supported copper catalysts for methanol synthesis.
Catalysis Letters, vol. 86, p. 77-80.
2. Lange J.-P. (2001) Methanol synthesis: a short review of technology improvements.
Catalysis Today, vol. 64, p. 3-8.
3. Lovik I. (2001) Modelling, estimation and optimization of the methanol synthesis with catalyst
deactivation. Doctoral thesis, Norwegian University of Science and Technology, 127p.
4. Yang R., Yu X., Zhang Y., Li W. and Tsubaki N. (2008) A new method of low temperature
methanol synthesis on Cu/ZnO/Al2O3 catalysts from CO/CO2/H2. Fuel, vol. 87, p.443-450.
5. Klier K. (1982). Methanol synthesis. Advances in Catalysis, vol. 31, p. 243-313
6. Skrzypek J., Lachowska M., Grzesik M., Słoczyński J. and Novak P. (1995) Thermodynamics
and kinetics of low pressure methanol synthesis. The Chemical Engineering Journal, vol. 58, p.
101-108.
7. VandenBussche K.M. and Froment G.F. (1996) A steady-state kinetic model for methanol
synthesis and the water gas shift reaction on a commercial Cu/ZnO/Al2O3 catalyst. Journal of
Catalysis, vol. 161, p. 1-10.
8. Tijm P.J.A.,Waller F.J. and Browne D.M. (2001) Methanol technology developments for the
new millennium.Applied Catalysis A: General, vol. 221, p. 275–282.
9. Gallucci F. and Basile A. (2007) A theoretical analysis of methanol synthesis from CO2 and
H2 in a ceramic membrane reactor. International Journal of Hydrogen Energy, vol. 32, p. 5050-
5058.
10. Graaf G.H. and Beenackers A.A.C.M. (1996) Comparison of two-phase and three-phase
methanol synthesis processes. Chemical Engineering and Processing, vol. 35, p. 413-427.
11. Felder R.M. And R.W. Rousseau (1939) Elementary principles of chemical processess, 3rd
edition,p. 592-595.