Embed Size (px)
Citation preview

Simulation of hot tears in castings
submitted in partial fulfilment of the requirements
for the degree of
Master of Technology (Manufacturing Engineering)
by
B.L.N Lohit Kumar (08310051)
Guide
Dr. B. Ravi
Department of Mechanical Engineering INDIAN INSTITUTE OF TECHNOLOGY BOMBAY
June 2010

i
Declaration of Academic Integrity
“I declare that this written submission represents my ideas in my own words and where
others' ideas or words have been included, I have adequately cited and referenced the original
sources. I also declare that I have adhered to all principles of academic honesty and integrity
and have not misrepresented or fabricated or falsified any idea/data/fact/source in my
submission. I understand that any violation of the above will be cause for disciplinary action
as per the rules of regulations of the Institute”
Date: Signature
Place: Name: B.L.N Lohit

ii
DISSERTATION APPROVAL SHEET
The dissertation entitled Simulation of hot tears in casting by B.L.N Lohit is approved for the degree of Master of Technology in Mechanical Engineering.
Examiners
Supervisors
Chairman
Date: Place:

i
Abstract Hot tearing is one of the most common and serious defects that occurs during the casting of
alloys. It remains a major problem despite decades-long efforts to develop working hot
tearing criteria and to implement those into casting process simulation programs. Hot
tearing is a phenomenon believed to occur during the last stage of solidification. Existing
models allow one to calculate the s t ress -strain and temperature in a casting and to
compare those with the chosen hot tearing criterion. In most successful cases, the
simulation shows the relative probability of hot tearing. None of the existing criteria,
however, can give the answer on whether the hot crack will appear or not and what will be
the extent of hot cracking (position, length, shape). This Project outlines the mechanisms
behind hot tear and tries to correlate the relationship between hot tearing tendency and
geometrical parameters. Initially, the currently available hot tearing criteria are compared.
Crack prone junctions L, T and C are simulated and a relation is correlated between the
tendency of hot tearing and geometrical parameters. The simulations obtained by a
commercial simulation program are compared with available experimental data and the
comparison is found to be good. Hardness of the mold is also one of the important factor, the
effect of which needs to be evaluated, as it results in additional stress in the castings. Gradual
thickness gradients and improved feeding help in decreasing hot tear tendency.
Keywords: Casting, Hot tearing, Simulation, Steel, Strain.

ii
Table of Contents
Abstract I
Table of Contents Ii
List of Figures V
List of Tables Vii
1 Introduction 1-3
2 Literature review 4- 36
3 Problem statement 37-39
1 .1 Hot tears initiation 1
1.2 Theories of hot tearing 3
2 .1 Mechanism of hot tears 4
2.2 Models predicting hot tear 14
2.2.1 Non mechanical criteria 14
2.2.2 Mechanical based criteria 17
2.2.3 Two phase modelling 26
2.3 Summaries of hot tear Mechanisms of hot tear development
30
2.4 Comparison of hot tearing Criteria 34
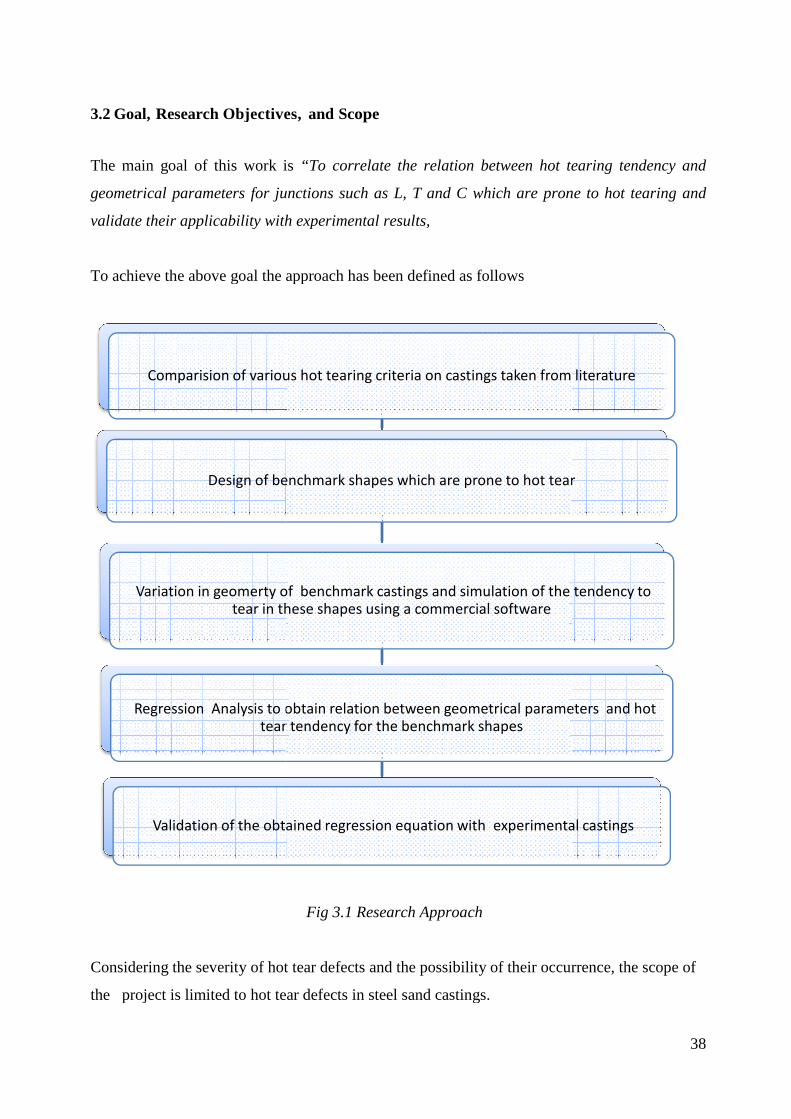
3.1 Motivation 37
3.2 Goal, Research Objectives, and Scope 38
3.3 Research approach 39
3.4 Organisation of report
39

iii
4 Comparison of hot tearing criteria 40-54
5 Benchmark shape and its analysis 56-66
6 Validation of simulation software 67-71
7 Virtual Experiments and Validation of regression equation 74-92
4.1 Criteria used for prediction 42
4.2 Analysis 1 43
4.3 Analysis 2 49
4.4 Summary 54
5.1 Benchmark shape 56
5.2 Analysis of Benchmark shape 57
5.3 Analysis of variations in Commercial software 61
5.4 Summary 66
6.1 Introduction 67
6.2 Hot Tear model in commercial software 68
6.2 .1 Case 1 68
6.2 .2 Case 2 70
6.2.3 Industrial casting 71
6.3 Summary 73
7.1 Variation of parameters in benchmark shape 75
7.2 Taguchi method for design of experiments 76

iv
8 Conclusions 91-92 8.1 Future scope 92
7.3 Regression analysis on benchmark shapes 80
7.4 Application of the equation on practical castings 86
7.5 Summary 90
Annexure I : Hot tear tendency data for benchmark shapes
93
Annexure II : Properties of steel used in simulation 97
References Acknowledgement
99 102

v
List of Figures
Figure Description Page
1.1 Hot tear in a specimen 2
2 .1 Appearance of Hot tears in Al-cu microstructure specimen 5
2.2 Radiography of Hot spot region showing extent of hot tearing 7
2.3 Mechanisms of film stage tearing 8
2.4 Different length scales of equiaxed dendritic solidification along with suggested hot tearing mechanisms
11
2.5 Summary of hot tearing Mechanisms 13
2.6 Graphical illustration of the method for determining the stress relief period tR and the vulnerable period
16
2.7 Schematic of a columnar grain structure that is used to determine the film thickness
19
2.8 Schematic diagram of the deformation of a semi-solid body due to a constant applied strain rate, for various total strains
20
2.9 Schematic view of the idealized microstructure for a semi – solid constrained liquid film stage in later mushy zone
21
2.10 Two types of temperature dependence of elongation to failure (εp) and linear shrinkage (εsh) in the semi-solid temperature range
22
2.11 Ductility of semi-solid alloys and strain caused by linear shrinkage and configuration of the Semisolid body
24
2.12 Schematics of the formation of a hot tear in between columnar dendrites as a result of a localized strain transmitted by the coherent dendrites below. The pressure in the interdendritic liquid is also indicated
28
2.13 Schematics of the mass balance performed at the scale of a small volume element over which liquid can enter through the vertical faces in order to compensate shrinkage and uniaxial deformation of the solid skeleton along the vertical direction
29
2.14 Schematic illustration of possible hot crack initiators and some crack propagation mechanisms
31
2.15 Fracture surfaces of hot tears in 200-mm round billet produced by DC casting at a casting speed of 200 mm/min (a) Al-1 pct Cu and (b) Al-3 pct Cu ( Eskin and Katergman, 2007).
32
3.1 Research Approach 38

vi
4.1 Approach to predict hot tear 41
4.2 Mg Al Casting geometry 43
4.3 Analysis 1(a) Modeling (b)Meshing (c) Temperature profile 46
4.4 Analysis 1 (a ) Hot tear prediction by RDG (b) Fuerer (c ) actual hot tearing
47
4.6 Stress calculated by LB Criteria 49
4.7 Geometry of steel casting 49
4.8 Analysis 2 (a) Modeling (b)Meshing (c) Temperature profile 52
4.9 Analysis 2 (a) Hot tear prediction by RDG (b) Fuerer (c ) actual hot tearing
53
4.10 Stress calculated by LB Criteria 55
5.1 Parameters of benchmark shapes L and T 56
5.2 Parameters of C shape 57
5.3 Variations in L shape 58
5.4 Variations in C shape 59
5.5 Variations in T shape 60
5.6 Thermal properties of H13 steel 60
5.7 Analysis of L junction in commercial simulation software 62
5.8 Analysis of T junction in commercial simulation software 63
5.9 Analysis of C junction in commercial simulation software 64
5.10 Geometrical shapes showing maximum tendency 65
6.1 (a) Geometry (b) Solid model (c) ProCAST Analysis 69
6.2 Actual hot tear in casting 70
6.3 Hot tear validation with industrial casting 71
6.4 (a) Casting model (b) Casting with feeders 72

vii
6.5 Comparison of actual hot tear location with simulation results
73
7.1 Overall approach 74
7.2 Experimental castings of L shape 87
7.3 Experimental Castings of T shape 88
7.4 Experimental Castings of C shape 89

viii
List of Tables Table Description Page
2.1 Hot tearing Mechanisms 12
2.2 Possible Mechanisms Acting within ‘‘Hot Tearing’ ’ Phenomenon 34
2.3 Summaries of Hot tearing criteria’s 36
4.1 Properties considered in thermo mechanical analysis of casting 44
4.2 Values for mg al alloy for RDG Braccini and LB criteria 45
4.3 Maximum value of pressure difference at nodes susceptible to hot tearing
48
4.4 Properties used for steel in thermo mechanical analysis 50
4.5 Property Values for steel alloy for rdg braccini and lb criteria 51
4.6 Maximum value of pressure difference at nodes susceptible to hot tearing –analysis 2
54
5.1 Variations in Geometry of benchmark L shape 57
5.2 Variations of geometry for T and C benchmark shapes 58
5.3 Input to commercial simulation software 59
5.4 Hot tear tendency values
61
6.1 Modules in simulation software 67
7.1 Variation map for L junction 75
7.2 P values in L shape 76
7.3 Level map for L shape and T shape 77
7.4 Design of Experiments for L and T shape 78
7.5 Design of Experiments for C shape 79
7.6 Values of hot tear tendency for experiments of L shape 80
7.7 Regression Table for L shape 82
7.8 Regression table for T shape 83

ix
7.9 Hot tear value for T shape 84
7.10 Regression values for C shape 85
7.11 Hot tear tendency values for C shape 86
7.12 Geometrical parameters and calculated hot tear values for L junction
87
7.13 Geometrical parameters and calculated hot tear values for T junction
88
7.14 Geometrical parameters and calculated hot tear values for C junction
89

1
Chapter 1
Introduction
Hot tears are identified as cracks, either on the surface or internally in the casting. These
cracks may be large and visible to the naked eye or small and found only by magnetic
particle inspection. They are caused by a combination of thermal effects, such as hot spot
size and casting restraint, such as cores in cylindrical castings. Metal composition can also
affect hot tearing tendency. Hot tearing in any casting is disastrous. Extensive rework is
required with the appearance of any small linear indication on the casting. Either design
or process changes will be proposed to eliminate this defect. However, even the
normal process fluctuations can cause random appearances of this defect during
production. It is possible that previous successful changes do not help eliminate future hot
tear problems. Once hot tears occur in castings, they must be repaired by welding or the
casting must be scrapped. A more fundamental understanding of hot tearing is important
when trying to eliminate this defect from any part or process.
1.1 Hot tear initiation
Solidification of alloys take place in a certain temperature range known as freezing
range, On decreasing temperature, the solid phase nucleates, grows in a form of grains and,
starting from a certain point in the solidification range, grains start to interact with each
other, first by feeling the presence of neighbours, then by contacting and bridging with them,
and finally by forming a continuous skeleton of the solid phase. Prior to configuration of
complete solid phase the acquisition of intrinsic properties such as strength and ductility
takes place.

2
During casting there is a considerable time during which the alloy consists of both solid
and liquid. The material in this semi-solid state is called mushy zone, during this period
the material experiences convection in the liquid region and deformation in the solid region,
convection in liquid region encounters large displacements with low stresses where as the
solid region suffers high stresses with low displacement. This radical different behaviour
accounts to tremendous change in viscosity, both these phenomenon occur in mushy zone
adding to its complexity the behaviour the deformation of the dendritic network depends on
its coherency state and the flow of liquid in now occurs in porous solid phase.
During solidification two major defects related to a lack of feeding can be encountered
in alloys: porosity and hot tears. The first defect is associated with a hydrostatic
depression in the mushy zone combined with segregation of gaseous solute elements
(hydrogen, nitrogen, and carbon monoxide). This depression is associated with the suction
of the liquid in the porous dendritic region due to shrinkage. The models developed for
the prediction of micro porosity formation are, therefore, based on the solution of an
equation coupled with a mass balance and a micro segregation model of gaseous
elements. The formation of hot tears is also linked to a lack of feeding in the mushy zone,
but only for specific regions where the dendritic network is submitted to shear or tensile
stresses. These stresses are induced by differential thermal contraction upon cooling.
Fig. 1.1: Hot tear in a specimen (Par and Weiliwu, 2003)

3
1.1 Theories of hot tearing
Hot tear is believed to be a fracture formed during solidification due to shrinkage and
hindered contraction and lack of feeding, and it initiates in the mushy zone. Hot
cracks or hot tear is one of the major defects in casting industry, because of the complex
mechanisms acting during the solidification of metals, the prediction of the hot
tearing phenomenon is not an easy task. The complex nature of mushy properties adds
additional difficulties when incorporating these in a hot tearing model. However several
attempts have been made to study and predict hot tear that have resulted in development
of several mechanisms predicting hot tear. Earlier criteria were based on stress or feeding
activity (Eskin et al., 2004). Other criteria combining both mechanical and non mechanical
aspects were proposed recently and include several parameters, which are complex in
formulation and implementation in FEM simulations. In spite of so many models being
predicted the accuracy of them is at stake, several researches have compared all the
available criteria and listed the pros and cons in each of them, if the criteria are
used qualitatively, considering that constitutive and fracture data of the mushy zone are
not well known, Only Rappaz-Drezet-Gremaud (RDG)’s criterion might be of value
(Eskin et al., 2004), However Rappaz-Drezet-Gremaud (RDG) c r i t e r ion has many
limitations in its assumptions (Rappaz et al., 1999), and the usage of this criterion for
direct chill casting still remains a question. All these criteria mostly looked upon the
thermo physical properties of the castings and crack initiation and very few theories
concentrated on crack propagation and importance of geometrical parameters.
This project mainly concentrates on correlating the relation between geometric parameters
and hot tearing tendency. For this purpose simpler geometric shapes which are prone to hot
tear are taken and simulated in commercial simulation software. Initially the available hot
tear criteria which predict the occurrence of hot tear were compared on experimental
castings taken from literature.

4
Chapter 2
Literature Review
The transition of liquid to solid is made more complicated for an alloy because the presence
of the mushy zone somehow “mixes” the two behaviours: the deformation of the dendritic
network strongly depends on its coherency state and the flow of liquid now occurs in a porous
solid phase and the physics of hot tear occurrence is also pretty complex.
2.1 Mechanism of hot tear
Hot tearing is recognized as one of the most common and serious defects found in
castings. The typical appearance of hot tearing in the microstructure (Fig.2.1) with a filled
hot tear in an Al-10%Cu alloy (Par and Weiliwu, 2003). The importance of studying and
understanding the occurrence of hot tears in alloys has long been recognized. Various
methods have been used to test and evaluate the severity of hot tears and its related
properties and several theories have attempted to explain their occurrence. From many studies
starting in the 1950s, and reviewed by Novikov and Sigworth (D.G. Eskin et al., 2004), it
appears that hot tears initiate above the solidus temperature and propagate in the
interdendritic liquid film. These results in a bumpy fracture surface covered with a smooth
layer. In DC casting, the name ‘‘mushy zone’’ is misleading, as its top part is actually a
slurry, because the newly formed grains are still suspended in the liquid. Only after the
temperature has dropped below the coherency temperature that is the temperature at which
grain starts interacting, a real mush is formed. The deformation behavior of the mush is very
critical for the formation of pores or hot tears. During solidification, the liquid flow through
the mushy zone decreases until it becomes insufficient to fill initiated cavities so that they
can grow further.

5
Fig. 2.1: Appearance of hot tears in Al-Cu microstructure specimen
(Par and Weiliwu, 2003)
The solidification process can be divided into four stages, based on the permeability of the
solid network.
1. Mass feeding in which both liquids and solids are free to move.
2. Interdendritic feeding, in which the remaining liquid has to flow through the
dendritic network after the dendrites have formed a solid skeleton. A pressure gradient
may develop across the mushy zone by solidification shrinkage occurring deeper in
the mushy zone. However at this stage the permeability of the network is still large
enough to prevent pore formation.
3. Interdendritic separation, in which the liquid network becomes fragmented and
pore formation or hot tearing may occur. With increasing solid fraction, liquid is isolated
in pockets or immobilized by surface tension, also when the permeability of the solid
network becomes too small for the liquid to flow, further thermal contraction of the
solid will cause pore formation or hot tearing.
4. Interdendritic bridging or solid feeding, in which the ingot has developed a
considerable strength and solid-state creep compensates further contraction. At the final
stage of solidification fS (fraction of solid) > 0.9, only isolated liquid pockets remain
and the ingot has a considerable strength. Solid-state creep can now only compensate
solidification shrinkage and thermal stresses.

6
The last two stages are mainly considered (Quack, 1996), since in slurry and during the
interdendritic f eed ing stage in the mush feeding is usually sufficient to avoid any
casting defects. It is mainly the ‘‘interdendritic separation’’ stage in which the ingot is
vulnerable to hot tearing. A large freezing range alloy promotes hot tearing since such an
alloy spends more time in the vulnerable state in which thin liquid films exist between the
dendrites. Apart from these intrinsic factors, the solidification shrinkage and thermal
contraction impose strains and stresses on the solid network, which are required for the
occurrence of hot tearing. It is argued that it is mainly the strain and the strain rate,
which are critical for hot tearing, Stresses do not seem critical as the forces available
during solidification are very high compared to the stresses a semi-solid network can
resist.
A lot of efforts have been devoted to understand the hot tearing phenomenon. The
compilation of research in this field has been done by Novikov and Sigworth, (Zheng et
al., 2001) reviewed the possible causes of hot tearing. (Eskin et al., 2004) have reported
that at low strain rates the grain boundary sliding is the main mechanism of deformation
o f a semi solid body. The load applied to the s e m i -solid body will be accommodated by
a grain boundary displacement that is lubricated by liquid film surrounding the grain.
Prokhorov proposed a model for deformation of the semi-solid body. If two tangential
forces s1 and s2 are applied to the equilibrium semi-solid body, the response of the body
manifests itself as the grain movement and at some point the grains will touch each
other. The liquid covering the grain will circulate to the lowest pressure point.
Further deformation will be possible if the surface tension and resistance to liquid flow
are sufficient to accommodate the stress imposed. If not, a brittle intergranular fracture or
hot tearing will occur. In relation to this theory, Prokhorov postulated that:
1. An increase in film thickness increases the fracture strain
2. A decrease in grain size increases the fracture strain
3. Any non -uniformity of grain size decreases the fracture strain

7
Based on this theory, (Prokhorov, 1962) the main measure for hot tearing is the ductility
of the semi-solid body. A hot tear will occur if the strain of the body exceeds its
ductility. A theory of shrinkage-related brittleness divides the solidification range into
two parts. In the upper part the coherent solid-phase network does not exist. Cracks or
defects occurring in this stage can be healed by liquid flow.
As the solidification progresses and the solid fraction further increases, at a certain stage
or a certain solid fraction a coherent network is formed resulting in fragmentation of the
liquid network and increasing the chances of pore formation. This stage is considered as the
start of linear shrinkage. Since the coherence point, there is a stress called the shrinkage
stress which is imposed onto the semisolid body. The semi-solid body is now under
the influence of these stresses, Fracture or hot tearing occurs if the shrinkage stress
exceeds the rupture stress.
Fig. 2.2: Radiography of Hot tear region showing of hot tearing (Davidson et al., 2003)

8
Pellini suggested a hot tearing theory based on the strain accumulation with the
following main features:
• Cracking occurs in a hot spot region
• Hot tearing is a strain-controlled phenomenon which occurs if the accumulated strain
of the hot spot reaches a certain critical value.
• The strain accumulated at the hot spot depends on the strain rate and time required
for a sample to pass through a film stage (Pellini, 1952).
The most important factor of hot tearing based on this theory is the total strain on the hot
spot region. The total strain is the additive of strain over a period with in which the hot
spot exists. Taking into account that the highest strain accumulates in the liquid film,
Although Pellini mentions a critical value of the accumulated strain, it is not clear whether
it is ductility or another entity. Based on the f i lm-strain theory on hot tearing formation
by Pellini (Pellini, 1952), hot tearing susceptibility generally develops in the mushy zone
at liquid fractions below 10%. It only occurs when stresses exceeding its strength and
ability to deform in the hot tearing temperature range are produced in the metal (in fig.
2.3). While the hot zone is narrow and exists as only a thin film, its strength is inadequate
to withstand the accumulated strain.
(a) (b) (c)
Fig. 2.3: Mechanisms of film stage tearing (Par and weiliwu, 2003)

9
This may be enough to cause hot tearing in the weak liquid film. The three stages are
shown in Fig.2.3.
(a) Solid nuclei together with considerable liquid metal. Hot tearing is not possible at this
stage
(b) Crystals separated by thick liquid film.
(c) Stage just before solidification, thin liquid films separate crystals. The developed strain
concentrations was sufficient to hot tearing
Pellini’s theory is a basis for a hot tearing criterion proposed by (Clyne and Davis, 1979).
Some authors suggest that it is not the strain but the strain rate which is the critical
parameter for hot cracking. More recently, a strain-rate based hot tearing criterion is
proposed by (Rappaz et al., 1999) yet another approach to the hot tearing
phenomenon is the assumption that failure happens at a critical stress. The liquid
surrounding the grain is considered as a stress riser of the semi-solid body (William and
Singer, 1979). In this theory, a liquid-filled crack is considered as a crack initiation. The
propagation of the crack initiator is determined by the critical stress. The critical stress is
mostly determined using the modified Gri f f i th energy balance approach. The
modi f icat ion of the Gri f f i th approach is particularly in accounting for the effect of
plasticity as proposed by (Rowan and Murray, 1950).
Another approach within the fracture mechanics theory is proposed by (Sigworth, 1996)
who considers a possibility of applying a liquid-metal-embrittlement concept to the hot
tearing case. There is also a group of hot tearing theories that consider the hindered feeding
of the solid phase by the liquid as the main cause of hot tearing. Niyama and Feurer use this
approach to derive the hot tearing criterion. Based on this theory, the hot tear will not occur
as long as there is no lack of feeding during solidification. Clyne and Davies give more
attention to the time spent in the mushy state (Eskin et al., 2004). The last stage of
solidification is considered as most susceptible to hot tearing. However, on further
decreasing of the liquid fraction the bridging between adjacent dendrites is established
so that the interdendritic separation is prevented.
10
Several hot tearing criteria have been developed in the past decades. Feurer used the fluid
flow through a porous network to calculate the after feeding by liquid metal. Hot tears
will initiate when this after feeding cannot compensate the solidification shrinkage (Feurer,
1977).
Clyne and Davies defined a cracking susceptibility coefficient (CSC) as the ratio
between the time tV during which the alloy is prone to hot tearing and the time tR during
which stress relaxation and after feeding can take place. These times are defined as the
periods during which the fraction liquid is between 0.1 and 0.01 and between 0.1 and
0.6 respectively. These criteria were combined with a heat flow model describing the
DC casting process by Katgerman. This enabled the determination of the cracking
susceptibility coefficient as a function of the casting parameters. Unfortunately, the above
criteria are restricted in their use because they give only a qualitative indication for the hot
tearing susceptibility (Katergman, 1982).
The first two-phase model, which takes into account both fluid flow and deformation of
the solid network, is the Rappaz–Drezet–Gremaud (RDG) hot tearing criterion (Rappaz et
al., 1999). This criterion is formulated on the basis of after feeding, which is limited by the
permeability of the mushy zone. At the solidification front the permeability is high but
deeper in the mushy zone the permeability is restr icted. A pressure drop along the
mushy zone exists which is a function of this permeability and the strain rate. If the
local pressure becomes lower than a critical pressure, a cavity is initiated. The model is
implemented in a thermo mechanical model for direct chill casting to predict hot tearing
during billet casting. The hot tearing susceptibility is found higher during start-up of the
casting and in the centre of the billet, which agrees with general casting practice. A further
development of this criterion is carried out by (Braccini et al., 2000). They included
plastic deformation of the solid phase and a criterion for the growth of a cavity. They base
their model on two geometric models, one for a columnar dendritic and one for an
equiaxed dendritic structure. Explicit relations are developed for critical strain rates and
they indicate that the critical strain rate decreases with increasing solid fraction.

11
Above the coherency temperature, liquid still present in between the dendrites is
continuous, since the solid dendrite arms have not yet coalesced. Deformation induced by
thermal stresses can, therefore, pull these arms apart quite easily. If the interdendritic liquid
flow can feed such regions, almost nothing is noticed, except may be some local inverse
segregation (‘‘healed’’ hot tears). However, deep in the mushy zone, where the permeability
of the mush is very small, an opening of the non coherent dendritic network by tensile
deformation cannot be compensated for by the liquid and hot tears form (Rappaz et al.,
1999). It is obvious that the actual hot tearing mechanism includes phenomena occurring
on two scales: microscopic (crack nucleation and propagation, stress concentration,
structure coherency, wet grain boundaries) and mesomacroscopic (lack of feeding, stress,
strain, or strain rate imposed on the structure). Fig. 2.4 illustrates these scales during
equiaxed dendritic solidification (Eskin and katergman, 2007). All t he mechanisms
mentioned do no t t ake nucleation completely into account. Table 2.2 summarizes
different approaches of researches across the world.
Fig. 2.4—Different length scales of equiaxed dendritic solidification along with suggested hot tearing mechanisms (Eskin and katergman, 2007)

12
Table 2.1 Hot tear mechanisms
Mechanisms and conditions
Suggested and developed by
Year
Causes of hot tearing Thermal Contraction Hein
Dobatkin Pellini
1935 1948 1952
Nucleation Liquid film or pore as stress Concentrator
Patterson et al. Niyama Rappaz et al. Braccini et al Suyitno et al
1953 1977 1999 2000 2002
Oxide bi-film entrained in the Mush Vacancy clusters at a grain boundary or solid/liquid interface
Campbell Fredriksson et al
1999 2005
Propagations Through liquid film by sliding By liquid film rupture By liquid metal embrittlement
Patterson Williams and Singer Novikov and Novik Pellini Patterson Saveiko Dickhaus Novikov &Sigworth
1953 1960 1963 1952 1953 1961 1994 1966
Conditions Thermal strain cannot be accommodated by liquid flow and mush ductility Pressure drop over the mush reaches a critical value for cavity nucleation Strain rate reaches a critical value that cannot be compensated by liquid feeding and much ductility Stresses and insufficient feeding in the vulnerable temperature range
Pellini Prokhorov Novikov Magnin et al Niyama Guven and Hunt Rappaz et al. Farup and Mo Pellini Prokhorov Rappaz et al. Braccini et al. Bochvar; Lees Clyne and Davies Feurer Kargerman
1952 1962 1966 1996 1977 1988 1999 2000 1952 1962 1999 2000 1942;1946 1975 1977 1982

13
Fig. 2.5: Summary of hot tearing Mechanisms (Eskin and katergman, 2007)
Figure 2.5 also shows that the conditions and causes of hot tearing can be considered on
different length scales, from macroscopic to microscopic. It is worth to note that most of
the existing hot tearing criteria deal with the conditions rather than with the mechanisms
of hot tearing. As suggested by Table 2.1 One can see that, over the years, much more effort
has been put on the conditions required for hot tearing occurrence rather than on the
mechanisms of crack initiation and propagation, different macroscopic and mesoscopic
parameters, such as stress and strain, were considered as critical for the development of hot
tearing. Today, the mesoscopic strain rate is believed to be the most important factor and
some modern models are based on it. The physical explanation of this approach is that
semisolid material during solidification can accommodate the imposed thermal strain by
plastic deformation, diffusion-aided creep, structure rearrangement, and filling of the gaps and
pores with the liquid. All these processes require some time, and the lack of time will result
in fracture. Therefore, there exists a maximum strain rate that the semisolid material can
endure without fracture during solidification (Eskin and katergman, 2007).

14
2.2 Models predicting hot tear
Due to the complexity of the mechanisms involved in hot-tearing formation, the
models developed so far are relatively simple. Most of them are based upon the
consideration of the solidification interval, the existing hot tear ing c r i te r i a , as
reviewed elsewhere, (Hisami et al., 2008) can be conditionally divided into the two
categories: non mechanical and mechanical. The former type of criteria deal with the
vulnerable temperature range, phase diagram, and process parameters, and is represented
by the criteria of Cline and Davies, Feurer and Waterman. The latter type of criteria
involves critical stress critical strain or critical strain rate (Skin and waterman, 2007).
Different casting processes impose specific requirements on the application of hot tearing
criteria. That is why some criteria work better for shape casting, whereas others are more
suitable for direct-chill casting.
2.2.1 Non mechanical criteria
A non mechanical criterion only concentrates on feeding and shrinkage during
solidification. This methodology assumes that hot tearing occurs due to the lack of feeding.
a) Feurer criteria
Feurer’s theory of hot tearing (Feurer, 1977) is a non mechanical criterion that
focuses on feeding and shrinkage during solidification. This approach considers that hot
tearing occurs due to lack of feeding, which is related to the difficulties of the fluid flow
through the mushy zone as a permeable medium competing with solidification
shrinkage (Skin et al., 2004). Feurer considers two terms, SPV and SRG, indicating
maximum volumetric flow rate (feeding term) through a dendrite network and
volumetric solidification shrinkage, respectively. Feurer’s criterion states that hot
tearing is possible if:
SPV < SRG (1)

15
The maximum volumetric flow rate per unit volume through the semisolid dendritic network is formulated as follows,
SPV =����
������ (2)
Ps= Pm +P0=Pc (3) Pm = ρgh (4) ρ = ρSfs+ρlf l (5)
Pc = � ��
�� (6)
where PS, L, c and ( in equation (2) are liquid volume fraction; secondary dendrite arm
spacing; effective feeding pressure; length of porous network that is determined as the
distance between the location at coherency and solidus temperature; the tortuosity
constant of the dendritic network; the viscosity of the liquid phase; respectively. ϒSL is the
solid liquid interface energy; p is the average density of the mush; g is the gravity
constant; h is the distance to the melt surface ρl and ρs are densities of the liquid and solid,
f l and fs are the liquid and the solid volume fractions in the dendrite network, and PO, PM,
and PC are atmospheric, metallostatic, and capillary pressure, respectively. The volumetric
solidification shrinkage is caused by the density difference between solid and liquid phase.
Further the shrinkage velocity is given by
� �� �
�� = = ��
���� (7)
where V is the volume element of the solidifying mush with constant mass and t is time.
The hot cracking susceptibility based on Feurer’s criterion considers SPV is equal to SRV
for the liquid fraction of f:l .

16
b) Clyne and Davis criteria
The hot tearing criterion proposed by Clyne and Davies is based on the theory that in
the last stage of freezing, the liquid is difficult to move freely so that the strain applied
during this stage cannot be accommodated by mass feeding. This last stage of
solidification is considered as the most susceptible to hot tearing (Suyitno et al., 2005).
However on further decreasing of the liquid fraction, bridging between adjacent dendrites
is established so that intedendritic separation is prevented. The cracking susceptibility
coefficient proposed by Clyne and Davies is formulated as the ratio between the vulnerable
time period (hot tearing susceptibility) tr and time available for stress relief process (mass
feeding and liquid feeding) tv:
H.C.S = ����
=����������� ��� (8)
where t0.99 is the time when the volume fraction of solid, fs, is 0.99, t0.9 is the time when fs is
0.9, and t0.4 is the time when fs is 0.4 (Clyne and Davis, 1979).
Fig 2.6 Graphical illustration of the method for determining the stress relief period tR and the vulnerable period (tV) (Skin et al., 2004).

17
c) Katergmans criteria
In Katgerman model, theoretical considerations of (Clyne and Davies, 1979) and (Feurer,
1977) are combined. The model defines the hot tearing index, HCS, as follows:
H.C.S = ���� = ��.����� !
�"���� ! (9)
Where H.C.S is hot criteria susceptibility, tcoh is the time when fs is at the coherency point,
and tcr is the time when feeding becomes inadequate that is determined by using Feurer’s
criterion and is the time for which
SPV = SRG (10)
2.2.2 Mechanical based criteria
A mechanical criteria emphasis only on deformation of the mushy zone rather than on
shrinkage effects of the mushy zone, they are basically stress and strain criteria developed
on the basis of failure of the region where crack induces
a) Stress based criteria
The stress-based criteria of hot tearing are based on the viewpoint that a semisolid body
will fracture if the applied or induced stress exceeds the strength of the body. The first type
of these hot tearing criteria accounts for the fact that a material has a limit stress at which
it fails. This approach can be subdivided into two sets of criteria. The first set is based on
the strength of bulk material and the second set, on the strength of a liquid film trapped
between grain boundaries. Within the second type of stress-based criteria, the hot tearing
susceptibility is derived from an assumption that the material contains defects or the
weakest point, and whether they will be a fracture or not depends on such parameters as:
stress, defects dimensions, configuration etc. Although it is rather difficult to get certain
material property that is comparable to the fracture toughness of solid materials, then idea

18
of applying the fracture mechanics theory would be an interesting topic particularly within
the framework of development of micro-mechanics. A stress-based hot tearing criterion that
uses the strength of liquid trapped between grain boundaries criteria is reported by
Novikov (Dickhaus et a1.,1994).They refer to the stress needed to pull apart two parallel
plates separated by a thin liquid film as to the strength of semi-solid metals. The
assumptions that are applied in this model are the uniform distribution of liquid and no
influence of sliding on the fracture strength. This criterion is expressed as:
#�$ = � % (11)
where # fr i s the fracture stress, ϒ is the surface tension; and b is the film thickness.
The constraints of this model are the negligible viscosity and wetting angle. To overcome
this constraint, (Dickhaus et al., 1994) promote a model proposed by Healy that involves
the viscosity. The separation force of the parallel plates of radius R separated by a liquid
film is given as follows,
Where &' = (�)�*� ( �
%��− �
%�� ) (12)
Where Fz is the force required to increase the film thickness from b1 to b2; i is the
dynamic viscosity; R is the radius of a plate; and t is the time required to increase the film
thickness from b1 to b2. The film thickness is calculated based on Fig. 2.7. Here; the liquid
distribution at grain boundaries is adopted as for columnar crystals. The equation for the
film thickness based on figure can be written as
b = ���-
. (13)

19
Fig .2.7: Schematic of a columnar grain structure that is used to determine the film thickness (Dickhaus et al., 1994)
b) L B criteria D. J. Lahaie and M. Bouchard modified and adapted an existing mechanical criterion for
ho t tearing of the semi-solid body to the deformation mechanisms (Eskin et al., 2004).As
proposed by some researchers (Suhartono at al., 2000), the solid grains of the semi-solid
body in liquid film stage were idealized as an aggregate of regular hexagons for each grain,
as shown in Figure 2.8. Assuming that the liquid and the solid grains in the later stage of
solidification process are incompressible, the body will be thus subjected to a constant
tensile strain rate e, if the feeding is not possible from outside to the liquid channel. Figure
2.8 shows the effect of the imposed deformation. The stress resisting deformation is thus
a function of the total strain ε. Due to thermal concentration, the initiated and
accumulated stress in the semi-solid body can be written as
# = /έ
√( 23!4( [21 − √(
� 23!4 74
�(+ 2 21 + √(
� 23!4 74
�(] (14)
The relationship between h and a can be represented with fraction solid fs as
!3 = √3 <���-=
�-=> (15)

20
Fig. 2.8: Schematic diagram of the deformation of a semi-solid body due to a constant
applied strain rate, for various total strains (Lahaie and Bouchard, 2001).
Therefore the constitutive expression of the internal generated stress in the
body can be calculated as
#? = /έ@ <���-=�-=
>( [<1 − �� <���-=
�-=> 7>�( + 2 <1 + <���-=
�-=> 7>�(] (16)
Where, 7 and A are taken as constants throughout the calculation, m is the parameter of
grain shape, which was 1/2 for columnar and 1/3 for equiaxed respectively (Lahaie and
Bouchard, 2001). Assuming that the semi-solid body of the specimen has a uniform tensile
strain, and the hot tearing fracture surface is intergranular, the tear will initiate at the
solid/liquid interface near the surface. Thus the fracture stress of can be expressed as
#� =� B
C(! ∗ �
�EFG�HI-=I-= JKL
(17)
where, ϒ1/g is the surface energy; f is the total strain on the semi-solid body, and h is the
film thickness. Wherever the internal stress at is greater than the fracture stress �f, hot
tears may occur.

21
Fig. 2.9: Schematic view of the idealized microstructure for a semi – solid
constrained liquid film stage in later mushy zone (Par and Weiliwu, 2003).
c) Willaim and Singer criteria
The stress-based hot tearing criteria that apply fracture mechanics approach is proposed
by Williams and Singer (Eskin et a1., 2004) They modify Griffith cracking criteria for
application as a hot tearing criterion. The original Griffith criterion considers a defect or a
small crack as a stress concen t ra to r and , t here fo re t he initiator of fracture. On
transition t o hot tearing phenomenon, the volume of liquid in the final stage of
solidification substitutes the defect as the crack initiator in the Griffith equation. Williams
and Singer argue that the final liquid is the weakest point and the stress concentrator of
the semi-solid body (Williams and Singer, 1968) . The modified Griffith model is written
as:
#�$ = M *NO�+��PQR�S
�� (18)
Where A is a constant dependent on the grain size and the dihedral angle; fr is the fracture
stress; G is the shear modulus; y is the effective fracture surface energy; VL is the volume of
liquid; and is Poisson’s ratio.
22
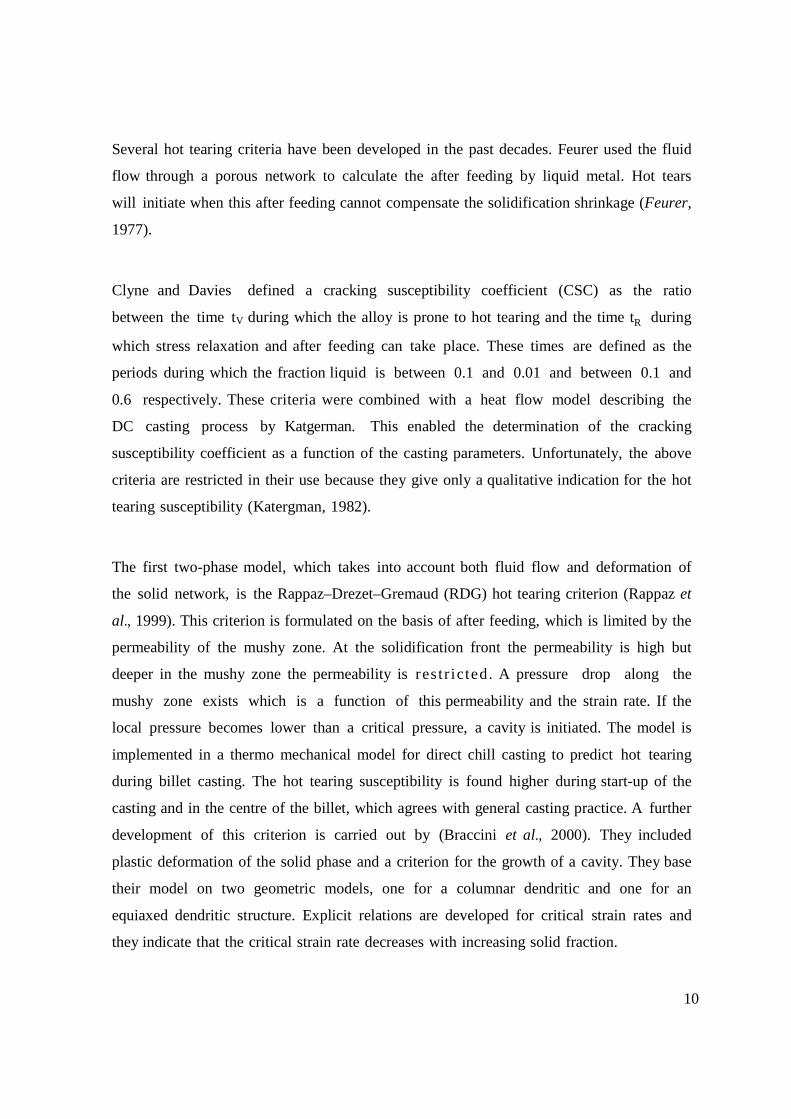
d) Strain based criteria
The ductility of semi-solid non-ferrous (including aluminium) alloys was used as a basis for
a hot shortness criterion suggested by Novikov (Eskin et a1., 2004). A characteristic called
a ‘‘reserve of plasticity in the solidification range’’. pr is proposed.
The ‘‘reserve of plasticity’’ pr is actually the difference between the average integrated
value of the elongation to failure εp and the linear shrinkage/contraction εsh i n the brittle (or
effective, or vulnerable) temperature range ∆Tbr (Fig 2.11 a). The hot tearing susceptibility
is then given by
T$ = U∆WX� (19)
Where S is the area between the εp and εsh curves in the brittle temperature range ∆Tbr. If the εsh curve intersects the εp curve (Fig. 2.11 b).
T$ = U��U�
∆WX� (20)
Fig. 2.10 Two types of temperature dependence of elongation to failure (εp) and linear
shrinkage (εsh) i n the semi-solid temperature range (Esksin et a1., 2004).

23
(Magnin et al., 1996) use a similar model for prediction of hot tearing of an Al–4.5% Cu
alloy. They propose that cracking occurs when the maximum principle plastic strain
exceeds the experimentally determined fracture strain in the solidification range. It is
demonstrated that hot cracking is more likely to occur at higher casting speeds, which
is in line with industrial experience. The same approach is also adopted by (Zhao et al.,
2000), for hot tearing prediction in an Al–4.5% Cu alloy. They measure the shrinkage stress
of casting, which is transformed to a critical strain for the formation of a hot tear. The strain
determined from their test is compared with the ductility from the work of (Magnin et al.,
1996). The temperature range where the ductility is lower than the strain induced by
solidification shrinkage is considered as potentially hazardous for hot tearing.
e) Strain rate based criteria
During solidification, alloys are in a two-phase situation: liquid and solid phases are
present though in constantly changing proportion. The liquid–solid phase transformation
leads to the solidification shrinkage and the solid phase then contracts resulting in the
strain development as an effect of geometrical configuration of the solidifying body. The
more complex the shape of the casting, the higher the strain. Based on this fact, hot tearing
criteria that are based merely on the comparison of the ductility of semi-solid alloys and
their solidification shrinkage cannot be used for hot tearing prediction of complex
castings. Prokhorov proposed a hot tearing model which includes the configuration of a
solidifying body (Prokhorov, 1962).
During solidification, solidifying alloys pass through a low-ductility range that is called
the brittle temperature range (BTR). The highest temperature of the brittle temperature
range is known as the upper limit of BTR (Bupper) and the lowest one, as the lower limit of
BTR (Blower). Fig. 2.11 shows a diagram illustrating the BTR; the liquidus temperature
(T1), solidus temperature (Ts), ductility curve (D) and strain curve (e) are also given. The
strength reflecting the appearance of a hot tear is defined as the limitation of strain capacity
in the semi-solid alloy as indicated by the intersection of the strain curve (e) and the
ductility curve (d).

24
Fig. 2.11 Ductility of semi-solid alloys and strain caused by linear shrinkage and configuration of the Semisolid
body (Prokhorov, 1962).
The intersection is determined by the slope of the strain curve (strain rate), the BTR
span and the shape of the D curve within the BTR. As the strain in the solidifying body
is determined by the solidification shrinkage/contraction and the geometrical
configuration, the strain under balance condition can be written as follows
73YY = 7?Z�_7�$\\ (21)
where εapp is the actual strain in the solidifying body; εfree is the free thermal contraction
strain; and εint is the internal strain resulted from the restricted shrinkage/contraction
and thermal stresses as a result of the configuration of the solidifying body.
The reserve of technological strength in the semi-solid state ∆εres) can be approximately
written in the following form:
∆7$\� = ]^?Z − (∆7�$\\ + ∆73YY) (22)

25
The expression is divided by BTR and written as:
∆K�_-`W) = a=bc`W) − ∆KI�__`W) − ∆Kdee`W) (23)
f3YY = f^?Z − f�$\\ (24)
Where α is the strain rate in terms of temperature dependence of the ductility or the
strain. Prokhorov postulated that hot tearing occurs when αres = 0 and, therefore
f3YY = f^?Z − f�$\\ (25)
If Ṫ is the cooling rate during solidification, it can be found that:
έ = fṪ (26)
This is the strain rate in terms of time Substitution of Eq. (16) to Eq. (15) results in
έ$\� = έ^?Z − έ�$\\ – έ3YY (27)
The hot tear will occur in the solidified body if
έ$\� ≪ 0 (28)
And Eq. (27) becomes

26
έ^?Z − έ�$\\ ≪ έ3YY (29)
The strain rate in Eq. (29) varies in different ways with the solidified body configuration or
the design factor. The left-hand side of the equation includes factors that depend on the
alloy composition, and it is the hot tearing criterion. The value of εapp is regarded as a
function of the solidified body configuration. The higher the difference at which the hot
cracking occurs, the worse the solidify body configuration in relation to hot tearing.
Based on the hot tearing criterion described above, the prediction of hot tearing
susceptibility is performed by computing the reserve strain rate εres. Therefore, the hot
tearing can be quantitatively predicted using Eq.27 this criteria is principally similar to the
criterion proposed by Novikov (Eskin et a1., 2004).
The differences are
• Prokhorov’s criterion uses the strain rate as a measure for hot tearing
tendency, while Novikov’s criterion uses the strain
• Prokhorov considers both the configuration of the solidifying body and the
solidification shrinkage/contraction as factors of hot tearing, while the
Strain criterion of Novikov uses only the solidification shrinkage/contraction.
• Prokhorov uses the difference between the lowest ductility of semi-solid body
and the actual strain as the reserve plastic strain, while the Novikov’s criterion
uses the area between the ductility curve and the strain curve in the entire
effective solidification range (Eskin et a1., 2004).
2.2.3. Two phase modelling Two phase modelling essentially takes into account both fluid flow and deformation of
the solid network. Unlike the other mechanical and non mechanical theories, these theories
try to implement both the aspects of feeding and stresses and tend to give better results as
they are much closer to real conditions.

27
a) RDG (Rappaz-Drezzet-Gremaud) criteria
Figure (2.12) is a schematic diagram of the columnar dendritic growth. The dendrites are
assumed to grow in a Bridgman-type configuration, i.e., in a given thermal gradient (G) and
with a velocity (vT) equal to the speed of the liquidus isotherm. This velocity points toward
the right and, therefore, the liquid has to flow from right to left in order to compensate for
shrinkage, the specific mass of the solid being larger than that of the liquid for most
metallic alloys. If the dendritic network is submitted to a tensile deformation rate
perpendicular to the growth direction (εp), the flow should also compensate for that
deformation if no hot tears form. The pressure in the interdendritic liquid is schematically
represented at the bottom of Fig.2.13 it decreases from the metallostatic pressure (pm) near
the dendrite tips. If the pressure falls below a cavitation pressure (pc), a void may form
(black region in Fig. 2.13 and give rise to a crack. Therefore, a hot tear will form at the
critical pressure (Pmin).
Where
T̂ ?Z = T̂ − ∆TK − ∆T�! = T� (30)
The average specific mass (p) = plf l+ psfs , the mean specific mass of the solid and liquid
phases, and (pv) = vlplf l+ vspsfs, is the average mass flow. The volume fraction of liquid (f l)
is equal to (1- fs), and the specific masses of the two phases (ps and p 1) are assumed to be
constant, but not equal.
Considering that the fluid moves along the x-axis only, whereas the solid deforms in the
transverse direction, one has
�k�B�BlB,no�p + �k�-�-l-,qo
�r − sW <�(�-�-) �p + �(�B�B)
�p > = 0 (31)

Fig 2.12 Schematicsresult of a localized st
in the inte
Taking fs as a function of x only
have been introduced together as shown in Eq.
t�u�,p 8 +1 8 vQ w
The entity E(x) is the defo
the distance x of the mushy
be determined from the veloc
zone (Figure 2.13).
Schematics of the formation of a hot tear in between cotrain transmitted by the coherent dendrites beerdendritic liquid is also indicated (Rapaaz et
nction of x only and the deformation rate of the solid along the y
have been introduced together as shown in Eq.32
Q w t�έYxy , u�vt� � t� u�,p 8 +1 8 vQz+yQ , u
formation rate times the volume fraction of
mushy zone. The integration constant C, appearing
velocity of the fluid at x= L, where L is the
28
olumnar dendrites as a elow. The pressure
z et a1., 1999).
and the deformation rate of the solid along the y-direction εp
Q u�vt� , { (32)
solid, cumulated over
appearing in Eq. (32), can
the length of the mushy

Fig 2.13—Schematics element over which liqshrinkage and uniaxial
Indeed, at the tip of the
shrinkage and the cumulated
shrinkage of the whole
identical to that of a plan
mushy zone is equal to - (1
following condition for the consta
T̂ 3p = |� − |
= 180 +�E~Q/���N
Please note that the integrals
thus introducing the tempera
TS are the liquidus temperature
As can be seen, the contr
VT/G, a factor which was
formation (Niyama et al., 1982).
cs of the mass balance performed at the scale oliquid can enter through the vertical faces in or
al deformation of the solid skeleton along the v(Rapaaz et a1 .,1999).
dendrites, the velocity of the fluid must
ulated deformation of the whole mushy zone if
whole mushy zone, given by the mass conserva
nar front and equals -vT. The cumulated de
(1 +1) E (L). Introducing these two expressions
he constant C, (Rapaaz et al., 1999).
Q w �+WQ�-+WQ�+k���-+WQoW�WS x� + 180 ��+~Q/��� N w �-+WQ�
+k���-+WQoW�WS
egrals over x have been replaced by integrals o
perature gradient, G, fs, being two functions of
perature and the temperature at the end of solidif
ribution of shrinkage to the pressure is proportio
already deduced by Niyama for his criterion
1982).
29
of a small volume rder to compensate vertical direction
ust compensate for the
if no void forms. The
conservation equation, is
deformation within the
ons in Eq.32 gives the
Q+ Qo� x� (33)
over the temperature,
of T. The terms TL and
fication, respectively.
oportional to the ratio
erion of microporosity

30
2.3 Summaries of hot tear Mechanisms of hot tear development The challenge nowadays lies not in the adequate description of macroscopic and
microscopic stress-strain situations and their correspondence to the parameters and
properties of the mushy zone, but rather in finding real factors causing the nucleation and
propagation of a hot crack. In fact, some existing theories and models of hot tearing
partially describe these factors with the crack initiator presented as a cavity filled
with liquid or a pore, or an oxide bi film, (Campbell, 1991) and with the crack propagation
path through the liquid film covering grain boundaries. (Eskin and Katergman, 2007). A
comprehensive model and a corresponding hot tearing criterion should include nucleation
and propagation of hot tears and connect these processes to the microstructure evolution
during solidification of the semisolid material; to the macroscopic and microscopic thermo-
mechanical situation in the mushy zone; and to the mechanical (or fracture-mechanical)
properties of the mushy zone. The last two components are well covered by a large body
of publications, though many mechanical properties still need to be determined and the
fracture mechanics potential has not been fully exploited. The correspondence
between the structure evolution during solidification and the crack nucleation and
propagation is studied in much less detail. Let us consider the possible mechanisms of
crack nucleation and propagation.
The nucleation of hot cracks is an almost unexplored phenomenon. Based on these
observations and ‘‘post-mortem’ examination of hot tear surfaces, the following crack
nuclei have been suggested
• Liquid film or liquid pool
• Pore or series of pores
• Grain boundary located in the place of stress concentration
Fig. 2.15 summarizes some of the possible crack initiators. The mechanism of hot tear
formation and propagation can be elucidated from of fractures. Unfortunately, the reports
on hot crack fractures in metallic materials are rare.

Fig. 2.14 —Schematic illustpropagation mec
Most such reports describe the
liquid, when grain boundaries
of crack propagation through
alloys is the classic Al-4 pct
vulnerable solidification range
2006). Much more important is
containing little solute that are
However, the information on
one wanted to summarize the findings a
grain boundaries is an essent
semisolid material gets to the
cracking, i.e., 90 to 95 pct sol
each other, or coalesced this
continuous liquid film as such
2005) show that a hot tear ap
materials and through solid bridges
Although in both cases the fractu
cracking mechanisms are acting
tration of possible hot crack initiators and soechanisms (Eskin and Katergman, 2007).
the cracking of semi solid alloys at relatively
are completely covered with liquid. In this
liquid film by grain separation is obvious. An
Cu alloy. However, alloys with high fractions
range are in practice not susceptible to hot teari
portant is the mechanism of crack formation and propagation
e most susceptible to hot tearing.
semisolid fracture in such alloys is only st
the findings available to date, it would appear
ssential feature of the fracture surface. Moreo
the temperature range of its maximum vul
solid, the greater the fraction of grain boundaries
case, there is no chance for the crack propaga
such a film does not exist. The recent observa
apparently propagates through the liquid film
d bridges in less alloyed materials, as illustrated
racture surface appears to be brittle, one can s
ing.
31
ome crack
ly large fractions of
case, the mechanism
An example of such
ions of liquid in the
ng (Davidson et al.,
propagation in alloys
starting to emerge. If
would appear that bridging of
Moreover, the closer the
vulnerability to hot
boundaries connected to
propagation through a
vations (Eskin et a1.,
ilm in more alloyed
ated in Figure 2.15 .
suggest that different

It is also obvious that the hot
is usually assumed), have sus
adequate feeding of the shrin
tearing but rather ‘‘patches’’ th
One can say that a semisolid all
having a microstructure that
tensile stresses is a self-healing
between grains at high solid
strength and ductility to prevent
enough to supply some liquid to solid
Otherwise, only the mechanis
temperature creep and pore coalescence
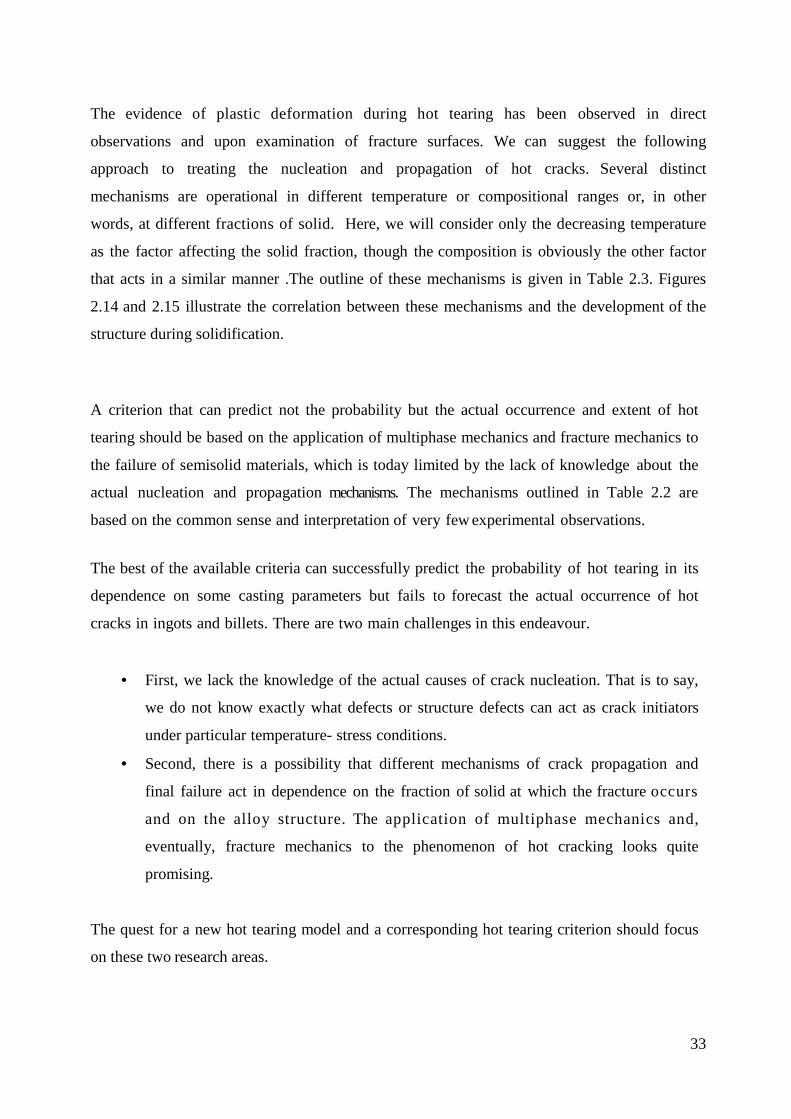
Fig. 2.16 Fracture surfaces oa casting speed of 200 mm/mi
crack, like any other crack, can develop cat
sustained growth, or stop. Liquid feeding pla
nking material with liquid does not eliminate
he consequences, which is reflected in the term
alloy containing enough liquid at the last stage
enables adequate permeability of the mush, and
ing material. On the other hand, the developm
fractions in the absence of any liquid would
vent any brittle rupture. Hence, the liquid feedi
e liquid to solid bridges that enables their liquid e
echanisms of ductile fracture (Campbell, 1991)
temperature creep and pore coalescence, will be active.
of hot tears in 200-mm round billet produced min (a) Al-1 pct Cu and (b) Al-3 pct Cu ( Eskin
2007).
32
tastrophically (which
ys a dual role. First,
inate the causes of hot
term ‘‘crack healing.’
ast stage of solidification,
ush, and subjected to
ment of solid bridges
would build up enough
eeding should be just
liquid embrittlement.
(Campbell, 1991), example high
d by DC casting at n and Katergman,
33
The evidence of plastic deformation during hot tearing has been observed in direct
observations and upon examination of fracture surfaces. We can suggest the following
approach to treating the nucleation and propagation of hot cracks. Several distinct
mechanisms are operational in different temperature or compositional ranges or, in other
words, at different fractions of solid. Here, we will consider only the decreasing temperature
as the factor affecting the solid fraction, though the composition is obviously the other factor
that acts in a similar manner .The outline of these mechanisms is given in Table 2.3. Figures
2.14 and 2.15 illustrate the correlation between these mechanisms and the development of the
structure during solidification.
A criterion that can predict not the probability but the actual occurrence and extent of hot
tearing should be based on the application of multiphase mechanics and fracture mechanics to
the failure of semisolid materials, which is today limited by the lack of knowledge about the
actual nucleation and propagation mechanisms. The mechanisms outlined in Table 2.2 are
based on the common sense and interpretation of very few experimental observations.
The best of the available criteria can successfully predict the probability of hot tearing in its
dependence on some casting parameters but fails to forecast the actual occurrence of hot
cracks in ingots and billets. There are two main challenges in this endeavour.
• First, we lack the knowledge of the actual causes of crack nucleation. That is to say,
we do not know exactly what defects or structure defects can act as crack initiators
under particular temperature- stress conditions.
• Second, there is a possibility that different mechanisms of crack propagation and
final failure act in dependence on the fraction of solid at which the fracture occurs
and on the alloy structure. The application of multiphase mechanics and,
eventually, fracture mechanics to the phenomenon of hot cracking looks quite
promising.
The quest for a new hot tearing model and a corresponding hot tearing criterion should focus
on these two research areas.

34
Table 2.2 Possible Mechanisms Acting within ‘‘Hot Tearing’’ Phenomenon
Temperature Range/Fraction of Solid
Nucleation of Crack
Propagation of Crack
Fracture Mode
Between coherency and rigidity temperatures; 50 to 80 pct solid
Below rigidity temperature; 80 to 99 pct solid
Close to the solidus; 98 to 100 pct solid
Grain boundary covered with liquid; shrinkage or gas pore
Pore, surface of particle or inclusion, liquid film or pool, vacancy clusters
Pore, surface of particle or inclusion, segregates at grain boundary, liquid at stress concentration point, vacancy clusters
(a) Liquid film rupture (b) fill ed gap
(a) Liquid film rupture; liquid metal embrittlement of solid bridges
(b) plastic deformation of bridges
a) Liquid metal embrittlement
(b) plastic deformation of bridges, creep
a) Brittle, interganular (b) healed crack
a) Brittle, interganular (b) ductile failure of bridges possible
(a)Brittle,intergranular, transgranular propagation is possible (b) macroscopically brittle or ductile, intergranular; transgranular propagation is possible
2.4 Comparison of hot tearing criteria The basic phenomena that lead to hot cracking are well established and understood, but a
generic criterion that will predict hot cracking under varying process conditions is still not
available. Although the earlier simple criteria based on the thermal history of the casting
have been extended and improved to include shrinkage and deformation, they are still
unable to give reliable predictions under all process conditions. Most of the existing hot
tearing criteria do not incorporate the nucleation and propagation of a hot tear, focusing
more on the macro-, meso-, and microscopic conditions that may result in rupture (Fig
2.5).
The ultimate hot cracking criterion needs to combine aspects of thermal history, shrinkage,
and porosity formation and constitutive behaviour in combination with the evolution of the
semisolid microstructure.

35
Current research efforts are aimed, in particular, at the quantitative description of structure
evolution and its correlation to cracking recently, several mechanical and non mechanical
hot tearing criteria were evaluated by implementing them into a thermo-mechanical model of
DC casting.(Hatami et al., 2008).
The sensitivity of this criterion is, however, a function of correctly chosen values of
properties such as Young’s modulus of the mush, surface tension between liquid
and solid, and permeability of the mush. These parameters are scarcely available and need
to be determined experimentally, while the existing experimental techniques are not reliable.
After comparing the hcs-hot tearing susceptibility obtained from all criteria’s the
following observations have been registered
• Higher cracking sensitivity for higher casting velocity,which is considered in
accordance with casting in practice.
• Further, it shows a higher sensitivity in the billet center, which is in accordance
with casting practice.
• Also it indicates the use of a ramping procedure (lower casting speed during start-
up phase) makes a difference especially in higher casting speed.
• The present approach is not able to correctly predict whether hot tear during DC
casting will occur.Table 2.4 shows summary of the results. This criterion is similar
to RDG (Rappaz Drezzet Gremaud) criterion that is a combined criterion and shows
the greatest potential in reference (Suyitno et al., 2005).
Table 2.3 summarizes the results obtained for the eight criteria. If the criteria are
used quantitatively, it is seen that none of the criteria are able to predict all observations. If
the criteria are used qualitatively, considering that constitutive and fracture data of the
mushy zone are not well known, only RDG (Rappaz Drezzet Gremaud)’s criterion might be
of a good value. But still The RDG (Rappaz Drezzet Gremaud) criterion is based on several
assumptions. During solidification, growth is columnar dendritic and the thermal gradient and
solidification rate are taken as constant. Further, when a cavity is formed, it will lead to a
crack.
Table 2.3 Summaries of Hot tearing criteria’s

36
Observation Fuerer
Clyne &
Davis
Katger-man
Prokhrov Novikov Strain
based
RDG Braccini Present
Increasing
sensitivity for
higher casting
speed
Yes No yes Yes No yes yes yes Yes
Highest sensitivity
in
billet center
Yes No yes Yes No no yes yes Yes
Ramping might
have
positive effect
No No No No No no yes no Yes
Crack NA NA NA Yes NA yes yes NA No
.
The possibility that cavities will lead to porosity and not always to a crack is not included.
(Braccini et al., 2000). Attempted to overcome several of these limitations in their criterion
however, our calculations do not show a significant effect on the predicted hot tearing
tendency.In fact, in the criterion of (Braccini et al., 2000), the metallostatic pressure, which
depends on the depth of sump, is the dominant parameter. Further researches are going on after
(Suyitno et al., 2005) approach predicted hot tears but was very sensitive to the the values
taken.

37
Chapter 3
Problem Definition
The review of literature revealed that the theories of hot tear fail to be accurate in predicting the
hot tears, but some of the theories are close enough in predicting the actual occurrence. As it
was observed in literature review most of the theories failed to give importance to crack
propagation and looked into crack nucleation. This chapter presents the motivation to take up
this research followed by problem definition objectives, scope and approach
3.1 Motivation
Due to the decreasing cost of computers and advances in computing methods from mid 80’s,
computer simulation of foundry process has been developed and improved by both academic
and industry. However prediction of hot tear accurately using simulations is still a challenging
task. Recent theories have shown qualitative results on hot tear occurrence, simulating the hot
tears accurately will help reduce the rejections of castings in industries. Researchers from 1950
have been doing phenomenal work on hot tear prediction, as observed in literature review.
Coupled criteria involving mechanical and non-mechanical aspects of hot tear formation have
been able to predict hot tears more accurately when compared to those criteria which are based
on either mechanical or non-mechanical aspects as shown in literature. Exact prediction of hot
tears in castings is still not accomplished, most of the present theories give importance to crack
nucleation and give less importance to crack propagation. Recently developed coupled Criteria
such as Rappaz-Drezet-Gremaud, Braccini and Suyinto employ shrinkage as well as
deformation aspects which help them to predict hot tears more accurately when compared to the
previous criteria. But to predict hot tear good accuracy further research on crack propagation
need to be done, since at present coupled theories are able to predict crack initiation. These
reasons triggered to compare the existing criteria, optimize them and to investigate the
dependence of geometrical factors in hot tearing initiation.
3.2 Goal, Research Objectives The main goal of this work is
geometrical parameters for junctions such as L, T and C which are prone to hot tearing and
validate their applicability with experimental results,
To achieve the above goal the approach has been defined as follows
Considering the severity of hot tear defects and the possibility of their occurrence, the scope of
the project is limited to hot tear defects in steel sand castings.
Comparision of various hot tearing criteria on castings taken from literature
Design of benchmark shapes which are prone to hot tear
Variation in geomerty of benchmark castings and simulation of the tendency to
tear in these shapes using a commercial software
Regression Analysis to obtain relation between geometrical parameters and hot
tear tendency for the benchmark shapes
Validation of the obtained regression equation with experimental castings
Objectives, and Scope
The main goal of this work is “To correlate the relation between hot tearing
geometrical parameters for junctions such as L, T and C which are prone to hot tearing and
validate their applicability with experimental results,
To achieve the above goal the approach has been defined as follows
Fig 3.1 Research Approach
Considering the severity of hot tear defects and the possibility of their occurrence, the scope of
the project is limited to hot tear defects in steel sand castings.
Comparision of various hot tearing criteria on castings taken from literature
Design of benchmark shapes which are prone to hot tear
Variation in geomerty of benchmark castings and simulation of the tendency to
tear in these shapes using a commercial software
Regression Analysis to obtain relation between geometrical parameters and hot
tear tendency for the benchmark shapes
Validation of the obtained regression equation with experimental castings
38
correlate the relation between hot tearing tendency and
geometrical parameters for junctions such as L, T and C which are prone to hot tearing and
Considering the severity of hot tear defects and the possibility of their occurrence, the scope of
Comparision of various hot tearing criteria on castings taken from literature
Design of benchmark shapes which are prone to hot tear
Variation in geomerty of benchmark castings and simulation of the tendency to
Regression Analysis to obtain relation between geometrical parameters and hot
Validation of the obtained regression equation with experimental castings

39
3.3 Research approach
The solidification and stress simulations were performed using Ansys, ProCAST and
AutoCAST however since the present defect occurs only during the last stages of
solidification the last few time steps are taken into consideration where the solid fraction
is greater than 0.85 ,at this solid fraction values at the corresponding nodes numerical
calculations on the basis of RDG (Rappaz Drezzet Gremaud) approach are carried out to
determine the critical pressure. The theoretical predictions are then compared to the practical
observed tears in the casting.
To correlate the influence of geometrical parameters the following approach was adopted
• Considering simple geometries which are more prone to hot tears
• Simulating the shapes and obtain correlation between geometry and hot tears
• Validating the obtained regression equations with the experimental castings.
3.4 Organisation of report
First chapter of the report contains the introduction. It specifies the problem area through a brief
introduction about hot tearing. The second chapter contains the literature review done. In this
chapter some of the mechanisms and current criteria which are most accurate in predicting hot
tear are listed. The fourth chapter about the different criteria and their ability to predict hot tear.
The fourth chapter highlights the benchmark shape considered for simulations .The next chapter
provides the regression analysis and the influence of geometry on hot tear is tested by applying
the equation to some industrial castings and castings obtained from literature.

40
Chapter 4
Comparison of hot tearing criteria
Castings with known geometry and with practical details of the occurrence of the hot tears
are taken and modelled in ANSYS and after obtaining the pre-requisites of hot tearing
criteria, evaluation of hot tear occurrence is done. The values needed to evaluate are typical
microstructure values such as secondary dendrite arm spacing, surface energy, and
viscosity these values are taken accurate enough for descent predictability. The isothermal
velocity vt is taken as the ratio of cooling rate to thermal gradient as suggested by (Niyama
et al., 1982).
4.1 Criteria Used for Prediction
• Feurer’s criteria is a non mechanical criterion relying entirely on lack of feeding,
the inputs needed to estimate the locations where there is no feeding is obtained and
analyzed on the benchmark castings taken from literature.
• Lahaie and Bouchard criteria is purely a stress based criterion which do not predict
the occurrence, however the values of stresses at the locations susceptible to hot
tear are obtained.
• According to Rappaz-Drezet-Gremaud a coupled criterion, if the critical pressure
drop exceeds 2 kPa then crack occurs.The accuracy of these predictions however
depend on the values taken to predict the criteria’s as these are highly sensitive to the
properties chosen for prediction. Some over predict the occurrence and some
criteria under predict, none of the present criteria’s are accurate as they only
concentrate on nucleation of a crack rather than its propagation

41
a) Approach to predict hot tear
Fig. 4.1: Approach to predict hot tear
b) Thermo-Mechanical Analysis of Castings
Various case studies are taken from industries and research papers and they are analyzed
for possibility of shrinkage porosity in casting using ANSYS. The output of the analysis is
thermal gradient and temperature As well as strain at each node. Various criteria are
calculated with the help of output. The analysis is carried out in three steps as given below
• Pre processing is used to define geometry, material property and element type for the
analysis.
• Processing phase defines analysis type like transient or steady state , apply loads and
solve the problem, it can also be reffered as solution phase.

42
• Post processing is to review the result in the form of graphs or tables. The
general postprocessor is used to review results at one sub step (time step) over the
entire model. The time-history postprocessor is used to review results at specific
points in the model over all time steps.
The following assumptions are made for the analysis:
• In practice the temperature difference between the mould surface and surrounding
air is not substantial hence radiation transfer can be ignored.
• Contact resistance between the mold and cooling material is negligible. Mould cavity
is instantaneously filled with molten metal.
• Outer surface of the mould is initially assumed to be at ambient temperature.
• The bottom surfaces of the casting are always in contact with the mould.
• The vertical surfaces of casting are in contact with the mould i.e. no a i r gap
in between, but the change in heat transfer coefficient for two of the case studies
have been employed and thus virtually creating an air gap.
c) Part Modeling
Modelling consists of defining two parts one is sand mould and other is the castings
with proportional dimensions. Modelling can be done with the help of any available CAD
software and can be inserted in ANSYS using geometry transformation. Model can also be
generated using ANSYS, In ANSYS, and model generation means generation of nodes that
represent the spatial volume.
d) Meshing
The main aim of the analysis is to do a thermo-mechanical analysis with respect to time.
Element, PLANE 13 is chosen in ANSYS® which has capability of coupled analysis
that is structural and thermal analysis. The element has quadratic shape functions.

43
e) Input parameters to ANSYS®
In present work, analysis is carried out for the time from pouring temperature to
solidification temperature. Input parameters required for ANSYS® model are as follows:
• Initial boundary conditions for sand mould, casting and atmosphere air
• Thermal boundary condition is convective heat transfer co efficient.
• Mechanical boundary condition is restricting the degree of freedom at some
sides and of mould.
• Material specifications like density, specific heat and thermal
conductivity, Youngs modulus , thermal expansion coefficient i s required for
sand, cast and atmospheric air.
4.2 Analysis I
The automotive industry is showing greater interest in magnesium alloys as they have a
high strength to weight ratio when compared to steel or aluminum alloys. Because of their
low density, incorporating magnesium alloys into the design of new vehicles decreases
weight and increases fuel efficiency. The figure shows the original geometry features of the
casting on which analysis are done.
Fig. 4.2: Mg-Al casting Geometry (Prokony et al., 2009)

44
This is especially important in helping to reduce carbon emissions that contribute to global
climate change, especially if cast in a permanent mold, the present analysis is to predict hot
tears in AZ91D magnesium alloy in a sand mould. The composition of the AZ91D
magnesium alloy used in the experiments was 8.61% aluminum, 0.6% zinc, 0.23%
manganese, 0.017% silicon, 0.003% copper, 0.0038% iron, 0.0014% nickel, 0.0012%
beryllium, and balance magnesium. Hot t ea r s o f an L -shape Ma g n es i u m ca s t i n g
were determined experimentally by (Bichler et al., 2008).
After obtaining the required temperature profiles, cooling rate and thermal gradient for
the present model, Rappaz-Drezet-Gremaud criteria was obtained at each and every node
when the fraction of solid was in between 0.85-0.98, as the criteria suggest that this is
fraction of solid where hot tear occurs Solid fraction was calculated by lever rule (Gibbs et
al., 2008).
Fs (t) = (TL-t) / (TL-TS) (35)
Here TL,,TS = liqidus,solidus temperature
t = temperature at any instant.
Table 4.1 Properties considered in Thermo-mechanical
analysis of Mg-Al alloy (Prokony et al., 2009)
Properties MG-AL alloy Mould
Density (Kg/m3) 1810 1520
Specific Heat (J/(kg·K) 1050 1000
Heat transfer Coefficient W /m2 6000(600K) 20
Thermal Conductivity W/(m·K) 80 0.8
Solidification Time (s) 350 -
Temperature (K) 993 413

45
Table 4.2 Values for Mg-Al alloy for Rappaz-Drezet-Gremaud, Feurer and Lahaie and Bouchard criteria (Rappaz et al., 1999).
Viscosity mPa.s 1.58
shrinkage β 0.06
strain rate έ 0.0001
Secondary dendrite arm spacing λ µm 76.6
∆T (.K) 125
Surface energy 0.85
Limiting thickness 1 nm
Grain size 30 µm
Parameter (m) ½ ( Columnar)
a (Length of hexagonal side) 19.49 µm
The air gap affects the heat transfer co-efficient this effect was also considered in
present analysis. Due to air-gap formation there is a decrease in heat transfer co-efficient
values, in the present simulation the change in heat transfer co-efficient values were taken
into consideration the graph shows the variation of heat transfer coefficient with temperature.
Transient thermal and structural analysis was carried out for the specific part, the mesh size
was refined for the casting part, the element chosen here was plane 13 ,which is a coupled
element, initially plane 42 was also taken but the results seem to me more better with plane
13 element. The figure shows the modeling meshing and the temperature profile obtained from
ANSYS. Fig 4.3 shows the predictions of the various criteria namely Fuerer, RDG, the actual
location of hot tear is also seen in Fig. 4.3 (c).The location shown by Fuerer and RDG are the
respective critical locations which have exceeded the threshold value limited by these
theories.The effect of air gap was also considered during the solidification process, the value of
heat transfer coefficient was changed to keep track of the increasing air gap.The other theory
was unable to locate the exact location but showed increase in stress values as the solidification
fraction increases as shown in Fig.4.5.

Fig 4.3
(a)
(b)
(c)
Fig 4.3: Analysis 1 (a) Modeling
(b) Meshing
(c) Temperature profile
46

Fig 4.4: Analysis 1
(a)
(b)
(c)
4: Analysis 1 (a) Hot tears Prediction by Feurer,
(b) Hot tears Predicted by Rappaz-Drezet-G
(c) Actual hot tearing
47
Gremaud
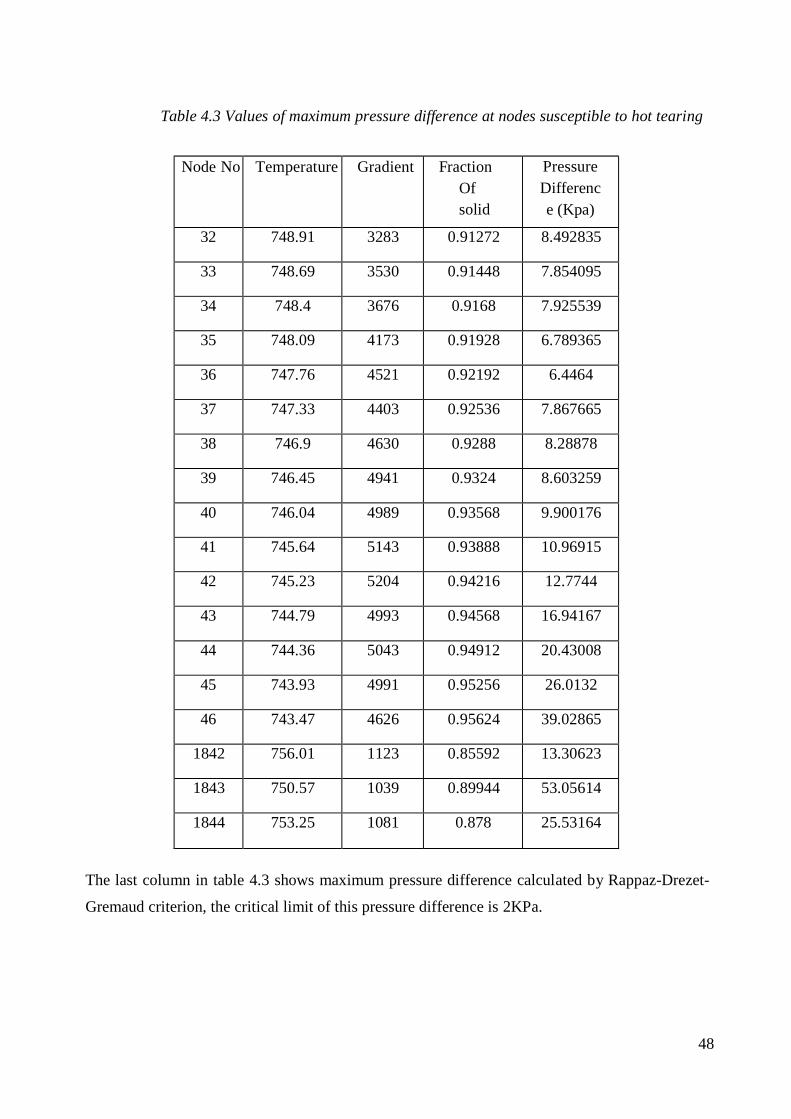
48
Table 4.3 Values of maximum pressure difference at nodes susceptible to hot tearing
Node No Temperature Gradient Fraction Of solid
Pressure Difference (Kpa)
32 748.91 3283 0.91272 8.492835
33 748.69 3530 0.91448 7.854095
34 748.4 3676 0.9168 7.925539
35 748.09 4173 0.91928 6.789365
36 747.76 4521 0.92192 6.4464
37 747.33 4403 0.92536 7.867665
38 746.9 4630 0.9288 8.28878
39 746.45 4941 0.9324 8.603259
40 746.04 4989 0.93568 9.900176
41 745.64 5143 0.93888 10.96915
42 745.23 5204 0.94216 12.7744
43 744.79 4993 0.94568 16.94167
44 744.36 5043 0.94912 20.43008
45 743.93 4991 0.95256 26.0132
46 743.47 4626 0.95624 39.02865
1842 756.01 1123 0.85592 13.30623
1843 750.57 1039 0.89944 53.05614
1844 753.25 1081 0.878 25.53164
The last column in table 4.3 shows maximum pressure difference calculated by Rappaz-Drezet-
Gremaud criterion, the critical limit of this pressure difference is 2KPa.

Fig 4.5 Stre
Using Lahaie and Bouchard crite
will occur are calculated, the str
high and they are susceptible to
sensitive values that are used in
the occurrence as shown in the
actual casting produced.
4.3 Analysis II
Fig 4.6 Geometry
ess calculated by Lahaie and Bouchard criter
teria, stresses at the nodes at which the other
resses are calculated at locations whose fracti
o hot tearing, the stress criteria is unable to
order to obtain the stress relation. The other
figure 4.3.It also shows the actual location
ry of steel casting (Monroe and Beckermann,
49
ria
criteria’s say hot tear
tion of solid are very
predict owing to the
er two criteria’s predict
of the hot tear in the
2005)
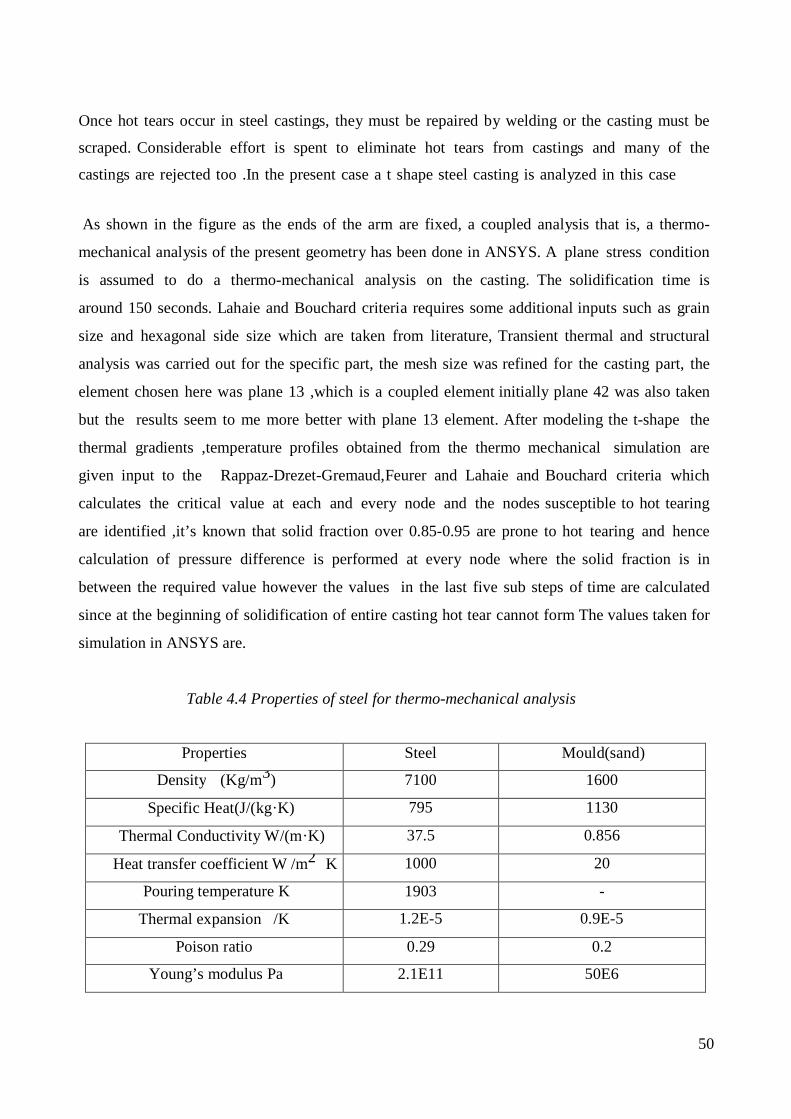
50
Once hot tears occur in steel castings, they must be repaired by welding or the casting must be
scraped. Considerable effort is spent to eliminate hot tears from castings and many of the
castings are rejected too .In the present case a t shape steel casting is analyzed in this case
As shown in the figure as the ends of the arm are fixed, a coupled analysis that is, a thermo-
mechanical analysis of the present geometry has been done in ANSYS. A plane stress condition
is assumed to do a thermo-mechanical analysis on the casting. The solidification time is
around 150 seconds. Lahaie and Bouchard criteria requires some additional inputs such as grain
size and hexagonal side size which are taken from literature, Transient thermal and structural
analysis was carried out for the specific part, the mesh size was refined for the casting part, the
element chosen here was plane 13 ,which is a coupled element initially plane 42 was also taken
but the results seem to me more better with plane 13 element. After modeling the t-shape the
thermal gradients ,temperature profiles obtained from the thermo mechanical simulation are
given input to the Rappaz-Drezet-Gremaud,Feurer and Lahaie and Bouchard criteria which
calculates the critical value at each and every node and the nodes susceptible to hot tearing
are identified ,it’s known that solid fraction over 0.85-0.95 are prone to hot tearing and hence
calculation of pressure difference is performed at every node where the solid fraction is in
between the required value however the values in the last five sub steps of time are calculated
since at the beginning of solidification of entire casting hot tear cannot form The values taken for
simulation in ANSYS are.
Table 4.4 Properties of steel for thermo-mechanical analysis
Properties Steel Mould(sand)
Density (Kg/m3) 7100 1600
Specific Heat(J/(kg·K) 795 1130
Thermal Conductivity W/(m·K) 37.5 0.856
Heat transfer coefficient W /m2 K 1000 20
Pouring temperature K 1903 -
Thermal expansion /K 1.2E-5 0.9E-5
Poison ratio 0.29 0.2
Young’s modulus Pa 2.1E11 50E6

51
The values required for Feurer criteria are taken from literature and are approximations
to predict hot tear occurrence. Properties taken into consideration by all the three
criteria used to predict the hot tears are listed below. The air gap affects the heat
transfer co-efficient this effect was also considered in present analysis. Due to air-
gap formation there is a decrease in heat transfer co-efficient values, in the present
simulation the change in heat transfer co-efficient values were taken into
consideration the graph shows the variation of heat transfer coefficient with
temperature.
Fig 4.6 shows the predictions of the various criteria namely Fuerer, RDG, the actual
location of hot tear is also seen in Fig. 4.6 (c).The location shown by Fuerer and RDG are
the respective critical locations which have exceeded the threshold value limited by these
theories. The effect of air gap was also considered during the solidification process, the
value of heat transfer coefficient was changed to keep track of the increasing air gap.The
other theory was unable to locate the exact location but showed increase in stress values
as the solidification fraction increases as shown in Fig.4.5
Table 4.5 Properties of steel for Rappaz-Drezet-Gremaud, Feurer and Lahaie and Bouchard criteria (Rappaz et al., 1999)
Properties Value
Viscosity(Pa.s) .0045
Secondary arm spacing(λ)µm 20
Shrinkage factor(β) 0.03
Strain rate(έ) 0.0001
Solidus temperature. K 1777
Liqidus temperature. K 1693
Surface energy 0.05
Limiting thickness 1 nm
Grain size 36 µm
Parameter (m) ½ ( Columnar)
a (Length of hexagonal side) 16.49 µm

52
(a)
(b)
(c)
Fig .4.8: Analysis 2 (a) Modeling
(b) Meshing
(c) Temperature profile

53
(a)
(b)
(c)
Fig 4.9 Analysis 2 (a) Hot tears Prediction by Feurer, (b) Hot tears Predicted by Rappaz-Drezet-Gremaud
(c) Actual hot tearing

54
Table 4.6 Values of maximum pressure difference at nodes susceptible to hot tearing
Node No
Temperature Gradient Fraction Of
Solid
Pressure Difference
(KPa)
1228 1627.1 727.7 0.916 25.17911
1229 1628.2 190.8 0.872 89.30161
1230 1628.6 266 0.856 30.5258
1231 1627.5 761.3 0.9 12.93339
1233 1628.7 761.2 0.852 3.385576
1234 1628.6 716.2 0.856 4.210772
1236 1628.7 263.2 0.852 28.31772
1237 1627.7 702.6 0.892 11.73555
1238 1628.3 211.1 0.868 65.60809
1239 1627.2 681 0.912 24.67964
1248 1627.3 472.6 0.908 44.25916
1249 1626.8 675.6 0.928 48.23515
1251 1628.9 573.1 0.844 4.957802
According to Rappaz-Drezet-Gremaud criterion if the maximum pressure difference
exceeds 2KPa, then hot tear may occur, the last column in Table 4.6 shows the
values of pressure difference at different nodes. The values required to calculate the
maximum pressure difference using this criterion were taken from Table 4.5.

55
Fig 4.10 Stress by Lahie and Bouchard criteria
4.6 Summary
• Feurer over predicts the hot tear in most of the cases-
As seen in simulation results the prediction zone covers the entire zone of
actual hot tear and also some nodes are identified at the boundaries of mould
and cast susceptible to tear ,since this criteria gives only importance to shrinkage
the results are over predicted.
• The actual hot tear is in the zone of Rappaz-Drezet-Gremaud prediction-
The actual hot tear in fact is in the zone of Rappaz-Drezet-Gremaud
prediction, but in addition to it some other nodes are also seen to be susceptible
to hot tear
• Some arbitrary nodes show positive response to tear which may be shrinkage
Porosities- Rappaz-Drezet-Gremaud essentially predicts cavities due to
pressure difference and hence every possibility that the hot tears predicted
from Rappaz-Drezet-Gremaud may be shrinkage porosities cannot be neglected.
• Lahaie and Bouchard criteria-
If the values are accurate then Lahaie and Bouchard criteria may be of good help
as it can be coupled with another criteria, since the values are not accurate
Lahaie and Bouchard fails to identify the real hot tears however very less
number of nodes coincide with actual hot tear.

56
Chapter 5
Benchmark shape and its analysis
As a need of hot tear prediction, a geometry which is more prone to this defect has to be
taken. This chapter highlights the benchmark shape and the proposed variations for further
simulation and experimental work.
5.1 Benchmark shape
Hot tear is a defect that occurs due to hindered contractions near to the hot spot, increased
thermal stresses during the last stages of solidification and many other complex
metallurgical phenomenon during solidification. Junctions are more prone to hot tears,
three different types of junctions were taken initially to correlate the dependence of hot
tear with geometry..
L Junction - Parameters
L1- length of arm L2- length of leg T1- thickness of arm T2- thickness of leg, D- depth
T Junction - Parameters L1- length of arm L2- length of leg
T1- thickness of arm T2- thickness of leg, D- depth
Fig 5.1 Parameters in L and T shape

57
C Junction - Parameters
L1- length of arm, L2- length of leg L1 L3= Length of leg 2 T1- Thickness of arm T2- Thickness of leg 2, Thickness of leg 2 = T3
Fig 5.2 Parameters in C shape
5.2 Analysis of Benchmark shape
The benchmark shapes were initially analyzed in ProCAST and AutoCAST with some
variations in the geometric parameters and their tendency to hot tearing was evaluated, the
variations in L, T and C shape are shown below.
Table 5.1 Variations in Geometry of benchmark L shape
Case Nomenclature L1
Length
of arm
L2
Length
of leg
T1
Thickness
of arm
T2
Thickness
of leg
D
Depth
1 250-100-10-10-50 250 100 10 10 50
2 250-100-50-10-50 250 100 50 10 50
3 250-100-10-50-50 250 100 10 50 50
4 250-100-50-50-50 250 100 50 50 50

58
Case (i) Case (ii) Case (iii) Case (iv)
Fig .5.3 Variations in L shapes
Similarly the T junction as well as the C junctions was simulated with specific variations
to find the possibility of hot tearing. Hot tear is more prone in the junctions having huge
thickness variations, and hence initially thickness parameter was majorly considered. The
C junction has two extra parameters that is lengthand thickness of its second leg. The
table below shows the variations that have been considered,
Table 5.2 Variations of geometry for T and C benchmark shapes
Case Type Nomenclature L1 L2 L3 T1 T2 T3 D
1 T 600-100-12.7-25.4-50 600 100 X 12.7 25.4 X 50
2 T 600-100-12.7-50.8-50 600 100 X 12.7 50.8 X 50
3 T 600-100-25.4-25.4-50 600 100 X 25.4 25.4 X 50
4 T 600-100-50.8-50.8-50 600 100 X 50.8 25.4 X 50
1 C 250-100-150-10-50-100-50 250 100 150 10 50 100 50
2 C 250-100-150-50-10-100-50 250 100 150 50 10 100 50
3 C 250-100-150-10-50-50-50 250 100 150 50 50 50 50
4 C 250-100-150-10-10-10-10 250 100 150 10 10 150 50

59
Case (i) Case (ii) Case (iii) Case (iv)
Fig. 5.4 Variations in C shape
Analysis of these variations of benchmark shape is done using commercial software
program, which directly gives the value of hot tear tendency based on strain rate
calculation, the material properties used for steel. The program uses FDM approach to
evaluate hot tear tendency, the details of the input given to program are listed below.
Table 5.3 Input to simulation software
Analysis Coupled (thermo-mechanical)
Material Steel H13
Stress Module Plastic (steel H13) , Rigid (sand)
Mold Sand
Mesh size 1 mm
Melting temperature 1377
Solidification temperature 1628 K
Liqidus temperature 1746 K
Pouring temperature 1903 K
Initial condition of sand 300 K

60
Case (i) Case (ii) Case (iii) Case (iv)
Fig. 5.5 Variations in T shape.
Fig.5.6 Thermal properties of H13 steel
The Thermal properties are taken from commercial software and the same properties have
been used while using another software program.
0
10
20
30
40
0 500 1000 1500 2000 2500
Temperature (K)
Conductivity (w/mK)
0.00E+00
5.00E-06
1.00E-05
1.50E-05
2.00E-05
0 500 1000 1500 2000
Temperature (k)
Thermal Expansion Coefficient (1/K)

61
Table 5.4 Hot tear tendency values
Junction type Case Hot tear tendency
L 1 .136
2 .22
3 .25
4 .083
T 1 .121
2 .11
3 .114
4 .07
C 1 .71
2 .171
3 .179
4 .308
5.3 Analysis of variations in Commercial simulation software
The properties used to simulate the tendency of hot tearing are taken from Program as
shown in the Fig. 5.6 .The results of the analysis from Fig.5.7 to Fig 5.10 shows the
analsys of all the variations in simulation software .The figures show the tendency to hot
tear, the red region in the figure is the area where there is maximum probablity of a hot
tear occuring, the blue regions are farely safe regions. The software directly gives the
tendency to hot tearing based on stress simulations which could be compared to similar
metals with different geometry.The tendency to hot tearing is mapped by using strain rate.
The geometrical parameters defenitley influenced the tendency to hot tearing. Initially
H13 steel is used for simulation due to better avalibility of properties and since all the
properties are kept constant throughout and its only the geometrical parameters which are
varied, The influence of geometrical parameters on hot tear arae directly reflected.the
following figures shows the analysis of Benchmark shapes in the software , The red area
shows the most susceptable region where tear can occur, in the Fig.5.10 highlights those
geometric variations which have highest possibility of tearing.

62
Case (i)
Case (ii)
Case (iv)
Fig.5.7 Analysis of L junction in commercial simulation software

63
Case (ii)
Case (iii)
Case (iv)
Fig.5.8 T case analysis in commercial simulation software

64
Case (ii)
Case (iii)
Case (iii)
Fig.5.9 Analysis of C junctions in commercial simulation software

65
Case (iii) L shape
Case (i) T Shape
Case (i) C Junction
Fig.5.10 Geometrical shapes showing maximum tendency

66
5.4 Summary
There is a need of better understanding of which geometrical parameters have greater
influence on hot tear tendencies in all of the three beenchmark shapes and also the results
obtained from ProCast which seem to be good, need to be validated so that further virtual
experiments can be carried out by varying all the parameters of the all the three
benchmark shapes and get a commendable relation between the parametres and the hot
tear tendency. Analysis of the initial variations of benchmark shapes were also carrried
out in AutoCAST , as the software gives a better flexibility. But how much change in the
value of hot tear tendency is significant is still unknown .Its also not known whether
ProCAST simulation results can be justified and hence the need for validating Proccast
results with the real industrial cases of hot tear occurs.

67
Chapter 6
Validation of Simulation Software
This chapter focuses on Implementation of commercial software to predict hot tear. Two
different industrial castings were used to validate this commercial finite element code.
6.1 Introduction
ProCAST is a commercial finite element code which can be used to simulate multiple
casting activities such as filling, solidification and defect prediction in continuous as well
as direct chill castings. The software consists of four modules Meshcast, Precast,
ProCAST and Viewcast In addition to hot tears, this program calculates the probable
locations of porosity, principal stresses in the casting, Microstructure properties and many
other results which are important for foundry industries, the following table highlights the
functions of each of the module.
Table 6.1 Modules in Simulation Software
Module Function
Precast - For meshing the geometries
- It identifies and cures flaws in geometries
Precast - For giving boundary conditions
- For initiating the solvers, stress solvers and thermal solvers
ProCAST - Solver which provides the entire results using Datacast which holds
data
Viewcast - It exports the results and it is the module in which we view the obtained
results
- Porosity, Hot tear, Microstructure, Gradients ,temperatures,etc.

68
6 .2 Hot Tear model in Simulation software
During a stress calculation, the simulation software calculates the hot susceptibility to
tearing. The hot tearing indicator allows to model cracks which are forming during the
solidification (i.e. it corresponds to openings in between dendrites which are not yet totally
solidified and which are opening because of a tensile stress). The hot tearing indicator is a
"strain-driven" model based upon the total strain which occurs during the solidification.
The model is computing the elastic and the plastic strain at a given node when the fraction
of solid is between CRITFS (usually 80%) and 99%. There is no parameter for this model
(except CRITFS which is a general stress Run Parameter).
As the amount of plastic strain will strongly depend upon the stress properties in the
mushy zone, the hot tearing indicator should be used to compare different designs with the
same alloy. One should not compare hot tearing indicator levels for different alloys.
6.2 .1 Case 1
Steel castings are prone to hot tear as they are cast in a rather hard mold when compared to
other sand castings owing to tolerances, accuracy and to reduce machining costs. In this
case a steel casting was analyzed using the program which had developed tear at its
junction due to a strong mold which caused a constraint to its free contraction, an elastic-
plastic model of plain carbon steel was taken for stress simulation, which called for both
plastic and elastic modulus and yield strength. The plain carbon steel AISI 1028 properties
were taken from ProCAST (also specified in annexure 2).
The pouring details were taken from literature (Jinwu Kang et al., 1999).The 3d model of
the casting is shown in the Fig.6.1

69
(a)
(b)
(c)
Fig 6.1 (a) Geometry (b) Solid model (c) ProCAST Analysis
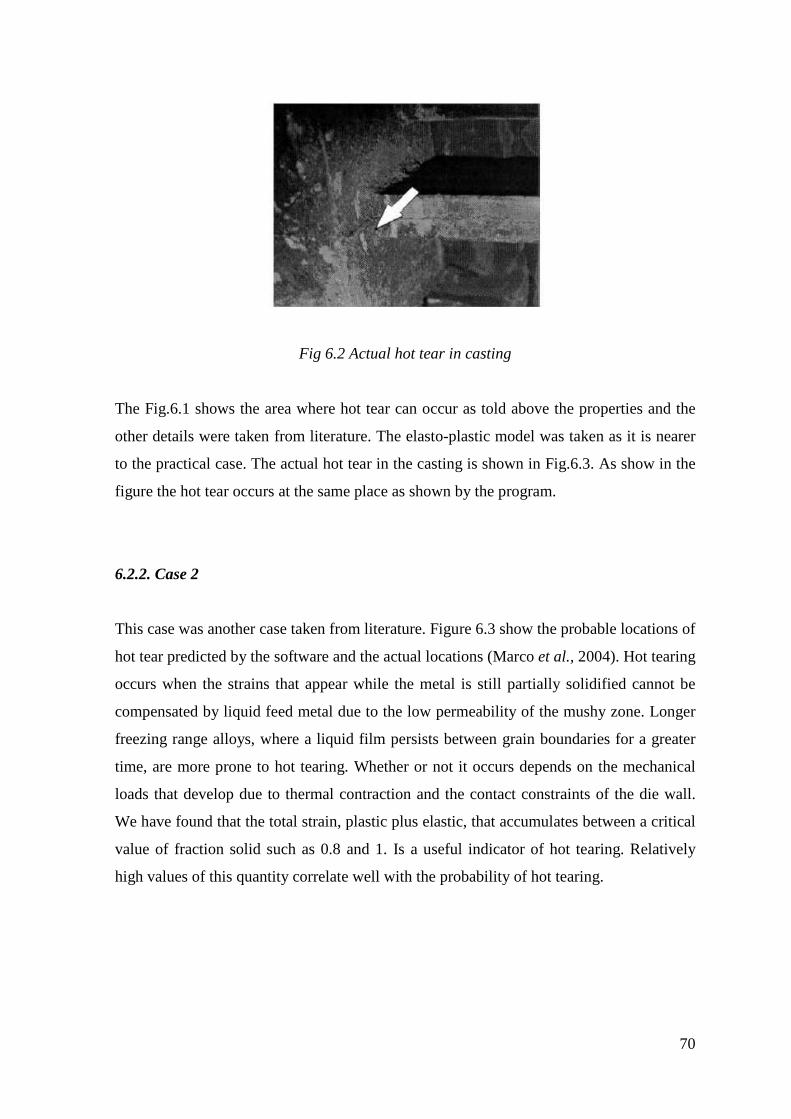
70
Fig 6.2 Actual hot tear in casting
The Fig.6.1 shows the area where hot tear can occur as told above the properties and the
other details were taken from literature. The elasto-plastic model was taken as it is nearer
to the practical case. The actual hot tear in the casting is shown in Fig.6.3. As show in the
figure the hot tear occurs at the same place as shown by the program.
6.2.2. Case 2
This case was another case taken from literature. Figure 6.3 show the probable locations of
hot tear predicted by the software and the actual locations (Marco et al., 2004). Hot tearing
occurs when the strains that appear while the metal is still partially solidified cannot be
compensated by liquid feed metal due to the low permeability of the mushy zone. Longer
freezing range alloys, where a liquid film persists between grain boundaries for a greater
time, are more prone to hot tearing. Whether or not it occurs depends on the mechanical
loads that develop due to thermal contraction and the contact constraints of the die wall.
We have found that the total strain, plastic plus elastic, that accumulates between a critical
value of fraction solid such as 0.8 and 1. Is a useful indicator of hot tearing. Relatively
high values of this quantity correlate well with the probability of hot tearing.

71
Fig.6.3 Hot tear validation with industrial casting (Marco et al., 2004)
It corresponds to a plastic strain driven model where accumulated plastic strains allow
cracks to nucleate and grow. All the plastic strain is considered, including plastic strains
formed in the mushy zone. The model couples the stress calculation with the porosity
calculation. The presence of porosity, corresponding to a void fraction indicator, will
increase the risk of cracking. The location of actual hot tear and the one predicted by the
program are almost similar, this shows the predicting ability of software, subject to
boundary conditions and material properties. The present case is taken from literature
(Marco et al., 2004).However it helps in justifying the ability of this commercial software
to predict hot tear.
6.2.3 Industrial casting
An industrial casting of steel was taken from Vulkan technologies, Pune. The casting had
hot tear as shown in fig. 6.5 .The part model of the casting was modeled as per the number
of feeders provided during actual casting practice. The part model of the casting is shown
in fig 6.4. The casting had large thickness gradients which could have been one of the
possibilities of the tear formation. The feeders provided were also very large thus
increasing the area of hot spot. These could have been the reasons of tear formation. The
huge thickness gradient can be reduced to decrease the chances of hot tear formation.

72
(a)
(b)
Fig.6.4 (a) Casting model
(b) Casting with feeders
The model with feeders was simulated in commercial simulation software. The properties
were modified as per the grade of steel. The simulation results were than compared to the
actual hot tear location in the castings. The tear locations in simulations were in good
accordance with the actual location.

Fig.6.5 Comparison of actual
6.3 Summary
The ability of this commercial software was validated using two castings taken from
literature, this enables us to go further and simulate the virtual experiments by varying
geometrical parameters so that correlation of the equation is possible. Since fewer accurate
properties of metals are present, sometimes there may be errors due to ap
the property values. However in this case the accurate values are taken and since
validation has been done the next chapter highlights the design of experiments which
include good combinations of all variations to get a good equation.
Fig.6.5 Comparison of actual hot tear location with simulation results
The ability of this commercial software was validated using two castings taken from
literature, this enables us to go further and simulate the virtual experiments by varying
geometrical parameters so that correlation of the equation is possible. Since fewer accurate
properties of metals are present, sometimes there may be errors due to ap
the property values. However in this case the accurate values are taken and since
validation has been done the next chapter highlights the design of experiments which
include good combinations of all variations to get a good equation.
73
hot tear location with simulation results
The ability of this commercial software was validated using two castings taken from
literature, this enables us to go further and simulate the virtual experiments by varying
geometrical parameters so that correlation of the equation is possible. Since fewer accurate
properties of metals are present, sometimes there may be errors due to approximation of
the property values. However in this case the accurate values are taken and since
validation has been done the next chapter highlights the design of experiments which

Chapter 7
Virtual Experiments and Validation
To correlate the relation between hot tear susceptibility and the junction’s geometric
parameters, simulation results of number of variations of ea
This chapter highlights the nu
taguchi technique. In the present chapter the following approach has been followed.
Variation of geometric parameters of benchmark shape and simulation of all the
Optimising the number of simulation trials by using Taguchi technique
Simulations of the reduced trials in commercial simulation software to predict hot tear
Regression analysis to obtain relation between the hot tear tendency and the geometrical parameters which were varied
Validation on experimental castings and castings taken from literature
Virtual Experiments and Validation
To correlate the relation between hot tear susceptibility and the junction’s geometric
parameters, simulation results of number of variations of each of the parameters is needed.
his chapter highlights the number of virtual experiments and their optimization using
In the present chapter the following approach has been followed.
Fig. 7.1: Overall approach
Variation of geometric parameters of benchmark shape and simulation of all the shapes in a commercial software
Optimising the number of simulation trials by using Taguchi technique
Simulations of the reduced trials in commercial simulation software to predict hot tear tendency
Regression analysis to obtain relation between the hot tear tendency and the geometrical parameters which were varied.
Validation on experimental castings and castings taken from literature
74
Virtual Experiments and Validation
To correlate the relation between hot tear susceptibility and the junction’s geometric
ch of the parameters is needed.
mber of virtual experiments and their optimization using
In the present chapter the following approach has been followed.
Variation of geometric parameters of benchmark shape and simulation of all the
Optimising the number of simulation trials by using Taguchi technique
Simulations of the reduced trials in commercial simulation software to predict hot tear
Regression analysis to obtain relation between the hot tear tendency and the
Validation on experimental castings and castings taken from literature

75
Both AutoCAST and ProCAST are used to simulate the variations in benchmark
shapes.the reason for using both the softwares for simulations are
• To cross check the results and reduce the error.
• AutoCAST is more flexible which readily gives the time at required fractions .
• ProCAST uses a FEM based method which deals with nodes , and AutoCAST
gives more flexibility as it is based on geometry.
7.1 Variation of parameters in benchmark shape
Geometrical parameters of each of the three junctions are varied which directly
corresponds to change in hot tear tendency values. In addition to that the susceptibility
may also depend on other thermal properties like gradient, cooling rate, however since
level cannot be fixed to solidification time and gradient, Initially taguchi method was not
used and the simulation was carried out with around 76 variations to see the influence of
the variables . Insignificant parameters can be then removed and then Taguchi technique
could be used to increase the significance of each of the parameters as well as reduce the
errors and improve the accuracy. Variation of L junction is shown in the given table. All
the simulations of these variations were also performed on AutoCAST other than a
commercial software to have a better accuracy of thermal data such as gradient and
solidification time. Thermal gradient value was taken from AutoCAST and a new time
parameter was introduced.
Table 7.1 Variation map for L junction
Variation in
parameter
L1 L2 T1 T2 D Number of
experiments
D 250 100 10 50 20- 100 6
L1 and L2 100-1500 100-2000 10 50 50 30
T1 and T2 250 100 10-100 10-300 50 20
Random 100-400 70-500 10-200 10-300 20-100 20

76
Table 7.2 P values in L shape
L1 L2 T1 T2 TG
P Value 0.304 0.0137 5.49E-10 0.001 0.87
Here in Table 7.2 TG is thermal gradient, the rest are geometrical parameters for L shape.
A similar variation map as in Table 7.1 was prepared for C and T shape and all the
simulations were carried out in two commercial software’s (Appendix 1). It was seen that
there was not much significance of thermal gradient values and the regression analysis
showed a lesser value of P. P value shows how significantly the relation is established.
Higher P values suggest that the relations are arbitrary. Ideally it should be nearer to zero.
As shown the P value of thermal gradient is very high, the thermal gradient (TG) values
are taken from AutoCAST .Thermal gradient is highly correlated to other geometric
factors and hence the effect of it is reduced. Since the geometrical factors are varied more
and hence the influence of this on thermal gradient is high this is possibly one of the
reasons for this outcome.
7.2 Taguchi method for design of experiments
The significance map for the experiments performed for the variations as shown in Table
7.1 is shown in Table 7.2. The results show poor significance values when regression was
performed and also since the thermal gradient and other factors had less influence, the
parameters could now be varied in levels as per Taguchi’s requirement which helped in
reducing each of experiments from over 1000 to as less as 16. However the significance
value (R2) depends on the number of experiments and hence all those experiments that
were done before was merged with these sixteen results to obtain better results and
significance. Minitab software was used to design experiments as per Taguchi method,
then number of levels considered for each of the geometrical parameter was four and the
numbers of geometrical parameters were 5 and hence the matrix obtained was a 4 level
and five factors as shown in Table 7.3. The number of factors and the levels are same for
both T as well as L junctions. The levels map that is the variation used in L and T
junctions are shown below.

77
Table 7.3 Level map for L shape and T shape
L shape
Level 1 Level 2 Level 3 Level 4
L1 50 150 250 350
L2 50 150 250 350
T1 10 40 70 100
T2 10 40 70 100
D 10 40 70 100
T Shape
L1 150 250 350 450
L2 50 150 250 350
T1 10 40 70 100
T2 10 40 70 100
D 30 50 70 90
Here the values represents the levels , that is L1 – 1 is the first level of the variable L1 that
is 50 , similarly the value D - 4 means the fourth level of the variable D, which
corresponds to 90 in the case of L junction. These sixteen simulations were performed and
analyzed in both the software programs mentioned above to get a regression equation
based on geometrical parameters which correspond to hot tear susceptibility, a new
parameter Time that is solidification time during 80% to 100 % where there are maximum
chances of hot tear occurrence is also introduced, this value is taken from AutoCAST
owing to its flexibility. Thermal gradient and critical time was taken from AutoCAST.
Critical time = t1.00 –t0.80 ( 35)
t1.00 – Time taken for solidi fraction is 1.00
t0.80 – Time when the fraction of solid is 0.8

78
Table 7.4 Design of Experiments for L and T shape
L1 L2 T1 T2 D
1 1 1 1 1
1 2 2 2 2
1 3 3 3 3
1 4 4 4 4
2 1 2 3 4
2 2 1 4 3
2 3 4 1 2
2 4 3 2 1
3 1 3 4 2
3 2 4 3 1
3 3 1 2 4
3 4 2 1 3
4 1 4 2 3
4 2 3 1 4
4 3 2 4 1
4 4 1 3 2
Similarly in C shape the geometrical parameters were fixed, In C shape the number of
factors were seven, and hence the suitable level –factor system obtained from Minitab
software. One parameter was varied for six levels and the remaining six factors were
varied to three levels each, to finally obtain an 18 row matrix for C shape. The matrix
designed for C shape is shown in Table 7.5. All the experiments design given by
minitab were modeled and analyzed by two commercial softwares. The results are than
analysed and a regression model in between the geometrical parameters and the hot
tear was correlated.

79
Table 7.5 Design of experiments for C shape
L1 L2
L3 T1 T2 T3 D
1 (50) 1 (50) 1 (50) 1 (10) 1 (10) 1 (10) 1 (10)
1 (50) 2 (150) 2 (150) 2 (50) 2 (50) 2 (50) 2 (50)
1 (50) 3 (250) 3 (250) 3 (90) 3 (90) 3 (90) 3 (90)
2 (150) 1 (50) 1 (50) 2 (50) 2 (50) 3 (90) 3 (90)
2 (150) 2 (150) 2 (150) 3 (90) 3 (90) 1 (10) 1 (10)
2 (150) 3 (250) 3 (250) 1 (10) 1 (10) 2 (50) 2 (50)
3 (250) 1 (50) 2 (150) 1 (10) 3 (90) 2 (50) 3 (90)
3 (250) 2 (150) 3 (250) 2 (50) 1 (10) 3 (90) 1 (10)
3 (250) 3 (250) 1 (50) 3 (90) 2 (50) 1 (10) 2 (50)
4 (350) 1 (50) 3 (250) 3 (90) 2 (50) 2 (50) 1 (10)
4 (350) 2 (150) 1 (50) 1 (10) 3 (90) 3 (90) 2 (50)
4 (350) 3 (250) 2 (150) 2 (50) 1 (10) 1 (10) 3 (90)
5 (450) 2 (150) 3 (250) 1 (10) 2 (50) 1 (10) 3 (90)
5 (450) 1 (50) 2 (150) 3 (90) 1 (10) 3 (90) 2 (50)
5 (450) 3 (250) 1 (50) 2 (50) 3 (90) 2 (50) 1 (10)
6 (550) 1 (50) 3 (250) 2 (50) 3 (90) 1 (10) 2 (50)
6 (550) 2 (150) 1 (50) 3 (90) 1 (10) 2 (50) 3 (90)
6 (550) 3 (250) 2 (150) 1 (10) 2 (50) 3 (90) 1 (10)
The table shows the variations of each of the parameters for example 6(550) in column L1
means it’s the sixth level and the value of the level is 550, Here all dimensions are in mm .
All these eighteen simulations and the other performed before taguchi method were
considered and used to obtain a regression equation to map hot tear with geometrical
parameters.
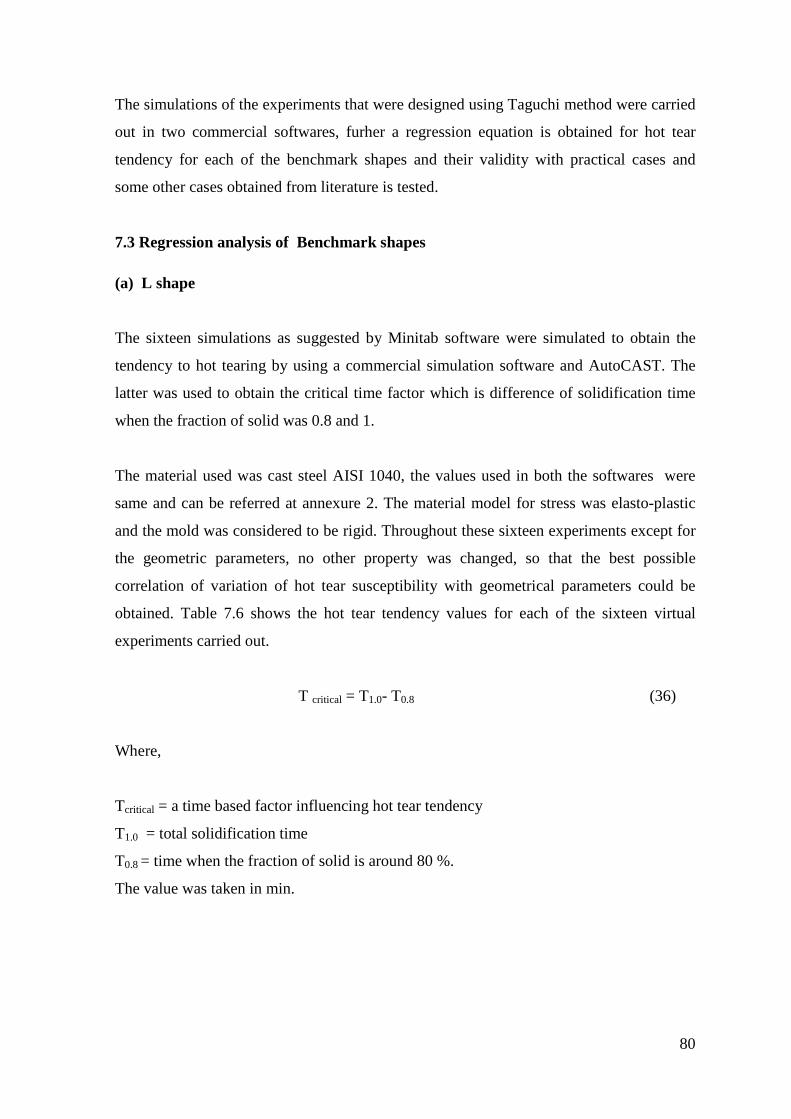
80
The simulations of the experiments that were designed using Taguchi method were carried
out in two commercial softwares, furher a regression equation is obtained for hot tear
tendency for each of the benchmark shapes and their validity with practical cases and
some other cases obtained from literature is tested.
7.3 Regression analysis of Benchmark shapes
(a) L shape
The sixteen simulations as suggested by Minitab software were simulated to obtain the
tendency to hot tearing by using a commercial simulation software and AutoCAST. The
latter was used to obtain the critical time factor which is difference of solidification time
when the fraction of solid was 0.8 and 1.
The material used was cast steel AISI 1040, the values used in both the softwares were
same and can be referred at annexure 2. The material model for stress was elasto-plastic
and the mold was considered to be rigid. Throughout these sixteen experiments except for
the geometric parameters, no other property was changed, so that the best possible
correlation of variation of hot tear susceptibility with geometrical parameters could be
obtained. Table 7.6 shows the hot tear tendency values for each of the sixteen virtual
experiments carried out.
T critical = T1.0- T0.8 (36)
Where,
Tcritical = a time based factor influencing hot tear tendency
T1.0 = total solidification time
T0.8 = time when the fraction of solid is around 80 %.
The value was taken in min.

81
Table 7.6 Values of hot tear tendency for experiments of L shape
Case L1 L2 T1 T2 Depth Critical
Time
(AutoCAST)
Hot tear
Tendency
1 50 50 10 10 10 0.058 0.06
2 50 150 40 40 40 1.14 0.07
3 50 250 70 70 70 3.03 0.144
4 50 350 100 100 100 5.77 0.147
5 150 50 40 70 100 3.52 0.075
6 150 150 10 100 70 3.74 0.14
7 150 250 100 10 40 1.59 0.178
8 150 350 70 40 10 0.13 0.06
9 250 50 70 100 40 1.51 0.079
10 250 150 100 70 10 0.12 0.109
11 250 250 10 40 100 1.48 0.183
12 250 350 40 10 70 1.52 0.133
13 350 50 100 40 70 3.72 0.09
14 350 150 70 10 100 4.04 0.217
315 350 250 40 100 10 0.14 0.07
16 350 350 10 70 40 1.39 0.147
These are the results obtained for L shape from both the commercial software, thermal
gradient was also taken into consideration and it was found that it had less significance,
However since each of the parameters have significant influence on hot tear values, thus
it’s very difficult to accurately interpret the physical significance, for example depth and
critical time each have significant influence on hot tear but the effect of only one is seen
because time and depth are again correlated to each other, same is the case with thermal
gradient also. Different combinations of the geometrical parameters were taken and the
regression line with the best possible R2 value was taken into consideration.

82
Since the regression equation with high R2 value, less p value and more t value shows that
the regression equation is not random. In short these parameters that are R2, T and P can
significantly tell about the feasibility of the regression line.
The regression equation obtained by regression analysis of the experiments done on L
junction and including the previous simulations done as Equation is of the form
�. �. � = ��3 ∗ ��% ∗ ��� ∗ ��. ∗ ]\ ∗ �� (37)
Where,
H.T.S = hot tearing susceptibility
L1 = length of the arm,
T1= Thickness of arm,
L2 = length of leg,
T2 = Thickness of leg,
T = Critical time,
D- Depth.
And a, b, c, d, e, f– Exponential coefficients.
The R2 value is 98.5 which shows the accuracy to which it will predict, the p value of each
of the variables shows the significance, lesser the p value more the significance, and
similarly more the t value significance is better. The following table highlights the
coefficients obtained by regression analysis.
Table 7.7 Regression Table for L shape
a b c D e f
Coefficient 0.17687 0.12518 -0.516
-0.26047 -0.285 0.2604
P value 0.016488 0.04 0.19 4.9E-12 0.9E-5 0.18E-4
T Value 2.75404 4.53931 -7.84791 -5.10977 -8.18 2.90489

83
The values corresponding to coefficients are the absolute values to which the parameters
would be raised as suggested by Eq (41).the critical time is measured form simulation of
the experiments using AutoCAST.
(b) Regression analysis of T junction
T junction had five variable parameters with the total number of experiments turning out
to be sixteen as the case was same as L junction, Hot tearing tendencies of the these
castings were simulated .The material properties were of plain carbon steel, same as that
of the L shape . Refer annexure 1.Table 7.8 highlights the coefficients of T shape obtained
after the regression analysis of the simulation experiments (Table 7.9). The equation is of
the form,
�. �. � = ��3 ∗ ��% ∗ ��� ∗ ��. ∗ ]\ ∗ �� (38)
Where,
H.T.S = hot tearing susceptibility
L1 = length of the arm,
T1= Thickness of arm,
L2 = length of leg,
T2 = Thickness of leg,
T = Critical time,
D- Depth.
And a, b, c, d, e, f– Exponential coefficients.
Table 7.8 Regression table for T shape
L1 L2 T1 T2 D T
-0.19106 0.29757 -0.29406 -.45854 -0.00783 0.549816 Coefficient
0.006 0.000638 0.000527 7.37E-06 0.95 7.69E-06 P value
-3.03157 4.080263 -4.163 -6.09322 -0.0583 6.073297 T Value

84
Table 7.9 Hot tear tendency values for T shape
S.No L1 L2 T1 T2 D
Critical
Time Hot Tear
1 150 50 10 10 30 0.2 0.076
2 150 150 40 40 50 1.48 0.096
3 150 250 70 70 70 3.23 0.127
4 150 350 100 100 90 5.59 0.147
5 250 50 40 70 90 4.2 0.11
6 250 150 10 100 70 3.77 0.22
7 250 250 100 10 50 2.3 0.294
8 250 350 70 40 30 0.85 0.064
9 350 50 70 100 50 2.25 0.085
10 350 150 100 70 30 0.77 0.07
11 350 250 10 40 90 1.58 0.18
12 350 350 40 10 70 1.46 0.42
13 450 50 100 40 70 3.94 0.08
14 450 150 70 10 90 3.65 0.258
15 450 250 40 100 30 0.98 0.08
16 450 350 10 70 50 1.97 0.187
The p values show the significance of the relation whether the relation is arbitrary or
discrete. The value of 0.95 shows that the parameter D is less significant as again the
critical Time and depth are correlated. Table 8.4 shows the values of the hot tear tendency.
c) Regression analysis of C junction
C junction has seven variable parameters with the total number of experiments turning out
to be eighteen; hot tearing tendencies of these castings were simulated. The material
properties were of plain carbon steel, same as that of the L shape (Appendix 2).

85
The equation is of the form
�. �. � = ��3 ∗ ��% ∗ �(� ∗ ��� ∗ ��. ∗ �(! ∗ ]\ ∗ �� (39)
Where,
H.T.S = hot tearing susceptibility
L1 = length of the arm,
T1= Thickness of arm,
L2 = length of leg 1,
L3 = Length of leg 2
T2 = Thickness of leg 1,
T3 = thickness of leg 3,
T = Critical time,
D- Depth.
And a, b, c, e, d, e, f, g, h – Exponential coefficients.
The coefficient values corresponds to the values given by the Annova regression
analysis(Table 7.10) , the p values correspond to the significance of the given coefficients.
Table 7.11 highlights the hot tear values at both the right and the left junctions in the c
shape.
Table 7.10 Regression Values for C shape
Larm L1 L2 Tarm T1 T2 Time
Coefficient 0.48 -0.28 X -0.922 .1037 -0.03 .168 Right
P Value 4.4E-0.5 0.01 X 3.89E-14 0.01 0.64 0.01 Right
Larm L1 L2 Tarm T1 T2 D
Coefficient 0.305 - 0.11 0.10 -0.92 0.24 -0.24 0.18 Left
P value 0.04 0.4 0.5 7.35E-11 0.04971 0.04557 0.04 Left

86
Table 7.11 Hot tear tendency values for C shape
L1 L2 L3 T1 T2 T3 D Time
Hot tear
(left )
Hot tear
(right)
50 50 50 10 10 10 10 0.06 0.055 0.07
50 150 150 50 50 50 50 1.69 0.045 0.045
50 250 250 90 90 90 90 5.93 0.05 0.05
150 50 50 50 50 90 90 3.94 0.07 0.069
150 150 150 90 90 10 10 0.11 0.075 0.85
150 250 250 10 10 50 50 1.39 0.162 0.28
250 50 150 10 90 50 90 2.77 0.97 1.06
250 150 250 50 10 90 10 0.17 0.1 0.07
250 250 50 90 50 10 50 2.29 0.063 0.188
350 50 250 90 50 50 10 0.14 0.127 0.106
350 150 50 10 90 90 50 2.46 1.03 1.1
350 250 150 50 10 10 90 2.29 0.142 0.19
450 150 250 10 50 10 90 2.83 1.4 0.51
450 50 150 90 10 90 50 2.59 0.19 0.11
450 250 50 50 90 50 10 0.26 0.101 0.12
550 50 250 50 90 10 50 2.41 0.1 0.185
550 150 50 90 10 50 90 4.81 0.17 0.13
550 250 150 10 50 90 10 0.38 0.7 0.25
7.4 Application of the equation on practical castings
a) Validation of L Junction
Experimental castings of L junctions were made with 0.2 carbon steel, the castings
radiography image shows a hot tear at the junction. Also few other castings were made of
L shapes but with different geometric parameters which did not have any type of tears.
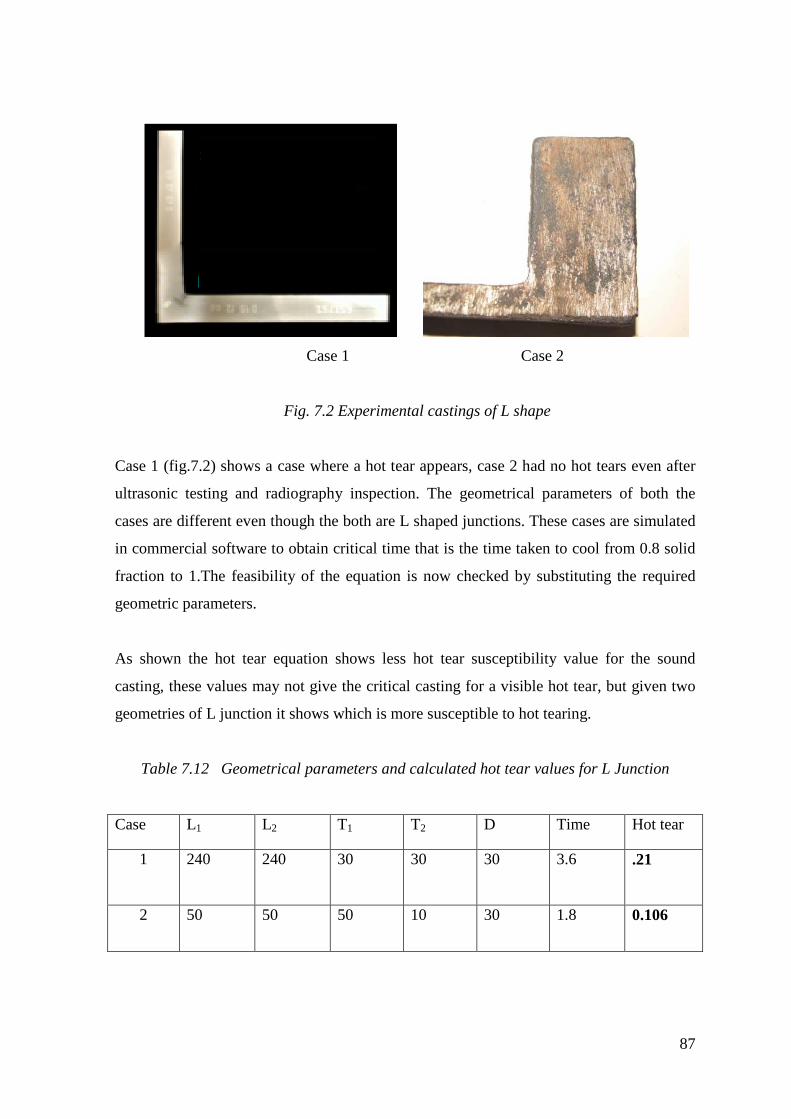
87
Case 1 Case 2
Fig. 7.2 Experimental castings of L shape
Case 1 (fig.7.2) shows a case where a hot tear appears, case 2 had no hot tears even after
ultrasonic testing and radiography inspection. The geometrical parameters of both the
cases are different even though the both are L shaped junctions. These cases are simulated
in commercial software to obtain critical time that is the time taken to cool from 0.8 solid
fraction to 1.The feasibility of the equation is now checked by substituting the required
geometric parameters.
As shown the hot tear equation shows less hot tear susceptibility value for the sound
casting, these values may not give the critical casting for a visible hot tear, but given two
geometries of L junction it shows which is more susceptible to hot tearing.
Table 7.12 Geometrical parameters and calculated hot tear values for L Junction
Case L1 L2 T1 T2 D Time Hot tear
1 240 240 30 30 30 3.6 .21
2 50 50 50 10 30 1.8 0.106

88
Table 7.13 Geometrical parameters and calculated hot tear values for T junctions
L1 L2 T1 T2 depth Time Hot tear
tendency
Visible
hot tear
Case 1 660 101 12.7 25.4 25.4 0.85 .11 Tear
Case 2 660 101 25.4 50.8 25.4 1.11 .07 No tear
Case 3 914 101 50.8 50.8 25.4 .97 .05 No tear
b) Validation of T Junction
T shaped castings of steel with carbon 0.23 % was taken from literature (Monreo and
Beckerman, 2005). Several castings were casted with changes in geometrical parameters
some of the castings were found to have hot tear defect and some of them were sound. The
different geometrical parameters are taken from (Monoe and Beckermmann, 2005) and are
analyzed by using the equation obtained from the regression analysis as shown in Table
7.13, the values however couldn’t justify a critical value above or below which tear would
occur, but the equation could justify that there is decrease in the value of hot tearing
susceptibility for the shapes which doesn’t tear as shown in Table 7.13, Hence the
equation could be used to compare to same type of castings with different geometrical
parameters.As shown in fig.7.3 case 1 shows a tear and hence comes up with a greater hot
tear susceptibility value than case 2 which doesn’t tear.
Fig.7.3: Experimental Castings of T shape (Monroe and beckermann, 1999)
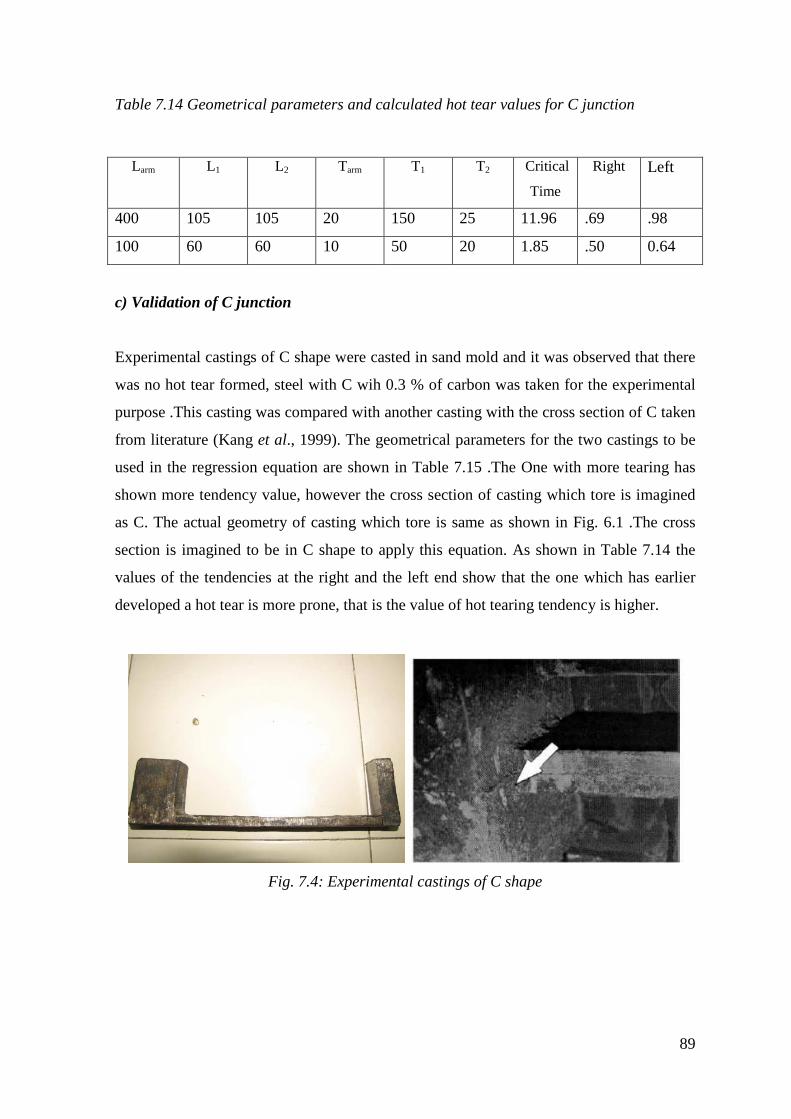
89
Table 7.14 Geometrical parameters and calculated hot tear values for C junction
Larm L1 L2 Tarm T1 T2 Critical
Time
Right Left
400 105 105 20 150 25 11.96 .69 .98
100 60 60 10 50 20 1.85 .50 0.64
c) Validation of C junction
Experimental castings of C shape were casted in sand mold and it was observed that there
was no hot tear formed, steel with C wih 0.3 % of carbon was taken for the experimental
purpose .This casting was compared with another casting with the cross section of C taken
from literature (Kang et al., 1999). The geometrical parameters for the two castings to be
used in the regression equation are shown in Table 7.15 .The One with more tearing has
shown more tendency value, however the cross section of casting which tore is imagined
as C. The actual geometry of casting which tore is same as shown in Fig. 6.1 .The cross
section is imagined to be in C shape to apply this equation. As shown in Table 7.14 the
values of the tendencies at the right and the left end show that the one which has earlier
developed a hot tear is more prone, that is the value of hot tearing tendency is higher.
Fig. 7.4: Experimental castings of C shape
90
7.5 Summary
The three regression equations were obtained and were applied on different castings.
• All the three regression equations obtained by the experiments help to predict
which geometry has greater tendency to tear when casted.
• However the critical value of hot tearing tendency after which tear can occur could
not be determined, since the hot tearing tendency values should be compared to
same material
• Also the number of practical experiments with hot tears should be high to justify
the Occurrence of hot tear at a threshold value.
• The parameters in equation are itself correlated and hence it is difficult to justify
the influence of some of the parameters.
• Mold was assumed rigid throughout the simulation, but practically mold is not 100
percent rigid, and hence a rigidity factor should be introduced.
• As far as comparison of two geometries is considered, the equation can give fairly
good result.
91
Chapter 8
Conclusions
An attempt to come up with a criterion to predict hot tear tendency based on geometrical
parameters for junctions prone to hot tear was accomplished, the following conclusions
are drawn from the work.
• Analysis of hot tear in the early stages of designing is a difficult task for a design
engineer, by predicting the tendency of hot tear before hand, scrap can be avoided.
• To sustain the competition and to improve the product quality and reduce lead
time, foundries need to reduce the defects. Defect analysis at earlier stages will
enable the casting engineer to avoid wastage of time and material during actual
trails.
• Junctions being the critical areas in casting, L, C, T were analyzed and a regression
fit between the geometric parameters of these shapes and hot tearing tendency was
correlated.
• The regression fit was validated with experimental castings and the results were
found in accordance with the practical case, the casting which developed a hot tear
showed a higher value of tendency.
• The need for developing regression equations of hot tears for some other junctions,
is identified.
• The present equation is only for steel sand combination, a need to develop a new
equation for other alloys and other types of moulds could help further to generalize
the equation.
• The best of the available criteria for predicting hot tear in continuous castings was
used to predict the hot tear in simple shapes. However the property values required
for prediction were sparsely available.

92
• The present equation is a simple and convenient equation based on geometrical
parameters which could be used readily at design stage.
• Almost all the complex castings are the complex combinations of junctions, hot
tear tendency can be evaluated by cutting them down into simple cross sections.
• The ability of ProCAST to predict the hot tear was validated with castings already
having tears.
8.1 Scope of Future Work
The future work which can be carried out in this project is as follows
• It is useful to extend the scope of the project to all the casting processes and all
materials. Currently it is limited to steel sand castings.
• In the current work the assumption made during simulation was that the mold is
always rigid, an experiment varying the mould hardness would further help in
giving accurate values of hot tearing tendency.
• The equations for predicting the hot tear in more complex junctions can be
developed and few more parameters can be included in future.
• The dependence of pouring temperature on hot tearing tendency can also be
correlated to increase the accuracy of the equation.

93
Annexure
Annexure 1: Hot tear tendency data for benchmark shapes
a) L shape - experiments results
Depth L1 L2 T1 T2 Time Gradient
Hot tear
tendency
20 250 100 10 50 0.429043 6.62 0.148
30 250 100 10 50 1.083333 7.91 0.174
50 250 100 10 50 1.402373 8.41 0.24
80 250 100 10 50 1.836158 9.6 0.33
100 250 100 10 50 2.063492 9.8 0.376
50 250 100 10 10 0.190678 4.72 0.136
50 250 100 10 30 0.821168 6.6 0.188
50 250 100 50 10 1.300578 5.82 0.22
50 250 100 20 10 0.4 5.8 0.168
50 250 100 20 20 0.642857 7.63 0.07
50 250 100 20 50 1.5 8.81 0.12
50 250 100 30 10 0.737705 6.42 0.16
50 250 100 30 30 0.882353 7 0.07
50 250 100 50 50 1.607143 11 0.083
50 250 125 10 50 1.5 8.34 0.243
50 250 250 10 50 1.363636 7.01 0.183
50 250 500 10 50 0.155172 7.13 0.192
50 250 1000 10 50 0.75 6.5 0.17
50 500 125 10 50 1.875 8.3 0.35
50 500 250 10 50 1.666667 7 0.333
50 500 500 10 50 1.5 6.8 0.24
50 500 1000 10 50 1.451613 6.5 0.17
50 1000 250 10 50 1.875 6.5 0.2
50 1000 500 10 50 1.730769 6.5 0.2
50 1000 1000 10 50 1.607143 6.8 0.342
50 1500 200 10 50 3 7.33 0.3
50 1500 250 10 50 2.866242 6 0.53
50 1500 500 10 50 2.5 5.8 0.596
50 1500 800 10 50 2.368421 6.77 0.43
50 1500 750 10 50 2.319588 5.36 0.41
50 1500 1000 10 50 2.25 6.36 0.515
50 1500 1500 10 50 1.184211 6.35 0.5
50 1500 2000 10 50 1.216216 6.53 0.43
50 200 250 10 50 1.451613 7 0.209
50 250 200 10 50 1.451613 7.5 0.168
20 100 200 10 70 0.371901 4.64 0.144
20 200 100 70 10 0.321429 5.32 0.123
20 500 250 100 50 0.432692 5 0.101
30 250 500 50 100 0.9 7 0.07
30 300 100 50 10 1.607143 6.58 0.16

94
40 500 100 100 20 1.607143 6.52 0.092
50 500 200 100 300 2.8125 12.2 0.07
60 100 300 50 80 2.727273 12.02 0.013
70 400 400 30 10 0.9 6.07 0.211
80 400 300 200 100 4.5 15.3 0.15
100 300 300 10 30 0.821168 7.71 0.143
100 400 100 10 10 0.190678 514 0.32
30 200 100 20 100 0.882353 7.13 0.1
40 300 150 16 80 1.5 7.1 0.112
50 400 200 24 120 2.8125 9.39 0.106
60 200 300 30 150 3 10.1 0.07
30 100 200 40 200 0.661765 8.45 0.07
30 200 100 30 90 0.849057 8.1 0.06
40 300 150 16 48 1.323529 8.19 0.09
50 400 200 70 210 2.142857 11.26 0.1
60 200 300 50 150 3 10.8 0.083
20 100 200 40 120 0.36 6.81 0.05
20 100 70 50 10 0.32 6.36 0.07
40 200 100 80 20 1.31 6.35 0.012
50 300 150 100 20 2.08 6.53 0.01
40 250 200 80 15 1.42 7 0.12
60 300 100 20 20 0.75 7.5 0.06
80 350 100 30 10 0.81 4.64 0.146
100 350 100 80 10 4.48 5.32 0.114
100 350 100 80 50 4.44 6.36 0.065
100 350 100 80 80 4.59 6.35 0.05
b) T shape experiments results
L1 L2 T1 T2 D time Hot tearTendency
150 50 10 10 30 0.2 0.076
150 150 40 40 50 1.48 0.096
150 250 70 70 70 3.23 0.127
150 350 100 100 90 5.59 0.147
250 50 40 70 90 4.2 0.11
250 150 10 100 70 3.77 0.22
250 250 100 10 50 2.3 0.294
250 350 70 40 30 0.85 0.064
350 50 70 100 50 2.25 0.085
350 150 100 70 30 0.77 0.07
350 250 10 40 90 1.58 0.18
350 350 40 10 70 1.46 0.42
450 50 100 40 70 3.94 0.08
450 150 70 10 90 3.65 0.258
450 250 40 100 30 0.98 0.08
450 350 10 70 50 1.97 0.187
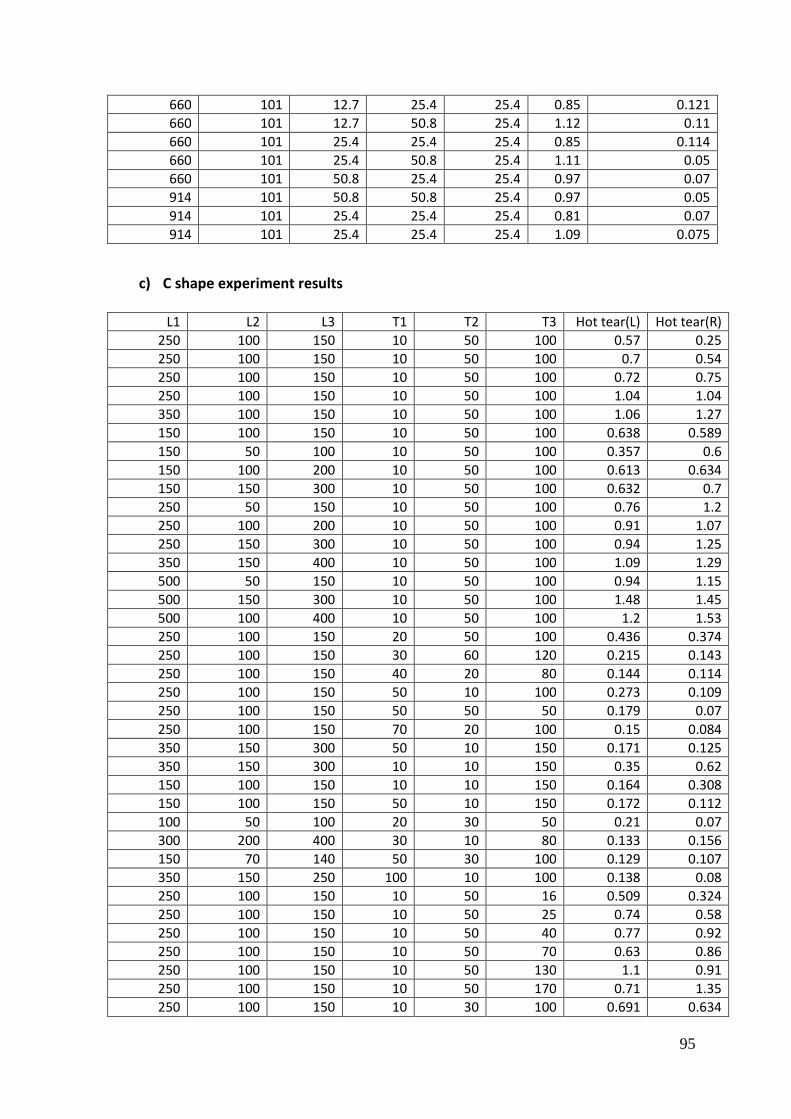
95
660 101 12.7 25.4 25.4 0.85 0.121
660 101 12.7 50.8 25.4 1.12 0.11
660 101 25.4 25.4 25.4 0.85 0.114
660 101 25.4 50.8 25.4 1.11 0.05
660 101 50.8 25.4 25.4 0.97 0.07
914 101 50.8 50.8 25.4 0.97 0.05
914 101 25.4 25.4 25.4 0.81 0.07
914 101 25.4 25.4 25.4 1.09 0.075
c) C shape experiment results
L1 L2 L3 T1 T2 T3 Hot tear(L) Hot tear(R)
250 100 150 10 50 100 0.57 0.25
250 100 150 10 50 100 0.7 0.54
250 100 150 10 50 100 0.72 0.75
250 100 150 10 50 100 1.04 1.04
350 100 150 10 50 100 1.06 1.27
150 100 150 10 50 100 0.638 0.589
150 50 100 10 50 100 0.357 0.6
150 100 200 10 50 100 0.613 0.634
150 150 300 10 50 100 0.632 0.7
250 50 150 10 50 100 0.76 1.2
250 100 200 10 50 100 0.91 1.07
250 150 300 10 50 100 0.94 1.25
350 150 400 10 50 100 1.09 1.29
500 50 150 10 50 100 0.94 1.15
500 150 300 10 50 100 1.48 1.45
500 100 400 10 50 100 1.2 1.53
250 100 150 20 50 100 0.436 0.374
250 100 150 30 60 120 0.215 0.143
250 100 150 40 20 80 0.144 0.114
250 100 150 50 10 100 0.273 0.109
250 100 150 50 50 50 0.179 0.07
250 100 150 70 20 100 0.15 0.084
350 150 300 50 10 150 0.171 0.125
350 150 300 10 10 150 0.35 0.62
150 100 150 10 10 150 0.164 0.308
150 100 150 50 10 150 0.172 0.112
100 50 100 20 30 50 0.21 0.07
300 200 400 30 10 80 0.133 0.156
150 70 140 50 30 100 0.129 0.107
350 150 250 100 10 100 0.138 0.08
250 100 150 10 50 16 0.509 0.324
250 100 150 10 50 25 0.74 0.58
250 100 150 10 50 40 0.77 0.92
250 100 150 10 50 70 0.63 0.86
250 100 150 10 50 130 1.1 0.91
250 100 150 10 50 170 0.71 1.35
250 100 150 10 30 100 0.691 0.634

96
250 100 150 10 80 100 1.04 0.95
250 100 150 10 100 100 1.01 1.01
250 100 150 10 150 100 0.92 0.92
250 150 100 10 50 10 0.313 0.139
250 250 50 10 100 50 0.75 0.6
300 200 100 10 70 20 0.56 0.44
300 200 50 20 20 20 0.08 0.114
350 300 150 20 70 20 0.23 0.112

97
Annexure 2: Properties of steel used in simulation
Temperature
conductivity Thermal conductivity
2.30E+01 2.50E+01
2.00E+02 2.63E+01
5.00E+02 2.73E+01
6.00E+02 2.78E+01
8.00E+02 2.81E+01
8.50E+02 2.84E+01
9.00E+02 3.04E+01
1.00E+03 3.12E+01
1.10E+03 3.42E+01
2.00E+03 3.42E+01
Temperature Density
2.45E+02 7.63E+03
2.65E+02 7.62E+03
2.85E+02 7.61E+03
3.05E+02 7.61E+03
3.25E+02 7.60E+03
3.45E+02 7.60E+03
3.65E+02 7.59E+03
3.85E+02 7.58E+03
4.05E+02 7.58E+03
4.25E+02 7.57E+03
4.45E+02 7.56E+03
4.65E+02 7.56E+03
4.85E+02 7.55E+03
5.05E+02 7.55E+03
5.25E+02 7.54E+03
5.45E+02 7.53E+03
5.65E+02 7.53E+03
5.85E+02 7.52E+03
6.05E+02 7.51E+03
Temerature Youngs modulus
2.48E+02 2.10E+05
3.38E+02 2.07E+05
4.28E+02 2.00E+05
5.18E+02 1.89E+05
6.08E+02 1.75E+05
6.98E+02 1.58E+05
7.88E+02 1.41E+05
8.78E+02 1.25E+05
9.68E+02 1.05E+05
1.06E+03 8.60E+04
1.15E+03 6.62E+04

98
1.24E+03 4.67E+04
1.33E+03 2.80E+04
1.37E+03 1.80E+04
1.38E+03 1.52E+04
1.39E+03 1.25E+04
1.40E+03 9.92E+03
1.41E+03 7.38E+03
1.42E+03 5.00E+03
1.43E+03 2.94E+03
1.44E+03 1.67E+03
Temperature Poison ratio
2.48E+02 3.63E-01
3.68E+02 3.63E-01
4.88E+02 3.63E-01
6.08E+02 3.63E-01
7.28E+02 3.63E-01
8.48E+02 3.63E-01
9.68E+02 3.63E-01
1.09E+03 3.63E-01
1.21E+03 3.63E-01
1.33E+03 3.63E-01
1.38E+03 3.67E-01
1.39E+03 3.72E-01
1.40E+03 3.79E-01
Temperature
Thermal expansion
coefficient
3.58E+02 1.43E-05
5.98E+02 1.52E-05
7.78E+02 1.51E-05
8.38E+02 1.52E-05
8.98E+02 1.26E-05
1.02E+03 1.42E-05
1.14E+03 1.53E-05
1.26E+03 1.61E-05
1.37E+03 1.66E-05
1.38E+03 1.65E-05
1.40E+03 1.64E-05
1.41E+03 1.63E-05
1.42E+03 1.60E-05
1.43E+03 1.55E-05
1.47E+03 1.47E-05

99
References
Journal articles
1. Eskin, D.G., Suyitno, Katgerman, L., “Mechanical properties in the semi-solid state
and hot tearing of aluminum alloys,” Progress in Materials Science, 49 (2004),
629–711.
2. Suyitno, Kool, W.H., and Katgerman, L., “Hot Tearing Criteria Evaluation for
Direct- Chill Casting of an Al-4.5 Pct Cu Alloy”, Metallurgical and Materials
Transactions A, (2005) Vol. 36, 1536-48.
3. D. Joshi, B.Ravi, “Classification and Simulation Based Design of 3D Junctions in
Casting”, American Foundry Society, (2009).
4. Rappaz, M., Drezet, J.M., and Gremaud, M., “A New Hot-Tearing Criterion,” in
Metallurgical and Material Transactions. A, (1999), vol. 30A, pp.449-455.
5. Hatamia, N., Babaeia,R., Dadashzadeha,M., and Davamib,P., “Modeling of hot
tearing formation during solidification,” The Journal of Materials Processing
Technology, 205 (2008), pp.506–513.
6. Braccini, M., Martin, C.L., Suery, M., (2002). In: Sahm, P.R., Hansen, P.N., Conley,
J.G., Modeling of Casting Welding and Advanced Solidification Processes IX.
Shaker Verlage, Aachen, pp.18–24.
7. John W. Gibbs and Patricio F. Mendez,"Solid fraction measurement using equation-
based cooling curve analysis," Scripta Materialia, 58 (2008) 699–702.
8. Davidson C., Viano D., Lu1 L., and St.John D.,” Observation of crack initiation
during hot tearing”, International Journal of Cast Metals Research (2006), VOL
19 NO 1, pp.59-65.
9. Clyne T.W., Davies G.J., In Solidif ication and casting of metals. London, Metals
Society, (1979), pp. 274-78.
10. Feurer U., In: Nieswaag H., Schut J, W., editors. “Quality Control of
Engineering Alloys and the Role of Metals Science”. Delft: Delft University of
Technology, (1977), pp.131-43.
11. Eskin D.G., and Katgerman L., “A Quest for a New Hot Tearing Criterion”,
Metallurgical and Materials Transactions, (2007), Volume 38A, 1512-19.
12. Dickhaus C.H., Ohm L., Engler S., American Foundry Society (1994), pp.101:677.
13. Eskine D., Zuidema Jr. J., Katgerman L., International Journal of Cast Metals
Research,(2002), pp.14:217.

100
14. Suhartono H.A., Potter K., Schram A., and Zenner H., “Modeling of Short Crack
Growth Under Biaxial Fatigue: Comparison between Simulation and
Experiment,
Mutiaxial Fatigue and Deformation: Testing and Prediction”, ASTM STP 1387,
Kalluri A., and Bonacuse A.J ., Eds., American Society for Testing and Materials,
West Conshohocken, PA, (2000), pp. 323-339.
15. Magnin, B., Katgerman, L., Hannart, B., 1995. In: Cross, M., Campbell, J. (Eds.),
Modeling of Casting Welding and Advanced Solidification Processes VII. TMS,
Warrendale, PA, pp. 303–310.
16. Lahaie D.J. and Dr. Bouchard M., “Physical Modeling of the Deformation
Mechanisms of Semi-Solid bodies and a Mechanical Criterion for Hot Tearing”,
Metallurgical and Materials Transaction B, August (2001), Vol.B, p697-705
17. Zhao L., Baoyin Wang N., Sahajwalla V., Pehlke R.D., Int J Cast Metals
Research, (2000), pp.13(3):167.
18. Niyama E., Uchida T., Morikawa M., and Saito S., AFSInt. Cast Met.J, (1982), pp.
52-63.
19. Pokorny M.G., Monroe C.A., Beckermann C., “ Prediction of deformation and hot
tear formation using a viscoplastic model with damage”, in Shape casting the 3rd
international symposium (2009), pp. 265-72
20. Bichler L., Elsayed A., Lee K., and Ravindran C., “Influence of Mold and Pouring
Temperatures on Hot Tearing Susceptibility of AZ91D Magnesium Alloy,”
International Journal of Metalcasting, 2 (1) (2008), pp.43-56.
21. John W. Gibbs and Patricio F. Mendez,"Solid fraction measurement using equation-
based cooling curve analysis," Scripta Materialia, 58 (2008), pp.699–702.
22. Charles Monroe., Christoph Beckermann., “Development of a hot tear indicator for
steel Castings”, in Materials Science and Engineering, A 413-414 (2005), pp.30–36.
23. Hamdi M.M., Asbjorn MO., and Fjaer G.H., TearSim: A Two-Phase Model
Addressing HotTearing Formation during Aluminum Direct Chill Casting”,
Metallurgical and Materials Transactions A, Volume 37A, (2006), pp.3069-82.
24. M. J. Couper, “Casting Defects and the Fatigue Behavior of an Al-alloy Casting”,
Fatigue Fracture Engineering Material Structure, 13 (3) (1990), pp.213-227.
25. T.R. Vijayaram et al.,"Numerical simulation of casting solidification in permanent
metallic molds," Journal of Materials Processing Technology, 178 (2006), pp.29–33.
26. Jaroslav Mackerle,"Object-oriented programming in FEM and BEM: a bibliography
(1990–2003)" Advances in Engineering Software, 35 (2004), pp.325–336.

101
27. G. K. Sigworth and Chengming Wan, "Mechanisms of Porosity Formation during
Solidification: A Theoretical Analysis" Metallurgical Transactions B 24B (1993),
pp.349-364.
28. S. J. Neises, J. J. Uicker and R. W. Heine “Geometric Modeling of Directional
Solidification Based on Section Modulus”, American Foundry Society Transaction,
61(1987), pp.25-29.
29. Yoshihiko Hangai et al.,"Quantitative evaluation of porosity in aluminum alloy die
castings by fractal analysis of spatial distribution of area," Materials and Design 30
(2009) 1169–1173.
Bibliography
1. J. Campbell, "Castings", Butterworth – Heinemann Ltd. Oxford 1991.
2. Ravi B “Metal casting- computer aided design and analysis,” PHI, 2008.
3. Minkowycs W J, Sparrow E M “Advances in numerical heat transfer,” Taylor &
Francis, 1997.
4. B Cantor, K O'Reilly,"Solidification and casting," Institute of Physics Publishing
Bristol and phiadelphia, 2003.
5. Doru Michael Stefanescu"Science and Engineering of Casting Solidification,"
Springer Science plus Business Media, 2nd edition, 2008.
6. Laurentiu Nastac,"Modeling and Simulation of Microstructure Evolution in
Solidifying," Kluwer Acedemic Publisher, New York, 2004.