Embed Size (px)
Citation preview

Simulation of Fibrous Scaffold Optimal Distribution by Genetic Algorithm
Presentation : D. Semnani
ICSIP 2009, Amsterdam
Isfahan University of Technology

2
Artificial Intelligence in Textile Engineering
ICSIP 2009, Amsterdam
•Optimization in Textiles Process, Material and Machinery
•Classification of Products
• Measuring Uniformity of Fibrous Structures
• Determination of Woven And Nonwoven Fabrics Characteristics
• Prediction of Tissue Quality

3
Application of image processing to determine the properties of the non-
woven and nano-fibers
• LightingLight source with low wave length, laser and light emitting diodes
• Magnification• Preparation
Value of the each pixel based on the adjacent values

4
SKELETONIZING OR THINNING
• Replacing each object with a narrow line (thickness: 1 pixel)
• Morphological or Pruning

5
FIBER ORIENTATION DISTRIBUTION (FOD)
• Orientation distribution functionα: the angle between fiber and horizontal axis

6

7
DIRECT TRACKING SEARCH
• Using Morphological or Pruning methods
• Every pixel has 8 adjacent pixels

8
DIRECT TRACKING SEARCH
• It is assumed that the fibers are one pixel thick and have not severe disruptions or kinks or bends within one pixel distance.

9
FOURIOR TRANSFORM• An image web was formed from light
cycles (dark to white and vice versa)
• u : frequency in X axis• v : frequency in Y axis

10
FURRIOR TRANSFORM • Power Spectrum Function
• If fiber are orientated in a special direction so frequency in same direction is low and in perpendicular direction is high.

11
FURRIOR TRANSFORM
• Evaluating image by special radius and loop thickness

12
FURRIOR TRANSFORM • If the image is not periodic, then discontinuation
points appear in transformed image.

13
FLOW FIELD ANALISYS
• The edges of image present the field orientations
• stages
1.Morphological operation
2.Calculating gradient vector for all points
3.Dividing image to the small images
4.Determining the mean orientation of fields in each small image
5.Calculating the final image orientation by using mean orientations of small images
13

14
GAUSSIAN FILTER• Replacing each point by regarding
adjacent points
• H and W : size of kernal matrice

15
GRADIENT
Sobel matrice
Gy Gx
1 2 1 1- 0 1
0 0 0 2- 0 2
1- 2- 3- 1- 0 1
x7 x4 x1 i-1
x8 x5 x2 i
x9 x6 x3 i+1
j+1 j j-1

16
FLOW FIELD ANALISYS

17
HOUGH TRANSFORM

18
HOUGH TRANSFORM

19
COMPARING METHODS• Direct Tracking is the best method for on-line
controlling but it has low speed process because of loops in its algorithm.
• Flow Field Analisys evaluate the STD lower than the other methods and can be used in on-line controlling.
• Furrior Transform is the best choice to non-on-line controlling.
• The results of Hough and Furrior Transform is so close.
Accuracy ranking

20
ORIENTATION IN REAL WEB• The best image will be one that
represents the entire field as a two dimensional projection.

21
EDGE THRESHOLDING

22
FIBER DIAMETER DISTRIBUTION

23
FIBER DIAMETER DISTRIBUTION

24
Threshold 2Threshold 1Threshold 3
MEASURING THE POROSITY OF VARIOUS SURFACE
LAYERS
• Threshold 1 : • Threshold 2 : • Threshold 3 :

25
MEASURING THE POROSITY OF VARIOUS SURFACE
LAYERS
n :Number white points N : Number of all points p : Porosity percentage
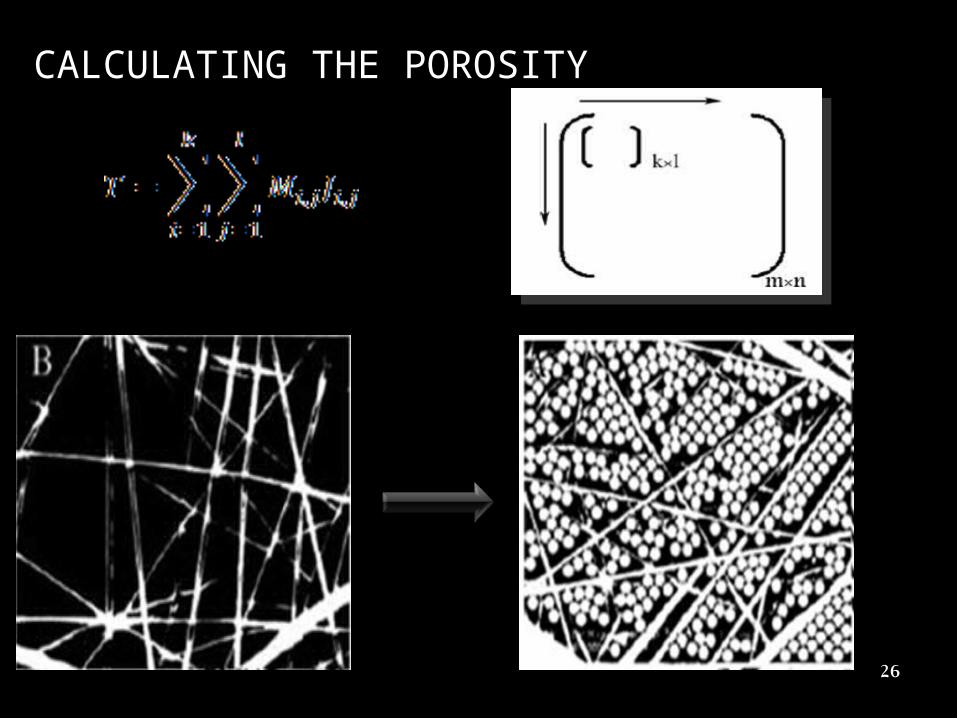
26
CALCULATING THE POROSITY

27
LAYER UNIFORMITY

28
LAYER UNIFORMITY

29
MEASURING LAYER WEIGHT

30
Our Method
ICSIP 2009, Amsterdam
Ideal Structure

31
GA
ICSIP 2009, Amsterdam
• Optimizing the model
•SELECTION : selecting individuals for reproduction.
•REPRODUCTION: Cross over and Mutation are most common reproduction operators of GA. EVALUATION: the fitness of new chromosome is evaluated.
•REPLACEMENT: individuals from the old population are removed and replaced by the new ones.
•The algorithm is stopped when the population converges toward optimal solution e.g. finding minimum of a function

32
GA MOdel
ICSIP 2009, Amsterdam
•The Number of lines in each group was equal.
•The Chromosomes have defined in a binary from
• There were two Genes with lengths of 5 and 19 bits
•The angle drops between 0-179.

33
Image Processing for Fitness
ICSIP 2009, Amsterdam
• Plotting the structure

34
Real Web
ICSIP 2009, Amsterdam
Histogram Modification, Thresholding,
Converting to binary formand Thinning.
35
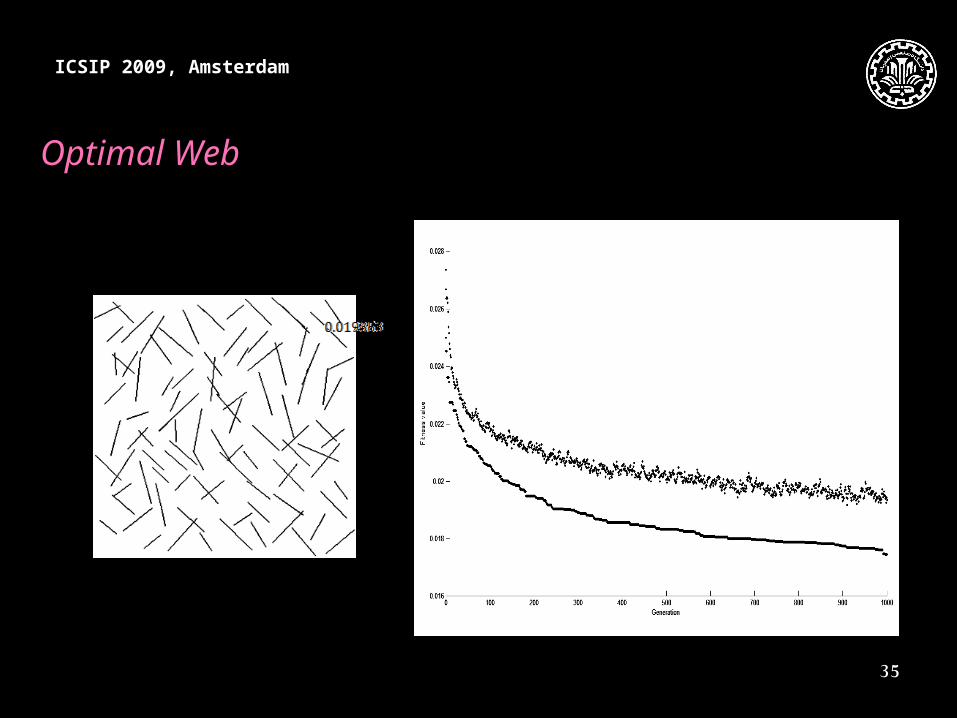
Optimal Web
ICSIP 2009, Amsterdam

36
ICSIP 2009, Amsterdam
Comparison optimal model and real web with real web
• Find the optimal web
•Fitness measuring
•Real web production
•Image Enhancement
•Measuring the fitness of real web
•Comparison optimal model and real web
•Analysis mechanical properties

37
ICSIP 2009, Amsterdam
Breaking load and fitness value VS Sample

38
Conclusion
• Simulated a non-woven web with optimal distribution, using Genetic Algorithm
• Relationship between distribution uniformity of a web and its breaking load
• Validity of such a relation has been investigated by performing the fitness function
• In another words, the sample which were more uniform, had a higher breaking load.
• In a further research we will investigate this relationship on a three dimensional structure of a fiber reinforcement composite.
ICSIP 2009, Amsterdam