Embed Size (px)
Citation preview

US Department of the InteriorUS Geological Survey
Scientific Investigations Report 2016ndash5046
Prepared in cooperation with the National Park Service
Simulation of Deep Ventilation in Crater Lake Oregon 1951ndash2099
Cover Photograph of Crater Lake Oregon looking southeast across the lake Photograph by National Park Service undated
Simulation of Deep Ventilation in Crater Lake Oregon 1951ndash2099
By Tamara M Wood Susan A Wherry Sebastiano Piccolroaz and Scott F Girdner
Prepared in cooperation with the National Park Service
Scientific Investigations Report 2016ndash5046
US Department of the InteriorUS Geological Survey
US Department of the InteriorSALLY JEWELL Secretary
US Geological SurveySuzette M Kimball Director
US Geological Survey Reston Virginia 2016
For more information on the USGSmdashthe Federal source for science about the Earth its natural and living resources natural hazards and the environmentmdashvisit httpwwwusgsgov or call 1ndash888ndashASKndashUSGS
For an overview of USGS information products including maps imagery and publications visit httpstoreusgsgov
Any use of trade firm or product names is for descriptive purposes only and does not imply endorsement by the US Government
Although this information product for the most part is in the public domain it also may contain copyrighted materials as noted in the text Permission to reproduce copyrighted items must be secured from the copyright owner
Suggested citationWood TM Wherry SA Piccolroaz S and Girdner SF 2016 Simulation of deep ventilation in Crater Lake Oregon 1951ndash2099 US Geological Survey Scientific Investigations Report 2016ndash5046 43 p httpdxdoiorg103133sir20165046
ISSN 2328-0328 (online)
iii
Contents
Abstract 1Introduction1
Purpose and Scope 3Methods3
Datasets3Historical Water Quality and Meteorological Data 3Climate Data4
Models 4Data Processing 6
Historical Water-Quality and Meteorological Data for the 1-Dimensional Deep Ventilation Model 6
Historical Water-Quality and Meteorological Data for the Dynamic Reservoir Simulation Model 7
Future Climate Data 7Air and Lake Surface Temperature 7Wind Speed 11
One-Dimensional Lake Temperature Modeling 13One-Dimensional Deep Ventilation Model 13
Initial Values of Calibration Parameters 13Reference Diffusivity Profile 14Calibration 16
Dynamic Reservoir Simulation Model 23Calibration 23
One-Dimensional Deep Ventilation Model Validation26Results of Future Climate Scenarios 28Comparisons to Future-Climate Studies of Other Lakes 37Conclusions39Summary40Acknowledgments 41References Cited41
Figures 1 Map showing sampling site and climate model grid Crater Lake Oregon 2 2 Flow chart showing approach used to convert wind stress to water column
mixing in the 1-dimensional deep ventilation model and the DYnamic REservoir Simulation Model 5
3 Time series of December-to-May averages of air temperature and water temperature at 20 meter depth and water temperature at 20 meter depth simulated by the lumped model air2water during the calibration period 1993ndash2011 at Crater Lake Oregon 9
4 Time series of December-to-May averages of downscaled air temperature from general circulation models and water temperature at 20 meter depth as determined with the air2water model through baseline (1951ndash2005) and future climate (2006ndash2099) conditions at Crater Lake Oregon 10
iv
FiguresmdashContinued 5 Graphs showing cumulative distribution functions of measured and simulated daily
wind speed for the common historical period 1991ndash2005 and the original and adjusted minimum mean and maximum wind speed from three general circulation models and two representative concentration pathways during baseline (1951ndash2005) and future (2006ndash2099) conditions at Crater Lake Oregon 12
6 Graph showing ten salinity profiles at Site B Crater Lake Oregon collected between July and September 1991ndash1998 and a 4th order polynomial fit to the average of the profiles 14
7 Graph showing reference turbulent diffusivity profile for the 1-dimensional deep ventilation model of Crater Lake Oregon 16
8 Contour plot showing measured temperature data Crater Lake Oregon 2000ndash2006 18
9 Contour plot showing temperature simulated with the 1-dimensional deep ventilation model Crater Lake Oregon 2000ndash2006 18
10 Graphs showing comparison of selected measured temperature profiles with profiles simulated with the 1-dimensional deep ventilation model Crater Lake Oregon 2003ndash2005 19
11 Graphs showing comparison of measured temperature to temperature simulated with the 1-dimensional deep ventilation model at depths between 20 and 530 meters Crater Lake Oregon 2000ndash2006 20
12 Graphs showing temperature and diffusivity profiles over the autumn to spring months of 2002ndash2003 when no deep ventilation of the water column occurred Crater Lake Oregon 21
13 Graphs showing temperature and diffusivity profiles over the autumn to spring months of 2003ndash2004 when deep ventilation of the water column occurred Crater Lake Oregon 21
14 Graphs showing upper and lower water-column heat content calculated from thermistors and from temperatures simulated by the 1-dimensional deep ventilation model of Crater Lake Oregon during the calibration years 2000ndash2006 and the validation years 1994ndash1999 and 2008ndash2011 22
15 Graphs showing comparison of selected measured temperature profiles to profiles simulated with the DYnamic REservoir Simulation Model Crater Lake Oregon 2001ndash2003 25
16 Graphs showing comparison of measured temperature to temperature simulated with the DYnamic REservoir Simulation Model Crater Lake Oregon 1999ndash2007 26
17 Graphs showing upper and lower water-column heat content calculated from thermistors and from temperatures simulated by the DYnamic REservoir Simulation Model of Crater Lake Oregon 1999ndash2007 27
18 Scatterplot showing comparison of the change in heat content between December and June as calculated from thermistor data and as simulated with the 1-dimensional deep ventilation model of Crater Lake Oregon 1994ndash1999 2000ndash2006 and 2008ndash2010 28
19 Contour plots showing temperature of Crater Lake Oregon simulated with the 1-dimensional deep ventilation model for baseline and future conditions from three general circulation models and two representative concentration pathways 30
v
FiguresmdashContinued 20 Graphs showing surface and bottom temperatures of Crater Lake Oregon
simulated with the 1-dimensional deep ventilation model for baseline and future conditions from three general circulation models and two representative concentration pathways 33
21 Time series showing heat content in Crater Lake Oregon as calculated from temperatures simulated by the 1-dimensional deep ventilation model for baseline and future conditions from three general circulation models and two representative concentration pathways 36
Tables 1 Statistical characteristics of air temperature and water temperature for the
historical period of record and for the baseline and future conditions periods from three general circulation models (GCMs) and two representative concentration pathways 9
2 Statistical characteristics of wind speed for the historical period of record and for the baseline and future conditions periods from three general circulation models (GCMs) and two representative concentration pathways 13
3 Rate of change in heat content in the deep and mid water column and the calculated hydrothermal flux between July and September Crater Lake Oregon 1990ndash2013 15
4 Calibration parameters for the 1-dimensional deep ventilation model of Crater Lake Oregon 17
5 Goodness-of-fit statistics at thermistor target depths for temperature simulated with the 1-dimensional deep ventilation model Crater Lake Oregon 2000ndash2006 17
6 Goodness-of-fit statistics for heat content calculated from temperatures simulated by the 1-dimensional deep ventilation model of Crater Lake Oregon 1994ndash2011 22
7 DYnamic REservoir Simulation Model default parameter values 24 8 Goodness of fit statistics for the DYnamic REservoir Simulation Model of Crater
Lake Oregon 1999ndash2007 24 9 Change in heat content from December to June in the lower water column of
Crater Lake Oregon 1994ndash2011 27 10 Linear regression models of upper and lower water-column heat content in Crater
Lake as calculated from temperatures simulated by the 1-dimensional deep ventilation model for baseline and future conditions from three general circulation models and two representative concentration pathways 29
11 Frequency of deep ventilation during the historical measurement period and during the baseline and future conditions periods from three general circulation models and two representative concentration pathways Crater Lake Oregon 35
12 Replacement volume and residence time in the deep lake determined during baseline conditions (1951ndash2005) and future conditions (2045ndash2099) from three general circulation models and two representative concentration pathways at Crater Lake Oregon 35
13 Long-term changes in lower water-column temperature in deep lakes (gt 100 m depth) based on historical measurements and modeling studies of future climate scenarios 38
vi
Conversion Factors
InchPound to International System of Units
Multiply By To obtain
Lengthkilometer (km) 06214 mile (mi)meter (m) 3281 foot (ft)
Areasquare meter (m2) 1076 square foot (ft2)
Volumecubic kilometer (km3) 02399 cubic mile (mi3)
Flow ratecubic meter per day (m3d) 3531 cubic foot per day (ft3d)
Masskilogram (kg) 2205 pound avoirdupois (lb)
Densitykilogram per cubic meter (kgm3) 006242 pound per cubic foot (lbft3)
Heat Energyjoule (J) 02391 calorie (cal)
Heat FluxWatt per square meter (Wm2) 7996 calorie per hour per square foot
[(calh)ft2]
Temperature in degrees Celsius (degC) may be converted to degrees Fahrenheit (degF) as
degF = (18 times degC) + 32
DatumsVertical coordinate information is referenced to the National Geodetic Vertical Datum of 1929 (NGVD 29)
Horizontal coordinate information is referenced to the World Geodetic System of 1984 (WGS 84)
Elevation as used in this report refers to distance above the vertical datum
Supplemental InformationConcentrations of chemical constituents in water are given in either milligrams per liter (mgL) or micrograms per liter (microgL)
vii
Abbreviations
1DDV 1-dimensional deep ventilation modelcdf cumulative distribution functionCTD conductivity temperature depth CVRMSE coefficient of variation of the root mean square errorDYRESM Dynamic Reservoir Simulation ModelGCM general circulation modelLWC lower water columnMACA Multivariate Adaptive Constructed AnalogNRMSE normalized root mean square errorPNW Pacific NorthwestRCP Representative Concentration PathwayRMSE root mean square errorSLT surface layer temperatureSML surface mixed layerTKE turbulent kinetic energyUSGS US Geological SurveyUWC upper water column
Simulation of Deep Ventilation in Crater Lake Oregon 1951ndash2099
By Tamara M Wood1 Susan A Wherry1 Sebastiano Piccolroaz2 and Scott F Girdner3
AbstractThe frequency of deep ventilation events in Crater
Lake a caldera lake in the Oregon Cascade Mountains was simulated in six future climate scenarios using a 1-dimensional deep ventilation model (1DDV) that was developed to simulate the ventilation of deep water initiated by reverse stratification and subsequent thermobaric instability The model was calibrated and validated with lake temperature data collected from 1994 to 2011 Wind and air temperature data from three general circulation models and two representative concentration pathways were used to simulate the change in lake temperature and the frequency of deep ventilation events in possible future climates The lumped model air2water was used to project lake surface temperature a required boundary condition for the lake model based on air temperature in the future climates
The 1DDV model was used to simulate daily water temperature profiles through 2099 All future climate scenarios projected increased water temperature throughout the water column and a substantive reduction in the frequency of deep ventilation events The least extreme scenario projected the frequency of deep ventilation events to decrease from about 1 in 2 years in current conditions to about 1 in 3 years by 2100 The most extreme scenario considered projected the frequency of deep ventilation events to be about 1 in 77 years by 2100 All scenarios predicted that the temperature of the entire water column will be greater than 4 degC for increasing lengths of time in the future and that the conditions required for thermobaric instability induced mixing will become rare or non-existent
The disruption of deep ventilation by itself does not provide a complete picture of the potential ecological and water quality consequences of warming climate to Crater Lake Estimating the effect of warming climate on deep water oxygen depletion and water clarity will require careful modeling studies to combine the physical mixing processes affected by the atmosphere with the multitude of factors affecting the growth of algae and corresponding water clarity
1US Geological Survey2University of Trento Italy3National Park Service Crater Lake National Park
IntroductionCrater Lake is located in Crater Lake National Park at the
crest of the Cascade Range in southern Oregon (fig 1) The lake partially fills a caldera that formed about 7700 years ago following the volcanic eruption and collapse of Mt Mazama The nearly circular caldera that formed was about 1220 m deep and 10 km across and subsequently filled approximately halfway with water The lake has a maximum depth of 594 m making it the deepest lake in the United States and eighth deepest in the world The surface is at 1883 m elevation and the shoreline is 31 km in length Crater Lake has no surface outlet and surface inlets are limited to small springs draining the steep caldera walls
Crater Lake is widely known for its deep blue color and extremely clear water Summer Secchi depth typically ranges between 25 and 35 m An ongoing long-term monitoring program was initiated in 1983 in response to concerns that the clarity of the lake might be declining The lake is extremely biologically unproductive (ultra-oligotrophic) with peak chlorophyll a concentrations less than 2 microgL and low nutrient concentrations (nitrate less than 0025 mgL phosphate less than 002 mgL) The lake is primarily nitrate and iron limited (Groeger 2007) Most of the available nitrate is located deep in the lake below 200 m and upward mixing of the deep-water nitrate pool from episodic winter mixing events is estimated to account for more than 85 percent of the seasonal nitrogen input to the upper water column when mixing occurs (Dymond and others 1996) and influences the autotrophic productivity the following summer These episodic winter mixing events also bring oxygen-rich surface waters downward and are critical for maintaining oxygen levels at greater than 90 percent of saturation throughout the water column (Crawford and Collier 2007)
Typical of dimictic lakes Crater Lake experiences periods of convective vertical mixing in early winter and spring Between convective mixing periods strong thermal stratification occurs in summer (warmer water floating on top) and is often reverse stratified in winter (colder water floating on top) Reverse stratification is possible when the upper water column temperatures are less than about 4 degC the temperature of maximum density at atmospheric pressure
2 Simulation of Deep Ventilation in Crater Lake Oregon 1951ndash2099
tac16_1054_fig 01
Base modified from US Geological Survey bathymetry and digital elevation model data accessed at httpoeoregonexplorerinfocraterlakebathymetryhtml Coordinate reference system is NAD 1983 State Plane Oregon South FIPS 3602
Samplingsite Band weather buoy
Meteorologicaltower
Merriam Cone
Wizard Island
Southwest basin
Northwest basin
East basin
EXPLANATION
Downscaled MACA climate grid
0
100
200
300
400
500
600
Depth below water surface in meters
OREGON
Studyarea
122deg4122deg6122deg8122deg10
42deg58
42deg56
42deg54
0 05 10 15 20 MILES
0 1 2 3 4 KILOMETERS
Casc
ade
Rang
e
Figure 1 Sampling site and climate model grid Crater Lake Oregon
Methods 3
The lake circulates to a depth of 200ndash300 m twice each year in early winter and spring due to wind and convective cooling However mixing to the bottom does not occur every winter but on average every 2ndash3 years through a process of thermobaric instability when the lake is weakly reversely stratified (Crawford and Collier 2007) Because the temperature of maximum density decreases with pressure it decreases with depth In a deep lake this fact is of particular importance because it provides the opportunity for strong winds to push colder surface water down to a depth where its temperature is closer to the local temperature of maximum density than the surrounding water In that situation the colder surface water is denser than the surrounding water and continues to sink until it reaches the depth at which it has the same density as the surrounding water or the bottom of the lake (Boehrer and Schultze 2008) This type of mixing generally allows surface water to penetrate deeper than convective mixing Distinct mixing events of this type occurred in Crater Lake in 11 of 22 winters between 1993 and 2014
The presence of reverse stratification in winter (colder water floating on top of a lake) is essential for thermobarically induced mixing events to occur in Crater Lake (Crawford and Collier 2007) because it sets up the requisite conditions that allow strong winds to push the upper layer of the lake below the compensation depth (the depth at which the colder surface water has the same density as the surrounding water) However air and water temperature data from Crater Lake over the last 22 years show that reverse stratification did not occur during the three warmest winters (2001 2003 and 2005) Because present day meteorological conditions already appear to be near the temperature threshold for reverse stratification further warming of the climate at Crater Lake could reduce the frequency of winter deep ventilation events or stop them altogether The absence of deep ventilation and the consequent reduction of the upward nitrate flux into the photic zone could result in a decrease in the already minimal primary production that supports the food web in the lake A loss of deep ventilation in Crater Lake also would prevent re-oxygenation of the bottom waters If anoxia in bottom water were to occur taxa presently living on the lake floor could be lost and nutrients (iron a co-limiting nutrient Groeger 2007) stored in the sediments could be released to the water column Such changes would result in large-scale ecological impacts on the lake potentially altering its world-renowned beauty and resulting in a loss of biological communities
The objective of this study is to assess whether the frequency of climatologically induced deep ventilation events is likely to change in the twenty-first century under warming climate conditions
Purpose and Scope
This report presents the results of a partnership between the US Geological Survey (USGS) and the National Park Service to investigate the changes in the frequency of deep
ventilation events in Crater Lake that could be expected in a future warmer climate We began by assessing through calibration and validation the suitability of a 1-dimensional research-grade vertical lake model recently developed specifically to simulate deep ventilation in Lake Baikal Russia for the study of deep ventilation in Crater Lake We compared the results to simulations produced by a widely used and well-tested 1-dimensional lake model the DYnamic REservoir Simulation Model (DYRESM) developed by the Centre for Water Research at the University of Western Australia to demonstrate the importance of using a model specifically designed to incorporate the distinctive and relatively uncommon process responsible for deep ventilation in Crater Lake
The effects of a future climate were assessed by running the selected model with boundary conditions determined using six climate scenarios from a combination of three GCMs and two RCPs representing a moderate and extreme scenario of future climate action The frequency of deep ventilation was assessed over two overlapping 55-year periods during 2007ndash2099 (2007ndash2061 and 2045ndash2099) The change in the frequency of deep ventilation was assessed as a comparison to 55 years of baseline conditions determined from the same three GCMs
Methods
Datasets
Depth-volume data (hypsographic curve) for Crater Lake was derived from a high-resolution (16 million soundings) multi-beam echo sounding survey of the lake completed in 2000 (Bacon and others 2002)
Historical Water Quality and Meteorological Data
High frequency meteorological and water quality data have been collected at Crater Lake since 1990 The meteorological datasets used in this study to provide boundary conditions for the lake models included wind speed air temperature relative humidity shortwave solar radiation and daily accumulation of rain and snow precipitation Wind speed air temperature surface water temperature and relative humidity were collected year round from a buoy in the lake at site B (fig 1) at a height of 2-m above water surface at 1-hour intervals As necessary small gaps of several days or less were filled with data from a meteorological station located on the crater rim (fig 1) using regression models developed over periods when both data were available Solar radiation data were collected at the site on the crater rim Daily accumulation of rain and snow were collected at Crater Lake National Park Headquarters located below the crater rim on the south side of Mt Mazama (fig 1) The continuous
4 Simulation of Deep Ventilation in Crater Lake Oregon 1951ndash2099
water temperature data that were used to calibrate and validate the lake models were collected by thermistors at 10-minute intervals at the discrete target depths of 20 30 40 50 70 90 130 150 170 200 250 300 350 400 460 530 and 580 m at site B between 1992 and 2013
In addition to the high-frequency thermistor data water column profiles of temperature and salinity were collected with a conductivity temperature and depth sonde (CTD) during discrete sampling events at 1-m depth intervals primarily between June and October from 1988 to 2013 at site B The temperature data from these profiles were used to evaluate the turbulent diffusivity profile of the water column and the salinity data were used to define a salinity-depth relation
Climate DataDownscaled future climate data were used to assess
potential climate change effects on the temperature profile and deep-water ventilation of Crater Lake The University of Idaho provides GCM data from the Coupled Model Intercomparison Project 5 (CMIP5 Taylor and others 2012) that are statistically downscaled using the Multivariate Adaptive Constructed Analogs (MACA) technique (Abatzoglou and Brown 2012) Daily air temperature and wind speed data downscaled to a 4-km (124 degree in latitude and longitude) spatial resolution were used for the historical period of 1951ndash2005 and the future period of 2006ndash2099 At the time that this study began the number of GCMs for which downscaled data were available was limited The three GCMs used in this study were selected from those available because they performed well in reproducing the climate of the Pacific Northwest (PNW) region Specifically CNRM-CM5 model from the National Centre of Meteorological Research (2014) was the model determined to be the best overall at reproducing various climate metrics in the PNW (Rupp and others 2013) Two models from the Hadley Centre in the United Kingdom (Met Office 2014) that differ in the number of vertical atmospheric levels also ranked highly in reproducing PNW climate (Rupp and others 2013) The HadGEM2-ES model has 38 levels and is closer to the CNRM-CM5 model (31 levels) than the HadGEM2-CC model which has finer vertical resolution (60 levels) Two available Representative Concentration Pathways RCP45 and RCP85 were evaluated for comparison The RCP45 scenario is one of moderate climate mitigation action in which an additional 45 W m-2 of heat is trapped in the earth-atmosphere system compared to preindustrial conditions by 2100 (Thomson and others 2011) The RCP85 scenario is more severe being characterized by a continued heavy reliance on fossil fuels and no implementation of climate policies In this scenario an additional 85 W m-2 of heat is trapped in the earth-atmosphere system compared to preindustrial conditions by 2100 (Riahi and others 2011) The bounding coordinates designating the area over Crater Lake were 4289613degN to 4297946degN and 1221472degW to 1220639degW and this region included nine
MACA grid points (fig 1) The downscaled air temperature and wind speed from the nine grid points were averaged for each day to acquire daily time-series sets representing conditions at Crater Lake as simulated by the three GCMs
Models
The selection of the lake model was critical to the success of this study Deep ventilation in Crater Lake resulting from thermobaric instabilities is a basin-scale process which in principle would require a computationally intensive 3-dimensional model to simulate the fundamental equations of motion Such a model would require a large amount of data for proper calibration and validation and would be difficult to run through decades of simulations even with the currently available high performance computational resources The 1-dimensional deep ventilation model we used (referred to as 1DDV in this report) was developed to efficiently simulate the deep ventilation process triggered by thermobaricity in Lake Baikal by reducing the problem to a 1-dimensional parameterized vertical energy budget in which the mechanical energy available in the wind is used to move a volume of surface water against a stable density gradient (Piccolroaz 2013 Piccolroaz and Toffolon 2013 fig 2A) The 1DDV model requires a minimum of external forcing input data water temperature at the surface wind speed and wind duration The 1DDV model does not calculate the surface heat balance rather water temperature averaged over the thickness of the model surface layer (herein denoted surface layer temperature or SLT) must be supplied as a boundary condition for the vertical temperature profile In addition to measured inputs and calculable model parameters the 1DDV model requires a reference turbulent diffusivity profile hydrothermal heat input profile the hypsometric curve (the relation between depth and water volume) salinity profile and calibration parameters used to describe energy transfer from the wind to the lake surface layer and the degree of mixing between lake layers The 1DDV model successfully simulated the deep-water renewal process in Lake Baikal but it has not been tested in a smaller lake
Two closure relations are introduced to evaluate the wind energy input at the surface and the volume of water involved in the wind-induced deep downwelling These relations are at the core of the model and have been derived by schematizing the downwelling process as a layer of water that is accelerated into horizontal motion by the available wind energy input and eventually is forced to move downward along the shoreline boundary (Boehrer and Schultze 2008) Wuumlest and others (2005) suggested that deep downwellings in Lake Baikal are likely to be driven by along-shore winds that given the large dimension of the lake can cause Ekman transport (National Atmospheric and Space Administration 2015) of the surface wind-driven layer of water perpendicular to the wind stress and toward the shoreline Because Crater Lake is smaller than Lake Baikal a surface Ekman layer is not expected to fully
Methods 5
tac16_1054_fig 02a
NO
NO
YES YES
START when ∆t=Td
Calculate KE based on Ua
Calculate Vd and zd based on KE
Is zdgthc
Vd moves to zd(mixing while sinking)
Vd moves to hc(mixing while sinking)
EXPLANATION∆t = elapsed time since the end of
the last downwelling time stepTd = downwelling time step (3 days)KE = input of kinetic energy to water
column from windUa = wind velocityVd = downwelled volumezd = stopping depthhc = compensation depth
All layers above move up to
accomodate
Switch the position of the two adiacent layers with
the highest buoyancy instability (mixing)
End downwelling
Are there unstable layers
A
Figure 2 Approach used to convert wind stress to water column mixing in the 1-dimensional deep ventilation model (1DDV) and the DYnamic REservoir Simulation Model (DYRESM) (A) Deepwater renewal in 1DDV and (B) surface mixed layer deepening in DYRESM The steps have been simplified to emphasize the important differences in approach between the two models
tac16_1054_fig 02b
YES
Combine surface layer with adjacent layer to
create new surface layer
Calculate density of new surface layer
Decrease KE by PEmix
START when Ua gt Uc
Calculate KE based on Uaand convective mixing
Calculate PEmix
Is KE gt PEmix
End SML deepening
Augment KE with shear at base of SML NO
(1st time)NO (2nd time)
BEXPLANATION
Ua = wind velocityUc = critical wind velocityKE = input of kinetic energy to water
column from windPEmix = increase in potential energy
required to mix the surface layer of the water column with the adjacent layer
SML = surface mixed layer
6 Simulation of Deep Ventilation in Crater Lake Oregon 1951ndash2099
develop and the acceleration of the surface water is likely closer to parallel to the wind stress As a first approximation however the same downwelling closure relations of 1DDV can be used for Crater Lake because the process is set in motion by the wind in both lakes As in Lake Baikal buoyancy instabilities due to the thermobaric effect play an important role in determining the deep ventilation process in Crater Lake (Crawford and Collier 2007) thus making 1DDV particularly well suited to investigate the renewal of deep water in the lake
As modeled with 1DDV a lake is divided into a number of layers of equal volume and a Lagrangian-based algorithm is used to rearrange these volumes to simulate the vertical displacement of water due to deep downwelling and convective mixing For the simulation of deep downwellings a finer spatial resolution is used by dividing each volume into a number of subvolumes with a reasonable increase of the computational cost The wind energy input to the lake (evaluated over a 3-day period) is compared to the energy that is required to displace the upper volume of water downwards to its compensation depth (the depth where the sinking volume has the same density of the surrounding water) If the energy input is sufficiently large which is generally the case when the water column is weakly inversely stratified and the wind is sufficiently strong the downwelling volume is displaced to a point below the compensation depth There the sinking volume is heavier than surrounding water and thus will continue to move downward until it either reaches water of the same temperature or the bottom of the lake In contrast shallow convective mixing occurs when the energy input is low or the lake is strongly stratified the sinking volume is displaced to a depth shallower than the compensation depth where it is lighter than surrounding water and due to positive buoyant forces is displaced upward again A limited exchange with surrounding water occurs but not full mixing as the volume is moved along the vertical during either deep or shallow downwelling as well as during vertical rearrangement of subvolumes due to the stabilization of unstable regions of the water column
To elucidate the atypical nature of the deep ventilation process in Crater Lake further the well-documented lake model DYRESM (fig 2B) was used to simulate 6 years of calibration data and the results were compared to the 1DDV simulation The DYRESM model is a 1-dimensional hydrodynamic model for lakes and reservoirs developed at the University of Western Australia and used in 59 countries at the time of this writing (Imerito 2014) The use of the model is limited to situations in which the 1-dimensional assumption is valid that is situations in which density stratification is strong enough to provide a strong restoring force to perturbations in the isopycnals resulting from wind energy input at the surface and therefore the isopycnals remain nearly horizontal DYRESM is Lagrangian-based the lake
is divided into horizontal layers with uniform properties but varying thicknesses that are determined dynamically to adequately resolve vertical gradients DYRESM solves the surface heat mass and momentum balance therefore input data requirements include solar radiation air vapor pressure and temperature wind speed and precipitation DYRESM simulates the vertical temperature and salinity profile based on surface boundary conditions and hydrothermal inputs which are modeled as point sources to the deep water column
The defining structure of the upper water column in DYRESM is the surface mixed layer (SML) Mixing in the upper part of the water column is based on a budget for the turbulent kinetic energy (TKE) of the SML (Tucker and Green 1977) Wind shear stress is converted to TKE that is used to deepen the mixed layer by entraining adjacent layers if there is enough TKE to overcome the buoyancy forces of a stable water column Thus the total TKE input to the water column at every time step (daily for this study) is used to deepen the mixed layer and in the process homogenize the density of the mixed layer The amount of TKE available is compared to the potential energy (PE) that must be overcome in order to completely mix layers with denser water into the SML The efficiency with which TKE accomplishes the mixing is controlled through parameters that are set to default values based on well-documented empirical relations When the assumption of 1-dimensionality is satisfied the developers state that the model produces an accurate solution without calibration (Imerito 2014)
It stands to reason that these two models would produce different simulated responses of Crater Lake to the same wind forcing and further that each would perform better in some circumstances DYRESM has been shown to perform well in simulating convective mixing through entrainment of adjacent layers and deepening of the SML especially during the erosion of summertime thermally stratified conditions but deep ventilation due to thermobaric instabilities is a fundamentally different process Therefore the differences between the results obtained from the models are instructive
Data Processing
Historical Water-Quality and Meteorological Data for the 1-Dimensional Deep Ventilation Model
The measured data inputs to the 1DDV model included daily average SLT data and daily average wind-speed data Measured vertical temperature profiles were used as initial conditions Based on these data needs we identified three periods for simulation with the 1DDV model that were free of large data gaps (1) from August 13 1994 to August 14 1999 (2) from September 23 2000 to June 27 2006 and (3) from
Methods 7
August 25 2008 to June 30 2011 Daily values of wind speed and SLT were used to be consistent with the temporal resolution of the climate datasets The computational time step of the model was 12 hours
Surface water temperature was measured at the buoy (at approximately 2 m depth) but this temperature was not appropriate to be used as the model boundary condition because the surface layer of the model has a thickness of about 10 m The water temperatures measured under the buoy were also contaminated by heating of the buoy especially during low-wind events in summer (RW Collier Oregon State University written commun 2015) Therefore the SLT time series used as the upper boundary condition was the temperature measured at 20 m depth (T20) which corresponds to the shallowest thermistor This measurement is sufficiently far from the surface to exclude the direct contribution of short-term variations of the heat flux components at the lake-atmosphere interface but close enough to the surface to capture the residual effect of the overall heat exchange and thus it proved to be more suitable than the buoy temperature as the thermal condition of the upper layer of the lake During wintertime reverse-stratified conditions that are most important in this study the assumption that T20 can represent SLT is appropriate because the surface mixed layer is usually deeper than 20 m during stratified conditions in summer this assumption is likely to underestimate SLT but is still reasonable
Although the target depth of the shallowest thermistor was 20 m most of the data were collected at a depth other than 20 m ranging between 15 and 36 m depending on the deployment When the shallowest thermistor data were collected at a depth other than 20 m the T20 was determined by linear interpolation between the surface buoy and the shallowest thermistor data When interpolation to 20 m depth was required during strongly stratified summer conditions (during which the epilimnion was warm and thin) and when the uppermost thermistor was installed beneath the thermocline the interpolated values substantially overestimated the temperature at 20 m Occasional summertime gaps in the thermistor data when the thermistors were not in the water were filled with CTD profile data by linear interpolation which resulted in a loss of variability in some summer months The focus of this study however was on winter mixing events when variability was unaffected by missing data The hourly dataset was averaged to a daily dataset for use in the model
The input wind-speed time series was developed from the meteorological data collected at the buoy in Crater Lake Wind-speed data were measured at a height of 3 m above water surface and the values were translated to 10-m values using a logarithmic approximation (Martin and McCutcheon 1998) The hourly dataset was then averaged to a daily dataset for use in the model
The initial condition temperature profile at the start of each simulation was extracted from a dataset that combined thermistor data CTD data and buoy surface temperature data to provide 1-m temperature profiles interpolated to daily values
Historical Water-Quality and Meteorological Data for the Dynamic Reservoir Simulation Model
The measured data inputs to the DYRESM model included daily averaged values of meteorological variables shortwave solar radiation cloud cover air temperature vapor pressure wind speed and daily accumulation of rain and snow precipitation Based on these data needs we identified three periods for simulation with the DYRESM model that were free of large data gaps (1) from January 20 1993 to August 24 1999 (2) from September 17 1999 to August 21 2007 and (3) from January 18 2008 to October 28 2013 Solar radiation data were measured at the meteorological station on the rim Missing days of data (defined as having less than 20 hourly measurements during the day) were filled with the median value measured on that yearly Julian day over the entire dataset Cloud cover was not recorded and was calculated as a function of the ratio of measured daily average solar radiation to the calculated clear sky radiation value (Environmental and Water Resources Institute 2005) for that Julian day (Crawford and Duchon 1999 Yang and others 2010) Air temperature wind speed and relative humidity were measured at both the buoy on the lake and at the meteorological station on the crater rim For these three variables the data measured at the buoy were used preferentially and when not available was filled in with data from the rim corrected using a linear regression between the measurements at both locations Wind speed data measured at the buoy on the lake at a height of 3 m above the water surface were translated to 10-m values using a logarithmic approximation to the atmospheric boundary layer (Martin and McCutcheon 1998) Vapor pressure was calculated from relative humidity using the Magnus-Tetens formula (Martin and McCutcheon 1998) Initial profiles of temperature and salinity were determined from the CTD profile collected most closely in time to the beginning of the simulation
Future Climate Data
Air and Lake Surface TemperatureThe future climate datasets of statistically downscaled
air temperature and wind speed need to be further downscaled from their regional spatial resolution (124 degree in latitude and longitude) to a finer local scale that is representative of the conditions at the lake surface through a bias-correction
8 Simulation of Deep Ventilation in Crater Lake Oregon 1951ndash2099
procedure For air temperature this bias correction was accomplished with the change factor method also known as the ldquodelta methodrdquo (Diaz-Nieto and Wilby 2005 Minville and others 2008) which involves adjusting the GCM time series by assuming that the bias of the GCM compared to measurements on each Julian day in the year as determined during an overlapping historical period applies to the GCM at all other baseline and future times
T T T Tadj y GCM y obs h GCM h = + minus( ) (1)
where Tobs h and TGCM h are the observed and GCM-modeled ldquomean
yearsrdquo for the same climatological historical period h which in this case is the 13-year period 1993ndash2005 (the mean year is defined by giving to each day of the year the average of all values available in the dataset for that same day) and
Tadjy and TGCMy are the adjusted and GCM-modeled time
series of daily air temperature in year y where y can be any year outside the historical period during the GCM baseline (1950ndash2005) or future climate (2006ndash2099) period
Additionally air temperature needs to be converted into lake temperature at 20 m depth which is how the SLT the boundary condition required by the model 1DDV is defined for this study The lumped model air2water (Piccolroaz and others 2013) was adopted The air2water model is based on a simplified parameterization of the heat exchanges between a lake and the atmosphere and is able to simulate daily near-surface lake temperature based only on air temperature as a proxy for the main meteo-climatic variables The model has been tested on 14 temperate lakes with accuracy comparable to more complex process-based models that require substantially more input data (Toffolon and others 2014) The air2water model also has been used successfully to investigate the feedback between stratification and thermal response of lakes (Piccolroaz and others 2015) For Crater Lake specifically the full (eight-parameter) version of the model was used and the parameters were calibrated using the measured daily average of air temperature and lake temperature at 20 m depth during the historical period 1993ndash2011 The temperature at 20 m depth sometimes had to be determined with an interpolation between the buoy (2 m) temperature and the uppermost thermistor (at approximately 20 m) (see section Historical Water-Quality and Meteorological Data for the 1-Dimensional Deep Ventilation Model) When this resulted in unrealistically high values in summer those values were removed before
calibrating air2water The calibration of air2water with this time series of water temperature was successful resulting in a root mean square error (RMSE) of 068 degC between the simulated and measured daily values of T20 over the entire calibration period of 1993ndash2011 Further air2water was able to capture the inter-annual variability and the long-term trend in T20 particularly in the DecemberndashMay average (the months that correspond to the time of year when the lake is inversely stratified or only weakly directly stratified [fig 3])
The calibrated air2water model was used to project T20 using the downscaled air temperature calculated with equation (1) for both the entire baseline period of 1951ndash2005 and the future conditions period of 2006ndash2099 Results of the application of air2water to the baseline and future scenarios are presented for each of the GCMs in figure 4AndashC in terms of the DecemberndashMay mean with downscaled baseline and future conditions air temperature Summary statistics are provided in table 1 The long-term trends in air and water temperature are indicated by the slope of the linear regressions and show that as expected the water temperature does not warm as fast as the air temperature and the interannual variability in the water temperature is less than the interannual variability in the air temperature Figure 4 indicates how the projected warming of air temperature could affect T20 during the 21st century Depending on the GCM the warming trend in water temperature is between 0013 and 0019 degC per year in the RCP45 scenario and 0034 and 0035 degC per year in the RCP85 scenario compared with air temperature warming trends between 0021 and 0031 degC per year and 0055 and 0060 degC per year respectively in the same scenarios
The long-term trends in T20 for the cold season from December to May directly quantify the effect that a future increase in air temperature is expected to have on the thermal regime of the lake This effect is evident in the comparison of the mean annual T20 and more importantly the mean annual percentage of days with T20 colder than 4 degC for the three GCMs and two RCPs between the baseline period and future conditions The CNRM-CM5 GCM projects the lowest average air temperatures for both baseline and future conditions increasing 255 degC from 480 degC (baseline) to 735 degC in the RCP45 scenario and increasing 428 degC from 480 to 908 degC in the RCP85 scenario (table 1)
By the second half of the 21st century the annual percentage of days during which the lake is inversely stratified (a necessary condition for thermobaric instabilities to occur) is expected to decrease from 389 percent (baseline) to 88 percent and 34 percent in the RCP45 and RCP 85 scenarios respectively The HadGEM2-CC and HadGEM2-ES GCMs project similar results HadGEM2-CC projects the highest average air temperatures for both baseline and future conditions increasing 297 degC from 540 degC (baseline) to 837 degC in the RCP45 scenario and increasing 485 degC from 540 to 1025 degC in the RCP85 scenario (table 1) Conversely HadGEM2-ES projects the largest shortening of
Methods 9
tac16_1054_fig 03
1994 1996 1998 2000 2002 2004 2006 2008 2010 2012
Tem
pera
ture
in
degr
ees
Cels
ius
5
4
3
2
1
0
-1
-0015 degC per year
-0022 degC per year
-0059 degC per year
Measured air temperature
Measured water temperature
Simulated water temperature
EXPLANATION
Figure 3 December-to-May averages (plotted at January 1) of air temperature and water temperature at 20 meter depth and water temperature at 20 meter depth simulated by the lumped model air2water during the calibration period 1993ndash2011 at Crater Lake Oregon Multi-annual trends (evaluated using robust linear regression) of air and water temperature also are shown
Table 1 Statistical characteristics of air temperature and water temperature for the historical period of record and for the baseline and future conditions periods from three general circulation models (GCMs) and two representative concentration pathways
[Water temperature is at 20 meter depth as simulated with the air2water model Abbreviation degC degree Celsius]
GCM or
measured Period
Average daily air temperature
Tair
(degC)
Standard deviation daily air
temperature (degC)
Average daily water temperature
T20
(degC)
Standard deviation
daily water temperature
(degC)
Annual percentage of
days with water temperature less
than 4 degC
T20-Tair
(degC)
Historical period of observations 1995ndash1999 2001ndash2006 2009ndash2011
Measured All months 503 685 560 248 402 057December to May 054 389 356 071 790 302
Baseline conditions 1951ndash2005
CNRM-CM5 All months 480 691 526 237 389 046December to May 018 399 338 107 728 320
HadGEM2-CC All months 540 710 567 243 341 027December to May 080 430 363 096 680 283
HadGEM2-ES All months 510 690 546 236 371 036December to May 075 423 348 089 733 273
Last 55 years of future conditions 2045ndash2099 representative concentration pathway 45
CNRM-CM5 All months 735 704 694 255 88 -041December to May 279 393 486 096 175 207
HadGEM2-CC All months 837 772 761 290 36 -076December to May 323 457 515 096 71 192
HadGEM2-ES All months 846 757 767 286 25 -079December to May 334 441 526 092 51 192
Last 55 years of future conditions 2045ndash2099 representative concentration pathway 85
CNRM-CM5 All months 908 738 807 290 34 -101December to May 438 439 583 128 69 145
HadGEM2-CC All months 1025 815 884 330 13 -141December to May 469 469 612 120 27 143
HadGEM2-ES All months 1014 791 877 319 01 -137December to May 490 443 613 100 02 123
10 Simulation of Deep Ventilation in Crater Lake Oregon 1951ndash2099
Figure 4 December-to-May averages of downscaled air temperature from general circulation models (GCMs) and water temperature at 20 meter depth as determined with the air2water model through baseline (1951ndash2005) and future climate (2006ndash2099) conditions at Crater Lake Oregon Long-term trends (evaluated using robust linear regression) of air and water temperature also are shown
tac16_1054_fig 04
CNRM-CM5
HadGEM2-CC
HadGEM2-ES
1950 2000 2050 2100
10
5
0
-5
Tem
pera
ture
in
degr
ees
Cels
ius
10
5
0
-5
Tem
pera
ture
in
degr
ees
Cels
ius
10
5
0
-5
Tem
pera
ture
in
degr
ees
Cels
ius
+0011 degC per year
+0004 degC per year
+0003 degC per year
+0003 degC per year
-0005 degC per year
+0013 degC per year+0034 degC per year
+0025 degC per year
+0021 degC per year+0060 degC per year
+0019 degC per year+0035 degC per year
+0018 degC per year+0035 degC per year
+0026 degC per year+0055 degC per year
+0031 degC per year+0055 degC per year
Year
A
B
C
EXPLANATION
Linear fit90 percent confidence interval
90 percent confidence interval
Linear fit90 percent confidence interval
90 percent confidence interval
Baseline RCP85RCP45
Air temperature
Water temperature
Methods 11
the duration of inverse stratification during the second half of the 21st century with a decrease from the 371 percent of the year (baseline) to the 25 percent and 01 percent in the RCP45 and RCP 85 scenarios respectively The notable decrease in the number of days in the year when T20 is less than 4 degC projected by all GCMs is expected to have strong implications for the general thermo-hydrodynamics of the lake
The variability in daily air temperature increases with the average temperature but the projected increase is different among the GCMs CNRM-CM5 projects the smallest increase in the standard deviation of daily values at 013 degC between baseline and RCP45 conditions and 047 degC between baseline and RCP85 conditions HadGEM2-CC projects the biggest increase in the standard deviation of daily values at 062 degC between baseline and RCP45 conditions and 105 degC between baseline and RCP85 conditions The differences among the average water temperature and the standard deviation of daily water temperature as projected by the GCMs mirror the projected differences in air temperature but are smaller in magnitude Given the large differences between the long-term trends in air temperature as determined by the three GCMs and the two RCPs and how closely projected water temperature tracks projected air temperature the uncertainties in the climate scenarios are likely to dwarf any errors in the application of air2water to determine T20
Wind SpeedThere is no expectation that individual events in the
time series of wind speed obtained from a GCM should match those in the measurements during the historical period but the statistics describing the distribution of wind speed should be as close as possible for the wind speed from the GCMs to represent current conditions When the cumulative distribution function (cdf) of the wind speed measurements (daily means 1991ndash2005) was compared to the cdf of the daily values from the GCMs for the same historical period there was substantial bias especially at higher wind speeds indicating the need for an additional downscaling step aimed at matching local scale measurements (fig 5) The approach used to downscale wind speed to the lake surface was similar to the statistical downscaling procedure adopted by Piccolroaz (2013) In this case the future period was divided into 10-year sub-periods (p) for which the corresponding cumulative distribution functions of GCM-modeled daily wind speed were evaluated (cdfGCMp) Each cdf was compared to the cdf of the GCM-modeled wind speed during the reference historical period (cdfGCMh ) in order to define a change function for
the sub-period (rp) that is defined as the ratio between the two cdfs This change function was used to modify the cdf of measurements (daily means to be consistent with the daily data from the GCMs) during the reference historical period (cdfobsh) to create an adjusted cdf (cdfadjp) that would describe the GCM-simulated wind speed for each future sub-period (p) To summarize this technique applies the translation between the cdf of the measurements and the GCM-simulated data during the historical reference period to sub-periods outside the historical reference period in order to obtain downscaled values from the GCM-simulated data The reference historical period (h) was defined as the period when wind speed measurements and baseline data from the GCMs overlapped (1991ndash2005)The whole procedure can be summarized as follows
cdf cdf r cdfcdfcdfadj p obs h p obs h
GCM p
GCM h
= = (2)
The final adjusted wind speed (Wadjp) was computed from the adjusted cdf for the sub-period by applying the quantile-mapping approach (Panofsky and Brier 1968)
( )( )1 adj p adj p GCM p GCM pW cdf cdf Wminus= (3)
where WGCMp is the daily series of GCM-modeled wind
speed for the sub-period p and cdfadj p
minus1 is the inverse of cdfadjp
Results of the downscaling are presented in figure 5 in terms of maximum mean and minimum annual wind speed for both historical and future periods The projected changes in average daily wind speed and average annual maximum wind speed between baseline and future conditions are small (table 2) The CNRM-CM5 GCM projects the 50th percentile wind speed to increase slightly between baseline conditions and either RCP from 371 to 377 ms whereas the HadGEM2-CC GCM projects 50th percentile wind speed to decrease slightly from 373 to 359 ms in the RCP45 scenario and from 373 to 352 ms in the RCP 85 scenario HadGEM2-ES projects decreasing average wind speeds of similar magnitude These results suggest that changes in the frequency of deep ventilation in Crater Lake as simulated by these future climate scenarios are likely to be mainly attributable to the projected changes in air temperature rather than wind speed
12 Simulation of Deep Ventilation in Crater Lake Oregon 1951ndash2099
tac16-1054_fig05
Maximum
Maximum
Maximum
Mean
Mean
Mean
Minimum
Minimum
Minimum
Freq
uenc
y
Win
d sp
eed
in m
eter
s pe
r sec
ond
Wind speed in meters per second
CNRM-CM5
HadGEM2-CC
HadGEM2-ES
1950 2000 2050 2100
1950 2000 2050 2100
1950 2000 2050 2100
10
08
06
04
02
0
5
00
10
10
15
20
Freq
uenc
y
10
08
06
04
02
00
10 20
Freq
uenc
y
10
08
06
04
02
00
10 20
20
Win
d sp
eed
in m
eter
s pe
r sec
ond
0
5
10
15
20
Win
d sp
eed
in m
eter
s pe
r sec
ond
0
5
10
15
20
Note cdf = cumulative distribution function
EXPLANATION EXPLANATIONWind speed observations during historical period
Adjusted GCM-modeled wind speed during baseline period
Adjusted GCM-modeled wind speed during future conditions period RCP45
Adjusted GCM-modeled wind speed during future conditions period RCP85
Year
cdf of observations during the historical period
cdf of GCM-modeled wind speed during the historical period
Figure 5 Cumulative distribution functions of measured and simulated daily wind speed for the common historical period 1991ndash2005 and the original and adjusted minimum mean and maximum wind speed from three general circulation models and two representative concentration pathways during baseline (1951ndash2005) and future (2006ndash2099) conditions at Crater Lake Oregon
One-Dimensional Lake Temperature Modeling 13
Table 2 Statistical characteristics of wind speed for the historical period of record and for the baseline and future conditions periods from three general circulation models (GCMs) and two representative concentration pathways
GCM or
measured Period
Daily wind speed in meters per second
50th percentile 75th percentile 90th percentile Maximum
Historical period of observations 1995ndash1999 2001ndash2006 2009ndash2011
Measured All months 381 610 857 1447December to May 467 724 925 1304
Baseline conditions 1951ndash2005
CNRM-CM5 All months 371 584 828 1519December to May 438 696 914 1447
HadGEM2-CC All months 373 589 843 1479December to May 436 709 926 1479
HadGEM2-ES All months 373 598 848 1886December to May 439 714 932 1886
Last 55 years of future conditions 2045ndash2099 representative concentration pathway 45
CNRM-CM5 All months 377 593 833 1545December to May 452 699 912 1457
HadGEM2-CC All months 359 569 827 1616December to May 426 696 908 1458
HadGEM2-ES All months 360 577 819 1624December to May 441 701 897 1624
Last 55 years of future conditions 2045ndash2099 representative concentration pathway 85
CNRM-CM5 All months 377 594 830 1670December to May 457 701 910 1511
HadGEM2-CC All months 352 557 814 1553December to May 425 687 905 1550
HadGEM2-ES All months 354 565 801 1784December to May 426 679 879 1629
One-Dimensional Lake Temperature Modeling
One-Dimensional Deep Ventilation Model
Density in Crater Lake is a function of temperature pressure and salinity Ideally the salinity concentration profile that results from the balance of hydrothermal inputs at the bottom and freshwater inputs at the surface would be part of the model solution For the purpose of calculating density in the 1DDV model however the change in the salinity profile through time is small Instead an average salinity profile was calculated from CTD profiles collected at site B (fig 1) and
assumed invariant A fourth order polynomial fit to the average salinity profile was used in the model and was assumed time-invariant (fig 6) This profile increases nearly linearly with depth below 200 m from about 1045 to about 108 mgL
at the bottom a gradient of 875times10-3 (mgL)m comparable to Crawford and Collier (2007) Above 200 m depth salinity increases more steeply with depth from about 104 mgL at the surface (fig 6)
Initial Values of Calibration ParametersThe closure relations at the core of the model require
the calibration of two parameters ξ and η which are mainly dependent on the morphological properties of the lake Scaling
14 Simulation of Deep Ventilation in Crater Lake Oregon 1951ndash2099
arguments were used to determine starting values for these parameters The first parameter ξ [(kgm2)s] is used to evaluate the external specific energy input from wind to the lake surface layer (Piccolroaz and Toffolon 2013)
e C W AHBw Dw w= ξτ~ (4)
where CD is the wind drag coefficient W is the wind speed at 10-meters above the lake
surface H is the depth of the wind-affected layer
approximated as the Ekman layer depth 0 4 uf
B is the horizontal scale of the wind-affected area (assumed to be the lake diameter 8200 m)
Aw is the water surface area affected by wind (taken to be the lake surface area 53times106 m2)
τw is the wind shear stress τw=ρaCDW2
ρa is air density ρ0 is water density f is the Coriolis frequency (994times10-5 per s at
Crater Lakersquos latitude of 4295degN) and
u is the friction velocity u w =
τρ0
Substituting for H and τw equation (4) can be rewritten
ξρ ρ
~a wA fB0
0 4 (5)
The starting value of ξ was calculated as 56 (kgm2)s
The second parameter ɳ [km h] is used to estimate the sinking volume during a downwelling event (Piccolroaz and Toffolon 2013)
2 ~d D w wV C W t HBU t= η ∆ ∆ (6)
where ∆tw is the wind duration and U is the mean water velocity within the
wind-driven layer (assumed proportional to u)
Equation 6 yields the following expression for η
ηρ
ρ~ 0 4
0
aBf
(7)
Assuming the full surface area of Crater Lake was wind-affected the starting value of η was calculated as 001128 km h
Two other calibration parameters in 1DDV determine the degree of mixing that occurs between layers When adjacent layers are exchanged in the process of simulating convective mixing the parameter cmix allows for a partial exchange of water between the adjacent layers (and proportional modification of tracer concentrations) When deep downwelling and ventilation occurs and a surface volume moves downward the parameter cmix
accounts for a partial exchange between the sinking volume and the surrounding layers Generally cmix is expected to be greater than cmix
reflecting the fact that deep downwelling is a relatively rapid process
Reference Diffusivity ProfileThe reference turbulent diffusivity profile required by the
model was determined using a modification of the heat budget method (Sweers 1970 Powell and Jassby 1974 Jassby and Powell 1975) that accommodated hydrothermal inputs expressed as
K A Tz
dHdt
Gz r zz z
z = minuspartpart
minus
minus1
(8)
where Kzr Az and Tz are the reference turbulent diffusivity
cross-sectional area and temperature respectively at depth z
tac16_1054_fig 06
103 104 105 106 107 108600
500
400
300
200
100
0
Salinity in milligrams per liter
Dept
h be
low
wat
er s
urfa
ce i
n m
eter
s
EXPLANATION
Individual salinity profile
4th order polynomial fit to the 10 individual profiles
Figure 6 Ten salinity profiles at Site B Crater Lake Oregon collected between July and September 1991ndash1998 and a 4th order polynomial fit to the average of the profiles
One-Dimensional Lake Temperature Modeling 15
Hz is the heat content at depth z defined as
H T z t A z dzzz
z
m
= ( ) ( )prime primeint and (9)
Gz is the total hydrothermal heat input between the maximum depth zm and depth z
G RB z cz p= ( )( )minusρ01 (10)
B(z) is the ldquoeffectiverdquo bottom area between the maximum depth zm and depth z that is the area through which the flux of hydrothermal heat R in Wm2 occurs and
ρ0 and cp are the density and specific heat of water respectively
Implicit in equation 10 is the assumption that the hydrothermal flux R is constant that is hydrothermal inputs as a function of depth are proportional to the circumscribed bottom area at each depth This influences the shape of the turbulent diffusivity profile but there is no basis for a different assumption Because radiative heating is not included equation 8 is only valid below the depth of maximum penetration of the radiative flux of heat from the surface Additionally the CTD temperature profiles that were used to calculate the terms in the equation did not normally go to the maximum depth in the lake therefore the valid range of integration was limited to depths below 50 m to avoid radiative fluxes and above 550 m a depth attained by most temperature profiles
The temperature profile in Crater Lake has a temperature minimum (Tmin) at a depth (zmin) below the seasonal thermocline located generally between 250 and 350 m depth The small increase in temperature with depth below zmin is a consequence of hydrothermal inputs (McManus and others 1992) The calculation of terms in equation 8 was limited to profiles between July and September of each year when the change in heat content below zmin could be attributed to hydrothermal inputs alone under the assumptions that the diffusive fluxes across zmin are zero and exchange with water from the upper water column does not occur during these months Under these assumptions the change in heat content in the deep water column between an initial July profile and a final September profile was estimated as
∆ = minus( )H c H Hdeep p z final z initialρ0 (11)
where z was the midpoint between depth of minimum
temperature in the initial and final profiles
The change in heat content calculated in this way had an average value of 14 Wm2 over 19 years when normalized to the bottom area below 350 m depth as compared to the previous estimate of 1 Wm2 (McManus and others 1993) The hydrothermal flux calculated in this way varied substantially from year to year (table 3) Whether this indicates a true variation in hydrothermal inputs or 3-dimensional effects related to the transport of hydrothermal fluids between the primary source in the south basin and the location of site B (fig 1) is unknown but for the purpose of calculating diffusivity a different value of the hydrothermal heat flux R in equation 10 was assigned to each year by dividing the calculated change in heat content in that year by the bottom surface area between 400 and 550 m depth An upper limit of 400 m was used instead of 350 m as in McManus and others (1993) because it was below the deepest value of zmin in the profiles
In the metalimnion above zmin the change in heat content through summer is expected to be positive as a result of diffusive transport of heat from the surface downward However the change in heat content between 150 m (below the thermocline) and z calculated in a manner analogous
Table 3 Rate of change in heat content in the deep and mid water column and the calculated hydrothermal flux between July and September Crater Lake Oregon 1990ndash2013
[Hydrothermal flux R is calculated based on bottom surface area below 350 meters depth Abbreviations Jd joule per day W m2 watt per square meter]
YearDeep
(times1012 Jd)R
(Wm2)
1990 143 0561991 100 0391994 318 1251995 498 1961996 107 0421998 655 2581999 385 1512000 196 0772003 857 3372004 548 2152005 242 0952006 -024 -0092007 232 0912008 380 1492009 725 2852010 406 1592011 344 1352012 242 0952013 303 119Mean 350 138
16 Simulation of Deep Ventilation in Crater Lake Oregon 1951ndash2099
to equation 11 resulted in changes that were positive and negative implicating horizontal transport and lateral heterogeneity Ravens and others (2000) encountered similar difficulties in calculating Kzr using the heat budget method in Lake Baikal A mean Kzr profile was obtained by averaging only those years in which the overall change in heat content between 150 m depth and z was positive indicating diffusive transport and removing the remaining few spurious negative values from the profiles before averaging The final profile above 350 m depth was based on July and September profiles in 9 years the profile below 350 m was based on July and September profiles in 19 years (fig 7) The resulting profile shows an increase in diffusivity in the deep lake below the temperature minimum where hydrothermal inputs make the water column marginally stable (McManus and others 1993) The profile is broadly consistent with the previous estimates of a turbulent diffusion coefficient between 10-4 and 10-3 m2s (McManus and others 1993) although because it is calculated over summer the profile could be an underestimate of diffusive mixing during the winter McManus and others (1993) calculated values for the summer between 6times10-4 and 8times10-4 m2s at depths from 250 to 420 m about a factor of 2 smaller than the estimate of 2times10-3 calculated for February
Because the diffusivity profile typically is characterized by a marked seasonality and may undergo significant inter-annual variability due to changes in external forcing
tac16_1054_fig 07
Dept
h be
low
wat
er s
urfa
ce i
n m
eter
s
500
600
400
300
200
100
0
10-45x10-4 2x10⁻⁴ 5x10⁻⁴ 10-3 2x10⁻³ 5x10⁻³
Reference turbulent diffusivity in square meters per second
Figure 7 Reference turbulent diffusivity profile for the 1-dimensional deep ventilation model of Crater Lake Oregon
the model is provided with a simple module to dynamically reconstruct the temporal evolution of Kz At every computational time step Kz is derived building on well-known empirical relationships of the type (for example Munk and Anderson 1948 Pacanowski and Philander 1981)
KK
aRiKz
z r
b c z bg=+( )
1 (12)
where Kzr is the reference diffusivity profile Kzbg is a background value (set equal to
1times10- 5 m2s consistent with typical values suggested by Pacanowski and Philander [1981]) and
Ri is the Richardson number and a b and c are positive parameters
For the purpose of calculating the Richardson number the square of the vertical velocity gradient is calculated as the sum of a background value an internal wave contribution proportional to the Brunt-Vaisala frequency and a wind shear contribution based on the law of the wall (Mellor 1989 see also Piccolroaz and Toffolon 2013 appendix A for details) Within the uppermost layer of the lake (that is within the Ekman layer) Kz is imposed to be uniform and equal to
Kf
Ck
Wz surfa D
=
1
0
22ρ
ρ (13)
where k is a constant that is in the range
1times10-2 le k le4times10-2 (Kullenberg 1976)
CalibrationHistorical data between September 23 2000 and
August 3 2006 the ldquomiddlerdquo period of available data were used for model calibration Crater Lake was organized into 37 layers of equal volume of 05 km3 and sub-volumes were set equal to 01 km3 The 37 layers were centered at depths between 5 and 554 m Calibration began by using the calculated starting values of 56 (kgm2)s and 001128 km h for ξ and η respectively and the mixing percentages of 06 percent between ambient and downwelling volumes and 10 percent between unstable sub-volumes that were used for Lake Baikal (Piccolroaz and Toffolon 2013) Equation 13 was evaluated for four values of k within the acceptable range 001 002 003 and 004 a value of 002 was selected for further model calibration
One-Dimensional Lake Temperature Modeling 17
Several combinations of ξ η cmix and cmix values were
considered The calibration process started by considering ξ values ranging from 1 to 56 (kgm2)s to determine a minimum value required to translate the measured wind into enough kinetic energy to induce mixing this minimum value was approximately 7 (kgm2)s Next several combinations of ξ and η were considered by incremental adjustments of ξ by approximately 5 (kgm2)s and η by approximately 000077 km h When a good set of parameter values that captured the general timing and magnitude of deep ventilation events was attained (ξ of 20ndash30 (kgm2)s and η of 0003ndash0008 km h) the parameter increments were further refined and adjustments to the mixing parameters were made based on inspection of simulated temperature time series at 16 depths in the lake where temperature was measured The final combination of parameter values that provided the best overall simulation of temperature at depths between 20 and 530 m and which best captured the occurrence and magnitude of deep ventilation events determined by minimizing the RMSE of DecemberndashJune changes in lower lake heat content was η equal to 000386 km h ξ equal to 28 (kgm2)s cmix equal to 100 percent and cmix
equal to 90 percent (table 4) The resulting calibrated model had a tendency to
simulate a deeper-than-observed thermocline (that is warmer temperatures than measured above 70 m depth) in late summer and colder temperatures than measured in the metalimnion down to 200 or 250 m depth in late spring and summer but captured the overall shape of the thermal profile and its seasonal changes well (figs 8 9 and 10) The winter months of reverse stratification generally are characterized by a thicker mixed layer in the thermistor data than is simulated by the model Performance statistics for the calibrated model
simulations of temperature compared to thermistor data at target depths are presented in table 5 Maximum values of bias (positive) RMSE and the coefficient of variation of the RMSE (CVRMSE) between the simulated and measured temperature were between 40 and 70 m depth a result of the simulated depth of the thermocline being too great in summer and the simulated base of the mixed layer being too shallow in winter (figs 8 and 9)
At the base of and below the seasonal thermocline the model simulated the rapid changes in temperature associated with a deepening mixed layer in the cooling phase of the seasonal cycle but the extremes in temperature were smaller than measured (between 150 and 250 m in fig 11) In the deep lake below 350 m the abrupt drop in temperature of a fraction of a degree associated with deep ventilation events in 2004 and 2006 were well simulated At 530 m the deep ventilation event that is mild in the 2002 measurements was simulated as a somewhat stronger event by the 1DDV model penetrating to the deepest simulation layer representing the bottom of the lake
Table 4 Calibration parameters for the 1-dimensional deep ventilation model of Crater Lake Oregon
[Abbreviations km kilometer h hour kg kilogram m meter s second ndash no units]
Parameter Value Units
η 000386 km hξ 28 (kgm2)s
cmix 1000 percentc´mix 900 percent
k 002 ndash
Table 5 Goodness-of-fit statistics at thermistor target depths for temperature simulated with the 1-dimensional deep ventilation model Crater Lake Oregon 2000ndash2006
[RMSE Root-mean-square error NRMSE Normalized root-mean-square error (RMSE divided by the range of the observations) CVRMSE Coefficient of variation of the root-mean-square error (RMSE divided by the mean of the observations) Abbreviation degC degrees Celsius]
DepthBias (degC)
RMSE (degC)
NRMSE CVRMSE
20 -012 031 003 00640 026 066 011 01450 027 068 013 01570 015 044 012 01190 006 030 010 008
110 001 024 011 006130 000 020 010 005150 002 017 011 005170 003 016 012 004200 004 013 012 004250 005 009 013 003300 007 008 016 002350 007 008 024 002400 006 007 027 002460 004 006 025 002530 003 005 016 001
18 Simulation of Deep Ventilation in Crater Lake Oregon 1951ndash2099
tac16_1054_fig 08
500
400
300
200
100
0Measured temperature 2000ndash2006
Dept
h be
low
wat
er s
urfa
ce i
n m
eter
s
2000 2001 2002 2003 2004 2005 2006Year
121526531536541546551556561566571520
EXPLANATIONTemperature in
degrees Celsius
Figure 8 Contour plot showing measured temperature data Crater Lake Oregon 2000ndash2006
tac16_1054_fig 09
0Simulated temperature 2000ndash2006
Year
Dept
h be
low
wat
er s
urfa
ce i
n m
eter
s
500
400
300
200
100
20012000 2002 2003 2004 2005 2006 121526531536541546551556561566571520
EXPLANATIONTemperature in
degrees Celsius
Figure 9 Contour plot showing temperature simulated with the 1-dimensional deep ventilation model Crater Lake Oregon 2000ndash2006
One-Dimensional Lake Temperature Modeling 19
tac16_1054_fig 10
October 15 2003
500
600
400
300
200
100
0
Dept
h be
low
wat
er s
urfa
ce i
n m
eter
s
500
600
400
300
200
100
0
January 15 2004 April 15 2004 July 1 2004
October 15 2004 January 15 2005 April 15 2005 July 1 2005
4 6 82 1210 4 6 82 1210 4 6 82 1210
3-day average temperature in degrees Celsius
4 6 82 1210
EXPLANATIONMeasuredSimulated
Figure 10 Comparison of selected measured temperature profiles with profiles simulated with the 1-dimensional deep ventilation model Crater Lake Oregon 2003ndash2005
The thermistor data show at least mild cooling in the hypolimnion between 250 and 450 m in most years even if it does not penetrate to the bottom as in years when a strong ventilation occurs (fig 11) The simulations do not show such mild cooling every year The lack of these small adjustments to hypolimnion temperatures can result in a larger simulated event when it does occur as in 2002 The ability of 1DDV to simulate the small but important variation in temperature at the deep thermistors is quantified by the RMSE normalized by the overall range in measurements (NRMSE) which was largest below 350 m depth (NRMSE between 016 and 027 table 5)
These features can be seen dynamically in animations of a winter of no deep ventilation (fig 12) and a winter in which deep ventilation occurred (fig 13) During the warming phase of the summer the depth of the simulated thermocline is close to the observed depth in both years By September coincident with the cooling phase the simulated thermocline is too deep and continues to deepen more rapidly than is shown in the observations In winter the animations (figs 12 and 13) show the tendency of the model to under-estimate the depth of the mixed layer in winter starting in February and lasting through April 2003 (fig 12) and starting in January and lasting through April 2004 (fig 13)
20 Simulation of Deep Ventilation in Crater Lake Oregon 1951ndash2099
Figure 11 Comparison of measured temperature to temperature simulated with the 1-dimensional deep ventilation model at depths between 20 and 530 meters Crater Lake Oregon 2000ndash2006
tac16_1054_fig 11
Tem
pera
ture
in
degr
ees
Cels
ius
Tem
pera
ture
in
degr
ees
Cels
ius
12
4
2
6
8
10
20 meters
3
2
4
5
6
770 meters
30
35
40
45150 meters
2000 2002 20062004 2000 2002 20062004 2000 2002 20062004
2000 2002 20062004 2000 2002 20062004 2000 2002 20062004
200 meters 250 meters 530 meters
30
32
34
36
38
40
32
34
36
34
36
38
40
37
35
42
EXPLANATIONMeasuredSimulated
The model correctly did not simulate a deep ventilation event in spring 2003 (fig 12) but it did correctly simulate a deep ventilation event starting in February 2004 (fig 13) The profile of turbulent diffusivity is relatively dynamic above about 250 m with a minimum at the thermocline and increasing above to a maximum at the surface In the hypolimnion the profile is relatively stable and increases to a maximum in the bottom boundary layer
For the purposes of this study more important than accuracy in the simulation of temperature at discrete depths (which was satisfactory) was the ability of the model to simulate the integrated heat content of the upper and lower water column which is the basis for determining whether deep ventilation occurred in a given year In Crater Lake
a natural demarcation between the upper and lower water column occurs at a depth of 325 m because a temperature minimum is usually apparent near this depth in winter temperature profiles which is the basis for assuming hydrothermal fluxes are confined to greater depths (McManus and others 1992 McManus and others 1993) and because thermistors were located at target depths of 300 and 350 m For the historical period 2000ndash2006 such events are evident in the lower heat content in the early winter of 2004 and 2006 (fig 14) and a smaller event is evident in early winter 2002 The ability of 1DDV to simulate the heat content in both the upper water column (above 325 m) and lower water column as calculated from the thermistors was good as indicated by small overall bias and CVRMSE between 001 and 005
One-Dimensional Lake Temperature Modeling 21
tac16_1054_fig 12
Dept
h be
low
wat
er s
urfa
ce i
n m
eter
s
0
400
500
600
300
200
100
October 2002
2 4 6
Temperature in degrees Celsius Diffusivity in square meters per second8 10 1 times 10-4 1 times 10-2
EXPLANATIONThermistorSimulated
Figure 12 Temperature and diffusivity profiles over the autumn to spring months of 2002ndash2003 when no deep ventilation of the water column occurred Crater Lake Oregon Animation in AVI format is available for download at httpdxdoiorg103133sir20165052
tac16_1054_fig 13
Dept
h be
low
wat
er s
urfa
ce i
n m
eter
s
0
400
500
300
200
100
October 2003
2 4 6Temperature in degrees Celsius Diffusivity in square meters per second
8 10 1 times 10-4 1 times 10-2
600
EXPLANATIONThermistorSimulated
Figure 13 Temperature and diffusivity profiles over the autumn to spring months of 2003ndash2004 when deep ventilation of the water column occurred Crater Lake Oregon Animation in AVI format is available for download at httpdxdoiorg103133sir20165052
22 Simulation of Deep Ventilation in Crater Lake Oregon 1951ndash2099
Table 6 Goodness-of-fit statistics for heat content calculated from temperatures simulated by the 1-dimensional deep ventilation model of Crater Lake Oregon 1994ndash2011
[RMSE Root-mean-square error NRMSE Normalized root-mean-square error (RMSE divided by the range of the observations) CVRMSE Coefficient of variation of the root-mean-square error (RMSE divided by the mean of the observations) Abbreviations J joule m meter]
PeriodDepth range
(m)
Bias (times1015 J)
RMSE (times1015 J)
NRMSE CVRMSE
1994ndash1999 0ndash325 083 1130 007 005325ndash550 041 100 021 001
2000ndash2006 (calibration)
0ndash325 073 959 008 004325ndash550 110 131 025 002
2008ndash2011 0ndash325 011 1180 010 005325ndash550 -042 054 016 001
tac16-1054_fig14
1995 2000 2005 2010
15 times 1017
20 times 1017
25 times 1017
30 times 1017
Upper 325 meters
Heat
con
tent
in
joul
es
65 times 1016
70 times 1016
75 times 1016
80 times 1016
Lower 325minus550 meters
Simulated
Measured
EXPLANATION
Figure 14 Upper and lower water-column heat content calculated from thermistors and from temperatures simulated by the 1-dimensional deep ventilation model of Crater Lake Oregon during the calibration years 2000ndash2006 and the validation years 1994ndash1999 and 2008ndash2011
The NRMSE values were larger for the lower water column in all three historical periods between 016 and 025 as compared to 007 to 010 for the upper water column (table 6) indicating the challenge of simulating the relatively small
changes in lower water column heat Most importantly however the model correctly simulated the historical series of deep ventilation events capturing the occurrences in each of 2002 2004 and 2006 (fig 14)
One-Dimensional Lake Temperature Modeling 23
Dynamic Reservoir Simulation Model
The hydrothermal fluxes into Crater Lake occur below 350 m depth and have been estimated to be 10 Wm2 (McManus and others 1992) We modified this value to 14 Wm2 based on the change in heat content between early and late summer temperature profiles (see section Reference Diffusivity Profile) and used this modified value in the DYRESM simulations (This higher value was confirmed by the simulations done with DYRESM because the flux of 10 Wm2 was too small to properly capture the warming of deep water when deep ventilation does not occur) Further definition of the depth distribution of hydrothermal inputs has not been possible so the total inflow was assumed to be distributed evenly across the sediment area below 350 m depth To incorporate the diffuse hydrothermal fluxes the subsurface inflow function of DYRESM was used and it was assumed that the total hydrothermal flux comprised four discrete inflows between 350 and the maximum depth of 592 m (at 375 425 475 and 525 m depth) Each of the four discrete inflows integrated the hydrothermal flux of a 50 m depth range centered on the discrete depth Based on a constant hydrothermal heat flux of 14 Wm2 and a salinity flux of 5 (microgm2)s and a total volume of hydrothermal inflow of 17280 m3d (140 Ls McManus and others 1993) the rate of heat input (in joules per day) salt input (in milligrams per day) and hydrothermal inflow (in cubic meters per day) at each of the four depths was calculated based on the fraction of the total bottom surface area included within the range of depths that the discrete source represented For example the inflow at 375 m was based on the bottom surface area between 350 and 400 m depth The calculated temperature and salinity of the hydrothermal inflow applied at the point sources was 3473 degC and 073 practical salinity unit (PSU) respectively based on the total hydrothermal flux of heat and salinity and the total volume of inflow
CalibrationThe DYRESM parameter suite includes three parameters
that control mixing in the upper part of the water column shear production efficiency (ηk) potential energy mixing efficiency (ηp) and wind stirring efficiency (ηs) Two other parameters influence mixing below the epilimnion diffusivity at the top of the bottom boundary layer (KBBL) and a coefficient of proportionality between eddy diffusivity and lake number (CLN our notation) The minimum and maximum layer thicknesses were specified as 2 and 10 m respectively Although calibration of the model is not deemed necessary (Imerito 2014) the model tended toward a deeper-than-observed surface mixed layer in the summer (figs 15 and 16) Several model runs were made in an attempt to optimize the model parameters for Crater Lake but substantial quantitative improvement was not obtained so the DYRESM model was run with default parameter values (table 7) for the mid time period roughly 8 years from September 1999 to August 2007 using the parameters supplied with the model
The performance of the model in reproducing the temperature measured at the thermistors was generally good in the upper 100 m of the water column during the winter months which are most important for this study In summer the model reproduced surface temperature well but over-estimated the temperature at 20 m depth indicating too much entrainment at the base of the mixed layer (fig 15) The maximum values of bias RMSE and CVRMSE were at 20 m depth (039 degC 129 degC and 024 respectively table 8) At the base of and below the seasonal thermocline between 100 and 200 m the model simulated the rapid changes in temperature associated with a deepening mixed layer in the cooling phase of the seasonal cycle but the overall variation in measured temperature was small and the extreme values were not well-captured (fig 16) In the deep water column the rapid decreases in temperature of a fraction of a degree associated with deep ventilation events were not well-simulated indeed at 530 m there was no change in simulated temperature during the calibration period indicating no simulated exchange with water from above (fig 16) Below 350 m NRMSE varied between 030 and 152 (table 8)
The ability of DYRESM to simulate the heat content in the upper 325 m as calculated from the thermistors was good as indicated by the NRMSE and CVRMSE values of 010 and 005 respectively (table 8) although a summer positive bias is apparentmdasha result of the thermocline being simulated to be too deep but also an indication that the input of heat at the water surface was too large Sensitivity analyses demonstrated that the surface heat budget was sensitive to the cloud cover calculation and the resulting atmospheric longwave radiation calculation (necessary because longwave radiation was not directly measured) The Swinbank (1963) calculation used in DYRESM may not adequately account for the altitude dependence of atmospheric emissivity on atmospheric water vapor (Marty and others 2002 Ruckstuhl and others 2007 Yang and others 2010) resulting in an overestimation of longwave radiation
As can be inferred from the comparison of model simulation results to the deepest thermistors DYRESM lacks the ability to simulate the dynamics of the heat content in the lower water column (fig 17) The NRMSE of 032 (table 8) indicates that the simulation of heat content in the lower water column also was quite good but the statistic does not capture the fact that DYRESM does not simulate the small but important abrupt decreases in lower water-column heat content associated with deep ventilation events which are clearly seen in figure 17 Thus DYRESM and 1DDV were both able to simulate temperature and heat content in the upper water column with acceptable accuracy However the assumptions on which DYRESM depends are not able to capture the thermobaric instability that is crucial for deep ventilation in the late winter making this model inappropriate to investigate the phenomenon
24 Simulation of Deep Ventilation in Crater Lake Oregon 1951ndash2099
Table 8 Goodness of fit statistics for the DYnamic REservoir Simulation Model of Crater Lake Oregon 1999ndash2007
[RMSE root-mean-square error NRMSE normalized root-mean-square error (RMSE divided by the range of the observations) CVRMSE coefficient of variation of the root-mean-square error (RMSE divided by the mean of the observations) Abbreviations m meter degC degrees Celsius J joule]
Temperature at thermistor depths
Depth (m)
Bias (degC)
RMSE (degC)
NRMSE CVRMSE
20 039 129 014 02440 017 059 010 01350 012 045 009 01070 010 038 010 00990 004 032 011 008
110 000 030 013 008130 004 033 017 009150 009 031 020 008170 014 027 020 007200 016 023 022 006250 019 023 031 006300 006 017 032 005350 -012 012 037 003400 -010 011 042 003460 016 034 152 009530 -008 009 030 002
Heat content
Depth range
(m)
Bias (times1015 J)
RMSE (times1015 J)
NRMSE CVRMSE
0ndash325 516 1224 010 005325ndash550 059 166 032 002
Table 7 DYnamic REservoir Simulation Model default parameter values
[Abbreviations m meter s second ndash no units]
Parameter Value Units
ηk 006 ndashηp 020 ndashηs 040 ndash
KBBL 14times10-5 m2sCLN 20000 ndash
One-Dimensional Lake Temperature Modeling 25
tac16-1054_fig15
October 15 2001
Dept
h be
low
wat
er s
urfa
ce i
n m
eter
s
500
400
300
200
100
0
500
400
300
200
100
0
January 15 2002 April 15 2002 July 01 2002
2 4 6 8 10 12 14 2 4 6 8 10 12 14 2 4 6 8 10 12 14 2 4 6 8 10 12 14
October 15 2002 January 15 2003 April 15 2003
3minusday average temperature in degrees Celsius
July 01 2003
EXPLANATIONMeasured
Simulated
Figure 15 Comparison of selected measured temperature profiles to profiles simulated with the DYnamic REservoir Simulation Model Crater Lake Oregon 2001ndash2003
26 Simulation of Deep Ventilation in Crater Lake Oregon 1951ndash2099
tac16-1054_fig16
0
5
10
15
202 meters
Tem
pera
ture
in
degr
ees
Cels
ius
10
12
14
1420 meters
30
25
35
40
45150 meters
2000 2002 2004 200632
34
36
38
40
42250 meters
2000 2002 2004 200633
34
35
36
37
38
39300 meters
2000 2002 2004 20062008 2008 200834
35
36
37400 meters
2
0
4
6
8
EXPLANATION
Measured
Simulated
Figure 16 Comparison of measured temperature to temperature simulated with the DYnamic REservoir Simulation Model Crater Lake Oregon 1999ndash2007
One-Dimensional Deep Ventilation Model Validation
Validation focused on the simulation of heat content Using the selected combination of model parameters the 1DDV model was run over the two remaining historical periods for which data were available August 13 1994 to August 24 1999 and August 25 2008 to July 5 2011 Heat content calculations indicate that the model did a good job of capturing upper lake heat content in both validation periods with an NRMSE less than or equal to 010 and CVRMSE equal to 005 (table 6) The model performance in simulating heat content in the lower lake was moderately good For the earlier 1994ndash1999 period the heat content calculated from simulated temperature in the lower depths resulted
in an NRMSE of 021 (CVRMSE 001) when compared to heat content calculated from thermistor data For the later 2008ndash2011 period the heat content calculated from simulated temperature in the lower depths resulted in an RMSE of 016 (CVRMSE 001) It is noteworthy that the model appropriately simulated deep ventilation in all but 1 year in which it was observed (fig 14 a strong deep ventilation event was simulated in 1997 when it was not observed as opposed to 1998 when it was) and the poor correlation from 1994 to 1999 is largely attributable to less-than-observed deep ventilation in 1995 and more-than-observed deep ventilation in 1997 Because the deep lake retains a memory of past years discrepancies between observed and simulated deep ventilation can propagate For example the simulation of more-than-observed deep ventilation in 1997 prevented the
One-Dimensional Lake Temperature Modeling 27
tac16-1054_fig17
15 times 1017
25 times 1017
Upper (0minus325 meters)
Heat
con
tent
in
joul
es
2000 2001 2002 2003 2004 2006 2007 2008200568 times 1016
72 times 1016
20 times 1017
30 times 1017
70 times 1016
74 times 1016
76 times 1016Lower (325minus550 meters)
Year
EXPLANATION
Measured
Simulated
Figure 17 Upper and lower water-column heat content calculated from thermistors and from temperatures simulated by the DYnamic REservoir Simulation Model of Crater Lake Oregon 1999ndash2007
simulation of the 1998 event by decreasing the temperature difference between the surface and the bottom at the time when deep ventilation should occur resulting in a stable temperature profile
The final validation of the calibrated model was in the form of identifying the occurrence of deep ventilation events A simple metric used to compare measured thermistor data and simulated values was the difference in lower water column heat content between December and June of each simulation winterndashspring season (table 9) There is a significant (p = 003) positive Pearson correlation of 034 between the measured and simulated change in lower water column heat content even with the improper simulation of an event in 1997 and resultant lack of a simulated event in 1998 (fig 18) Most importantly for the purpose of this analysis the frequency of deep ventilation events was 05 for both the measurements and simulations
Table 9 Change in heat content from December to June in the lower water column of Crater Lake Oregon 1994ndash2011
[Lower water column defined as depths greater than 325 m Shaded values indicate cooling bolded values indicate deep mixing events defined as cooling greater than 9 times1014 joules Abbreviations 1DDV 1-dimensional deep ventilation mode J joule m meter]
YearsMeasured
(times1015 J)
1DDV simulation
(times1015 J)
1994ndash1995 -260 -1161995ndash1996 004 -0481996ndash1997 045 -1971997ndash1998 -126 -0041998ndash1999 -153 -1522000ndash2001 042 1042001ndash2002 -025 -0762002ndash2003 -006 0502003ndash2004 -202 -1372004ndash2005 082 0992005ndash2006 -206 -1982008ndash2009 -099 -1462009ndash2010 -057 -0672010ndash2011 -099 -175
28 Simulation of Deep Ventilation in Crater Lake Oregon 1951ndash2099
Results of Future Climate ScenariosThe CNRM-CM5 model projected the mildest air
temperature scenario of the three GCMs considered and this translated to the mildest scenario in terms of the changes to water-column stratification and the frequency of deep ventilation (fig 19AndashB table 10) Over the 149 years of simulation spanning the baseline period through 2099 the RCP45 scenario projected a transition from deep-water temperatures in the range of 33 to 38 degC during the baseline period (1951ndash2005) to a range of 35 to 43 degC between 2050 and 2099 and a deepening of the 43 degC isotherm (fig 19A) The minimum compensation depth characterizing days when deep ventilation occurred in each year progressively shallowed as an effect of the progressive warming of the entire water column profile which was caused by increasing surface temperatures As the entire profile warmed and shifted farther away from the temperature of maximum density curve the
tac16-1054_fig18
EXPLANATION
-1 times 1015 1 times 1015
-1 times 1015
0
0
1 times 1015
2 times 1015
Thermistor change in heat content in joules
Sim
ulat
ed c
hang
e in
hea
t con
tent
in
joul
es
2 times 1015
Threshold for deep ventilation events
Deep ventilation event observed
Deep ventilation event not observed
Incorrect
Correct Incorrect
Correct
Figure 18 Comparison of the change in heat content between December and June as calculated from thermistor data and as simulated with the 1-dimensional deep ventilation model of Crater Lake Oregon 1994ndash1999 2000ndash2006 and 2008ndash2010 Dashed lines represent the 9times1014 joule threshold for the change in heat content used to identify deep ventilation events Quadrants indicate which years were correctly and incorrectly simulated by the 1-dimensional deep ventilation model
minimum compensation depth decreased from as deep as 250 m early in the baseline period to no deeper than 50 m after 2070 until the point when the entire water column was always greater than 4 degC and the compensation depth could no longer be defined After 2050 there was no compensation depth in most years because temperature in the surface mixed layer did not go below 4 degC (table 1 fig 20AndashB) The RCP85 scenario projected water column temperatures greater than 43 degC throughout the water column after 2080 and no years of minimum surface mixed layer temperature below 4 degC after 2065 (figs 19B and 20B)
The most extreme projections came from the HadGEM2-ES model (figs 19EndashF) Over the 149 years of simulation the RCP45 scenario projected a transition from deep-water temperatures in the range of 33 to 38 degC during the baseline period to a range of 38 to greater than 43 degC between 2050 and 2099 and a deepening of the 43 degC isotherm (fig 19E) The temperature in the surface mixed layer was less than 4 degC in only 1 year after 2070 The RCP85 scenario projected water column temperatures greater than 43 degC throughout the water column after 2060 and no years of minimum surface mixed layer temperature less than 4 degC after 2045 (figs 19 and 20EndashF) The HadGEM2-ES RCP85 temperature projections lead the CNRM-CM5 RCP85 projections by about 20 years
Once the surface water no longer decreases to below 4 degC in winter there is no mechanism for thermobaric instability and the vertical extent of mixing is limited to the depth to which convective mixing can penetrate from the surface Convective mixing to great depth can still occur when the surface water gets colder than the rest of the water column and deep waters have had enough time to warm from hydrothermal inputs however this occurs less frequently in future simulations Such events are evidenced in figure 19 by the appearance of vertical profiles of cooler water between 4 and 43 degC The model shows such deep convective mixing events occurring infrequently after 2070 but they are evident in the RCP85 scenarios in 2078 (CNRM-CM5) 2086 (HadGEM2-CC) and 2050 (HadGEM2-ES) (figs 19B D F figs 20B D F)
The frequency of deep ventilation during the baseline period and in alternative future climates is quantified in table 11 CNRM-CM5 is again the model that projected the most moderate changes of the three GCMs considered Based on a threshold for change in lower water-column heat content of -9times1014 J the projected change in the frequency of deep ventilation under the RCP45 scenario went from 33 percent during the baseline period to 31 percent in the future conditions Under the RCP85 scenario the projection was a change in frequency from 33 percent during the baseline period to 33 percent in the first 55 years of future conditions to 18 percent in the second 55 years
Results of Future Climate Scenarios 29Ta
ble
10
Line
ar re
gres
sion
mod
els
of u
pper
and
low
er w
ater
-col
umn
heat
con
tent
in C
rate
r Lak
e a
s ca
lcul
ated
from
tem
pera
ture
s si
mul
ated
by
the
1-di
men
sion
al d
eep
vent
ilatio
n m
odel
for
bas
elin
e an
d fu
ture
con
ditio
ns fr
om th
ree
gene
ral c
ircul
atio
n m
odel
s an
d tw
o re
pres
enta
tive
conc
entra
tion
path
way
s
[Cha
nge
in a
ir te
mpe
ratu
re C
alcu
late
d ba
sed
on th
e lo
ng-te
rm tr
end
over
the
entir
e 93
yea
rs o
f fut
ure
clim
ate
(fig
4)
RM
SE R
oot-m
ean-
squa
re e
rror
Cha
nge
in w
ater
tem
pera
ture
C
alcu
late
d ba
sed
on th
e lin
ear t
rend
in th
e ra
te o
f cha
nge
in h
eat c
onte
nt fo
r the
upp
er a
nd lo
wer
wat
er c
olum
n re
spec
tivel
y A
bbre
viat
ions
m m
eter
degC
deg
ree
Cel
sius
J j
oule
Wm
2 w
att
per s
quar
e m
eter
]
Gen
eral
ci
rcul
atio
n m
odel
Chan
ge
in a
ir
tem
pera
ture
(deg
C)
Upp
er w
ater
col
umn
(0ndash3
25 m
)Lo
wer
wat
er c
olum
n (3
25ndash5
90 m
)
Mea
n da
ily
heat
co
nten
t (times
1017
J)
Rate
of c
hang
e in
he
at c
onte
nt
RMSE
(times
1017
J)
Chan
ge
in w
ater
te
mpe
ratu
re
(degC)
Mea
n da
ily
heat
co
nten
t (times
1016
J)
Rate
of c
hang
e in
he
at c
onte
nt
RMSE
(times
1016
J)
Chan
ge
in w
ater
te
mpe
ratu
re
(degC)
Line
ar tr
end
(times10
17
Jde
cade
)
Nor
mal
ized
by
are
a (W
m2 )
Line
ar tr
end
(times10
16
Jde
cade
)
Nor
mal
ized
by
are
a (W
m2 )
Base
line
cond
ition
s 1
951ndash
2005
CN
RM
-CM
51
382
290
034
026
032
90
327
250
009
002
016
002
Had
GEM
2-C
C0
192
370
008
006
032
30
077
26-0
007
-00
10
15-0
02
Had
GEM
2-ES
-03
02
330
020
015
032
10
197
190
035
006
016
009
Firs
t 55
year
s of
futu
re c
ondi
tions
200
6ndash20
61 r
epre
sent
ativ
e co
ncen
tratio
n pa
thw
ay 4
5
CN
RM
-CM
51
172
560
036
027
032
70
347
660
053
009
029
014
Had
GEM
2-C
C1
682
610
084
063
033
50
807
690
174
030
021
046
Had
GEM
2-ES
144
265
007
60
570
333
073
779
010
10
170
270
27
Last
55
year
s of
futu
re c
ondi
tions
204
5ndash20
99 r
epre
sent
ativ
e co
ncen
tratio
n pa
thw
ay 4
5
CN
RM
-CM
51
172
770
062
047
035
80
607
970
088
015
035
023
Had
GEM
2-C
C1
682
910
072
054
036
60
698
360
183
031
039
048
Had
GEM
2-ES
144
297
007
20
540
368
068
842
015
80
270
340
42
Firs
t 55
year
s of
futu
re c
ondi
tions
200
6ndash20
61 r
epre
sent
ativ
e co
ncen
tratio
n pa
thw
ay 8
5
CN
RM
-CM
53
312
600
072
054
033
80
687
730
127
022
031
033
Had
GEM
2-C
C3
012
730
124
093
036
61
187
840
212
036
031
056
Had
GEM
2-ES
301
276
014
21
070
339
136
807
033
50
570
320
88
Last
55
year
s of
futu
re c
ondi
tions
204
5ndash20
99 r
epre
sent
ativ
e co
ncen
tratio
n pa
thw
ay 8
5
CN
RM
-CM
53
313
220
238
179
039
52
288
840
445
076
044
117
Had
GEM
2-C
C3
013
370
193
145
040
81
849
360
463
079
065
122
Had
GEM
2-ES
301
345
019
21
440
363
183
998
060
01
020
371
58
30 Simulation of Deep Ventilation in Crater Lake Oregon 1951ndash2099
tac1
6-10
54_f
ig19
ab
Depth below water surface in metersA
Sim
ulat
ed te
mpe
ratu
re C
NRM
minusCM
5 RC
P45
sce
nari
o 19
51ndash2
099
500
400
300
200
1000
End
of b
asel
ine
peri
od
Com
pens
atio
n de
pth
500
400
300
200
1000 19
5119
7119
9120
1120
3120
5120
7120
91
B S
imul
ated
tem
pera
ture
CN
RMminusC
M5
RCP8
5 s
cena
rio
1951
ndash209
9
1215
265
315
365
415
465
515
565
615
665
715
20
EXPL
AN
ATIO
NTe
mpe
ratu
re i
nde
gree
s Ce
lsiu
s
Figu
re 1
9
Tem
pera
ture
of C
rate
r Lak
e O
rego
n s
imul
ated
with
the
1-di
men
sion
al d
eep
vent
ilatio
n m
odel
for
bas
elin
e an
d fu
ture
con
ditio
ns fr
om th
ree
gene
ral
circ
ulat
ion
mod
els
and
two
repr
esen
tativ
e co
ncen
tratio
n pa
thw
ays
(A) C
NRM
-CM
5 R
CP4
5 (B
) CN
RM-C
M5
RCP
85
(C) H
adGE
M2-
CC R
CP4
5 (D
) Had
GEM
2-CC
RC
P85
(E)
Had
GEM
2-ES
RCP
45
(F) H
adGE
M2-
ES R
CP8
5
Results of Future Climate Scenarios 31
tac1
6-10
54_f
ig19
cd
Depth below water surface in meters
500
400
300
200
1000
C S
imul
ated
tem
pera
ture
Had
GEM
2minusCC
RCP
45
scen
ario
195
1ndash20
99
500
400
300
200
1000 19
5119
7119
9120
1120
3120
5120
7120
91
D S
imul
ated
tem
pera
ture
Had
GEM
2minusCC
RCP
85
scen
ario
195
1ndash20
99
End
of b
asel
ine
peri
od
Com
pens
atio
n de
pth
1215
265
315
365
415
465
515
565
615
665
715
20
EXPL
AN
ATIO
NTe
mpe
ratu
re i
nde
gree
s Ce
lsiu
s
Figu
re 1
9mdash
Cont
inue
d
32 Simulation of Deep Ventilation in Crater Lake Oregon 1951ndash2099
tac1
6-10
54_f
ig19
ef
Depth below water surface in meters
500
400
300
200
1000
E S
imul
ated
tem
pera
ture
Had
GEM
2minusES
RCP
45
scen
ario
195
1ndash20
99
500
400
300
200
1000 19
5119
7119
9120
1120
3120
5120
7120
91
F S
imul
ated
tem
pera
ture
Had
GEM
2minusES
RCP
85
scen
ario
195
1ndash20
99
End
of b
asel
ine
peri
od
Com
pens
atio
n de
pth
1215
265
315
365
415
465
515
565
615
665
715
20
EXPL
AN
ATIO
NTe
mpe
ratu
re i
nde
gree
s Ce
lsiu
s
Figu
re 1
9mdash
Cont
inue
d
Results of Future Climate Scenarios 33
tac16-1054_fig20abcd
0
2
4
6
8A CNRMminusCM5 RCP45
Tem
pera
ture
in
degr
ees
Cels
ius
20202000 2040 2060 2080 2100
0
2
4
6
8B CNRMminusCM5 RCP85
0
2
4
6
8
0
2
4
6
8
C HadGEM2minusCC RCP45
D HadGEM2minusCC RCP85
Surface (5 meters)
Bottom (554 meters)
4 degrees Celsius
EXPLANATION
Figure 20 Surface and bottom temperatures of Crater Lake Oregon simulated with the 1-dimensional deep ventilation model for baseline and future conditions from three general circulation models and two representative concentration pathways (A) CNRM-CM5 RCP45 (B) CNRM-CM5 RCP85 (C) HadGEM2-CC RCP45 (D) HadGEM2-CC RCP85 (E) HadGEM2-ES RCP45 (F) HadGEM2-ES RCP85
34 Simulation of Deep Ventilation in Crater Lake Oregon 1951ndash2099
tac16-1054_fig20ef
Tem
pera
ture
in
degr
ees
Cels
ius
20202000 2040 2060 2080 2100
0
2
4
6
8E HadGEM2minusES RCP45
0
2
4
6
8F HadGEM2minusES RCP85
Surface (5 meters)
Bottom (554 meters)
4 degrees Celsius
EXPLANATION
Figure 20mdashContinued
The most extreme changes were projected by the HadGEM2-ES model which projected a change in the frequency of deep ventilation under the RCP45 scenario from 55 percent during the baseline period (the closest to that observed during the historical period) to 36 percent in the first 55 years of future conditions to 25 percent in the second 55 years Under the RCP85 scenario the projection was a change in frequency from 55 percent during the baseline period to 31 percent in the first 55 years of future conditions to 13 percent in the second 55 years Based on a threshold for change in lower water-column heat content of -9 times1014 J the HadGEM2-CC GCM simulated a frequency of 44 percent during the baseline period This GCM projected a change in frequency from 44 percent during the baseline period to 33 percent in RCP45 future conditions for all years and a decrease in frequency to 27 percent in the first 55 years and to 18 percent in the second 55 years of the RCP85 scenario future conditions
Another way to evaluate mixing is in terms of the volume replaced during ventilation events When the replaced volume was averaged over decades it was essentially unchanged under future conditions projected by all GCMS in the RCP45 scenario (table 12) The CNRM-CM5 and HadGEM2-CC models simulated that the replaced volume actually increased by about 20 percent in the last 55 years of the RCP45 scenario
Previous estimates of the age of deep water have been 2ndash4 years based on dissolved-oxygen concentration (McManus and others 1993) 1ndash2 years based on tritium (Simpson 1970) and 32 years based on chlorofluorocarbons (Weiss 1992) In our simulations residence time in the deep lake stayed nearly the same or slightly decreased between baseline conditions and the last 55 years of the RCP45 scenario (from 252 to 214 years HadGEM2-CC GCM) Projected changes under the RCP85 scenario were substantial and all models predicted residence times doubling between the baseline conditions which ranged 188 to 290 years and the last 55 years of the RCP85 scenario which ranged 402 to 432 years These changes in the average age of the deep water underscore the fact that the expected changes in a future climate are important in terms of both the frequency of mixing events and the total volume mixed over time
The upper (0ndash325 m depth) and lower (325ndash550 m depth) water column (UWC and LWC) heat content were relatively stable over the 55-year baseline period and increased most rapidly in the last 50 years of each future climate simulation (fig 21) The annual and interannual variability in the UWC heat content remained relatively stable through 100 years of future climate whereas the interannual variability in the LWC heat content increased markedly in future climate scenarios
Results of Future Climate Scenarios 35
Table 11 Frequency of deep ventilation during the historical measurement period and during the baseline and future conditions periods from three general circulation models and two representative concentration pathways Crater Lake Oregon
[Frequency Based on a threshold of -9 times1014 J for the change in lower water-column heat content between December 1 and June 1 of each winter-spring season Mean Mean decrease in heat content in a deep ventilation year Abbreviations 1DDV 1-dimensional deep ventilation model J joule]
Time series Frequency Mean
(times1015 J)
Historical period of observations 1995ndash1999 2001ndash2006 2009ndash2011
Measured 050 -164Simulated with 1DDV 050 -160
Baseline conditions 1951ndash2005
CNRM-CM5 033 -221HadGEM2-CC 044 -195HadGEM2-ES 055 -188
First 55 years of future conditions 2006ndash2061representative concentration pathway 45
CNRM-CM5 031 -347HadGEM2-CC 033 -305HadGEM2-ES 036 -353
Last 55 years of future conditions 2045ndash2099representative concentration pathway 45
CNRM-CM5 031 -387HadGEM2-CC 033 -297HadGEM2-ES 025 -422
First 55 years of future conditions 2006ndash2061representative concentration pathway 85
CNRM-CM5 033 -338HadGEM2-CC 027 -367HadGEM2-ES 031 -365
Last 55 years of future conditions 2045ndash2099representative concentration pathway 85
CNRM-CM5 018 -528HadGEM2-CC 018 -275HadGEM2-ES 013 -527
Table 12 Replacement volume and residence time in the deep lake determined during baseline conditions (1951ndash2005) and future conditions (2045ndash2099) from three general circulation models and two representative concentration pathways at Crater Lake Oregon
[Volume replaced Below 325 meters depth Fraction replaced Based on a deep lake volume of 498 km3 Residence time Reciprocal of fraction replaced Abbreviation km3yr cubic kilometer per year]
GCMVolume replaced
(km3yr)Fraction replaced
(per year)Residence time
(years)
Baseline RCP45 RCP85 Baseline RCP45 RCP85 Baseline RCP45 RCP85
CNRM-CM5 172 207 115 034 041 023 290 241 432HadGEM2-CC 198 233 124 040 047 025 252 214 402HadGEM2-ES 265 255 122 053 051 025 188 195 408
36 Simulation of Deep Ventilation in Crater Lake Oregon 1951ndash2099
Figure 21 Time series showing heat content in Crater Lake Oregon as calculated from temperatures simulated by the 1-dimensional deep ventilation model for baseline and future conditions from three general circulation models and two representative concentration pathways (A) Upper water-column heat content during the baseline period (B) upper water-column heat content during the period of future climate RCP45 scenario (C) upper water-column heat content during the period of future climate RCP85 scenario (D) lower water-column heat content during the baseline period (E) lower water-column heat content during the period of future climate RCP45 scenario (F) lower water-column heat content during the period of future climate RCP85 scenario
tac16-1054_fig21
70 times 1016
80 times 1016
90 times 1016
10 times 1017
11 times 1017
15 times 1017
20 times 1017
25 times 1017
30 times 1017
35 times 1017
40 times 1017
45 times 1017
50 times 1017
Upper water column (0minus325 meters)A
1950 1970 1990 20101960 1980 2000 2020 20602040 2080 2100
Lower water column (325minus550 meters)D
B
E
C
F
20202000 2000 20602040 2080 2100
RCP45 RCP85
RCP45
Baseline
Baseline RCP85Heat
con
tent
in
joul
es
CNRMminusCM5
HadGEM2minusCC
HadGEM2minusES
EXPLANATION
Taking the CNRM-CM5 GCM as an example the UWC heat content increased at a rate of 339times1015 J (15 percent) per decade during the baseline period in response to 0025 degC per year of warming in annual air temperature (table 10 figs 4A and 21) In the future scenarios UWC heat content increased 357times1015 J (14 percent) and 623times1015 J (22 percent) per decade in the first and second 55 years of the RCP45 scenario respectively and 715times1015 J (28 percent) and 238times1016 J (74 percent) per decade in the first and second 55 years of the RCP85 scenario respectively The RMSE around those slopes was largely consistent between 329times1016 (baseline conditions) and 395times1016 J (second 55 years of future conditions RCP85) Thus the interannual and annual variability of the UWC heat content is not much changed in the future scenarios even as the heat content rises
In contrast the LWC heat content again considering CNRM-CM5 as an example increased 529times1014 J (069 percent) and 877times1014 J (11 percent) per decade in the first and second 55 years of the RCP45 scenario respectively and 127times1015 J (16 percent) and 445times1015 J (50 percent) per decade in the first and second 55 years of the RCP85 scenario respectively (table 10) The RMSE around the regression line increased notably between the baseline conditions (155times1015 J) and the second 55 years of future climate scenarios (348times1015 J or 444times1015 J) reflecting longer periods between deep ventilation events and increasingly dramatic decreases in the lower water column heat content when an event occurred (fig 21) The threshold for thermobaric instabilitymdashlake-surface water temperature slightly colder than 4 degCmdashremains the same in
Comparisons to Future-Climate Studies of Other Lakes 37
a future climate but the frequency at which that threshold is met decreases (table 1) Because the heat content in the deep lake continues to steadily increase in response to hydrothermal inputs and the frequency of meeting the surface temperature threshold for deep ventilation caused by thermobaricity decreases the difference between the deep lake temperature and the 4 degC threshold for deep ventilation becomes greater through time As a result the decreases in heat content related to deep ventilation events are less frequent but are larger when they occur In the last 20 years of the RCP45 scenario of the HadGEM2-CC and HadGEM2-ES models and the last 40ndash50 years of RCP85 scenario for all GCMs the system warms to the point that the entire water column is greater than the 4 degC threshold (table 1) and thermobaric instability cannot occur In these periods the deep ventilation events are convectively driven and only occur when the surface temperatures are less than the deep temperatures which is infrequent During these events the colder surface temperatures are denser than the deep waters and given sufficient wind energy are able to mix all the way to the bottom of the lake (figs 20B D F) Thus the lake is expected to undergo a shift in its thermal regime progressively transitioning from dimictic to warm monomictic to oligomictic
The rate of increasing heat content in the UWC and LWC can be compared to the approximately 13times1016 J per decade of heat (based on 14 W m-2 over the bottom surface area below 350 m) that is put into the deep lake by hydrothermal inflows The rate of change of heat content in the UWC exceeds this hydrothermal flux only in the second 55 years of the RCP85 scenarios (all three GCMs) and in the first 55 years of the RCP85 scenarios as projected by the HadGEM2-ES model (table 10) This implies that during baseline conditions and with one exception during the first 55 years of future conditions the lower water column is a source of heat to the upper water column and the atmosphere is a heat sink for the lake Only in the second 55 years of the more extreme scenario are air temperatures high enough to overcome the hydrothermal fluxes and turn the atmosphere into a source of heat to the lake
Comparisons to Future-Climate Studies of Other Lakes
All of the future climate scenarios that were used to simulate the daily water temperature profile in Crater Lake through the year 2099 projected increased water temperature throughout the water column and a decreased frequency of deep ventilation events Under the assumption that the realized future conditions will be within the range of outcomes encompassed by the six scenarios used in this studymdashthree GCMs and two representative concentration pathwaysmdashthe
long-term average temperature in the upper water column (defined to be above 325 m depth) of Crater Lake can be expected to increase between 094 and 319 degC between 2006 and 2099 and the corresponding increase in the hypolimnion (below 325 m depth) is between 037 and 246 degC In the RCP85 scenario all GCMs show the entire water column warming to greater than 43 degC year-round after 2080 and in the RCP45 scenario all GCMs show the entire water column warming to greater than 35 degC year-round after 2080
Studies of the effects of climate change on temperate lakes worldwide share several conclusions regarding the expected changes in the epilimnion First water temperatures will increase in proportion to air temperature and generally the increase is greater than 50 percent (Peeters and others 2002 Livingstone 2003 Hampton and others 2008) and as much as nearly 100 percent (Coats and others 2006 Peeters and others 2007 Perroud and Goyette 2010) of the increase in air temperature depending on how it is measuredmdashmonthly seasonal or annual means a long-term average daily minimums or daily means Second the annual number of days of stratification will increase and third annual periods of ice cover will shorten in high-latitude lakes (Robertson and Ragotzkie 1990 Hostetler and Giorgi 1995 Elo and others 1998 Hostetler and Small 1999) Overall these and other studies have concluded that in a future climate the epilimnion of lakes will respond quickly and in direct and high proportion to warmer air temperature and the accompanying changes in other meteorological drivers such as longwave radiation and evaporation
Conclusions regarding the temperature in the hypolimnion of lakes are less consistent which is not surprising particularly because the thermal mass per surface area varies with the overall depth of the lake and the climate setting of the lake is important The hypolimnion in temperate lakes that remain dimictic and reliably inverse stratify in winter are not expected to retain a climate signal or warm in a future climate (Butcher and others 2015) In monomictic lakes deep enough to establish a seasonal thermocline the influence of the atmosphere is transmitted to the hypolimnion by means of mixing with the epilimnion outside of the stratified season therefore in lakes that reliably mix at least once per year the hypolimnion receives the climate signal embedded in epilimnion temperatures prior to the onset of stratification and carries it through the stratified season to the next autumn or spring mixing event resulting in a trend in the annual average hypolimnion temperature that reflects the climate signal rather than seasonal fluctuations (Dokulil and others 2006) Deep lakes that do not mix every year hold a long-term ldquomemoryrdquo of the climate manifested as a slow interannual upward trend in temperature as heat diffuses from above punctuated periodically by rapid cooling when deep-mixing events occur resulting in a ldquosawtoothrdquo pattern in the temperature or heat content (Livingstone 1997 Ambrosetti and Barbanti 1999)
38 Simulation of Deep Ventilation in Crater Lake Oregon 1951ndash2099Ta
ble
13
Long
-term
cha
nges
in lo
wer
wat
er-c
olum
n te
mpe
ratu
re in
dee
p la
kes
(gt 1
00 m
dep
th)
base
d on
his
toric
al m
easu
rem
ents
and
mod
elin
g st
udie
s of
futu
re c
limat
e sc
enar
ios
[Low
er w
ater
col
umn
Gre
ater
than
325
m d
epth
for C
rate
r Lak
e e
quiv
alen
t to
the
hypo
limni
on fo
r oth
er la
kes
Abb
revi
atio
n G
CM
gen
eral
circ
ulat
ion
mod
el deg
C d
egre
es C
elsi
us m
met
er ~
app
roxi
mat
ely
ndash
no
data
na
not
app
licab
le]
Lake
Latit
ude
Elev
atio
n (m
)
Max
imum
de
pth
(m)
Low
er w
ater
col
umn
Air
tem
pera
ture
in
crea
se(deg
C)
Calc
ulat
ion
of la
ke
tem
pera
ture
His
tori
cal o
r fu
ture
per
iod
Refe
renc
eTe
mpe
ratu
re
chan
ge
(degC)
Tem
pera
ture
ch
ange
nor
mal
ized
by
air
tem
pera
ture
ch
ange
Lake
tem
pera
ture
cha
nges
bas
ed o
n hi
stor
ical
obs
erva
tions
Zuric
h47
3degN
406
136
028
ndash05
30
28ndash0
53
~1 (i
n th
e da
ily
min
imum
)M
axim
um d
ecad
al m
ean
incr
ease
ran
ge is
by
seas
on
1947
ndash199
8Li
ving
ston
e (2
003)
Taho
e139
1degN
189
850
00
640
85~0
75
(in th
e da
ily
min
imum
)Lo
ng-te
rm tr
end
slop
e19
70ndash2
002
Coa
ts a
nd o
ther
s (20
06)
Bai
kal
160
0ndash
ndash1
20Lo
ng-te
rm tr
end
slop
e at
25 m
dep
th19
45ndash2
005
Ham
pton
and
oth
ers
(200
8)
Lake
tem
pera
ture
cha
nges
bas
ed o
n m
odel
ing
stud
ies
of fu
ture
clim
ate
Gen
eva
464
degN37
230
92
20ndash2
33
053
ndash05
64
13R
ange
in m
onth
ly m
eans
naPe
rrou
d an
d G
oyet
te
(201
0)C
onst
ance
476
degN39
525
42
6ndash2
90
6ndash0
74
Ran
ge in
mon
thly
mea
nsna
Peet
ers a
nd o
ther
s (20
07)
Zuric
h47
3degN
406
136
14
035
4A
nnua
l ave
rage
naPe
eter
s and
oth
ers (
2002
)C
rate
r43
0degN
188
359
00
26ndash0
69
013
ndash02
42
02ndash2
91
(ran
ge o
f RC
P45
scen
ario
s and
3 G
CM
san
nual
mea
ns)
Bas
ed o
n tre
nd c
alcu
late
dov
er fi
rst a
nd la
st 5
5 ye
ars
2006
ndash209
9Th
is st
udy
123
ndash20
40
22ndash0
40
520
ndash57
2(r
ange
of R
CP8
5sc
enar
ios a
nd 3
GC
Ms
annu
al m
eans
)
Bas
ed o
n tre
nd c
alcu
late
dov
er fi
rst a
nd la
st 5
5 ye
ars
2006
ndash209
9
1Val
ues a
re a
ppro
xim
ate
Wat
er te
mpe
ratu
re in
crea
se b
ased
on
the
slop
e at
300
m (h
ypol
imni
on) i
n ta
ble
II o
f Coa
tes a
nd o
ther
s (20
06)
Air
tem
pera
ture
incr
ease
det
erm
ined
gra
phic
ally
from
figu
re 8
in C
oats
an
d ot
hers
(200
6)
Conclusions 39
It might be reasonable to assume that the climate signal would be more difficult to discern in the hypolimnion of deep lakes with a vast hypolimnetic volume to ldquodiluterdquo the climate signal from the much smaller epilimnetic volume however although it is challenging to compare studies because of the different methods of reporting results other studies of deep lakes do not necessarily support that assumption (table 13) For example Coats and others (2006) determined from more than 33 years of historical record that the hypolimnetic temperature increase in Lake Tahoe United States (500 m maximum depth) was approximately 81 percent of the increase in the epilimnetic temperature in response to an approximately 075 degC increase in air temperature A study of 52 years of record in Lake Zuumlrich Switzerland (136 m deep) determined that the hypolimnetic temperature increase was between 48 and 61 percent of the epilimnetic temperature increase in response to a similar increase in air temperature (about 1 degC Livingstone 2003) Among modeling studies of future climate all of which considered air temperature increases of about 4 degC the increase in hypolimnetic temperature was 73 percent of the increase in epilimnetic temperature (annual average) in Lake Zuumlrich (136 m maximum depth Peeters and others 2002) between 69 and 87 percent (range in monthly means) in Lake Constance Germany (254 m maximum depth Peeters and others 2007) and between 61 and 95 percent (range in monthly means) in Lake Geneva Switzerland (309 m maximum depth Perroud and Goyette 2010) This small set of studies suggests that on decadal time scales the hypolimnion even in the deepest lakes responds to the atmospheric changes at the surface
By comparison the projected deep hypolimnetic (below 325 m) temperature increase in Crater Lake is moderate particularly for the RCP45 scenarios The long-term mean hypolimnetic temperature increase as a percentage of the air temperature increase is projected in the range of 13ndash24 percent (corresponding to an absolute increase between 026 and 069 degC) across the three GCMs as compared to Lake Tahoe a lake of similar depth to Crater Lake for which the same percentage measured over 33 years of historical record was 85 percent (table 13 Coats and others 2006) However the projected increase in temperature shown in table 13 is based on long-term linear trends in heat content calculated over 55-year segments (table 10) and clearly underestimates both the rate of increase and the absolute increase in temperature projected to occur over shorter timeframes between less and less frequent deep ventilation events (fig 20) For the RCP85 scenarios the projected increase in temperature across the three GCMs is 22ndash40 percent of the air temperature increase or 123ndash204 degC Therefore the projected temperature increase in the hypolimnion as a percentage of the air temperature increase is bigger for the larger increase in air temperature projected by the RCP85 scenarios In these scenarios the lake becomes oligomictic much earlier and the temperature
in the deep hypolimnion increases in response to the strong hydrothermal heat flux Thus the primary effect of the atmospheric changes is not to provide more direct heat transfer to the hypolimnion in the future but rather to decrease cooling of the hypolimnion This decrease in cooling is bigger for the RCP85 scenario as indicated by a lower frequency of deep ventilation events
ConclusionsThe ventilation of the deepest water and cooling of
the hypolimnion in Crater Lake is initiated by thermobaric instability Over long time periods the largest effect of warmer surface temperatures is on the frequency at which the necessary conditions for thermobaric instability are established Currently the reverse stratification that enables deep ventilation events initiated by thermobaric instability occurs in about 50 percent of years All the future climate scenarios considered show that the number of days during which this condition is met will decrease in the future The least extreme scenario (CNRM-CM5 RCP45) shows this condition occurring nearly every year and on as many as 200 days in a year through 1990 then tapering off until the condition is met in less than 50 percent of years by 2100 usually on less than 100 days in a year Mostly as a consequence of this change in lake surface temperature the frequency of deep ventilation events is projected to decrease from about 50 percent in current conditions to 31 percent by 2100 The most extreme scenario considered in this study showed lake surface temperatures never cooling to less than 4 degC after 2050 and projected the frequency of deep ventilation events to be 13 percent by 2100 In these periods the deep ventilation events are convectively driven and occur infrequently only when the surface temperature is less than the deep temperature
The temperature gradient in the deep lake is nearly two orders of magnitude greater than adiabatic and would be unstable but for the hydrothermal inputs of salinity as well as heat (McManus and others 1993) In this application of 1DDV salinity was not simulated dynamically rather the salinity profile was held fixed at a historical average and therefore the stabilizing effect of salinity on density in the hypolimnion was maintained through time In a future climate in which deep ventilation occurred less frequently the salt content below approximately 350 m would increase with the increase in heat content as a result of hydrothermal inflows Simulations in this study which did not allow salt content to increase in proportion to heat content probably underestimated the stabilizing effect that salinity would have in the distant future For this reason the decreased frequency of deep ventilation of the deep lake in future climates could be greater than what was demonstrated in this study
40 Simulation of Deep Ventilation in Crater Lake Oregon 1951ndash2099
The hydrothermal inputs to the lake were estimated at 14 Wm2 40 percent higher than the previous estimate of 1 Wm2 At either value it is clear that the function of the atmosphere in the long-term heat budget since the caldera filled has been as a heat sink for the lake This is not projected to change in the future climates considered until the last 55 years of the RCP85 scenario The hydrothermal inputs imply that the profundal changes in Crater Lake in a future climate could be different from those projected for deep lakes receiving relatively little hydrothermal heat inputs In the complete absence of cooling hydrothermal heating at the rate of 14 Wm2 would increase the temperature of the hypolimnion below 325 m depth by about 039 degC per decade which could be considered the upper limit on the rate of temperature increase In the event therefore that deep ventilation events stop completely in a future climate the projected lake temperature changes could be underestimates
SummaryThe frequency of deep ventilation events in Crater
Lake a caldera lake in the Oregon Cascade Mountains was simulated in six future climate scenarios The 1-dimensional deep ventilation (1DDV) model used was developed specifically to simulate the ventilation of deep water initiated by reverse stratification and subsequent thermobaric instability which allows water colder than the temperature of maximum density at the surface to be unstable when displaced downward a sufficient distance by wind action and to sink to the deep lake The model which is forced with wind speed and lake surface-water temperature was calibrated with lake temperature data collected from 2000 to 2006 and validated with data from 1994 to 1999 and 2008 to 2011 Emphasis in the calibration and validation was placed on the correct simulation of wintertime deep ventilation events and their frequency The simulated annual frequency of these events in the calibrationvalidation of the model was 05 (1 in 2 years) as compared to 05 in the historical data
Wind and air temperature data from three general circulation models (GCMs) (CNRM-CM5 HadGEM2-CC and HadGEM2-ES) and two representative concentration pathways (RCP45 and RCP85 corresponding to a moderate and more extreme future respectively) were statistically downscaled using the Multivariate Adaptive Constructed Analogs (MACA) technique bias corrected using measurements from the surface of Crater Lake and then used to simulate the change in lake temperature and the frequency of deep ventilation events in possible future climates The lumped model air2water was used to project lake surface temperature a required boundary condition for the lake model based on air temperature in the future climates
The 1DDV model was used to simulate daily water temperature profiles for 55 years of baseline conditions and 95 years of future conditions for all six combinations
of GCMs and RCPs All future climate scenarios projected increased water temperature throughout the water column and a substantive reduction in the frequency of deep ventilation events The least extreme scenario (CNRM-CM5 RCP45) projected the frequency of deep ventilation events to decrease from about 1 in 2 years in current conditions to about 1 in 3 years by 2100 The most extreme scenario considered (HadGEM2-ES RCP85) projected the frequency of deep ventilation events to be about 1 in 77 years by 2100 and lake surface temperatures never cooling to less than 4 degC after 2050 All RCP45 scenarios predicted that the system would warm to the point that the entire water column is greater than the 4 degC threshold (the maximum temperature of maximum density) for increasing lengths of time All RCP85 scenarios predicted that the system would warm to the point that the entire water column would be greater than the 4 degC threshold by the year 2060 for the HadGEM2 models and by the year 2080 for the CNRM-CM5 model thus the conditions required for thermobaric instability induced mixing become rare or non-existent
The historical role of the atmosphere in the heat budget of Crater Lake has been to cool the deep waters of the lake and vent the hydrothermal heat flux to the atmosphere (we estimated the hydrothermal heat flux to be about 14 Wm2 which is somewhat larger but the same order of magnitude as the previous estimate of 1 Wm2) The primary effects of warmer future climates on the lake are decreased frequency of episodic cooling of the hypolimnion a transition from the lake as a heat source to a heat sink for the atmosphere and a progressive shift in the thermal regime of Crater Lake from dimictic to warm monomictic to oligomictic In the complete absence of deep ventilation events the water temperature in the deep lake can increase by about 039 degC per decade based on hydrothermal inputs alone so this provides an upper limit for the rate of temperature increase between episodic mixing
The disruption of deep ventilation by itself does not provide a complete picture of the potential ecological and water quality consequences of warming climate to Crater Lake The depth timing and frequency of vertical water column mixing are among the most important processes in deep lakes as vertical mixing often controls the growth of algae and water clarity through redistribution of nutrients and replenishes dissolved oxygen near the lake bottom that is otherwise depleted by the decomposition of organic material raining down from above The disruption of deep ventilation has the potential to deplete oxygen levels in the deep lake and alter benthic communities living on the lake floor Likewise changes in the frequency of deep ventilation would affect the vertical movement of nutrients and alter both the subsequent growth of algae during summer and the corresponding water clarity for which Crater Lake is famous Estimating the effect of warming climate on deep water oxygen depletion and water clarity will require careful modeling studies to combine the physical mixing processes affected by the atmosphere with the multitude of factors affecting the growth of algae and corresponding water clarity
References Cited 41
AcknowledgmentsThis modeling work was supported by the US
Geological Survey (USGS)-National Park Service (NPS) Water Quality Partnership Program The long-term climatological and year-round water column temperature data collected at Crater Lake was initiated by NPS and USGS Global Change Research Programs and extensive collaboration between the NPS and the College of Oceanic and Atmospheric Sciences at Oregon State University In particular we thank Dr Robert Collier Dr Jack Dymond and Mr J Chris Moser
References Cited
Abatzoglou JT and Brown TJ 2012 A comparison of statistical downscaling methods suited for wildfire applications International Journal of Climatology doi101002joc2312
Ambrosetti W and Barbanti L 1999 Deep water warming in lakesmdashAn indicator of climatic change Journal of Limnology v 58 p 1ndash9
Bacon CR Gardner JV Mayer LA Buktenica MW Dartnell P Ramsey DW and Robinson JE 2002 Morphology volcanism and mass wasting in Crater Lake Oregon Geological Society of America Bulletin v 114 no 6 p 675ndash692
Boehrer B and Schultze M 2008 Stratification of lakes Reviews of Geophysics v 46 RG2005 doi1010292006RG000210
Butcher JB Nover D Johnson TE and Clark CM 2015 Sensitivity of lake thermal and mixing dynamics to climate change Climatic Change v 129 p 295ndash305 doi101007s10584-015-1326-1
Coats R Perez-Losada J Schladow G Richards R and Goldman C 2006 The warming of Lake Tahoe Climatic Change v 76 p 121ndash148
Crawford GB and Collier RW 2007 Long-term observations of deepwater renewal in Crater Lake Oregon Hydrobiologia v 574 p 47ndash68
Crawford TM and Duchon CE 1999 An improved parameterization for estimating effective atmospheric emissivity for use in calculating daytime downwelling longwave radiation Journal of Applied Meteorology v 38 p 474ndash480
Diaz-Nieto J and Wilby RL 2005 A comparison of statistical downscaling and climate change factor methodsmdashImpacts on low flows in the River Thames United Kingdom Climatic Change v 69 p 245ndash268
Dokulil MT Jagsch A George GD Anneville O Jankowski T Wahl B Lenhart B Blenckner T and Teubner K 2006 Twenty years of spatially coherent deepwater warming in lakes across Europe related to the North Atlantic Oscillation Limnology and Oceanography v 51 p 2787ndash2793
Dymond J Collier R and McManus J 1996 Unbalanced particle flux budgets in Crater Lake OregonmdashImplications for edge effects and sediment focusing in lakes Limnology and Oceanography v 41 no 4 p 732ndash742
Elo A Huttula T Peltonen A and Virta J 1998 The effects of climate change on the temperature conditions of lakes Boreal Environmental Research v 3 p 137ndash150
Environmental and Water Resources Institute 2005 The ASCE Standardized Reference Evapotranspiration EquationmdashFinal report prepared by the Task Committee on Standardization of Reference Evapotranspiration Reston Virginia Environmental and Water Resources Institute of the American Society of Civil Engineers 59 p
Groeger AW 2007 Nutrient limitation in Crater Lake Oregon Hydrobiologia v 574 p 205ndash216
Hampton SE Izmestrsquoeva LR Moore MV Katz SL Dennis B and Silow EA 2008 Sixty years of environmental change in the worldrsquos largest freshwater lakemdashLake Baikal Siberia Global Change Biology v 14 p 1947ndash1958 doi101111j1365-2486200801616x
Hostetler SW and Giorgi F 1995 Effects of a 2XCO2 climate on two large lake systems Pyramid Lake Nevada and Yellowstone Lake Wyoming Global and Planetary Change v 10 p 43ndash54
Hostetler SW and Small EE 1999 Response of North American freshwater lakes to simulated future climates Journal of the American Water Resources Association v 35 p 1625ndash1637
Imerito A 2014 Dynamic Reservoir Simulation Model DYRESM v4mdashv40 science manual Perth University of Western Australia Centre for Water Research 42 p
Jassby A and Powell T 1975 Vertical patters of eddy diffusion during stratification in Castle Lake California Limnology and Oceanography v 20 p 530ndash543
42 Simulation of Deep Ventilation in Crater Lake Oregon 1951ndash2099
Kullenberg G 1976 On vertical mixing and the energy transfer from the wind to the water Tellus B v 28 no 2 p 159ndash165
Livingstone D 1997 An example of the simultaneous occurrence of climate-driven ldquosawtoothrdquo deep-water warmingcooling episodes in several Swiss lakes Verhandlungen des Internationalen Verein Limnologie v 26 p 822ndash828
Livingstone D 2003 Impact of secular climate change on the thermal structure of a large temperate central European lake Climatic Change v 57 p 205ndash255
Martin JL and McCutcheon SC 1998 Hydrodynamics and transport for water quality modeling Boca Raton Florida CRC Press 816 p
Marty Ch Philipona R Froumlhlich C and Ohmura A 2002 Altitude dependence of surface radiation fluxes and cloud forcing in the alpsmdashResults from the alpine surface radiation budget network Theoretical and Applied Climatology v 72 p 137ndash155
McManus J Collier RW Chen CA and Dymond J 1992 Physical properties of Crater Lake OregonmdashA method for the determination of a conductivity and temperature-dependent expression for salinity Limnology and Oceanography v 37 p 41ndash53
McManus J Collier RW and Dymond J 1993 Mixing processes in Crater Lake Oregon Journal of Geophysical Research v 98 p 18295ndash18307
Mellor GL 1989 Retrospect on oceanic boundary layer modeling and second moment closure in Muller P and Henderson D eds The parameterization of small-scale processes Proceedings of the 5th Aha Hulikorsquoa Hawaiian Winter Workshop January 1989 Honolulu University of Hawaii at Manoa p 251ndash272
Met Office 2014 Met Office climate prediction modelmdashHadGEM2 family Met Office Web site accessed December 24 2015 at httpwwwmetofficegovukresearchmodelling-systemsunified-modelclimate-modelshadgem2
Minville M Brissette F and Leconte R 2008 Uncertainty of the impact of climate change on the hydrology of a Nordic watershed Journal of Hydrology v 358 p 70ndash83
Munk WH and Anderson ER 1948 Notes on a theory of the thermocline Journal of Marine Research v 7 p 276ndash295
National Atmospheric and Space Administration 2015 Ocean in motionmdashEkman TransportmdashBackground National Atmospheric and Space Administration Web site accessed December 24 2015 at httpoceanmotionorghtmlbackgroundocean-in-motionhtm
National Centre of Meteorological Research 2014 CNRM-CM5mdashDescription National Centre of Meteorological Research Web site accessed December 24 2015 at httpwwwcnrm-gamefrspipphparticle126amplang=en
Pacanowski RC and Philander SG 1981 Parameterization of vertical mixing in numerical models of tropical oceans Journal of Physical Oceanography v 11 p 1443ndash1451
Panofsky HA and Brier GW 1968 Some applications of statistics to meteorology The Pennsylvania State University College of Earth and Mineral Sciences 224 p
Peeters F Livingstone DM Goudsmit G Kipfer R and Forster R 2002 Modeling 50 years of historical temperature profiles in a large central European lake Limnology and Oceanography v 47 p 186ndash197
Peeters F Straile D Lorke A and Livingstone D 2007 Earlier onset of the spring phytoplankton bloom in lakes of the temperate zone in a warmer climate Global Change Biology v 13 p 1898ndash1909 doi101111j1365-2486200701412x
Perroud M and Goyette S 2010 Impact of warmer climate on Lake Geneva water-temperature profiles Boreal Environment Research v 15 p 255ndash278
Piccolroaz S 2013 Deep ventilation in Lake BaikalmdashA simplified model for a complex natural phenomenon Italy University of Trento PhD thesis 172 p accessed February 2014 at httpeprints-phdbibliounitnit1012
Piccolroaz S and Toffolon M 2013 Deep water renewal in Lake BaikalmdashA model for long-term analyses Journal of Geophysical Research v 118 p 6717ndash6733
References Cited 43
Piccolroaz S Toffolon M and Majone B 2013 A simple lumped model to convert air temperature into surface water temperature in lakes Hydrology and Earth System Sciences v 17 p 3323ndash3338 doi105194hess-17-3323-2013
Piccolroaz S Toffolon M and Majone B 2015 The role of stratification on lakesrsquo thermal responsemdashThe case of Lake Superior Water Resources Research v 51 p 7878ndash7894 doi010022014WR016555
Powell T and Jassby A 1974 The estimation of vertical eddy diffusivities below the thermocline in lakes Water Resources Research v 10 p 191ndash198
Ravens TM Kocsis O and Wuumlest A 2000 Small-scale turbulence and vertical mixing in Lake Baikal Limnology and Oceanography v 45 p 159ndash173
Riahi K Rao S Krey V Cho C Chirkov V Fischer G Kindermann G Nakicenovic N and Rafaj P 2011 RCP85mdashA scenario of comparatively high greenhouse gas emissions Climatic Change v 109 p 33ndash57 doi101007s10584-011-0149-y
Robertson DM and Ragotzkie RA 1990 Changes in the thermal structure of moderate to large sized lakes in response to changes in air temperature Aquatic Sciences v 52 p 360ndash380
Ruckstuhl C Philipona R Morland J and Ohmura A 2007 Observed relationship between surface specific humidity integrated water vapor and longwave downward radiation at different altitudes Journal of Geophysical Research v 112 p D03302 doi1010292006JD007850
Rupp DE Abatzoglou JT Hegewisch KC and Mote PW 2013 Evaluation of CMIP5 20th century climate simulations for the Pacific Northwest USA Journal of Geophysical Research v 118 p 10884ndash10906 doi101002jgrd50843
Simpson HJ 1970 Tritium in Crater Lake Oregon Journal of Geophysical Research v 75 p 5195ndash5207
Sweers HE 1970 Vertical diffusivity coefficient in a thermocline Limnology and Oceanography v 15 p 273ndash280
Swinbank WC 1963 Long-wave radiation from clear skies Quarterly Journal of the Royal Meteorological Society v 89 p 339ndash348
Taylor KE Stouffer RJ and Meehl GA 2012 An Overview of CMIP5 and the experiment design Bulletin of the American Meteorological Society v 93 p 485ndash498 doi101175BAMS-D-11-000941
Thomson AM Calvin KV Smith SJ Kyle GP Volke A Patel P Delgado-Arias S Bond-Lamberty B Wise MA Clarke LE and Edmonds JA 2011 RCP45mdashA pathway for stabilization of radiative forcing by 2100 Climatic Change v 109 p 77ndash94 doi101007s10584-011-0151-4
Toffolon M Piccolroaz S Majone B Soja AM Peeters F Schmid M and Wuumlest A 2014 Prediction of surface water temperature from air temperature in lakes with different morphology Limnology and Oceanography v 59 no 6 p 2185ndash2202 doi104319lo20145962185
Tucker WA and Green AW 1977 A time-dependent model of the lake-averaged vertical temperature distribution of lakes Limnology and Oceanography v 22 p 687ndash699
Weiss RF 1992 Rates and variability of deep water renewal and biological production in deep temperate lakesmdashLake Baikal and Crater Lake [abs] Eos Transactions American Geophysical Union v 73 iss 43 p 198
Wuumlest AT Ravens M Granin NG Kocsis O Schurter M and Sturm M 2005 Cold intrusions in Lake BaikalmdashDirect observational evidence for deep water renewal Limnology and Oceanography v 50 p 184ndash196
Yang K He J Tang W Qin J and Cheng CCK 2010 On downward shortwave and longwave radiations over high altitude regionsmdashObservation and modeling on the Tibetan Plateau Agricultural and Forest Meteorology v 150 p 38ndash46 doi101016jagrformet200908004
Publishing support provided by the US Geological Survey Science Publishing Network Tacoma Publishing Service Center
For more information concerning the research in this report contact theDirector Oregon Water Science CenterUS Geological Survey2130 SW 5th AvenuePortland Oregon 97201httporwaterusgsgov
Wood and othersmdash
Simulation of D
eep Ventilation in Crater Lake Oregon 1951ndash2099mdash
Scientific Investigations Report 2016ndash5046
ISSN 2328-0328 (online)httpdxdoiorg103133sir20165046

Simulation of Deep Ventilation in Crater Lake Oregon 1951ndash2099
By Tamara M Wood Susan A Wherry Sebastiano Piccolroaz and Scott F Girdner
Prepared in cooperation with the National Park Service
Scientific Investigations Report 2016ndash5046
US Department of the InteriorUS Geological Survey
US Department of the InteriorSALLY JEWELL Secretary
US Geological SurveySuzette M Kimball Director
US Geological Survey Reston Virginia 2016
For more information on the USGSmdashthe Federal source for science about the Earth its natural and living resources natural hazards and the environmentmdashvisit httpwwwusgsgov or call 1ndash888ndashASKndashUSGS
For an overview of USGS information products including maps imagery and publications visit httpstoreusgsgov
Any use of trade firm or product names is for descriptive purposes only and does not imply endorsement by the US Government
Although this information product for the most part is in the public domain it also may contain copyrighted materials as noted in the text Permission to reproduce copyrighted items must be secured from the copyright owner
Suggested citationWood TM Wherry SA Piccolroaz S and Girdner SF 2016 Simulation of deep ventilation in Crater Lake Oregon 1951ndash2099 US Geological Survey Scientific Investigations Report 2016ndash5046 43 p httpdxdoiorg103133sir20165046
ISSN 2328-0328 (online)
iii
Contents
Abstract 1Introduction1
Purpose and Scope 3Methods3
Datasets3Historical Water Quality and Meteorological Data 3Climate Data4
Models 4Data Processing 6
Historical Water-Quality and Meteorological Data for the 1-Dimensional Deep Ventilation Model 6
Historical Water-Quality and Meteorological Data for the Dynamic Reservoir Simulation Model 7
Future Climate Data 7Air and Lake Surface Temperature 7Wind Speed 11
One-Dimensional Lake Temperature Modeling 13One-Dimensional Deep Ventilation Model 13
Initial Values of Calibration Parameters 13Reference Diffusivity Profile 14Calibration 16
Dynamic Reservoir Simulation Model 23Calibration 23
One-Dimensional Deep Ventilation Model Validation26Results of Future Climate Scenarios 28Comparisons to Future-Climate Studies of Other Lakes 37Conclusions39Summary40Acknowledgments 41References Cited41
Figures 1 Map showing sampling site and climate model grid Crater Lake Oregon 2 2 Flow chart showing approach used to convert wind stress to water column
mixing in the 1-dimensional deep ventilation model and the DYnamic REservoir Simulation Model 5
3 Time series of December-to-May averages of air temperature and water temperature at 20 meter depth and water temperature at 20 meter depth simulated by the lumped model air2water during the calibration period 1993ndash2011 at Crater Lake Oregon 9
4 Time series of December-to-May averages of downscaled air temperature from general circulation models and water temperature at 20 meter depth as determined with the air2water model through baseline (1951ndash2005) and future climate (2006ndash2099) conditions at Crater Lake Oregon 10
iv
FiguresmdashContinued 5 Graphs showing cumulative distribution functions of measured and simulated daily
wind speed for the common historical period 1991ndash2005 and the original and adjusted minimum mean and maximum wind speed from three general circulation models and two representative concentration pathways during baseline (1951ndash2005) and future (2006ndash2099) conditions at Crater Lake Oregon 12
6 Graph showing ten salinity profiles at Site B Crater Lake Oregon collected between July and September 1991ndash1998 and a 4th order polynomial fit to the average of the profiles 14
7 Graph showing reference turbulent diffusivity profile for the 1-dimensional deep ventilation model of Crater Lake Oregon 16
8 Contour plot showing measured temperature data Crater Lake Oregon 2000ndash2006 18
9 Contour plot showing temperature simulated with the 1-dimensional deep ventilation model Crater Lake Oregon 2000ndash2006 18
10 Graphs showing comparison of selected measured temperature profiles with profiles simulated with the 1-dimensional deep ventilation model Crater Lake Oregon 2003ndash2005 19
11 Graphs showing comparison of measured temperature to temperature simulated with the 1-dimensional deep ventilation model at depths between 20 and 530 meters Crater Lake Oregon 2000ndash2006 20
12 Graphs showing temperature and diffusivity profiles over the autumn to spring months of 2002ndash2003 when no deep ventilation of the water column occurred Crater Lake Oregon 21
13 Graphs showing temperature and diffusivity profiles over the autumn to spring months of 2003ndash2004 when deep ventilation of the water column occurred Crater Lake Oregon 21
14 Graphs showing upper and lower water-column heat content calculated from thermistors and from temperatures simulated by the 1-dimensional deep ventilation model of Crater Lake Oregon during the calibration years 2000ndash2006 and the validation years 1994ndash1999 and 2008ndash2011 22
15 Graphs showing comparison of selected measured temperature profiles to profiles simulated with the DYnamic REservoir Simulation Model Crater Lake Oregon 2001ndash2003 25
16 Graphs showing comparison of measured temperature to temperature simulated with the DYnamic REservoir Simulation Model Crater Lake Oregon 1999ndash2007 26
17 Graphs showing upper and lower water-column heat content calculated from thermistors and from temperatures simulated by the DYnamic REservoir Simulation Model of Crater Lake Oregon 1999ndash2007 27
18 Scatterplot showing comparison of the change in heat content between December and June as calculated from thermistor data and as simulated with the 1-dimensional deep ventilation model of Crater Lake Oregon 1994ndash1999 2000ndash2006 and 2008ndash2010 28
19 Contour plots showing temperature of Crater Lake Oregon simulated with the 1-dimensional deep ventilation model for baseline and future conditions from three general circulation models and two representative concentration pathways 30
v
FiguresmdashContinued 20 Graphs showing surface and bottom temperatures of Crater Lake Oregon
simulated with the 1-dimensional deep ventilation model for baseline and future conditions from three general circulation models and two representative concentration pathways 33
21 Time series showing heat content in Crater Lake Oregon as calculated from temperatures simulated by the 1-dimensional deep ventilation model for baseline and future conditions from three general circulation models and two representative concentration pathways 36
Tables 1 Statistical characteristics of air temperature and water temperature for the
historical period of record and for the baseline and future conditions periods from three general circulation models (GCMs) and two representative concentration pathways 9
2 Statistical characteristics of wind speed for the historical period of record and for the baseline and future conditions periods from three general circulation models (GCMs) and two representative concentration pathways 13
3 Rate of change in heat content in the deep and mid water column and the calculated hydrothermal flux between July and September Crater Lake Oregon 1990ndash2013 15
4 Calibration parameters for the 1-dimensional deep ventilation model of Crater Lake Oregon 17
5 Goodness-of-fit statistics at thermistor target depths for temperature simulated with the 1-dimensional deep ventilation model Crater Lake Oregon 2000ndash2006 17
6 Goodness-of-fit statistics for heat content calculated from temperatures simulated by the 1-dimensional deep ventilation model of Crater Lake Oregon 1994ndash2011 22
7 DYnamic REservoir Simulation Model default parameter values 24 8 Goodness of fit statistics for the DYnamic REservoir Simulation Model of Crater
Lake Oregon 1999ndash2007 24 9 Change in heat content from December to June in the lower water column of
Crater Lake Oregon 1994ndash2011 27 10 Linear regression models of upper and lower water-column heat content in Crater
Lake as calculated from temperatures simulated by the 1-dimensional deep ventilation model for baseline and future conditions from three general circulation models and two representative concentration pathways 29
11 Frequency of deep ventilation during the historical measurement period and during the baseline and future conditions periods from three general circulation models and two representative concentration pathways Crater Lake Oregon 35
12 Replacement volume and residence time in the deep lake determined during baseline conditions (1951ndash2005) and future conditions (2045ndash2099) from three general circulation models and two representative concentration pathways at Crater Lake Oregon 35
13 Long-term changes in lower water-column temperature in deep lakes (gt 100 m depth) based on historical measurements and modeling studies of future climate scenarios 38
vi
Conversion Factors
InchPound to International System of Units
Multiply By To obtain
Lengthkilometer (km) 06214 mile (mi)meter (m) 3281 foot (ft)
Areasquare meter (m2) 1076 square foot (ft2)
Volumecubic kilometer (km3) 02399 cubic mile (mi3)
Flow ratecubic meter per day (m3d) 3531 cubic foot per day (ft3d)
Masskilogram (kg) 2205 pound avoirdupois (lb)
Densitykilogram per cubic meter (kgm3) 006242 pound per cubic foot (lbft3)
Heat Energyjoule (J) 02391 calorie (cal)
Heat FluxWatt per square meter (Wm2) 7996 calorie per hour per square foot
[(calh)ft2]
Temperature in degrees Celsius (degC) may be converted to degrees Fahrenheit (degF) as
degF = (18 times degC) + 32
DatumsVertical coordinate information is referenced to the National Geodetic Vertical Datum of 1929 (NGVD 29)
Horizontal coordinate information is referenced to the World Geodetic System of 1984 (WGS 84)
Elevation as used in this report refers to distance above the vertical datum
Supplemental InformationConcentrations of chemical constituents in water are given in either milligrams per liter (mgL) or micrograms per liter (microgL)
vii
Abbreviations
1DDV 1-dimensional deep ventilation modelcdf cumulative distribution functionCTD conductivity temperature depth CVRMSE coefficient of variation of the root mean square errorDYRESM Dynamic Reservoir Simulation ModelGCM general circulation modelLWC lower water columnMACA Multivariate Adaptive Constructed AnalogNRMSE normalized root mean square errorPNW Pacific NorthwestRCP Representative Concentration PathwayRMSE root mean square errorSLT surface layer temperatureSML surface mixed layerTKE turbulent kinetic energyUSGS US Geological SurveyUWC upper water column
Simulation of Deep Ventilation in Crater Lake Oregon 1951ndash2099
By Tamara M Wood1 Susan A Wherry1 Sebastiano Piccolroaz2 and Scott F Girdner3
AbstractThe frequency of deep ventilation events in Crater
Lake a caldera lake in the Oregon Cascade Mountains was simulated in six future climate scenarios using a 1-dimensional deep ventilation model (1DDV) that was developed to simulate the ventilation of deep water initiated by reverse stratification and subsequent thermobaric instability The model was calibrated and validated with lake temperature data collected from 1994 to 2011 Wind and air temperature data from three general circulation models and two representative concentration pathways were used to simulate the change in lake temperature and the frequency of deep ventilation events in possible future climates The lumped model air2water was used to project lake surface temperature a required boundary condition for the lake model based on air temperature in the future climates
The 1DDV model was used to simulate daily water temperature profiles through 2099 All future climate scenarios projected increased water temperature throughout the water column and a substantive reduction in the frequency of deep ventilation events The least extreme scenario projected the frequency of deep ventilation events to decrease from about 1 in 2 years in current conditions to about 1 in 3 years by 2100 The most extreme scenario considered projected the frequency of deep ventilation events to be about 1 in 77 years by 2100 All scenarios predicted that the temperature of the entire water column will be greater than 4 degC for increasing lengths of time in the future and that the conditions required for thermobaric instability induced mixing will become rare or non-existent
The disruption of deep ventilation by itself does not provide a complete picture of the potential ecological and water quality consequences of warming climate to Crater Lake Estimating the effect of warming climate on deep water oxygen depletion and water clarity will require careful modeling studies to combine the physical mixing processes affected by the atmosphere with the multitude of factors affecting the growth of algae and corresponding water clarity
1US Geological Survey2University of Trento Italy3National Park Service Crater Lake National Park
IntroductionCrater Lake is located in Crater Lake National Park at the
crest of the Cascade Range in southern Oregon (fig 1) The lake partially fills a caldera that formed about 7700 years ago following the volcanic eruption and collapse of Mt Mazama The nearly circular caldera that formed was about 1220 m deep and 10 km across and subsequently filled approximately halfway with water The lake has a maximum depth of 594 m making it the deepest lake in the United States and eighth deepest in the world The surface is at 1883 m elevation and the shoreline is 31 km in length Crater Lake has no surface outlet and surface inlets are limited to small springs draining the steep caldera walls
Crater Lake is widely known for its deep blue color and extremely clear water Summer Secchi depth typically ranges between 25 and 35 m An ongoing long-term monitoring program was initiated in 1983 in response to concerns that the clarity of the lake might be declining The lake is extremely biologically unproductive (ultra-oligotrophic) with peak chlorophyll a concentrations less than 2 microgL and low nutrient concentrations (nitrate less than 0025 mgL phosphate less than 002 mgL) The lake is primarily nitrate and iron limited (Groeger 2007) Most of the available nitrate is located deep in the lake below 200 m and upward mixing of the deep-water nitrate pool from episodic winter mixing events is estimated to account for more than 85 percent of the seasonal nitrogen input to the upper water column when mixing occurs (Dymond and others 1996) and influences the autotrophic productivity the following summer These episodic winter mixing events also bring oxygen-rich surface waters downward and are critical for maintaining oxygen levels at greater than 90 percent of saturation throughout the water column (Crawford and Collier 2007)
Typical of dimictic lakes Crater Lake experiences periods of convective vertical mixing in early winter and spring Between convective mixing periods strong thermal stratification occurs in summer (warmer water floating on top) and is often reverse stratified in winter (colder water floating on top) Reverse stratification is possible when the upper water column temperatures are less than about 4 degC the temperature of maximum density at atmospheric pressure
2 Simulation of Deep Ventilation in Crater Lake Oregon 1951ndash2099
tac16_1054_fig 01
Base modified from US Geological Survey bathymetry and digital elevation model data accessed at httpoeoregonexplorerinfocraterlakebathymetryhtml Coordinate reference system is NAD 1983 State Plane Oregon South FIPS 3602
Samplingsite Band weather buoy
Meteorologicaltower
Merriam Cone
Wizard Island
Southwest basin
Northwest basin
East basin
EXPLANATION
Downscaled MACA climate grid
0
100
200
300
400
500
600
Depth below water surface in meters
OREGON
Studyarea
122deg4122deg6122deg8122deg10
42deg58
42deg56
42deg54
0 05 10 15 20 MILES
0 1 2 3 4 KILOMETERS
Casc
ade
Rang
e
Figure 1 Sampling site and climate model grid Crater Lake Oregon
Methods 3
The lake circulates to a depth of 200ndash300 m twice each year in early winter and spring due to wind and convective cooling However mixing to the bottom does not occur every winter but on average every 2ndash3 years through a process of thermobaric instability when the lake is weakly reversely stratified (Crawford and Collier 2007) Because the temperature of maximum density decreases with pressure it decreases with depth In a deep lake this fact is of particular importance because it provides the opportunity for strong winds to push colder surface water down to a depth where its temperature is closer to the local temperature of maximum density than the surrounding water In that situation the colder surface water is denser than the surrounding water and continues to sink until it reaches the depth at which it has the same density as the surrounding water or the bottom of the lake (Boehrer and Schultze 2008) This type of mixing generally allows surface water to penetrate deeper than convective mixing Distinct mixing events of this type occurred in Crater Lake in 11 of 22 winters between 1993 and 2014
The presence of reverse stratification in winter (colder water floating on top of a lake) is essential for thermobarically induced mixing events to occur in Crater Lake (Crawford and Collier 2007) because it sets up the requisite conditions that allow strong winds to push the upper layer of the lake below the compensation depth (the depth at which the colder surface water has the same density as the surrounding water) However air and water temperature data from Crater Lake over the last 22 years show that reverse stratification did not occur during the three warmest winters (2001 2003 and 2005) Because present day meteorological conditions already appear to be near the temperature threshold for reverse stratification further warming of the climate at Crater Lake could reduce the frequency of winter deep ventilation events or stop them altogether The absence of deep ventilation and the consequent reduction of the upward nitrate flux into the photic zone could result in a decrease in the already minimal primary production that supports the food web in the lake A loss of deep ventilation in Crater Lake also would prevent re-oxygenation of the bottom waters If anoxia in bottom water were to occur taxa presently living on the lake floor could be lost and nutrients (iron a co-limiting nutrient Groeger 2007) stored in the sediments could be released to the water column Such changes would result in large-scale ecological impacts on the lake potentially altering its world-renowned beauty and resulting in a loss of biological communities
The objective of this study is to assess whether the frequency of climatologically induced deep ventilation events is likely to change in the twenty-first century under warming climate conditions
Purpose and Scope
This report presents the results of a partnership between the US Geological Survey (USGS) and the National Park Service to investigate the changes in the frequency of deep
ventilation events in Crater Lake that could be expected in a future warmer climate We began by assessing through calibration and validation the suitability of a 1-dimensional research-grade vertical lake model recently developed specifically to simulate deep ventilation in Lake Baikal Russia for the study of deep ventilation in Crater Lake We compared the results to simulations produced by a widely used and well-tested 1-dimensional lake model the DYnamic REservoir Simulation Model (DYRESM) developed by the Centre for Water Research at the University of Western Australia to demonstrate the importance of using a model specifically designed to incorporate the distinctive and relatively uncommon process responsible for deep ventilation in Crater Lake
The effects of a future climate were assessed by running the selected model with boundary conditions determined using six climate scenarios from a combination of three GCMs and two RCPs representing a moderate and extreme scenario of future climate action The frequency of deep ventilation was assessed over two overlapping 55-year periods during 2007ndash2099 (2007ndash2061 and 2045ndash2099) The change in the frequency of deep ventilation was assessed as a comparison to 55 years of baseline conditions determined from the same three GCMs
Methods
Datasets
Depth-volume data (hypsographic curve) for Crater Lake was derived from a high-resolution (16 million soundings) multi-beam echo sounding survey of the lake completed in 2000 (Bacon and others 2002)
Historical Water Quality and Meteorological Data
High frequency meteorological and water quality data have been collected at Crater Lake since 1990 The meteorological datasets used in this study to provide boundary conditions for the lake models included wind speed air temperature relative humidity shortwave solar radiation and daily accumulation of rain and snow precipitation Wind speed air temperature surface water temperature and relative humidity were collected year round from a buoy in the lake at site B (fig 1) at a height of 2-m above water surface at 1-hour intervals As necessary small gaps of several days or less were filled with data from a meteorological station located on the crater rim (fig 1) using regression models developed over periods when both data were available Solar radiation data were collected at the site on the crater rim Daily accumulation of rain and snow were collected at Crater Lake National Park Headquarters located below the crater rim on the south side of Mt Mazama (fig 1) The continuous
4 Simulation of Deep Ventilation in Crater Lake Oregon 1951ndash2099
water temperature data that were used to calibrate and validate the lake models were collected by thermistors at 10-minute intervals at the discrete target depths of 20 30 40 50 70 90 130 150 170 200 250 300 350 400 460 530 and 580 m at site B between 1992 and 2013
In addition to the high-frequency thermistor data water column profiles of temperature and salinity were collected with a conductivity temperature and depth sonde (CTD) during discrete sampling events at 1-m depth intervals primarily between June and October from 1988 to 2013 at site B The temperature data from these profiles were used to evaluate the turbulent diffusivity profile of the water column and the salinity data were used to define a salinity-depth relation
Climate DataDownscaled future climate data were used to assess
potential climate change effects on the temperature profile and deep-water ventilation of Crater Lake The University of Idaho provides GCM data from the Coupled Model Intercomparison Project 5 (CMIP5 Taylor and others 2012) that are statistically downscaled using the Multivariate Adaptive Constructed Analogs (MACA) technique (Abatzoglou and Brown 2012) Daily air temperature and wind speed data downscaled to a 4-km (124 degree in latitude and longitude) spatial resolution were used for the historical period of 1951ndash2005 and the future period of 2006ndash2099 At the time that this study began the number of GCMs for which downscaled data were available was limited The three GCMs used in this study were selected from those available because they performed well in reproducing the climate of the Pacific Northwest (PNW) region Specifically CNRM-CM5 model from the National Centre of Meteorological Research (2014) was the model determined to be the best overall at reproducing various climate metrics in the PNW (Rupp and others 2013) Two models from the Hadley Centre in the United Kingdom (Met Office 2014) that differ in the number of vertical atmospheric levels also ranked highly in reproducing PNW climate (Rupp and others 2013) The HadGEM2-ES model has 38 levels and is closer to the CNRM-CM5 model (31 levels) than the HadGEM2-CC model which has finer vertical resolution (60 levels) Two available Representative Concentration Pathways RCP45 and RCP85 were evaluated for comparison The RCP45 scenario is one of moderate climate mitigation action in which an additional 45 W m-2 of heat is trapped in the earth-atmosphere system compared to preindustrial conditions by 2100 (Thomson and others 2011) The RCP85 scenario is more severe being characterized by a continued heavy reliance on fossil fuels and no implementation of climate policies In this scenario an additional 85 W m-2 of heat is trapped in the earth-atmosphere system compared to preindustrial conditions by 2100 (Riahi and others 2011) The bounding coordinates designating the area over Crater Lake were 4289613degN to 4297946degN and 1221472degW to 1220639degW and this region included nine
MACA grid points (fig 1) The downscaled air temperature and wind speed from the nine grid points were averaged for each day to acquire daily time-series sets representing conditions at Crater Lake as simulated by the three GCMs
Models
The selection of the lake model was critical to the success of this study Deep ventilation in Crater Lake resulting from thermobaric instabilities is a basin-scale process which in principle would require a computationally intensive 3-dimensional model to simulate the fundamental equations of motion Such a model would require a large amount of data for proper calibration and validation and would be difficult to run through decades of simulations even with the currently available high performance computational resources The 1-dimensional deep ventilation model we used (referred to as 1DDV in this report) was developed to efficiently simulate the deep ventilation process triggered by thermobaricity in Lake Baikal by reducing the problem to a 1-dimensional parameterized vertical energy budget in which the mechanical energy available in the wind is used to move a volume of surface water against a stable density gradient (Piccolroaz 2013 Piccolroaz and Toffolon 2013 fig 2A) The 1DDV model requires a minimum of external forcing input data water temperature at the surface wind speed and wind duration The 1DDV model does not calculate the surface heat balance rather water temperature averaged over the thickness of the model surface layer (herein denoted surface layer temperature or SLT) must be supplied as a boundary condition for the vertical temperature profile In addition to measured inputs and calculable model parameters the 1DDV model requires a reference turbulent diffusivity profile hydrothermal heat input profile the hypsometric curve (the relation between depth and water volume) salinity profile and calibration parameters used to describe energy transfer from the wind to the lake surface layer and the degree of mixing between lake layers The 1DDV model successfully simulated the deep-water renewal process in Lake Baikal but it has not been tested in a smaller lake
Two closure relations are introduced to evaluate the wind energy input at the surface and the volume of water involved in the wind-induced deep downwelling These relations are at the core of the model and have been derived by schematizing the downwelling process as a layer of water that is accelerated into horizontal motion by the available wind energy input and eventually is forced to move downward along the shoreline boundary (Boehrer and Schultze 2008) Wuumlest and others (2005) suggested that deep downwellings in Lake Baikal are likely to be driven by along-shore winds that given the large dimension of the lake can cause Ekman transport (National Atmospheric and Space Administration 2015) of the surface wind-driven layer of water perpendicular to the wind stress and toward the shoreline Because Crater Lake is smaller than Lake Baikal a surface Ekman layer is not expected to fully
Methods 5
tac16_1054_fig 02a
NO
NO
YES YES
START when ∆t=Td
Calculate KE based on Ua
Calculate Vd and zd based on KE
Is zdgthc
Vd moves to zd(mixing while sinking)
Vd moves to hc(mixing while sinking)
EXPLANATION∆t = elapsed time since the end of
the last downwelling time stepTd = downwelling time step (3 days)KE = input of kinetic energy to water
column from windUa = wind velocityVd = downwelled volumezd = stopping depthhc = compensation depth
All layers above move up to
accomodate
Switch the position of the two adiacent layers with
the highest buoyancy instability (mixing)
End downwelling
Are there unstable layers
A
Figure 2 Approach used to convert wind stress to water column mixing in the 1-dimensional deep ventilation model (1DDV) and the DYnamic REservoir Simulation Model (DYRESM) (A) Deepwater renewal in 1DDV and (B) surface mixed layer deepening in DYRESM The steps have been simplified to emphasize the important differences in approach between the two models
tac16_1054_fig 02b
YES
Combine surface layer with adjacent layer to
create new surface layer
Calculate density of new surface layer
Decrease KE by PEmix
START when Ua gt Uc
Calculate KE based on Uaand convective mixing
Calculate PEmix
Is KE gt PEmix
End SML deepening
Augment KE with shear at base of SML NO
(1st time)NO (2nd time)
BEXPLANATION
Ua = wind velocityUc = critical wind velocityKE = input of kinetic energy to water
column from windPEmix = increase in potential energy
required to mix the surface layer of the water column with the adjacent layer
SML = surface mixed layer
6 Simulation of Deep Ventilation in Crater Lake Oregon 1951ndash2099
develop and the acceleration of the surface water is likely closer to parallel to the wind stress As a first approximation however the same downwelling closure relations of 1DDV can be used for Crater Lake because the process is set in motion by the wind in both lakes As in Lake Baikal buoyancy instabilities due to the thermobaric effect play an important role in determining the deep ventilation process in Crater Lake (Crawford and Collier 2007) thus making 1DDV particularly well suited to investigate the renewal of deep water in the lake
As modeled with 1DDV a lake is divided into a number of layers of equal volume and a Lagrangian-based algorithm is used to rearrange these volumes to simulate the vertical displacement of water due to deep downwelling and convective mixing For the simulation of deep downwellings a finer spatial resolution is used by dividing each volume into a number of subvolumes with a reasonable increase of the computational cost The wind energy input to the lake (evaluated over a 3-day period) is compared to the energy that is required to displace the upper volume of water downwards to its compensation depth (the depth where the sinking volume has the same density of the surrounding water) If the energy input is sufficiently large which is generally the case when the water column is weakly inversely stratified and the wind is sufficiently strong the downwelling volume is displaced to a point below the compensation depth There the sinking volume is heavier than surrounding water and thus will continue to move downward until it either reaches water of the same temperature or the bottom of the lake In contrast shallow convective mixing occurs when the energy input is low or the lake is strongly stratified the sinking volume is displaced to a depth shallower than the compensation depth where it is lighter than surrounding water and due to positive buoyant forces is displaced upward again A limited exchange with surrounding water occurs but not full mixing as the volume is moved along the vertical during either deep or shallow downwelling as well as during vertical rearrangement of subvolumes due to the stabilization of unstable regions of the water column
To elucidate the atypical nature of the deep ventilation process in Crater Lake further the well-documented lake model DYRESM (fig 2B) was used to simulate 6 years of calibration data and the results were compared to the 1DDV simulation The DYRESM model is a 1-dimensional hydrodynamic model for lakes and reservoirs developed at the University of Western Australia and used in 59 countries at the time of this writing (Imerito 2014) The use of the model is limited to situations in which the 1-dimensional assumption is valid that is situations in which density stratification is strong enough to provide a strong restoring force to perturbations in the isopycnals resulting from wind energy input at the surface and therefore the isopycnals remain nearly horizontal DYRESM is Lagrangian-based the lake
is divided into horizontal layers with uniform properties but varying thicknesses that are determined dynamically to adequately resolve vertical gradients DYRESM solves the surface heat mass and momentum balance therefore input data requirements include solar radiation air vapor pressure and temperature wind speed and precipitation DYRESM simulates the vertical temperature and salinity profile based on surface boundary conditions and hydrothermal inputs which are modeled as point sources to the deep water column
The defining structure of the upper water column in DYRESM is the surface mixed layer (SML) Mixing in the upper part of the water column is based on a budget for the turbulent kinetic energy (TKE) of the SML (Tucker and Green 1977) Wind shear stress is converted to TKE that is used to deepen the mixed layer by entraining adjacent layers if there is enough TKE to overcome the buoyancy forces of a stable water column Thus the total TKE input to the water column at every time step (daily for this study) is used to deepen the mixed layer and in the process homogenize the density of the mixed layer The amount of TKE available is compared to the potential energy (PE) that must be overcome in order to completely mix layers with denser water into the SML The efficiency with which TKE accomplishes the mixing is controlled through parameters that are set to default values based on well-documented empirical relations When the assumption of 1-dimensionality is satisfied the developers state that the model produces an accurate solution without calibration (Imerito 2014)
It stands to reason that these two models would produce different simulated responses of Crater Lake to the same wind forcing and further that each would perform better in some circumstances DYRESM has been shown to perform well in simulating convective mixing through entrainment of adjacent layers and deepening of the SML especially during the erosion of summertime thermally stratified conditions but deep ventilation due to thermobaric instabilities is a fundamentally different process Therefore the differences between the results obtained from the models are instructive
Data Processing
Historical Water-Quality and Meteorological Data for the 1-Dimensional Deep Ventilation Model
The measured data inputs to the 1DDV model included daily average SLT data and daily average wind-speed data Measured vertical temperature profiles were used as initial conditions Based on these data needs we identified three periods for simulation with the 1DDV model that were free of large data gaps (1) from August 13 1994 to August 14 1999 (2) from September 23 2000 to June 27 2006 and (3) from
Methods 7
August 25 2008 to June 30 2011 Daily values of wind speed and SLT were used to be consistent with the temporal resolution of the climate datasets The computational time step of the model was 12 hours
Surface water temperature was measured at the buoy (at approximately 2 m depth) but this temperature was not appropriate to be used as the model boundary condition because the surface layer of the model has a thickness of about 10 m The water temperatures measured under the buoy were also contaminated by heating of the buoy especially during low-wind events in summer (RW Collier Oregon State University written commun 2015) Therefore the SLT time series used as the upper boundary condition was the temperature measured at 20 m depth (T20) which corresponds to the shallowest thermistor This measurement is sufficiently far from the surface to exclude the direct contribution of short-term variations of the heat flux components at the lake-atmosphere interface but close enough to the surface to capture the residual effect of the overall heat exchange and thus it proved to be more suitable than the buoy temperature as the thermal condition of the upper layer of the lake During wintertime reverse-stratified conditions that are most important in this study the assumption that T20 can represent SLT is appropriate because the surface mixed layer is usually deeper than 20 m during stratified conditions in summer this assumption is likely to underestimate SLT but is still reasonable
Although the target depth of the shallowest thermistor was 20 m most of the data were collected at a depth other than 20 m ranging between 15 and 36 m depending on the deployment When the shallowest thermistor data were collected at a depth other than 20 m the T20 was determined by linear interpolation between the surface buoy and the shallowest thermistor data When interpolation to 20 m depth was required during strongly stratified summer conditions (during which the epilimnion was warm and thin) and when the uppermost thermistor was installed beneath the thermocline the interpolated values substantially overestimated the temperature at 20 m Occasional summertime gaps in the thermistor data when the thermistors were not in the water were filled with CTD profile data by linear interpolation which resulted in a loss of variability in some summer months The focus of this study however was on winter mixing events when variability was unaffected by missing data The hourly dataset was averaged to a daily dataset for use in the model
The input wind-speed time series was developed from the meteorological data collected at the buoy in Crater Lake Wind-speed data were measured at a height of 3 m above water surface and the values were translated to 10-m values using a logarithmic approximation (Martin and McCutcheon 1998) The hourly dataset was then averaged to a daily dataset for use in the model
The initial condition temperature profile at the start of each simulation was extracted from a dataset that combined thermistor data CTD data and buoy surface temperature data to provide 1-m temperature profiles interpolated to daily values
Historical Water-Quality and Meteorological Data for the Dynamic Reservoir Simulation Model
The measured data inputs to the DYRESM model included daily averaged values of meteorological variables shortwave solar radiation cloud cover air temperature vapor pressure wind speed and daily accumulation of rain and snow precipitation Based on these data needs we identified three periods for simulation with the DYRESM model that were free of large data gaps (1) from January 20 1993 to August 24 1999 (2) from September 17 1999 to August 21 2007 and (3) from January 18 2008 to October 28 2013 Solar radiation data were measured at the meteorological station on the rim Missing days of data (defined as having less than 20 hourly measurements during the day) were filled with the median value measured on that yearly Julian day over the entire dataset Cloud cover was not recorded and was calculated as a function of the ratio of measured daily average solar radiation to the calculated clear sky radiation value (Environmental and Water Resources Institute 2005) for that Julian day (Crawford and Duchon 1999 Yang and others 2010) Air temperature wind speed and relative humidity were measured at both the buoy on the lake and at the meteorological station on the crater rim For these three variables the data measured at the buoy were used preferentially and when not available was filled in with data from the rim corrected using a linear regression between the measurements at both locations Wind speed data measured at the buoy on the lake at a height of 3 m above the water surface were translated to 10-m values using a logarithmic approximation to the atmospheric boundary layer (Martin and McCutcheon 1998) Vapor pressure was calculated from relative humidity using the Magnus-Tetens formula (Martin and McCutcheon 1998) Initial profiles of temperature and salinity were determined from the CTD profile collected most closely in time to the beginning of the simulation
Future Climate Data
Air and Lake Surface TemperatureThe future climate datasets of statistically downscaled
air temperature and wind speed need to be further downscaled from their regional spatial resolution (124 degree in latitude and longitude) to a finer local scale that is representative of the conditions at the lake surface through a bias-correction
8 Simulation of Deep Ventilation in Crater Lake Oregon 1951ndash2099
procedure For air temperature this bias correction was accomplished with the change factor method also known as the ldquodelta methodrdquo (Diaz-Nieto and Wilby 2005 Minville and others 2008) which involves adjusting the GCM time series by assuming that the bias of the GCM compared to measurements on each Julian day in the year as determined during an overlapping historical period applies to the GCM at all other baseline and future times
T T T Tadj y GCM y obs h GCM h = + minus( ) (1)
where Tobs h and TGCM h are the observed and GCM-modeled ldquomean
yearsrdquo for the same climatological historical period h which in this case is the 13-year period 1993ndash2005 (the mean year is defined by giving to each day of the year the average of all values available in the dataset for that same day) and
Tadjy and TGCMy are the adjusted and GCM-modeled time
series of daily air temperature in year y where y can be any year outside the historical period during the GCM baseline (1950ndash2005) or future climate (2006ndash2099) period
Additionally air temperature needs to be converted into lake temperature at 20 m depth which is how the SLT the boundary condition required by the model 1DDV is defined for this study The lumped model air2water (Piccolroaz and others 2013) was adopted The air2water model is based on a simplified parameterization of the heat exchanges between a lake and the atmosphere and is able to simulate daily near-surface lake temperature based only on air temperature as a proxy for the main meteo-climatic variables The model has been tested on 14 temperate lakes with accuracy comparable to more complex process-based models that require substantially more input data (Toffolon and others 2014) The air2water model also has been used successfully to investigate the feedback between stratification and thermal response of lakes (Piccolroaz and others 2015) For Crater Lake specifically the full (eight-parameter) version of the model was used and the parameters were calibrated using the measured daily average of air temperature and lake temperature at 20 m depth during the historical period 1993ndash2011 The temperature at 20 m depth sometimes had to be determined with an interpolation between the buoy (2 m) temperature and the uppermost thermistor (at approximately 20 m) (see section Historical Water-Quality and Meteorological Data for the 1-Dimensional Deep Ventilation Model) When this resulted in unrealistically high values in summer those values were removed before
calibrating air2water The calibration of air2water with this time series of water temperature was successful resulting in a root mean square error (RMSE) of 068 degC between the simulated and measured daily values of T20 over the entire calibration period of 1993ndash2011 Further air2water was able to capture the inter-annual variability and the long-term trend in T20 particularly in the DecemberndashMay average (the months that correspond to the time of year when the lake is inversely stratified or only weakly directly stratified [fig 3])
The calibrated air2water model was used to project T20 using the downscaled air temperature calculated with equation (1) for both the entire baseline period of 1951ndash2005 and the future conditions period of 2006ndash2099 Results of the application of air2water to the baseline and future scenarios are presented for each of the GCMs in figure 4AndashC in terms of the DecemberndashMay mean with downscaled baseline and future conditions air temperature Summary statistics are provided in table 1 The long-term trends in air and water temperature are indicated by the slope of the linear regressions and show that as expected the water temperature does not warm as fast as the air temperature and the interannual variability in the water temperature is less than the interannual variability in the air temperature Figure 4 indicates how the projected warming of air temperature could affect T20 during the 21st century Depending on the GCM the warming trend in water temperature is between 0013 and 0019 degC per year in the RCP45 scenario and 0034 and 0035 degC per year in the RCP85 scenario compared with air temperature warming trends between 0021 and 0031 degC per year and 0055 and 0060 degC per year respectively in the same scenarios
The long-term trends in T20 for the cold season from December to May directly quantify the effect that a future increase in air temperature is expected to have on the thermal regime of the lake This effect is evident in the comparison of the mean annual T20 and more importantly the mean annual percentage of days with T20 colder than 4 degC for the three GCMs and two RCPs between the baseline period and future conditions The CNRM-CM5 GCM projects the lowest average air temperatures for both baseline and future conditions increasing 255 degC from 480 degC (baseline) to 735 degC in the RCP45 scenario and increasing 428 degC from 480 to 908 degC in the RCP85 scenario (table 1)
By the second half of the 21st century the annual percentage of days during which the lake is inversely stratified (a necessary condition for thermobaric instabilities to occur) is expected to decrease from 389 percent (baseline) to 88 percent and 34 percent in the RCP45 and RCP 85 scenarios respectively The HadGEM2-CC and HadGEM2-ES GCMs project similar results HadGEM2-CC projects the highest average air temperatures for both baseline and future conditions increasing 297 degC from 540 degC (baseline) to 837 degC in the RCP45 scenario and increasing 485 degC from 540 to 1025 degC in the RCP85 scenario (table 1) Conversely HadGEM2-ES projects the largest shortening of
Methods 9
tac16_1054_fig 03
1994 1996 1998 2000 2002 2004 2006 2008 2010 2012
Tem
pera
ture
in
degr
ees
Cels
ius
5
4
3
2
1
0
-1
-0015 degC per year
-0022 degC per year
-0059 degC per year
Measured air temperature
Measured water temperature
Simulated water temperature
EXPLANATION
Figure 3 December-to-May averages (plotted at January 1) of air temperature and water temperature at 20 meter depth and water temperature at 20 meter depth simulated by the lumped model air2water during the calibration period 1993ndash2011 at Crater Lake Oregon Multi-annual trends (evaluated using robust linear regression) of air and water temperature also are shown
Table 1 Statistical characteristics of air temperature and water temperature for the historical period of record and for the baseline and future conditions periods from three general circulation models (GCMs) and two representative concentration pathways
[Water temperature is at 20 meter depth as simulated with the air2water model Abbreviation degC degree Celsius]
GCM or
measured Period
Average daily air temperature
Tair
(degC)
Standard deviation daily air
temperature (degC)
Average daily water temperature
T20
(degC)
Standard deviation
daily water temperature
(degC)
Annual percentage of
days with water temperature less
than 4 degC
T20-Tair
(degC)
Historical period of observations 1995ndash1999 2001ndash2006 2009ndash2011
Measured All months 503 685 560 248 402 057December to May 054 389 356 071 790 302
Baseline conditions 1951ndash2005
CNRM-CM5 All months 480 691 526 237 389 046December to May 018 399 338 107 728 320
HadGEM2-CC All months 540 710 567 243 341 027December to May 080 430 363 096 680 283
HadGEM2-ES All months 510 690 546 236 371 036December to May 075 423 348 089 733 273
Last 55 years of future conditions 2045ndash2099 representative concentration pathway 45
CNRM-CM5 All months 735 704 694 255 88 -041December to May 279 393 486 096 175 207
HadGEM2-CC All months 837 772 761 290 36 -076December to May 323 457 515 096 71 192
HadGEM2-ES All months 846 757 767 286 25 -079December to May 334 441 526 092 51 192
Last 55 years of future conditions 2045ndash2099 representative concentration pathway 85
CNRM-CM5 All months 908 738 807 290 34 -101December to May 438 439 583 128 69 145
HadGEM2-CC All months 1025 815 884 330 13 -141December to May 469 469 612 120 27 143
HadGEM2-ES All months 1014 791 877 319 01 -137December to May 490 443 613 100 02 123
10 Simulation of Deep Ventilation in Crater Lake Oregon 1951ndash2099
Figure 4 December-to-May averages of downscaled air temperature from general circulation models (GCMs) and water temperature at 20 meter depth as determined with the air2water model through baseline (1951ndash2005) and future climate (2006ndash2099) conditions at Crater Lake Oregon Long-term trends (evaluated using robust linear regression) of air and water temperature also are shown
tac16_1054_fig 04
CNRM-CM5
HadGEM2-CC
HadGEM2-ES
1950 2000 2050 2100
10
5
0
-5
Tem
pera
ture
in
degr
ees
Cels
ius
10
5
0
-5
Tem
pera
ture
in
degr
ees
Cels
ius
10
5
0
-5
Tem
pera
ture
in
degr
ees
Cels
ius
+0011 degC per year
+0004 degC per year
+0003 degC per year
+0003 degC per year
-0005 degC per year
+0013 degC per year+0034 degC per year
+0025 degC per year
+0021 degC per year+0060 degC per year
+0019 degC per year+0035 degC per year
+0018 degC per year+0035 degC per year
+0026 degC per year+0055 degC per year
+0031 degC per year+0055 degC per year
Year
A
B
C
EXPLANATION
Linear fit90 percent confidence interval
90 percent confidence interval
Linear fit90 percent confidence interval
90 percent confidence interval
Baseline RCP85RCP45
Air temperature
Water temperature
Methods 11
the duration of inverse stratification during the second half of the 21st century with a decrease from the 371 percent of the year (baseline) to the 25 percent and 01 percent in the RCP45 and RCP 85 scenarios respectively The notable decrease in the number of days in the year when T20 is less than 4 degC projected by all GCMs is expected to have strong implications for the general thermo-hydrodynamics of the lake
The variability in daily air temperature increases with the average temperature but the projected increase is different among the GCMs CNRM-CM5 projects the smallest increase in the standard deviation of daily values at 013 degC between baseline and RCP45 conditions and 047 degC between baseline and RCP85 conditions HadGEM2-CC projects the biggest increase in the standard deviation of daily values at 062 degC between baseline and RCP45 conditions and 105 degC between baseline and RCP85 conditions The differences among the average water temperature and the standard deviation of daily water temperature as projected by the GCMs mirror the projected differences in air temperature but are smaller in magnitude Given the large differences between the long-term trends in air temperature as determined by the three GCMs and the two RCPs and how closely projected water temperature tracks projected air temperature the uncertainties in the climate scenarios are likely to dwarf any errors in the application of air2water to determine T20
Wind SpeedThere is no expectation that individual events in the
time series of wind speed obtained from a GCM should match those in the measurements during the historical period but the statistics describing the distribution of wind speed should be as close as possible for the wind speed from the GCMs to represent current conditions When the cumulative distribution function (cdf) of the wind speed measurements (daily means 1991ndash2005) was compared to the cdf of the daily values from the GCMs for the same historical period there was substantial bias especially at higher wind speeds indicating the need for an additional downscaling step aimed at matching local scale measurements (fig 5) The approach used to downscale wind speed to the lake surface was similar to the statistical downscaling procedure adopted by Piccolroaz (2013) In this case the future period was divided into 10-year sub-periods (p) for which the corresponding cumulative distribution functions of GCM-modeled daily wind speed were evaluated (cdfGCMp) Each cdf was compared to the cdf of the GCM-modeled wind speed during the reference historical period (cdfGCMh ) in order to define a change function for
the sub-period (rp) that is defined as the ratio between the two cdfs This change function was used to modify the cdf of measurements (daily means to be consistent with the daily data from the GCMs) during the reference historical period (cdfobsh) to create an adjusted cdf (cdfadjp) that would describe the GCM-simulated wind speed for each future sub-period (p) To summarize this technique applies the translation between the cdf of the measurements and the GCM-simulated data during the historical reference period to sub-periods outside the historical reference period in order to obtain downscaled values from the GCM-simulated data The reference historical period (h) was defined as the period when wind speed measurements and baseline data from the GCMs overlapped (1991ndash2005)The whole procedure can be summarized as follows
cdf cdf r cdfcdfcdfadj p obs h p obs h
GCM p
GCM h
= = (2)
The final adjusted wind speed (Wadjp) was computed from the adjusted cdf for the sub-period by applying the quantile-mapping approach (Panofsky and Brier 1968)
( )( )1 adj p adj p GCM p GCM pW cdf cdf Wminus= (3)
where WGCMp is the daily series of GCM-modeled wind
speed for the sub-period p and cdfadj p
minus1 is the inverse of cdfadjp
Results of the downscaling are presented in figure 5 in terms of maximum mean and minimum annual wind speed for both historical and future periods The projected changes in average daily wind speed and average annual maximum wind speed between baseline and future conditions are small (table 2) The CNRM-CM5 GCM projects the 50th percentile wind speed to increase slightly between baseline conditions and either RCP from 371 to 377 ms whereas the HadGEM2-CC GCM projects 50th percentile wind speed to decrease slightly from 373 to 359 ms in the RCP45 scenario and from 373 to 352 ms in the RCP 85 scenario HadGEM2-ES projects decreasing average wind speeds of similar magnitude These results suggest that changes in the frequency of deep ventilation in Crater Lake as simulated by these future climate scenarios are likely to be mainly attributable to the projected changes in air temperature rather than wind speed
12 Simulation of Deep Ventilation in Crater Lake Oregon 1951ndash2099
tac16-1054_fig05
Maximum
Maximum
Maximum
Mean
Mean
Mean
Minimum
Minimum
Minimum
Freq
uenc
y
Win
d sp
eed
in m
eter
s pe
r sec
ond
Wind speed in meters per second
CNRM-CM5
HadGEM2-CC
HadGEM2-ES
1950 2000 2050 2100
1950 2000 2050 2100
1950 2000 2050 2100
10
08
06
04
02
0
5
00
10
10
15
20
Freq
uenc
y
10
08
06
04
02
00
10 20
Freq
uenc
y
10
08
06
04
02
00
10 20
20
Win
d sp
eed
in m
eter
s pe
r sec
ond
0
5
10
15
20
Win
d sp
eed
in m
eter
s pe
r sec
ond
0
5
10
15
20
Note cdf = cumulative distribution function
EXPLANATION EXPLANATIONWind speed observations during historical period
Adjusted GCM-modeled wind speed during baseline period
Adjusted GCM-modeled wind speed during future conditions period RCP45
Adjusted GCM-modeled wind speed during future conditions period RCP85
Year
cdf of observations during the historical period
cdf of GCM-modeled wind speed during the historical period
Figure 5 Cumulative distribution functions of measured and simulated daily wind speed for the common historical period 1991ndash2005 and the original and adjusted minimum mean and maximum wind speed from three general circulation models and two representative concentration pathways during baseline (1951ndash2005) and future (2006ndash2099) conditions at Crater Lake Oregon
One-Dimensional Lake Temperature Modeling 13
Table 2 Statistical characteristics of wind speed for the historical period of record and for the baseline and future conditions periods from three general circulation models (GCMs) and two representative concentration pathways
GCM or
measured Period
Daily wind speed in meters per second
50th percentile 75th percentile 90th percentile Maximum
Historical period of observations 1995ndash1999 2001ndash2006 2009ndash2011
Measured All months 381 610 857 1447December to May 467 724 925 1304
Baseline conditions 1951ndash2005
CNRM-CM5 All months 371 584 828 1519December to May 438 696 914 1447
HadGEM2-CC All months 373 589 843 1479December to May 436 709 926 1479
HadGEM2-ES All months 373 598 848 1886December to May 439 714 932 1886
Last 55 years of future conditions 2045ndash2099 representative concentration pathway 45
CNRM-CM5 All months 377 593 833 1545December to May 452 699 912 1457
HadGEM2-CC All months 359 569 827 1616December to May 426 696 908 1458
HadGEM2-ES All months 360 577 819 1624December to May 441 701 897 1624
Last 55 years of future conditions 2045ndash2099 representative concentration pathway 85
CNRM-CM5 All months 377 594 830 1670December to May 457 701 910 1511
HadGEM2-CC All months 352 557 814 1553December to May 425 687 905 1550
HadGEM2-ES All months 354 565 801 1784December to May 426 679 879 1629
One-Dimensional Lake Temperature Modeling
One-Dimensional Deep Ventilation Model
Density in Crater Lake is a function of temperature pressure and salinity Ideally the salinity concentration profile that results from the balance of hydrothermal inputs at the bottom and freshwater inputs at the surface would be part of the model solution For the purpose of calculating density in the 1DDV model however the change in the salinity profile through time is small Instead an average salinity profile was calculated from CTD profiles collected at site B (fig 1) and
assumed invariant A fourth order polynomial fit to the average salinity profile was used in the model and was assumed time-invariant (fig 6) This profile increases nearly linearly with depth below 200 m from about 1045 to about 108 mgL
at the bottom a gradient of 875times10-3 (mgL)m comparable to Crawford and Collier (2007) Above 200 m depth salinity increases more steeply with depth from about 104 mgL at the surface (fig 6)
Initial Values of Calibration ParametersThe closure relations at the core of the model require
the calibration of two parameters ξ and η which are mainly dependent on the morphological properties of the lake Scaling
14 Simulation of Deep Ventilation in Crater Lake Oregon 1951ndash2099
arguments were used to determine starting values for these parameters The first parameter ξ [(kgm2)s] is used to evaluate the external specific energy input from wind to the lake surface layer (Piccolroaz and Toffolon 2013)
e C W AHBw Dw w= ξτ~ (4)
where CD is the wind drag coefficient W is the wind speed at 10-meters above the lake
surface H is the depth of the wind-affected layer
approximated as the Ekman layer depth 0 4 uf
B is the horizontal scale of the wind-affected area (assumed to be the lake diameter 8200 m)
Aw is the water surface area affected by wind (taken to be the lake surface area 53times106 m2)
τw is the wind shear stress τw=ρaCDW2
ρa is air density ρ0 is water density f is the Coriolis frequency (994times10-5 per s at
Crater Lakersquos latitude of 4295degN) and
u is the friction velocity u w =
τρ0
Substituting for H and τw equation (4) can be rewritten
ξρ ρ
~a wA fB0
0 4 (5)
The starting value of ξ was calculated as 56 (kgm2)s
The second parameter ɳ [km h] is used to estimate the sinking volume during a downwelling event (Piccolroaz and Toffolon 2013)
2 ~d D w wV C W t HBU t= η ∆ ∆ (6)
where ∆tw is the wind duration and U is the mean water velocity within the
wind-driven layer (assumed proportional to u)
Equation 6 yields the following expression for η
ηρ
ρ~ 0 4
0
aBf
(7)
Assuming the full surface area of Crater Lake was wind-affected the starting value of η was calculated as 001128 km h
Two other calibration parameters in 1DDV determine the degree of mixing that occurs between layers When adjacent layers are exchanged in the process of simulating convective mixing the parameter cmix allows for a partial exchange of water between the adjacent layers (and proportional modification of tracer concentrations) When deep downwelling and ventilation occurs and a surface volume moves downward the parameter cmix
accounts for a partial exchange between the sinking volume and the surrounding layers Generally cmix is expected to be greater than cmix
reflecting the fact that deep downwelling is a relatively rapid process
Reference Diffusivity ProfileThe reference turbulent diffusivity profile required by the
model was determined using a modification of the heat budget method (Sweers 1970 Powell and Jassby 1974 Jassby and Powell 1975) that accommodated hydrothermal inputs expressed as
K A Tz
dHdt
Gz r zz z
z = minuspartpart
minus
minus1
(8)
where Kzr Az and Tz are the reference turbulent diffusivity
cross-sectional area and temperature respectively at depth z
tac16_1054_fig 06
103 104 105 106 107 108600
500
400
300
200
100
0
Salinity in milligrams per liter
Dept
h be
low
wat
er s
urfa
ce i
n m
eter
s
EXPLANATION
Individual salinity profile
4th order polynomial fit to the 10 individual profiles
Figure 6 Ten salinity profiles at Site B Crater Lake Oregon collected between July and September 1991ndash1998 and a 4th order polynomial fit to the average of the profiles
One-Dimensional Lake Temperature Modeling 15
Hz is the heat content at depth z defined as
H T z t A z dzzz
z
m
= ( ) ( )prime primeint and (9)
Gz is the total hydrothermal heat input between the maximum depth zm and depth z
G RB z cz p= ( )( )minusρ01 (10)
B(z) is the ldquoeffectiverdquo bottom area between the maximum depth zm and depth z that is the area through which the flux of hydrothermal heat R in Wm2 occurs and
ρ0 and cp are the density and specific heat of water respectively
Implicit in equation 10 is the assumption that the hydrothermal flux R is constant that is hydrothermal inputs as a function of depth are proportional to the circumscribed bottom area at each depth This influences the shape of the turbulent diffusivity profile but there is no basis for a different assumption Because radiative heating is not included equation 8 is only valid below the depth of maximum penetration of the radiative flux of heat from the surface Additionally the CTD temperature profiles that were used to calculate the terms in the equation did not normally go to the maximum depth in the lake therefore the valid range of integration was limited to depths below 50 m to avoid radiative fluxes and above 550 m a depth attained by most temperature profiles
The temperature profile in Crater Lake has a temperature minimum (Tmin) at a depth (zmin) below the seasonal thermocline located generally between 250 and 350 m depth The small increase in temperature with depth below zmin is a consequence of hydrothermal inputs (McManus and others 1992) The calculation of terms in equation 8 was limited to profiles between July and September of each year when the change in heat content below zmin could be attributed to hydrothermal inputs alone under the assumptions that the diffusive fluxes across zmin are zero and exchange with water from the upper water column does not occur during these months Under these assumptions the change in heat content in the deep water column between an initial July profile and a final September profile was estimated as
∆ = minus( )H c H Hdeep p z final z initialρ0 (11)
where z was the midpoint between depth of minimum
temperature in the initial and final profiles
The change in heat content calculated in this way had an average value of 14 Wm2 over 19 years when normalized to the bottom area below 350 m depth as compared to the previous estimate of 1 Wm2 (McManus and others 1993) The hydrothermal flux calculated in this way varied substantially from year to year (table 3) Whether this indicates a true variation in hydrothermal inputs or 3-dimensional effects related to the transport of hydrothermal fluids between the primary source in the south basin and the location of site B (fig 1) is unknown but for the purpose of calculating diffusivity a different value of the hydrothermal heat flux R in equation 10 was assigned to each year by dividing the calculated change in heat content in that year by the bottom surface area between 400 and 550 m depth An upper limit of 400 m was used instead of 350 m as in McManus and others (1993) because it was below the deepest value of zmin in the profiles
In the metalimnion above zmin the change in heat content through summer is expected to be positive as a result of diffusive transport of heat from the surface downward However the change in heat content between 150 m (below the thermocline) and z calculated in a manner analogous
Table 3 Rate of change in heat content in the deep and mid water column and the calculated hydrothermal flux between July and September Crater Lake Oregon 1990ndash2013
[Hydrothermal flux R is calculated based on bottom surface area below 350 meters depth Abbreviations Jd joule per day W m2 watt per square meter]
YearDeep
(times1012 Jd)R
(Wm2)
1990 143 0561991 100 0391994 318 1251995 498 1961996 107 0421998 655 2581999 385 1512000 196 0772003 857 3372004 548 2152005 242 0952006 -024 -0092007 232 0912008 380 1492009 725 2852010 406 1592011 344 1352012 242 0952013 303 119Mean 350 138
16 Simulation of Deep Ventilation in Crater Lake Oregon 1951ndash2099
to equation 11 resulted in changes that were positive and negative implicating horizontal transport and lateral heterogeneity Ravens and others (2000) encountered similar difficulties in calculating Kzr using the heat budget method in Lake Baikal A mean Kzr profile was obtained by averaging only those years in which the overall change in heat content between 150 m depth and z was positive indicating diffusive transport and removing the remaining few spurious negative values from the profiles before averaging The final profile above 350 m depth was based on July and September profiles in 9 years the profile below 350 m was based on July and September profiles in 19 years (fig 7) The resulting profile shows an increase in diffusivity in the deep lake below the temperature minimum where hydrothermal inputs make the water column marginally stable (McManus and others 1993) The profile is broadly consistent with the previous estimates of a turbulent diffusion coefficient between 10-4 and 10-3 m2s (McManus and others 1993) although because it is calculated over summer the profile could be an underestimate of diffusive mixing during the winter McManus and others (1993) calculated values for the summer between 6times10-4 and 8times10-4 m2s at depths from 250 to 420 m about a factor of 2 smaller than the estimate of 2times10-3 calculated for February
Because the diffusivity profile typically is characterized by a marked seasonality and may undergo significant inter-annual variability due to changes in external forcing
tac16_1054_fig 07
Dept
h be
low
wat
er s
urfa
ce i
n m
eter
s
500
600
400
300
200
100
0
10-45x10-4 2x10⁻⁴ 5x10⁻⁴ 10-3 2x10⁻³ 5x10⁻³
Reference turbulent diffusivity in square meters per second
Figure 7 Reference turbulent diffusivity profile for the 1-dimensional deep ventilation model of Crater Lake Oregon
the model is provided with a simple module to dynamically reconstruct the temporal evolution of Kz At every computational time step Kz is derived building on well-known empirical relationships of the type (for example Munk and Anderson 1948 Pacanowski and Philander 1981)
KK
aRiKz
z r
b c z bg=+( )
1 (12)
where Kzr is the reference diffusivity profile Kzbg is a background value (set equal to
1times10- 5 m2s consistent with typical values suggested by Pacanowski and Philander [1981]) and
Ri is the Richardson number and a b and c are positive parameters
For the purpose of calculating the Richardson number the square of the vertical velocity gradient is calculated as the sum of a background value an internal wave contribution proportional to the Brunt-Vaisala frequency and a wind shear contribution based on the law of the wall (Mellor 1989 see also Piccolroaz and Toffolon 2013 appendix A for details) Within the uppermost layer of the lake (that is within the Ekman layer) Kz is imposed to be uniform and equal to
Kf
Ck
Wz surfa D
=
1
0
22ρ
ρ (13)
where k is a constant that is in the range
1times10-2 le k le4times10-2 (Kullenberg 1976)
CalibrationHistorical data between September 23 2000 and
August 3 2006 the ldquomiddlerdquo period of available data were used for model calibration Crater Lake was organized into 37 layers of equal volume of 05 km3 and sub-volumes were set equal to 01 km3 The 37 layers were centered at depths between 5 and 554 m Calibration began by using the calculated starting values of 56 (kgm2)s and 001128 km h for ξ and η respectively and the mixing percentages of 06 percent between ambient and downwelling volumes and 10 percent between unstable sub-volumes that were used for Lake Baikal (Piccolroaz and Toffolon 2013) Equation 13 was evaluated for four values of k within the acceptable range 001 002 003 and 004 a value of 002 was selected for further model calibration
One-Dimensional Lake Temperature Modeling 17
Several combinations of ξ η cmix and cmix values were
considered The calibration process started by considering ξ values ranging from 1 to 56 (kgm2)s to determine a minimum value required to translate the measured wind into enough kinetic energy to induce mixing this minimum value was approximately 7 (kgm2)s Next several combinations of ξ and η were considered by incremental adjustments of ξ by approximately 5 (kgm2)s and η by approximately 000077 km h When a good set of parameter values that captured the general timing and magnitude of deep ventilation events was attained (ξ of 20ndash30 (kgm2)s and η of 0003ndash0008 km h) the parameter increments were further refined and adjustments to the mixing parameters were made based on inspection of simulated temperature time series at 16 depths in the lake where temperature was measured The final combination of parameter values that provided the best overall simulation of temperature at depths between 20 and 530 m and which best captured the occurrence and magnitude of deep ventilation events determined by minimizing the RMSE of DecemberndashJune changes in lower lake heat content was η equal to 000386 km h ξ equal to 28 (kgm2)s cmix equal to 100 percent and cmix
equal to 90 percent (table 4) The resulting calibrated model had a tendency to
simulate a deeper-than-observed thermocline (that is warmer temperatures than measured above 70 m depth) in late summer and colder temperatures than measured in the metalimnion down to 200 or 250 m depth in late spring and summer but captured the overall shape of the thermal profile and its seasonal changes well (figs 8 9 and 10) The winter months of reverse stratification generally are characterized by a thicker mixed layer in the thermistor data than is simulated by the model Performance statistics for the calibrated model
simulations of temperature compared to thermistor data at target depths are presented in table 5 Maximum values of bias (positive) RMSE and the coefficient of variation of the RMSE (CVRMSE) between the simulated and measured temperature were between 40 and 70 m depth a result of the simulated depth of the thermocline being too great in summer and the simulated base of the mixed layer being too shallow in winter (figs 8 and 9)
At the base of and below the seasonal thermocline the model simulated the rapid changes in temperature associated with a deepening mixed layer in the cooling phase of the seasonal cycle but the extremes in temperature were smaller than measured (between 150 and 250 m in fig 11) In the deep lake below 350 m the abrupt drop in temperature of a fraction of a degree associated with deep ventilation events in 2004 and 2006 were well simulated At 530 m the deep ventilation event that is mild in the 2002 measurements was simulated as a somewhat stronger event by the 1DDV model penetrating to the deepest simulation layer representing the bottom of the lake
Table 4 Calibration parameters for the 1-dimensional deep ventilation model of Crater Lake Oregon
[Abbreviations km kilometer h hour kg kilogram m meter s second ndash no units]
Parameter Value Units
η 000386 km hξ 28 (kgm2)s
cmix 1000 percentc´mix 900 percent
k 002 ndash
Table 5 Goodness-of-fit statistics at thermistor target depths for temperature simulated with the 1-dimensional deep ventilation model Crater Lake Oregon 2000ndash2006
[RMSE Root-mean-square error NRMSE Normalized root-mean-square error (RMSE divided by the range of the observations) CVRMSE Coefficient of variation of the root-mean-square error (RMSE divided by the mean of the observations) Abbreviation degC degrees Celsius]
DepthBias (degC)
RMSE (degC)
NRMSE CVRMSE
20 -012 031 003 00640 026 066 011 01450 027 068 013 01570 015 044 012 01190 006 030 010 008
110 001 024 011 006130 000 020 010 005150 002 017 011 005170 003 016 012 004200 004 013 012 004250 005 009 013 003300 007 008 016 002350 007 008 024 002400 006 007 027 002460 004 006 025 002530 003 005 016 001
18 Simulation of Deep Ventilation in Crater Lake Oregon 1951ndash2099
tac16_1054_fig 08
500
400
300
200
100
0Measured temperature 2000ndash2006
Dept
h be
low
wat
er s
urfa
ce i
n m
eter
s
2000 2001 2002 2003 2004 2005 2006Year
121526531536541546551556561566571520
EXPLANATIONTemperature in
degrees Celsius
Figure 8 Contour plot showing measured temperature data Crater Lake Oregon 2000ndash2006
tac16_1054_fig 09
0Simulated temperature 2000ndash2006
Year
Dept
h be
low
wat
er s
urfa
ce i
n m
eter
s
500
400
300
200
100
20012000 2002 2003 2004 2005 2006 121526531536541546551556561566571520
EXPLANATIONTemperature in
degrees Celsius
Figure 9 Contour plot showing temperature simulated with the 1-dimensional deep ventilation model Crater Lake Oregon 2000ndash2006
One-Dimensional Lake Temperature Modeling 19
tac16_1054_fig 10
October 15 2003
500
600
400
300
200
100
0
Dept
h be
low
wat
er s
urfa
ce i
n m
eter
s
500
600
400
300
200
100
0
January 15 2004 April 15 2004 July 1 2004
October 15 2004 January 15 2005 April 15 2005 July 1 2005
4 6 82 1210 4 6 82 1210 4 6 82 1210
3-day average temperature in degrees Celsius
4 6 82 1210
EXPLANATIONMeasuredSimulated
Figure 10 Comparison of selected measured temperature profiles with profiles simulated with the 1-dimensional deep ventilation model Crater Lake Oregon 2003ndash2005
The thermistor data show at least mild cooling in the hypolimnion between 250 and 450 m in most years even if it does not penetrate to the bottom as in years when a strong ventilation occurs (fig 11) The simulations do not show such mild cooling every year The lack of these small adjustments to hypolimnion temperatures can result in a larger simulated event when it does occur as in 2002 The ability of 1DDV to simulate the small but important variation in temperature at the deep thermistors is quantified by the RMSE normalized by the overall range in measurements (NRMSE) which was largest below 350 m depth (NRMSE between 016 and 027 table 5)
These features can be seen dynamically in animations of a winter of no deep ventilation (fig 12) and a winter in which deep ventilation occurred (fig 13) During the warming phase of the summer the depth of the simulated thermocline is close to the observed depth in both years By September coincident with the cooling phase the simulated thermocline is too deep and continues to deepen more rapidly than is shown in the observations In winter the animations (figs 12 and 13) show the tendency of the model to under-estimate the depth of the mixed layer in winter starting in February and lasting through April 2003 (fig 12) and starting in January and lasting through April 2004 (fig 13)
20 Simulation of Deep Ventilation in Crater Lake Oregon 1951ndash2099
Figure 11 Comparison of measured temperature to temperature simulated with the 1-dimensional deep ventilation model at depths between 20 and 530 meters Crater Lake Oregon 2000ndash2006
tac16_1054_fig 11
Tem
pera
ture
in
degr
ees
Cels
ius
Tem
pera
ture
in
degr
ees
Cels
ius
12
4
2
6
8
10
20 meters
3
2
4
5
6
770 meters
30
35
40
45150 meters
2000 2002 20062004 2000 2002 20062004 2000 2002 20062004
2000 2002 20062004 2000 2002 20062004 2000 2002 20062004
200 meters 250 meters 530 meters
30
32
34
36
38
40
32
34
36
34
36
38
40
37
35
42
EXPLANATIONMeasuredSimulated
The model correctly did not simulate a deep ventilation event in spring 2003 (fig 12) but it did correctly simulate a deep ventilation event starting in February 2004 (fig 13) The profile of turbulent diffusivity is relatively dynamic above about 250 m with a minimum at the thermocline and increasing above to a maximum at the surface In the hypolimnion the profile is relatively stable and increases to a maximum in the bottom boundary layer
For the purposes of this study more important than accuracy in the simulation of temperature at discrete depths (which was satisfactory) was the ability of the model to simulate the integrated heat content of the upper and lower water column which is the basis for determining whether deep ventilation occurred in a given year In Crater Lake
a natural demarcation between the upper and lower water column occurs at a depth of 325 m because a temperature minimum is usually apparent near this depth in winter temperature profiles which is the basis for assuming hydrothermal fluxes are confined to greater depths (McManus and others 1992 McManus and others 1993) and because thermistors were located at target depths of 300 and 350 m For the historical period 2000ndash2006 such events are evident in the lower heat content in the early winter of 2004 and 2006 (fig 14) and a smaller event is evident in early winter 2002 The ability of 1DDV to simulate the heat content in both the upper water column (above 325 m) and lower water column as calculated from the thermistors was good as indicated by small overall bias and CVRMSE between 001 and 005
One-Dimensional Lake Temperature Modeling 21
tac16_1054_fig 12
Dept
h be
low
wat
er s
urfa
ce i
n m
eter
s
0
400
500
600
300
200
100
October 2002
2 4 6
Temperature in degrees Celsius Diffusivity in square meters per second8 10 1 times 10-4 1 times 10-2
EXPLANATIONThermistorSimulated
Figure 12 Temperature and diffusivity profiles over the autumn to spring months of 2002ndash2003 when no deep ventilation of the water column occurred Crater Lake Oregon Animation in AVI format is available for download at httpdxdoiorg103133sir20165052
tac16_1054_fig 13
Dept
h be
low
wat
er s
urfa
ce i
n m
eter
s
0
400
500
300
200
100
October 2003
2 4 6Temperature in degrees Celsius Diffusivity in square meters per second
8 10 1 times 10-4 1 times 10-2
600
EXPLANATIONThermistorSimulated
Figure 13 Temperature and diffusivity profiles over the autumn to spring months of 2003ndash2004 when deep ventilation of the water column occurred Crater Lake Oregon Animation in AVI format is available for download at httpdxdoiorg103133sir20165052
22 Simulation of Deep Ventilation in Crater Lake Oregon 1951ndash2099
Table 6 Goodness-of-fit statistics for heat content calculated from temperatures simulated by the 1-dimensional deep ventilation model of Crater Lake Oregon 1994ndash2011
[RMSE Root-mean-square error NRMSE Normalized root-mean-square error (RMSE divided by the range of the observations) CVRMSE Coefficient of variation of the root-mean-square error (RMSE divided by the mean of the observations) Abbreviations J joule m meter]
PeriodDepth range
(m)
Bias (times1015 J)
RMSE (times1015 J)
NRMSE CVRMSE
1994ndash1999 0ndash325 083 1130 007 005325ndash550 041 100 021 001
2000ndash2006 (calibration)
0ndash325 073 959 008 004325ndash550 110 131 025 002
2008ndash2011 0ndash325 011 1180 010 005325ndash550 -042 054 016 001
tac16-1054_fig14
1995 2000 2005 2010
15 times 1017
20 times 1017
25 times 1017
30 times 1017
Upper 325 meters
Heat
con
tent
in
joul
es
65 times 1016
70 times 1016
75 times 1016
80 times 1016
Lower 325minus550 meters
Simulated
Measured
EXPLANATION
Figure 14 Upper and lower water-column heat content calculated from thermistors and from temperatures simulated by the 1-dimensional deep ventilation model of Crater Lake Oregon during the calibration years 2000ndash2006 and the validation years 1994ndash1999 and 2008ndash2011
The NRMSE values were larger for the lower water column in all three historical periods between 016 and 025 as compared to 007 to 010 for the upper water column (table 6) indicating the challenge of simulating the relatively small
changes in lower water column heat Most importantly however the model correctly simulated the historical series of deep ventilation events capturing the occurrences in each of 2002 2004 and 2006 (fig 14)
One-Dimensional Lake Temperature Modeling 23
Dynamic Reservoir Simulation Model
The hydrothermal fluxes into Crater Lake occur below 350 m depth and have been estimated to be 10 Wm2 (McManus and others 1992) We modified this value to 14 Wm2 based on the change in heat content between early and late summer temperature profiles (see section Reference Diffusivity Profile) and used this modified value in the DYRESM simulations (This higher value was confirmed by the simulations done with DYRESM because the flux of 10 Wm2 was too small to properly capture the warming of deep water when deep ventilation does not occur) Further definition of the depth distribution of hydrothermal inputs has not been possible so the total inflow was assumed to be distributed evenly across the sediment area below 350 m depth To incorporate the diffuse hydrothermal fluxes the subsurface inflow function of DYRESM was used and it was assumed that the total hydrothermal flux comprised four discrete inflows between 350 and the maximum depth of 592 m (at 375 425 475 and 525 m depth) Each of the four discrete inflows integrated the hydrothermal flux of a 50 m depth range centered on the discrete depth Based on a constant hydrothermal heat flux of 14 Wm2 and a salinity flux of 5 (microgm2)s and a total volume of hydrothermal inflow of 17280 m3d (140 Ls McManus and others 1993) the rate of heat input (in joules per day) salt input (in milligrams per day) and hydrothermal inflow (in cubic meters per day) at each of the four depths was calculated based on the fraction of the total bottom surface area included within the range of depths that the discrete source represented For example the inflow at 375 m was based on the bottom surface area between 350 and 400 m depth The calculated temperature and salinity of the hydrothermal inflow applied at the point sources was 3473 degC and 073 practical salinity unit (PSU) respectively based on the total hydrothermal flux of heat and salinity and the total volume of inflow
CalibrationThe DYRESM parameter suite includes three parameters
that control mixing in the upper part of the water column shear production efficiency (ηk) potential energy mixing efficiency (ηp) and wind stirring efficiency (ηs) Two other parameters influence mixing below the epilimnion diffusivity at the top of the bottom boundary layer (KBBL) and a coefficient of proportionality between eddy diffusivity and lake number (CLN our notation) The minimum and maximum layer thicknesses were specified as 2 and 10 m respectively Although calibration of the model is not deemed necessary (Imerito 2014) the model tended toward a deeper-than-observed surface mixed layer in the summer (figs 15 and 16) Several model runs were made in an attempt to optimize the model parameters for Crater Lake but substantial quantitative improvement was not obtained so the DYRESM model was run with default parameter values (table 7) for the mid time period roughly 8 years from September 1999 to August 2007 using the parameters supplied with the model
The performance of the model in reproducing the temperature measured at the thermistors was generally good in the upper 100 m of the water column during the winter months which are most important for this study In summer the model reproduced surface temperature well but over-estimated the temperature at 20 m depth indicating too much entrainment at the base of the mixed layer (fig 15) The maximum values of bias RMSE and CVRMSE were at 20 m depth (039 degC 129 degC and 024 respectively table 8) At the base of and below the seasonal thermocline between 100 and 200 m the model simulated the rapid changes in temperature associated with a deepening mixed layer in the cooling phase of the seasonal cycle but the overall variation in measured temperature was small and the extreme values were not well-captured (fig 16) In the deep water column the rapid decreases in temperature of a fraction of a degree associated with deep ventilation events were not well-simulated indeed at 530 m there was no change in simulated temperature during the calibration period indicating no simulated exchange with water from above (fig 16) Below 350 m NRMSE varied between 030 and 152 (table 8)
The ability of DYRESM to simulate the heat content in the upper 325 m as calculated from the thermistors was good as indicated by the NRMSE and CVRMSE values of 010 and 005 respectively (table 8) although a summer positive bias is apparentmdasha result of the thermocline being simulated to be too deep but also an indication that the input of heat at the water surface was too large Sensitivity analyses demonstrated that the surface heat budget was sensitive to the cloud cover calculation and the resulting atmospheric longwave radiation calculation (necessary because longwave radiation was not directly measured) The Swinbank (1963) calculation used in DYRESM may not adequately account for the altitude dependence of atmospheric emissivity on atmospheric water vapor (Marty and others 2002 Ruckstuhl and others 2007 Yang and others 2010) resulting in an overestimation of longwave radiation
As can be inferred from the comparison of model simulation results to the deepest thermistors DYRESM lacks the ability to simulate the dynamics of the heat content in the lower water column (fig 17) The NRMSE of 032 (table 8) indicates that the simulation of heat content in the lower water column also was quite good but the statistic does not capture the fact that DYRESM does not simulate the small but important abrupt decreases in lower water-column heat content associated with deep ventilation events which are clearly seen in figure 17 Thus DYRESM and 1DDV were both able to simulate temperature and heat content in the upper water column with acceptable accuracy However the assumptions on which DYRESM depends are not able to capture the thermobaric instability that is crucial for deep ventilation in the late winter making this model inappropriate to investigate the phenomenon
24 Simulation of Deep Ventilation in Crater Lake Oregon 1951ndash2099
Table 8 Goodness of fit statistics for the DYnamic REservoir Simulation Model of Crater Lake Oregon 1999ndash2007
[RMSE root-mean-square error NRMSE normalized root-mean-square error (RMSE divided by the range of the observations) CVRMSE coefficient of variation of the root-mean-square error (RMSE divided by the mean of the observations) Abbreviations m meter degC degrees Celsius J joule]
Temperature at thermistor depths
Depth (m)
Bias (degC)
RMSE (degC)
NRMSE CVRMSE
20 039 129 014 02440 017 059 010 01350 012 045 009 01070 010 038 010 00990 004 032 011 008
110 000 030 013 008130 004 033 017 009150 009 031 020 008170 014 027 020 007200 016 023 022 006250 019 023 031 006300 006 017 032 005350 -012 012 037 003400 -010 011 042 003460 016 034 152 009530 -008 009 030 002
Heat content
Depth range
(m)
Bias (times1015 J)
RMSE (times1015 J)
NRMSE CVRMSE
0ndash325 516 1224 010 005325ndash550 059 166 032 002
Table 7 DYnamic REservoir Simulation Model default parameter values
[Abbreviations m meter s second ndash no units]
Parameter Value Units
ηk 006 ndashηp 020 ndashηs 040 ndash
KBBL 14times10-5 m2sCLN 20000 ndash
One-Dimensional Lake Temperature Modeling 25
tac16-1054_fig15
October 15 2001
Dept
h be
low
wat
er s
urfa
ce i
n m
eter
s
500
400
300
200
100
0
500
400
300
200
100
0
January 15 2002 April 15 2002 July 01 2002
2 4 6 8 10 12 14 2 4 6 8 10 12 14 2 4 6 8 10 12 14 2 4 6 8 10 12 14
October 15 2002 January 15 2003 April 15 2003
3minusday average temperature in degrees Celsius
July 01 2003
EXPLANATIONMeasured
Simulated
Figure 15 Comparison of selected measured temperature profiles to profiles simulated with the DYnamic REservoir Simulation Model Crater Lake Oregon 2001ndash2003
26 Simulation of Deep Ventilation in Crater Lake Oregon 1951ndash2099
tac16-1054_fig16
0
5
10
15
202 meters
Tem
pera
ture
in
degr
ees
Cels
ius
10
12
14
1420 meters
30
25
35
40
45150 meters
2000 2002 2004 200632
34
36
38
40
42250 meters
2000 2002 2004 200633
34
35
36
37
38
39300 meters
2000 2002 2004 20062008 2008 200834
35
36
37400 meters
2
0
4
6
8
EXPLANATION
Measured
Simulated
Figure 16 Comparison of measured temperature to temperature simulated with the DYnamic REservoir Simulation Model Crater Lake Oregon 1999ndash2007
One-Dimensional Deep Ventilation Model Validation
Validation focused on the simulation of heat content Using the selected combination of model parameters the 1DDV model was run over the two remaining historical periods for which data were available August 13 1994 to August 24 1999 and August 25 2008 to July 5 2011 Heat content calculations indicate that the model did a good job of capturing upper lake heat content in both validation periods with an NRMSE less than or equal to 010 and CVRMSE equal to 005 (table 6) The model performance in simulating heat content in the lower lake was moderately good For the earlier 1994ndash1999 period the heat content calculated from simulated temperature in the lower depths resulted
in an NRMSE of 021 (CVRMSE 001) when compared to heat content calculated from thermistor data For the later 2008ndash2011 period the heat content calculated from simulated temperature in the lower depths resulted in an RMSE of 016 (CVRMSE 001) It is noteworthy that the model appropriately simulated deep ventilation in all but 1 year in which it was observed (fig 14 a strong deep ventilation event was simulated in 1997 when it was not observed as opposed to 1998 when it was) and the poor correlation from 1994 to 1999 is largely attributable to less-than-observed deep ventilation in 1995 and more-than-observed deep ventilation in 1997 Because the deep lake retains a memory of past years discrepancies between observed and simulated deep ventilation can propagate For example the simulation of more-than-observed deep ventilation in 1997 prevented the
One-Dimensional Lake Temperature Modeling 27
tac16-1054_fig17
15 times 1017
25 times 1017
Upper (0minus325 meters)
Heat
con
tent
in
joul
es
2000 2001 2002 2003 2004 2006 2007 2008200568 times 1016
72 times 1016
20 times 1017
30 times 1017
70 times 1016
74 times 1016
76 times 1016Lower (325minus550 meters)
Year
EXPLANATION
Measured
Simulated
Figure 17 Upper and lower water-column heat content calculated from thermistors and from temperatures simulated by the DYnamic REservoir Simulation Model of Crater Lake Oregon 1999ndash2007
simulation of the 1998 event by decreasing the temperature difference between the surface and the bottom at the time when deep ventilation should occur resulting in a stable temperature profile
The final validation of the calibrated model was in the form of identifying the occurrence of deep ventilation events A simple metric used to compare measured thermistor data and simulated values was the difference in lower water column heat content between December and June of each simulation winterndashspring season (table 9) There is a significant (p = 003) positive Pearson correlation of 034 between the measured and simulated change in lower water column heat content even with the improper simulation of an event in 1997 and resultant lack of a simulated event in 1998 (fig 18) Most importantly for the purpose of this analysis the frequency of deep ventilation events was 05 for both the measurements and simulations
Table 9 Change in heat content from December to June in the lower water column of Crater Lake Oregon 1994ndash2011
[Lower water column defined as depths greater than 325 m Shaded values indicate cooling bolded values indicate deep mixing events defined as cooling greater than 9 times1014 joules Abbreviations 1DDV 1-dimensional deep ventilation mode J joule m meter]
YearsMeasured
(times1015 J)
1DDV simulation
(times1015 J)
1994ndash1995 -260 -1161995ndash1996 004 -0481996ndash1997 045 -1971997ndash1998 -126 -0041998ndash1999 -153 -1522000ndash2001 042 1042001ndash2002 -025 -0762002ndash2003 -006 0502003ndash2004 -202 -1372004ndash2005 082 0992005ndash2006 -206 -1982008ndash2009 -099 -1462009ndash2010 -057 -0672010ndash2011 -099 -175
28 Simulation of Deep Ventilation in Crater Lake Oregon 1951ndash2099
Results of Future Climate ScenariosThe CNRM-CM5 model projected the mildest air
temperature scenario of the three GCMs considered and this translated to the mildest scenario in terms of the changes to water-column stratification and the frequency of deep ventilation (fig 19AndashB table 10) Over the 149 years of simulation spanning the baseline period through 2099 the RCP45 scenario projected a transition from deep-water temperatures in the range of 33 to 38 degC during the baseline period (1951ndash2005) to a range of 35 to 43 degC between 2050 and 2099 and a deepening of the 43 degC isotherm (fig 19A) The minimum compensation depth characterizing days when deep ventilation occurred in each year progressively shallowed as an effect of the progressive warming of the entire water column profile which was caused by increasing surface temperatures As the entire profile warmed and shifted farther away from the temperature of maximum density curve the
tac16-1054_fig18
EXPLANATION
-1 times 1015 1 times 1015
-1 times 1015
0
0
1 times 1015
2 times 1015
Thermistor change in heat content in joules
Sim
ulat
ed c
hang
e in
hea
t con
tent
in
joul
es
2 times 1015
Threshold for deep ventilation events
Deep ventilation event observed
Deep ventilation event not observed
Incorrect
Correct Incorrect
Correct
Figure 18 Comparison of the change in heat content between December and June as calculated from thermistor data and as simulated with the 1-dimensional deep ventilation model of Crater Lake Oregon 1994ndash1999 2000ndash2006 and 2008ndash2010 Dashed lines represent the 9times1014 joule threshold for the change in heat content used to identify deep ventilation events Quadrants indicate which years were correctly and incorrectly simulated by the 1-dimensional deep ventilation model
minimum compensation depth decreased from as deep as 250 m early in the baseline period to no deeper than 50 m after 2070 until the point when the entire water column was always greater than 4 degC and the compensation depth could no longer be defined After 2050 there was no compensation depth in most years because temperature in the surface mixed layer did not go below 4 degC (table 1 fig 20AndashB) The RCP85 scenario projected water column temperatures greater than 43 degC throughout the water column after 2080 and no years of minimum surface mixed layer temperature below 4 degC after 2065 (figs 19B and 20B)
The most extreme projections came from the HadGEM2-ES model (figs 19EndashF) Over the 149 years of simulation the RCP45 scenario projected a transition from deep-water temperatures in the range of 33 to 38 degC during the baseline period to a range of 38 to greater than 43 degC between 2050 and 2099 and a deepening of the 43 degC isotherm (fig 19E) The temperature in the surface mixed layer was less than 4 degC in only 1 year after 2070 The RCP85 scenario projected water column temperatures greater than 43 degC throughout the water column after 2060 and no years of minimum surface mixed layer temperature less than 4 degC after 2045 (figs 19 and 20EndashF) The HadGEM2-ES RCP85 temperature projections lead the CNRM-CM5 RCP85 projections by about 20 years
Once the surface water no longer decreases to below 4 degC in winter there is no mechanism for thermobaric instability and the vertical extent of mixing is limited to the depth to which convective mixing can penetrate from the surface Convective mixing to great depth can still occur when the surface water gets colder than the rest of the water column and deep waters have had enough time to warm from hydrothermal inputs however this occurs less frequently in future simulations Such events are evidenced in figure 19 by the appearance of vertical profiles of cooler water between 4 and 43 degC The model shows such deep convective mixing events occurring infrequently after 2070 but they are evident in the RCP85 scenarios in 2078 (CNRM-CM5) 2086 (HadGEM2-CC) and 2050 (HadGEM2-ES) (figs 19B D F figs 20B D F)
The frequency of deep ventilation during the baseline period and in alternative future climates is quantified in table 11 CNRM-CM5 is again the model that projected the most moderate changes of the three GCMs considered Based on a threshold for change in lower water-column heat content of -9times1014 J the projected change in the frequency of deep ventilation under the RCP45 scenario went from 33 percent during the baseline period to 31 percent in the future conditions Under the RCP85 scenario the projection was a change in frequency from 33 percent during the baseline period to 33 percent in the first 55 years of future conditions to 18 percent in the second 55 years
Results of Future Climate Scenarios 29Ta
ble
10
Line
ar re
gres
sion
mod
els
of u
pper
and
low
er w
ater
-col
umn
heat
con
tent
in C
rate
r Lak
e a
s ca
lcul
ated
from
tem
pera
ture
s si
mul
ated
by
the
1-di
men
sion
al d
eep
vent
ilatio
n m
odel
for
bas
elin
e an
d fu
ture
con
ditio
ns fr
om th
ree
gene
ral c
ircul
atio
n m
odel
s an
d tw
o re
pres
enta
tive
conc
entra
tion
path
way
s
[Cha
nge
in a
ir te
mpe
ratu
re C
alcu
late
d ba
sed
on th
e lo
ng-te
rm tr
end
over
the
entir
e 93
yea
rs o
f fut
ure
clim
ate
(fig
4)
RM
SE R
oot-m
ean-
squa
re e
rror
Cha
nge
in w
ater
tem
pera
ture
C
alcu
late
d ba
sed
on th
e lin
ear t
rend
in th
e ra
te o
f cha
nge
in h
eat c
onte
nt fo
r the
upp
er a
nd lo
wer
wat
er c
olum
n re
spec
tivel
y A
bbre
viat
ions
m m
eter
degC
deg
ree
Cel
sius
J j
oule
Wm
2 w
att
per s
quar
e m
eter
]
Gen
eral
ci
rcul
atio
n m
odel
Chan
ge
in a
ir
tem
pera
ture
(deg
C)
Upp
er w
ater
col
umn
(0ndash3
25 m
)Lo
wer
wat
er c
olum
n (3
25ndash5
90 m
)
Mea
n da
ily
heat
co
nten
t (times
1017
J)
Rate
of c
hang
e in
he
at c
onte
nt
RMSE
(times
1017
J)
Chan
ge
in w
ater
te
mpe
ratu
re
(degC)
Mea
n da
ily
heat
co
nten
t (times
1016
J)
Rate
of c
hang
e in
he
at c
onte
nt
RMSE
(times
1016
J)
Chan
ge
in w
ater
te
mpe
ratu
re
(degC)
Line
ar tr
end
(times10
17
Jde
cade
)
Nor
mal
ized
by
are
a (W
m2 )
Line
ar tr
end
(times10
16
Jde
cade
)
Nor
mal
ized
by
are
a (W
m2 )
Base
line
cond
ition
s 1
951ndash
2005
CN
RM
-CM
51
382
290
034
026
032
90
327
250
009
002
016
002
Had
GEM
2-C
C0
192
370
008
006
032
30
077
26-0
007
-00
10
15-0
02
Had
GEM
2-ES
-03
02
330
020
015
032
10
197
190
035
006
016
009
Firs
t 55
year
s of
futu
re c
ondi
tions
200
6ndash20
61 r
epre
sent
ativ
e co
ncen
tratio
n pa
thw
ay 4
5
CN
RM
-CM
51
172
560
036
027
032
70
347
660
053
009
029
014
Had
GEM
2-C
C1
682
610
084
063
033
50
807
690
174
030
021
046
Had
GEM
2-ES
144
265
007
60
570
333
073
779
010
10
170
270
27
Last
55
year
s of
futu
re c
ondi
tions
204
5ndash20
99 r
epre
sent
ativ
e co
ncen
tratio
n pa
thw
ay 4
5
CN
RM
-CM
51
172
770
062
047
035
80
607
970
088
015
035
023
Had
GEM
2-C
C1
682
910
072
054
036
60
698
360
183
031
039
048
Had
GEM
2-ES
144
297
007
20
540
368
068
842
015
80
270
340
42
Firs
t 55
year
s of
futu
re c
ondi
tions
200
6ndash20
61 r
epre
sent
ativ
e co
ncen
tratio
n pa
thw
ay 8
5
CN
RM
-CM
53
312
600
072
054
033
80
687
730
127
022
031
033
Had
GEM
2-C
C3
012
730
124
093
036
61
187
840
212
036
031
056
Had
GEM
2-ES
301
276
014
21
070
339
136
807
033
50
570
320
88
Last
55
year
s of
futu
re c
ondi
tions
204
5ndash20
99 r
epre
sent
ativ
e co
ncen
tratio
n pa
thw
ay 8
5
CN
RM
-CM
53
313
220
238
179
039
52
288
840
445
076
044
117
Had
GEM
2-C
C3
013
370
193
145
040
81
849
360
463
079
065
122
Had
GEM
2-ES
301
345
019
21
440
363
183
998
060
01
020
371
58
30 Simulation of Deep Ventilation in Crater Lake Oregon 1951ndash2099
tac1
6-10
54_f
ig19
ab
Depth below water surface in metersA
Sim
ulat
ed te
mpe
ratu
re C
NRM
minusCM
5 RC
P45
sce
nari
o 19
51ndash2
099
500
400
300
200
1000
End
of b
asel
ine
peri
od
Com
pens
atio
n de
pth
500
400
300
200
1000 19
5119
7119
9120
1120
3120
5120
7120
91
B S
imul
ated
tem
pera
ture
CN
RMminusC
M5
RCP8
5 s
cena
rio
1951
ndash209
9
1215
265
315
365
415
465
515
565
615
665
715
20
EXPL
AN
ATIO
NTe
mpe
ratu
re i
nde
gree
s Ce
lsiu
s
Figu
re 1
9
Tem
pera
ture
of C
rate
r Lak
e O
rego
n s
imul
ated
with
the
1-di
men
sion
al d
eep
vent
ilatio
n m
odel
for
bas
elin
e an
d fu
ture
con
ditio
ns fr
om th
ree
gene
ral
circ
ulat
ion
mod
els
and
two
repr
esen
tativ
e co
ncen
tratio
n pa
thw
ays
(A) C
NRM
-CM
5 R
CP4
5 (B
) CN
RM-C
M5
RCP
85
(C) H
adGE
M2-
CC R
CP4
5 (D
) Had
GEM
2-CC
RC
P85
(E)
Had
GEM
2-ES
RCP
45
(F) H
adGE
M2-
ES R
CP8
5
Results of Future Climate Scenarios 31
tac1
6-10
54_f
ig19
cd
Depth below water surface in meters
500
400
300
200
1000
C S
imul
ated
tem
pera
ture
Had
GEM
2minusCC
RCP
45
scen
ario
195
1ndash20
99
500
400
300
200
1000 19
5119
7119
9120
1120
3120
5120
7120
91
D S
imul
ated
tem
pera
ture
Had
GEM
2minusCC
RCP
85
scen
ario
195
1ndash20
99
End
of b
asel
ine
peri
od
Com
pens
atio
n de
pth
1215
265
315
365
415
465
515
565
615
665
715
20
EXPL
AN
ATIO
NTe
mpe
ratu
re i
nde
gree
s Ce
lsiu
s
Figu
re 1
9mdash
Cont
inue
d
32 Simulation of Deep Ventilation in Crater Lake Oregon 1951ndash2099
tac1
6-10
54_f
ig19
ef
Depth below water surface in meters
500
400
300
200
1000
E S
imul
ated
tem
pera
ture
Had
GEM
2minusES
RCP
45
scen
ario
195
1ndash20
99
500
400
300
200
1000 19
5119
7119
9120
1120
3120
5120
7120
91
F S
imul
ated
tem
pera
ture
Had
GEM
2minusES
RCP
85
scen
ario
195
1ndash20
99
End
of b
asel
ine
peri
od
Com
pens
atio
n de
pth
1215
265
315
365
415
465
515
565
615
665
715
20
EXPL
AN
ATIO
NTe
mpe
ratu
re i
nde
gree
s Ce
lsiu
s
Figu
re 1
9mdash
Cont
inue
d
Results of Future Climate Scenarios 33
tac16-1054_fig20abcd
0
2
4
6
8A CNRMminusCM5 RCP45
Tem
pera
ture
in
degr
ees
Cels
ius
20202000 2040 2060 2080 2100
0
2
4
6
8B CNRMminusCM5 RCP85
0
2
4
6
8
0
2
4
6
8
C HadGEM2minusCC RCP45
D HadGEM2minusCC RCP85
Surface (5 meters)
Bottom (554 meters)
4 degrees Celsius
EXPLANATION
Figure 20 Surface and bottom temperatures of Crater Lake Oregon simulated with the 1-dimensional deep ventilation model for baseline and future conditions from three general circulation models and two representative concentration pathways (A) CNRM-CM5 RCP45 (B) CNRM-CM5 RCP85 (C) HadGEM2-CC RCP45 (D) HadGEM2-CC RCP85 (E) HadGEM2-ES RCP45 (F) HadGEM2-ES RCP85
34 Simulation of Deep Ventilation in Crater Lake Oregon 1951ndash2099
tac16-1054_fig20ef
Tem
pera
ture
in
degr
ees
Cels
ius
20202000 2040 2060 2080 2100
0
2
4
6
8E HadGEM2minusES RCP45
0
2
4
6
8F HadGEM2minusES RCP85
Surface (5 meters)
Bottom (554 meters)
4 degrees Celsius
EXPLANATION
Figure 20mdashContinued
The most extreme changes were projected by the HadGEM2-ES model which projected a change in the frequency of deep ventilation under the RCP45 scenario from 55 percent during the baseline period (the closest to that observed during the historical period) to 36 percent in the first 55 years of future conditions to 25 percent in the second 55 years Under the RCP85 scenario the projection was a change in frequency from 55 percent during the baseline period to 31 percent in the first 55 years of future conditions to 13 percent in the second 55 years Based on a threshold for change in lower water-column heat content of -9 times1014 J the HadGEM2-CC GCM simulated a frequency of 44 percent during the baseline period This GCM projected a change in frequency from 44 percent during the baseline period to 33 percent in RCP45 future conditions for all years and a decrease in frequency to 27 percent in the first 55 years and to 18 percent in the second 55 years of the RCP85 scenario future conditions
Another way to evaluate mixing is in terms of the volume replaced during ventilation events When the replaced volume was averaged over decades it was essentially unchanged under future conditions projected by all GCMS in the RCP45 scenario (table 12) The CNRM-CM5 and HadGEM2-CC models simulated that the replaced volume actually increased by about 20 percent in the last 55 years of the RCP45 scenario
Previous estimates of the age of deep water have been 2ndash4 years based on dissolved-oxygen concentration (McManus and others 1993) 1ndash2 years based on tritium (Simpson 1970) and 32 years based on chlorofluorocarbons (Weiss 1992) In our simulations residence time in the deep lake stayed nearly the same or slightly decreased between baseline conditions and the last 55 years of the RCP45 scenario (from 252 to 214 years HadGEM2-CC GCM) Projected changes under the RCP85 scenario were substantial and all models predicted residence times doubling between the baseline conditions which ranged 188 to 290 years and the last 55 years of the RCP85 scenario which ranged 402 to 432 years These changes in the average age of the deep water underscore the fact that the expected changes in a future climate are important in terms of both the frequency of mixing events and the total volume mixed over time
The upper (0ndash325 m depth) and lower (325ndash550 m depth) water column (UWC and LWC) heat content were relatively stable over the 55-year baseline period and increased most rapidly in the last 50 years of each future climate simulation (fig 21) The annual and interannual variability in the UWC heat content remained relatively stable through 100 years of future climate whereas the interannual variability in the LWC heat content increased markedly in future climate scenarios
Results of Future Climate Scenarios 35
Table 11 Frequency of deep ventilation during the historical measurement period and during the baseline and future conditions periods from three general circulation models and two representative concentration pathways Crater Lake Oregon
[Frequency Based on a threshold of -9 times1014 J for the change in lower water-column heat content between December 1 and June 1 of each winter-spring season Mean Mean decrease in heat content in a deep ventilation year Abbreviations 1DDV 1-dimensional deep ventilation model J joule]
Time series Frequency Mean
(times1015 J)
Historical period of observations 1995ndash1999 2001ndash2006 2009ndash2011
Measured 050 -164Simulated with 1DDV 050 -160
Baseline conditions 1951ndash2005
CNRM-CM5 033 -221HadGEM2-CC 044 -195HadGEM2-ES 055 -188
First 55 years of future conditions 2006ndash2061representative concentration pathway 45
CNRM-CM5 031 -347HadGEM2-CC 033 -305HadGEM2-ES 036 -353
Last 55 years of future conditions 2045ndash2099representative concentration pathway 45
CNRM-CM5 031 -387HadGEM2-CC 033 -297HadGEM2-ES 025 -422
First 55 years of future conditions 2006ndash2061representative concentration pathway 85
CNRM-CM5 033 -338HadGEM2-CC 027 -367HadGEM2-ES 031 -365
Last 55 years of future conditions 2045ndash2099representative concentration pathway 85
CNRM-CM5 018 -528HadGEM2-CC 018 -275HadGEM2-ES 013 -527
Table 12 Replacement volume and residence time in the deep lake determined during baseline conditions (1951ndash2005) and future conditions (2045ndash2099) from three general circulation models and two representative concentration pathways at Crater Lake Oregon
[Volume replaced Below 325 meters depth Fraction replaced Based on a deep lake volume of 498 km3 Residence time Reciprocal of fraction replaced Abbreviation km3yr cubic kilometer per year]
GCMVolume replaced
(km3yr)Fraction replaced
(per year)Residence time
(years)
Baseline RCP45 RCP85 Baseline RCP45 RCP85 Baseline RCP45 RCP85
CNRM-CM5 172 207 115 034 041 023 290 241 432HadGEM2-CC 198 233 124 040 047 025 252 214 402HadGEM2-ES 265 255 122 053 051 025 188 195 408
36 Simulation of Deep Ventilation in Crater Lake Oregon 1951ndash2099
Figure 21 Time series showing heat content in Crater Lake Oregon as calculated from temperatures simulated by the 1-dimensional deep ventilation model for baseline and future conditions from three general circulation models and two representative concentration pathways (A) Upper water-column heat content during the baseline period (B) upper water-column heat content during the period of future climate RCP45 scenario (C) upper water-column heat content during the period of future climate RCP85 scenario (D) lower water-column heat content during the baseline period (E) lower water-column heat content during the period of future climate RCP45 scenario (F) lower water-column heat content during the period of future climate RCP85 scenario
tac16-1054_fig21
70 times 1016
80 times 1016
90 times 1016
10 times 1017
11 times 1017
15 times 1017
20 times 1017
25 times 1017
30 times 1017
35 times 1017
40 times 1017
45 times 1017
50 times 1017
Upper water column (0minus325 meters)A
1950 1970 1990 20101960 1980 2000 2020 20602040 2080 2100
Lower water column (325minus550 meters)D
B
E
C
F
20202000 2000 20602040 2080 2100
RCP45 RCP85
RCP45
Baseline
Baseline RCP85Heat
con
tent
in
joul
es
CNRMminusCM5
HadGEM2minusCC
HadGEM2minusES
EXPLANATION
Taking the CNRM-CM5 GCM as an example the UWC heat content increased at a rate of 339times1015 J (15 percent) per decade during the baseline period in response to 0025 degC per year of warming in annual air temperature (table 10 figs 4A and 21) In the future scenarios UWC heat content increased 357times1015 J (14 percent) and 623times1015 J (22 percent) per decade in the first and second 55 years of the RCP45 scenario respectively and 715times1015 J (28 percent) and 238times1016 J (74 percent) per decade in the first and second 55 years of the RCP85 scenario respectively The RMSE around those slopes was largely consistent between 329times1016 (baseline conditions) and 395times1016 J (second 55 years of future conditions RCP85) Thus the interannual and annual variability of the UWC heat content is not much changed in the future scenarios even as the heat content rises
In contrast the LWC heat content again considering CNRM-CM5 as an example increased 529times1014 J (069 percent) and 877times1014 J (11 percent) per decade in the first and second 55 years of the RCP45 scenario respectively and 127times1015 J (16 percent) and 445times1015 J (50 percent) per decade in the first and second 55 years of the RCP85 scenario respectively (table 10) The RMSE around the regression line increased notably between the baseline conditions (155times1015 J) and the second 55 years of future climate scenarios (348times1015 J or 444times1015 J) reflecting longer periods between deep ventilation events and increasingly dramatic decreases in the lower water column heat content when an event occurred (fig 21) The threshold for thermobaric instabilitymdashlake-surface water temperature slightly colder than 4 degCmdashremains the same in
Comparisons to Future-Climate Studies of Other Lakes 37
a future climate but the frequency at which that threshold is met decreases (table 1) Because the heat content in the deep lake continues to steadily increase in response to hydrothermal inputs and the frequency of meeting the surface temperature threshold for deep ventilation caused by thermobaricity decreases the difference between the deep lake temperature and the 4 degC threshold for deep ventilation becomes greater through time As a result the decreases in heat content related to deep ventilation events are less frequent but are larger when they occur In the last 20 years of the RCP45 scenario of the HadGEM2-CC and HadGEM2-ES models and the last 40ndash50 years of RCP85 scenario for all GCMs the system warms to the point that the entire water column is greater than the 4 degC threshold (table 1) and thermobaric instability cannot occur In these periods the deep ventilation events are convectively driven and only occur when the surface temperatures are less than the deep temperatures which is infrequent During these events the colder surface temperatures are denser than the deep waters and given sufficient wind energy are able to mix all the way to the bottom of the lake (figs 20B D F) Thus the lake is expected to undergo a shift in its thermal regime progressively transitioning from dimictic to warm monomictic to oligomictic
The rate of increasing heat content in the UWC and LWC can be compared to the approximately 13times1016 J per decade of heat (based on 14 W m-2 over the bottom surface area below 350 m) that is put into the deep lake by hydrothermal inflows The rate of change of heat content in the UWC exceeds this hydrothermal flux only in the second 55 years of the RCP85 scenarios (all three GCMs) and in the first 55 years of the RCP85 scenarios as projected by the HadGEM2-ES model (table 10) This implies that during baseline conditions and with one exception during the first 55 years of future conditions the lower water column is a source of heat to the upper water column and the atmosphere is a heat sink for the lake Only in the second 55 years of the more extreme scenario are air temperatures high enough to overcome the hydrothermal fluxes and turn the atmosphere into a source of heat to the lake
Comparisons to Future-Climate Studies of Other Lakes
All of the future climate scenarios that were used to simulate the daily water temperature profile in Crater Lake through the year 2099 projected increased water temperature throughout the water column and a decreased frequency of deep ventilation events Under the assumption that the realized future conditions will be within the range of outcomes encompassed by the six scenarios used in this studymdashthree GCMs and two representative concentration pathwaysmdashthe
long-term average temperature in the upper water column (defined to be above 325 m depth) of Crater Lake can be expected to increase between 094 and 319 degC between 2006 and 2099 and the corresponding increase in the hypolimnion (below 325 m depth) is between 037 and 246 degC In the RCP85 scenario all GCMs show the entire water column warming to greater than 43 degC year-round after 2080 and in the RCP45 scenario all GCMs show the entire water column warming to greater than 35 degC year-round after 2080
Studies of the effects of climate change on temperate lakes worldwide share several conclusions regarding the expected changes in the epilimnion First water temperatures will increase in proportion to air temperature and generally the increase is greater than 50 percent (Peeters and others 2002 Livingstone 2003 Hampton and others 2008) and as much as nearly 100 percent (Coats and others 2006 Peeters and others 2007 Perroud and Goyette 2010) of the increase in air temperature depending on how it is measuredmdashmonthly seasonal or annual means a long-term average daily minimums or daily means Second the annual number of days of stratification will increase and third annual periods of ice cover will shorten in high-latitude lakes (Robertson and Ragotzkie 1990 Hostetler and Giorgi 1995 Elo and others 1998 Hostetler and Small 1999) Overall these and other studies have concluded that in a future climate the epilimnion of lakes will respond quickly and in direct and high proportion to warmer air temperature and the accompanying changes in other meteorological drivers such as longwave radiation and evaporation
Conclusions regarding the temperature in the hypolimnion of lakes are less consistent which is not surprising particularly because the thermal mass per surface area varies with the overall depth of the lake and the climate setting of the lake is important The hypolimnion in temperate lakes that remain dimictic and reliably inverse stratify in winter are not expected to retain a climate signal or warm in a future climate (Butcher and others 2015) In monomictic lakes deep enough to establish a seasonal thermocline the influence of the atmosphere is transmitted to the hypolimnion by means of mixing with the epilimnion outside of the stratified season therefore in lakes that reliably mix at least once per year the hypolimnion receives the climate signal embedded in epilimnion temperatures prior to the onset of stratification and carries it through the stratified season to the next autumn or spring mixing event resulting in a trend in the annual average hypolimnion temperature that reflects the climate signal rather than seasonal fluctuations (Dokulil and others 2006) Deep lakes that do not mix every year hold a long-term ldquomemoryrdquo of the climate manifested as a slow interannual upward trend in temperature as heat diffuses from above punctuated periodically by rapid cooling when deep-mixing events occur resulting in a ldquosawtoothrdquo pattern in the temperature or heat content (Livingstone 1997 Ambrosetti and Barbanti 1999)
38 Simulation of Deep Ventilation in Crater Lake Oregon 1951ndash2099Ta
ble
13
Long
-term
cha
nges
in lo
wer
wat
er-c
olum
n te
mpe
ratu
re in
dee
p la
kes
(gt 1
00 m
dep
th)
base
d on
his
toric
al m
easu
rem
ents
and
mod
elin
g st
udie
s of
futu
re c
limat
e sc
enar
ios
[Low
er w
ater
col
umn
Gre
ater
than
325
m d
epth
for C
rate
r Lak
e e
quiv
alen
t to
the
hypo
limni
on fo
r oth
er la
kes
Abb
revi
atio
n G
CM
gen
eral
circ
ulat
ion
mod
el deg
C d
egre
es C
elsi
us m
met
er ~
app
roxi
mat
ely
ndash
no
data
na
not
app
licab
le]
Lake
Latit
ude
Elev
atio
n (m
)
Max
imum
de
pth
(m)
Low
er w
ater
col
umn
Air
tem
pera
ture
in
crea
se(deg
C)
Calc
ulat
ion
of la
ke
tem
pera
ture
His
tori
cal o
r fu
ture
per
iod
Refe
renc
eTe
mpe
ratu
re
chan
ge
(degC)
Tem
pera
ture
ch
ange
nor
mal
ized
by
air
tem
pera
ture
ch
ange
Lake
tem
pera
ture
cha
nges
bas
ed o
n hi
stor
ical
obs
erva
tions
Zuric
h47
3degN
406
136
028
ndash05
30
28ndash0
53
~1 (i
n th
e da
ily
min
imum
)M
axim
um d
ecad
al m
ean
incr
ease
ran
ge is
by
seas
on
1947
ndash199
8Li
ving
ston
e (2
003)
Taho
e139
1degN
189
850
00
640
85~0
75
(in th
e da
ily
min
imum
)Lo
ng-te
rm tr
end
slop
e19
70ndash2
002
Coa
ts a
nd o
ther
s (20
06)
Bai
kal
160
0ndash
ndash1
20Lo
ng-te
rm tr
end
slop
e at
25 m
dep
th19
45ndash2
005
Ham
pton
and
oth
ers
(200
8)
Lake
tem
pera
ture
cha
nges
bas
ed o
n m
odel
ing
stud
ies
of fu
ture
clim
ate
Gen
eva
464
degN37
230
92
20ndash2
33
053
ndash05
64
13R
ange
in m
onth
ly m
eans
naPe
rrou
d an
d G
oyet
te
(201
0)C
onst
ance
476
degN39
525
42
6ndash2
90
6ndash0
74
Ran
ge in
mon
thly
mea
nsna
Peet
ers a
nd o
ther
s (20
07)
Zuric
h47
3degN
406
136
14
035
4A
nnua
l ave
rage
naPe
eter
s and
oth
ers (
2002
)C
rate
r43
0degN
188
359
00
26ndash0
69
013
ndash02
42
02ndash2
91
(ran
ge o
f RC
P45
scen
ario
s and
3 G
CM
san
nual
mea
ns)
Bas
ed o
n tre
nd c
alcu
late
dov
er fi
rst a
nd la
st 5
5 ye
ars
2006
ndash209
9Th
is st
udy
123
ndash20
40
22ndash0
40
520
ndash57
2(r
ange
of R
CP8
5sc
enar
ios a
nd 3
GC
Ms
annu
al m
eans
)
Bas
ed o
n tre
nd c
alcu
late
dov
er fi
rst a
nd la
st 5
5 ye
ars
2006
ndash209
9
1Val
ues a
re a
ppro
xim
ate
Wat
er te
mpe
ratu
re in
crea
se b
ased
on
the
slop
e at
300
m (h
ypol
imni
on) i
n ta
ble
II o
f Coa
tes a
nd o
ther
s (20
06)
Air
tem
pera
ture
incr
ease
det
erm
ined
gra
phic
ally
from
figu
re 8
in C
oats
an
d ot
hers
(200
6)
Conclusions 39
It might be reasonable to assume that the climate signal would be more difficult to discern in the hypolimnion of deep lakes with a vast hypolimnetic volume to ldquodiluterdquo the climate signal from the much smaller epilimnetic volume however although it is challenging to compare studies because of the different methods of reporting results other studies of deep lakes do not necessarily support that assumption (table 13) For example Coats and others (2006) determined from more than 33 years of historical record that the hypolimnetic temperature increase in Lake Tahoe United States (500 m maximum depth) was approximately 81 percent of the increase in the epilimnetic temperature in response to an approximately 075 degC increase in air temperature A study of 52 years of record in Lake Zuumlrich Switzerland (136 m deep) determined that the hypolimnetic temperature increase was between 48 and 61 percent of the epilimnetic temperature increase in response to a similar increase in air temperature (about 1 degC Livingstone 2003) Among modeling studies of future climate all of which considered air temperature increases of about 4 degC the increase in hypolimnetic temperature was 73 percent of the increase in epilimnetic temperature (annual average) in Lake Zuumlrich (136 m maximum depth Peeters and others 2002) between 69 and 87 percent (range in monthly means) in Lake Constance Germany (254 m maximum depth Peeters and others 2007) and between 61 and 95 percent (range in monthly means) in Lake Geneva Switzerland (309 m maximum depth Perroud and Goyette 2010) This small set of studies suggests that on decadal time scales the hypolimnion even in the deepest lakes responds to the atmospheric changes at the surface
By comparison the projected deep hypolimnetic (below 325 m) temperature increase in Crater Lake is moderate particularly for the RCP45 scenarios The long-term mean hypolimnetic temperature increase as a percentage of the air temperature increase is projected in the range of 13ndash24 percent (corresponding to an absolute increase between 026 and 069 degC) across the three GCMs as compared to Lake Tahoe a lake of similar depth to Crater Lake for which the same percentage measured over 33 years of historical record was 85 percent (table 13 Coats and others 2006) However the projected increase in temperature shown in table 13 is based on long-term linear trends in heat content calculated over 55-year segments (table 10) and clearly underestimates both the rate of increase and the absolute increase in temperature projected to occur over shorter timeframes between less and less frequent deep ventilation events (fig 20) For the RCP85 scenarios the projected increase in temperature across the three GCMs is 22ndash40 percent of the air temperature increase or 123ndash204 degC Therefore the projected temperature increase in the hypolimnion as a percentage of the air temperature increase is bigger for the larger increase in air temperature projected by the RCP85 scenarios In these scenarios the lake becomes oligomictic much earlier and the temperature
in the deep hypolimnion increases in response to the strong hydrothermal heat flux Thus the primary effect of the atmospheric changes is not to provide more direct heat transfer to the hypolimnion in the future but rather to decrease cooling of the hypolimnion This decrease in cooling is bigger for the RCP85 scenario as indicated by a lower frequency of deep ventilation events
ConclusionsThe ventilation of the deepest water and cooling of
the hypolimnion in Crater Lake is initiated by thermobaric instability Over long time periods the largest effect of warmer surface temperatures is on the frequency at which the necessary conditions for thermobaric instability are established Currently the reverse stratification that enables deep ventilation events initiated by thermobaric instability occurs in about 50 percent of years All the future climate scenarios considered show that the number of days during which this condition is met will decrease in the future The least extreme scenario (CNRM-CM5 RCP45) shows this condition occurring nearly every year and on as many as 200 days in a year through 1990 then tapering off until the condition is met in less than 50 percent of years by 2100 usually on less than 100 days in a year Mostly as a consequence of this change in lake surface temperature the frequency of deep ventilation events is projected to decrease from about 50 percent in current conditions to 31 percent by 2100 The most extreme scenario considered in this study showed lake surface temperatures never cooling to less than 4 degC after 2050 and projected the frequency of deep ventilation events to be 13 percent by 2100 In these periods the deep ventilation events are convectively driven and occur infrequently only when the surface temperature is less than the deep temperature
The temperature gradient in the deep lake is nearly two orders of magnitude greater than adiabatic and would be unstable but for the hydrothermal inputs of salinity as well as heat (McManus and others 1993) In this application of 1DDV salinity was not simulated dynamically rather the salinity profile was held fixed at a historical average and therefore the stabilizing effect of salinity on density in the hypolimnion was maintained through time In a future climate in which deep ventilation occurred less frequently the salt content below approximately 350 m would increase with the increase in heat content as a result of hydrothermal inflows Simulations in this study which did not allow salt content to increase in proportion to heat content probably underestimated the stabilizing effect that salinity would have in the distant future For this reason the decreased frequency of deep ventilation of the deep lake in future climates could be greater than what was demonstrated in this study
40 Simulation of Deep Ventilation in Crater Lake Oregon 1951ndash2099
The hydrothermal inputs to the lake were estimated at 14 Wm2 40 percent higher than the previous estimate of 1 Wm2 At either value it is clear that the function of the atmosphere in the long-term heat budget since the caldera filled has been as a heat sink for the lake This is not projected to change in the future climates considered until the last 55 years of the RCP85 scenario The hydrothermal inputs imply that the profundal changes in Crater Lake in a future climate could be different from those projected for deep lakes receiving relatively little hydrothermal heat inputs In the complete absence of cooling hydrothermal heating at the rate of 14 Wm2 would increase the temperature of the hypolimnion below 325 m depth by about 039 degC per decade which could be considered the upper limit on the rate of temperature increase In the event therefore that deep ventilation events stop completely in a future climate the projected lake temperature changes could be underestimates
SummaryThe frequency of deep ventilation events in Crater
Lake a caldera lake in the Oregon Cascade Mountains was simulated in six future climate scenarios The 1-dimensional deep ventilation (1DDV) model used was developed specifically to simulate the ventilation of deep water initiated by reverse stratification and subsequent thermobaric instability which allows water colder than the temperature of maximum density at the surface to be unstable when displaced downward a sufficient distance by wind action and to sink to the deep lake The model which is forced with wind speed and lake surface-water temperature was calibrated with lake temperature data collected from 2000 to 2006 and validated with data from 1994 to 1999 and 2008 to 2011 Emphasis in the calibration and validation was placed on the correct simulation of wintertime deep ventilation events and their frequency The simulated annual frequency of these events in the calibrationvalidation of the model was 05 (1 in 2 years) as compared to 05 in the historical data
Wind and air temperature data from three general circulation models (GCMs) (CNRM-CM5 HadGEM2-CC and HadGEM2-ES) and two representative concentration pathways (RCP45 and RCP85 corresponding to a moderate and more extreme future respectively) were statistically downscaled using the Multivariate Adaptive Constructed Analogs (MACA) technique bias corrected using measurements from the surface of Crater Lake and then used to simulate the change in lake temperature and the frequency of deep ventilation events in possible future climates The lumped model air2water was used to project lake surface temperature a required boundary condition for the lake model based on air temperature in the future climates
The 1DDV model was used to simulate daily water temperature profiles for 55 years of baseline conditions and 95 years of future conditions for all six combinations
of GCMs and RCPs All future climate scenarios projected increased water temperature throughout the water column and a substantive reduction in the frequency of deep ventilation events The least extreme scenario (CNRM-CM5 RCP45) projected the frequency of deep ventilation events to decrease from about 1 in 2 years in current conditions to about 1 in 3 years by 2100 The most extreme scenario considered (HadGEM2-ES RCP85) projected the frequency of deep ventilation events to be about 1 in 77 years by 2100 and lake surface temperatures never cooling to less than 4 degC after 2050 All RCP45 scenarios predicted that the system would warm to the point that the entire water column is greater than the 4 degC threshold (the maximum temperature of maximum density) for increasing lengths of time All RCP85 scenarios predicted that the system would warm to the point that the entire water column would be greater than the 4 degC threshold by the year 2060 for the HadGEM2 models and by the year 2080 for the CNRM-CM5 model thus the conditions required for thermobaric instability induced mixing become rare or non-existent
The historical role of the atmosphere in the heat budget of Crater Lake has been to cool the deep waters of the lake and vent the hydrothermal heat flux to the atmosphere (we estimated the hydrothermal heat flux to be about 14 Wm2 which is somewhat larger but the same order of magnitude as the previous estimate of 1 Wm2) The primary effects of warmer future climates on the lake are decreased frequency of episodic cooling of the hypolimnion a transition from the lake as a heat source to a heat sink for the atmosphere and a progressive shift in the thermal regime of Crater Lake from dimictic to warm monomictic to oligomictic In the complete absence of deep ventilation events the water temperature in the deep lake can increase by about 039 degC per decade based on hydrothermal inputs alone so this provides an upper limit for the rate of temperature increase between episodic mixing
The disruption of deep ventilation by itself does not provide a complete picture of the potential ecological and water quality consequences of warming climate to Crater Lake The depth timing and frequency of vertical water column mixing are among the most important processes in deep lakes as vertical mixing often controls the growth of algae and water clarity through redistribution of nutrients and replenishes dissolved oxygen near the lake bottom that is otherwise depleted by the decomposition of organic material raining down from above The disruption of deep ventilation has the potential to deplete oxygen levels in the deep lake and alter benthic communities living on the lake floor Likewise changes in the frequency of deep ventilation would affect the vertical movement of nutrients and alter both the subsequent growth of algae during summer and the corresponding water clarity for which Crater Lake is famous Estimating the effect of warming climate on deep water oxygen depletion and water clarity will require careful modeling studies to combine the physical mixing processes affected by the atmosphere with the multitude of factors affecting the growth of algae and corresponding water clarity
References Cited 41
AcknowledgmentsThis modeling work was supported by the US
Geological Survey (USGS)-National Park Service (NPS) Water Quality Partnership Program The long-term climatological and year-round water column temperature data collected at Crater Lake was initiated by NPS and USGS Global Change Research Programs and extensive collaboration between the NPS and the College of Oceanic and Atmospheric Sciences at Oregon State University In particular we thank Dr Robert Collier Dr Jack Dymond and Mr J Chris Moser
References Cited
Abatzoglou JT and Brown TJ 2012 A comparison of statistical downscaling methods suited for wildfire applications International Journal of Climatology doi101002joc2312
Ambrosetti W and Barbanti L 1999 Deep water warming in lakesmdashAn indicator of climatic change Journal of Limnology v 58 p 1ndash9
Bacon CR Gardner JV Mayer LA Buktenica MW Dartnell P Ramsey DW and Robinson JE 2002 Morphology volcanism and mass wasting in Crater Lake Oregon Geological Society of America Bulletin v 114 no 6 p 675ndash692
Boehrer B and Schultze M 2008 Stratification of lakes Reviews of Geophysics v 46 RG2005 doi1010292006RG000210
Butcher JB Nover D Johnson TE and Clark CM 2015 Sensitivity of lake thermal and mixing dynamics to climate change Climatic Change v 129 p 295ndash305 doi101007s10584-015-1326-1
Coats R Perez-Losada J Schladow G Richards R and Goldman C 2006 The warming of Lake Tahoe Climatic Change v 76 p 121ndash148
Crawford GB and Collier RW 2007 Long-term observations of deepwater renewal in Crater Lake Oregon Hydrobiologia v 574 p 47ndash68
Crawford TM and Duchon CE 1999 An improved parameterization for estimating effective atmospheric emissivity for use in calculating daytime downwelling longwave radiation Journal of Applied Meteorology v 38 p 474ndash480
Diaz-Nieto J and Wilby RL 2005 A comparison of statistical downscaling and climate change factor methodsmdashImpacts on low flows in the River Thames United Kingdom Climatic Change v 69 p 245ndash268
Dokulil MT Jagsch A George GD Anneville O Jankowski T Wahl B Lenhart B Blenckner T and Teubner K 2006 Twenty years of spatially coherent deepwater warming in lakes across Europe related to the North Atlantic Oscillation Limnology and Oceanography v 51 p 2787ndash2793
Dymond J Collier R and McManus J 1996 Unbalanced particle flux budgets in Crater Lake OregonmdashImplications for edge effects and sediment focusing in lakes Limnology and Oceanography v 41 no 4 p 732ndash742
Elo A Huttula T Peltonen A and Virta J 1998 The effects of climate change on the temperature conditions of lakes Boreal Environmental Research v 3 p 137ndash150
Environmental and Water Resources Institute 2005 The ASCE Standardized Reference Evapotranspiration EquationmdashFinal report prepared by the Task Committee on Standardization of Reference Evapotranspiration Reston Virginia Environmental and Water Resources Institute of the American Society of Civil Engineers 59 p
Groeger AW 2007 Nutrient limitation in Crater Lake Oregon Hydrobiologia v 574 p 205ndash216
Hampton SE Izmestrsquoeva LR Moore MV Katz SL Dennis B and Silow EA 2008 Sixty years of environmental change in the worldrsquos largest freshwater lakemdashLake Baikal Siberia Global Change Biology v 14 p 1947ndash1958 doi101111j1365-2486200801616x
Hostetler SW and Giorgi F 1995 Effects of a 2XCO2 climate on two large lake systems Pyramid Lake Nevada and Yellowstone Lake Wyoming Global and Planetary Change v 10 p 43ndash54
Hostetler SW and Small EE 1999 Response of North American freshwater lakes to simulated future climates Journal of the American Water Resources Association v 35 p 1625ndash1637
Imerito A 2014 Dynamic Reservoir Simulation Model DYRESM v4mdashv40 science manual Perth University of Western Australia Centre for Water Research 42 p
Jassby A and Powell T 1975 Vertical patters of eddy diffusion during stratification in Castle Lake California Limnology and Oceanography v 20 p 530ndash543
42 Simulation of Deep Ventilation in Crater Lake Oregon 1951ndash2099
Kullenberg G 1976 On vertical mixing and the energy transfer from the wind to the water Tellus B v 28 no 2 p 159ndash165
Livingstone D 1997 An example of the simultaneous occurrence of climate-driven ldquosawtoothrdquo deep-water warmingcooling episodes in several Swiss lakes Verhandlungen des Internationalen Verein Limnologie v 26 p 822ndash828
Livingstone D 2003 Impact of secular climate change on the thermal structure of a large temperate central European lake Climatic Change v 57 p 205ndash255
Martin JL and McCutcheon SC 1998 Hydrodynamics and transport for water quality modeling Boca Raton Florida CRC Press 816 p
Marty Ch Philipona R Froumlhlich C and Ohmura A 2002 Altitude dependence of surface radiation fluxes and cloud forcing in the alpsmdashResults from the alpine surface radiation budget network Theoretical and Applied Climatology v 72 p 137ndash155
McManus J Collier RW Chen CA and Dymond J 1992 Physical properties of Crater Lake OregonmdashA method for the determination of a conductivity and temperature-dependent expression for salinity Limnology and Oceanography v 37 p 41ndash53
McManus J Collier RW and Dymond J 1993 Mixing processes in Crater Lake Oregon Journal of Geophysical Research v 98 p 18295ndash18307
Mellor GL 1989 Retrospect on oceanic boundary layer modeling and second moment closure in Muller P and Henderson D eds The parameterization of small-scale processes Proceedings of the 5th Aha Hulikorsquoa Hawaiian Winter Workshop January 1989 Honolulu University of Hawaii at Manoa p 251ndash272
Met Office 2014 Met Office climate prediction modelmdashHadGEM2 family Met Office Web site accessed December 24 2015 at httpwwwmetofficegovukresearchmodelling-systemsunified-modelclimate-modelshadgem2
Minville M Brissette F and Leconte R 2008 Uncertainty of the impact of climate change on the hydrology of a Nordic watershed Journal of Hydrology v 358 p 70ndash83
Munk WH and Anderson ER 1948 Notes on a theory of the thermocline Journal of Marine Research v 7 p 276ndash295
National Atmospheric and Space Administration 2015 Ocean in motionmdashEkman TransportmdashBackground National Atmospheric and Space Administration Web site accessed December 24 2015 at httpoceanmotionorghtmlbackgroundocean-in-motionhtm
National Centre of Meteorological Research 2014 CNRM-CM5mdashDescription National Centre of Meteorological Research Web site accessed December 24 2015 at httpwwwcnrm-gamefrspipphparticle126amplang=en
Pacanowski RC and Philander SG 1981 Parameterization of vertical mixing in numerical models of tropical oceans Journal of Physical Oceanography v 11 p 1443ndash1451
Panofsky HA and Brier GW 1968 Some applications of statistics to meteorology The Pennsylvania State University College of Earth and Mineral Sciences 224 p
Peeters F Livingstone DM Goudsmit G Kipfer R and Forster R 2002 Modeling 50 years of historical temperature profiles in a large central European lake Limnology and Oceanography v 47 p 186ndash197
Peeters F Straile D Lorke A and Livingstone D 2007 Earlier onset of the spring phytoplankton bloom in lakes of the temperate zone in a warmer climate Global Change Biology v 13 p 1898ndash1909 doi101111j1365-2486200701412x
Perroud M and Goyette S 2010 Impact of warmer climate on Lake Geneva water-temperature profiles Boreal Environment Research v 15 p 255ndash278
Piccolroaz S 2013 Deep ventilation in Lake BaikalmdashA simplified model for a complex natural phenomenon Italy University of Trento PhD thesis 172 p accessed February 2014 at httpeprints-phdbibliounitnit1012
Piccolroaz S and Toffolon M 2013 Deep water renewal in Lake BaikalmdashA model for long-term analyses Journal of Geophysical Research v 118 p 6717ndash6733
References Cited 43
Piccolroaz S Toffolon M and Majone B 2013 A simple lumped model to convert air temperature into surface water temperature in lakes Hydrology and Earth System Sciences v 17 p 3323ndash3338 doi105194hess-17-3323-2013
Piccolroaz S Toffolon M and Majone B 2015 The role of stratification on lakesrsquo thermal responsemdashThe case of Lake Superior Water Resources Research v 51 p 7878ndash7894 doi010022014WR016555
Powell T and Jassby A 1974 The estimation of vertical eddy diffusivities below the thermocline in lakes Water Resources Research v 10 p 191ndash198
Ravens TM Kocsis O and Wuumlest A 2000 Small-scale turbulence and vertical mixing in Lake Baikal Limnology and Oceanography v 45 p 159ndash173
Riahi K Rao S Krey V Cho C Chirkov V Fischer G Kindermann G Nakicenovic N and Rafaj P 2011 RCP85mdashA scenario of comparatively high greenhouse gas emissions Climatic Change v 109 p 33ndash57 doi101007s10584-011-0149-y
Robertson DM and Ragotzkie RA 1990 Changes in the thermal structure of moderate to large sized lakes in response to changes in air temperature Aquatic Sciences v 52 p 360ndash380
Ruckstuhl C Philipona R Morland J and Ohmura A 2007 Observed relationship between surface specific humidity integrated water vapor and longwave downward radiation at different altitudes Journal of Geophysical Research v 112 p D03302 doi1010292006JD007850
Rupp DE Abatzoglou JT Hegewisch KC and Mote PW 2013 Evaluation of CMIP5 20th century climate simulations for the Pacific Northwest USA Journal of Geophysical Research v 118 p 10884ndash10906 doi101002jgrd50843
Simpson HJ 1970 Tritium in Crater Lake Oregon Journal of Geophysical Research v 75 p 5195ndash5207
Sweers HE 1970 Vertical diffusivity coefficient in a thermocline Limnology and Oceanography v 15 p 273ndash280
Swinbank WC 1963 Long-wave radiation from clear skies Quarterly Journal of the Royal Meteorological Society v 89 p 339ndash348
Taylor KE Stouffer RJ and Meehl GA 2012 An Overview of CMIP5 and the experiment design Bulletin of the American Meteorological Society v 93 p 485ndash498 doi101175BAMS-D-11-000941
Thomson AM Calvin KV Smith SJ Kyle GP Volke A Patel P Delgado-Arias S Bond-Lamberty B Wise MA Clarke LE and Edmonds JA 2011 RCP45mdashA pathway for stabilization of radiative forcing by 2100 Climatic Change v 109 p 77ndash94 doi101007s10584-011-0151-4
Toffolon M Piccolroaz S Majone B Soja AM Peeters F Schmid M and Wuumlest A 2014 Prediction of surface water temperature from air temperature in lakes with different morphology Limnology and Oceanography v 59 no 6 p 2185ndash2202 doi104319lo20145962185
Tucker WA and Green AW 1977 A time-dependent model of the lake-averaged vertical temperature distribution of lakes Limnology and Oceanography v 22 p 687ndash699
Weiss RF 1992 Rates and variability of deep water renewal and biological production in deep temperate lakesmdashLake Baikal and Crater Lake [abs] Eos Transactions American Geophysical Union v 73 iss 43 p 198
Wuumlest AT Ravens M Granin NG Kocsis O Schurter M and Sturm M 2005 Cold intrusions in Lake BaikalmdashDirect observational evidence for deep water renewal Limnology and Oceanography v 50 p 184ndash196
Yang K He J Tang W Qin J and Cheng CCK 2010 On downward shortwave and longwave radiations over high altitude regionsmdashObservation and modeling on the Tibetan Plateau Agricultural and Forest Meteorology v 150 p 38ndash46 doi101016jagrformet200908004
Publishing support provided by the US Geological Survey Science Publishing Network Tacoma Publishing Service Center
For more information concerning the research in this report contact theDirector Oregon Water Science CenterUS Geological Survey2130 SW 5th AvenuePortland Oregon 97201httporwaterusgsgov
Wood and othersmdash
Simulation of D
eep Ventilation in Crater Lake Oregon 1951ndash2099mdash
Scientific Investigations Report 2016ndash5046
ISSN 2328-0328 (online)httpdxdoiorg103133sir20165046
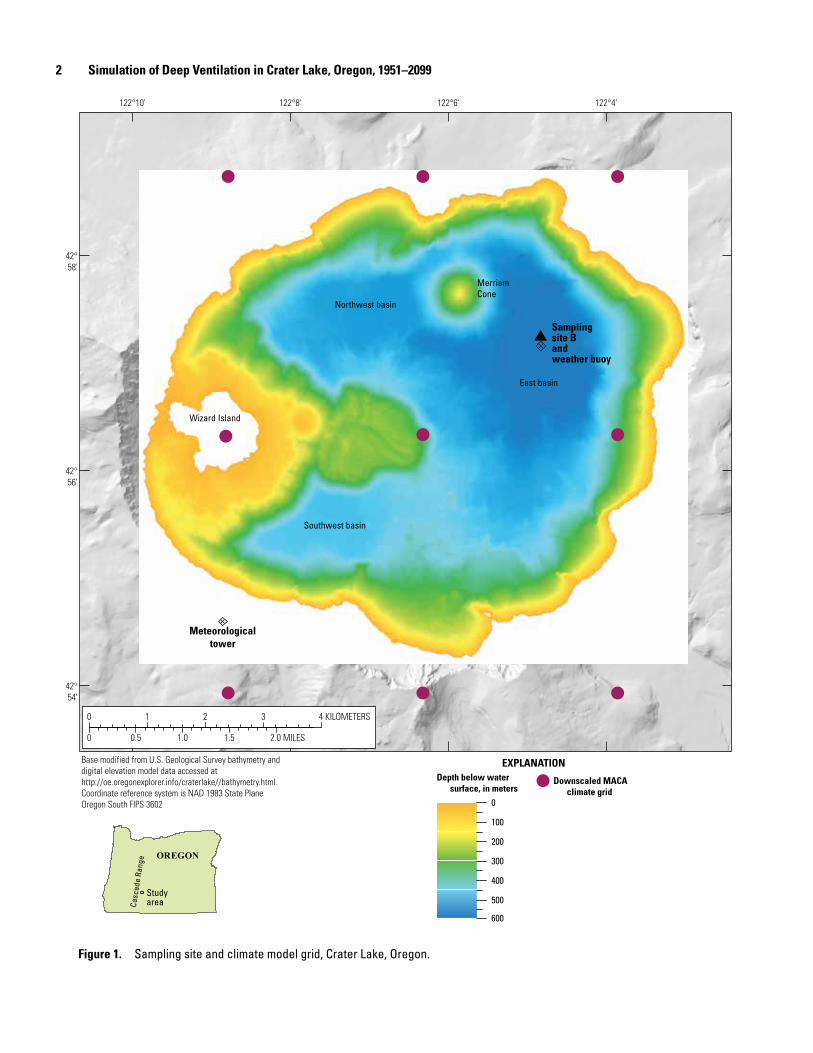
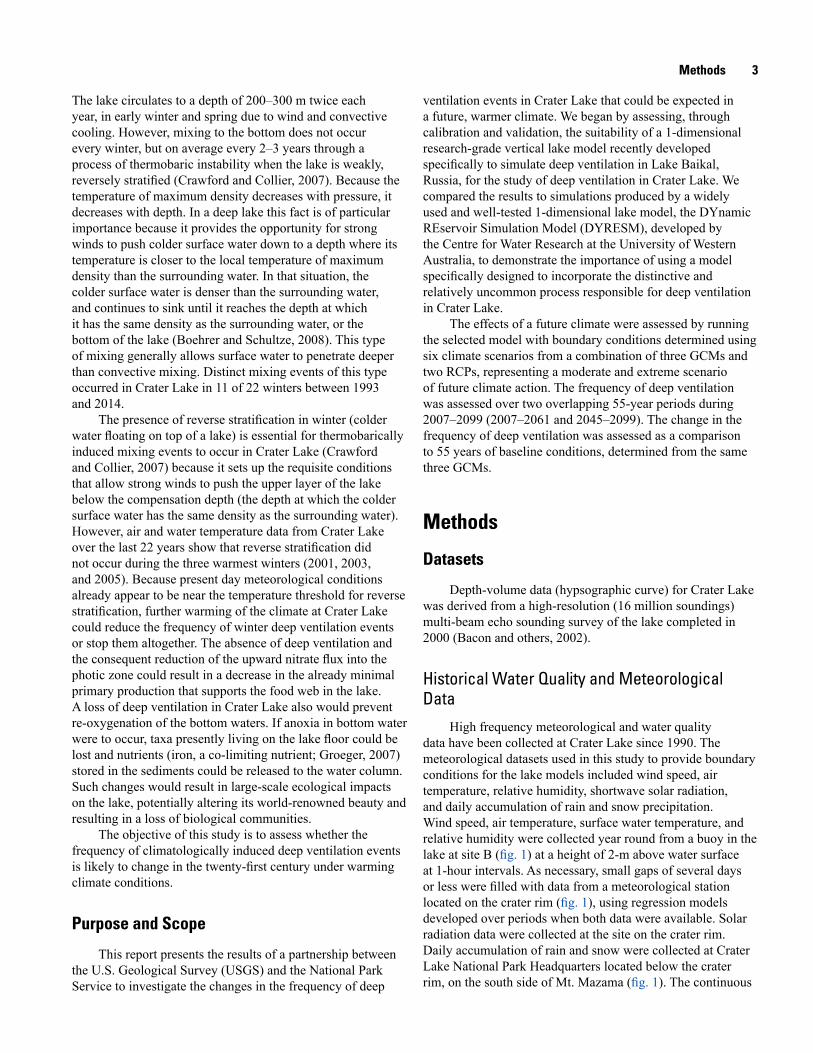
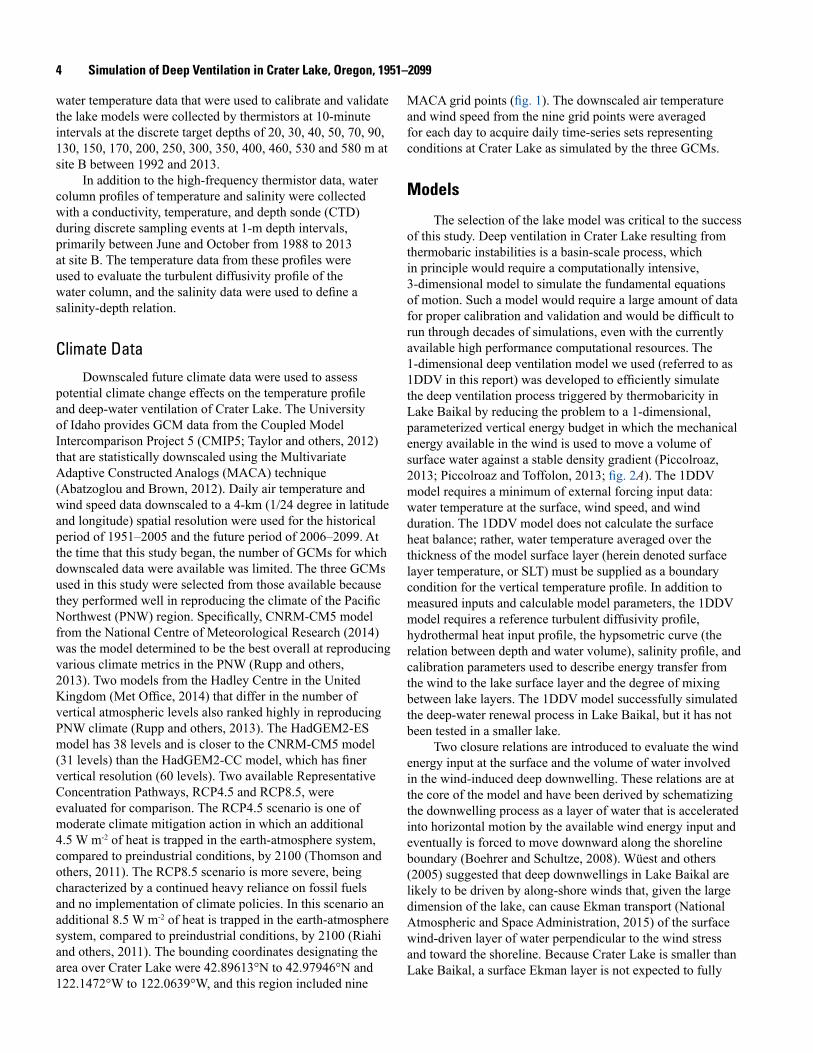
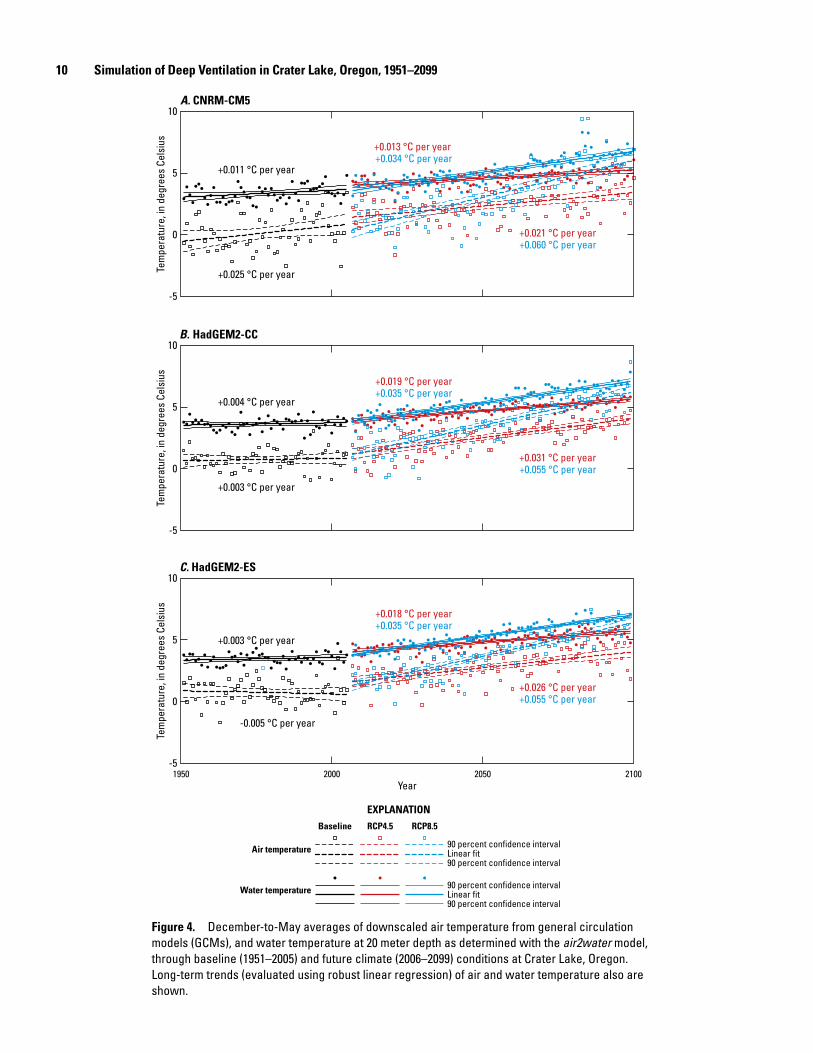
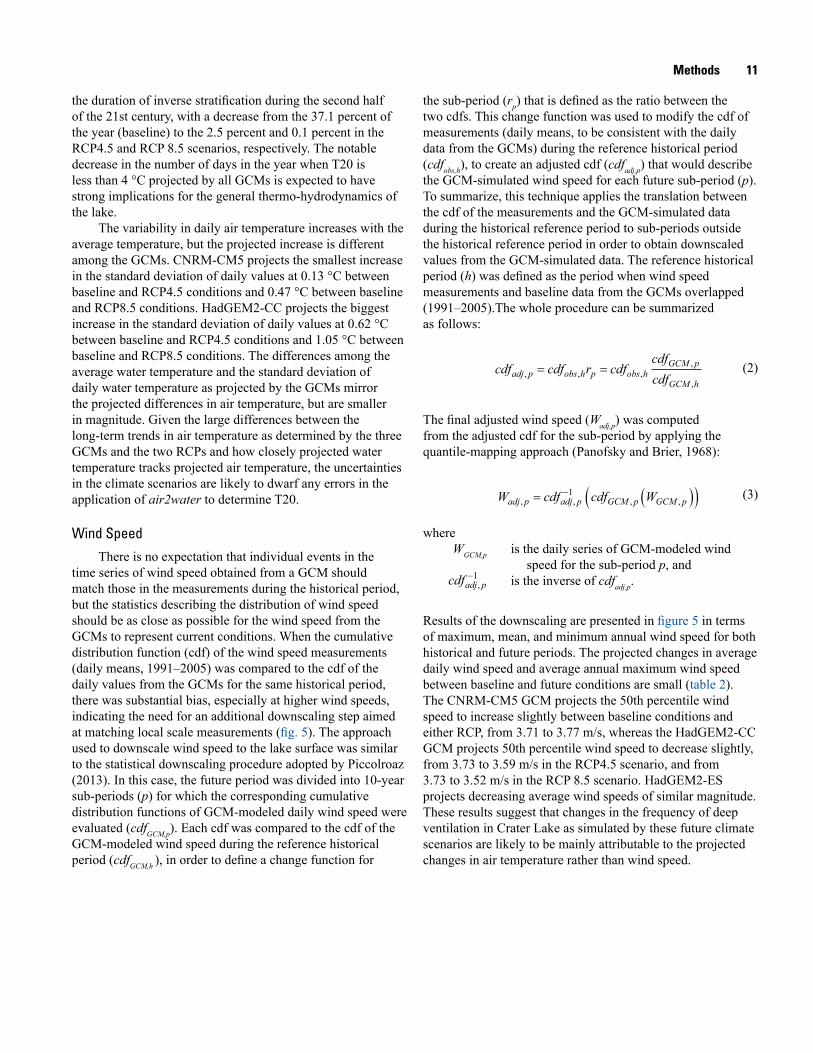
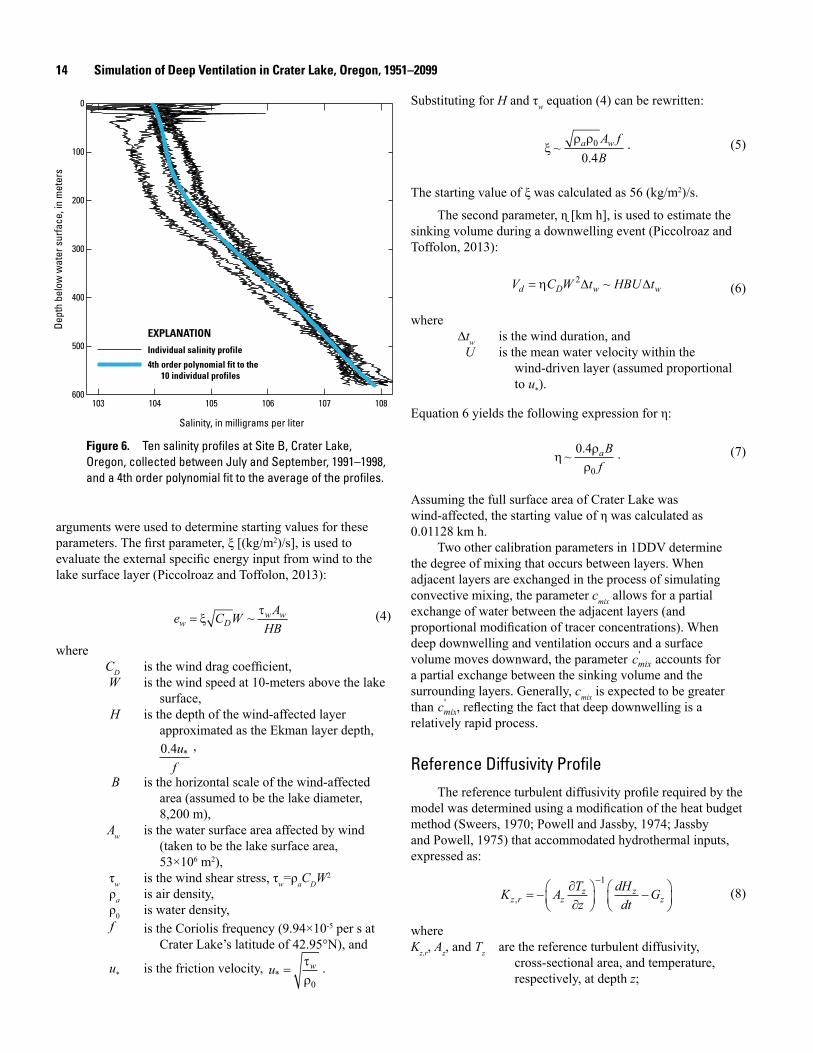
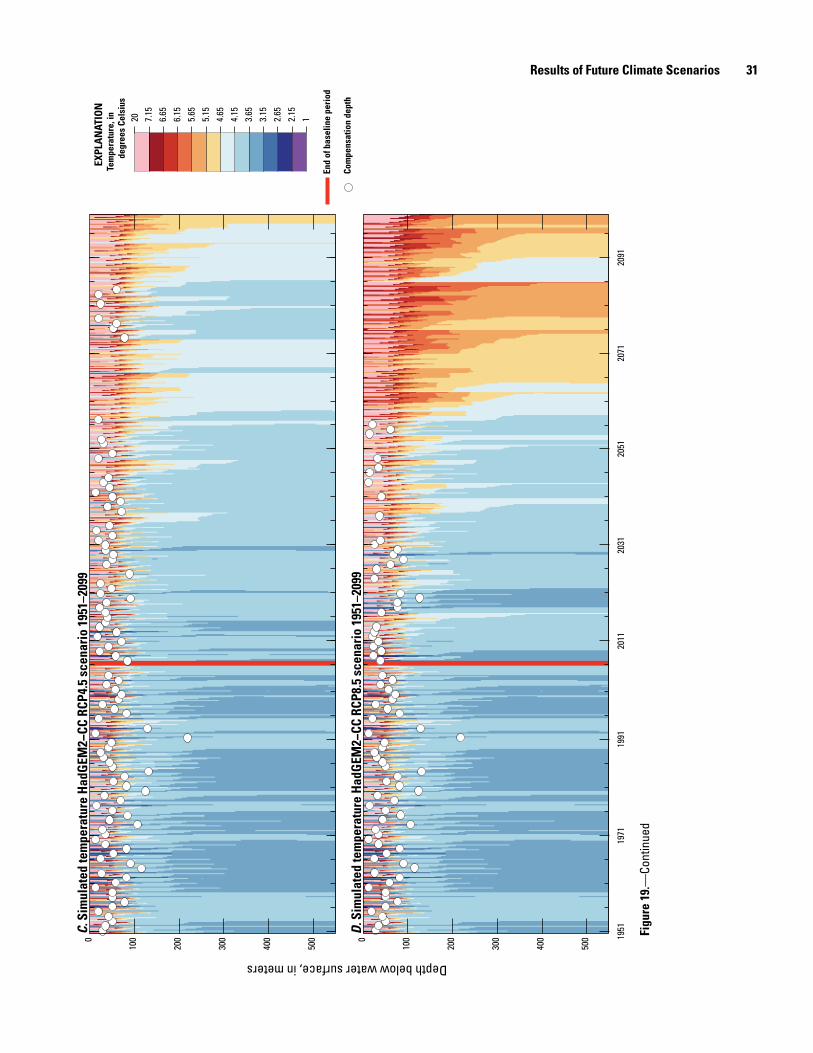
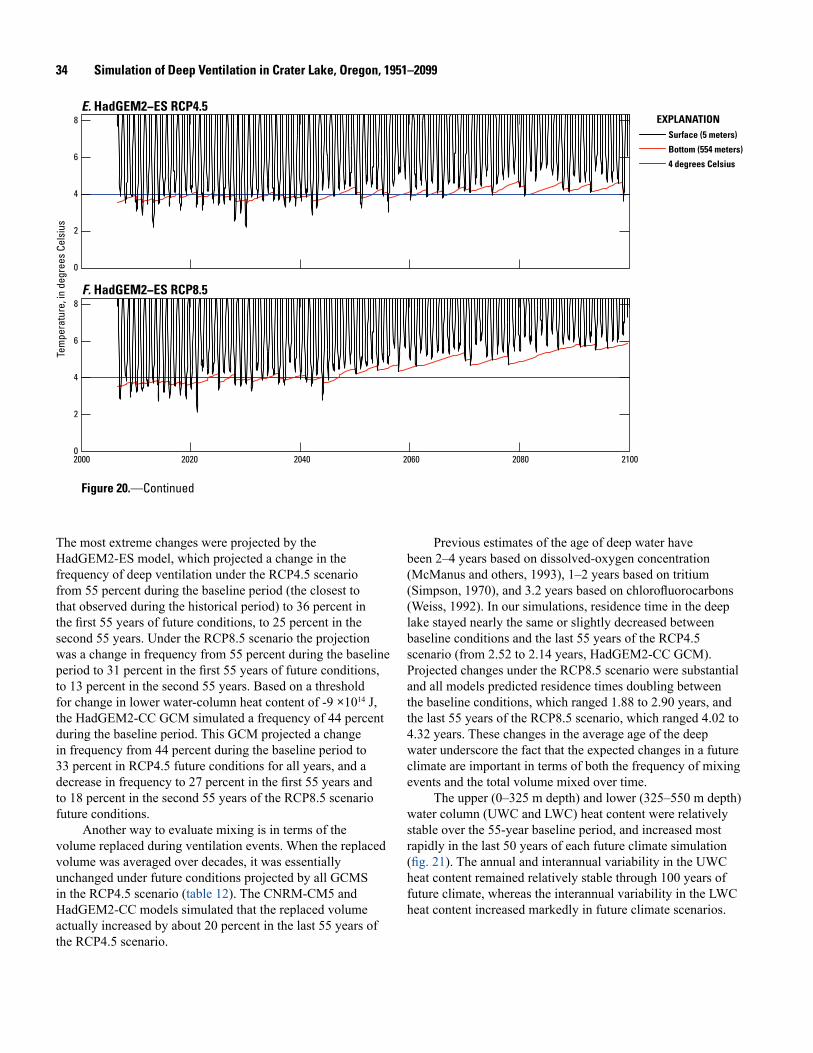
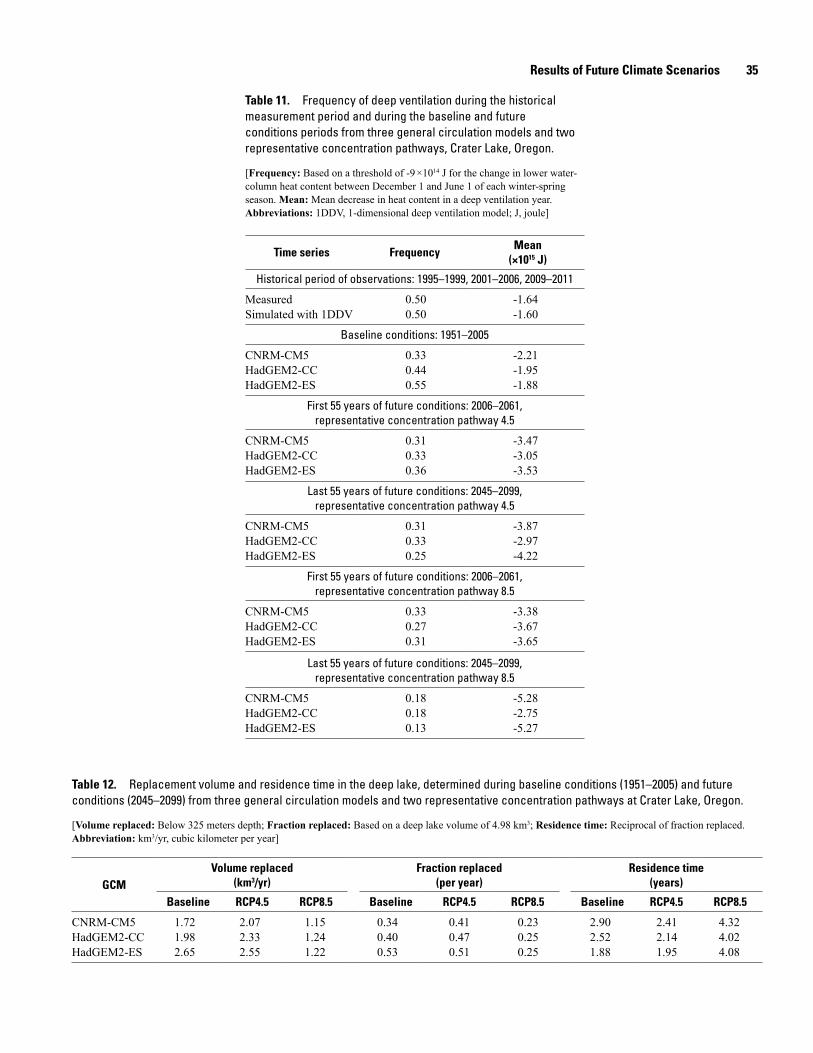

Wood and othersmdash
Simulation of D
eep Ventilation in Crater Lake Oregon 1951ndash2099mdash
Scientific Investigations Report 2016ndash5046
ISSN 2328-0328 (online)httpdxdoiorg103133sir20165046