Embed Size (px)
Citation preview

www.SandV.com12 SOUND & VIBRATION/SEPTEMBER 2015
Simulation Method to Meet NewPass-By Noise Requirements
A new pass-by noise test method has been introduced, in which engine speeds and loads are reduced (compared to the old test method) to better reflect real-world driving behavior. New noise limits apply from July 1, 2016, and tighten by up to 4 dB by 2026. The new test method is recognized internationally, and it is anticipated that the limits will also be adopted in most territories around the world. To achieve these tough new pass-by noise requirements, vehicle manufacturers need to address several important aspects of their products. Vehicle performance is critical to the test method and is controlled by the full-load engine torque curve, speed of response to accelerator pedal input, transmission type, overall gear ratios, tire rolling radius, and resistance due to friction and aerodynamic drag. Noise sources (exhaust, intake, powertrain, driveline, tires) and vehicle noise insulation are critical to the noise level radiated to the far field. A simulation method was developed that could account for all of these critical aspects and predict the pass-by noise test result. This simulation method is useful to explore and optimize a car in its early stages of product development when design decisions are easier and more cost-effective. Countermeasures suggested by the simulation were procured in hardware and tested. The expected benefits were achieved, signposting a route to achieve the pass-by noise requirements of 2026 and demonstrating that the simulation method was useful.
In May 2014, the Official Journal of the European Union pub-lished a new pass-by noise regulation for motor vehicles.1 This new regulation applies from 1 July 2016. The regulation states:
“Since its adoption, Directive 70/157/EEC (the old pass-by noise regulation) has been substantially amended several times. The most recent reduction of sound level limits for motor vehicles, introduced in 1995, did not have the effects expected. Studies showed that the test method used under that directive no longer reflected real-life driving behavior in urban traffic. In particular, as pointed out in the Green Paper on the Future Noise Policy of November 4, 1996, the contribution of tire-rolling noise to total noise emissions was underestimated in the test method.”The old test method mandated that vehicles were operated at full
engine load and relatively high engine speed for two reasons: be-cause this reflected real-world driving in the 1960s and ’70s, when engines were typically less powerful, and because this resulted in a test method that was straightforward to perform.
Today’s vehicles typically have more powerful engines, therefore lower engine loads (in percentage terms) are required to achieve the same rate of vehicle acceleration. With the increase in urban-ization over the last few decades, today’s drivers spend more time in cities at lower average vehicle speeds. So today, the majority of urban driving occurs at low engine load (below 30%) and medium engine speed (around 30-35%). This results in a relatively smaller contribution from powertrain noise and conversely a greater con-tribution from tire noise.
The new test method has been targeted at a slightly higher load than the most commonly occurring driving condition to avoid an over-emphasis on tire noise.
Synopsis of the New Test MethodThe new test method2 is rather complicated. The synopsis given
here covers only the most important points, as applicable to a
sample car. This car is a sporty variant of a mass-market C-segment passenger vehicle and is equipped with a manual transmission. Its relevant characteristics are shown in Table 1.
Tests are performed both at full-load acceleration and at constant speed. A target acceleration, determined from the vehicle’s power-to-mass ratio, controls the relative weighting of noise levels at full load and constant speed (partial power factor, kP) to derive the final result, approximating operation at moderate engine load. By contrast, the old test used ful-load acceleration only.
The vehicle achieves 50 km/h when the reference point (the front for front-engine vehicles, the center for mid-engine vehicles, and the rear for rear-engine vehicles) passes the center of the test zone. Vehicle speeds are reduced relative to the old test, which used 50 km/h when the front of the vehicle passed the start of the test zone.
Tests are performed in one or two gears in which full-load acceleration most closely matches a reference acceleration, also determined from the vehicle’s power-to-mass ratio, but higher than the target acceleration. By contrast, the old test used 2nd and 3rd gears for most cars.
Full-load testing tries to achieve the reference acceleration by selecting appropriate gears using the following conditions:• Clause 4.1.2.1.4.1 (a) in [1]: A single gear is used for testing when
the test acceleration is within ±5% of the reference acceleration (as long as the reference acceleration does not exceed 2.0 m/s²).
• Clause 4.1.2.1.4.1 (b) in [1]: Otherwise, two gears are used for testing (called gear i and gear i+1), which give test acceleration values either side of the reference acceleration (as long as test acceleration in the lower gear does not exceed 2.0 m/s²). In this case, an appropriate weighting is applied between the results in the two gears.
• Clause 4.1.2.1.4.1 (c) in [1]: If test acceleration in the lower of two gears exceeds 2.0 m/s², move to testing in the next higher single gear that gives a new test acceleration less than 2.0 m/s².Constant-speed testing is performed in the same gear(s) as full
load testing.There are some special provisions for automatic transmissions. If
the transmission has a manual selector or the gear is held (without kick-down) during the pass-by test, this is known as locked gear ratios. The manual selector is used, and the process is the same as for manual transmissions described previously.
On the other hand, if there is no manual selector, or the gear is not held, or it is a continuously variable transmission, this is known as non-locked gear ratios. In this case, the “D” selector position is used, and kick-down is permitted. The test acceleration is calculated for the second part of the test zone between the line PP’ and the line BB’. Pre-acceleration (see below) may not be used.
Uije Kim, Hyundai Motor Company, Seoul, KoreaMatthew Maunder, Duncan Mawdsley and Phil Grant, Ricardo UK, Shoreham-by-Sea, United Kingdom
Based on a paper presented at the SAE Noise and Vibration Conference & Exhibition, Grand Rapids, MI, June 2015.
Table 1. Relevant characteristics of sample car.
Class M1
Power-to-mass ratio 104.6 kW/1000Kg
Target acceleration aurban 1.182 m/s²0.63×log10 (PMR) –0.09
Reference acceleration awot ref 1.801 m/s²1.59×log10 (PMR) –1.41
Partial power factor kP 0.374 – �nal pass-by noise result is 37.4% of constant speed result plus 62.6% of full-load result
Test acceleration in 3rd gear 1.890 m/s² – within 5% of referencewithout pre-acceleration acceleration
Test gear selection without 3rd gear only, according to Clausepre-acceleration 4.1.2.1.4.1 (a) of [1]

www.SandV.com SOUND & VIBRATION/SEPTEMBER 2015 13
For vehicles with manual transmissions or automatic transmis-sions with locked gear ratios, the new regulation permits the use of pre-acceleration, which is defined as “the application of an ac-celeration control device prior to AA’ for the purpose of achieving stable acceleration between AA’ and BB’.” This means that turbo lag and slow pedal response can be completed before AA’, enabling full torque and greater “stable” acceleration to be delivered within the test zone. The outcome of this provision is that the reference acceleration is achieved in higher gears and at lower engine speeds, giving lower noise levels from powertrain noise sources and pro-ducing a strong benefit for the final pass-by noise result.
Test Track and Measurement EquipmentThe specification for the test-track surface has been updated
for the new regulations. The new surface specification3 aims to minimize variation between test tracks in terms of noise-relevant parameters:
• Texture• Sound absorption• Mechanical impedance• Skid resistance properties
Practical experience suggests that this new surface specification is smoother (see Figure 1) and slightly more absorbent than many test-track surfaces conforming to the previous specification. This results in lower noise levels, particularly during the constant-speed test, that is more strongly influenced by road-tire interface noise.
Measurements from a major European test facility indicate that the noise benefit is as much as 6 dB during the constant-speed test (see Figure 2) for a sporty variant of a mass market D-segment passenger vehicle fitted with standard tires. Noting that the sample car’s partial power factor is 0.374, this would give up to 2.2 dB benefit in the final pass-by noise result. The benefit can be even greater if road-tire interface noise is also a significant contributor in the full-load acceleration test.
The old method could be performed very quickly and simply using only two sound level meters and a calibrated speed measure-ment device. However, the new method requires considerably more equipment. Measurement of vehicle speed and position is critical. Simple GPS systems are not accurate enough for this task. More sophisticated multiple-constellation global navigation satellite systems may be accurate but were not investigated for this study. Alternatively, a combination of radar and light gates (used by the authors and shown in Figure 3) can produce accurate results. Further, it is necessary to measure engine speed, for which a te-lemetry system is required to transmit this signal to the track-side measurement station.
Noise Limit ValuesThe new regulation1 gives noise limit values in its Annex III.
Note that the result is mathematically rounded to the nearest integer value. This gives up to 0.5-dB benefit in the final pass-by noise result.
Category M1 is newly subdivided according to power-to-mass ratio. Cars with power-to-mass ratio above 120 kW/1000 kg (for example Audi S3, Ford Focus ST) have a higher noise limit by 1 dB. The sample car, at 104.6 kW/1000 kg, would require a 15% increase in power to achieve this status. The noise limit increases by a further 2 dB for cars with power-to-mass ratio above 160 kW/1000 kg (Mercedes A45 AMG, BMW M3, Ford Mustang V8). There is a further 1 dB benefit after the year 2020 for supercars having power-to-mass ratio above 200 kW/1000 kg, number of seats less than or equal to four, and with the driver’s seat less than 450 mm from the ground (Jaguar F-Type R, Porsche 911 Turbo S, Ferrari 458 Italia, Chevrolet Corvette Stingray).
The noise limit is increased by a further 1 dB for off-road vehicles with maximum laden mass greater than 2 tons (Porsche Cayenne or Range Rover, some models of which also achieve the higher power-to-mass ratio conditions).
For cars in category M1 with less than 120 kW/1000 kg, the noise limit value is initially 72 dB(A) from July 1, 2016. This is thought to be slightly more difficult to achieve than the old noise limit value of 74 dB(A) under the old noise test method. For new vehicle types, this limit reduces by 2 dB to 70 dB(A) from July 1, 2020, and then by a further 2 dB to 68 dB(A) from July 1, 2024. The reduced limits apply two years later to newly registered cars of existing types.
Pass-By Noise Development ProcedureThe following four steps are recommended in a comprehensive
pass-by noise development procedure, aligned with a vehicle development program:• Vehicle performance simulation• Pass-by noise source ranking• Pass-by noise simulation• Countermeasure simulation and development
Each of these steps is detailed below.Vehicle Performance Simulation. It has become clear that careful
selection of vehicle performance parameters can yield significant advantages for pass-by noise. To enable appropriate decisions to be
Figure 1. Example of new track surface.
Figure 2. Noise benefit of new track surface; 50 km/h, constant speed, 3rd gear.
Figure 3. Radar and light gates to determine vehicle position and speed.

www.SandV.com14 SOUND & VIBRATION/SEPTEMBER 2015
made at the concept stage of a new vehicle development program, vehicle performance simulation can be performed. The following
information is needed:• Full-load engine torque vs. engine speed• Delay before full torque is achieved (for example turbo lag)• Vehicle mass, drag coefficient and frontal area, length and en-
gine location• Tire rolling radius (calculated from tire size specification)• Coefficient of rolling resistance• Gear ratios and driveline efficiency
The forces are simply calculated as follows:• Surplus force = motive force – friction force – aerodynamic force• Motive force = torque delivered × overall gear ratio × driveline
efficiency/tire rolling radius• Friction force = coefficient of rolling resistance × gravitational
acceleration × vehicle mass• Aerodynamic force = 0.5 × air density × drag coefficient × frontal
area × vehicle speed²Vehicle acceleration is then simply surplus force/(vehicle mass
× rotational inertia coefficient).The pass-by testing drive cycle consists of the following phases:
• Constant speed before reference point (front of vehicle) passes line AA’; this is achieved when surplus force is zero, namely when motive force = friction force + aerodynamic force
• Full-load acceleration through the main pass-by zone – iterations of initial vehicle speed are required so the vehicle achieves 50 km/h when the reference point passes line PP’
• Zero-torque delivery (actually negative torque due to engine friction and pumping losses) after the rear of the vehicle passes line BB’Figure 4 shows how turbo lag is simply represented in the
model as a delay after the driver fully depresses the accelerator pedal and before the engine achieves full torque (blue line). On the other hand, if pre-acceleration is used, step 1 is eliminated so that the vehicle delivers stable (maximum) acceleration between lines AA’ and BB’ (red line).
For the sxample car without using pre-acceleration, the vehicle performance model gives the following results (see Figure 5) that were validated by testing:• 3rd gear test acceleration 1.890 m/s²• 4th gear test acceleration 1.416 m/s²• 5th gear test acceleration 0.994 m/s²
As shown in Table 1, the 3rd-gear test acceleration is within 5% of the reference acceleration, so testing is performed in 3rd gear only (clause 4.1.2.1.4.1 (a) in [1]).
When pre-acceleration is introduced, the accelerator pedal is pressed around 20 m before line AA’. So the engine is delivering full torque at the line AA’, and the vehicle is undergoing stable acceleration between lines AA’ and BB’. In 4th and 5th gears, the car achieves test accelerations of 2.115 m/s² and 1.462 m/s², respec-tively. These are higher and lower than the reference acceleration. However, the acceleration in 4th gear exceeds 2.0 m/s², so testing is performed in 5th gear only, since this gives acceleration less than 2.0 m/s² – according to Clause 4.1.2.1.4.1 (c).1
For various values of engine torque and final drive ratio, the vehicle performance simulation was used to calculate the test gear selection without pre-acceleration (Figure 6) and with pre-acceleration (Figure 7) for the sample car. Note that lower engine torque gives slower acceleration, and higher engine torque gives faster acceleration. But this setting has no impact on emissions in the NEDC (New European Driving Cycle), which does not use full-load acceleration.
A lower final drive ratio gives “taller” gearing, lower engine speeds, and slower acceleration; this gives better fuel consumption and CO2 in the NEDC cycle but potentially worse NOx. Conversely, a higher final drive ratio gives “shorter” gearing, higher engine speeds, and faster acceleration. This gives worse fuel consumption and CO2 in the NEDC cycle but potentially better NOx.
In general, the best vehicle performance strategy to minimize pass-by noise level is to maximize acceleration in each gear by reducing vehicle mass, increasing torque, or using lower (shorter) gearing. Using this approach, the reference acceleration is achieved in higher gears at lower engine speeds, typically giving lower noise levels from powertrain noise sources and reducing the final
Figure 4. Simple representation of turbo lag.
Figure 5. Results of vehicle performance simulation for sample car, without pre-acceleration.

www.SandV.com SOUND & VIBRATION/SEPTEMBER 2015 15
pass-by noise result.Typically, a local minimum of pass-by noise level is achieved
with test acceleration as low as possible to allow testing in a single gear, namely just above 5% below the reference accelera-
tion. This will be shown later in the pass-by noise simulation for the sample car.
Conversely, a local maximum pass-by noise level is achieved by testing in a single gear with test acceleration just under the gear selection boundary of 5% above the reference acceleration. This situation should be avoided.
Pass-by Noise Source Ranking. In a future vehicle development program, this step might be omitted. However, for the purposes of methodology development and validation of the pass-by noise simulation, the study described here included this work.
Because a prototype vehicle was available, a test-based approach could be used to evaluate the relative strength of the various noise sources on the vehicle and their contributions to the final pass-by noise result. The objective of these measurements was to provide eough knowledge to direct the efficient development of the vehicle and its systems, tackling the biggest problems with greatest priority.
The relative noise contributions (both overall and 1/3 octave) were evaluated by measuring both with and without each con-tribution suppressed – the well-known “windowing” technique. Suppression methods are:• Exhaust orifice – additional muffler fitted (Figure 8)• Intake orifice – additional muffler fitted (Figure 9)• Exhaust muffler shell – foam-lead-foam acoustical barrier wrap-
ping• Intake pipes and filter box – foam-lead-foam acoustical barrier
wrapping• Powertrain – foam-lead-foam acoustical barrier applied to a
well-sealed undertray (Figure 10), side shields, top cover, close-fitting sump shield
• Tires – worn tires with shallow tread fittedThe maximum development potential was determined from
Figure 6. Test gear selection without pre-acceleration for various values of engine torque and final drive ratio.
Figure 7. Test gear selection with pre-acceleration for various values of engine torque and final drive ratio.
Figure 9. Additional intake muffler.
Figure 8. Additional exhaust muffler.
www.SandV.com16 SOUND & VIBRATION/SEPTEMBER 2015
a measurement with all noise sources suppressed. This build also provided a quiet baseline for evaluating each contribution, maximizing numerical significance. Each noise source was then revealed (suppression removed) in turn and then re-suppressed. The noise contribution was determined by subtracting the quiet baseline noise from the noise with source revealed.
During testing, the removed noise suppression measures were carried in the vehicle to avoid changing the overall mass of the vehicle.
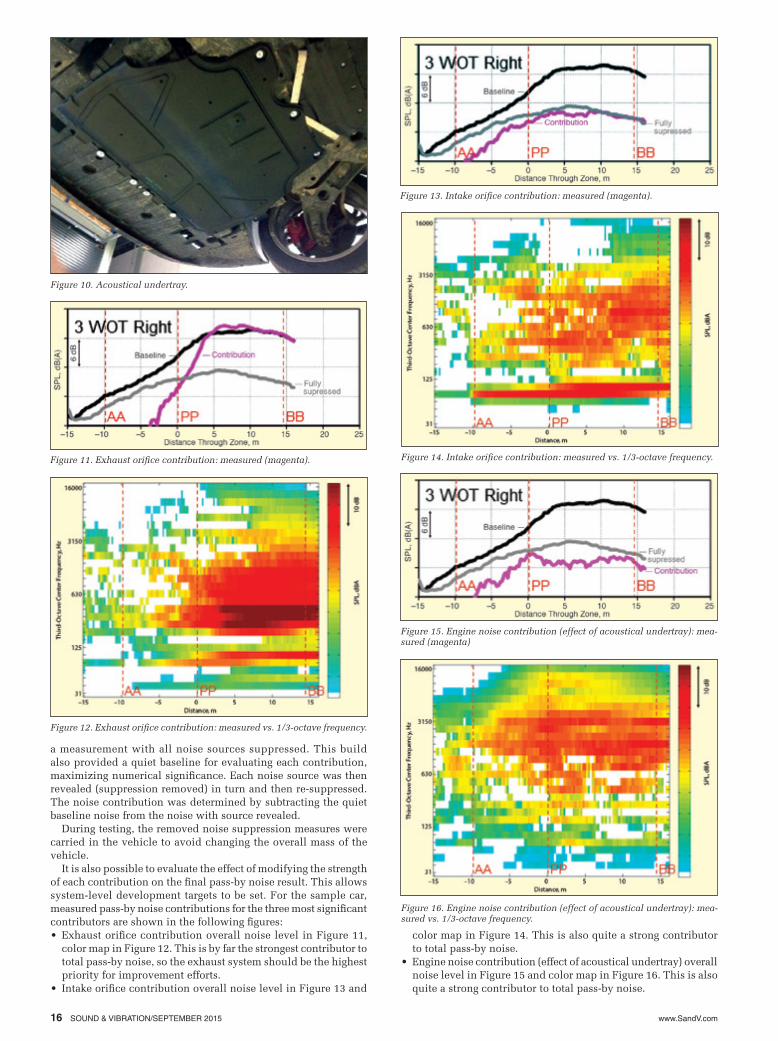
It is also possible to evaluate the effect of modifying the strength of each contribution on the final pass-by noise result. This allows system-level development targets to be set. For the sample car, measured pass-by noise contributions for the three most significant contributors are shown in the following figures:• Exhaust orifice contribution overall noise level in Figure 11,
color map in Figure 12. This is by far the strongest contributor to total pass-by noise, so the exhaust system should be the highest priority for improvement efforts.
• Intake orifice contribution overall noise level in Figure 13 and
color map in Figure 14. This is also quite a strong contributor to total pass-by noise.
• Engine noise contribution (effect of acoustical undertray) overall noise level in Figure 15 and color map in Figure 16. This is also quite a strong contributor to total pass-by noise.
Figure 10. Acoustical undertray.
Figure 11. Exhaust orifice contribution: measured (magenta).
Figure 12. Exhaust orifice contribution: measured vs. 1/3-octave frequency.
Figure 13. Intake orifice contribution: measured (magenta).
Figure 14. Intake orifice contribution: measured vs. 1/3-octave frequency.
Figure 16. Engine noise contribution (effect of acoustical undertray): mea-sured vs. 1/3-octave frequency.
Figure 15. Engine noise contribution (effect of acoustical undertray): mea-sured (magenta)

www.SandV.com SOUND & VIBRATION/SEPTEMBER 2015 17
Pass-By Noise Simulation. In a future vehicle development pro-gram, this step might replace the measured pass-by noise source ranking described in the previous section, since it has basically the same objectives.
After vehicle performance has been established, it is appropriate to consider the relative strength of the various noise sources on the vehicle and their contributions to the final pass-by noise result. The objective of this simulation was to provide enough knowledge to direct the efficient development of the vehicle and its systems, tackling the biggest problems with greatest priority.
The authors developed a simplified approach to pass-by noise simulation that showed the trend in pass-by noise results when input parameters were modified. Calculations were performed in 1/3-octave bands and then summed to give overall noise level. These energy summations intrinsically ignore the phase relation-ships between the sources, assuming the sources to be independent. This assumption is reasonable for all but the lowest frequencies, where phase cancellation may be important.
The following information was needed for the pass-by noise simulation:• Source strength of each noise source derived from appropriate
system-level testing or simulation – powertrain (engine and transmission), exhaust and intake orifices, tires.
• Insertion loss due to the car body’s barrier effect on each source.• Acoustic loss, calculated using an ideal monopole source model
due to the changing distance between source and receiver; com-puted from the vehicle performance model described above.Source strength measurements are not detailed here, since these
techniques are widely known. Powertrain noise is classically measured in a semi-anechoic test cell at up to six locations, but in-vehicle methods have recently been developed using particle velocity transducers. Exhaust and intake orifice noise can be readily simulated using one-dimensional, gas-dynamics simula-tions or measured by testing a vehicle on a semi-anechoic chassis dynamometer. Tire noise can be measured on a semi-anechoic chassis dynamometer.
Source strength was represented in terms of acoustic volume velocity, Qsrc. For simulations where peak torque was modified in the performance model, then Qsrc of powertrain sources was adjusted according to a simple proportionality relationship.
Insertion loss due to the car body, Pwith-car/Pwithout-car was mea-sured in a semi-anechoic chamber. Two different noise sources were used to cover the low and high frequency ranges. A recipro-cal arrangement was used, with microphones at the locations of the vehicle noise sources (Figures 17 and 18), and noise sources located at six receiver locations (Figure 19). Sound pressure was measured at the microphones, both with and without the presence of the car, the difference between the two situations providing the insertion loss of the car body.
The simplification to only six receiver locations provided a coarse directionality that, though crude, was found to be adequate to meet the objective of the simulation. Step changes in predicted noise levels can be seen at the boundaries between these insertion loss directions, at vehicle positions –5 m and +9.3 m. But these do not affect the peak levels that form the final result.
Loss due to distance r of an ideal monopole source Px/Qx is calculated according to Equation 1.
Finally, the contribution of each source at the pass-by microphone Psrc is calculated according to Equation 2:
A correction for atmospheric absorption was added4 with the assumptions: 20° C, 20% relative humidity. This has almost no effect below 1 kHz but increases to around 8 dB at 16 kHz at a 20-m distance.
For the sample car, simulated pass-by noise contributions for the three most significant contributors are shown in the following figures:
• Exhaust orifice contribution overall noise level in Figure 20;, color map in Figure 21, as revealed by the noise source ranking measurements. This is by far the strongest contributor to total pass-by noise, so the exhaust system should be the highest prior-ity for improvement efforts.
• Intake orifice contribution overall noise level in Figure 22; color map in Figure 23. This is also quite a strong contributor to total pass-by noise.
• Engine noise contribution overall noise level in Figure 24; color map in Figure 25. This is also quite a strong contributor to total pass-by noiseThe simulated pass-by noise contributions are compared to mea-
sured contributions from the noise source ranking measurements described previously. The simulation appears to be reasonably
Figure 17. Microphones at noise source locations with car present.
Figure 18. Microphones at noise source locations without car present.
Figure 19. Six receiver locations at 1.2 m high (green spots) with noise source locations.
PQ
ir
r ex
xi r c= -
4 12prw w / (1)
. .P QP
PPQsrc src
with car
without car
x
x
= -
-(2)

www.SandV.com18 SOUND & VIBRATION/SEPTEMBER 2015
Figure 20. Exhaust orifice contribution: simulated (blue) vs. measured (magenta).
valid, though certainly not perfect.The effects of pre-acceleration were simulated. For the sample
car with pre-acceleration (testing in 5th gear), the final reported pass-by noise level was 4.8 dB lower than without pre-acceleration (testing in 3rd gear), because the powertrain noise source levels
were reduced due to lower engine speeds. Note again that for automatic transmissions with non-locked ratios, pre-acceleration is not permitted.
Countermeasure Simulation and Development. The above analyses have clearly identified the exhaust orifice as the dominant contributor to pass-by noise, with significant contributions also from the intake orifice and engine noise. Therefore, the simulation model was re-run to calculate the expected change in pass-by noise level from some possible source and path modifications. Exhaust noise was reduced by 6 dB to simulate the effects of an exhaust development effort. Engine noise insertion loss was increased by 3 dB to simulate the effects of adding a well-sealed acoustic un-dertray. With these changes, the final reported pass-by noise level was reduced by 2.2 dB.
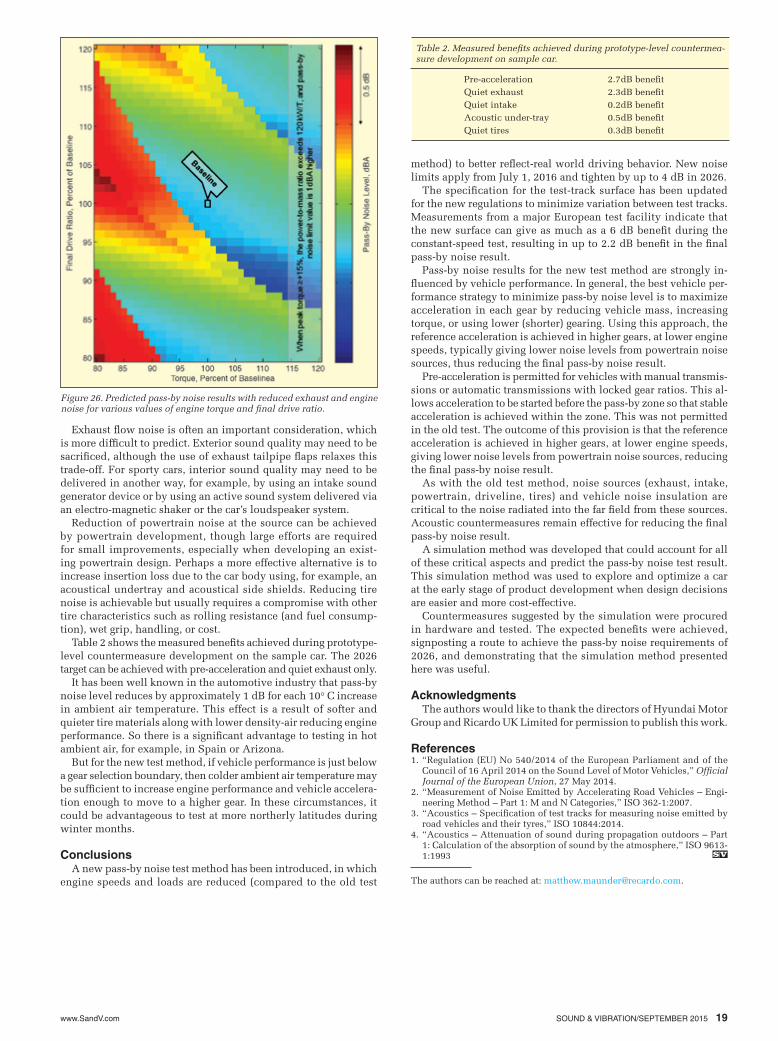
With the modifications in place, pass-by noise was predicted for various values of engine torque and final drive ratio, giving test gear selections as shown in Figure 7. Final reported pass-by noise results are shown in Figure 26. This figure indicates that vehicle performance is already well optimized, with the baseline values of torque and final drive close to a local minimum of pass-by noise
Note that changes of up to 1 dB or more can be realized with relatively modest shifts in performance parameters – emphasizing the benefit of selecting appropriate vehicle performance parameters during the early concept stage of a vehicle product development program.
Countermeasures to reduce noise source strength or to increase insertion loss due to the car body can be developed experimentally when prototype or mule vehicles are available. However, the ben-efits of such countermeasures can be anticipated by manipulating data from a test-based pass-by noise source ranking or a pass-by noise simulation. This allows the most effective countermeasures to be pre-selected.
Reducing exhaust and intake orifice noise is commonly an im-portant countermeasure for pass-by noise. These systems can be carefully developed using 1D gas dynamics simulation. If possible, noise reductions should be made without increasing pressure loss, since this can negatively impact engine performance and lead to pass-by noise testing in a shorter gear at higher engine speeds.
Figure 21. Exhaust orifice contribution: simulated vs. 1/3-octave frequency.
Figure 22. Intake orifice contribution: simulated (blue) vs. measured (ma-genta).
Figure 23. Intake orifice contribution: simulated vs. 1/3-octave frequency.
Figure 24. Engine noise contribution: simulated (blue) vs. measured (ma-genta).
Figure 25 Engine noise contribution: simulated vs. 1/3-octave frequency.
www.SandV.com SOUND & VIBRATION/SEPTEMBER 2015 19
Table 2. Measured bene�ts achieved during prototype-level countermea-sure development on sample car.
Pre-acceleration 2.7dB bene t Quiet exhaust 2.3dB bene t Quiet intake 0.2dB bene t Acoustic under-tray 0.5dB bene t Quiet tires 0.3dB bene t
Figure 26. Predicted pass-by noise results with reduced exhaust and engine noise for various values of engine torque and final drive ratio.
Exhaust flow noise is often an important consideration, which is more difficult to predict. Exterior sound quality may need to be sacrificed, although the use of exhaust tailpipe flaps relaxes this trade-off. For sporty cars, interior sound quality may need to be delivered in another way, for example, by using an intake sound generator device or by using an active sound system delivered via an electro-magnetic shaker or the car’s loudspeaker system.
Reduction of powertrain noise at the source can be achieved by powertrain development, though large efforts are required for small improvements, especially when developing an exist-ing powertrain design. Perhaps a more effective alternative is to increase insertion loss due to the car body using, for example, an acoustical undertray and acoustical side shields. Reducing tire noise is achievable but usually requires a compromise with other tire characteristics such as rolling resistance (and fuel consump-tion), wet grip, handling, or cost.
Table 2 shows the measured benefits achieved during prototype-level countermeasure development on the sample car. The 2026 target can be achieved with pre-acceleration and quiet exhaust only.
It has been well known in the automotive industry that pass-by noise level reduces by approximately 1 dB for each 10° C increase in ambient air temperature. This effect is a result of softer and quieter tire materials along with lower density-air reducing engine performance. So there is a significant advantage to testing in hot ambient air, for example, in Spain or Arizona.
But for the new test method, if vehicle performance is just below a gear selection boundary, then colder ambient air temperature may be sufficient to increase engine performance and vehicle accelera-tion enough to move to a higher gear. In these circumstances, it could be advantageous to test at more northerly latitudes during winter months.
ConclusionsA new pass-by noise test method has been introduced, in which
engine speeds and loads are reduced (compared to the old test
method) to better reflect-real world driving behavior. New noise limits apply from July 1, 2016 and tighten by up to 4 dB in 2026.
The specification for the test-track surface has been updated for the new regulations to minimize variation between test tracks. Measurements from a major European test facility indicate that the new surface can give as much as a 6 dB benefit during the constant-speed test, resulting in up to 2.2 dB benefit in the final pass-by noise result.
Pass-by noise results for the new test method are strongly in-fluenced by vehicle performance. In general, the best vehicle per-formance strategy to minimize pass-by noise level is to maximize acceleration in each gear by reducing vehicle mass, increasing torque, or using lower (shorter) gearing. Using this approach, the reference acceleration is achieved in higher gears, at lower engine speeds, typically giving lower noise levels from powertrain noise sources, thus reducing the final pass-by noise result.
Pre-acceleration is permitted for vehicles with manual transmis-sions or automatic transmissions with locked gear ratios. This al-lows acceleration to be started before the pass-by zone so that stable acceleration is achieved within the zone. This was not permitted in the old test. The outcome of this provision is that the reference acceleration is achieved in higher gears, at lower engine speeds, giving lower noise levels from powertrain noise sources, reducing the final pass-by noise result.
As with the old test method, noise sources (exhaust, intake, powertrain, driveline, tires) and vehicle noise insulation are critical to the noise radiated into the far field from these sources. Acoustic countermeasures remain effective for reducing the final pass-by noise result.
A simulation method was developed that could account for all of these critical aspects and predict the pass-by noise test result. This simulation method was used to explore and optimize a car at the early stage of product development when design decisions are easier and more cost-effective.
Countermeasures suggested by the simulation were procured in hardware and tested. The expected benefits were achieved, signposting a route to achieve the pass-by noise requirements of 2026, and demonstrating that the simulation method presented here was useful.
AcknowledgmentsThe authors would like to thank the directors of Hyundai Motor
Group and Ricardo UK Limited for permission to publish this work.
References1. “Regulation (EU) No 540/2014 of the European Parliament and of the
Council of 16 April 2014 on the Sound Level of Motor Vehicles,” Official Journal of the European Union, 27 May 2014.
2. “Measurement of Noise Emitted by Accelerating Road Vehicles – Engi-neering Method – Part 1: M and N Categories,” ISO 362-1:2007.
3. “Acoustics – Specification of test tracks for measuring noise emitted by road vehicles and their tyres,” ISO 10844:2014.
4. “Acoustics – Attenuation of sound during propagation outdoors – Part 1: Calculation of the absorption of sound by the atmosphere,” ISO 9613-1:1993
The authors can be reached at: [email protected].

![Indoor pass by noise - UNECE · 2018. 1. 23. · noise level measured in a semi-anechoic chamber [dB (A)] 10 dB. Kramer and ald, Comparison of pass-by noise from real track and simulated](https://img.pdfslide.us/doc/110x75/609f06d3e60c8d0e44466656/indoor-pass-by-noise-unece-2018-1-23-noise-level-measured-in-a-semi-anechoic.jpg)