Embed Size (px)
Citation preview
3838
ISSN 2286-4822
www.euacademic.org
EUROPEAN ACADEMIC RESEARCH
Vol. IV, Issue 4/ July 2016
Impact Factor: 3.4546 (UIF)
DRJI Value: 5.9 (B+)
Simulation Internal Partial Discharge Activity
within Void as Function Frequency Using:
COMSL+MATLAB LIVELINK
MOHAMMED IMRAN MOUSA
ZULKURNAIN ABDUL-MALEK
TIJANI HAFEEZ OLASUNKANMI
ADETORO SAHEED AYODEJI
MOHAMMED QASIM ABDULRASOOL
Universiti Teknologi Malaysia (UTM)
Malaysia
Abstract:
The good performance of all power system networks is mainly
determined by the health of dielectric material high voltage equipment.
In this paper Internal Partial discharges within a disc-shape void in
polycarbonate are simulated as function frequency (100-0.01) Hz of
voltage applied. The developing combined mathematical solving
technique, COMSOL + MATLAB LIVLINK, to ameliorating the FEM
analysis. As the solving technique is time and accuracy dependent, the
pre-used solving techniques based mainly on one solver, which was -in
some cases- of low precision and time consuming. Thus, it is of
importance to develop a highly accurate and system responded solving
technique that can simultaneously simulate the changes in any (or all)
of the system parameters. This development implemented to modelling
partial discharge and compare with experimental result of behaviour
partial discharge as function a frequency and voltage applied for disc-
shape cavity that represent by 2D model. This is work explained effect
frequency on behaviour of partial discharge at different voltage applied
and cavity size.
Key words: Partial discharge, Simulation, Finite element method
analysis, Variable frequency, Disc-shape cavity
Mohammed Imran Mousa, Zulkurnain Abdul-Malek, Tijani Hafeez Olasunkanmi,
Adetoro Saheed Ayodeji, Mohammed Qasim Abdulrasool- Simulation Internal
Partial Discharge Activity within Void as Function Frequency Using:
COMSL+MATLAB LIVELINK
EUROPEAN ACADEMIC RESEARCH - Vol. IV, Issue 4 / July 2016
3839
1. INTRODUCTION
The partial discharge activity is normally affecting on
performance of power system because it is influent on health of
insulation system in electrical equipment and might make
possible the breakdown and irrecoverable damage to the
system. For this reason, many researchers described the partial
discharge phenomena to understand behaviour of PD [1-5]. The
cumulative effects of partial discharge in solid dielectric
materials lead to insulations deterioration and reduce the
electrical strength of it. The important factors that affecting on
behaviour of partial discharge within cavity are the basic
characteristics of the dielectric material, the field intensity, the
cavity geometry, the distance between electrodes, the pressure
of void, and characteristics of the gas filling a void.
The Physical modelling of partial discharge in dielectric
material within cavity Provides significant information into PD
mechanisms, in addition to description for several features of
the Partial discharge pattern [1,2]. Suitable models depicting
the behaviour of partial discharge within void in solid
insulation became a subject of increasing interest [3-8]. Gemant
& Philippoff in 1932 modelled PD within void and symbolized
by sample circuit known as the capacitance model, then
developed to Whitehead model of the three capacitors and the
Maxwellian approach (Pedersen mostly) [6]. In recent years, by
using computer to assist processing technique has facilitated
modelling partial discharge, Especially phase resolved partial
discharge (PD) measurement systems became very common[9-
14].
Forssén in 2005, a finite element analysis model has
been developed by using COMSOL software to depict Partial
discharge activity to study an effect factors on the behaviour of
PD activity [15], then Illias improved the model of PD by using
(FEA) software in parallel with a mathematical package to
Mohammed Imran Mousa, Zulkurnain Abdul-Malek, Tijani Hafeez Olasunkanmi,
Adetoro Saheed Ayodeji, Mohammed Qasim Abdulrasool- Simulation Internal
Partial Discharge Activity within Void as Function Frequency Using:
COMSL+MATLAB LIVELINK
EUROPEAN ACADEMIC RESEARCH - Vol. IV, Issue 4 / July 2016
3840
enhance the finite element analysis[16]. The modelling partial
discharge using (FEA) is complex analysis due to there is many
factors caused numerical convergence problems during
simulation. The inception voltage that is one of the necessary
conditions to partial discharge occurrence within voids in solid
insulation depends upon many factors such as the type of gas in
the void, the gas pressure, surface properties of the void, size
and shape of the void, and dielectric constant of the
surrounding medium [17]. the inception voltage magnitude
comes to be equal to various materials that have the same
cavity since it is independent of the permittivity of insulation
material [18].
The advantage of modelling dynamic partial discharge is
that the parameters which may influence on PD activity under
diverse conditions can be readily evaluated, for this reason a lot
of authors modelling partial discharge. In this work, the
simulation of dynamic partial discharge activity has been
developed combined two mathematical solving technique
COMSOL + MATLAB LIVLINK, to improving the FEM
analysis in parallel with a mathematical bundle using
MATLAB code and used the development of inception voltage
which depend on permittivity of insulation material [17].For
different diameter of disc-shape cavity in polycarbonate with
various applied voltage and range of frequency have been
carried, The simulation data are compared with the
experimental results to study behaviour of partial discharge
[19].
2 PARAMETERS OF PARTIAL DISCHARGE MODEL
There are two types of parameters that have been introduced in
PD modelling and simulation studies are:
Mohammed Imran Mousa, Zulkurnain Abdul-Malek, Tijani Hafeez Olasunkanmi,
Adetoro Saheed Ayodeji, Mohammed Qasim Abdulrasool- Simulation Internal
Partial Discharge Activity within Void as Function Frequency Using:
COMSL+MATLAB LIVELINK
EUROPEAN ACADEMIC RESEARCH - Vol. IV, Issue 4 / July 2016
3841
a. The parameters related with surface charge
deterioration after Partial Discharge occurrence are:-
1. The effective lifetime of De-trappable electron in the void
surface (ttrap).
2. Conductivity of void surface (σsf).
3. Electrons injected into the insulation and the void per unit
time.
b. The Parameters related with the void size are:-
1. Inception voltage VI.
2. Extinction voltage Vext.
3. The critical current for an electron avalanche to develop Icrit.
A lower trap or higher σsf may increase the surface charge decay
rate through diffusion into deeper traps or conduction along the
cavity wall respectively, reducing the number of electrons
available for the next PD occurrence and increasing the time
waiting for PD initiator electron (tstat) to become available.
3 MODELLING OF PD
A. Field Equations
The electric potential distribution in the dielectric is described
by the field model. The basic governing equations of the field
model are as follows:
……….. (1)
…….. (2)
Where the D is the electrical displacement field, ρf is the free
electron density and Jf is the free current density. On the
assumption that the insulation is non-dispersive material,
linear isotropic with an instantaneous polarization which is
exposed to a tardily altering field, can write equ.1 as:
Mohammed Imran Mousa, Zulkurnain Abdul-Malek, Tijani Hafeez Olasunkanmi,
Adetoro Saheed Ayodeji, Mohammed Qasim Abdulrasool- Simulation Internal
Partial Discharge Activity within Void as Function Frequency Using:
COMSL+MATLAB LIVELINK
EUROPEAN ACADEMIC RESEARCH - Vol. IV, Issue 4 / July 2016
3842
( )
Then
( )
Where E is electric field, ε°, εr are the permittivity of vacuum
and relative respectively and V is the electric potential, then
the equ.2 can be written as:
( ) (
)……….. (3)
From equation (3), σ is conductivity of insulation material, the
finite element analysis software can solve equation this
equation.
B. MODEL GEOMETRY AND MESH
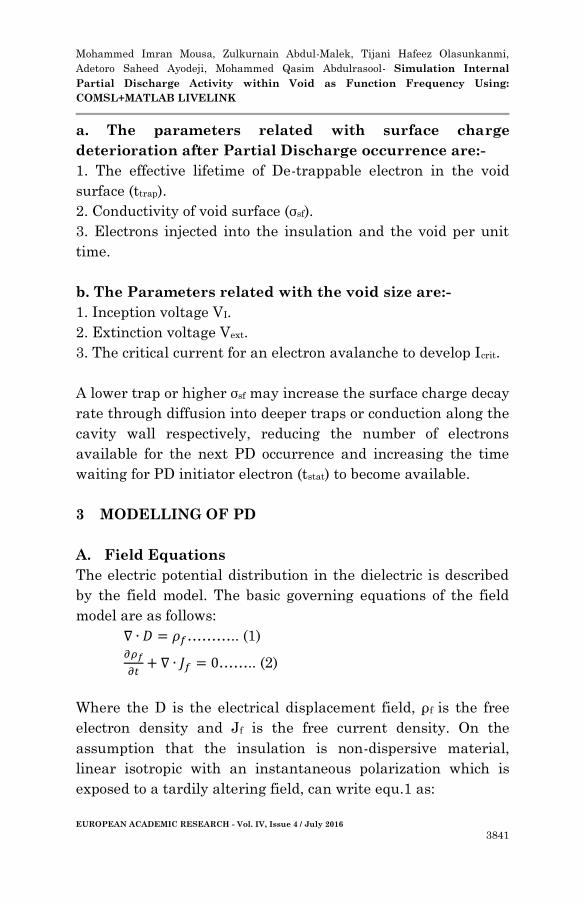
It depends on the test sample of experimental measurement
created model geometry as shown in fig 1 [20]. The model is
employed using two-dimensional (2D) symmetric FEA analysis
using COMSOL and MATLAB LIVLINK depend on a field
model that solves electric potentials and interfaces with
MATLAB code. The model consists of a homogenous insulation
material (εr=3), the sample consist of three layer from
polycarbonate, each layer has 1.0 mm thickness and 30 mm
width, disc-shape cavity of (1.5,4) mm diameter and a void
surface of 0.1 mm thickness to allow the modelling of surface
charge decay through conduction along the void wall. A
sinusoidal AC voltage is applied to the upper electrode while
the lower electrode is always grounded. FEA model is used
continuously throughout the simulation to calculate the field
distribution in the void. This is achieved in FEA modelling by
assuming that during a PD event, the whole cavity is affected.
Mohammed Imran Mousa, Zulkurnain Abdul-Malek, Tijani Hafeez Olasunkanmi,
Adetoro Saheed Ayodeji, Mohammed Qasim Abdulrasool- Simulation Internal
Partial Discharge Activity within Void as Function Frequency Using:
COMSL+MATLAB LIVELINK
EUROPEAN ACADEMIC RESEARCH - Vol. IV, Issue 4 / July 2016
3843
FIG. 1 2D axial-symmetric model geometry contain three of
polycarbonate each one 1mm×30mm and cylindrical air void (1.5, 4)
mm×1mm.
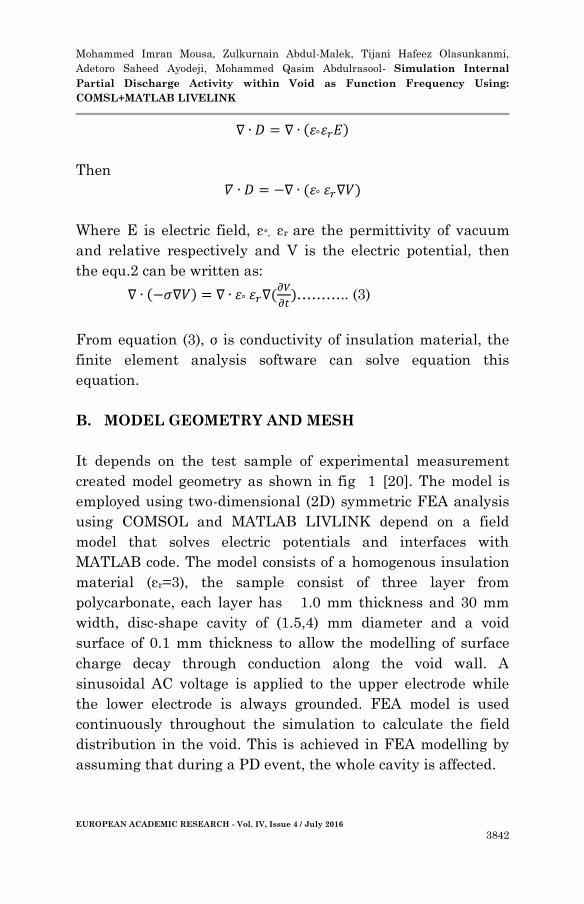
A mapped mesh with Free Triangular elements is used, the
element size parameters are:
1. The maximum element size =0.76mm.
2. The minimum element size =0.0029mm.
3. The maximum element growth rate =1.2
4. Resolution of curvature =0.25
5. Resolution of narrow regions =1
The mapped mesh is chosen instead of an unstructured mesh to
make it easier to control the element density in the thin cavity
surface as show in fig 2. The number of element depends on size
of sample.
FIG. 2 Generated mesh of model.
C. DISCHARGE
The partial discharge may be occurring when the voltage inside
cavity exceeds the inception voltage and there is initial free
electron present. The inception voltage (VI) across cavity for
partial discharge has been developed by [17],whereas VI written
as:
Mohammed Imran Mousa, Zulkurnain Abdul-Malek, Tijani Hafeez Olasunkanmi,
Adetoro Saheed Ayodeji, Mohammed Qasim Abdulrasool- Simulation Internal
Partial Discharge Activity within Void as Function Frequency Using:
COMSL+MATLAB LIVELINK
EUROPEAN ACADEMIC RESEARCH - Vol. IV, Issue 4 / July 2016
3844
(
( ) )(
[ ( )]
)….. (4)
Whereas t’ is the thickness of void, t is the thickness of
insulation, B constant depend on gas inside void where for air is
2737.50 V/kPa-cm [21,22], the pressure of air in gap assumed
77 KPa [18],and k=M (pt’)N, M and N are constants as given for
air 3.5134and 0.0599 respectively [23].there are three source to
generate electron because of surface emission, the electrons of
shallow traps (Ned), free surface electrons (Nes) and electrons
injected from electrode (Nei) ,the electrons generated from
shallow traps(Ned) can be written as[16]:
( ) ( ( )
)
(
) …… (5)
And
{ ( )
( )
From equation (5), Ned0 is initial electron of sallow traps, VPD is
the voltage inside void of Previous partial discharge happened,
t is the time interval between the previous and new PD, ttrap is
effective age of electrons generated from shallow traps, the
initial electrons classified into two magnitude high number of
electron (NedoH) and low number of electrons(NedoL),whereas the
choose one of them depend on the polarity of cavity voltage and
surface voltage ,if the same polarity use high value and vice
versa.
The free surface electron can be written as:
( ) ( ( )
) (
( )
( ))…… (6)
From equation (6),Neso is the initial free cavity surface electron,
Vsf is the voltage of cavity surface and the cavity surface voltage
after partial discharge instantly, Therefore the total electron
generated (Net) calculated by equation below:
Mohammed Imran Mousa, Zulkurnain Abdul-Malek, Tijani Hafeez Olasunkanmi,
Adetoro Saheed Ayodeji, Mohammed Qasim Abdulrasool- Simulation Internal
Partial Discharge Activity within Void as Function Frequency Using:
COMSL+MATLAB LIVELINK
EUROPEAN ACADEMIC RESEARCH - Vol. IV, Issue 4 / July 2016
3845
( ) ( ( ) ( ) ) , ( ( )
)-……. (7)
From equation 7, Nei is the electron injected by electrode; Vcav
is the voltage inside cavity.
The conductivity of cavity change during partial
discharge depend on voltage and current inside cavity, from
Vcav,VI ,Icav and critical current (Icr), the conductivity of cavity
calculate by:
( ) * ⟦ * ( ( )
) (
( )
)+⟧+…. (8)
From equation 8, σmax is the maximum cavity conductivity and
Icr is critical current to start electron avalanche[24,25],when the
voltage inside cavity exceed the inception voltage, the
probability of occur partial discharge calculate by:
( ) ( ( ) ) …… (9)
From equation 8,dt is the time step interval[24,25],then the
result from equation 8 compare to random vector the value of
vector from 0 to 1 and length of vector is same number of step
times multiply by the number of cycles, the partial discharge
occur when the PD large than random vector.
The conductivity of surface cavity depend on polarity of
cavity voltage and the surface voltage, when the polarity is
same the conductivity reset depend on voltage cavity and
voltage decay Vdca ,can calculate by:
( ) . ( ( )
⁄ )/ ….. (10)
From equation 10, σsf is the initial conductivity of surface
cavity; if the polarity is different the conductivity is equal
initial value.
Mohammed Imran Mousa, Zulkurnain Abdul-Malek, Tijani Hafeez Olasunkanmi,
Adetoro Saheed Ayodeji, Mohammed Qasim Abdulrasool- Simulation Internal
Partial Discharge Activity within Void as Function Frequency Using:
COMSL+MATLAB LIVELINK
EUROPEAN ACADEMIC RESEARCH - Vol. IV, Issue 4 / July 2016
3846
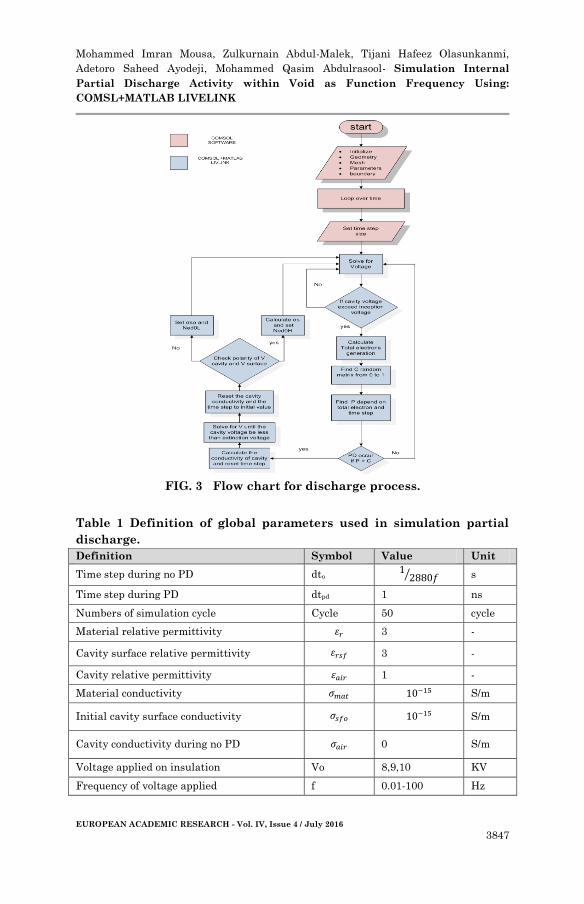
4 DISCHARGE PROCESS
Partial discharge simulation demonstrated by flow chart shown
in fig 3 ,COMSOL and MATLAB LIVLINK using to solve the
electric field by finite element analysis. The discharge in void
inside insulation modelled dynamic by change the conductivity
of cavity and charge decay. The maximum conductivity of the
void during discharge and critical current are chosen to avoid
numerical convergence error [26,16] also from literature chosen
the value of voltage decay. The extinction voltage and inception
voltage are adjusted to get agree with measurement results for
each frequency. The maximum surface conductivity depend on
the voltage applied , frequency and thickness of sample[18],it is
limit to avoid numerical error can calculated by:
(
) …….. (11)
Where α and β are constant and 0.4054 m/V
respectively.
The electrons generated Net is assumed constant and
control by exponential of ratio voltage cavity with inception
voltage and the value of Net depend on frequency whereas the
generation of electron increase when the frequency increase
[26],the initial magnitude of electron generator when the
frequency 100Hz and 50Hz is 500 1/s ,300 1/s for frequency
10Hz,1Hz and 0.1Hz and for frequency 0.01Hz the magnitude
of electron generation is 150 1/s. the magnitude of initial
electron generated by charge de-trapping ,electron generated by
surface charge and electrons injection by electrode adjusted to
obtain agreement with experimental result. The effective
lifetime of electron is constant 2ms[18] .the global parameters
used in simulation explained by table 1.
Mohammed Imran Mousa, Zulkurnain Abdul-Malek, Tijani Hafeez Olasunkanmi,
Adetoro Saheed Ayodeji, Mohammed Qasim Abdulrasool- Simulation Internal
Partial Discharge Activity within Void as Function Frequency Using:
COMSL+MATLAB LIVELINK
EUROPEAN ACADEMIC RESEARCH - Vol. IV, Issue 4 / July 2016
3847
FIG. 3 Flow chart for discharge process.
Table 1 Definition of global parameters used in simulation partial
discharge.
Definition Symbol Value Unit
Time step during no PD dto
⁄ s
Time step during PD dtpd 1 ns
Numbers of simulation cycle Cycle 50 cycle
Material relative permittivity 3 -
Cavity surface relative permittivity 3 -
Cavity relative permittivity 1 -
Material conductivity S/m
Initial cavity surface conductivity S/m
Cavity conductivity during no PD 0 S/m
Voltage applied on insulation Vo 8,9,10 KV
Frequency of voltage applied f 0.01-100 Hz
Mohammed Imran Mousa, Zulkurnain Abdul-Malek, Tijani Hafeez Olasunkanmi,
Adetoro Saheed Ayodeji, Mohammed Qasim Abdulrasool- Simulation Internal
Partial Discharge Activity within Void as Function Frequency Using:
COMSL+MATLAB LIVELINK
EUROPEAN ACADEMIC RESEARCH - Vol. IV, Issue 4 / July 2016
3848
Diameter of cavity d 1.5,4 mm
Diameter Surface cavity ds 0.1 mm
Initial cavity inception voltage VIo 4900 V
Initial extinction voltage Vexto 1100 V
voltage decay Vdca 100 V
Critical current Icr A
Conductivity of cavity during PD S/m
5 RESULT AND DISCUSSION
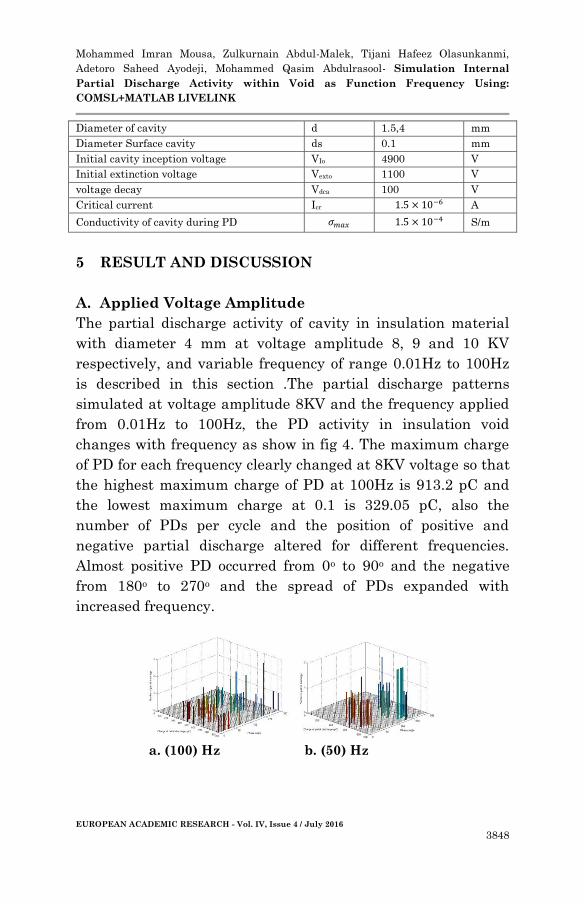
A. Applied Voltage Amplitude
The partial discharge activity of cavity in insulation material
with diameter 4 mm at voltage amplitude 8, 9 and 10 KV
respectively, and variable frequency of range 0.01Hz to 100Hz
is described in this section .The partial discharge patterns
simulated at voltage amplitude 8KV and the frequency applied
from 0.01Hz to 100Hz, the PD activity in insulation void
changes with frequency as show in fig 4. The maximum charge
of PD for each frequency clearly changed at 8KV voltage so that
the highest maximum charge of PD at 100Hz is 913.2 pC and
the lowest maximum charge at 0.1 is 329.05 pC, also the
number of PDs per cycle and the position of positive and
negative partial discharge altered for different frequencies.
Almost positive PD occurred from 0o to 90o and the negative
from 180o to 270o and the spread of PDs expanded with
increased frequency.
a. (100) Hz b. (50) Hz
Mohammed Imran Mousa, Zulkurnain Abdul-Malek, Tijani Hafeez Olasunkanmi,
Adetoro Saheed Ayodeji, Mohammed Qasim Abdulrasool- Simulation Internal
Partial Discharge Activity within Void as Function Frequency Using:
COMSL+MATLAB LIVELINK
EUROPEAN ACADEMIC RESEARCH - Vol. IV, Issue 4 / July 2016
3849
c. (10) Hz d. (1) Hz
e. (0.1) Hz f. (0.01) Hz
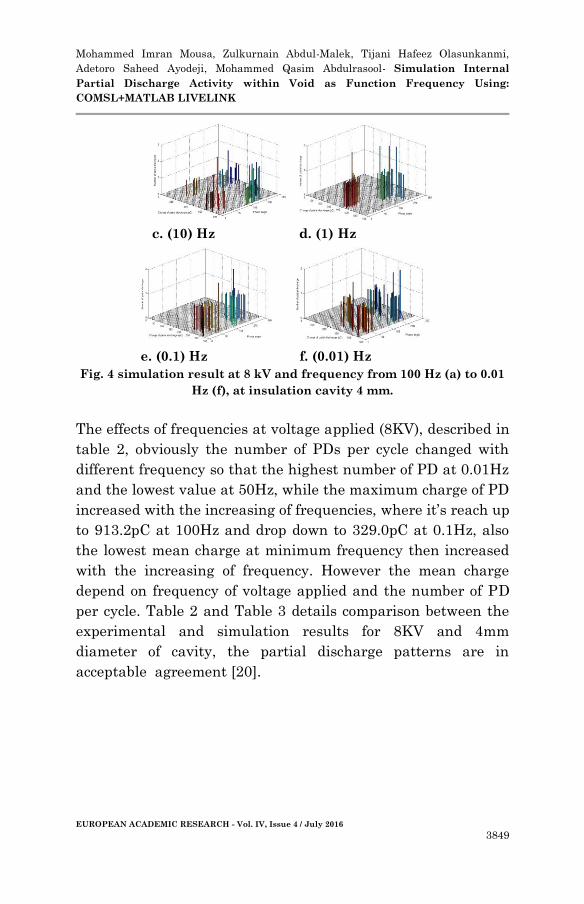
Fig. 4 simulation result at 8 kV and frequency from 100 Hz (a) to 0.01
Hz (f), at insulation cavity 4 mm.
The effects of frequencies at voltage applied (8KV), described in
table 2, obviously the number of PDs per cycle changed with
different frequency so that the highest number of PD at 0.01Hz
and the lowest value at 50Hz, while the maximum charge of PD
increased with the increasing of frequencies, where it’s reach up
to 913.2pC at 100Hz and drop down to 329.0pC at 0.1Hz, also
the lowest mean charge at minimum frequency then increased
with the increasing of frequency. However the mean charge
depend on frequency of voltage applied and the number of PD
per cycle. Table 2 and Table 3 details comparison between the
experimental and simulation results for 8KV and 4mm
diameter of cavity, the partial discharge patterns are in
acceptable agreement [20].
Mohammed Imran Mousa, Zulkurnain Abdul-Malek, Tijani Hafeez Olasunkanmi,
Adetoro Saheed Ayodeji, Mohammed Qasim Abdulrasool- Simulation Internal
Partial Discharge Activity within Void as Function Frequency Using:
COMSL+MATLAB LIVELINK
EUROPEAN ACADEMIC RESEARCH - Vol. IV, Issue 4 / July 2016
3850
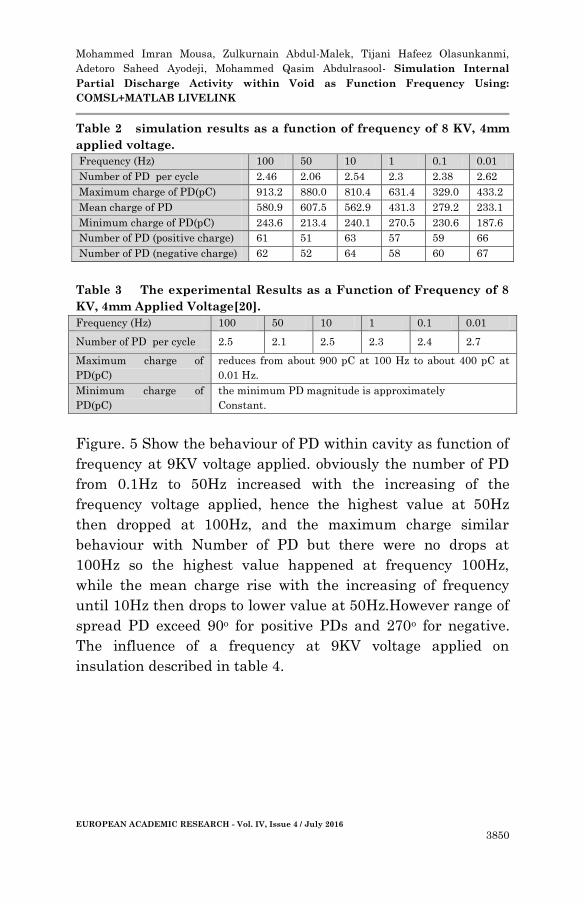
Table 2 simulation results as a function of frequency of 8 KV, 4mm
applied voltage.
Frequency (Hz) 100 50 10 1 0.1 0.01
Number of PD per cycle 2.46 2.06 2.54 2.3 2.38 2.62
Maximum charge of PD(pC) 913.2 880.0 810.4 631.4 329.0 433.2
Mean charge of PD 580.9 607.5 562.9 431.3 279.2 233.1
Minimum charge of PD(pC) 243.6 213.4 240.1 270.5 230.6 187.6
Number of PD (positive charge) 61 51 63 57 59 66
Number of PD (negative charge) 62 52 64 58 60 67
Table 3 The experimental Results as a Function of Frequency of 8
KV, 4mm Applied Voltage[20].
Frequency (Hz) 100 50 10 1 0.1 0.01
Number of PD per cycle 2.5 2.1 2.5 2.3 2.4 2.7
Maximum charge of
PD(pC)
reduces from about 900 pC at 100 Hz to about 400 pC at
0.01 Hz.
Minimum charge of
PD(pC)
the minimum PD magnitude is approximately
Constant.
Figure. 5 Show the behaviour of PD within cavity as function of
frequency at 9KV voltage applied. obviously the number of PD
from 0.1Hz to 50Hz increased with the increasing of the
frequency voltage applied, hence the highest value at 50Hz
then dropped at 100Hz, and the maximum charge similar
behaviour with Number of PD but there were no drops at
100Hz so the highest value happened at frequency 100Hz,
while the mean charge rise with the increasing of frequency
until 10Hz then drops to lower value at 50Hz.However range of
spread PD exceed 90o for positive PDs and 270o for negative.
The influence of a frequency at 9KV voltage applied on
insulation described in table 4.
Mohammed Imran Mousa, Zulkurnain Abdul-Malek, Tijani Hafeez Olasunkanmi,
Adetoro Saheed Ayodeji, Mohammed Qasim Abdulrasool- Simulation Internal
Partial Discharge Activity within Void as Function Frequency Using:
COMSL+MATLAB LIVELINK
EUROPEAN ACADEMIC RESEARCH - Vol. IV, Issue 4 / July 2016
3851
a. (100) Hz b. (50) Hz
c. (10) Hz d. (1) Hz
e. (0.1) Hz f. (0.01) Hz
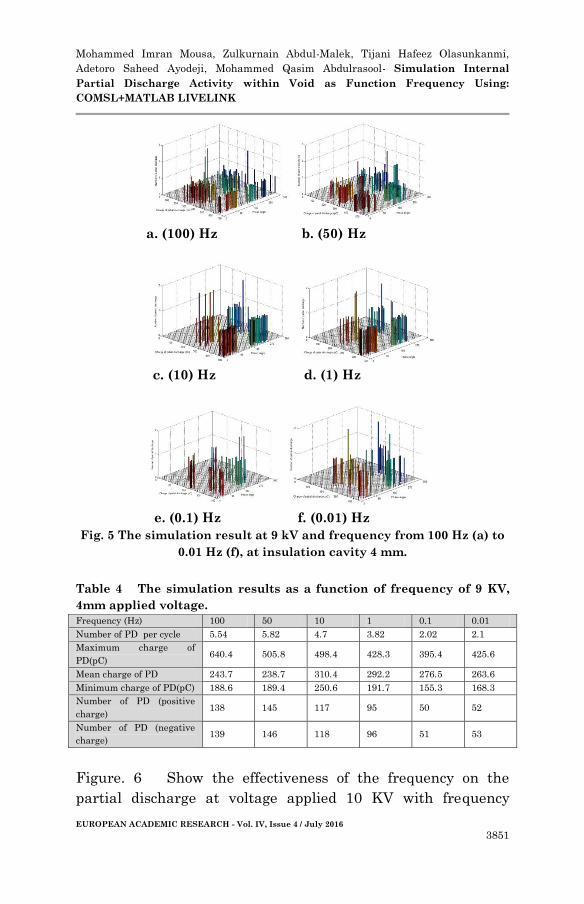
Fig. 5 The simulation result at 9 kV and frequency from 100 Hz (a) to
0.01 Hz (f), at insulation cavity 4 mm.
Table 4 The simulation results as a function of frequency of 9 KV,
4mm applied voltage.
Frequency (Hz) 100 50 10 1 0.1 0.01
Number of PD per cycle 5.54 5.82 4.7 3.82 2.02 2.1
Maximum charge of
PD(pC) 640.4 505.8 498.4 428.3 395.4 425.6
Mean charge of PD 243.7 238.7 310.4 292.2 276.5 263.6
Minimum charge of PD(pC) 188.6 189.4 250.6 191.7 155.3 168.3
Number of PD (positive
charge) 138 145 117 95 50 52
Number of PD (negative
charge) 139 146 118 96 51 53
Figure. 6 Show the effectiveness of the frequency on the
partial discharge at voltage applied 10 KV with frequency
Mohammed Imran Mousa, Zulkurnain Abdul-Malek, Tijani Hafeez Olasunkanmi,
Adetoro Saheed Ayodeji, Mohammed Qasim Abdulrasool- Simulation Internal
Partial Discharge Activity within Void as Function Frequency Using:
COMSL+MATLAB LIVELINK
EUROPEAN ACADEMIC RESEARCH - Vol. IV, Issue 4 / July 2016
3852
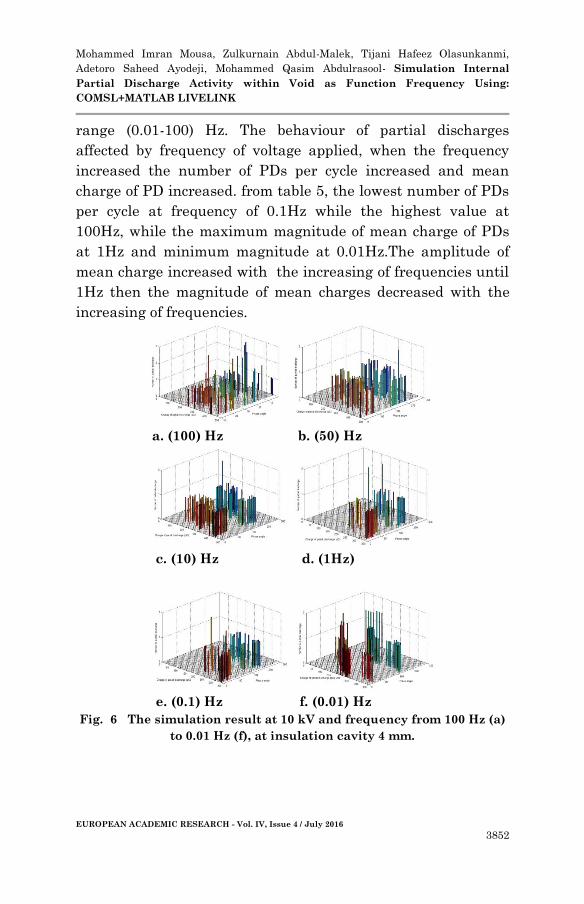
range (0.01-100) Hz. The behaviour of partial discharges
affected by frequency of voltage applied, when the frequency
increased the number of PDs per cycle increased and mean
charge of PD increased. from table 5, the lowest number of PDs
per cycle at frequency of 0.1Hz while the highest value at
100Hz, while the maximum magnitude of mean charge of PDs
at 1Hz and minimum magnitude at 0.01Hz.The amplitude of
mean charge increased with the increasing of frequencies until
1Hz then the magnitude of mean charges decreased with the
increasing of frequencies.
a. (100) Hz b. (50) Hz
c. (10) Hz d. (1Hz)
e. (0.1) Hz f. (0.01) Hz
Fig. 6 The simulation result at 10 kV and frequency from 100 Hz (a)
to 0.01 Hz (f), at insulation cavity 4 mm.
Mohammed Imran Mousa, Zulkurnain Abdul-Malek, Tijani Hafeez Olasunkanmi,
Adetoro Saheed Ayodeji, Mohammed Qasim Abdulrasool- Simulation Internal
Partial Discharge Activity within Void as Function Frequency Using:
COMSL+MATLAB LIVELINK
EUROPEAN ACADEMIC RESEARCH - Vol. IV, Issue 4 / July 2016
3853
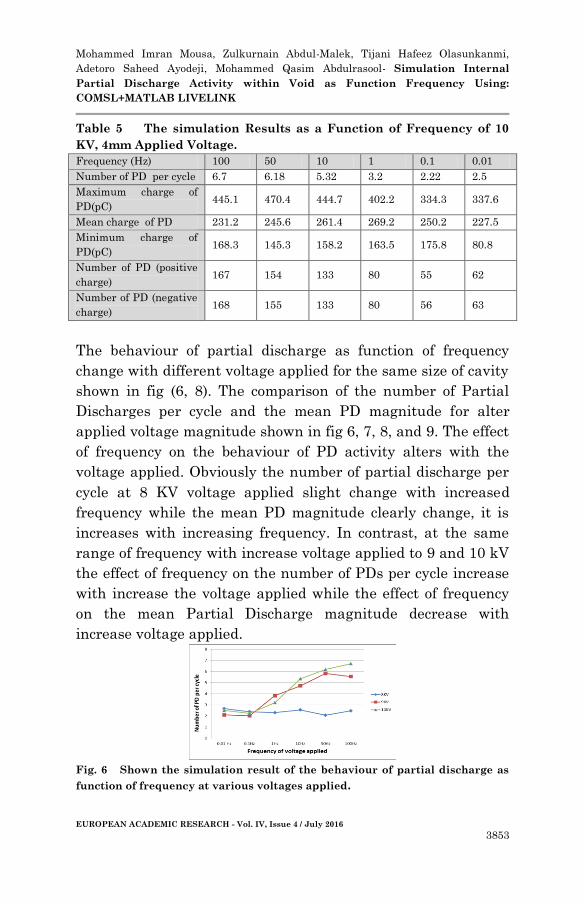
Table 5 The simulation Results as a Function of Frequency of 10
KV, 4mm Applied Voltage.
Frequency (Hz) 100 50 10 1 0.1 0.01
Number of PD per cycle 6.7 6.18 5.32 3.2 2.22 2.5
Maximum charge of
PD(pC) 445.1 470.4 444.7 402.2 334.3 337.6
Mean charge of PD 231.2 245.6 261.4 269.2 250.2 227.5
Minimum charge of
PD(pC) 168.3 145.3 158.2 163.5 175.8 80.8
Number of PD (positive
charge) 167 154 133 80 55 62
Number of PD (negative
charge) 168 155 133 80 56 63
The behaviour of partial discharge as function of frequency
change with different voltage applied for the same size of cavity
shown in fig (6, 8). The comparison of the number of Partial
Discharges per cycle and the mean PD magnitude for alter
applied voltage magnitude shown in fig 6, 7, 8, and 9. The effect
of frequency on the behaviour of PD activity alters with the
voltage applied. Obviously the number of partial discharge per
cycle at 8 KV voltage applied slight change with increased
frequency while the mean PD magnitude clearly change, it is
increases with increasing frequency. In contrast, at the same
range of frequency with increase voltage applied to 9 and 10 kV
the effect of frequency on the number of PDs per cycle increase
with increase the voltage applied while the effect of frequency
on the mean Partial Discharge magnitude decrease with
increase voltage applied.
Fig. 6 Shown the simulation result of the behaviour of partial discharge as
function of frequency at various voltages applied.
Mohammed Imran Mousa, Zulkurnain Abdul-Malek, Tijani Hafeez Olasunkanmi,
Adetoro Saheed Ayodeji, Mohammed Qasim Abdulrasool- Simulation Internal
Partial Discharge Activity within Void as Function Frequency Using:
COMSL+MATLAB LIVELINK
EUROPEAN ACADEMIC RESEARCH - Vol. IV, Issue 4 / July 2016
3854
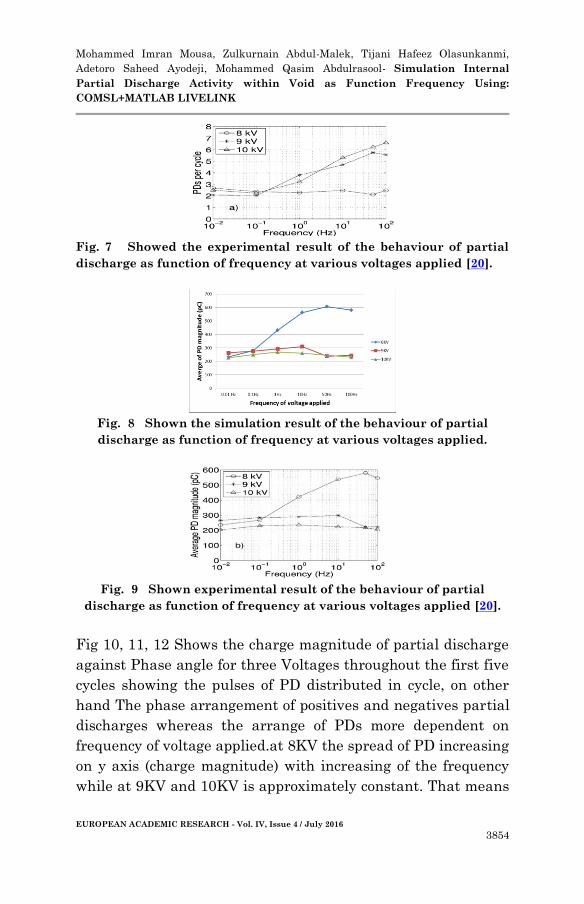
Fig. 7 Showed the experimental result of the behaviour of partial
discharge as function of frequency at various voltages applied [20].
Fig. 8 Shown the simulation result of the behaviour of partial
discharge as function of frequency at various voltages applied.
Fig. 9 Shown experimental result of the behaviour of partial
discharge as function of frequency at various voltages applied [20].
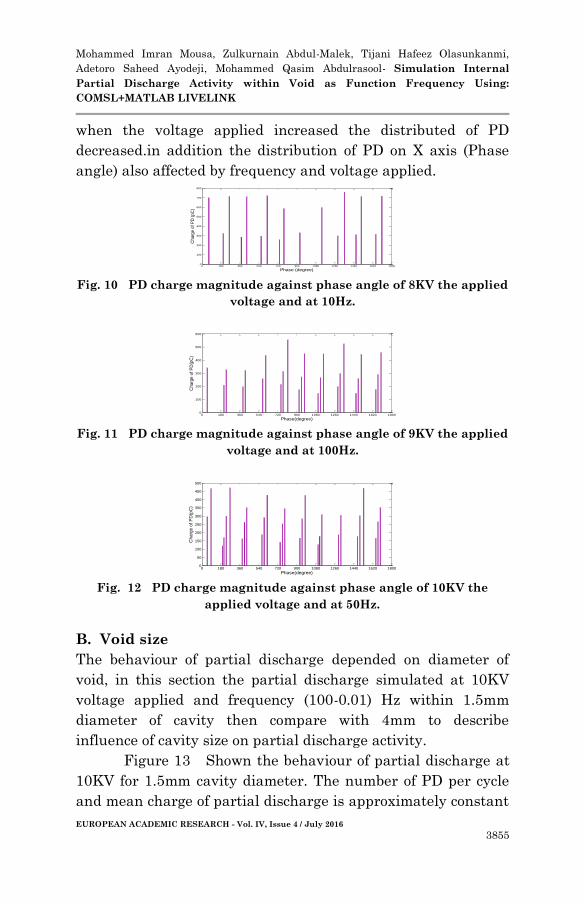
Fig 10, 11, 12 Shows the charge magnitude of partial discharge
against Phase angle for three Voltages throughout the first five
cycles showing the pulses of PD distributed in cycle, on other
hand The phase arrangement of positives and negatives partial
discharges whereas the arrange of PDs more dependent on
frequency of voltage applied.at 8KV the spread of PD increasing
on y axis (charge magnitude) with increasing of the frequency
while at 9KV and 10KV is approximately constant. That means
Mohammed Imran Mousa, Zulkurnain Abdul-Malek, Tijani Hafeez Olasunkanmi,
Adetoro Saheed Ayodeji, Mohammed Qasim Abdulrasool- Simulation Internal
Partial Discharge Activity within Void as Function Frequency Using:
COMSL+MATLAB LIVELINK
EUROPEAN ACADEMIC RESEARCH - Vol. IV, Issue 4 / July 2016
3855
when the voltage applied increased the distributed of PD
decreased.in addition the distribution of PD on X axis (Phase
angle) also affected by frequency and voltage applied.
Fig. 10 PD charge magnitude against phase angle of 8KV the applied
voltage and at 10Hz.
Fig. 11 PD charge magnitude against phase angle of 9KV the applied
voltage and at 100Hz.
Fig. 12 PD charge magnitude against phase angle of 10KV the
applied voltage and at 50Hz.
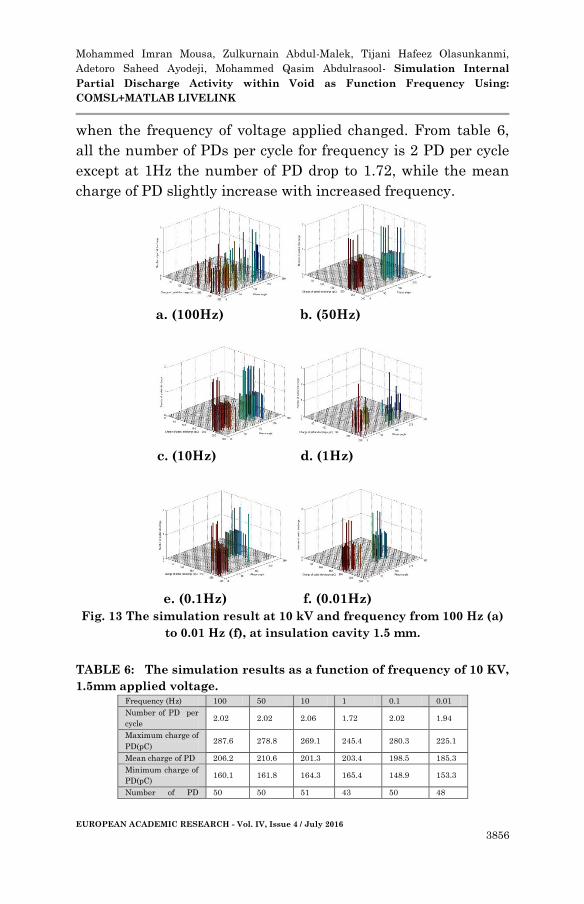
B. Void size
The behaviour of partial discharge depended on diameter of
void, in this section the partial discharge simulated at 10KV
voltage applied and frequency (100-0.01) Hz within 1.5mm
diameter of cavity then compare with 4mm to describe
influence of cavity size on partial discharge activity.
Figure 13 Shown the behaviour of partial discharge at
10KV for 1.5mm cavity diameter. The number of PD per cycle
and mean charge of partial discharge is approximately constant
0 180 360 540 720 900 1080 1260 1440 1620 18000
100
200
300
400
500
600
700
800
Phase (degree)
Ch
arg
e o
f P
D (
pC
)
0 180 360 540 720 900 1080 1260 1440 1620 18000
100
200
300
400
500
600
Phase(degree)
Charg
e o
f P
D(p
C)
0 180 360 540 720 900 1080 1260 1440 1620 18000
50
100
150
200
250
300
350
400
450
500
Phase(degree)
Charg
e o
f P
D(p
C)
Mohammed Imran Mousa, Zulkurnain Abdul-Malek, Tijani Hafeez Olasunkanmi,
Adetoro Saheed Ayodeji, Mohammed Qasim Abdulrasool- Simulation Internal
Partial Discharge Activity within Void as Function Frequency Using:
COMSL+MATLAB LIVELINK
EUROPEAN ACADEMIC RESEARCH - Vol. IV, Issue 4 / July 2016
3856
when the frequency of voltage applied changed. From table 6,
all the number of PDs per cycle for frequency is 2 PD per cycle
except at 1Hz the number of PD drop to 1.72, while the mean
charge of PD slightly increase with increased frequency.
a. (100Hz) b. (50Hz)
c. (10Hz) d. (1Hz)
e. (0.1Hz) f. (0.01Hz)
Fig. 13 The simulation result at 10 kV and frequency from 100 Hz (a)
to 0.01 Hz (f), at insulation cavity 1.5 mm.
TABLE 6: The simulation results as a function of frequency of 10 KV,
1.5mm applied voltage. Frequency (Hz) 100 50 10 1 0.1 0.01
Number of PD per
cycle 2.02 2.02 2.06 1.72 2.02 1.94
Maximum charge of
PD(pC) 287.6 278.8 269.1 245.4 280.3 225.1
Mean charge of PD 206.2 210.6 201.3 203.4 198.5 185.3
Minimum charge of
PD(pC) 160.1 161.8 164.3 165.4 148.9 153.3
Number of PD 50 50 51 43 50 48
Mohammed Imran Mousa, Zulkurnain Abdul-Malek, Tijani Hafeez Olasunkanmi,
Adetoro Saheed Ayodeji, Mohammed Qasim Abdulrasool- Simulation Internal
Partial Discharge Activity within Void as Function Frequency Using:
COMSL+MATLAB LIVELINK
EUROPEAN ACADEMIC RESEARCH - Vol. IV, Issue 4 / July 2016
3857
(positive charge)
Number of PD
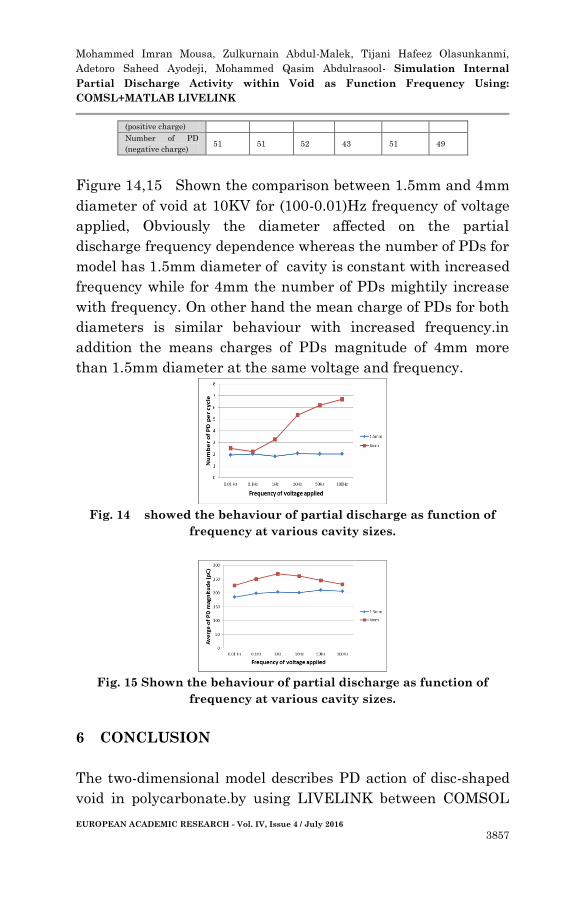
(negative charge) 51 51 52 43 51 49
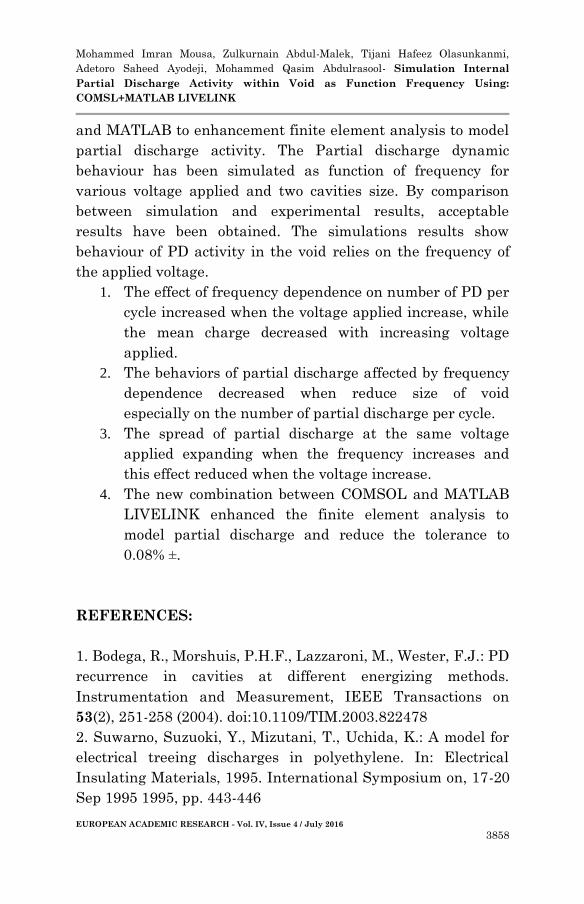
Figure 14,15 Shown the comparison between 1.5mm and 4mm
diameter of void at 10KV for (100-0.01)Hz frequency of voltage
applied, Obviously the diameter affected on the partial
discharge frequency dependence whereas the number of PDs for
model has 1.5mm diameter of cavity is constant with increased
frequency while for 4mm the number of PDs mightily increase
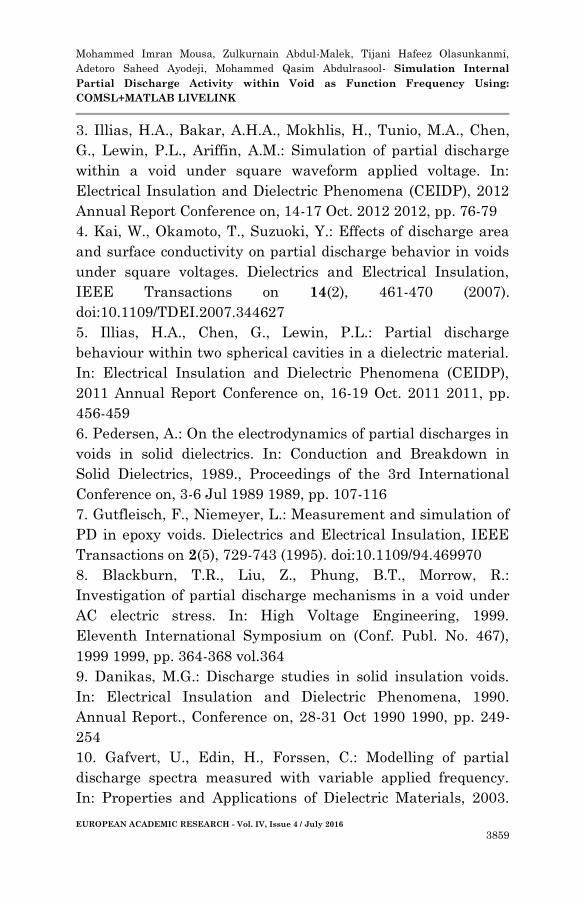
with frequency. On other hand the mean charge of PDs for both
diameters is similar behaviour with increased frequency.in
addition the means charges of PDs magnitude of 4mm more
than 1.5mm diameter at the same voltage and frequency.
Fig. 14 showed the behaviour of partial discharge as function of
frequency at various cavity sizes.
Fig. 15 Shown the behaviour of partial discharge as function of
frequency at various cavity sizes.
6 CONCLUSION
The two-dimensional model describes PD action of disc-shaped
void in polycarbonate.by using LIVELINK between COMSOL
Mohammed Imran Mousa, Zulkurnain Abdul-Malek, Tijani Hafeez Olasunkanmi,
Adetoro Saheed Ayodeji, Mohammed Qasim Abdulrasool- Simulation Internal
Partial Discharge Activity within Void as Function Frequency Using:
COMSL+MATLAB LIVELINK
EUROPEAN ACADEMIC RESEARCH - Vol. IV, Issue 4 / July 2016
3858
and MATLAB to enhancement finite element analysis to model
partial discharge activity. The Partial discharge dynamic
behaviour has been simulated as function of frequency for
various voltage applied and two cavities size. By comparison
between simulation and experimental results, acceptable
results have been obtained. The simulations results show
behaviour of PD activity in the void relies on the frequency of
the applied voltage.
1. The effect of frequency dependence on number of PD per
cycle increased when the voltage applied increase, while
the mean charge decreased with increasing voltage
applied.
2. The behaviors of partial discharge affected by frequency
dependence decreased when reduce size of void
especially on the number of partial discharge per cycle.
3. The spread of partial discharge at the same voltage
applied expanding when the frequency increases and
this effect reduced when the voltage increase.
4. The new combination between COMSOL and MATLAB
LIVELINK enhanced the finite element analysis to
model partial discharge and reduce the tolerance to
0.08% ±.
REFERENCES:
1. Bodega, R., Morshuis, P.H.F., Lazzaroni, M., Wester, F.J.: PD
recurrence in cavities at different energizing methods.
Instrumentation and Measurement, IEEE Transactions on
53(2), 251-258 (2004). doi:10.1109/TIM.2003.822478
2. Suwarno, Suzuoki, Y., Mizutani, T., Uchida, K.: A model for
electrical treeing discharges in polyethylene. In: Electrical
Insulating Materials, 1995. International Symposium on, 17-20
Sep 1995 1995, pp. 443-446
Mohammed Imran Mousa, Zulkurnain Abdul-Malek, Tijani Hafeez Olasunkanmi,
Adetoro Saheed Ayodeji, Mohammed Qasim Abdulrasool- Simulation Internal
Partial Discharge Activity within Void as Function Frequency Using:
COMSL+MATLAB LIVELINK
EUROPEAN ACADEMIC RESEARCH - Vol. IV, Issue 4 / July 2016
3859
3. Illias, H.A., Bakar, A.H.A., Mokhlis, H., Tunio, M.A., Chen,
G., Lewin, P.L., Ariffin, A.M.: Simulation of partial discharge
within a void under square waveform applied voltage. In:
Electrical Insulation and Dielectric Phenomena (CEIDP), 2012
Annual Report Conference on, 14-17 Oct. 2012 2012, pp. 76-79
4. Kai, W., Okamoto, T., Suzuoki, Y.: Effects of discharge area
and surface conductivity on partial discharge behavior in voids
under square voltages. Dielectrics and Electrical Insulation,
IEEE Transactions on 14(2), 461-470 (2007).
doi:10.1109/TDEI.2007.344627
5. Illias, H.A., Chen, G., Lewin, P.L.: Partial discharge
behaviour within two spherical cavities in a dielectric material.
In: Electrical Insulation and Dielectric Phenomena (CEIDP),
2011 Annual Report Conference on, 16-19 Oct. 2011 2011, pp.
456-459
6. Pedersen, A.: On the electrodynamics of partial discharges in
voids in solid dielectrics. In: Conduction and Breakdown in
Solid Dielectrics, 1989., Proceedings of the 3rd International
Conference on, 3-6 Jul 1989 1989, pp. 107-116
7. Gutfleisch, F., Niemeyer, L.: Measurement and simulation of
PD in epoxy voids. Dielectrics and Electrical Insulation, IEEE
Transactions on 2(5), 729-743 (1995). doi:10.1109/94.469970
8. Blackburn, T.R., Liu, Z., Phung, B.T., Morrow, R.:
Investigation of partial discharge mechanisms in a void under
AC electric stress. In: High Voltage Engineering, 1999.
Eleventh International Symposium on (Conf. Publ. No. 467),
1999 1999, pp. 364-368 vol.364
9. Danikas, M.G.: Discharge studies in solid insulation voids.
In: Electrical Insulation and Dielectric Phenomena, 1990.
Annual Report., Conference on, 28-31 Oct 1990 1990, pp. 249-
254
10. Gafvert, U., Edin, H., Forssen, C.: Modelling of partial
discharge spectra measured with variable applied frequency.
In: Properties and Applications of Dielectric Materials, 2003.
Mohammed Imran Mousa, Zulkurnain Abdul-Malek, Tijani Hafeez Olasunkanmi,
Adetoro Saheed Ayodeji, Mohammed Qasim Abdulrasool- Simulation Internal
Partial Discharge Activity within Void as Function Frequency Using:
COMSL+MATLAB LIVELINK
EUROPEAN ACADEMIC RESEARCH - Vol. IV, Issue 4 / July 2016
3860
Proceedings of the 7th International Conference on, 1-5 June
2003 2003, pp. 839-842 vol.833
11. Edin, H.: Partial Discharges Studied with Variable
Frequency of the Applied Voltage. KTH (2001)
12. Edin, C.F.e.H.: Modeling of a discharging cavity in a
dielectric material exposed to high electric field. Excerpt from
the Proceedings of the COMSOL Multiphysics User's
Conference Stockholm (2005 ).
13. Chen, G., Baharudin, F.: Partial discharge modelling based
on a cylindrical model in solid dielectrics. In: Condition
Monitoring and Diagnosis, 2008. CMD 2008. International
Conference on, 21-24 April 2008 2008, pp. 74-78
14. Testa, L., Serra, S., Montanari, G.C.: Advanced modeling of
electron avalanche process in polymeric dielectric voids:
Simulations and experimental validation. Journal of Applied
Physics 108(3), 034110-034110-034110 (2010).
doi:10.1063/1.3359713
15. Forssén, C.: Partial discharges in cylindrical cavities at
variable frequency of the applied voltage. Diss. KTH (2005).
16. Illias, H.A., Chen, G., Lewin, P.L.: Comparison of partial
discharge measurement and simulation results for spherical
cavities within solid dielectric materials as a function of
frequency using Finite Element Analysis method. In: Electrical
Insulation (ISEI), Conference Record of the 2010 IEEE
International Symposium on, 6-9 June 2010 2010, pp. 1-5
17. Zuberi, M., Masood, A., Husain, E., Anwar, A.: Estimation
of partial discharge inception voltages due to voids in solid
sheet insulation. In: Electrical Insulation Conference (EIC),
2013 IEEE 2013, pp. 124-128. IEEE
18. Illias, H., Chen, G., Lewin, P.L.: Partial discharge behavior
within a spherical cavity in a solid dielectric material as a
function of frequency and amplitude of the applied voltage.
Dielectrics and Electrical Insulation, IEEE Transactions on
18(2), 432-443 (2011).
Mohammed Imran Mousa, Zulkurnain Abdul-Malek, Tijani Hafeez Olasunkanmi,
Adetoro Saheed Ayodeji, Mohammed Qasim Abdulrasool- Simulation Internal
Partial Discharge Activity within Void as Function Frequency Using:
COMSL+MATLAB LIVELINK
EUROPEAN ACADEMIC RESEARCH - Vol. IV, Issue 4 / July 2016
3861
19. Forssen, C., Edin, H.: Partial discharges in a cavity at
variable applied frequency part 1: measurements. Dielectrics
and Electrical Insulation, IEEE Transactions on 15(6), 1601-
1609 (2008). doi:10.1109/TDEI.2008.4712663
20. Forssén, C., Edin, H.: Partial discharges in a cavity at
variable applied frequency Part 1: Measurements. Dielectrics
and Electrical Insulation, IEEE Transactions on 15(6), 1601-
1609 (2008).
21. Townsend, J.S.: Electrons in gases. Hutchinson London,
(1947)
22. Loeb, L.B.: Basic processes of gaseous electronics.
University of California Pr, (1955)
23. Husain, E., Nema, R.S.: Analysis of Paschen Curves for air,
N2 and SF6 Using the Townsend Breakdown Equation.
Electrical Insulation, IEEE Transactions on EI-17(4), 350-353
(1982). doi:10.1109/TEI.1982.298506
24. Illias, H., Chen, G., Lewin, P.: Partial discharge modelling
in a spherical cavity within a dielectric insulation material as a
function of frequency. In: Electrical Insulation Conference,
2009. EIC 2009. IEEE 2009, pp. 55-59. IEEE
25. Illias, H., Chen, G., Lewin, P.: Modeling of Surface Charge
Decay in a Spherical Cavity within a Solid Dielectric Material
using Finite Element Analysis. (2009).
26. Forssén, C., Edin, H.: Partial discharges in a cavity at
variable applied frequency part 2: measurements and modeling.
Dielectrics and Electrical Insulation, IEEE Transactions on
15(6), 1610-1616 (2008).