Embed Size (px)
Citation preview
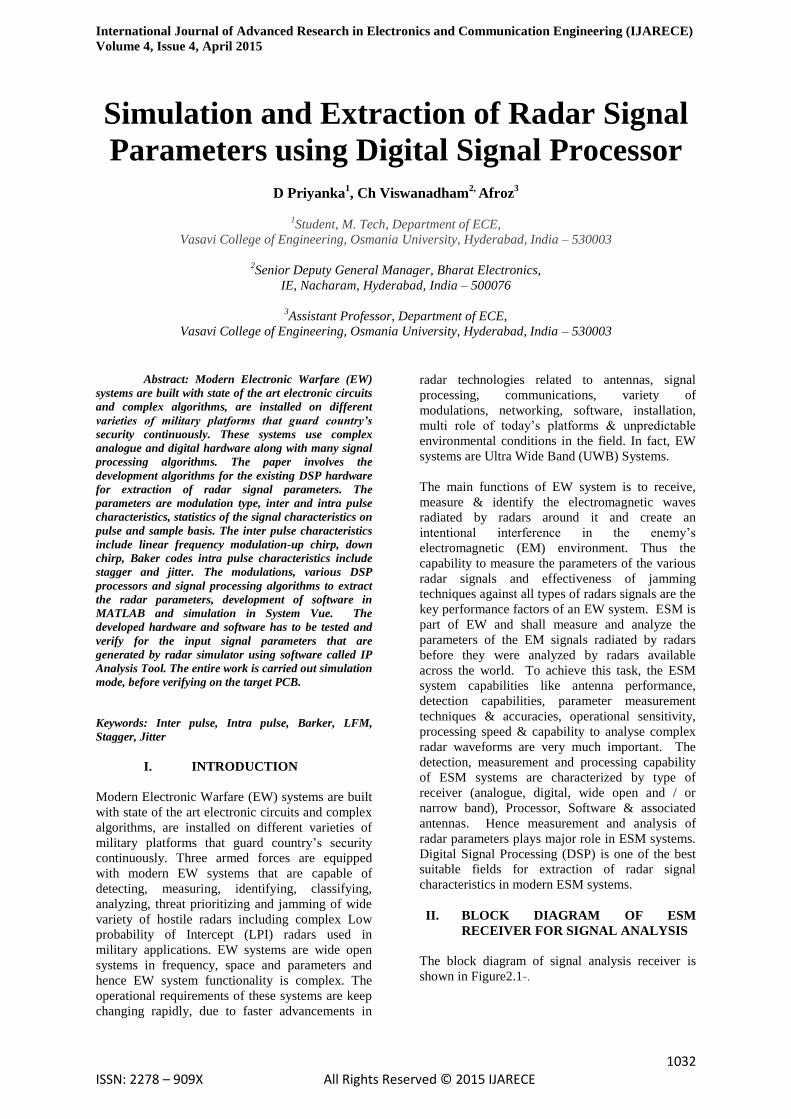
International Journal of Advanced Research in Electronics and Communication Engineering (IJARECE)
Volume 4, Issue 4, April 2015
1032 ISSN: 2278 – 909X All Rights Reserved © 2015 IJARECE
Simulation and Extraction of Radar Signal
Parameters using Digital Signal Processor
D Priyanka1, Ch Viswanadham
2, Afroz
3
1Student, M. Tech, Department of ECE,
Vasavi College of Engineering, Osmania University, Hyderabad, India – 530003
2Senior Deputy General Manager, Bharat Electronics,
IE, Nacharam, Hyderabad, India – 500076
3Assistant Professor, Department of ECE,
Vasavi College of Engineering, Osmania University, Hyderabad, India – 530003
Abstract: Modern Electronic Warfare (EW)
systems are built with state of the art electronic circuits
and complex algorithms, are installed on different
varieties of military platforms that guard country’s
security continuously. These systems use complex
analogue and digital hardware along with many signal
processing algorithms. The paper involves the
development algorithms for the existing DSP hardware
for extraction of radar signal parameters. The
parameters are modulation type, inter and intra pulse
characteristics, statistics of the signal characteristics on
pulse and sample basis. The inter pulse characteristics
include linear frequency modulation-up chirp, down
chirp, Baker codes intra pulse characteristics include
stagger and jitter. The modulations, various DSP
processors and signal processing algorithms to extract
the radar parameters, development of software in
MATLAB and simulation in System Vue. The
developed hardware and software has to be tested and
verify for the input signal parameters that are
generated by radar simulator using software called IP
Analysis Tool. The entire work is carried out simulation
mode, before verifying on the target PCB.
Keywords: Inter pulse, Intra pulse, Barker, LFM,
Stagger, Jitter
I. INTRODUCTION
Modern Electronic Warfare (EW) systems are built
with state of the art electronic circuits and complex
algorithms, are installed on different varieties of
military platforms that guard country’s security
continuously. Three armed forces are equipped
with modern EW systems that are capable of
detecting, measuring, identifying, classifying,
analyzing, threat prioritizing and jamming of wide
variety of hostile radars including complex Low
probability of Intercept (LPI) radars used in
military applications. EW systems are wide open
systems in frequency, space and parameters and
hence EW system functionality is complex. The
operational requirements of these systems are keep
changing rapidly, due to faster advancements in
radar technologies related to antennas, signal
processing, communications, variety of
modulations, networking, software, installation,
multi role of today’s platforms & unpredictable
environmental conditions in the field. In fact, EW
systems are Ultra Wide Band (UWB) Systems.
The main functions of EW system is to receive,
measure & identify the electromagnetic waves
radiated by radars around it and create an
intentional interference in the enemy’s
electromagnetic (EM) environment. Thus the
capability to measure the parameters of the various
radar signals and effectiveness of jamming
techniques against all types of radars signals are the
key performance factors of an EW system. ESM is
part of EW and shall measure and analyze the
parameters of the EM signals radiated by radars
before they were analyzed by radars available
across the world. To achieve this task, the ESM
system capabilities like antenna performance,
detection capabilities, parameter measurement
techniques & accuracies, operational sensitivity,
processing speed & capability to analyse complex
radar waveforms are very much important. The
detection, measurement and processing capability
of ESM systems are characterized by type of
receiver (analogue, digital, wide open and / or
narrow band), Processor, Software & associated
antennas. Hence measurement and analysis of
radar parameters plays major role in ESM systems.
Digital Signal Processing (DSP) is one of the best
suitable fields for extraction of radar signal
characteristics in modern ESM systems.
II. BLOCK DIAGRAM OF ESM
RECEIVER FOR SIGNAL ANALYSIS
The block diagram of signal analysis receiver is
shown in Figure2.1-.
International Journal of Advanced Research in Electronics and Communication Engineering (IJARECE)
Volume 4, Issue 4, April 2015
1033 ISSN: 2278 – 909X All Rights Reserved © 2015 IJARECE
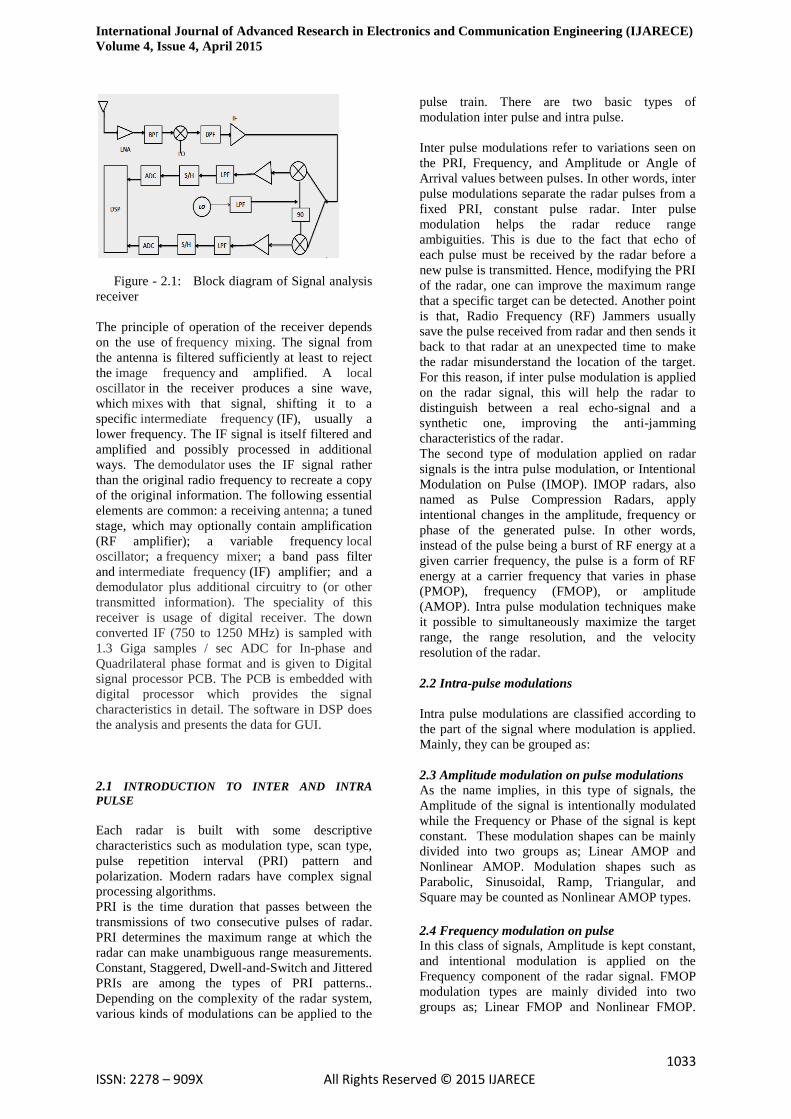
Figure - 2.1: Block diagram of Signal analysis
receiver
The principle of operation of the receiver depends
on the use of frequency mixing. The signal from
the antenna is filtered sufficiently at least to reject
the image frequency and amplified. A local
oscillator in the receiver produces a sine wave,
which mixes with that signal, shifting it to a
specific intermediate frequency (IF), usually a
lower frequency. The IF signal is itself filtered and
amplified and possibly processed in additional
ways. The demodulator uses the IF signal rather
than the original radio frequency to recreate a copy
of the original information. The following essential
elements are common: a receiving antenna; a tuned
stage, which may optionally contain amplification
(RF amplifier); a variable frequency local
oscillator; a frequency mixer; a band pass filter
and intermediate frequency (IF) amplifier; and a
demodulator plus additional circuitry to (or other
transmitted information). The speciality of this
receiver is usage of digital receiver. The down
converted IF (750 to 1250 MHz) is sampled with
1.3 Giga samples / sec ADC for In-phase and
Quadrilateral phase format and is given to Digital
signal processor PCB. The PCB is embedded with
digital processor which provides the signal
characteristics in detail. The software in DSP does
the analysis and presents the data for GUI.
2.1 INTRODUCTION TO INTER AND INTRA
PULSE
Each radar is built with some descriptive
characteristics such as modulation type, scan type,
pulse repetition interval (PRI) pattern and
polarization. Modern radars have complex signal
processing algorithms.
PRI is the time duration that passes between the
transmissions of two consecutive pulses of radar.
PRI determines the maximum range at which the
radar can make unambiguous range measurements.
Constant, Staggered, Dwell-and-Switch and Jittered
PRIs are among the types of PRI patterns..
Depending on the complexity of the radar system,
various kinds of modulations can be applied to the
pulse train. There are two basic types of
modulation inter pulse and intra pulse.
Inter pulse modulations refer to variations seen on
the PRI, Frequency, and Amplitude or Angle of
Arrival values between pulses. In other words, inter
pulse modulations separate the radar pulses from a
fixed PRI, constant pulse radar. Inter pulse
modulation helps the radar reduce range
ambiguities. This is due to the fact that echo of
each pulse must be received by the radar before a
new pulse is transmitted. Hence, modifying the PRI
of the radar, one can improve the maximum range
that a specific target can be detected. Another point
is that, Radio Frequency (RF) Jammers usually
save the pulse received from radar and then sends it
back to that radar at an unexpected time to make
the radar misunderstand the location of the target.
For this reason, if inter pulse modulation is applied
on the radar signal, this will help the radar to
distinguish between a real echo-signal and a
synthetic one, improving the anti-jamming
characteristics of the radar.
The second type of modulation applied on radar
signals is the intra pulse modulation, or Intentional
Modulation on Pulse (IMOP). IMOP radars, also
named as Pulse Compression Radars, apply
intentional changes in the amplitude, frequency or
phase of the generated pulse. In other words,
instead of the pulse being a burst of RF energy at a
given carrier frequency, the pulse is a form of RF
energy at a carrier frequency that varies in phase
(PMOP), frequency (FMOP), or amplitude
(AMOP). Intra pulse modulation techniques make
it possible to simultaneously maximize the target
range, the range resolution, and the velocity
resolution of the radar.
2.2 Intra-pulse modulations
Intra pulse modulations are classified according to
the part of the signal where modulation is applied.
Mainly, they can be grouped as:
2.3 Amplitude modulation on pulse modulations
As the name implies, in this type of signals, the
Amplitude of the signal is intentionally modulated
while the Frequency or Phase of the signal is kept
constant. These modulation shapes can be mainly
divided into two groups as; Linear AMOP and
Nonlinear AMOP. Modulation shapes such as
Parabolic, Sinusoidal, Ramp, Triangular, and
Square may be counted as Nonlinear AMOP types.
2.4 Frequency modulation on pulse
In this class of signals, Amplitude is kept constant,
and intentional modulation is applied on the
Frequency component of the radar signal. FMOP
modulation types are mainly divided into two
groups as; Linear FMOP and Nonlinear FMOP.
International Journal of Advanced Research in Electronics and Communication Engineering (IJARECE)
Volume 4, Issue 4, April 2015
1034 ISSN: 2278 – 909X All Rights Reserved © 2015 IJARECE
Linear FMOP signals are also named as “Chirp”
signals. Modulation shapes such as Parabolic,
Sinusoidal, Ramp, Triangular, Square and FSK
may be counted as Nonlinear FMOP types.
Frequency Modulation is applied to the signals so
that Pulse Compression is achieved and the
Ambiguity diagram is approximated to the ideal
case.
2.5 Phase modulation on pulse
Phase Modulation on Pulse is another method for
Pulse Compression. In this modulation type, Phase
of the signal is modulated depending on a binary
code, while the Amplitude of the signal is kept
constant.
2.6 Linear frequency modulation
This technique is dominantly used for narrow band
operations .In this case, pulse compression is
accomplished by adding frequency modulation to a
long pulse at transmission, and by using a matched
filter receiver in order to compress the received
signal. Using LFM with in a rectangular pulse
compresses the matched filter output by a factor,
which is directly proportional to the pulse width
and bandwidth. Thus, by using long pulses and
wideband LFM modulation we can achieve large
compression ratios. This form of pulse compression
is known as “correlation processing” .LFM pulse
compression technique is a kind of technique in
which the frequency of the transmitted signal is
varied over pulse duration of T. This variation of
the frequency from low to high or vice a versa is
known as “chirping”. Changing the frequency from
low to high is called “up-chirp” or upsweep.
Similarly, changing the frequency from high to low
is called “down-chirp”. The technique of applying a
different chirp rate for each pulse is known as
“chirp diversity”. One of the combined modulation
techniques is that used in radars and called LFM.
[5]
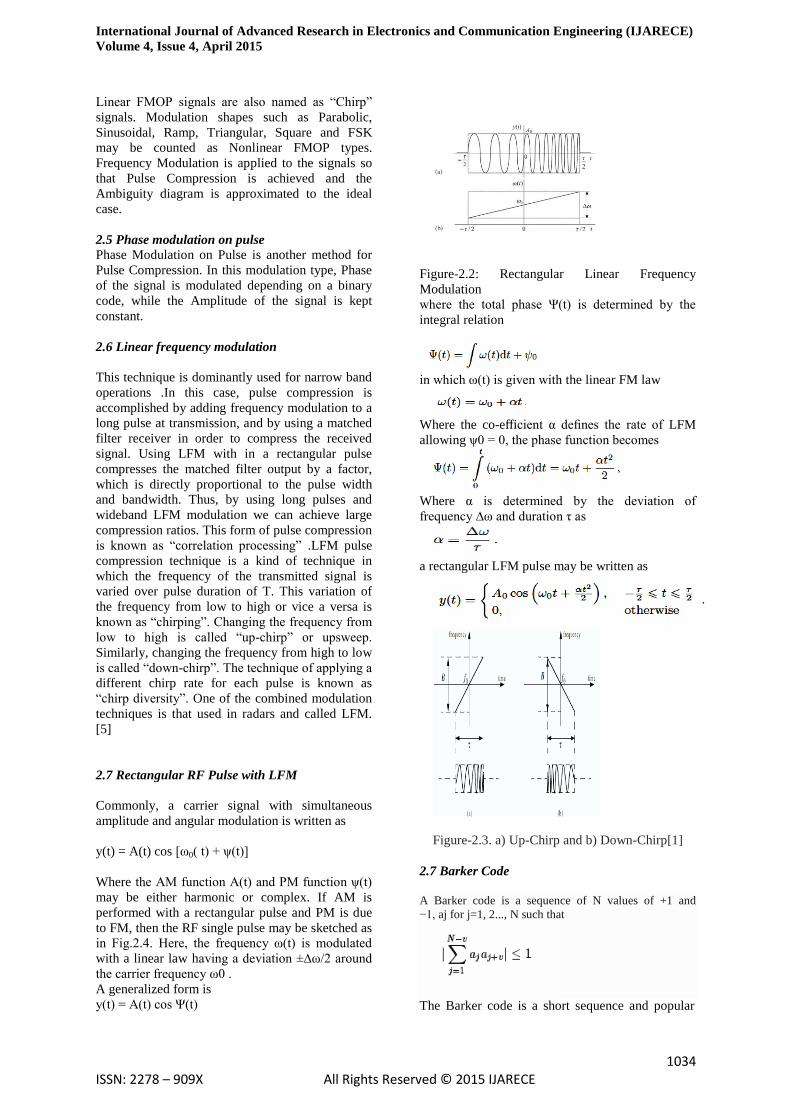
2.7 Rectangular RF Pulse with LFM
Commonly, a carrier signal with simultaneous
amplitude and angular modulation is written as
y(t) = A(t) cos [ω0( t) + ψ(t)]
Where the AM function A(t) and PM function ψ(t)
may be either harmonic or complex. If AM is
performed with a rectangular pulse and PM is due
to FM, then the RF single pulse may be sketched as
in Fig.2.4. Here, the frequency ω(t) is modulated
with a linear law having a deviation ±∆ω/2 around
the carrier frequency ω0 .
A generalized form is
y(t) = A(t) cos Ψ(t)
Figure-2.2: Rectangular Linear Frequency
Modulation
where the total phase Ψ(t) is determined by the
integral relation
in which ω(t) is given with the linear FM law
Where the co-efficient α defines the rate of LFM
allowing ψ0 = 0, the phase function becomes
Where α is determined by the deviation of
frequency ∆ω and duration τ as
a rectangular LFM pulse may be written as
Figure-2.3. a) Up-Chirp and b) Down-Chirp[1]
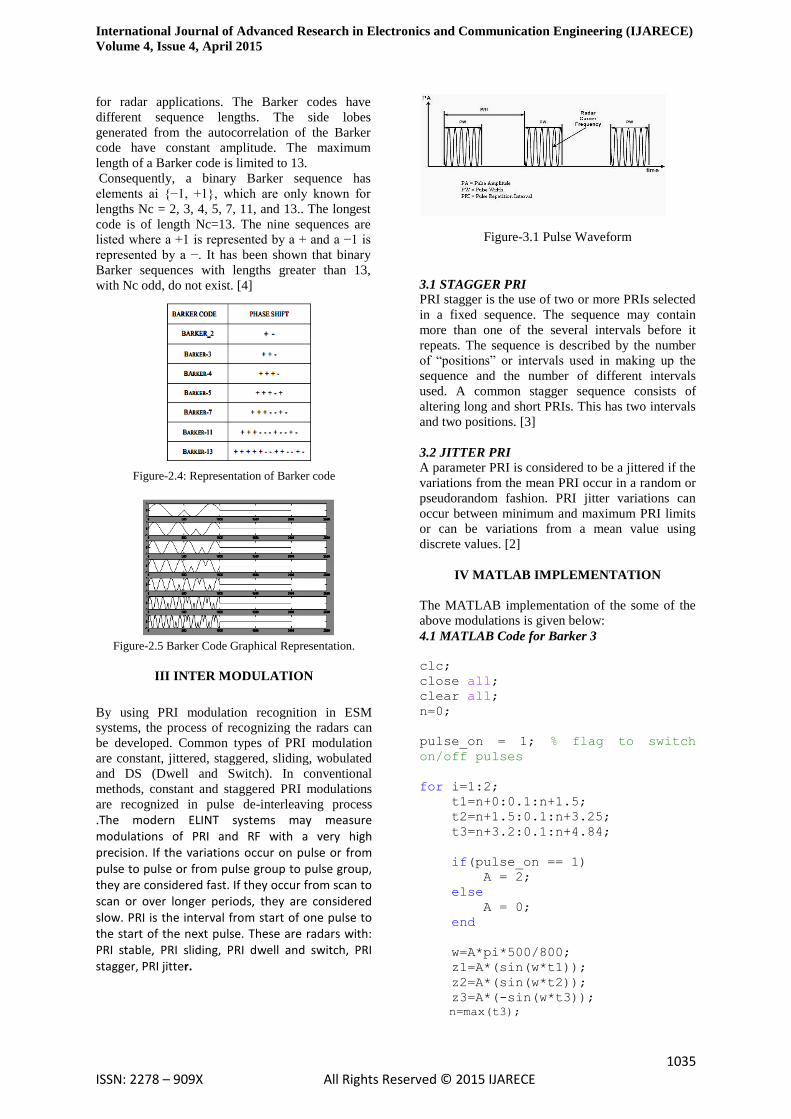
2.7 Barker Code
A Barker code is a sequence of N values of +1 and
−1, aj for j=1, 2..., N such that
The Barker code is a short sequence and popular
International Journal of Advanced Research in Electronics and Communication Engineering (IJARECE)
Volume 4, Issue 4, April 2015
1035 ISSN: 2278 – 909X All Rights Reserved © 2015 IJARECE
for radar applications. The Barker codes have
different sequence lengths. The side lobes
generated from the autocorrelation of the Barker
code have constant amplitude. The maximum
length of a Barker code is limited to 13.
Consequently, a binary Barker sequence has
elements ai {−1, +1}, which are only known for
lengths Nc = 2, 3, 4, 5, 7, 11, and 13.. The longest
code is of length Nc=13. The nine sequences are
listed where a +1 is represented by a + and a −1 is
represented by a −. It has been shown that binary
Barker sequences with lengths greater than 13,
with Nc odd, do not exist. [4]
Figure-2.4: Representation of Barker code
Figure-2.5 Barker Code Graphical Representation.
III INTER MODULATION
By using PRI modulation recognition in ESM
systems, the process of recognizing the radars can
be developed. Common types of PRI modulation
are constant, jittered, staggered, sliding, wobulated
and DS (Dwell and Switch). In conventional
methods, constant and staggered PRI modulations
are recognized in pulse de-interleaving process
.The modern ELINT systems may measure modulations of PRI and RF with a very high precision. If the variations occur on pulse or from pulse to pulse or from pulse group to pulse group, they are considered fast. If they occur from scan to scan or over longer periods, they are considered slow. PRI is the interval from start of one pulse to the start of the next pulse. These are radars with: PRI stable, PRI sliding, PRI dwell and switch, PRI stagger, PRI jitter.
Figure-3.1 Pulse Waveform
3.1 STAGGER PRI
PRI stagger is the use of two or more PRIs selected
in a fixed sequence. The sequence may contain
more than one of the several intervals before it
repeats. The sequence is described by the number
of “positions” or intervals used in making up the
sequence and the number of different intervals
used. A common stagger sequence consists of
altering long and short PRIs. This has two intervals
and two positions. [3]
3.2 JITTER PRI
A parameter PRI is considered to be a jittered if the
variations from the mean PRI occur in a random or
pseudorandom fashion. PRI jitter variations can
occur between minimum and maximum PRI limits
or can be variations from a mean value using
discrete values. [2]
IV MATLAB IMPLEMENTATION
The MATLAB implementation of the some of the
above modulations is given below:
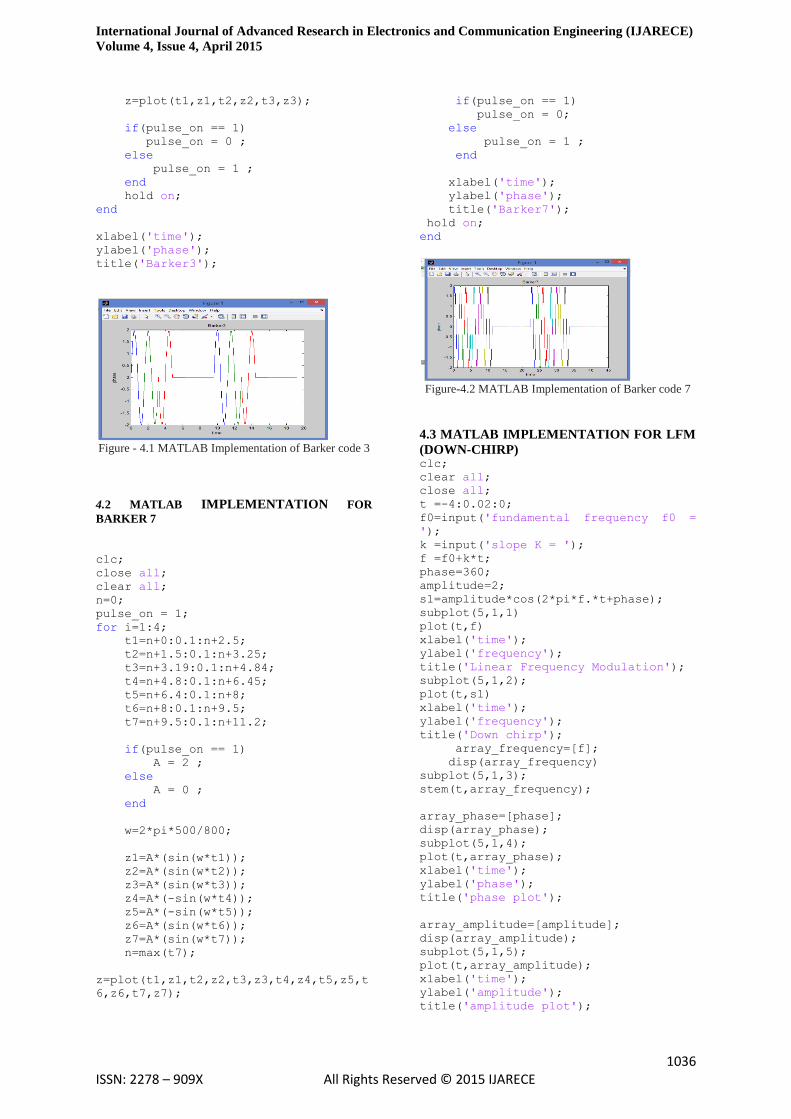
4.1 MATLAB Code for Barker 3
clc;
close all;
clear all;
n=0;
pulse_on = 1; % flag to switch
on/off pulses
for i=1:2;
t1=n+0:0.1:n+1.5;
t2=n+1.5:0.1:n+3.25;
t3=n+3.2:0.1:n+4.84;
if(pulse_on == 1)
A = 2;
else
A = 0;
end
w=A*pi*500/800;
z1=A*(sin(w*t1));
z2=A*(sin(w*t2));
z3=A*(-sin(w*t3));
n=max(t3);
International Journal of Advanced Research in Electronics and Communication Engineering (IJARECE)
Volume 4, Issue 4, April 2015
1036 ISSN: 2278 – 909X All Rights Reserved © 2015 IJARECE
z=plot(t1,z1,t2,z2,t3,z3);
if(pulse_on == 1)
pulse_on = 0 ;
else
pulse_on = 1 ;
end
hold on;
end
xlabel('time');
ylabel('phase');
title('Barker3');
Figure - 4.1 MATLAB Implementation of Barker code 3
4.2 MATLAB IMPLEMENTATION FOR
BARKER 7
clc;
close all;
clear all;
n=0;
pulse_on = 1;
for i=1:4;
t1=n+0:0.1:n+2.5;
t2=n+1.5:0.1:n+3.25;
t3=n+3.19:0.1:n+4.84;
t4=n+4.8:0.1:n+6.45;
t5=n+6.4:0.1:n+8;
t6=n+8:0.1:n+9.5;
t7=n+9.5:0.1:n+11.2;
if(pulse_on == 1)
A = 2 ;
else
A = 0 ;
end
w=2*pi*500/800;
z1=A*(sin(w*t1));
z2=A*(sin(w*t2));
z3=A*(sin(w*t3));
z4=A*(-sin(w*t4));
z5=A*(-sin(w*t5));
z6=A*(sin(w*t6));
z7=A*(sin(w*t7));
n=max(t7);
z=plot(t1,z1,t2,z2,t3,z3,t4,z4,t5,z5,t
6,z6,t7,z7);
if(pulse_on == 1)
pulse_on = 0;
else
pulse_on = 1 ;
end
xlabel('time');
ylabel('phase');
title('Barker7');
hold on;
end
Figure-4.2 MATLAB Implementation of Barker code 7
4.3 MATLAB IMPLEMENTATION FOR LFM
(DOWN-CHIRP) clc;
clear all;
close all;
t =-4:0.02:0;
f0=input('fundamental frequency f0 =
');
k =input('slope K = ');
f =f0+k*t;
phase=360;
amplitude=2;
s1=amplitude*cos(2*pi*f.*t+phase);
subplot(5,1,1)
plot(t,f)
xlabel('time');
ylabel('frequency');
title('Linear Frequency Modulation');
subplot(5,1,2);
plot(t,s1)
xlabel('time');
ylabel('frequency');
title('Down chirp');
array_frequency=[f];
disp(array_frequency)
subplot(5,1,3);
stem(t,array_frequency);
array_phase=[phase];
disp(array_phase);
subplot(5,1,4);
plot(t,array_phase);
xlabel('time');
ylabel('phase');
title('phase plot');
array_amplitude=[amplitude];
disp(array_amplitude);
subplot(5,1,5);
plot(t,array_amplitude);
xlabel('time');
ylabel('amplitude');
title('amplitude plot');
International Journal of Advanced Research in Electronics and Communication Engineering (IJARECE)
Volume 4, Issue 4, April 2015
1037 ISSN: 2278 – 909X All Rights Reserved © 2015 IJARECE
Figure-4.3 MATLAB Implementation of LFM-Down
Chirp
4.4 MATLAB IMPLEMENTATION FOR LFM
(UP-CHIRP) clc;
clear all;
close all;
t =0:0.02:4;
f0=input('fundamental frequency f0 =
');
k =input('slope K = ');
f =f0+k*t;
phase=0;
amplitude=2;
s1=amplitude*cos(2*pi*f.*t+phase);
subplot(5,1,1)
plot(t,f)
xlabel('time');
ylabel('frequency');
title('Linear Frequency Modulation');
subplot(5,1,2);
plot(t,s1)
xlabel('time');
ylabel('frequency');
title('Up chirp');
array_frequency=[f];
disp(array_frequency);
subplot(5,1,3);
stem(t,array_frequency);
array_phase=[phase];
disp(array_phase);
subplot(5,1,4);
plot(t,array_phase);
xlabel('time');
ylabel('phase');
title('phase plot');
array_amplitude=[amplitude];
disp(array_amplitude);
subplot(5,1,5);
plot(t,array_amplitude);
xlabel('time');
ylabel('amplitude');
title('amplitude plot');
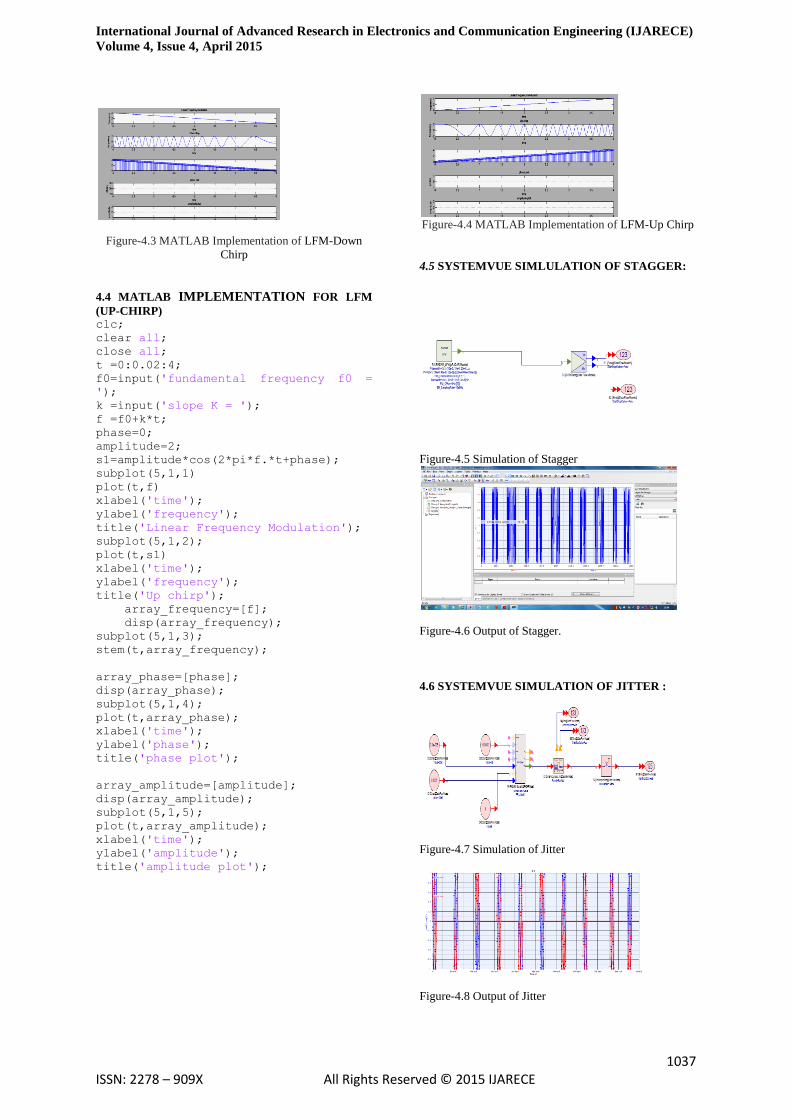
Figure-4.4 MATLAB Implementation of LFM-Up Chirp
4.5 SYSTEMVUE SIMLULATION OF STAGGER:
Figure-4.5 Simulation of Stagger
Figure-4.6 Output of Stagger.
4.6 SYSTEMVUE SIMULATION OF JITTER :
Figure-4.7 Simulation of Jitter
Figure-4.8 Output of Jitter
International Journal of Advanced Research in Electronics and Communication Engineering (IJARECE)
Volume 4, Issue 4, April 2015
1038 ISSN: 2278 – 909X All Rights Reserved © 2015 IJARECE
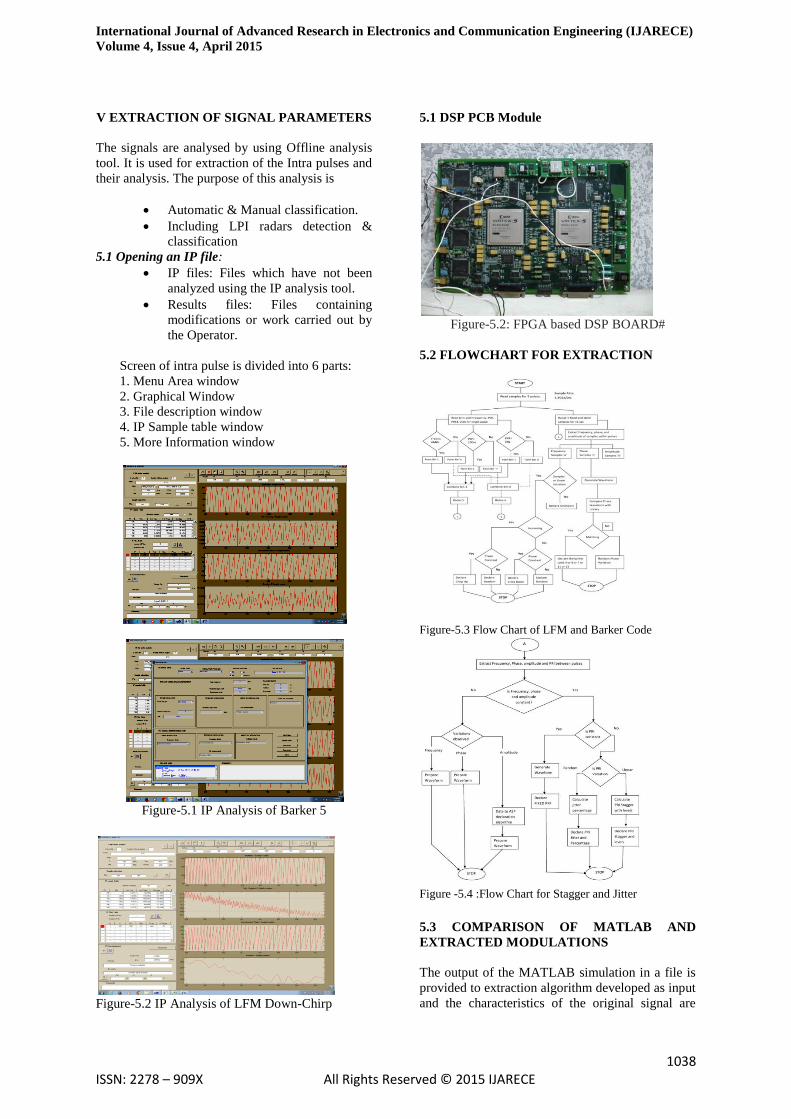
V EXTRACTION OF SIGNAL PARAMETERS
The signals are analysed by using Offline analysis
tool. It is used for extraction of the Intra pulses and
their analysis. The purpose of this analysis is
Automatic & Manual classification.
Including LPI radars detection &
classification
5.1 Opening an IP file:
IP files: Files which have not been
analyzed using the IP analysis tool.
Results files: Files containing
modifications or work carried out by
the Operator.
Screen of intra pulse is divided into 6 parts:
1. Menu Area window
2. Graphical Window
3. File description window
4. IP Sample table window
5. More Information window
Figure-5.1 IP Analysis of Barker 5
Figure-5.2 IP Analysis of LFM Down-Chirp
5.1 DSP PCB Module
Figure-5.2: FPGA based DSP BOARD#
5.2 FLOWCHART FOR EXTRACTION
Figure-5.3 Flow Chart of LFM and Barker Code
Figure -5.4 :Flow Chart for Stagger and Jitter
5.3 COMPARISON OF MATLAB AND
EXTRACTED MODULATIONS
The output of the MATLAB simulation in a file is
provided to extraction algorithm developed as input
and the characteristics of the original signal are
International Journal of Advanced Research in Electronics and Communication Engineering (IJARECE)
Volume 4, Issue 4, April 2015
1039 ISSN: 2278 – 909X All Rights Reserved © 2015 IJARECE
observed as the classification output for different
varieties of signals. This shows the algorithms are
satisfactory and results are comparable. The tests
are done for Barker, Chirp Down modulations.
VI CONCULSION
In this paper, the finger printing of modulated
signals of various types have been analysed and
suitable algorithms have been developed to extract
these radar signal parameters. To verify these
characteristics, initially MATLAB CODE is
developed and analysed through the simulations,
which are presented in the paper. Also, the
simulation is done for extraction of characteristics
of the samples using DSP algorithms is carried out
and presented in the paper. Hence, the simulation
of Inter and intra pulse characteristics and
extraction of the same has been carried out and
presented in the paper. The same work can be
further carried out by much complex signals like
Huff-man code, etc.,.
VII REFERENCES
[1]http://www.ijetae.com/files/Volume4Issue4/IJ
ETAE_0414_18.pdf
[2] Richard G. Wiley “The analysis of radar
signals” Chapter 8 page no 150
[3] Richard G. Wiley “The analysis of radar
signals” Chapter 8 page no 154
[4] http://en.wikipedia.org/wiki/Barker_code
[5] J.C.Toomay,Paul J.Hannen “Radar Principles
for the Non-Specialist” Third edition.
VIII BIO DATA OF AUTHOR
Devarapalli Priyanka completed her
schooling and Intermediate in Hyderabad,
Telangana .She has done her B.Tech from Swami
Vivekananda Institute of Technology near
Secunderabad from the stream Electronics and
Communication Engineering. Presently pursuing
M.E (Communication and Signal Processing) from
Vasavi College of Engineering .At present she is
doing her project work in Bharat Electronics
Limited, Hyderabad as part of her M.E. curriculum.
Ch Viswanadham, born in
Ampolu, a village in suburbs
of Srikakulam, Andhra
Pradesh, India joined Bharat
Electronics Limited, a premier
defence electronics industry in
1990 immediately after B Tech
(ECE) from Nagarjuna
University, Guntur, and
Andhra Pradesh. He worked in various Naval EW
Systems from design to field trails. He has
received internal R&D award for developing light
weight ESM system for Indian Naval Ships. He
has been deputed to Israel, Spain & South Korea to
participate in technical discussions on EW systems
with international companies. He has completed
Master’s degree in Digital Systems from Osmania
University, Hyderabad in 1997, while working at
BEL. Presently he is working as Senior Deputy
General Manager (D&E) and heading RF & MWP
group. He has presented many technical papers in
BEL-House journal, national & international
journals and conferences. He is Fellow of IETE &
IE (I), Life member of SEMCE (I) & CSI and
MIEEE. He is pursuing PhD in Andhra University,
Visakhapatnam. His areas of interest are antennas,
radomes, RF & Microwave designs and wide band
/ narrow band receivers.
SK. Afroz Begum, received the
Bachelor of Technology in Electronics and
Communication Engineering from JNT University
and the Master of Engineering in Systems and
Signal processing from JNTU Hyderabad.
Currently, she is working as Assistant Professor in
the department of Electronics and Communication
Engineering, Vasavi College of Engineering,
Hyderabad. She has presented technical papers in
national & international conferences and attended
many workshops. She is member of IETE. Her
Research interests include DSP processors and
digital image processing.