Embed Size (px)
Citation preview

Spr ing 2012 | PCI Journal64
Precast, prestressed concrete adjacent box girders are a series of transversely connected, parallel beams that extend the length of short- to medium-span
bridges.1 The connection between boxes is meant to devel-op continuous behavior across the combined girder width, which acts as the bridge deck perpendicular to traffic. As such, it plays a significant role in the distribution of loads, relative deflections between beams, and overall system capacity. Inadequately designed connections can lead to reflective cracking, joint leakage, moisture accumulation, corrosion, excessive relative displacement between gird-ers, and sudden collapse. Examples of bridges that have experienced such extreme distress include the 2005 partial collapse of the Lakeview Drive Bridge over Interstate 70 in Washington, Pa., and the corrosion of a railroad bridge in Nebraska in 2007. Improvement to the connection between adjacent box girders is recommended to ensure the safety and continued use of such bridges.
The majority of failures in adjacent box girders are not due to negligent design or construction but rather to inadequate design criteria, poor drainage features, and difficulties associated with maintenance and repair. These problems are easily preventable and separate from the overall system efficiency. This conclusion is based on failures occurring
■ Proper design and detailing of the transverse connection between adjacent box girders is essential to economical initial construction and long-term maintenance, as is adequate prestressing force.
■ This paper presents a post-tensioned transverse system that eliminates the need for diaphragms and a concrete overlay.
■ The system does not exhibit strain change or cracking under fatigue loading.
Simplified transverse post-tensioning construction and maintenance of adjacent box girders
Jenna Hansen, Kromel Hanna, and Maher K. Tadros
65PCI Journal | Spr ing 2012
when a single member takes on loads that are theoretically assigned to adjacent parts of the system. A simple solution is to treat the system as a composite section rather than focusing on an even load distribution.
While standard details vary from state to state, most depart-ments of transportation use a combination of diaphragms, structural or nonstructural concrete toppings, and post-ten-sioning to achieve continuous behavior between adjacent box girders. Of the three, diaphragms are the most difficult to construct and maintain. Skewed bridges are especially difficult to construct because diaphragms must be stag-gered, meaning only a few girders can be connected at each location.2 This use of multiple connection points increases overall construction time. When used in combination with structural or nonstructural concrete overlays, the system benefits minimally from the use of precast concrete.
Another problem with diaphragms is that long-term maintenance becomes difficult due to blocked access to the post-tensioning. Drainage ducts are often too widely spaced between diaphragms, leading to accumulation of water, corrosion of the post-tensioning, and eventually to failure. Even if the problem is detected before collapse, ac-cess to the post-tensioning is still problematic.
Moisture accumulation is a direct result of reflective cracking between joints due to inadequate compressive post-tensioning force. A nonstructural concrete overlay is neither efficient nor economical as a means to prevent cracks penetrating to the post-tensioning.3 A more effective solution would be to increase the post-tensioning force so that cracking did not occur in the first place.
Transverse connections facilitate construction by elimi-nating concrete forming and placement in the field. In addition, adjacent box girders allow for shallower super-structure depths, which, in combination with the voids, reduce member weight and provide extra space for utilities without compromising the torsional stiffness of the section. Furthermore, the cost of construction and aesthetic ap-peal of a given bridge improves when comparing a boxed section with a continuous flat soffit against I-girders and similarly shaped alternatives.4
Past efforts have updated the design criteria for adjacent box girders and analyzed the performance of a connec-tion without diaphragms, concrete toppings, and post-tensioning. The purpose of the research reported in this paper is to investigate the effectiveness of post-tensioning, as determined by updated design charts, on the previously developed system. Post-tensioning is intended to keep the shear keys under compression, prevent reflective crack-ing at the joints, and create an even distribution of load. The experimental program for this system confirms its exceptional performance and applicability to current bridge applications.
Current design practice
Adjacent box girder bridges incorporate various prac-tices in the design and detailing of transverse connecting systems. According to the Ontario Bridge Design Code,5 the general design philosophy of transversely connected members is that loads are transferred entirely by shear; flexural rigidity can be ignored.6,7 Grouted shear keys are assumed inadequate to transfer the full shear force. There-fore, a structural concrete slab at least 6 in. (150 mm) is required. This transverse shear force is considered a direct function of the bridge width-to-span ratio, longitudinal flexural rigidity, and longitudinal tensile rigidity. In some states, such as Michigan, departments of transportation treat translational and rotational deformations as functions of flexural rigidity, necessitating post-tensioning to develop continuous behavior.8
Research suggests that each method has merit. Joint fracture and topping cracking on several bridges in West Virginia have been attributed to the inadequacy of both the grout installation of the shear key and the transverse tie force.7 A long-term study in New York indicated that increasing shear-key depths and post-tensioning resulted in less longitudinal cracking of the deck slab.8 Based on a survey of current practices for the design and construction of adjacent box girder bridges in the United States and Canada, PCI’s Subcommittee on Adjacent Member Bridg-es has recognized the importance of both the shear-key and post-tensioning details in the design of the transverse connection.9
While standards differ worldwide, the majority of the United States relies on publications by the American Association of State Highway and Transportation Of-ficials (AASHTO) and PCI as the primary basis for state and local bridge design specifications. The most current standards available from these organizations (with regard to adjacent box girders) are the AASHTO Load and Resis-tance Factor Design (LRFD) Bridge Specifications10 and the PCI Bridge Design Manual.11
The AASHTO LRFD specifications provide little informa-tion on the subject of adjacent members beyond stating that “the use of transverse mild steel rods secured by nuts should not be considered sufficient to achieve full trans-verse flexural continuity unless demonstrated by test or experience.” The manual recommends a minimum average effective post-tensioning pressure of 250 psi (1.7 MPa); however, the area over which this pressure applies is unspecified and could be either the shear key or the girder contact face.1
PCI Bridge Design Manual section 8.9, Transverse Design of Adjacent Box Beam Bridges, is based on a procedure proposed by El-Remaily et al.1 This procedure is founded on the theory that diaphragms are the primary means of
Spr ing 2012 | PCI Journal66
distributing transverse loads and preventing differential displacement across the width of the bridge deck.11 Post-tensioning is used to create continuous behavior and joint compression meant to prevent cracking and limit moisture ingress. For this reason, El-Remaily based his calculations on diaphragm area alone.
Hanna et al.11–13 updated El-Remaily’s procedure to account for the latest AASHTO LRFD specifications’ loads and governing parameters, such as bridge width, span-to-depth ratio, and skew angle. They concluded that El-Remaily’s procedure is overly conservative because post-tensioning forces extend beyond the diaphragm area along the top and bottom flanges of the adjacent box girders. They suggest that the transverse reinforcement (rather than the dia-phragms) is the primary means of distributing transverse loads and preventing differential displacement.
Non-post-tensioned system development
Initial efforts to improve the connection between adjacent box girders resulted in two non-post-tensioned systems that do not require a concrete topping or diaphragms for load distribution. The wide-joint system uses top and bottom reinforcement in a wide, full-length, full-depth shear key. Shear and moment are transferred between boxes by two reinforcing steel bars every 4 ft (1.2 m) that extend from blockouts in the top and bottom flanges of each box. The reinforcement is spliced together by short bars with spiral confinement to provide adequate development length. Despite the reduction in development length, the blockouts still form an area of 16 in. × 5.5 in. (400 mm × 140 mm) every 4 ft (1.2 m) along the girder connection that must be filled. This can be done at the same time as the shear key and hidden by a 0.5 in. (13 mm) wearing surface.2
The narrow-joint system eliminates blockouts by using Grade 75 (520 MPa) threaded rods that can be coupled together instead of spliced. The shear key for this system is a continuous 6 in. × 2.5 in. (150 mm × 65 mm) section located near the top of the box, which also extends the
full box depth at every 8 ft (2.4 m) connection. Note that the spacing of the narrow-joint system is twice that of the wide-joint system. While the reinforcement for the wide-joint system can be cast into the member, the narrow-joint system requires a plastic duct at the top and bottom flanges to create openings for the threaded rods. Vertical vents must be provided to allow the air to escape during grout-ing.2 Hanna et al. provide further explanation and details of both the wide-joint and narrow-joint systems.
The wide-joint and narrow-joint connections were com-pared with a current non-post-tensioned connection used by the Illinois Department of Transportation. All three systems were tested under static and cyclic loading. The Illinois connection failed when tested without a con-crete topping; however, it performed satisfactorily with a concrete topping, as specified in the Illinois details.2 Test results indicate that the capacities of the wide-joint and narrow-joint systems were slightly higher than those calculated from strain compatibility. In addition, the two systems’ capacities were significantly higher than that of the current connection, which uses a single middepth tie for reinforcement instead of the two layers used in the wide-joint and narrow-joint systems.
Post-tensioned system development
A modified version of the narrow-joint system is now available to allow for post-tensioning of the transverse high-strength steel rods. The system also avoids the use of diaphragms and concrete topping for load distribution. It maintains the use of top and bottom reinforcement; however, the ducts have been moved inward so that post-tensioning extends between girder voids. This simplifies inspection of the post-tensioning because it is no longer bonded with the box section and shear keys. Construction time is reduced due to the elimination of grouted ducts, and venting is no longer an issue of girder production.
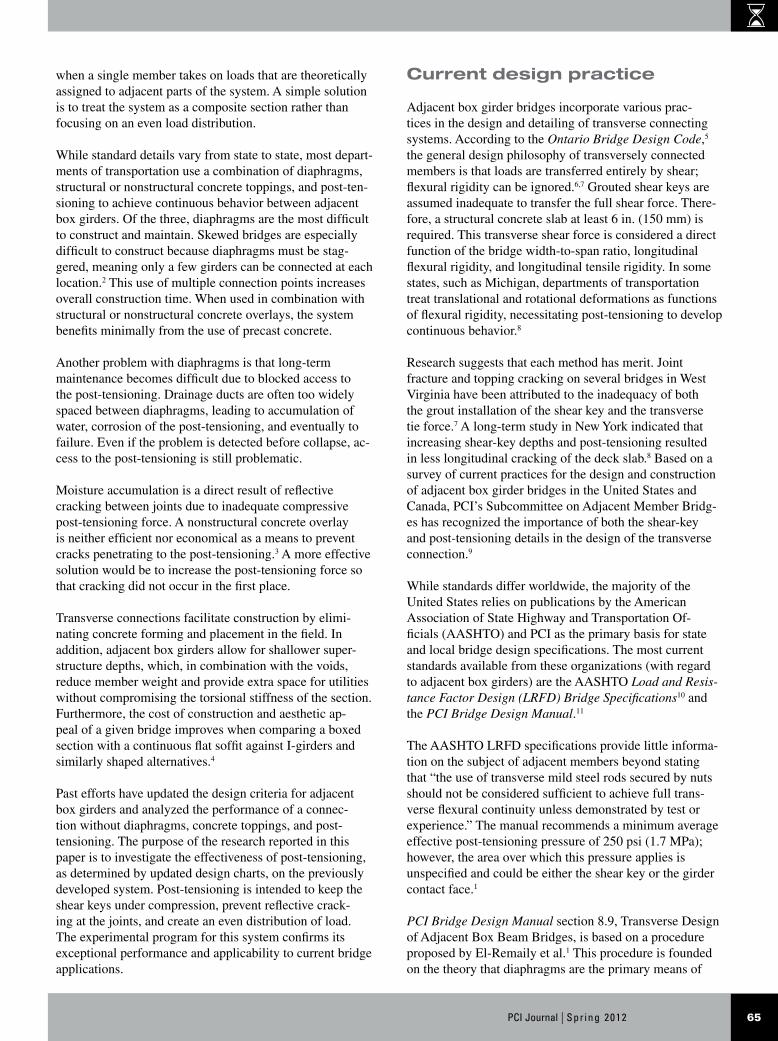
A duct within a sleeve is proposed to allow post-tensioning after grouting of the shear key. The interior duct is neces-sary to prevent the sleeve from closing during grouting. Furthermore, post-tensioning should be applied after the shear key is grouted so that the joints are under initial com-pression. Figure 1 is a diagram of the proposed modifica-tions to the current AASHTO LRFD specifications and PCI Bridge Design Manual box section.
The sleeves shown have a diameter of 3.5 in. (89 mm) to provide space for an interior duct, high-strength steel rods, and couplers. This sleeve can be formed by plastic tubing cut to the appropriate dimensions. Reinforcement should be provided for confinement at these locations. The 3.5-in.-diameter opening provides a moment arm of 12 in. (300 mm) while keeping the sleeve flush with the top and bottom flanges. Shear keys extend the full hori-
Figure 1. Post-tensioned system box dimensions. Note: 1 in. = 25.4 mm; 1 ft = 0.305 m.
2 ft 3 in. to 3 ft 6 in.
8 ft spacing
3 ft
5/8 in.
4 ft
1.25 in.
2 in. 2 in.
3 in.
3 in.
6 in. 1.5 in.1.5 in.
4.75 in.
5.5 in.
67PCI Journal | Spr ing 2012
• The length of shell elements in the direction of traffic is 12 in. (300 mm).
• The thickness of shell elements equals the total con-crete thickness of the corresponding component (that is, top flange, bottom flange, and web).
• Frame elements are repeated every 8 ft (2.4 m) along the bridge length.
• The cross section of the connecting frame elements is a rectangle of width equal to the spacing between frame elements and depth equal to the thickness of the corresponding flange.
The loads applied for analysis include the dead load DL of concrete curbs and railing, as well as an HL-93 live load LL with dynamic load allowance of 0.33. Single- and multiple-lane loadings were applied to determine the most critical load case for the transverse connection. Dead load due to self-weight and wearing surface was not considered because it is uniformly distributed over the bridge and therefore does not generate transverse load effects. The
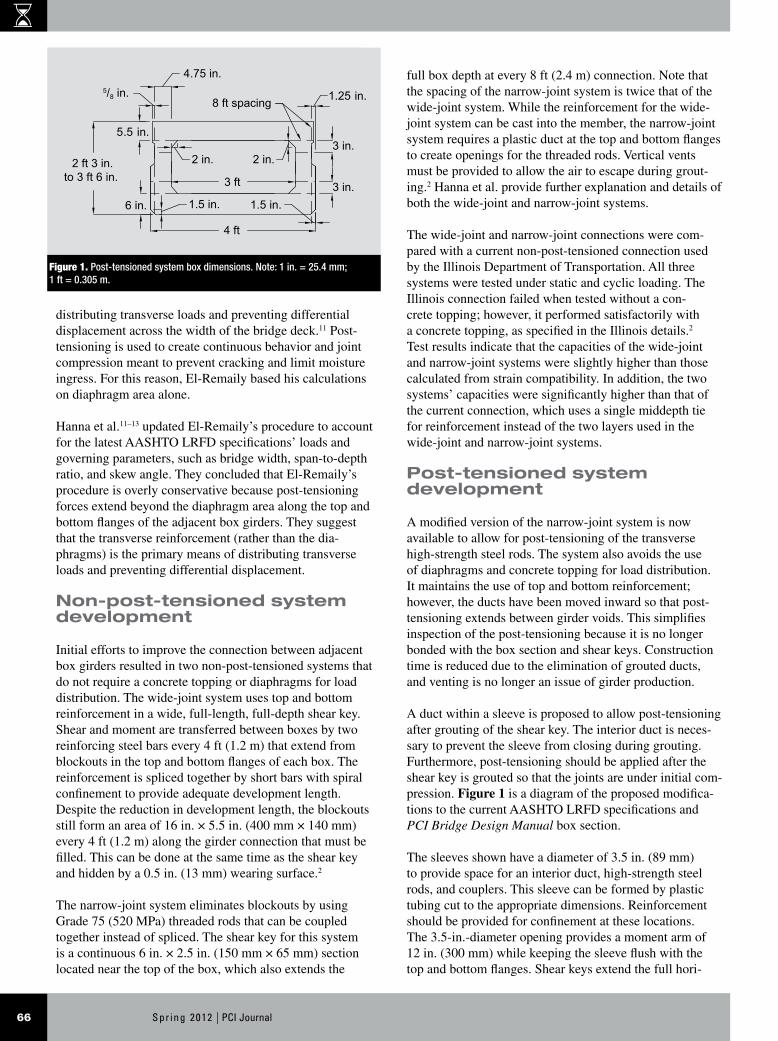
zontal length at the top of the girders and the full vertical depth every 8 ft (2.4 m) along the member. Figure 2 shows how the end girders must be formed without a shear key at the exterior face of the bridge in order to provide an even surface for bearing of the post-tensioning materials. The high-strength steel rods should be cut at even length increments of 4 ft (1.2 m) for couplers to be placed at the joint between adjacent members for ease of construction. It is also recommended that an 8 ft (2.4 m) length be used so that members can be placed two at a time, thereby reducing problems with construction tolerance.
To calculate the load effects on the proposed connection, a three-dimensional computer model was developed using a numerical analysis program. Each box girder was modeled using shell elements that represent the flanges and webs of the box girders, while the connections between boxes were modeled using frame elements. The following assumptions were made for developing the model:
• Shell and frame elements represent the centerlines of the modeled components.
Figure 2. Post-tensioning connection details. Note: 1 in. = 25.4 mm; 1 ft = 0.305 m.
Plan view
Duct at 8 ft spacing
Sleeve at 8 ft spacing
GroutShear key
7.25 in.
7.75 in.
Spherical nut for 1 in. diameter rod
6 in. x 6 in. x 1.5 in. dished plate
Coupling nut 4.25 in. long
1 in. diameterthreaded rodat 8 ft spacing
Elevation view
Spr ing 2012 | PCI Journal68
behavior could be monitored under top and bottom tensile conditions. Specimen size was determined based on setup limitations. Unlike real bridge applications, supports had to be placed along the transverse direction instead of the lon-gitudinal direction of the specimen. This allowed for a test setup that could induce top tension; however, it also caused the specimen weight to shift from a longitudinal distribu-tion to a transverse distribution. This effect was accounted for in the analysis to determine specimen loading.
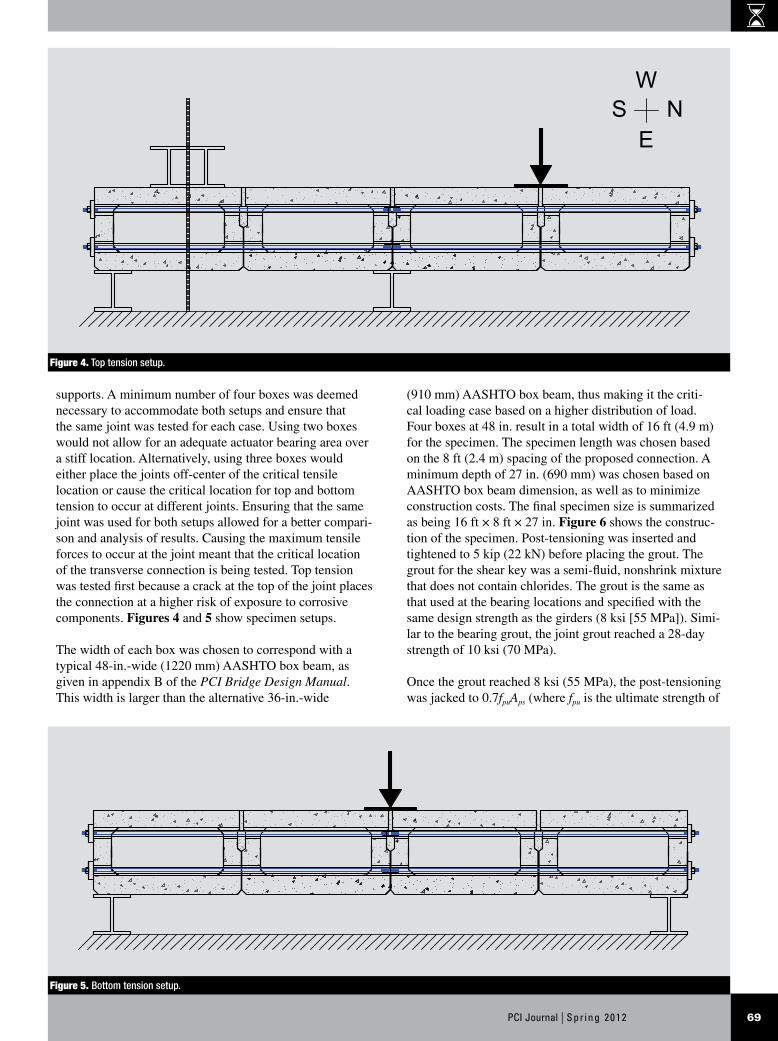
The method selected to induce top tension in the speci-men was a simple support setup with part of the specimen width overhanging one support. Neoprene bearing pads were placed between the specimen and bearing locations to provide additional flexibility for the system. The actuator that applied the fatigue load had a 15 in. × 15 in. (380 mm × 380 mm) bearing area at midspan of the cantilevered sec-tion. All bearing areas corresponded to stiff locations, such as webs and joints. To prevent the specimen from lifting off the support farthest from the load, the specimen had to be held down using a top support. This support was placed as close to the end of the specimen width as lab conditions would allow. Maximum tension for this setup occurred at the support closest to the load.
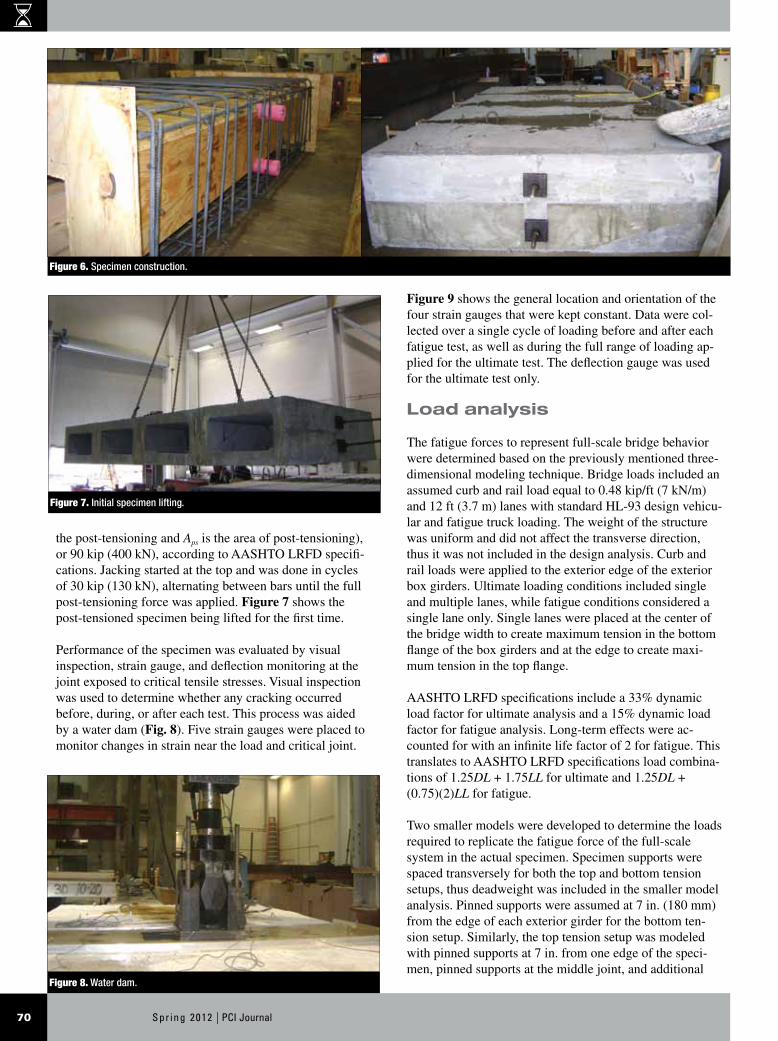
Bottom tension was created with a typical simple support setup with the load applied at the center of the specimen. Maximum tension for this case occurs midway between
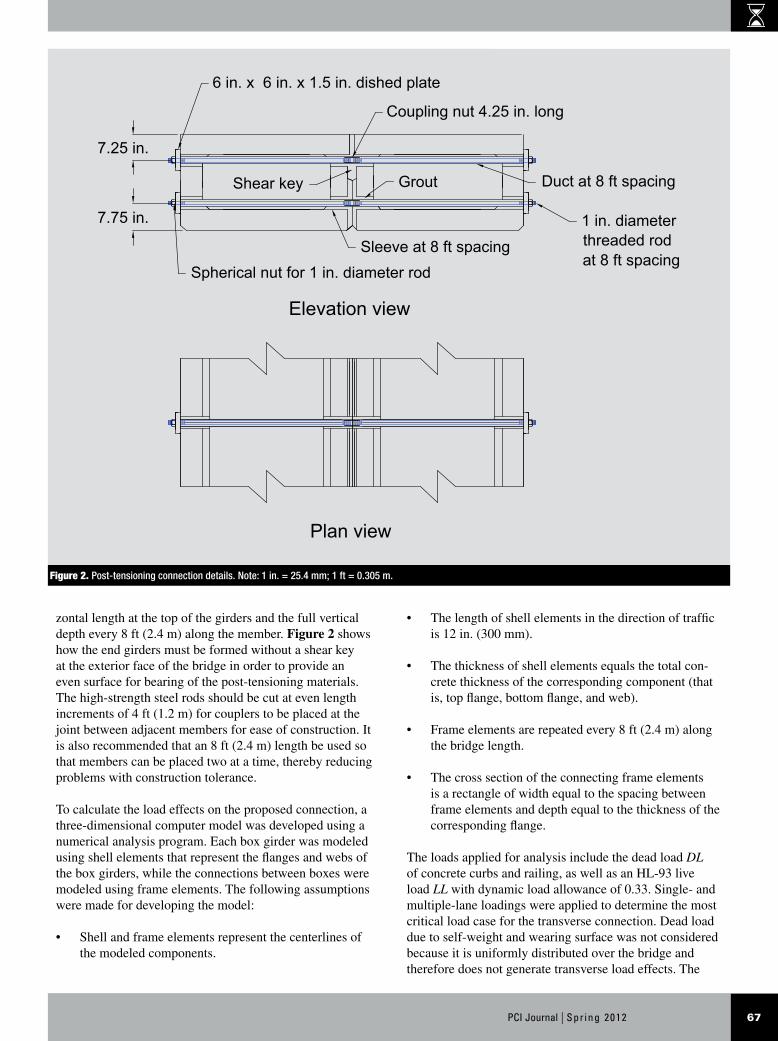
weight of the concrete curb and railing was assumed to be 0.48 kip/ft (7.0 kN/m) applied to the outside box gird-ers. Design charts were developed for the post-tensioned system based on the results of the three-dimensional model analysis. The effect of box girder depth, span width, and span-to-depth ratio were considered.
Figure 3 shows the effect of box depth and bridge width on the tension in the transverse connection for the post-ten-sioned system. This figure is developed for zero skew and a span-to-depth ratio of 30. The figure indicates that the tension increases with increasing bridge width and decreas-ing box depth. The effect of bridge width on the required tension force is higher on narrow bridges (width less than 52 ft [16 m]) than on wide bridges. Forces for this chart result from factored loads (1.25DL + 1.75LL) and can be divided by the effective prestress of the post-tensioning to determine the required area of reinforcement. An example of this calculation is provided in the appendix.
Experimental program
The effectiveness of the developed system was analyzed based on its joint performance under fatigue and ultimate loading. The purpose of fatigue loading was to verify that ultimate loading controls transverse post-tensioning requirements. Fatigue was represented by a 5 million cyclic load. Two setups were used so that the connection
Figure 3. Effect of box depth and bridge width on the post-tensioned system. Note: 1 in. = 25.4 mm; 1 ft = 0.305 m; 1 kip = 4.448 kN.
0.0
20.0
40.0
60.0
80.0
100.0
120.0
24 34 44 54 64 74 84
Tens
ion
forc
e, k
ip
Bridge width, ft
27
33
39
42
Box depth, in.
Post-tensioned connection every 8 ft Span-to-depth ratio = 30
69PCI Journal | Spr ing 2012
supports. A minimum number of four boxes was deemed necessary to accommodate both setups and ensure that the same joint was tested for each case. Using two boxes would not allow for an adequate actuator bearing area over a stiff location. Alternatively, using three boxes would either place the joints off-center of the critical tensile location or cause the critical location for top and bottom tension to occur at different joints. Ensuring that the same joint was used for both setups allowed for a better compari-son and analysis of results. Causing the maximum tensile forces to occur at the joint meant that the critical location of the transverse connection is being tested. Top tension was tested first because a crack at the top of the joint places the connection at a higher risk of exposure to corrosive components. Figures 4 and 5 show specimen setups.
The width of each box was chosen to correspond with a typical 48-in.-wide (1220 mm) AASHTO box beam, as given in appendix B of the PCI Bridge Design Manual. This width is larger than the alternative 36-in.-wide
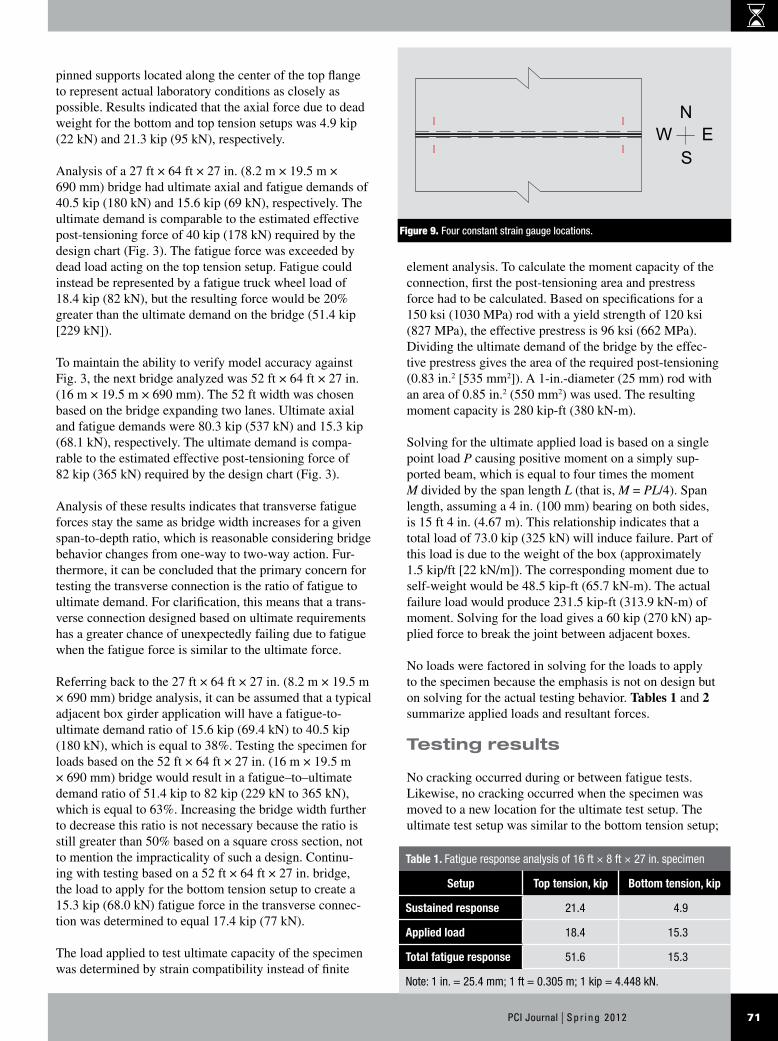
(910 mm) AASHTO box beam, thus making it the criti-cal loading case based on a higher distribution of load. Four boxes at 48 in. result in a total width of 16 ft (4.9 m) for the specimen. The specimen length was chosen based on the 8 ft (2.4 m) spacing of the proposed connection. A minimum depth of 27 in. (690 mm) was chosen based on AASHTO box beam dimension, as well as to minimize construction costs. The final specimen size is summarized as being 16 ft × 8 ft × 27 in. Figure 6 shows the construc-tion of the specimen. Post-tensioning was inserted and tightened to 5 kip (22 kN) before placing the grout. The grout for the shear key was a semi-fluid, nonshrink mixture that does not contain chlorides. The grout is the same as that used at the bearing locations and specified with the same design strength as the girders (8 ksi [55 MPa]). Simi-lar to the bearing grout, the joint grout reached a 28-day strength of 10 ksi (70 MPa).
Once the grout reached 8 ksi (55 MPa), the post-tensioning was jacked to 0.7fpuAps (where fpu is the ultimate strength of
Figure 4. Top tension setup.
WNS
E
Figure 5. Bottom tension setup.
Spr ing 2012 | PCI Journal70
the post-tensioning and Aps is the area of post-tensioning), or 90 kip (400 kN), according to AASHTO LRFD specifi-cations. Jacking started at the top and was done in cycles of 30 kip (130 kN), alternating between bars until the full post-tensioning force was applied. Figure 7 shows the post-tensioned specimen being lifted for the first time.
Performance of the specimen was evaluated by visual inspection, strain gauge, and deflection monitoring at the joint exposed to critical tensile stresses. Visual inspection was used to determine whether any cracking occurred before, during, or after each test. This process was aided by a water dam (Fig. 8). Five strain gauges were placed to monitor changes in strain near the load and critical joint.
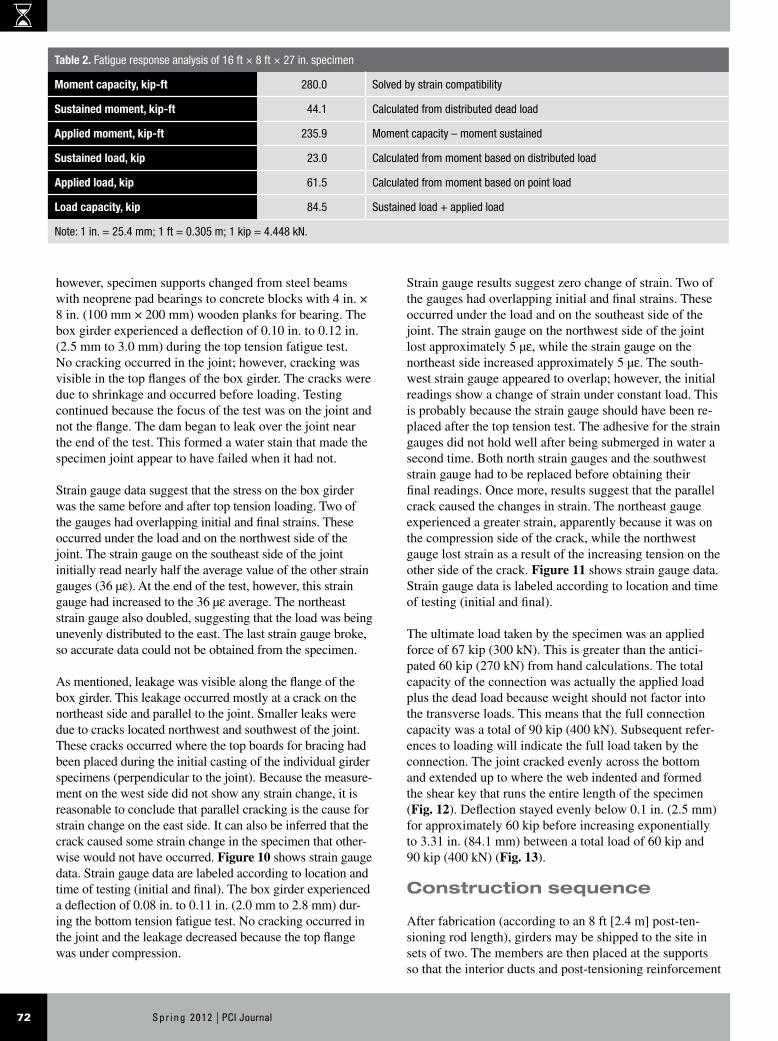
Figure 9 shows the general location and orientation of the four strain gauges that were kept constant. Data were col-lected over a single cycle of loading before and after each fatigue test, as well as during the full range of loading ap-plied for the ultimate test. The deflection gauge was used for the ultimate test only.
Load analysis
The fatigue forces to represent full-scale bridge behavior were determined based on the previously mentioned three-dimensional modeling technique. Bridge loads included an assumed curb and rail load equal to 0.48 kip/ft (7 kN/m) and 12 ft (3.7 m) lanes with standard HL-93 design vehicu-lar and fatigue truck loading. The weight of the structure was uniform and did not affect the transverse direction, thus it was not included in the design analysis. Curb and rail loads were applied to the exterior edge of the exterior box girders. Ultimate loading conditions included single and multiple lanes, while fatigue conditions considered a single lane only. Single lanes were placed at the center of the bridge width to create maximum tension in the bottom flange of the box girders and at the edge to create maxi-mum tension in the top flange.
AASHTO LRFD specifications include a 33% dynamic load factor for ultimate analysis and a 15% dynamic load factor for fatigue analysis. Long-term effects were ac-counted for with an infinite life factor of 2 for fatigue. This translates to AASHTO LRFD specifications load combina-tions of 1.25DL + 1.75LL for ultimate and 1.25DL + (0.75)(2)LL for fatigue.
Two smaller models were developed to determine the loads required to replicate the fatigue force of the full-scale system in the actual specimen. Specimen supports were spaced transversely for both the top and bottom tension setups, thus deadweight was included in the smaller model analysis. Pinned supports were assumed at 7 in. (180 mm) from the edge of each exterior girder for the bottom ten-sion setup. Similarly, the top tension setup was modeled with pinned supports at 7 in. from one edge of the speci-men, pinned supports at the middle joint, and additional
Figure 6. Specimen construction.
Figure 7. Initial specimen lifting.
Figure 8. Water dam.
71PCI Journal | Spr ing 2012
element analysis. To calculate the moment capacity of the connection, first the post-tensioning area and prestress force had to be calculated. Based on specifications for a 150 ksi (1030 MPa) rod with a yield strength of 120 ksi (827 MPa), the effective prestress is 96 ksi (662 MPa). Dividing the ultimate demand of the bridge by the effec-tive prestress gives the area of the required post-tensioning (0.83 in.2 [535 mm2]). A 1-in.-diameter (25 mm) rod with an area of 0.85 in.2 (550 mm2) was used. The resulting moment capacity is 280 kip-ft (380 kN-m).
Solving for the ultimate applied load is based on a single point load P causing positive moment on a simply sup-ported beam, which is equal to four times the moment M divided by the span length L (that is, M = PL/4). Span length, assuming a 4 in. (100 mm) bearing on both sides, is 15 ft 4 in. (4.67 m). This relationship indicates that a total load of 73.0 kip (325 kN) will induce failure. Part of this load is due to the weight of the box (approximately 1.5 kip/ft [22 kN/m]). The corresponding moment due to self-weight would be 48.5 kip-ft (65.7 kN-m). The actual failure load would produce 231.5 kip-ft (313.9 kN-m) of moment. Solving for the load gives a 60 kip (270 kN) ap-plied force to break the joint between adjacent boxes.
No loads were factored in solving for the loads to apply to the specimen because the emphasis is not on design but on solving for the actual testing behavior. Tables 1 and 2 summarize applied loads and resultant forces.
Testing results
No cracking occurred during or between fatigue tests. Likewise, no cracking occurred when the specimen was moved to a new location for the ultimate test setup. The ultimate test setup was similar to the bottom tension setup;
pinned supports located along the center of the top flange to represent actual laboratory conditions as closely as possible. Results indicated that the axial force due to dead weight for the bottom and top tension setups was 4.9 kip (22 kN) and 21.3 kip (95 kN), respectively.
Analysis of a 27 ft × 64 ft × 27 in. (8.2 m × 19.5 m × 690 mm) bridge had ultimate axial and fatigue demands of 40.5 kip (180 kN) and 15.6 kip (69 kN), respectively. The ultimate demand is comparable to the estimated effective post-tensioning force of 40 kip (178 kN) required by the design chart (Fig. 3). The fatigue force was exceeded by dead load acting on the top tension setup. Fatigue could instead be represented by a fatigue truck wheel load of 18.4 kip (82 kN), but the resulting force would be 20% greater than the ultimate demand on the bridge (51.4 kip [229 kN]).
To maintain the ability to verify model accuracy against Fig. 3, the next bridge analyzed was 52 ft × 64 ft × 27 in. (16 m × 19.5 m × 690 mm). The 52 ft width was chosen based on the bridge expanding two lanes. Ultimate axial and fatigue demands were 80.3 kip (537 kN) and 15.3 kip (68.1 kN), respectively. The ultimate demand is compa-rable to the estimated effective post-tensioning force of 82 kip (365 kN) required by the design chart (Fig. 3).
Analysis of these results indicates that transverse fatigue forces stay the same as bridge width increases for a given span-to-depth ratio, which is reasonable considering bridge behavior changes from one-way to two-way action. Fur-thermore, it can be concluded that the primary concern for testing the transverse connection is the ratio of fatigue to ultimate demand. For clarification, this means that a trans-verse connection designed based on ultimate requirements has a greater chance of unexpectedly failing due to fatigue when the fatigue force is similar to the ultimate force.
Referring back to the 27 ft × 64 ft × 27 in. (8.2 m × 19.5 m × 690 mm) bridge analysis, it can be assumed that a typical adjacent box girder application will have a fatigue-to-ultimate demand ratio of 15.6 kip (69.4 kN) to 40.5 kip (180 kN), which is equal to 38%. Testing the specimen for loads based on the 52 ft × 64 ft × 27 in. (16 m × 19.5 m × 690 mm) bridge would result in a fatigue–to–ultimate demand ratio of 51.4 kip to 82 kip (229 kN to 365 kN), which is equal to 63%. Increasing the bridge width further to decrease this ratio is not necessary because the ratio is still greater than 50% based on a square cross section, not to mention the impracticality of such a design. Continu-ing with testing based on a 52 ft × 64 ft × 27 in. bridge, the load to apply for the bottom tension setup to create a 15.3 kip (68.0 kN) fatigue force in the transverse connec-tion was determined to equal 17.4 kip (77 kN).
The load applied to test ultimate capacity of the specimen was determined by strain compatibility instead of finite
Table 1. Fatigue response analysis of 16 ft × 8 ft × 27 in. specimen
Setup Top tension, kip Bottom tension, kip
Sustained response 21.4 4.9
Applied load 18.4 15.3
Total fatigue response 51.6 15.3
Note: 1 in. = 25.4 mm; 1 ft = 0.305 m; 1 kip = 4.448 kN.
Figure 9. Four constant strain gauge locations.
NEW
S
Spr ing 2012 | PCI Journal72
Strain gauge results suggest zero change of strain. Two of the gauges had overlapping initial and final strains. These occurred under the load and on the southeast side of the joint. The strain gauge on the northwest side of the joint lost approximately 5 µε, while the strain gauge on the northeast side increased approximately 5 µε. The south-west strain gauge appeared to overlap; however, the initial readings show a change of strain under constant load. This is probably because the strain gauge should have been re-placed after the top tension test. The adhesive for the strain gauges did not hold well after being submerged in water a second time. Both north strain gauges and the southwest strain gauge had to be replaced before obtaining their final readings. Once more, results suggest that the parallel crack caused the changes in strain. The northeast gauge experienced a greater strain, apparently because it was on the compression side of the crack, while the northwest gauge lost strain as a result of the increasing tension on the other side of the crack. Figure 11 shows strain gauge data. Strain gauge data is labeled according to location and time of testing (initial and final).
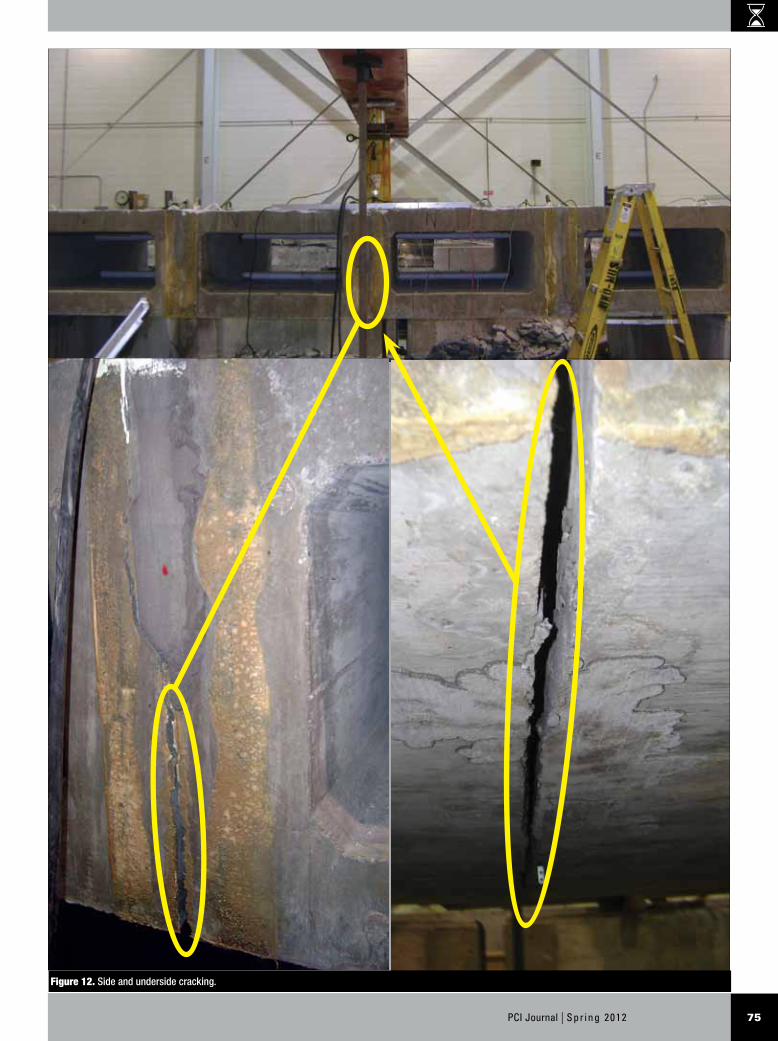
The ultimate load taken by the specimen was an applied force of 67 kip (300 kN). This is greater than the antici-pated 60 kip (270 kN) from hand calculations. The total capacity of the connection was actually the applied load plus the dead load because weight should not factor into the transverse loads. This means that the full connection capacity was a total of 90 kip (400 kN). Subsequent refer-ences to loading will indicate the full load taken by the connection. The joint cracked evenly across the bottom and extended up to where the web indented and formed the shear key that runs the entire length of the specimen (Fig. 12). Deflection stayed evenly below 0.1 in. (2.5 mm) for approximately 60 kip before increasing exponentially to 3.31 in. (84.1 mm) between a total load of 60 kip and 90 kip (400 kN) (Fig. 13).
Construction sequence
After fabrication (according to an 8 ft [2.4 m] post-ten-sioning rod length), girders may be shipped to the site in sets of two. The members are then placed at the supports so that the interior ducts and post-tensioning reinforcement
however, specimen supports changed from steel beams with neoprene pad bearings to concrete blocks with 4 in. × 8 in. (100 mm × 200 mm) wooden planks for bearing. The box girder experienced a deflection of 0.10 in. to 0.12 in. (2.5 mm to 3.0 mm) during the top tension fatigue test. No cracking occurred in the joint; however, cracking was visible in the top flanges of the box girder. The cracks were due to shrinkage and occurred before loading. Testing continued because the focus of the test was on the joint and not the flange. The dam began to leak over the joint near the end of the test. This formed a water stain that made the specimen joint appear to have failed when it had not.
Strain gauge data suggest that the stress on the box girder was the same before and after top tension loading. Two of the gauges had overlapping initial and final strains. These occurred under the load and on the northwest side of the joint. The strain gauge on the southeast side of the joint initially read nearly half the average value of the other strain gauges (36 µε). At the end of the test, however, this strain gauge had increased to the 36 µε average. The northeast strain gauge also doubled, suggesting that the load was being unevenly distributed to the east. The last strain gauge broke, so accurate data could not be obtained from the specimen.
As mentioned, leakage was visible along the flange of the box girder. This leakage occurred mostly at a crack on the northeast side and parallel to the joint. Smaller leaks were due to cracks located northwest and southwest of the joint. These cracks occurred where the top boards for bracing had been placed during the initial casting of the individual girder specimens (perpendicular to the joint). Because the measure-ment on the west side did not show any strain change, it is reasonable to conclude that parallel cracking is the cause for strain change on the east side. It can also be inferred that the crack caused some strain change in the specimen that other-wise would not have occurred. Figure 10 shows strain gauge data. Strain gauge data are labeled according to location and time of testing (initial and final). The box girder experienced a deflection of 0.08 in. to 0.11 in. (2.0 mm to 2.8 mm) dur-ing the bottom tension fatigue test. No cracking occurred in the joint and the leakage decreased because the top flange was under compression.
Table 2. Fatigue response analysis of 16 ft × 8 ft × 27 in. specimen
Moment capacity, kip-ft 280.0 Solved by strain compatibility
Sustained moment, kip-ft 44.1 Calculated from distributed dead load
Applied moment, kip-ft 235.9 Moment capacity – moment sustained
Sustained load, kip 23.0 Calculated from moment based on distributed load
Applied load, kip 61.5 Calculated from moment based on point load
Load capacity, kip 84.5 Sustained load + applied load
Note: 1 in. = 25.4 mm; 1 ft = 0.305 m; 1 kip = 4.448 kN.

73PCI Journal | Spr ing 2012
can be inserted through the sleeves. The following outlines the complete construction of a bridge using the proposed system:
1. Place the supports.
2. Set two girders on supports beginning at the edge and moving adjacently to form the bridge width.
3. Insert the interior duct.
4. Add the post-tensioning.
5. Attach the post-tensioning and the interior duct cou-pler at each joint if more than two girders are wait-ing to be placed. Fit the interior duct with the sleeve blockout.
6. Repeat steps 2 through 5.
7. Repeat steps 2 through 4 with final girders. Attach post-tensioning anchorage to the exterior two girders.
8. Tighten post-tensioning to approximately 5 kip (22 kN).
9. Grout the shear keys.
10. Apply full post-tensioning force.
Conclusion
The objective of this research was to improve the per-formance of the transverse connections currently used in adjacent box-girder bridges. This was done by developing a detail capable of transferring moment and shear in the transverse direction. The authors combined the efforts of this research with a previous study2 in which intermediate and end diaphragms and a concrete overlay were proved to be unnecessary for adequate load distribution in the transverse direction of non-post-tensioned adjacent box
Figure 10. Initial and final strains for top tension fatigue setup. Note: Lf = final readings for strain gauge next to load; Li = initial readings for strain gauge next to load; NEf = final readings for strain gauge at northeast corner of joint; NEi = initial readings for strain gauge at northeast corner of joint; NWf = final readings for strain gauge at northwest corner of joint; NWi = initial readings for strain gauge at northwest corner of joint; SEf = final readings for strain gauge at southeast corner of joint; SEi = initial readings for strain gauge at southeast corner of joint; SWf = final readings for strain gauge at southwest corner of joint; SWi = initial readings for strain gauge at southwest corner of joint.
-60
-40
-20
0
20
40
60
80
0 20 40 60 80 100 120
Stra
in,
Time t, sec
Li Lf NEi
NEf NWi NWf
SEi SEf SWi
SWf

Spr ing 2012 | PCI Journal74
girder connections. Benefits of this system, as well as the modified system that allows for post-tensioning, include significantly simplified box production, an improved rate of construction, easier inspection of voids, and reduced costs. It was found that post-tensioning also increases the capacity and efficiency of the section because joints are placed under compression and are less likely to experience reflective cracking and leakage.
The experimental program consisted of applying an 18.4 kip (82 kN) load for 5 million cycles at an exterior joint of the four-box specimen with supports at the center and opposite edge. This produced tension at the more criti-cal top flange, where the system is vulnerable to environ-mental chemicals and corrosives. Cracking was monitored by a dam over the joint and five strain gauges placed next to the load and on either side of the center joint. No cracking or strain change occurred during the experiment. Supports were then moved to both ends of the member and the load repositioned to the center joint for tension in the
bottom flange. A 17.4 kip (77.4 kN) load was applied for 5 million cycles, and no cracking or strain change oc-curred.
Ultimate capacity was calculated as 280 kip-ft (380 kN-m) using strain compatibility and found to be slightly higher during testing. A total load of 90 kip (400 kN), or 300 kip-ft (400 kN-m), was reached before failure. Crack-ing did not propagate until after 60 kip (270 kN), where-upon the deflection increased exponentially from 0.1 in. to 3.31 in. (2.5 mm to 84 mm) over the next 30 kip (130 kN) applied.
It was concluded that a post-tensioned transverse con-nection without diaphragms or a concrete overlay can be designed and detailed to have comparable performance to typical connections while being more economical and practical. The tested specimen had excellent performance under both static and cyclic loads.
Figure 11. Initial and final strains for bottom tension fatigue setup. Note: Lf = final readings for strain gauge next to load; Li = initial readings for strain gauge next to load; NEf = final readings for strain gauge at northeast corner of joint; NEi = initial readings for strain gauge at northeast corner of joint; NWf = final readings for strain gauge at northwest corner of joint; NWi = initial readings for strain gauge at northwest corner of joint; SEf = final readings for strain gauge at southeast corner of joint; SEi = initial readings for strain gauge at southeast corner of joint; SWf = final readings for strain gauge at southwest corner of joint; SWi = initial readings for strain gauge at southwest corner of joint.
-35
-30
-25
-20
-15
-10
-5
0
5
10
15
0 20 40 60 80 100 120 140 160
Stra
in,
Time t, sec
Li Lf NEi
NEf NWi NWf
SEi SEf SWi
SWf
75PCI Journal | Spr ing 2012
Figure 12. Side and underside cracking.

Spr ing 2012 | PCI Journal76
6. Bakht, B., L. G. Jaeger, and M. S. Cheung. 1983. Transverse Shear in Multibeam Bridges. Journal of Structural Engineering, V. 109, No. 4 (April): pp. 936–949.
7. PCI Bridges Committee. 1995. Reflective Cracking in Adjacent Box Beam Bridge Superstructures. Subcom-mittee on Adjacent Box Beam Bridges, Second Draft. Chicago, IL: PCI.
8. Martin, L. D., and A. E. N. Osborn. 1983. Connec-tions for Modular Concrete Bridge Decks. In FHWA-82/106, NTIS document PB84-118058. Glenview, IL: Consulting Engineers Group Inc.
9. Lall, J., S. Alampalli, and E. F. Dicocoo. 1998. Perfor-mance of Full-Depth Shear Keys in Adjacent Pre-stressed Box Beam Bridges. PCI Journal, V. 43, No. 2 (March–April): pp. 72–79.
10. American Association of State Highway and Trans-portation Officials (AASHTO). 2004. AASHTO LRFD Bridge Design Specifications. 3rd ed. Washington, DC: AASHTO.
References
1. El-Remaily, A., M. K. Tadros, T. Yamane, and G. Krause. 1996. Transverse Design of Adjacent Precast Prestressed Concrete Box Girder Bridges. PCI Jour-nal, V. 41, No. 4 (July–August): pp. 96–113.
2. Hanna, K., G. Morcous, and M. Tadros. 2011. Ad-jacent Box Girders without Internal Diaphragms or Post-tensioned Joints. PCI Journal, V. 56, No. 4 (Fall): pp. 94–107.
3. Labib, M. L. 2007. Effect of Transverse Post-ten-sioning on Load Distribution in Side-by-Side CFRP Prestressed Concrete Box Beam Bridges. MS thesis, Lawrence Technological University, Southfield, MI.
4. Hanna, K. E., G. Morcous, and M. K. Tadros. 2009. Transverse Post-tensioning Design and Detailing of Precast Prestressed Concrete Adjacent Box Girder Bridges. PCI Journal, V. 54, No. 4 (Fall): pp. 160–174.
5. Ministry of Transportation of Ontario (MTO). 1995. Ontario Highway Bridge Design Code. Downsview, ON, Canada: MTO.
Figure 13. Total load versus deflection of specimen. Note: 1 in. = 25.4 mm; 1 kip = 4.448 kN.
3.31 in. total deflection at 67 kip applied
0
10
20
30
40
50
60
70
80
90
100
0.00 0.50 1.00 1.50 2.00 2.50 3.00 3.50
Loa
d P
, kip
Deflection , in.
Weight = 23 kip
77PCI Journal | Spr ing 2012
11. PCI Bridge Design Manual Steering Committee. 1997. PCI Bridge Design Manual. MNL-133-97. 2nd ed. Chicago, IL: PCI.
12. Hanna, K. E., G. Morcous, and M. K. Tadros. 2007. Transverse Design and Detailing of Adjacent Box Beam Bridges. In The PCI National Bridge Confer-ence: Proceedings, October 22–24, 2007, Phoenix, Arizona. CD-ROM.
13. Hanna, K. E. 2008. Behavior of Adjacent Precast Prestressed Concrete Box Girder Bridges. PhD diss., University of Nebraska, Lincoln, NE.
Notation
Aps = area of post-tensioning
DL = dead load
fcl = compressive strength of concrete or grout
fpe = effective prestress of post-tensioning
fpu = ultimate strength of post-tensioning
fpy = yield strength of post-tensioning
fse = effective prestress of concrete
L = beam span
LL = live load
M = moment
P = point load
t = time
Δ = deflection
Spr ing 2012 | PCI Journal78
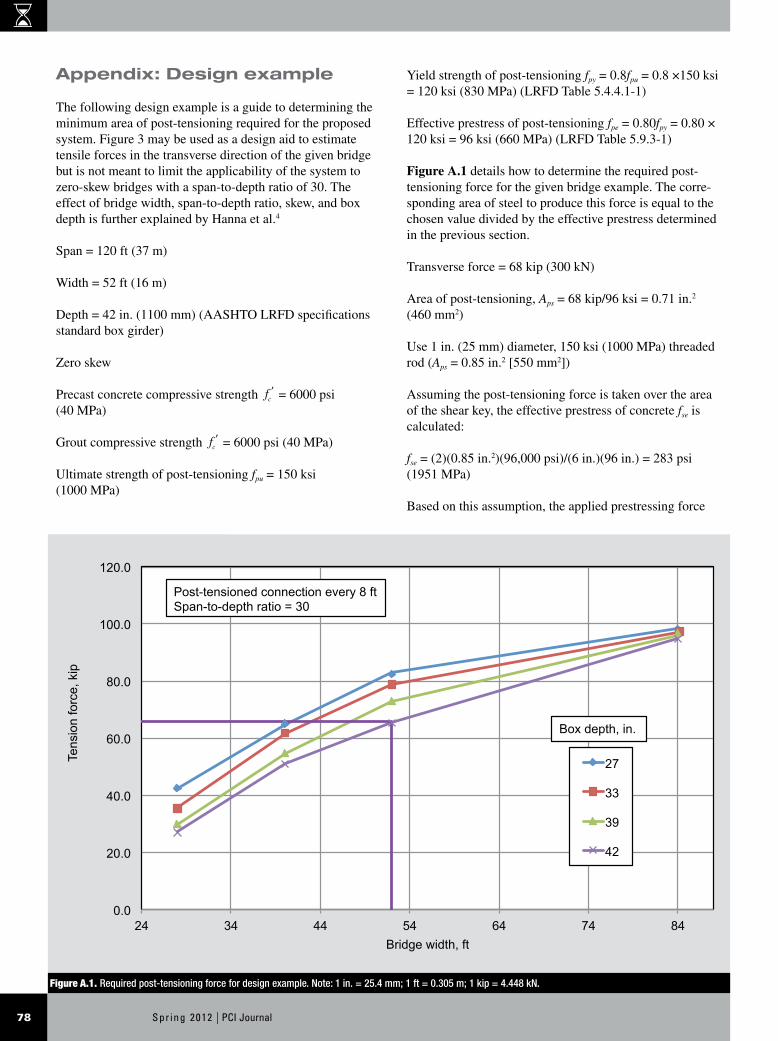
Yield strength of post-tensioning fpy = 0.8fpu = 0.8 ×150 ksi = 120 ksi (830 MPa) (LRFD Table 5.4.4.1-1)
Effective prestress of post-tensioning fpe = 0.80fpy = 0.80 × 120 ksi = 96 ksi (660 MPa) (LRFD Table 5.9.3-1)
Figure A.1 details how to determine the required post-tensioning force for the given bridge example. The corre-sponding area of steel to produce this force is equal to the chosen value divided by the effective prestress determined in the previous section.
Transverse force = 68 kip (300 kN)
Area of post-tensioning, Aps = 68 kip/96 ksi = 0.71 in.2 (460 mm2)
Use 1 in. (25 mm) diameter, 150 ksi (1000 MPa) threaded rod (Aps = 0.85 in.2 [550 mm2])
Assuming the post-tensioning force is taken over the area of the shear key, the effective prestress of concrete fse is calculated:
fse = (2)(0.85 in.2)(96,000 psi)/(6 in.)(96 in.) = 283 psi (1951 MPa)
Based on this assumption, the applied prestressing force
Appendix: Design example
The following design example is a guide to determining the minimum area of post-tensioning required for the proposed system. Figure 3 may be used as a design aid to estimate tensile forces in the transverse direction of the given bridge but is not meant to limit the applicability of the system to zero-skew bridges with a span-to-depth ratio of 30. The effect of bridge width, span-to-depth ratio, skew, and box depth is further explained by Hanna et al.4
Span = 120 ft (37 m)
Width = 52 ft (16 m)
Depth = 42 in. (1100 mm) (AASHTO LRFD specifications standard box girder)
Zero skew
Precast concrete compressive strength fcl = 6000 psi (40 MPa)
Grout compressive strength fcl = 6000 psi (40 MPa)
Ultimate strength of post-tensioning fpu = 150 ksi (1000 MPa)
Figure A.1. Required post-tensioning force for design example. Note: 1 in. = 25.4 mm; 1 ft = 0.305 m; 1 kip = 4.448 kN.
0.0
20.0
40.0
60.0
80.0
100.0
120.0
24 34 44 54 64 74 84
Tens
ion
forc
e, k
ip
Bridge width, ft
27
33
39
42
Box depth, in.
Post-tensioned connection every 8 ft Span-to-depth ratio = 30

79PCI Journal | Spr ing 2012
meets AASHTO LRFD specifications’ recommendations for a 250 psi (1724 kPa) compression force at the joint. Considering an alternative area based on the girder contact face, the force is less than 250 psi (1720 kPa); however, the results of the experimental program are enough to demon-strate the system’s adequacy with regard to test and experi-ence, thus further substantiating the design.
About the authors
Jenna L. Hansen is a masters student in the Department of Civil Engineering at the University of Nebraska–Lincoln.
Kromel E. Hanna, PhD, is a project engineer for Con-Fab Cali-fornia Corp. of Lathrop, Calif.
Maher K. Tadros, PhD, P.E., is an emeritus professor of Civil Engineering at the University of Nebraska–Lincoln and principal of E.construct.USA.
Abstract
Precast, prestressed concrete adjacent box girders are regularly considered for short- to medium-span bridges on secondary roads. This corresponds to spans from 20 ft to 127 ft (6.1 m to 38.7 m), though typically no more than 40 ft (12.2 m). Many of these projects have limited funding or require rapid construction. Sec-ondary roads are also subject to a certain amount of public criticism, particularly with regard to cost and aesthetic appeal. Research has shown that an appeal-ing structure can be defined as having continuously flat soffits and high span-to-depth ratios—characteristics
of an adjacent box system. Proper design and detail-ing of the transverse connection between girders is essential to minimizing both initial cost and long-term maintenance. Typical connections include diaphragms and cast-in-place concrete toppings, which directly increase both cost and time of construction. Inadequate post-tensioning is the primary cause of reflective cracking leading to ingress of chlorides and the con-sequent reinforcement deterioration, excessive girder deflection, and possible unexpected failures.
This paper presents the results of testing on a post-tensioned transverse system that eliminates the need for diaphragms and a concrete overlay. Post-tensioning was determined based on previous research on a simi-lar system that was not post-tensioned. Results indicate that the system does not exhibit strain change or crack-ing under fatigue loading and would be an excellent candidate for practical applications.
Keywords
Box girder, bridge, connection, grout, post-tensioning, shear key, transverse connection.
Review policy
This paper was reviewed in accordance with the Precast/Prestressed Concrete Institute’s peer-review process.
Reader comments
Please address any reader comments to journal@pci .org or Precast/Prestressed Concrete Institute, c/o PCI Journal, 200 W. Adams St., Suite 2100, Chicago, IL 60606. J


![Post Tensioning[1]](https://img.pdfslide.us/doc/110x75/543ffc0bafaf9fff098b4bcd/post-tensioning1.jpg)