Embed Size (px)
Citation preview
CDM-SSC-PDD (version 02) CDM – Executive Board page 1
CLEAN DEVELOPMENT MECHANISM SIMPLIFIED PROJECT DESIGN DOCUMENT
FOR SMALL-SCALE PROJECT ACTIVITIES (SSC-CDM-PDD) Version 02
CONTENTS
A. General description of the small-scale project activity B. Baseline methodology C. Duration of the project activity / Crediting period D. Monitoring methodology and plan E. Calculation of GHG emission reductions by sources F. Environmental impacts G. Stakeholders comments
Annexes Annex 1: Information on participants in the project activity Annex 2: Information regarding public funding Annex 3: Baseline Information Annex 4: Abbreviations Attachment:
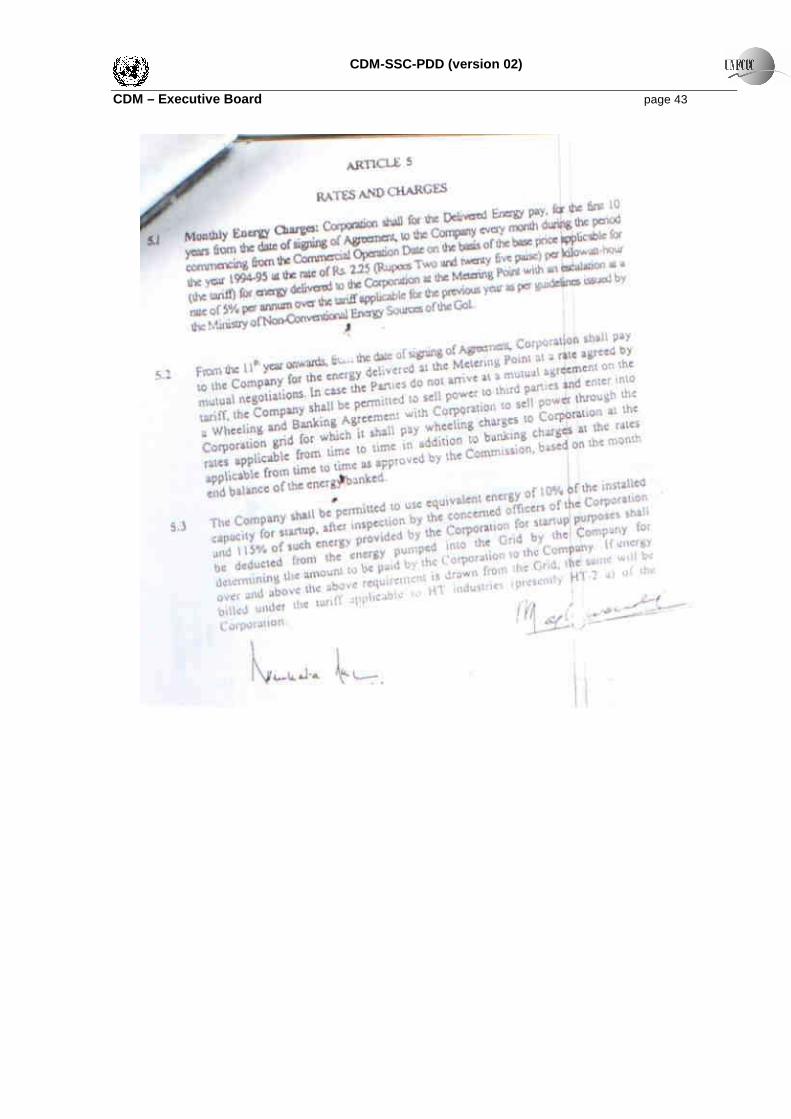
1. In principle clearance from Government of Karnataka for setting up of the project 2. Term loan sanction letters from funding institutions evidencing rate of interest on debt. 3. Extract from Power Purchase Agreement indicating the power purchase price (Article 5 –
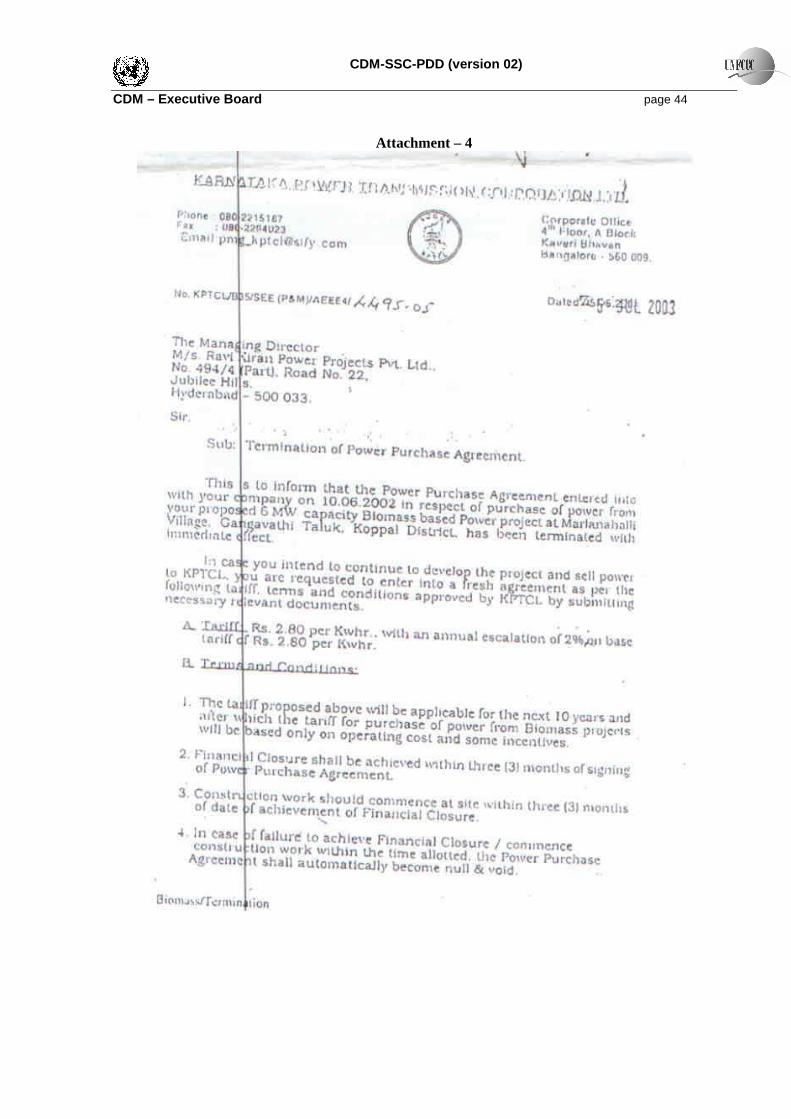
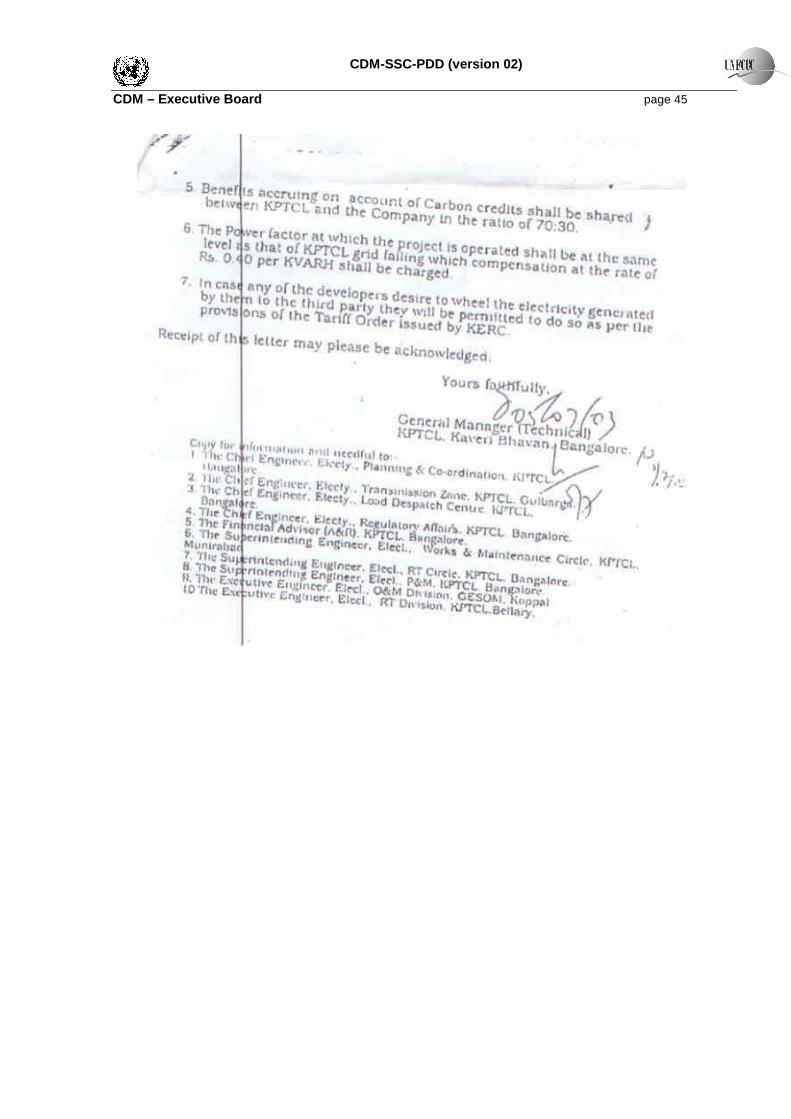
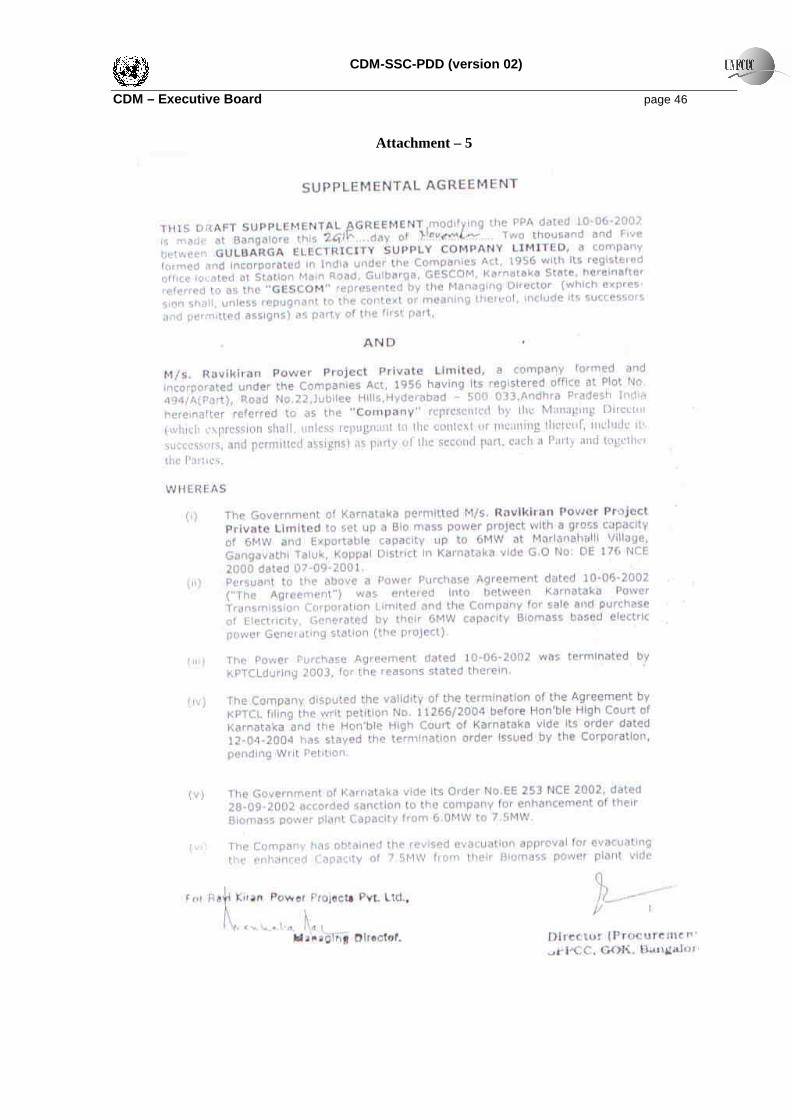
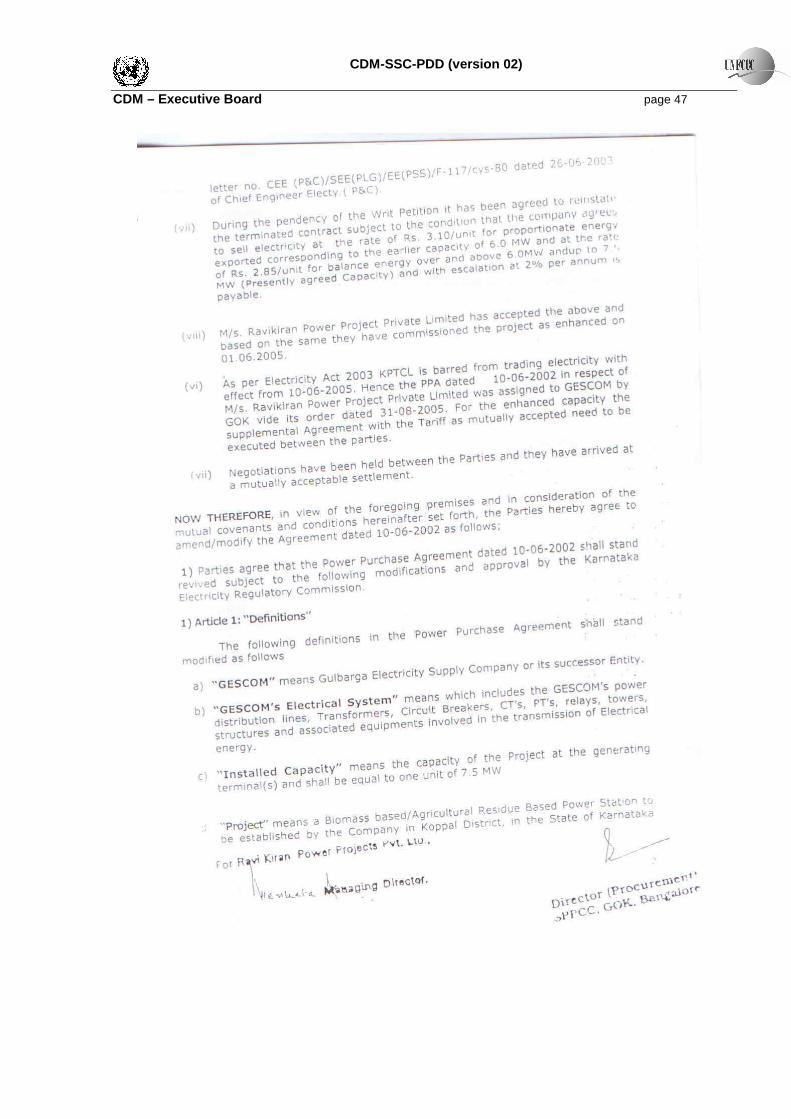
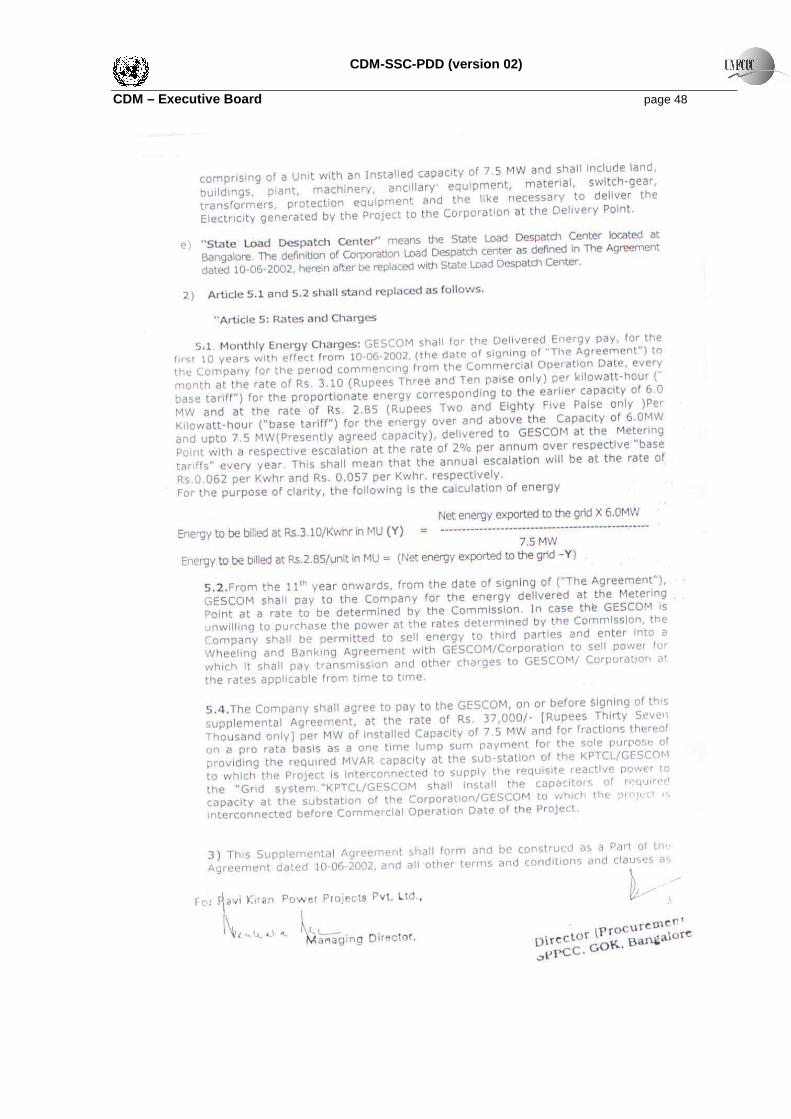
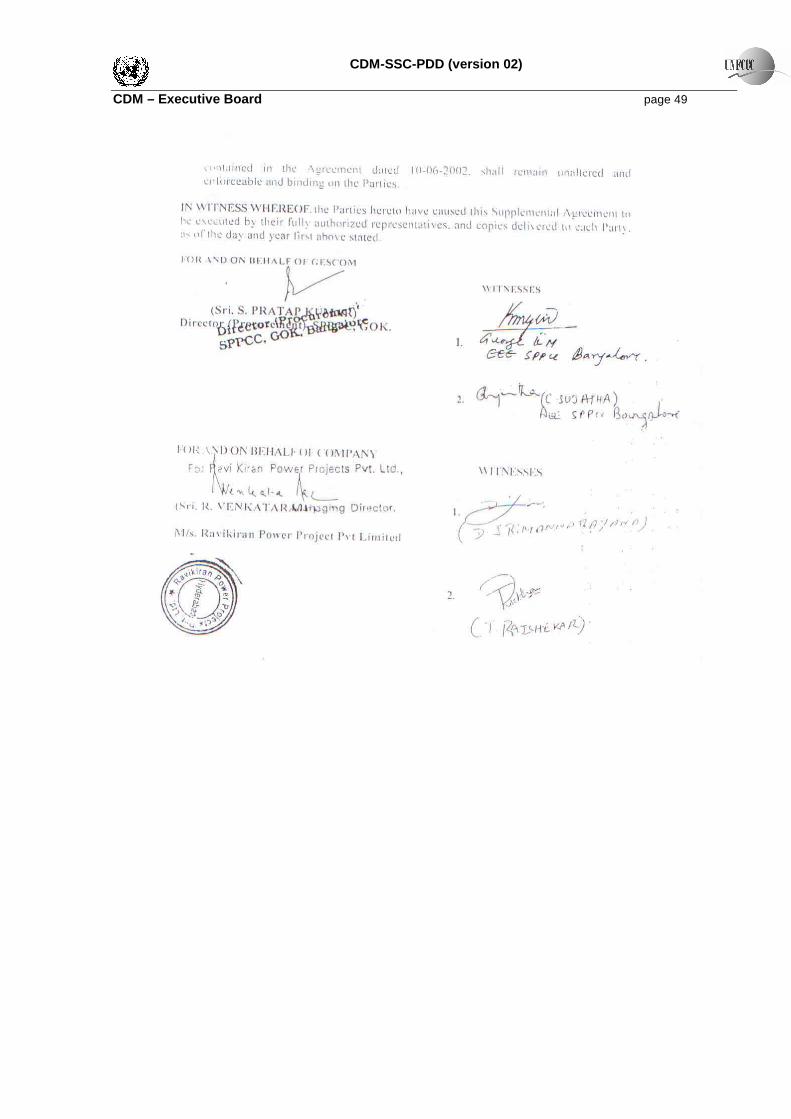
Rates & Charges) 4. Letter issued by KPTCL terminating the PPA and indicating the revised tariff 5. Supplemental Agreement (modifying the PPA) executed between Gulbarga Electricity
Supply Company Ltd., and Ravikiran Power 6. Project IRR and Benchmark analysis in soft copy (Pre-project and Post-project scenarios in excel spreadsheet separately attached)
CDM-SSC-PDD (version 02) CDM – Executive Board page 2
Revision history of this document Version Number
Date Description and reason of revision
01 21 January 2003
Initial adoption
02 8 July 2005 • The Board agreed to revise the CDM SSC PDD to reflect guidance and clarifications provided by the Board since version 01 of this document.
• As a consequence, the guidelines for completing CDM SSC PDD have been revised accordingly to version 2. The latest version can be found at <http://cdm.unfccc.int/Reference/Documents>.
CDM-SSC-PDD (version 02) CDM – Executive Board page 3
SECTION A. General description of the small-scale project activity A.1. Title of the small-scale project activity: >> Title : 7.5 MW renewable energy generation for a grid, Karnataka, India Version: 03 dated 30/04/2007 A.2. Description of the small-scale project activity: >> The purpose of the project activity is to utilise available biomass fuels in the region to generate clean power for the grid system owned by the state owned power utility, Karnataka Power Transmission Corporation Limited (KPTCL). The plant location was selected based on surplus availability of biomass in the form of agro-industrial residue such as rice husk and other crop residues. The annual biomass requirement for the 7.5 MW plant is estimated as 75,000 tonnes. A detailed survey for fuel availability was carried out and found that surplus biomass is available in the Koppal District of Karnataka. In the event of non-availability of sufficient quantity of biomass, the project participants may utilise coal as supplementary fuel, as permitted by the Ministry of Non-conventional Energy Sources. However, the maximum quantity of coal that can be co-fired is restricted to 25% of the annual total fuel requirement. The project proponents considered on a conservative basis usage of coal to an extent of about 10% of total fuel as supplementary fuel during the operational life time of plant. Apart from export of surplus power to the state utility, the other objectives of the project activity are: a) Sustainable Development, through utilisation of biomass and crop residues b) Mitigation of local environment pollution and health hazards c) Climate change mitigation, through renewable energy generation and reducing the demand for
fossil fuel based power d) Contributing to the national electricity capacity through additional power generation The following local benefits are expected due to the project
• Proper utilisation of locally available biomass resources. • Generation of additional income for rural farmers due to creation of commercial value for
the neglected biomass • Generation of eco-friendly green power and contribution to the availability of quality power
in rural areas (due to the project located in rural area); • Creation of indirect employment for rural unemployed youth due to requirement of
collection of biomass through out the year. • Creation of direct employment for both skilled and unskilled person during the operation of
the plant • Contribution to the sustainable development through generation of renewable energy for a
grid system that is predominantly conventional fossil fuel based. By utilising renewable energy sources the project reduces demand / use of fossil fuels for power generation.
CDM-SSC-PDD (version 02) CDM – Executive Board page 4
View of project participant about the project activity’s contribution to Sustainable Development Ministry of Environment and Forests (MoEF), Government of India, has stipulated the following indicators for sustainable development in the interim approval guidelines for CDM projects.
1. Social well being 2. Economic well being 3. Environmental well being 4. Technological well being
The project activity contributes to the above indicators in the following manner.
Social well being The 7.5 MW biomass based power project caters jobs for number of persons in the rural area during construction phase and is catering presently in various ways like biomass collection, processing of biomass, transportation of biomass as well as in the operation of the power plant. Apart from the direct employment generation, project also encourages indirect employment by setting up other agro industries due to availability of power supply from the project. Commercial value to agricultural residues will encourage the farmers to collect biomass from fields which will improve the income levels of the farmers. The project has engaged both genders during construction of the project and it will continue in biomass collection, biomass processing etc during operation lifetime of the project and this will lead to increase in gender equity and prevents social disparities. Economic well being The project will bring in additional capital investment and indirectly supports creation of local infrastructure like roads, schools and other basic civic amenities. The capital investment in the local area is at a cost of Rs.322.9 millions. The project acts as a nucleus for other economic activities such as setting up of cottage industries, shops, hotels etc around the area contributing to the economic development around the project area. The project activity helps local farmers in earning extra income by selling crop residues there by helping them to improve their economic standards. The biomass based power generating plant facilitates the availability of continuous and sustained power to the local industries and agricultural farmers located in remote areas, there by avoiding the load shedding and low frequency of power. Environmental well being The project activity utilises biomass potential available for power generation, which otherwise is dominated by fossil fuels such as coal, lignite and gas. The project will not result in increase of GHG emissions and cause no negative impact on the environment. The project generates real, measurable and long-term emissions reductions.
CDM-SSC-PDD (version 02) CDM – Executive Board page 5 The project utilizes surplus biomass residues and thereby reduces dependence on fossil fuels to certain extent. The project conserves local resources, reduces pressure on the local environment to some extent, provides improved health and other environmental benefits. Technological well being The CDM project activity leads to increase in utilization of biomass resources for power generation and contributes to the energy security in the country. The above benefits due to the project activity ensure that the project is contributing to the sustainable development of the region. A.3. Project participants: >> Name of the party involved
((host) indicates a host party) Private and/or public entity
(ies) project participants Whether party involved
wishes to be considered as project participant
India (Host)
Private Entity: Ravikiran Power Projects (P)
Limited, Hyderabad
No.
A.4. Technical description of the small-scale project activity: >> A.4.1. Location of the small-scale project activity : >> A.4.1.1. Host Party(ies): >> India A.4.1.2. Region/State/Province etc.: >> State : Karnataka A.4.1.3. City/Town/Community etc: >> District : Koppal Taluk : Gangavathi Village : Marlanhalli A.4.1.4. Detail of physical location, including information allowing the unique identification of this small-scale project activity(ies): >> The project is located at Marlanhalli Village, Gangavathi Taluk, Koppal District of Karnataka. The plant is well accessible by road and rail. The nearest railhead is at Koppal, at a distance of 80 kms from the project location. The nearest seaport is at Panaji at a distance of 350 kms.
CDM-SSC-PDD (version 02) CDM – Executive Board page 6
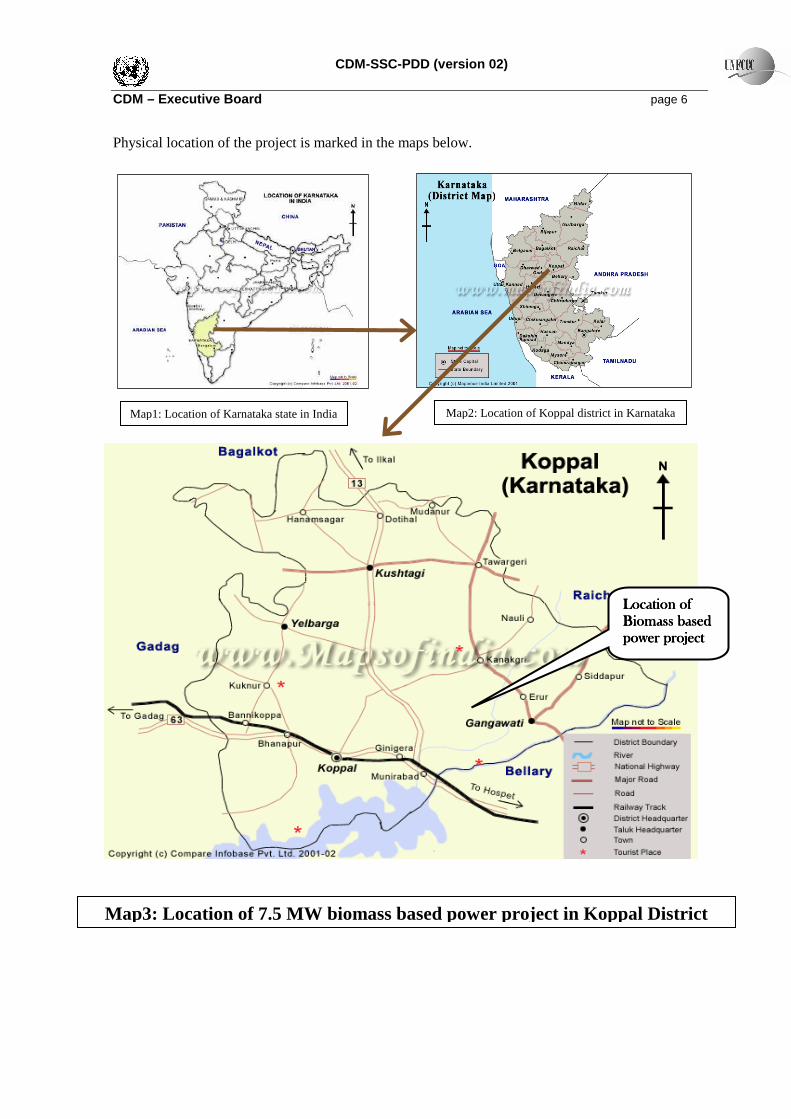
Map1: Location of Karnataka state in India Map2: Location of Koppal district in Karnataka
Map3: Location of 7.5 MW biomass based power project in Koppal District
Location of Location of Location of Location of
Biomass based Biomass based Biomass based Biomass based
power projectpower projectpower projectpower project
Physical location of the project is marked in the maps below.
CDM-SSC-PDD (version 02) CDM – Executive Board page 7
A.4.2. Type and category(ies) and technology of the small-scale project activity : >> According to Appendix B to the simplified modalities and procedures for small-scale CDM project activities the project activity falls under Type I, Renewable energy projects since the project activity utilising renewable biomass as the main energy source for electricity generation. Since, the generated electricity is being exported to the regional grid system, the applicable category is I.D., Renewable electricity generation for a grid. Accordingly, the applicable methodology for the project activity shall be AMS I.D., Version 10, dated 23rd December 2006, which includes renewable biomass for electricity generation for a grid system. Since, the capacity of the CDM project is only 7.5 MW, which is well below the qualifying capacity of 15 MW, the project activity is a small scale CDM project activity and UNFCCC indicative simplified modalities and procedures can be applied. Since, the maximum electricity generating capacity is limited by the design of the plant and machinery and by the license issued by the state authorities, there is no possibility of exceeding the limits of small-scale CDM project activities during the crediting period and the project activity will remain as a small scale project activity. Technical details of the project activity The project is designed to generate electricity for grid system using multi-fuels. The basic technology is Rankine cycle route where direct combustion of biomass materials takes place through the multi-fuel fired boiler to generate high pressure and high temperature steam, which drives an impulse turbine generator set. No technology transfer is envisaged for the proposed CDM project activity. The plant and machinery of the project consists of one number traveling grate boiler, one number steam turbine generator set, power evacuation system and fuel handling system etc. The electricity voltage level generated by the turbo generator is stepped up to the voltage that is suitable to interface with the grid electricity. Other plant equipment includes fuel conveyors, electrostatic precipitator, power evacuation facilities, water treatment plant, cooling tower, compressed air plant etc. The capacity of the turbo generator is 7.5 MW, which generates electricity at 11 kV. Average annual estimate of power export to the grid system is around 45.19 GWh. Technical specifications of the some of the important items of plant and machinery: Boiler Type : Travelling Grate, Bi-drum, natural circulation, water tube Boiler capacity (100 % load) : 27 tons / hour Steam pressure at super heater outlet : 65 ata Steam temperature at super heater outlet: 485oC Turbo generator Type : Condensing, impulse type with one bleed-off Steam pressure at the TG inlet : 62 ata Steam temperature at the TG inlet : 480oC
CDM-SSC-PDD (version 02) CDM – Executive Board page 8 Steam inlet quantity : 26 tons/hour Generator Voltage : 11 kV Frequency : 50 Hz Power factor : 0.8 RPM : 3000 Condenser type : Surface condenser / Water cooled Water Water requirement : 50 m3 / hour Power evacuation Grid Voltage : 110 kV KEB substation : Gangavathi 110 / 33 kV (1.5 kms from plant)
Auxiliaries
Fuel handling : Series of belt conveyors Chimney : 84 mts, RCC Demineralization plant capacity : 2 m3 / hour
Ash handling Bottom Ash : Submerged conveyor Fly ash : Screw feeder
Cooling tower Type : Induced draft, RCC Capacity : 1600 m3 / hour
Air compressor Capacity : 50 NM3 / hour Type : Reciprocating, Non-lubricated
Energy info (Annual Average) Gross generation (for optimum year) : 50.49 GWh In-house auxiliary consumption @ 10.5% : 5.30 GWh Net generation supplied to grid (optimum): 45.19 GWh The actual specifications of the equipment would depend on the detailed engineering of the plant. A.4.3. Brief explanation of how the anthropogenic emissions of anthropogenic greenhouse gas (GHGs) by sources are to be reduced by the proposed small-scale project activity , including why the emission reductions would not occur in the absence of the proposed small-scale project activity , taking into account national and/or sectoral policies and circumstances: >> Project activity and baseline scenario The project activity is a 7.5 MW biomass based power plant , which has commenced its operations in July 2005. The project activity is supplying the generated power to the southern grid of India, leading to the displacement of Carbon intensive electricity by power generation from a renewable energy source.
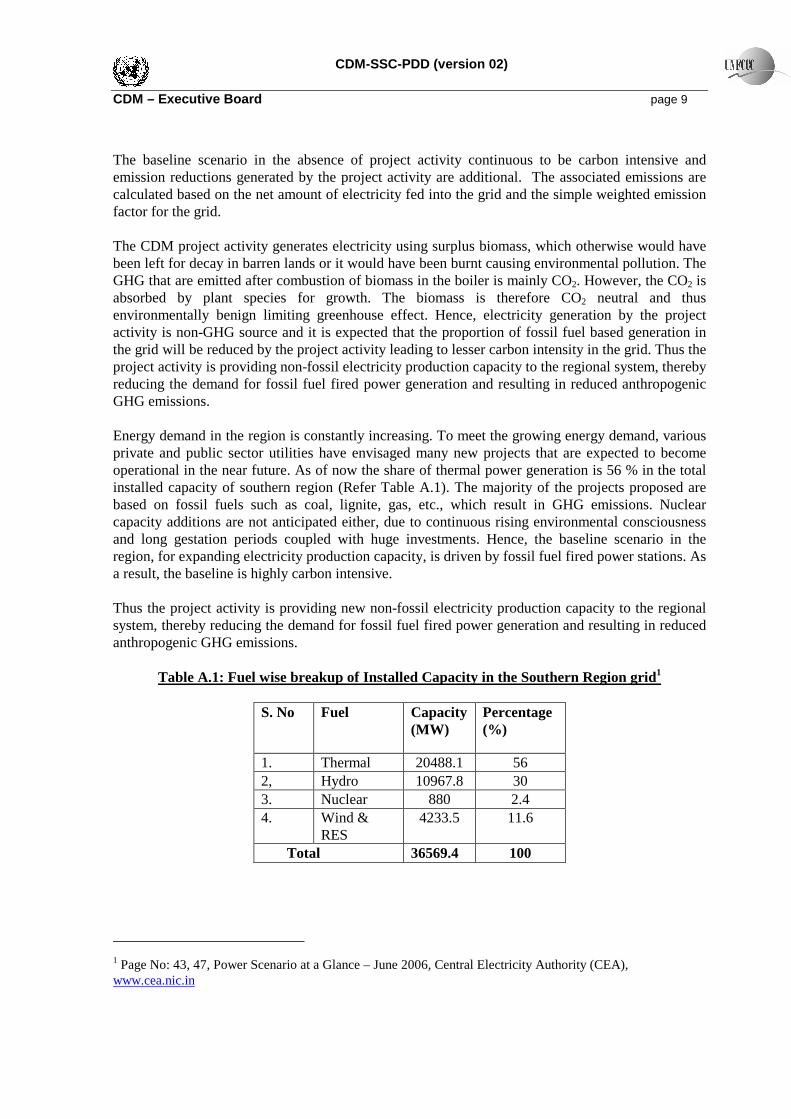
CDM-SSC-PDD (version 02) CDM – Executive Board page 9 The baseline scenario in the absence of project activity continuous to be carbon intensive and emission reductions generated by the project activity are additional. The associated emissions are calculated based on the net amount of electricity fed into the grid and the simple weighted emission factor for the grid. The CDM project activity generates electricity using surplus biomass, which otherwise would have been left for decay in barren lands or it would have been burnt causing environmental pollution. The GHG that are emitted after combustion of biomass in the boiler is mainly CO2. However, the CO2 is absorbed by plant species for growth. The biomass is therefore CO2 neutral and thus environmentally benign limiting greenhouse effect. Hence, electricity generation by the project activity is non-GHG source and it is expected that the proportion of fossil fuel based generation in the grid will be reduced by the project activity leading to lesser carbon intensity in the grid. Thus the project activity is providing non-fossil electricity production capacity to the regional system, thereby reducing the demand for fossil fuel fired power generation and resulting in reduced anthropogenic GHG emissions. Energy demand in the region is constantly increasing. To meet the growing energy demand, various private and public sector utilities have envisaged many new projects that are expected to become operational in the near future. As of now the share of thermal power generation is 56 % in the total installed capacity of southern region (Refer Table A.1). The majority of the projects proposed are based on fossil fuels such as coal, lignite, gas, etc., which result in GHG emissions. Nuclear capacity additions are not anticipated either, due to continuous rising environmental consciousness and long gestation periods coupled with huge investments. Hence, the baseline scenario in the region, for expanding electricity production capacity, is driven by fossil fuel fired power stations. As a result, the baseline is highly carbon intensive. Thus the project activity is providing new non-fossil electricity production capacity to the regional system, thereby reducing the demand for fossil fuel fired power generation and resulting in reduced anthropogenic GHG emissions.
Table A.1: Fuel wise breakup of Installed Capacity in the Southern Region grid1
S. No Fuel Capacity (MW)
Percentage (%)
1. Thermal 20488.1 56 2, Hydro 10967.8 30 3. Nuclear 880 2.4 4. Wind &
RES 4233.5 11.6
Total 36569.4 100
1 Page No: 43, 47, Power Scenario at a Glance – June 2006, Central Electricity Authority (CEA), www.cea.nic.in
CDM-SSC-PDD (version 02) CDM – Executive Board page 10 Additionality The project activity is not the baseline scenario and the emission reductions would therefore not occur in the absence of the project activity. The project activity is not required by law, and the national and state policies in place are not sufficient to make the project commercially viable on its own. The project faces barriers, which in the absence of CDM would be prohibitive. These barriers include: Investment Barriers Prevailing Practice – One of the first few biomass plants initiated in the state of Karnataka Technological barrier – Difficulties in handling different types and characteristics of biomass material to use in the boiler. Other barriers – Uncertain Tariff policies, barriers related to fluctuations in biomass price, handling and storage.
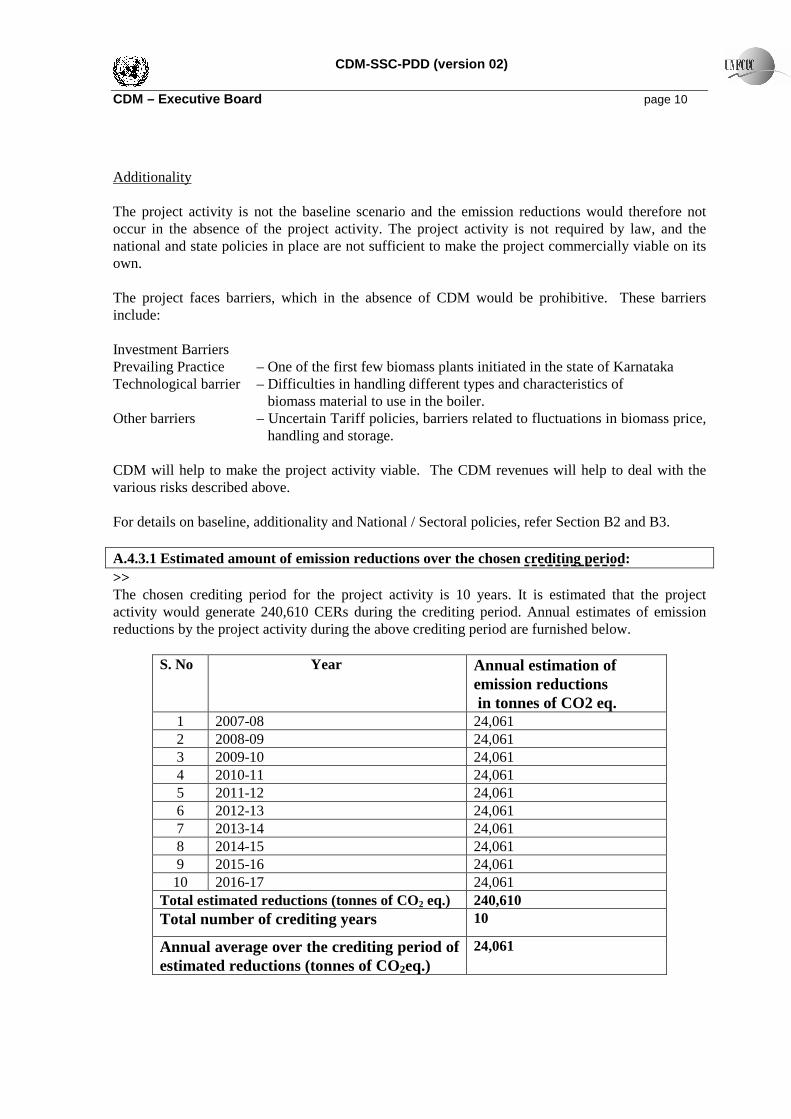
CDM will help to make the project activity viable. The CDM revenues will help to deal with the various risks described above. For details on baseline, additionality and National / Sectoral policies, refer Section B2 and B3. A.4.3.1 Estimated amount of emission reductions over the chosen crediting period: >> The chosen crediting period for the project activity is 10 years. It is estimated that the project activity would generate 240,610 CERs during the crediting period. Annual estimates of emission reductions by the project activity during the above crediting period are furnished below.
S. No Year Annual estimation of emission reductions in tonnes of CO2 eq.
1 2007-08 24,061 2 2008-09 24,061 3 2009-10 24,061 4 2010-11 24,061 5 2011-12 24,061 6 2012-13 24,061 7 2013-14 24,061 8 2014-15 24,061 9 2015-16 24,061 10 2016-17 24,061
Total estimated reductions (tonnes of CO2 eq.) 240,610 Total number of crediting years 10
Annual average over the crediting period of estimated reductions (tonnes of CO2eq.)
24,061
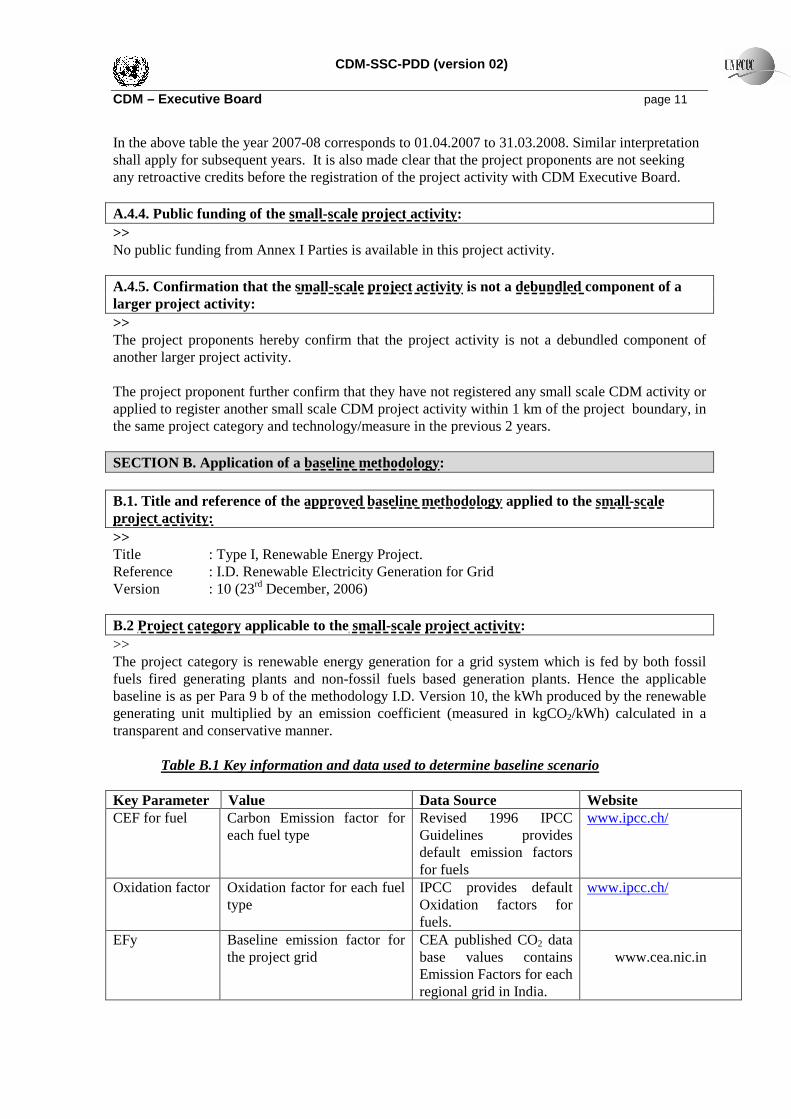
CDM-SSC-PDD (version 02) CDM – Executive Board page 11 In the above table the year 2007-08 corresponds to 01.04.2007 to 31.03.2008. Similar interpretation shall apply for subsequent years. It is also made clear that the project proponents are not seeking any retroactive credits before the registration of the project activity with CDM Executive Board. A.4.4. Public funding of the small-scale project activity : >> No public funding from Annex I Parties is available in this project activity. A.4.5. Confirmation that the small-scale project activity is not a debundled component of a larger project activity: >> The project proponents hereby confirm that the project activity is not a debundled component of another larger project activity. The project proponent further confirm that they have not registered any small scale CDM activity or applied to register another small scale CDM project activity within 1 km of the project boundary, in the same project category and technology/measure in the previous 2 years. SECTION B. Application of a baseline methodology: B.1. Title and reference of the approved baseline methodology applied to the small-scale project activity: >> Title : Type I, Renewable Energy Project. Reference : I.D. Renewable Electricity Generation for Grid Version : 10 (23rd December, 2006) B.2 Project category applicable to the small-scale project activity : >> The project category is renewable energy generation for a grid system which is fed by both fossil fuels fired generating plants and non-fossil fuels based generation plants. Hence the applicable baseline is as per Para 9 b of the methodology I.D. Version 10, the kWh produced by the renewable generating unit multiplied by an emission coefficient (measured in kgCO2/kWh) calculated in a transparent and conservative manner.
Table B.1 Key information and data used to determine baseline scenario Key Parameter Value Data Source Website CEF for fuel Carbon Emission factor for
each fuel type Revised 1996 IPCC Guidelines provides default emission factors for fuels
www.ipcc.ch/
Oxidation factor Oxidation factor for each fuel type
IPCC provides default Oxidation factors for fuels.
www.ipcc.ch/
EFy Baseline emission factor for the project grid
CEA published CO2 data base values contains Emission Factors for each regional grid in India.
www.cea.nic.in
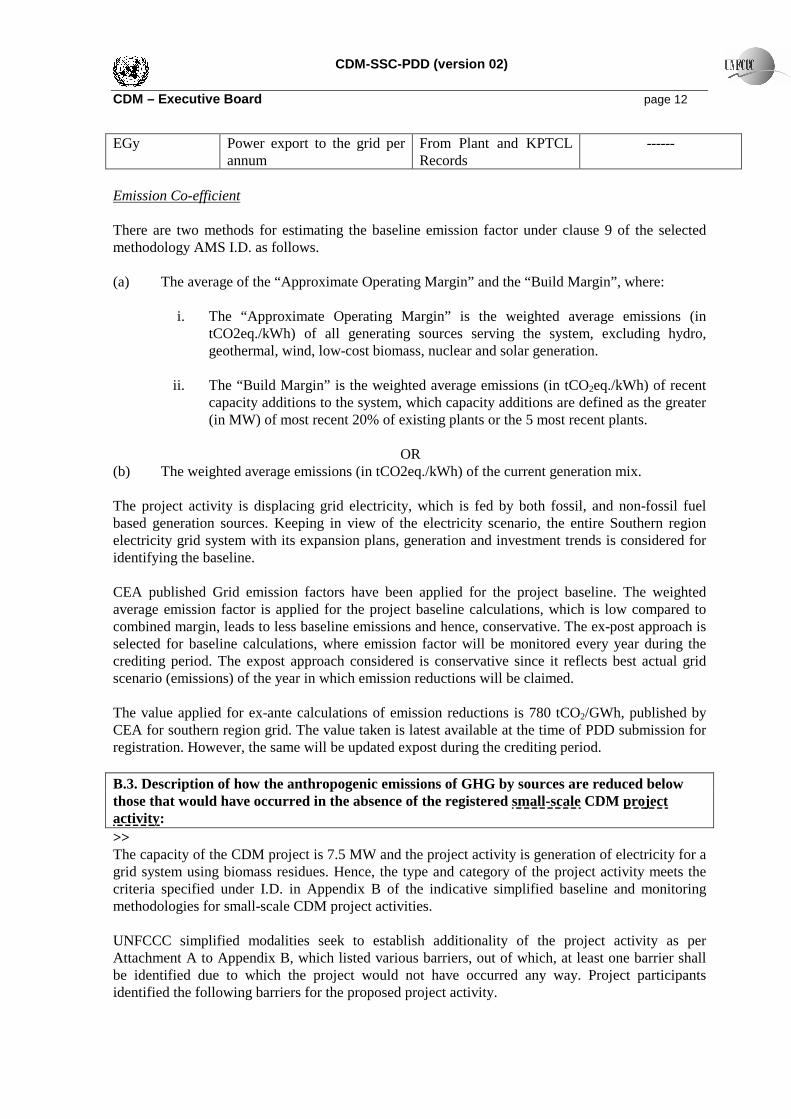
CDM-SSC-PDD (version 02) CDM – Executive Board page 12 EGy Power export to the grid per
annum From Plant and KPTCL Records
------
Emission Co-efficient There are two methods for estimating the baseline emission factor under clause 9 of the selected methodology AMS I.D. as follows. (a) The average of the “Approximate Operating Margin” and the “Build Margin”, where:
i. The “Approximate Operating Margin” is the weighted average emissions (in tCO2eq./kWh) of all generating sources serving the system, excluding hydro, geothermal, wind, low-cost biomass, nuclear and solar generation.
ii. The “Build Margin” is the weighted average emissions (in tCO2eq./kWh) of recent
capacity additions to the system, which capacity additions are defined as the greater (in MW) of most recent 20% of existing plants or the 5 most recent plants.
OR (b) The weighted average emissions (in tCO2eq./kWh) of the current generation mix. The project activity is displacing grid electricity, which is fed by both fossil, and non-fossil fuel based generation sources. Keeping in view of the electricity scenario, the entire Southern region electricity grid system with its expansion plans, generation and investment trends is considered for identifying the baseline. CEA published Grid emission factors have been applied for the project baseline. The weighted average emission factor is applied for the project baseline calculations, which is low compared to combined margin, leads to less baseline emissions and hence, conservative. The ex-post approach is selected for baseline calculations, where emission factor will be monitored every year during the crediting period. The expost approach considered is conservative since it reflects best actual grid scenario (emissions) of the year in which emission reductions will be claimed. The value applied for ex-ante calculations of emission reductions is 780 tCO2/GWh, published by CEA for southern region grid. The value taken is latest available at the time of PDD submission for registration. However, the same will be updated expost during the crediting period. B.3. Description of how the anthropogenic emissions of GHG by sources are reduced below those that would have occurred in the absence of the registered small-scale CDM project activity : >> The capacity of the CDM project is 7.5 MW and the project activity is generation of electricity for a grid system using biomass residues. Hence, the type and category of the project activity meets the criteria specified under I.D. in Appendix B of the indicative simplified baseline and monitoring methodologies for small-scale CDM project activities. UNFCCC simplified modalities seek to establish additionality of the project activity as per Attachment A to Appendix B, which listed various barriers, out of which, at least one barrier shall be identified due to which the project would not have occurred any way. Project participants identified the following barriers for the proposed project activity.
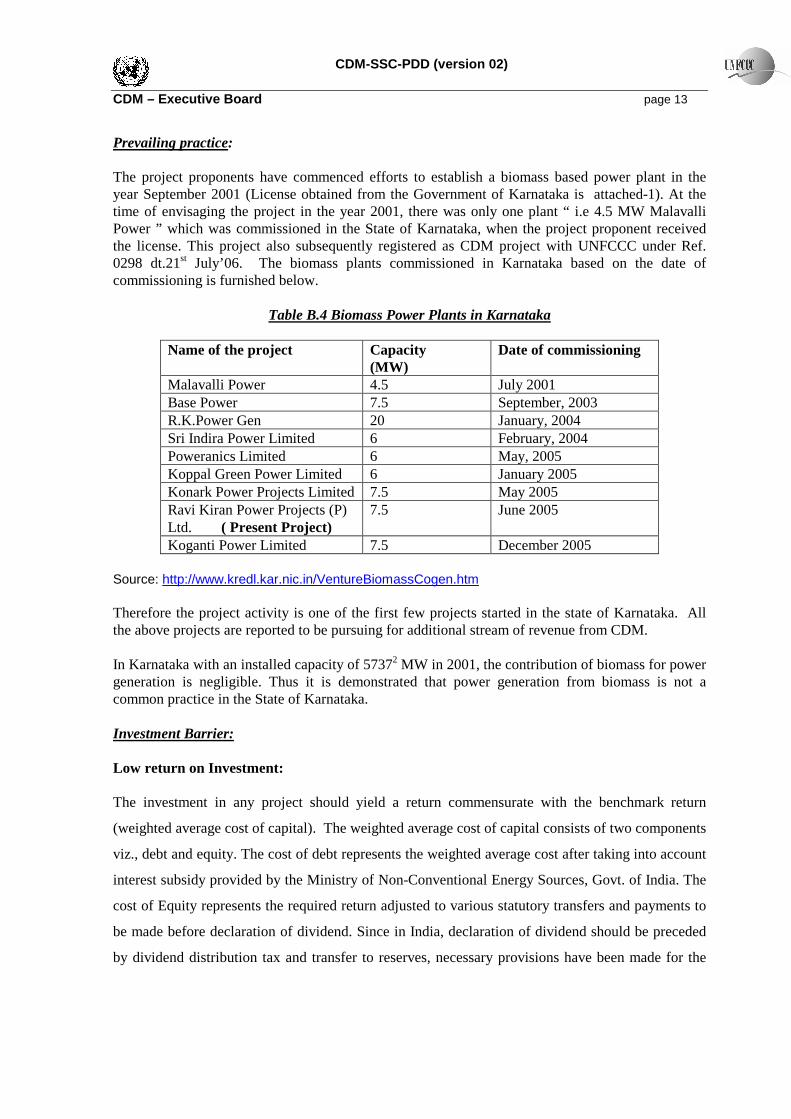
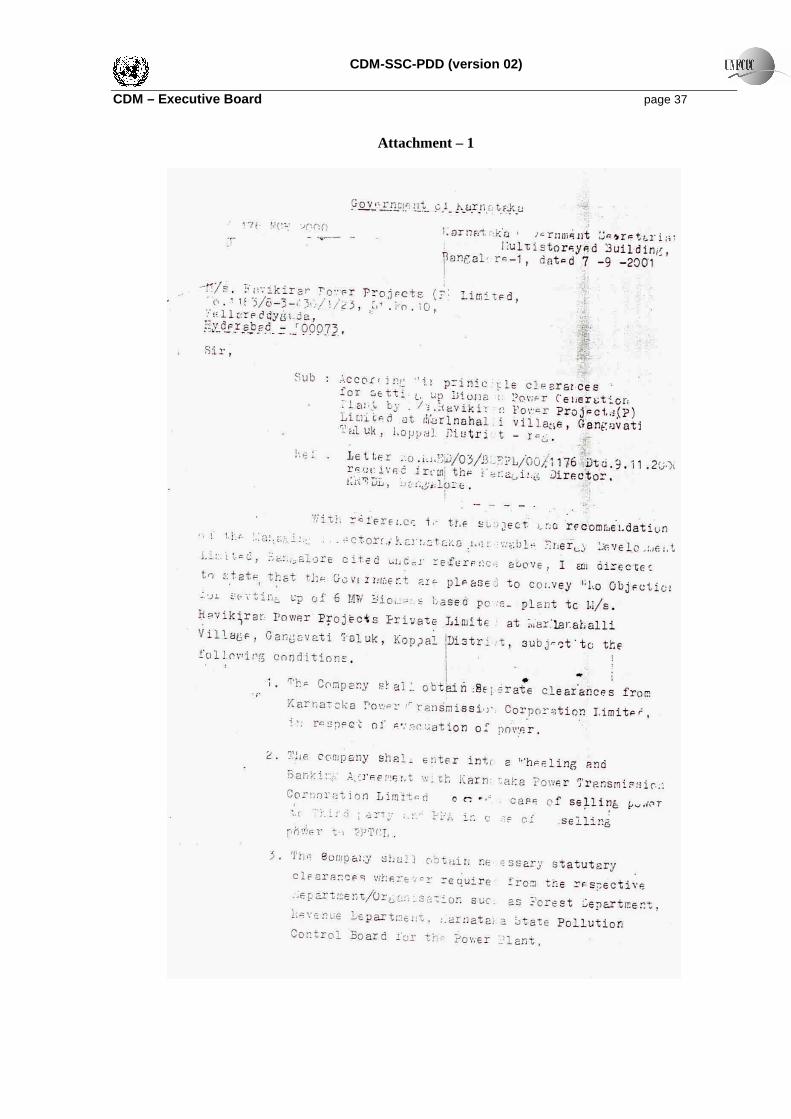
CDM-SSC-PDD (version 02) CDM – Executive Board page 13 Prevailing practice: The project proponents have commenced efforts to establish a biomass based power plant in the year September 2001 (License obtained from the Government of Karnataka is attached-1). At the time of envisaging the project in the year 2001, there was only one plant “ i.e 4.5 MW Malavalli Power ” which was commissioned in the State of Karnataka, when the project proponent received the license. This project also subsequently registered as CDM project with UNFCCC under Ref. 0298 dt.21st July’06. The biomass plants commissioned in Karnataka based on the date of commissioning is furnished below.
Table B.4 Biomass Power Plants in Karnataka
Name of the project Capacity (MW)
Date of commissioning
Malavalli Power 4.5 July 2001 Base Power 7.5 September, 2003 R.K.Power Gen 20 January, 2004 Sri Indira Power Limited 6 February, 2004 Poweranics Limited 6 May, 2005 Koppal Green Power Limited 6 January 2005 Konark Power Projects Limited 7.5 May 2005 Ravi Kiran Power Projects (P) Ltd. ( Present Project)
7.5 June 2005
Koganti Power Limited 7.5 December 2005 Source: http://www.kredl.kar.nic.in/VentureBiomassCogen.htm Therefore the project activity is one of the first few projects started in the state of Karnataka. All the above projects are reported to be pursuing for additional stream of revenue from CDM. In Karnataka with an installed capacity of 57372 MW in 2001, the contribution of biomass for power generation is negligible. Thus it is demonstrated that power generation from biomass is not a common practice in the State of Karnataka. Investment Barrier: Low return on Investment: The investment in any project should yield a return commensurate with the benchmark return
(weighted average cost of capital). The weighted average cost of capital consists of two components
viz., debt and equity. The cost of debt represents the weighted average cost after taking into account
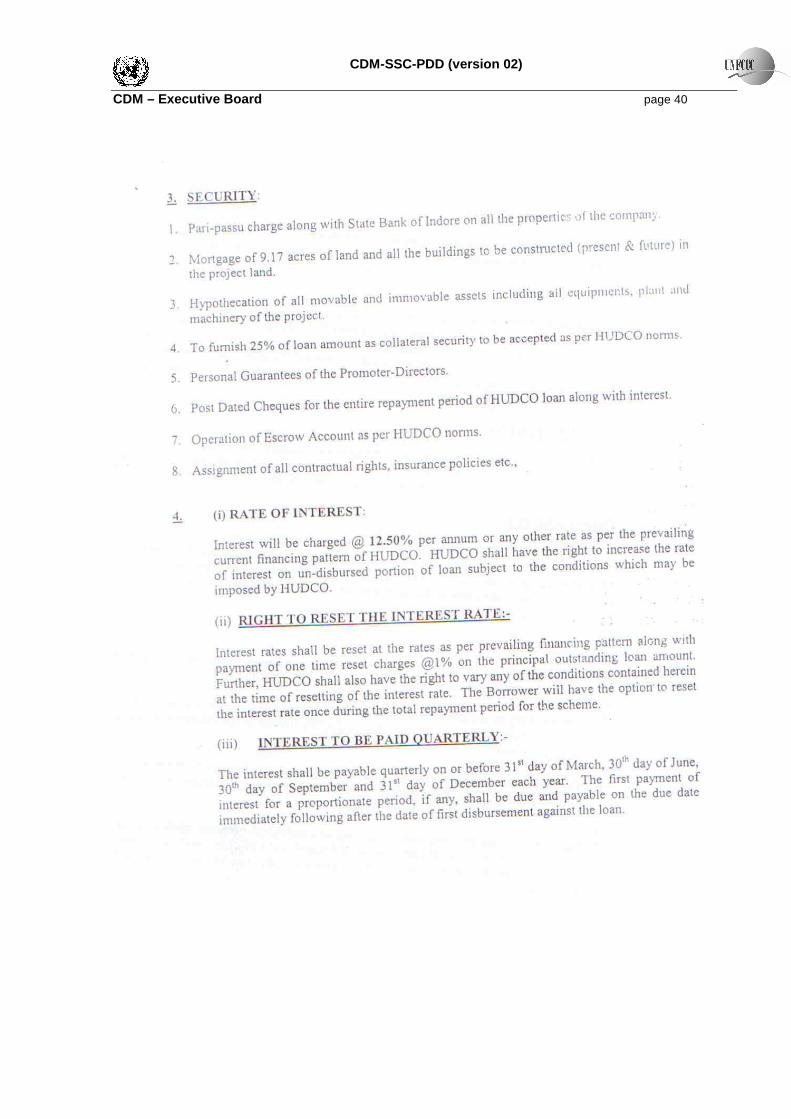
interest subsidy provided by the Ministry of Non-Conventional Energy Sources, Govt. of India. The
cost of Equity represents the required return adjusted to various statutory transfers and payments to
be made before declaration of dividend. Since in India, declaration of dividend should be preceded
by dividend distribution tax and transfer to reserves, necessary provisions have been made for the
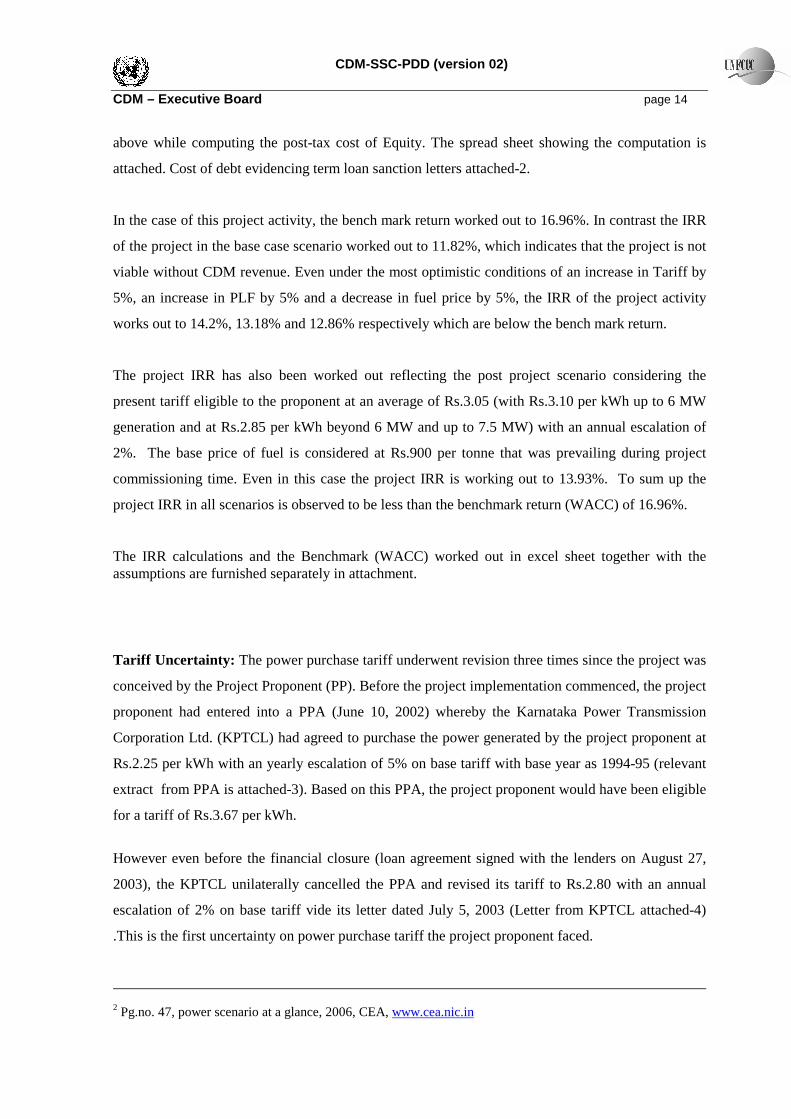
CDM-SSC-PDD (version 02) CDM – Executive Board page 14 above while computing the post-tax cost of Equity. The spread sheet showing the computation is
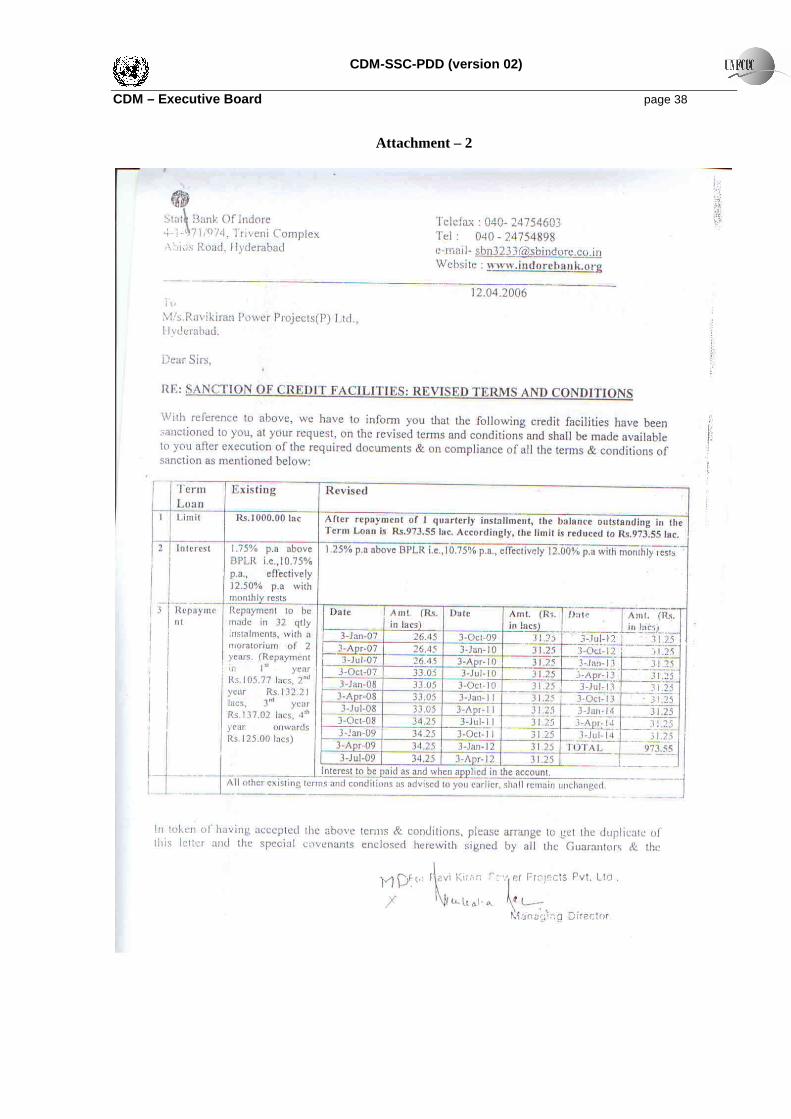
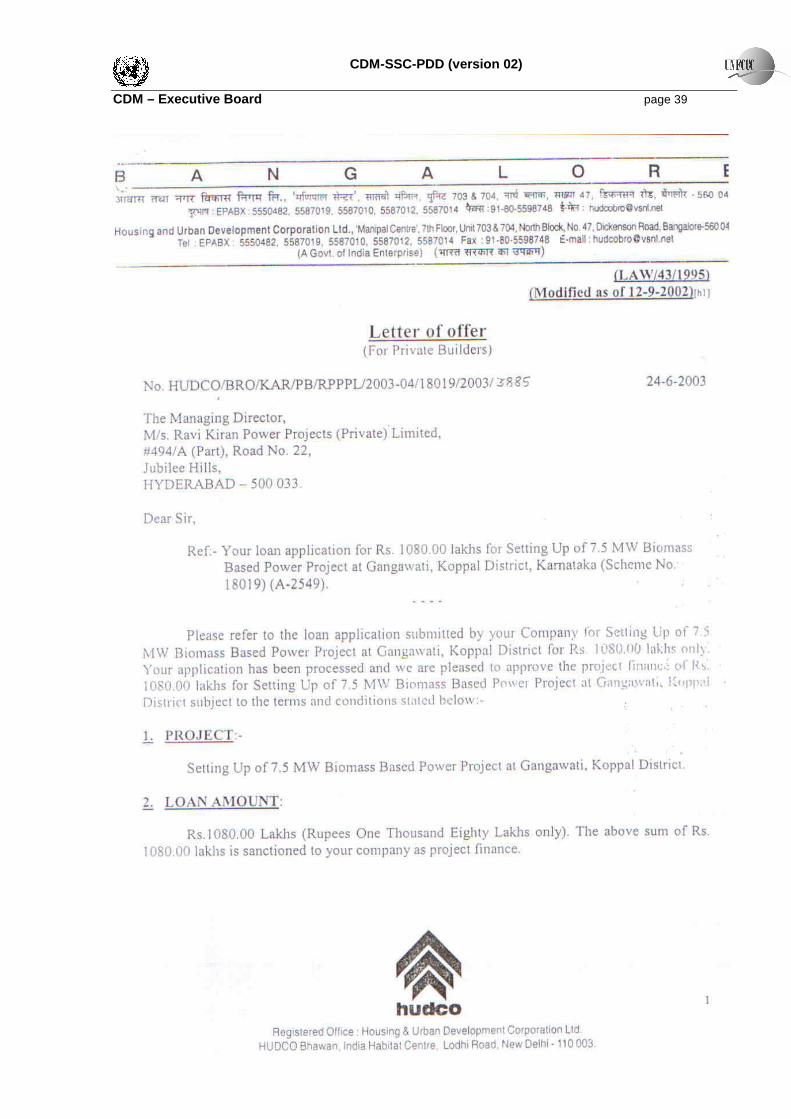
attached. Cost of debt evidencing term loan sanction letters attached-2.
In the case of this project activity, the bench mark return worked out to 16.96%. In contrast the IRR
of the project in the base case scenario worked out to 11.82%, which indicates that the project is not
viable without CDM revenue. Even under the most optimistic conditions of an increase in Tariff by
5%, an increase in PLF by 5% and a decrease in fuel price by 5%, the IRR of the project activity
works out to 14.2%, 13.18% and 12.86% respectively which are below the bench mark return.
The project IRR has also been worked out reflecting the post project scenario considering the
present tariff eligible to the proponent at an average of Rs.3.05 (with Rs.3.10 per kWh up to 6 MW
generation and at Rs.2.85 per kWh beyond 6 MW and up to 7.5 MW) with an annual escalation of
2%. The base price of fuel is considered at Rs.900 per tonne that was prevailing during project
commissioning time. Even in this case the project IRR is working out to 13.93%. To sum up the
project IRR in all scenarios is observed to be less than the benchmark return (WACC) of 16.96%.
The IRR calculations and the Benchmark (WACC) worked out in excel sheet together with the assumptions are furnished separately in attachment. Tariff Uncertainty: The power purchase tariff underwent revision three times since the project was
conceived by the Project Proponent (PP). Before the project implementation commenced, the project
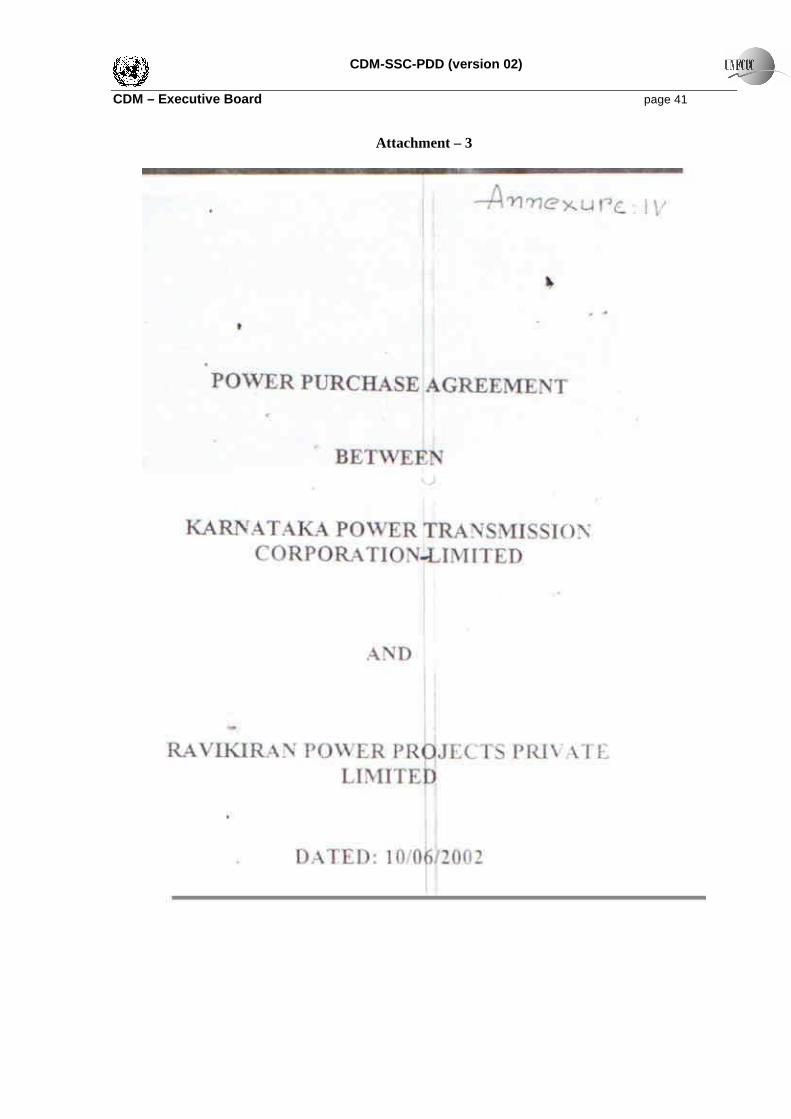
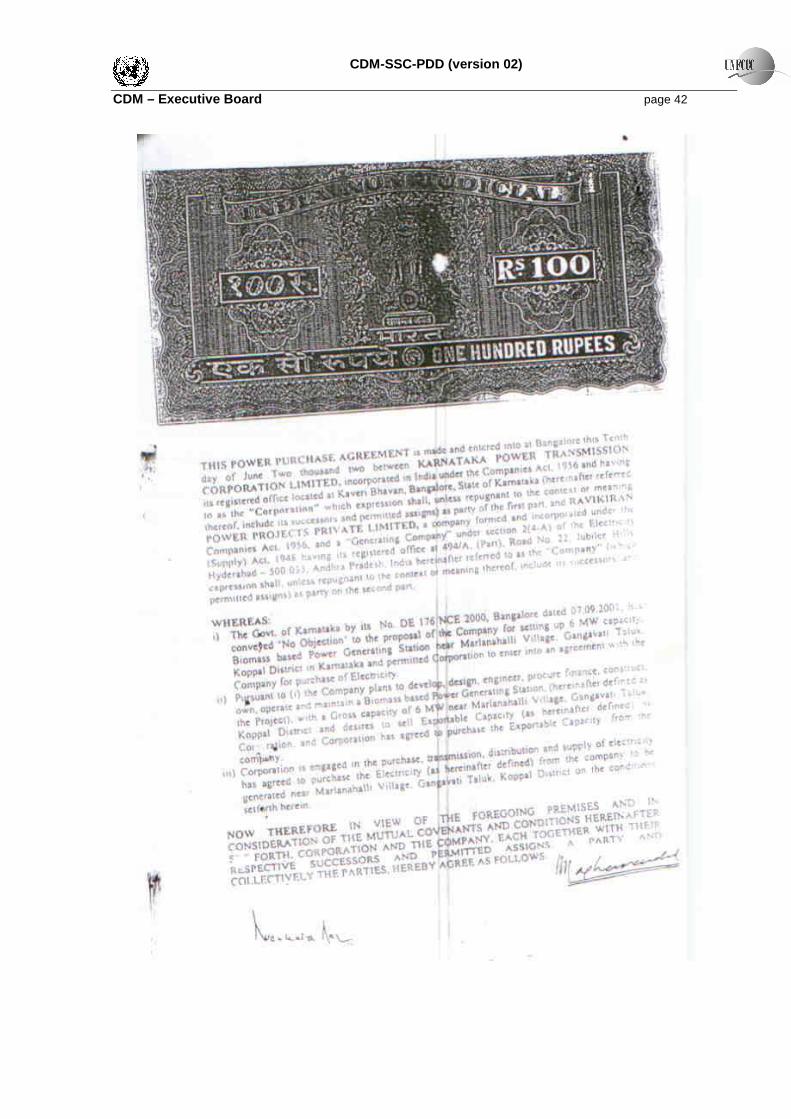
proponent had entered into a PPA (June 10, 2002) whereby the Karnataka Power Transmission
Corporation Ltd. (KPTCL) had agreed to purchase the power generated by the project proponent at
Rs.2.25 per kWh with an yearly escalation of 5% on base tariff with base year as 1994-95 (relevant
extract from PPA is attached-3). Based on this PPA, the project proponent would have been eligible
for a tariff of Rs.3.67 per kWh.
However even before the financial closure (loan agreement signed with the lenders on August 27,
2003), the KPTCL unilaterally cancelled the PPA and revised its tariff to Rs.2.80 with an annual
escalation of 2% on base tariff vide its letter dated July 5, 2003 (Letter from KPTCL attached-4)
.This is the first uncertainty on power purchase tariff the project proponent faced.
2 Pg.no. 47, power scenario at a glance, 2006, CEA, www.cea.nic.in
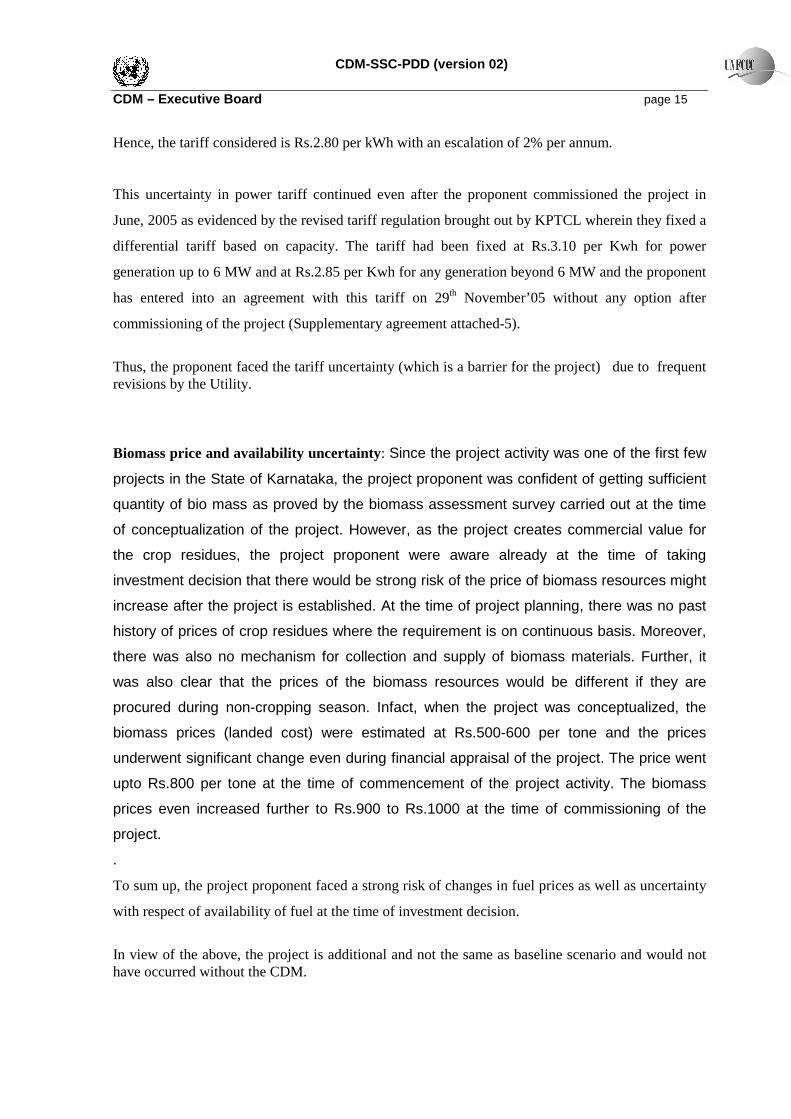
CDM-SSC-PDD (version 02) CDM – Executive Board page 15 Hence, the tariff considered is Rs.2.80 per kWh with an escalation of 2% per annum.
This uncertainty in power tariff continued even after the proponent commissioned the project in
June, 2005 as evidenced by the revised tariff regulation brought out by KPTCL wherein they fixed a
differential tariff based on capacity. The tariff had been fixed at Rs.3.10 per Kwh for power
generation up to 6 MW and at Rs.2.85 per Kwh for any generation beyond 6 MW and the proponent
has entered into an agreement with this tariff on 29th November’05 without any option after
commissioning of the project (Supplementary agreement attached-5).
Thus, the proponent faced the tariff uncertainty (which is a barrier for the project) due to frequent revisions by the Utility. Biomass price and availability uncertainty: Since the project activity was one of the first few
projects in the State of Karnataka, the project proponent was confident of getting sufficient
quantity of bio mass as proved by the biomass assessment survey carried out at the time
of conceptualization of the project. However, as the project creates commercial value for
the crop residues, the project proponent were aware already at the time of taking
investment decision that there would be strong risk of the price of biomass resources might
increase after the project is established. At the time of project planning, there was no past
history of prices of crop residues where the requirement is on continuous basis. Moreover,
there was also no mechanism for collection and supply of biomass materials. Further, it
was also clear that the prices of the biomass resources would be different if they are
procured during non-cropping season. Infact, when the project was conceptualized, the
biomass prices (landed cost) were estimated at Rs.500-600 per tone and the prices
underwent significant change even during financial appraisal of the project. The price went
upto Rs.800 per tone at the time of commencement of the project activity. The biomass
prices even increased further to Rs.900 to Rs.1000 at the time of commissioning of the
project.
.
To sum up, the project proponent faced a strong risk of changes in fuel prices as well as uncertainty
with respect of availability of fuel at the time of investment decision.
In view of the above, the project is additional and not the same as baseline scenario and would not have occurred without the CDM.
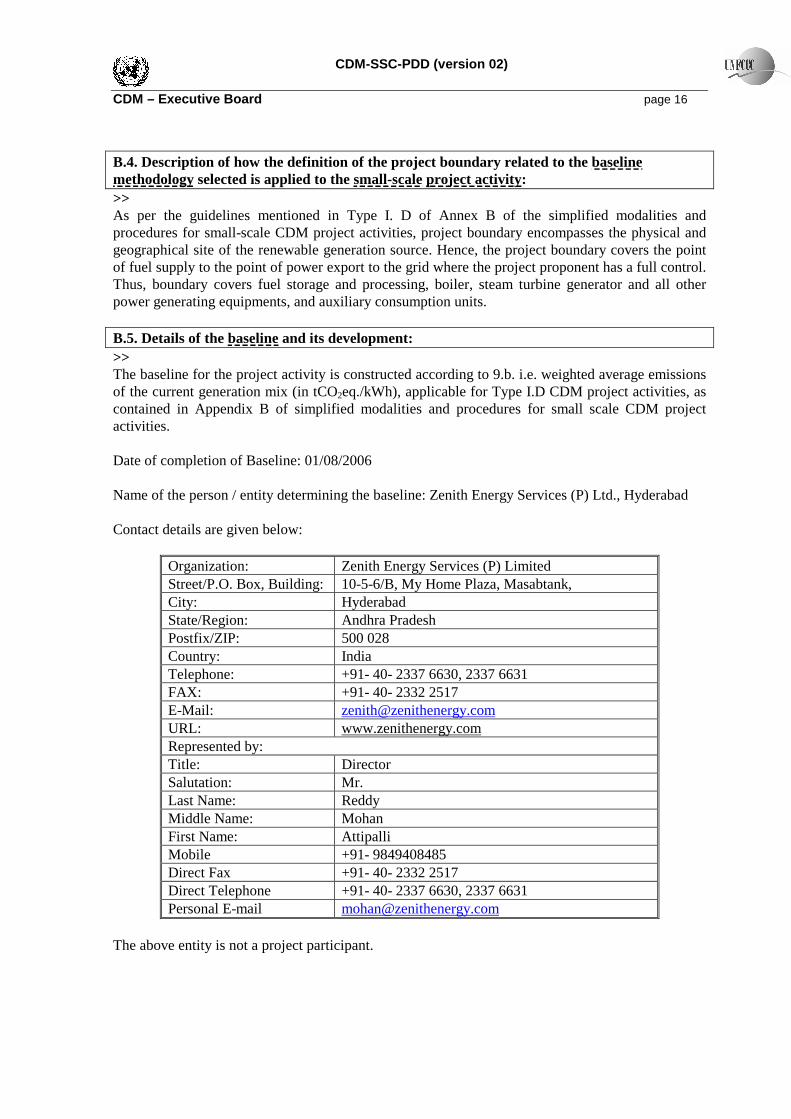
CDM-SSC-PDD (version 02) CDM – Executive Board page 16 B.4. Description of how the definition of the project boundary related to the baseline methodology selected is applied to the small-scale project activity : >> As per the guidelines mentioned in Type I. D of Annex B of the simplified modalities and procedures for small-scale CDM project activities, project boundary encompasses the physical and geographical site of the renewable generation source. Hence, the project boundary covers the point of fuel supply to the point of power export to the grid where the project proponent has a full control. Thus, boundary covers fuel storage and processing, boiler, steam turbine generator and all other power generating equipments, and auxiliary consumption units. B.5. Details of the baseline and its development: >> The baseline for the project activity is constructed according to 9.b. i.e. weighted average emissions of the current generation mix (in tCO2eq./kWh), applicable for Type I.D CDM project activities, as contained in Appendix B of simplified modalities and procedures for small scale CDM project activities. Date of completion of Baseline: 01/08/2006 Name of the person / entity determining the baseline: Zenith Energy Services (P) Ltd., Hyderabad Contact details are given below:
Organization: Zenith Energy Services (P) Limited Street/P.O. Box, Building: 10-5-6/B, My Home Plaza, Masabtank, City: Hyderabad State/Region: Andhra Pradesh Postfix/ZIP: 500 028 Country: India Telephone: +91- 40- 2337 6630, 2337 6631 FAX: +91- 40- 2332 2517 E-Mail: [email protected] URL: www.zenithenergy.com Represented by: Title: Director Salutation: Mr. Last Name: Reddy Middle Name: Mohan First Name: Attipalli Mobile +91- 9849408485 Direct Fax +91- 40- 2332 2517 Direct Telephone +91- 40- 2337 6630, 2337 6631 Personal E-mail [email protected]
The above entity is not a project participant.
CDM-SSC-PDD (version 02) CDM – Executive Board page 17
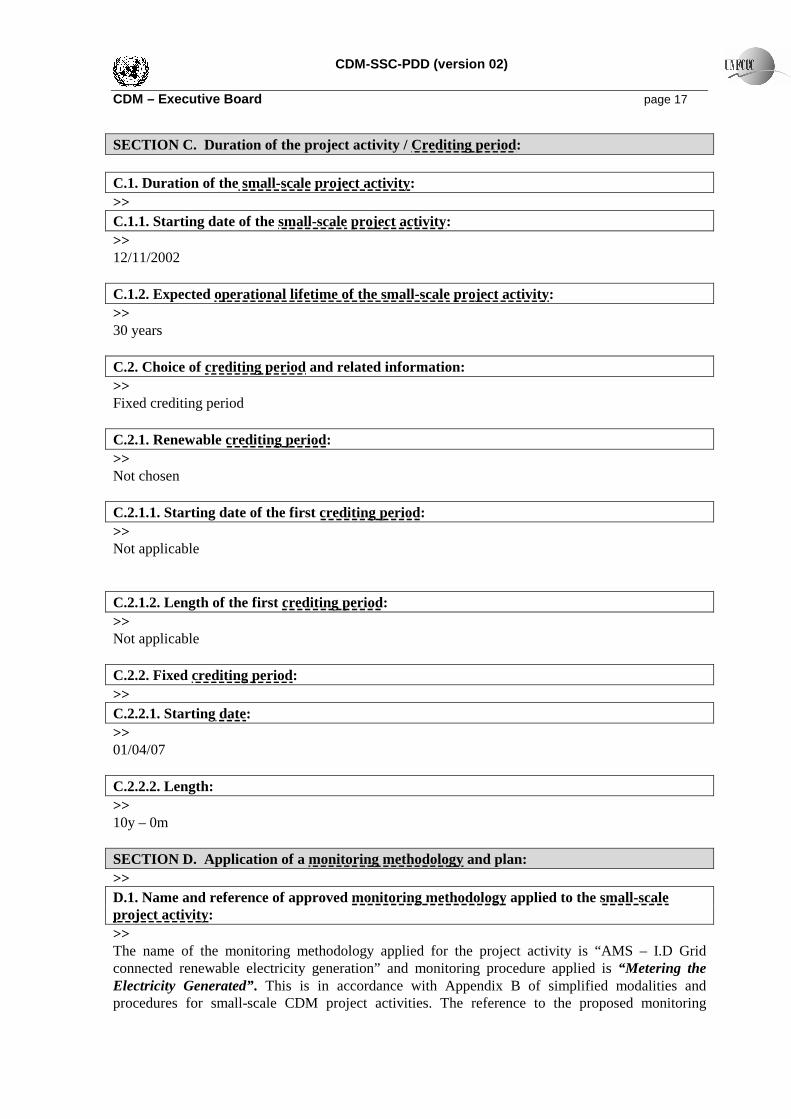
SECTION C. Duration of the project activity / Crediting period: C.1. Duration of the small-scale project activity : >> C.1.1. Starting date of the small-scale project activity : >> 12/11/2002 C.1.2. Expected operational lifetime of the small-scale project activity : >> 30 years C.2. Choice of crediting period and related information: >> Fixed crediting period C.2.1. Renewable crediting period: >> Not chosen C.2.1.1. Starting date of the first crediting period: >> Not applicable C.2.1.2. Length of the first crediting period: >> Not applicable C.2.2. Fixed crediting period: >> C.2.2.1. Starting date: >> 01/04/07 C.2.2.2. Length: >> 10y – 0m SECTION D. Application of a monitoring methodology and plan: >> D.1. Name and reference of approved monitoring methodology applied to the small-scale project activity : >> The name of the monitoring methodology applied for the project activity is “AMS – I.D Grid connected renewable electricity generation” and monitoring procedure applied is “Metering the Electricity Generated”. This is in accordance with Appendix B of simplified modalities and procedures for small-scale CDM project activities. The reference to the proposed monitoring
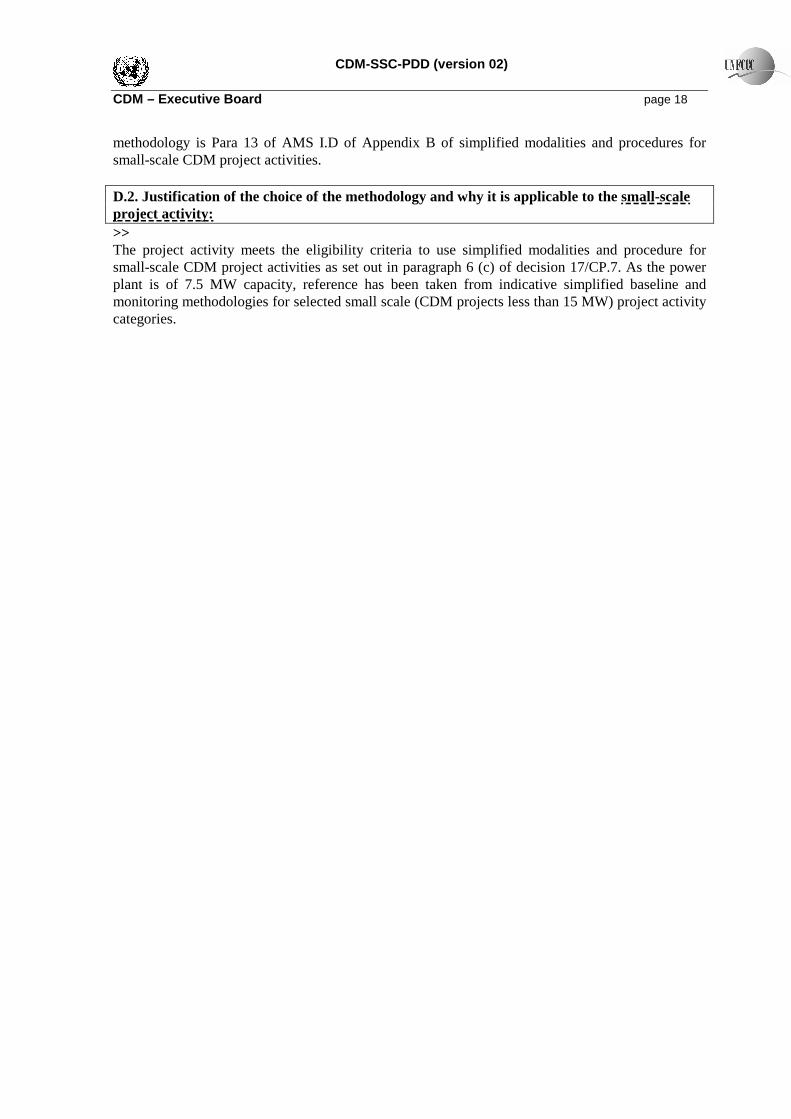
CDM-SSC-PDD (version 02) CDM – Executive Board page 18 methodology is Para 13 of AMS I.D of Appendix B of simplified modalities and procedures for small-scale CDM project activities. D.2. Justification of the choice of the methodology and why it is applicable to the small-scale project activity: >> The project activity meets the eligibility criteria to use simplified modalities and procedure for small-scale CDM project activities as set out in paragraph 6 (c) of decision 17/CP.7. As the power plant is of 7.5 MW capacity, reference has been taken from indicative simplified baseline and monitoring methodologies for selected small scale (CDM projects less than 15 MW) project activity categories.
CDM-SSC-PDD (version 02) CDM – Executive Board page 19
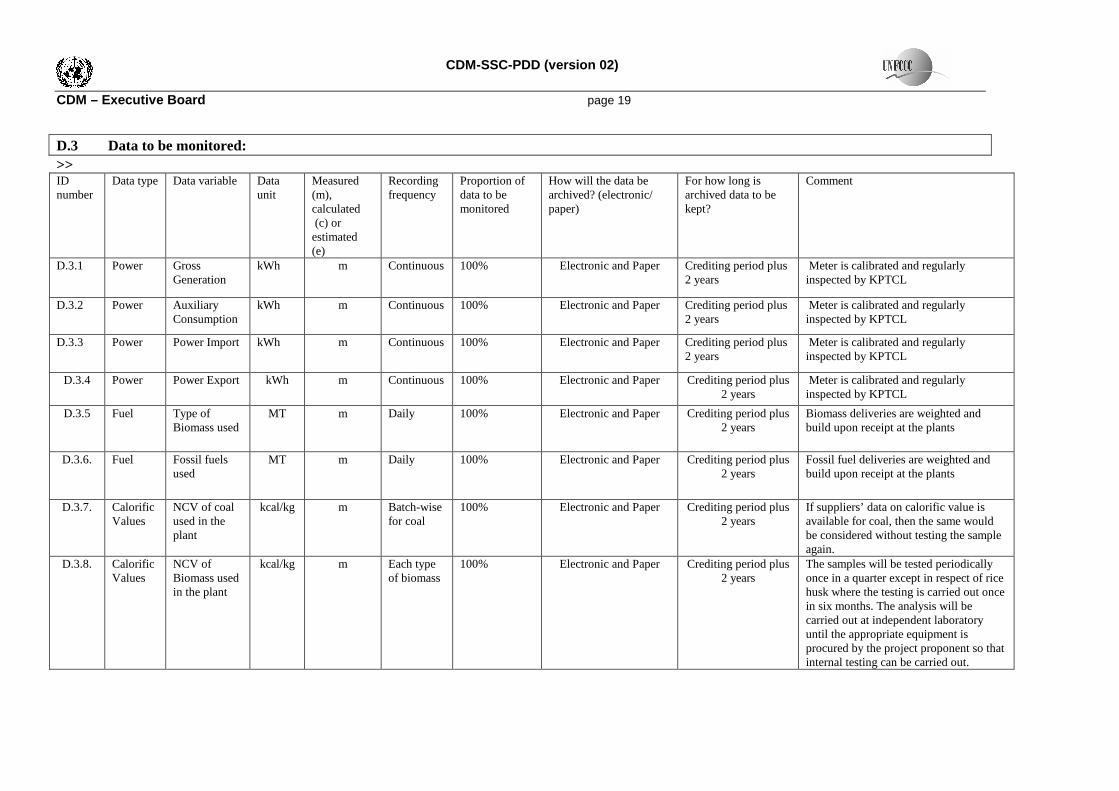
D.3 Data to be monitored: >> ID number
Data type Data variable Data unit
Measured (m), calculated (c) or estimated (e)
Recording frequency
Proportion of data to be monitored
How will the data be archived? (electronic/ paper)
For how long is archived data to be kept?
Comment
D.3.1 Power Gross Generation
kWh m Continuous 100% Electronic and Paper Crediting period plus 2 years
Meter is calibrated and regularly inspected by KPTCL
D.3.2 Power Auxiliary Consumption
kWh m Continuous 100% Electronic and Paper Crediting period plus 2 years
Meter is calibrated and regularly inspected by KPTCL
D.3.3 Power Power Import kWh m Continuous 100% Electronic and Paper Crediting period plus 2 years
Meter is calibrated and regularly inspected by KPTCL
D.3.4 Power Power Export kWh m Continuous 100% Electronic and Paper Crediting period plus 2 years
Meter is calibrated and regularly inspected by KPTCL
D.3.5 Fuel Type of Biomass used
MT m Daily 100% Electronic and Paper Crediting period plus 2 years
Biomass deliveries are weighted and build upon receipt at the plants
D.3.6. Fuel Fossil fuels used
MT m Daily 100% Electronic and Paper Crediting period plus 2 years
Fossil fuel deliveries are weighted and build upon receipt at the plants
D.3.7. Calorific Values
NCV of coal used in the plant
kcal/kg m Batch-wise for coal
100% Electronic and Paper Crediting period plus 2 years
If suppliers’ data on calorific value is available for coal, then the same would be considered without testing the sample again.
D.3.8. Calorific Values
NCV of Biomass used in the plant
kcal/kg m Each type of biomass
100% Electronic and Paper Crediting period plus 2 years
The samples will be tested periodically once in a quarter except in respect of rice husk where the testing is carried out once in six months. The analysis will be carried out at independent laboratory until the appropriate equipment is procured by the project proponent so that internal testing can be carried out.
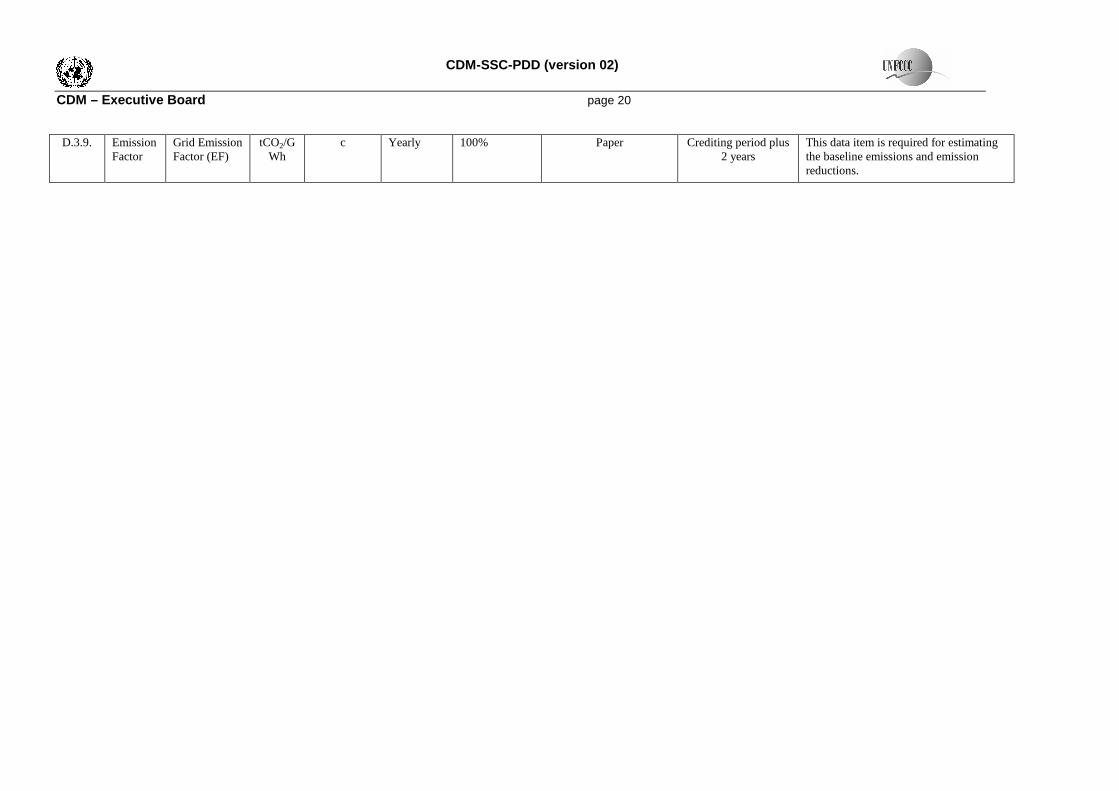
CDM-SSC-PDD (version 02) CDM – Executive Board page 20 D.3.9. Emission
Factor Grid Emission Factor (EF)
tCO2/GWh
c Yearly 100% Paper Crediting period plus 2 years
This data item is required for estimating the baseline emissions and emission reductions.
CDM-SSC-PDD (version 02) CDM – Executive Board page 21
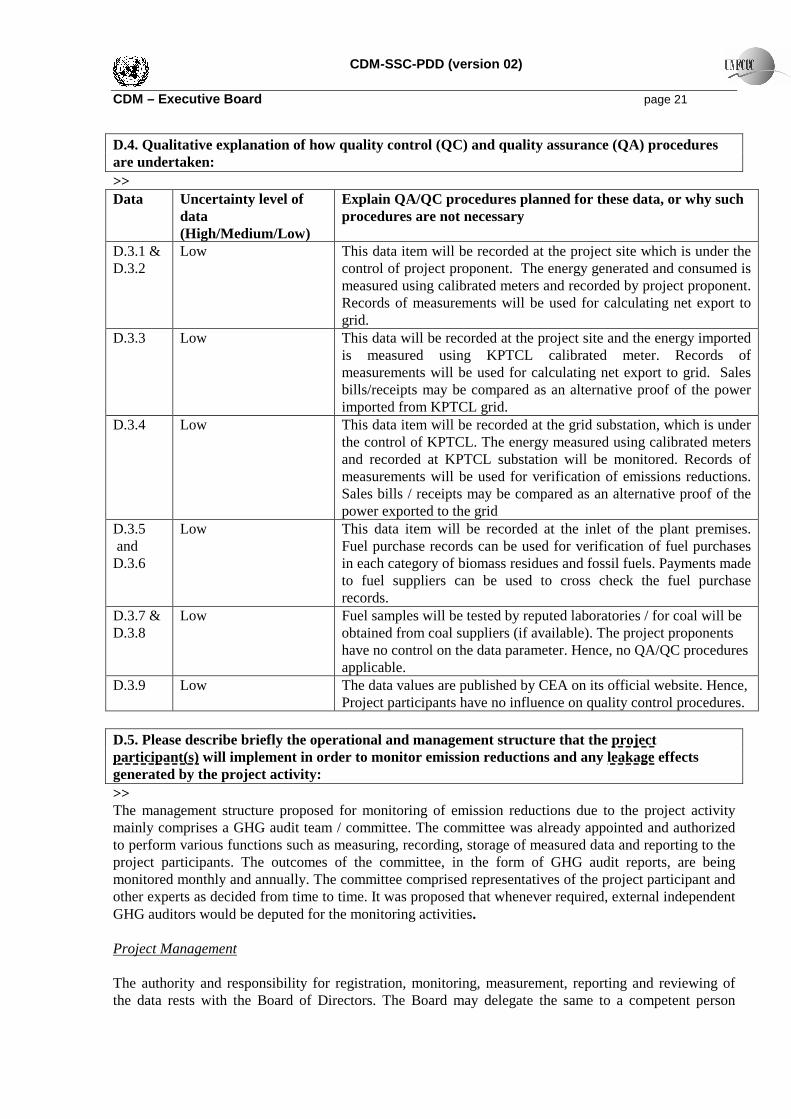
D.4. Qualitative explanation of how quality control (QC) and quality assurance (QA) procedures are undertaken: >> Data Uncertainty level of
data (High/Medium/Low)
Explain QA/QC procedures planned for these data, or why such procedures are not necessary
D.3.1 & D.3.2
Low This data item will be recorded at the project site which is under the control of project proponent. The energy generated and consumed is measured using calibrated meters and recorded by project proponent. Records of measurements will be used for calculating net export to grid.
D.3.3 Low This data will be recorded at the project site and the energy imported is measured using KPTCL calibrated meter. Records of measurements will be used for calculating net export to grid. Sales bills/receipts may be compared as an alternative proof of the power imported from KPTCL grid.
D.3.4 Low This data item will be recorded at the grid substation, which is under the control of KPTCL. The energy measured using calibrated meters and recorded at KPTCL substation will be monitored. Records of measurements will be used for verification of emissions reductions. Sales bills / receipts may be compared as an alternative proof of the power exported to the grid
D.3.5 and D.3.6
Low This data item will be recorded at the inlet of the plant premises. Fuel purchase records can be used for verification of fuel purchases in each category of biomass residues and fossil fuels. Payments made to fuel suppliers can be used to cross check the fuel purchase records.
D.3.7 & D.3.8
Low Fuel samples will be tested by reputed laboratories / for coal will be obtained from coal suppliers (if available). The project proponents have no control on the data parameter. Hence, no QA/QC procedures applicable.
D.3.9 Low The data values are published by CEA on its official website. Hence, Project participants have no influence on quality control procedures.
D.5. Please describe briefly the operational and management structure that the project participant(s) will implement in order to monitor emission reductions and any leakage effects generated by the project activity: >> The management structure proposed for monitoring of emission reductions due to the project activity mainly comprises a GHG audit team / committee. The committee was already appointed and authorized to perform various functions such as measuring, recording, storage of measured data and reporting to the project participants. The outcomes of the committee, in the form of GHG audit reports, are being monitored monthly and annually. The committee comprised representatives of the project participant and other experts as decided from time to time. It was proposed that whenever required, external independent GHG auditors would be deputed for the monitoring activities. Project Management The authority and responsibility for registration, monitoring, measurement, reporting and reviewing of the data rests with the Board of Directors. The Board may delegate the same to a competent person
CDM-SSC-PDD (version 02) CDM – Executive Board page 22 identified for the purpose. The identified person will be the in charge of GHG monitoring activities and necessary reports will be submitted to the management or it’s Committee for review. Monitoring Requirements The monitoring plan includes monitoring of parameters i.e. the energy fed to the KPTCL grid system, Biomass and fossil fuel consumption, auxiliary consumptions and Imports. Emission reductions resulted from the project activity will be calculated using the energy fed in accordance with the calculations illustrated in Section E of the PDD. Emission reductions generated by the project shall be monitored at regular intervals. The crediting period chosen for the project activity is 10 years. Monitoring equipment comprises of energy meters and weigh bridge at Project entrance. The export meters will monitor the energy fed by the plant to KPTCL grid system. In accordance with the PPA, project proponents have to install two energy meters one is main meter and the other is check meter. Project proponent calibrates both the meters according to the procedures laid down in PPA. The import meter will record the energy taken by the project activity from Grid system. This meter will be checked, calibrated and may be replaced with a new one by KPTCL based on meter condition. This will be under the control of KPTCL, project proponent have no authorization to deal with import energy meter. The gross, auxiliary energy meters and weigh bridge meter will be periodically checked and calibrated by project proponent as per Indian standards for calibration of equipment. Methodology adopted for determining base line emission factor is the weighted average emissions of the generating mix in the Southern grid system, which will represent the intensity of carbon emissions of the grid system. The baseline emission factor is calculated ex-post for all the years of the crediting period using the official data published by the Central Electricity Authority for the Southern grid and therefore included in the monitoring procedures. Leakage Monitoring The 7.5 MW biomass project is renewable energy type and it utilizes biomass fuel for power generation. Since neither energy generating equipment is transferred from another activity nor existing equipment is transferred to another activity, leakage needs not to be monitored or considered. The project does not lead to any leakage emissions due to ‘competing use for biomass’ as the availability of biomass in the region is surplus and the same is demonstrated in the section E.1.2.2. Data Recording and Storage The net energy fed to the grid system, by the project activity will be recorded by project proponents using either of the two meters (main meter and check meter) in the presence of the representative of KPTCL. Representatives of both the project proponent and KPTCL will sign the document which will contain all details such as the equipment data, calibration status, previous reading, current reading, export, import, net billable units, date and time of recording etc. This document will be used as a basic document for monitoring and verification of the net energy exported to the grid. KPTCL will pay to project proponents based on this document. Biomass and coal consumption are recorded on daily as well as monthly basis and the same can be verified from fuel entry data maintained at the project site. This document will be used as a basic document for monitoring and verification of the fuel consumption for power generation.
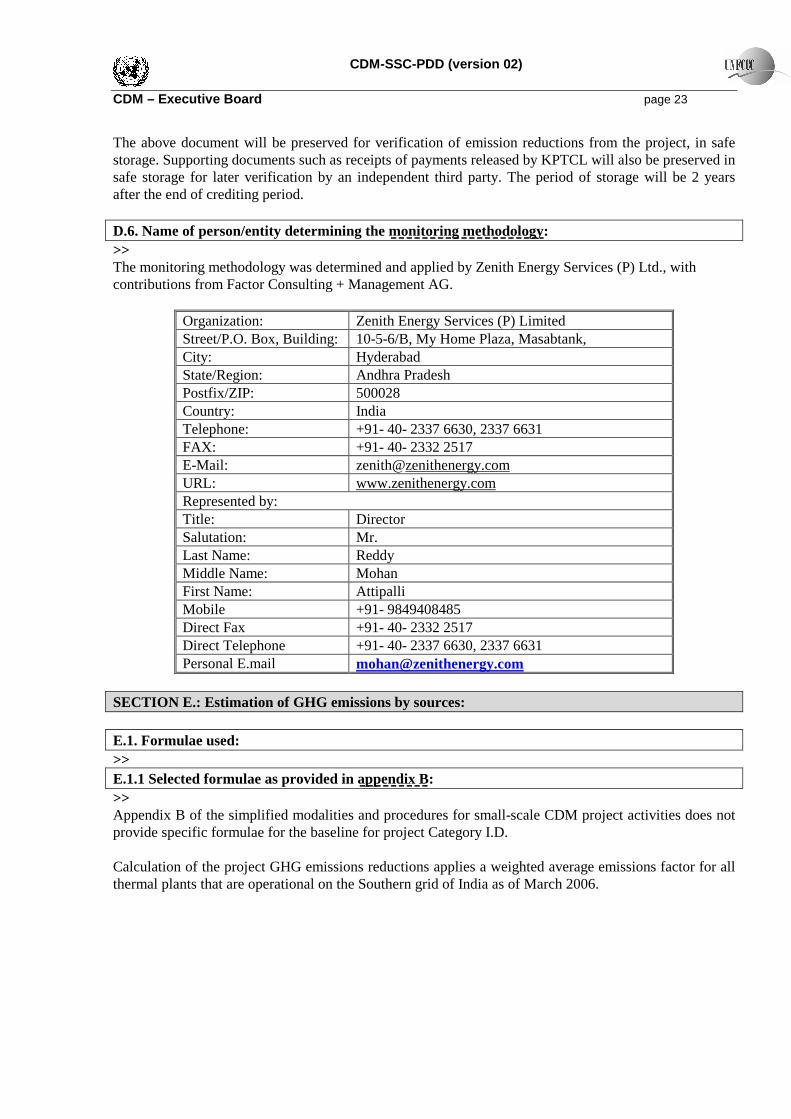
CDM-SSC-PDD (version 02) CDM – Executive Board page 23 The above document will be preserved for verification of emission reductions from the project, in safe storage. Supporting documents such as receipts of payments released by KPTCL will also be preserved in safe storage for later verification by an independent third party. The period of storage will be 2 years after the end of crediting period. D.6. Name of person/entity determining the monitoring methodology: >> The monitoring methodology was determined and applied by Zenith Energy Services (P) Ltd., with contributions from Factor Consulting + Management AG.
Organization: Zenith Energy Services (P) Limited Street/P.O. Box, Building: 10-5-6/B, My Home Plaza, Masabtank, City: Hyderabad State/Region: Andhra Pradesh Postfix/ZIP: 500028 Country: India Telephone: +91- 40- 2337 6630, 2337 6631 FAX: +91- 40- 2332 2517 E-Mail: [email protected] URL: www.zenithenergy.com Represented by: Title: Director Salutation: Mr. Last Name: Reddy Middle Name: Mohan First Name: Attipalli Mobile +91- 9849408485 Direct Fax +91- 40- 2332 2517 Direct Telephone +91- 40- 2337 6630, 2337 6631 Personal E.mail [email protected]
SECTION E.: Estimation of GHG emissions by sources: E.1. Formulae used: >> E.1.1 Selected formulae as provided in appendix B: >> Appendix B of the simplified modalities and procedures for small-scale CDM project activities does not provide specific formulae for the baseline for project Category I.D. Calculation of the project GHG emissions reductions applies a weighted average emissions factor for all thermal plants that are operational on the Southern grid of India as of March 2006.
CDM-SSC-PDD (version 02) CDM – Executive Board page 24
E.1.2 Description of formulae when not provided in appendix B: >> E.1.2.1 Describe the formulae used to estimate anthropogenic emissions by sources of GHGs due to the project activity within the project boundary: >> Due to the project being a CO2 neutral source of energy, no anthropogenic emissions by sources of GHGs are anticipated within the project boundary due to the project activity, hence no formulae are applicable. However, use of fossil fuels is permitted in exigencies to a maximum of 25% of the total annual fuel requirement for biomass based power projects. Hence, the project may use fossil fuels such as coal in future in case of exigencies. In the event of coal consumption, the emissions occurring from the burning of coal will be calculated using the following formula.
PEy = ∑ EFi.y . NCVi . EFco2. i . OXIDi Where: PEy are the emissions from the project activity during the year y in tones of CO2 FFi,y is the quantity of fossil fuel type i combusted to supplement the biomass residues in the project activity during the year y in energy or mass units NCVi is the net calorific value of the fossil fuel type i in TJ per unit of energy or mass units, obtained from local fuel supplier or from the country specific IPCC default factors EFCO2i is the CO2 emission factor per unit of energy or mass of the fuel type i in tons of CO2
obtained from the country specific IPCC default factors OXID i is the oxidation factor of the fuel (as per table 1.29 in the 1996 revised IPCC guidelines
for default values)
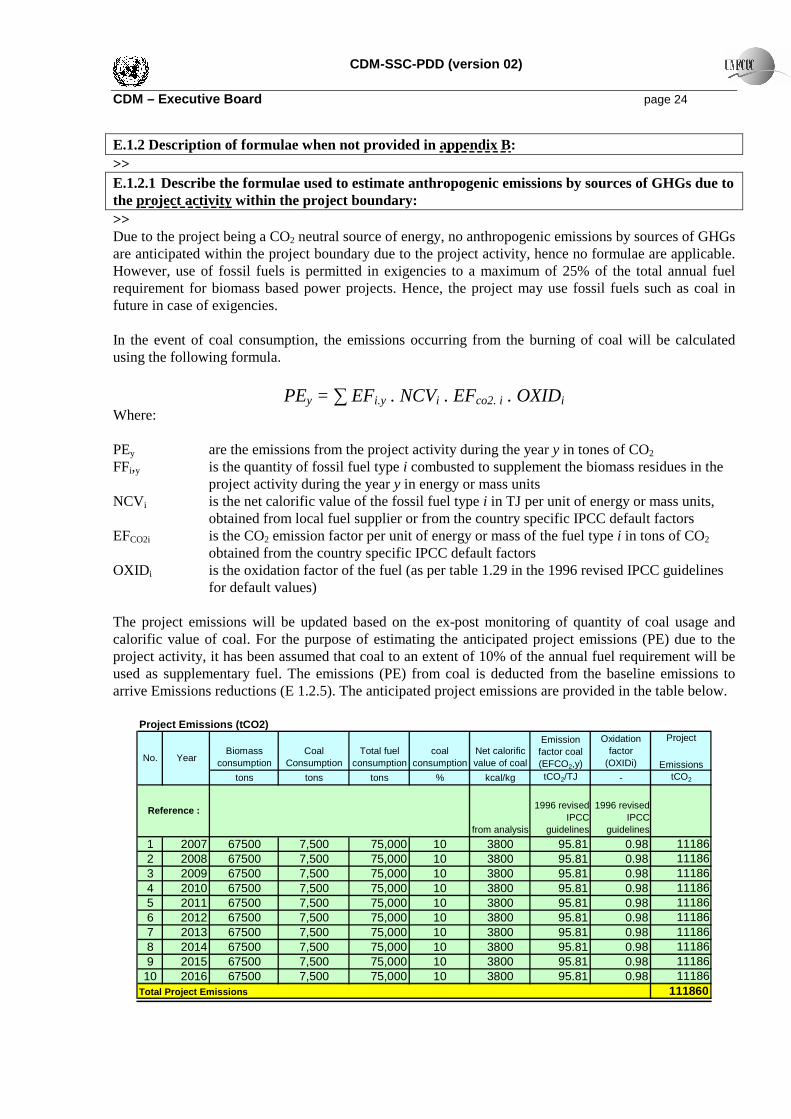
The project emissions will be updated based on the ex-post monitoring of quantity of coal usage and calorific value of coal. For the purpose of estimating the anticipated project emissions (PE) due to the project activity, it has been assumed that coal to an extent of 10% of the annual fuel requirement will be used as supplementary fuel. The emissions (PE) from coal is deducted from the baseline emissions to arrive Emissions reductions (E 1.2.5). The anticipated project emissions are provided in the table below.
Project Emissions (tCO2)
Biomass consumption
Coal Consumption
Total fuel consumption
coal consumption
Net calorific value of coal
Emission factor coal (EFCO2,y)
Oxidation factor
(OXIDi)
Project
Emissionstons tons tons % kcal/kg tCO2/TJ - tCO2
from analysis
1996 revised IPCC
guidelines
1996 revised IPCC
guidelines
1 2007 67500 7,500 75,000 10 3800 95.81 0.98 111862 2008 67500 7,500 75,000 10 3800 95.81 0.98 111863 2009 67500 7,500 75,000 10 3800 95.81 0.98 111864 2010 67500 7,500 75,000 10 3800 95.81 0.98 111865 2011 67500 7,500 75,000 10 3800 95.81 0.98 111866 2012 67500 7,500 75,000 10 3800 95.81 0.98 111867 2013 67500 7,500 75,000 10 3800 95.81 0.98 111868 2014 67500 7,500 75,000 10 3800 95.81 0.98 111869 2015 67500 7,500 75,000 10 3800 95.81 0.98 11186
10 2016 67500 7,500 75,000 10 3800 95.81 0.98 11186Total Project Emissions 111860
Reference :
No. Year
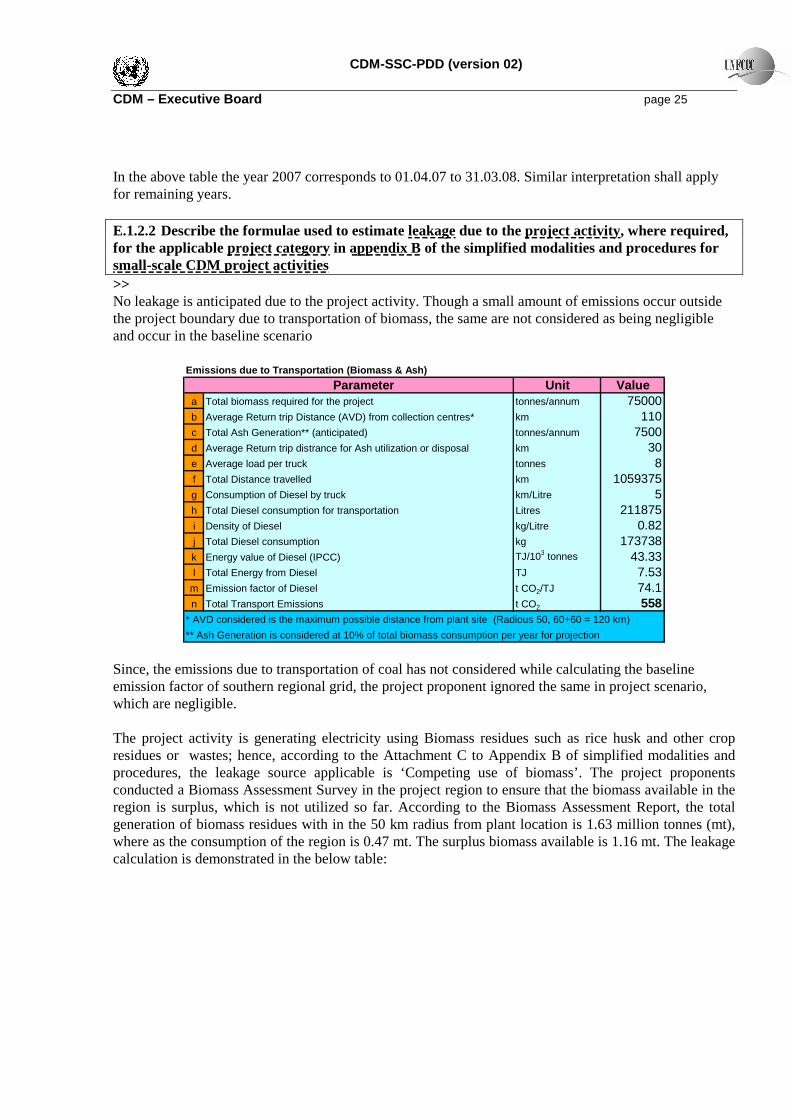
CDM-SSC-PDD (version 02) CDM – Executive Board page 25 In the above table the year 2007 corresponds to 01.04.07 to 31.03.08. Similar interpretation shall apply for remaining years. E.1.2.2 Describe the formulae used to estimate leakage due to the project activity, where required, for the applicable project category in appendix B of the simplified modalities and procedures for small-scale CDM project activities >> No leakage is anticipated due to the project activity. Though a small amount of emissions occur outside the project boundary due to transportation of biomass, the same are not considered as being negligible and occur in the baseline scenario
Emissions due to Transportation (Biomass & Ash)
Parameter Unit Valuea Total biomass required for the project tonnes/annum 75000b Average Return trip Distance (AVD) from collection centres* km 110c Total Ash Generation** (anticipated) tonnes/annum 7500d Average Return trip distrance for Ash utilization or disposal km 30e Average load per truck tonnes 8f Total Distance travelled km 1059375g Consumption of Diesel by truck km/Litre 5h Total Diesel consumption for transportation Litres 211875i Density of Diesel kg/Litre 0.82j Total Diesel consumption kg 173738k Energy value of Diesel (IPCC) TJ/103 tonnes 43.33l Total Energy from Diesel TJ 7.53
m Emission factor of Diesel t CO2/TJ 74.1n Total Transport Emissions t CO2 558
* AVD considered is the maximum possible distance from plant site (Radious 50, 60+60 = 120 km)
** Ash Generation is considered at 10% of total biomass consumption per year for projection Since, the emissions due to transportation of coal has not considered while calculating the baseline emission factor of southern regional grid, the project proponent ignored the same in project scenario, which are negligible. The project activity is generating electricity using Biomass residues such as rice husk and other crop residues or wastes; hence, according to the Attachment C to Appendix B of simplified modalities and procedures, the leakage source applicable is ‘Competing use of biomass’. The project proponents conducted a Biomass Assessment Survey in the project region to ensure that the biomass available in the region is surplus, which is not utilized so far. According to the Biomass Assessment Report, the total generation of biomass residues with in the 50 km radius from plant location is 1.63 million tonnes (mt), where as the consumption of the region is 0.47 mt. The surplus biomass available is 1.16 mt. The leakage calculation is demonstrated in the below table:
CDM-SSC-PDD (version 02) CDM – Executive Board page 26
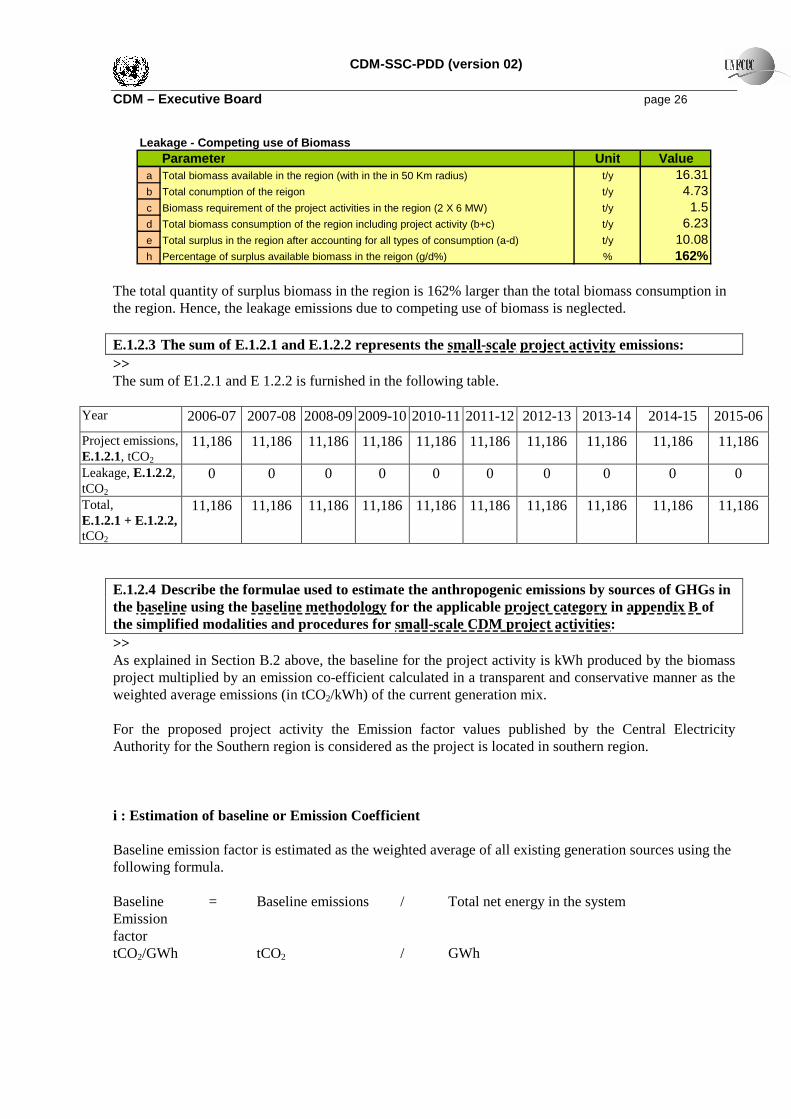
Leakage - Competing use of BiomassParameter Unit Value
a Total biomass available in the region (with in the in 50 Km radius) t/y 16.31b Total conumption of the reigon t/y 4.73c Biomass requirement of the project activities in the region (2 X 6 MW) t/y 1.5d Total biomass consumption of the region including project activity (b+c) t/y 6.23e Total surplus in the region after accounting for all types of consumption (a-d) t/y 10.08h Percentage of surplus available biomass in the reigon (g/d%) % 162%
The total quantity of surplus biomass in the region is 162% larger than the total biomass consumption in the region. Hence, the leakage emissions due to competing use of biomass is neglected. E.1.2.3 The sum of E.1.2.1 and E.1.2.2 represents the small-scale project activity emissions: >> The sum of E1.2.1 and E 1.2.2 is furnished in the following table.
Year 2006-07 2007-08 2008-09 2009-10 2010-11 2011-12 2012-13 2013-14 2014-15 2015-06
Project emissions, E.1.2.1, tCO2
11,186 11,186 11,186 11,186 11,186 11,186 11,186 11,186 11,186 11,186
Leakage, E.1.2.2, tCO2
0 0 0 0 0 0 0 0 0 0
Total, E.1.2.1 + E.1.2.2, tCO2
11,186 11,186 11,186 11,186 11,186 11,186 11,186 11,186 11,186 11,186
E.1.2.4 Describe the formulae used to estimate the anthropogenic emissions by sources of GHGs in the baseline using the baseline methodology for the applicable project category in appendix B of the simplified modalities and procedures for small-scale CDM project activities: >> As explained in Section B.2 above, the baseline for the project activity is kWh produced by the biomass project multiplied by an emission co-efficient calculated in a transparent and conservative manner as the weighted average emissions (in tCO2/kWh) of the current generation mix. For the proposed project activity the Emission factor values published by the Central Electricity Authority for the Southern region is considered as the project is located in southern region. i : Estimation of baseline or Emission Coefficient Baseline emission factor is estimated as the weighted average of all existing generation sources using the following formula. Baseline = Baseline emissions / Total net energy in the system Emission factor tCO2/GWh tCO2 / GWh
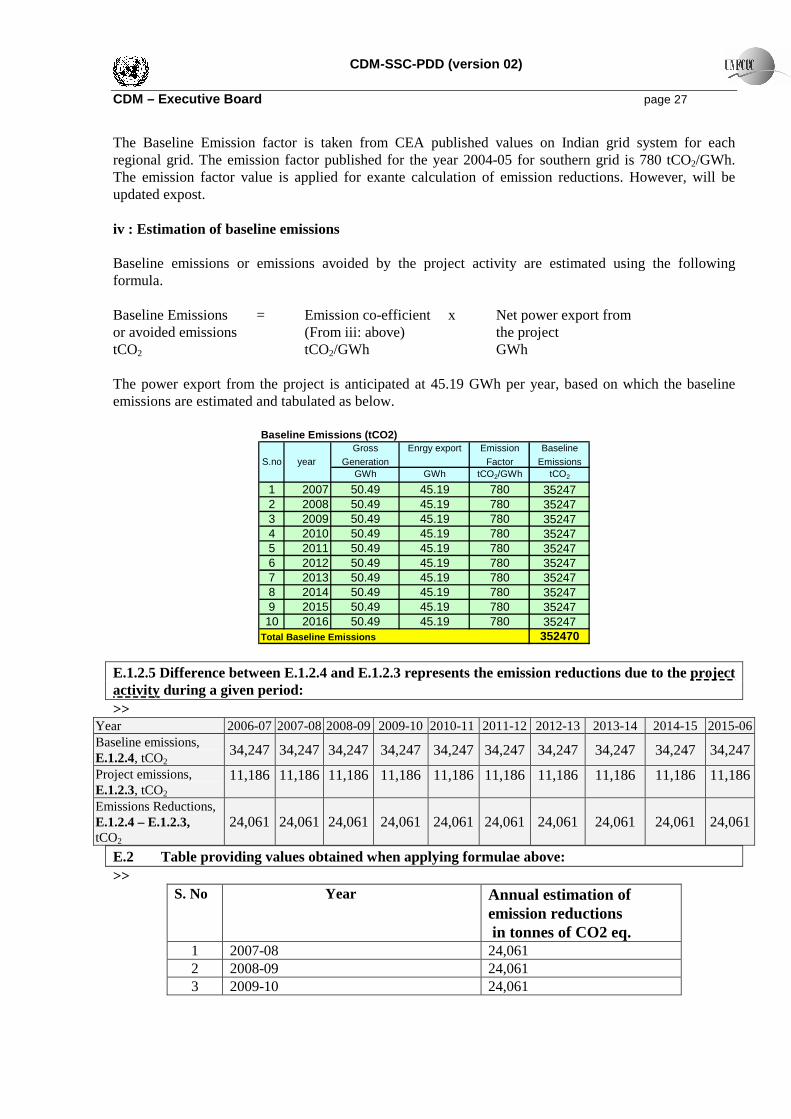
CDM-SSC-PDD (version 02) CDM – Executive Board page 27 The Baseline Emission factor is taken from CEA published values on Indian grid system for each regional grid. The emission factor published for the year 2004-05 for southern grid is 780 tCO2/GWh. The emission factor value is applied for exante calculation of emission reductions. However, will be updated expost. iv : Estimation of baseline emissions Baseline emissions or emissions avoided by the project activity are estimated using the following formula. Baseline Emissions = Emission co-efficient x Net power export from or avoided emissions (From iii: above) the project tCO2 tCO2/GWh GWh The power export from the project is anticipated at 45.19 GWh per year, based on which the baseline emissions are estimated and tabulated as below.
Baseline Emissions (tCO2)Gross
Generation Enrgy export Emission
Factor Baseline
Emissions GWh GWh tCO2/GWh tCO2
1 2007 50.49 45.19 780 352472 2008 50.49 45.19 780 352473 2009 50.49 45.19 780 352474 2010 50.49 45.19 780 352475 2011 50.49 45.19 780 352476 2012 50.49 45.19 780 352477 2013 50.49 45.19 780 352478 2014 50.49 45.19 780 352479 2015 50.49 45.19 780 3524710 2016 50.49 45.19 780 35247
Total Baseline Emissions 352470
S.no year
E.1.2.5 Difference between E.1.2.4 and E.1.2.3 represents the emission reductions due to the project activity during a given period: >>
Year 2006-07 2007-08 2008-09 2009-10 2010-11 2011-12 2012-13 2013-14 2014-15 2015-06 Baseline emissions, E.1.2.4, tCO2
34,247 34,247 34,247 34,247 34,247 34,247 34,247 34,247 34,247 34,247
Project emissions, E.1.2.3, tCO2
11,186 11,186 11,186 11,186 11,186 11,186 11,186 11,186 11,186 11,186
Emissions Reductions, E.1.2.4 – E.1.2.3, tCO2
24,061 24,061 24,061 24,061 24,061 24,061 24,061 24,061 24,061 24,061
E.2 Table providing values obtained when applying formulae above: >>
S. No Year Annual estimation of emission reductions in tonnes of CO2 eq.
1 2007-08 24,061 2 2008-09 24,061 3 2009-10 24,061
CDM-SSC-PDD (version 02) CDM – Executive Board page 28
4 2010-11 24,061 5 2011-12 24,061 6 2012-13 24,061 7 2013-14 24,061 8 2014-15 24,061 9 2015-16 24,061 10 2016-17 24,061
Total estimated reductions (tonnes of CO2 eq.)
240,610
Total number of crediting years 10
Annual average over the crediting period of estimated reductions (tonnes of CO2eq.)
24,061
SECTION F.: Environmental impacts: F.1. If required by the host Party, documentation on the analysis of the environmental impacts of the project activity: >> As per the prevailing regulations of the Host Party i.e. India (represented by the Ministry of Environment and Forests, Govt. of India and also the line ministry for environmental issues in India), the project activity need not conduct environmental impact assessment. However, before implementation of the project, project participants have to obtain clearance from local Pollution Control Board. As required for implementation of the project activity, project participants had studied the possibility of environmental impacts and concluded that no negative impacts are possible due to the project activity. Having satisfied with the project design, local pollution control board represented by the Karnataka State Pollution Control Board (KPCB) has accorded its consent for implementation and operation of the project. The project does not fall under the purview of the Environmental Impact Assessment (EIA) notification of the Ministry of Environment and Forest, Government of India. However the design philosophy of this biomass based project activity is driven by the concept of providing the low cost energy with carbon neutral fuel. Therefore the project will have no impact on the environment. SECTION G. Stakeholders’ comments: G.1. Brief description of how comments by local stakeholders have been invited and compiled: >> No specific public consultation / participation requirements are specified in Indian statutes for setting up of small-scale industries. However, there are certain procedural requirements, which every project investor needs to follow before implementing any project. Before implementing any project, project investors / developers need to identify the stakeholders, prepare necessary documents, approach the identified stakeholders directly and obtain required clearances / approvals. The stakeholders after review of documents and investment profile, will accord approvals / licences or send comments in writing to project investors for further clarifications / corrections. In case they are not satisfied with the project design or they feel that the project impacts any of the local environment / social / economical environments, they will not issue clearances / approvals and stop the implementation of the project.
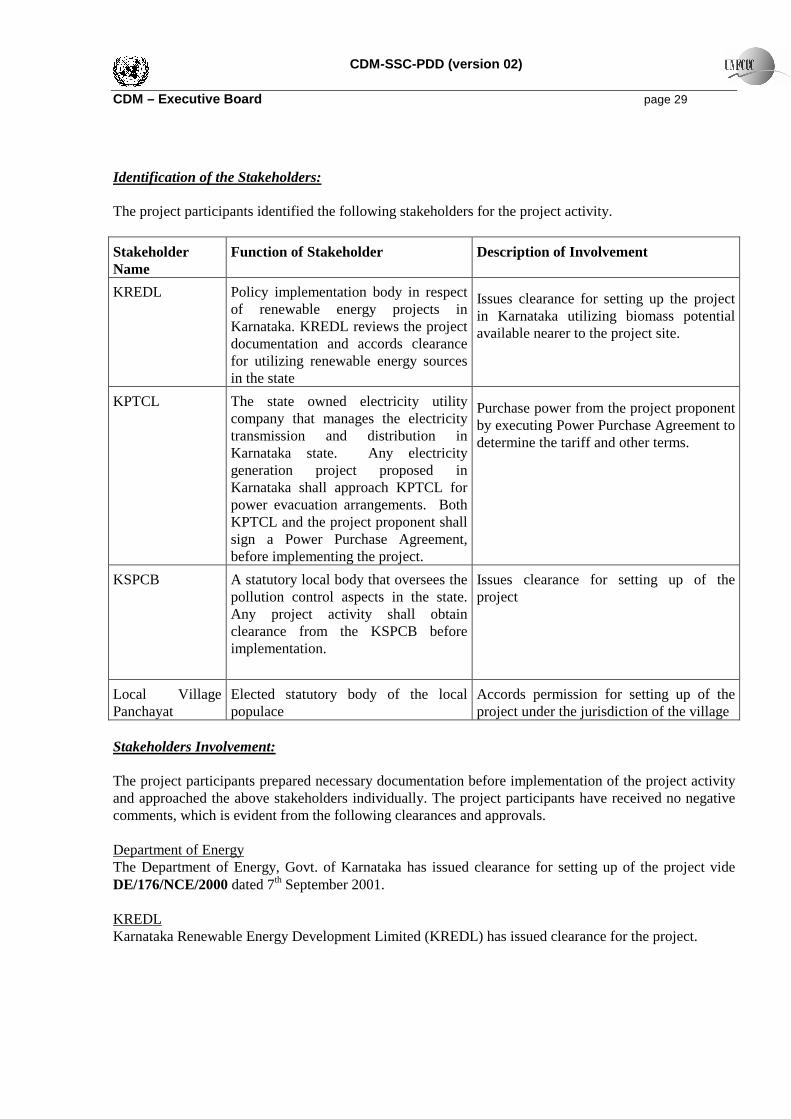
CDM-SSC-PDD (version 02) CDM – Executive Board page 29 Identification of the Stakeholders: The project participants identified the following stakeholders for the project activity.
Stakeholder Name
Function of Stakeholder Description of Involvement
KREDL Policy implementation body in respect of renewable energy projects in Karnataka. KREDL reviews the project documentation and accords clearance for utilizing renewable energy sources in the state
Issues clearance for setting up the project in Karnataka utilizing biomass potential available nearer to the project site.
KPTCL The state owned electricity utility company that manages the electricity transmission and distribution in Karnataka state. Any electricity generation project proposed in Karnataka shall approach KPTCL for power evacuation arrangements. Both KPTCL and the project proponent shall sign a Power Purchase Agreement, before implementing the project.
Purchase power from the project proponent by executing Power Purchase Agreement to determine the tariff and other terms.
KSPCB A statutory local body that oversees the pollution control aspects in the state. Any project activity shall obtain clearance from the KSPCB before implementation.
Issues clearance for setting up of the project
Local Village Panchayat
Elected statutory body of the local populace
Accords permission for setting up of the project under the jurisdiction of the village
Stakeholders Involvement: The project participants prepared necessary documentation before implementation of the project activity and approached the above stakeholders individually. The project participants have received no negative comments, which is evident from the following clearances and approvals. Department of Energy The Department of Energy, Govt. of Karnataka has issued clearance for setting up of the project vide DE/176/NCE/2000 dated 7th September 2001. KREDL Karnataka Renewable Energy Development Limited (KREDL) has issued clearance for the project.
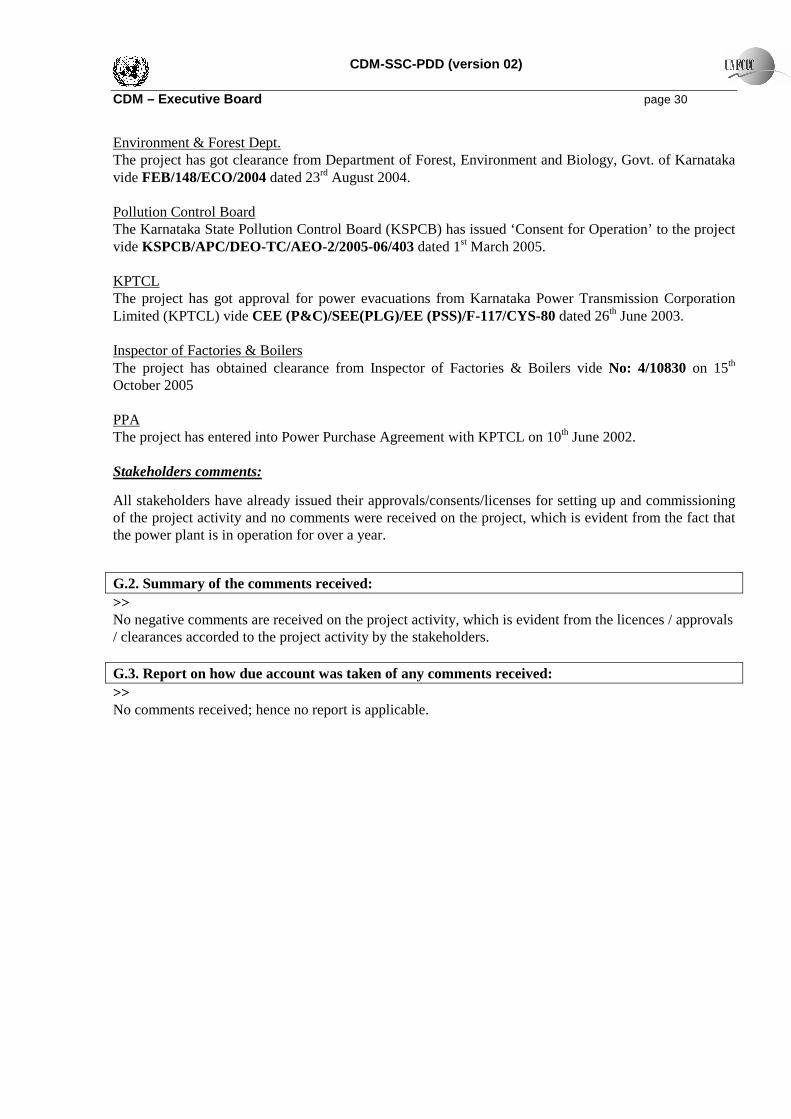
CDM-SSC-PDD (version 02) CDM – Executive Board page 30 Environment & Forest Dept. The project has got clearance from Department of Forest, Environment and Biology, Govt. of Karnataka vide FEB/148/ECO/2004 dated 23rd August 2004. Pollution Control Board The Karnataka State Pollution Control Board (KSPCB) has issued ‘Consent for Operation’ to the project vide KSPCB/APC/DEO-TC/AEO-2/2005-06/403 dated 1st March 2005. KPTCL The project has got approval for power evacuations from Karnataka Power Transmission Corporation Limited (KPTCL) vide CEE (P&C)/SEE(PLG)/EE (PSS)/F-117/CYS-80 dated 26th June 2003. Inspector of Factories & Boilers The project has obtained clearance from Inspector of Factories & Boilers vide No: 4/10830 on 15th October 2005 PPA The project has entered into Power Purchase Agreement with KPTCL on 10th June 2002. Stakeholders comments:
All stakeholders have already issued their approvals/consents/licenses for setting up and commissioning of the project activity and no comments were received on the project, which is evident from the fact that the power plant is in operation for over a year.
G.2. Summary of the comments received: >> No negative comments are received on the project activity, which is evident from the licences / approvals / clearances accorded to the project activity by the stakeholders. G.3. Report on how due account was taken of any comments received: >> No comments received; hence no report is applicable.
CDM-SSC-PDD (version 02) CDM – Executive Board page 31
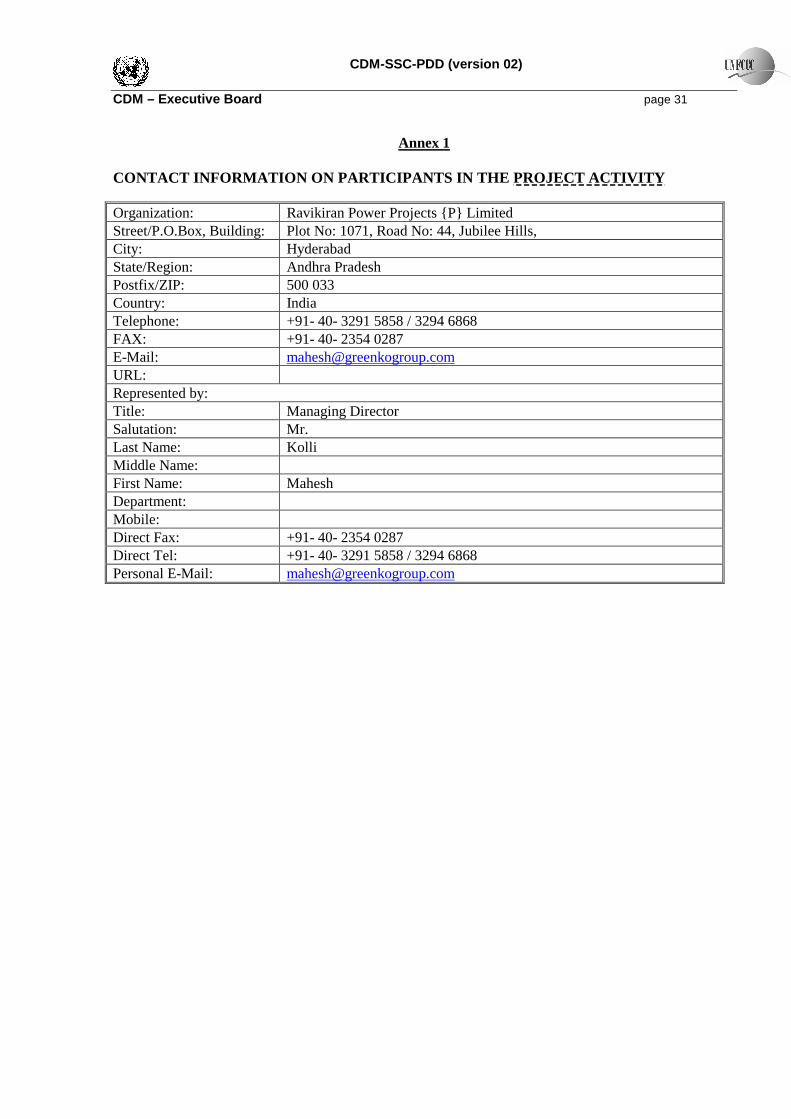
Annex 1 CONTACT INFORMATION ON PARTICIPANTS IN THE PROJECT ACTIVITY
Organization: Ravikiran Power Projects {P} Limited Street/P.O.Box, Building: Plot No: 1071, Road No: 44, Jubilee Hills, City: Hyderabad State/Region: Andhra Pradesh Postfix/ZIP: 500 033 Country: India Telephone: +91- 40- 3291 5858 / 3294 6868 FAX: +91- 40- 2354 0287 E-Mail: [email protected] URL: Represented by: Title: Managing Director Salutation: Mr. Last Name: Kolli Middle Name: First Name: Mahesh Department: Mobile: Direct Fax: +91- 40- 2354 0287 Direct Tel: +91- 40- 3291 5858 / 3294 6868 Personal E-Mail: [email protected]

CDM-SSC-PDD (version 02) CDM – Executive Board page 32
Annex 2
INFORMATION REGARDING PUBLIC FUNDING
No public funding from the parties included in Annex - I is involved in the project activity
CDM-SSC-PDD (version 02) CDM – Executive Board page 33
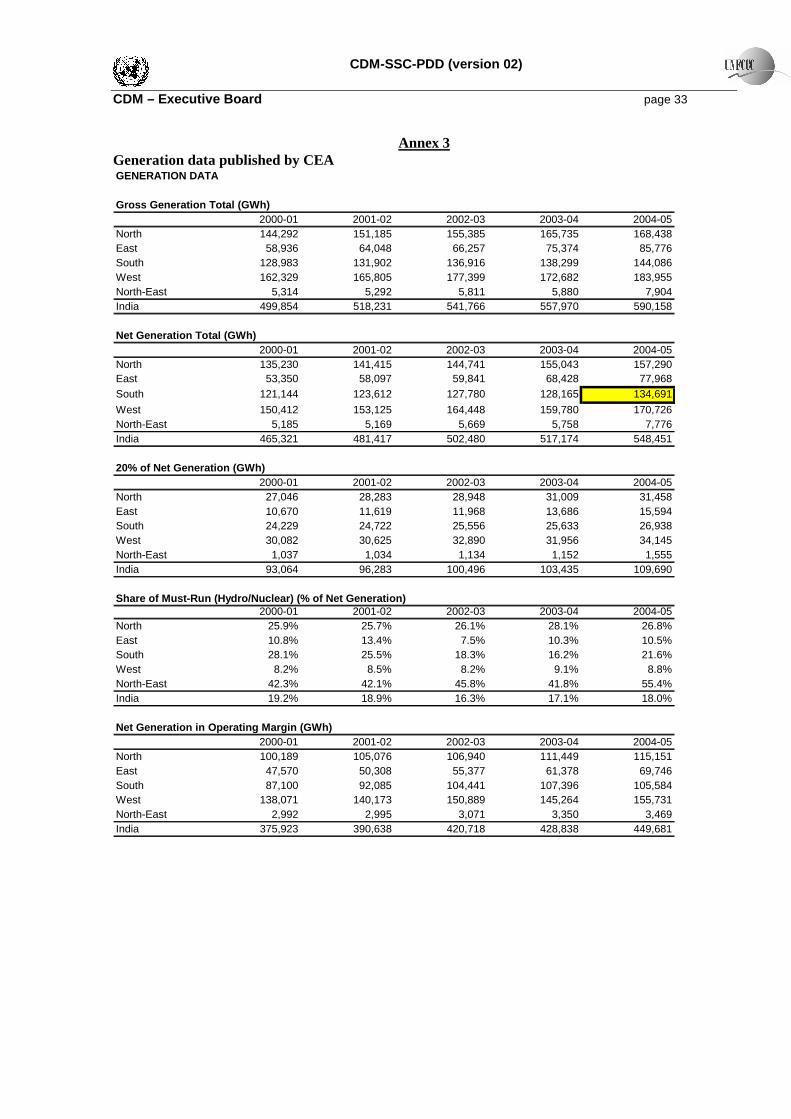
Annex 3 Generation data published by CEA GENERATION DATA
Gross Generation Total (GWh)2000-01 2001-02 2002-03 2003-04 2004-05
North 144,292 151,185 155,385 165,735 168,438East 58,936 64,048 66,257 75,374 85,776South 128,983 131,902 136,916 138,299 144,086West 162,329 165,805 177,399 172,682 183,955North-East 5,314 5,292 5,811 5,880 7,904India 499,854 518,231 541,766 557,970 590,158
Net Generation Total (GWh)2000-01 2001-02 2002-03 2003-04 2004-05
North 135,230 141,415 144,741 155,043 157,290East 53,350 58,097 59,841 68,428 77,968South 121,144 123,612 127,780 128,165 134,691
West 150,412 153,125 164,448 159,780 170,726North-East 5,185 5,169 5,669 5,758 7,776India 465,321 481,417 502,480 517,174 548,451
20% of Net Generation (GWh)2000-01 2001-02 2002-03 2003-04 2004-05
North 27,046 28,283 28,948 31,009 31,458East 10,670 11,619 11,968 13,686 15,594South 24,229 24,722 25,556 25,633 26,938West 30,082 30,625 32,890 31,956 34,145North-East 1,037 1,034 1,134 1,152 1,555India 93,064 96,283 100,496 103,435 109,690
Share of Must-Run (Hydro/Nuclear) (% of Net Generat ion)2000-01 2001-02 2002-03 2003-04 2004-05
North 25.9% 25.7% 26.1% 28.1% 26.8%East 10.8% 13.4% 7.5% 10.3% 10.5%South 28.1% 25.5% 18.3% 16.2% 21.6%West 8.2% 8.5% 8.2% 9.1% 8.8%North-East 42.3% 42.1% 45.8% 41.8% 55.4%India 19.2% 18.9% 16.3% 17.1% 18.0%
Net Generation in Operating Margin (GWh)2000-01 2001-02 2002-03 2003-04 2004-05
North 100,189 105,076 106,940 111,449 115,151East 47,570 50,308 55,377 61,378 69,746South 87,100 92,085 104,441 107,396 105,584West 138,071 140,173 150,889 145,264 155,731North-East 2,992 2,995 3,071 3,350 3,469India 375,923 390,638 420,718 428,838 449,681
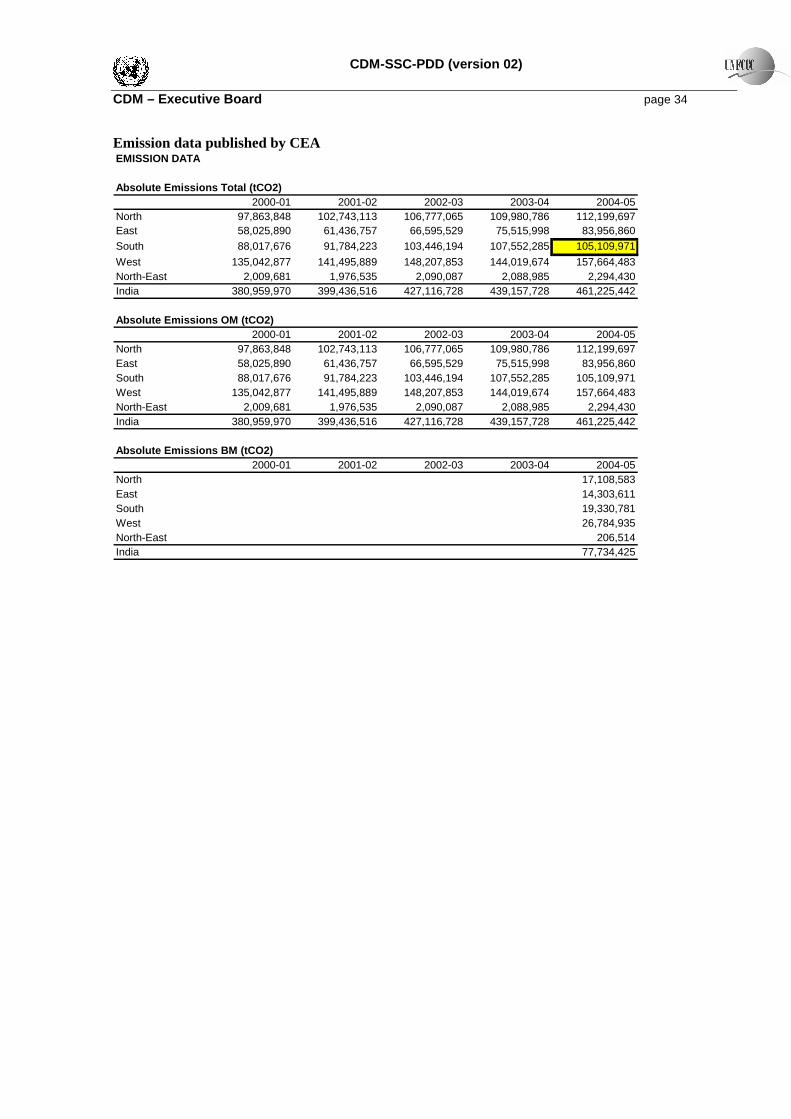
CDM-SSC-PDD (version 02) CDM – Executive Board page 34 Emission data published by CEA EMISSION DATA
Absolute Emissions Total (tCO2)2000-01 2001-02 2002-03 2003-04 2004-05
North 97,863,848 102,743,113 106,777,065 109,980,786 112,199,697East 58,025,890 61,436,757 66,595,529 75,515,998 83,956,860
South 88,017,676 91,784,223 103,446,194 107,552,285 105,109,971
West 135,042,877 141,495,889 148,207,853 144,019,674 157,664,483North-East 2,009,681 1,976,535 2,090,087 2,088,985 2,294,430India 380,959,970 399,436,516 427,116,728 439,157,728 461,225,442
Absolute Emissions OM (tCO2)2000-01 2001-02 2002-03 2003-04 2004-05
North 97,863,848 102,743,113 106,777,065 109,980,786 112,199,697East 58,025,890 61,436,757 66,595,529 75,515,998 83,956,860South 88,017,676 91,784,223 103,446,194 107,552,285 105,109,971West 135,042,877 141,495,889 148,207,853 144,019,674 157,664,483North-East 2,009,681 1,976,535 2,090,087 2,088,985 2,294,430India 380,959,970 399,436,516 427,116,728 439,157,728 461,225,442
Absolute Emissions BM (tCO2)2000-01 2001-02 2002-03 2003-04 2004-05
North 17,108,583East 14,303,611South 19,330,781West 26,784,935North-East 206,514India 77,734,425
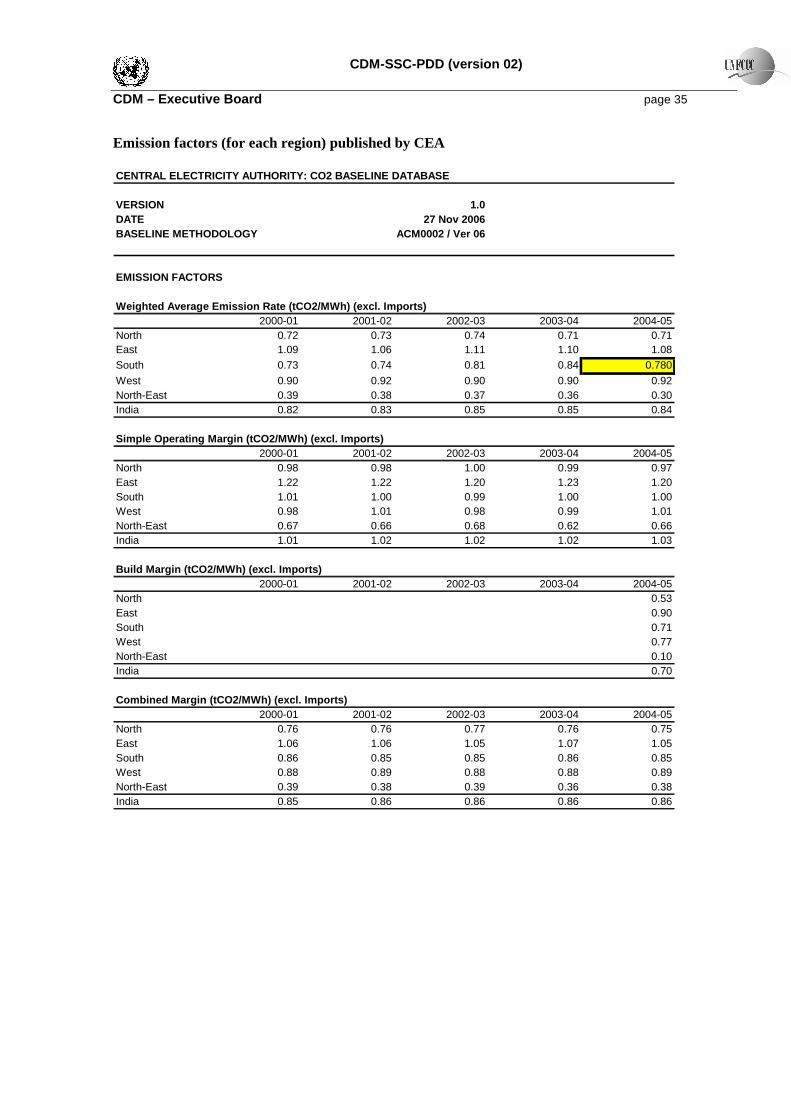
CDM-SSC-PDD (version 02) CDM – Executive Board page 35 Emission factors (for each region) published by CEA CENTRAL ELECTRICITY AUTHORITY: CO2 BASELINE DATABAS E
VERSION 1.0DATE 27 Nov 2006BASELINE METHODOLOGY ACM0002 / Ver 06
EMISSION FACTORS
Weighted Average Emission Rate (tCO2/MWh) (excl. Im ports)2000-01 2001-02 2002-03 2003-04 2004-05
North 0.72 0.73 0.74 0.71 0.71East 1.09 1.06 1.11 1.10 1.08
South 0.73 0.74 0.81 0.84 0.780
West 0.90 0.92 0.90 0.90 0.92North-East 0.39 0.38 0.37 0.36 0.30India 0.82 0.83 0.85 0.85 0.84
Simple Operating Margin (tCO2/MWh) (excl. Imports)2000-01 2001-02 2002-03 2003-04 2004-05
North 0.98 0.98 1.00 0.99 0.97East 1.22 1.22 1.20 1.23 1.20South 1.01 1.00 0.99 1.00 1.00West 0.98 1.01 0.98 0.99 1.01North-East 0.67 0.66 0.68 0.62 0.66India 1.01 1.02 1.02 1.02 1.03
Build Margin (tCO2/MWh) (excl. Imports)2000-01 2001-02 2002-03 2003-04 2004-05
North 0.53East 0.90South 0.71West 0.77North-East 0.10India 0.70
Combined Margin (tCO2/MWh) (excl. Imports)2000-01 2001-02 2002-03 2003-04 2004-05
North 0.76 0.76 0.77 0.76 0.75East 1.06 1.06 1.05 1.07 1.05South 0.86 0.85 0.85 0.86 0.85West 0.88 0.89 0.88 0.88 0.89North-East 0.39 0.38 0.39 0.36 0.38India 0.85 0.86 0.86 0.86 0.86

CDM-SSC-PDD (version 02) CDM – Executive Board page 36
Annex 4
Abbreviations
CEA Central Electricity Authority
CFE Consent for Establishment
CFO Consent for Operation
CO2 Carbon dioxide
EIA Environment Impact Assessment
GHG Greenhouse gas
GWh Giga watt hour
IPCC Inter Governmental Panel on Climate Change
kcal Kilo Calories
KPTCL Karnataka Power Transmission Corporation Limited
KREDL Karnataka Renewable Energy Development Limited
KSPCB Karnataka State Pollution Control Board
kWh Kilo watt hour
MW Mega watt
MNES Ministry of Non Conventional Energy Sources
MoEF Ministry of Environment & Forest
MT Metric Tonne
NCV Net Calorific Value
PDD Project Design Document
PPA Power Purchase Agreement
UNFCCC United Nations Framework Convention on Climate Change
CDM-SSC-PDD (version 02) CDM – Executive Board page 37
Attachment – 1
CDM-SSC-PDD (version 02) CDM – Executive Board page 38
Attachment – 2
CDM-SSC-PDD (version 02) CDM – Executive Board page 39
CDM-SSC-PDD (version 02) CDM – Executive Board page 40
CDM-SSC-PDD (version 02) CDM – Executive Board page 41
Attachment – 3
CDM-SSC-PDD (version 02) CDM – Executive Board page 42
CDM-SSC-PDD (version 02) CDM – Executive Board page 43
CDM-SSC-PDD (version 02) CDM – Executive Board page 44
Attachment – 4
CDM-SSC-PDD (version 02) CDM – Executive Board page 45
CDM-SSC-PDD (version 02) CDM – Executive Board page 46
Attachment – 5
CDM-SSC-PDD (version 02) CDM – Executive Board page 47
CDM-SSC-PDD (version 02) CDM – Executive Board page 48
CDM-SSC-PDD (version 02) CDM – Executive Board page 49