Embed Size (px)
Citation preview
March 22, 2021
Simmons Energy
21st Annual Energy Conference

Copyright 2020 ChampionX. All rights reserved. 2
Notices & Disclaimers
Forward-Looking Statements
This investor presentation contains statements relating to future actions and results, which are "forward-looking statements" within the meaning of the Securities Exchange Act of 1934, as amended, and the
Private Securities Litigation Reform Act of 1995. Such statements relate to, among other things, ChampionX's market position and growth opportunities. Forward-looking statements include, statements related
to ChampionX’s expectations regarding the performance of the business, financial results, liquidity and capital resources of ChampionX. Forward-looking statements are subject to inherent risks and
uncertainties that could cause actual results to differ materially from current expectations, including, but not limited to, changes in economic, competitive, strategic, technological, tax, regulatory or other factors
that affect the operation of ChampionX’s businesses. You are encouraged to refer to the documents that ChampionX files from time to time with the Securities and Exchange Commission (“SEC”), including
the “Risk Factors” in ChampionX’s Annual Report on Form 10-K for the year ended December 31, 2020, and in ChampionX’s other filings with the SEC. Readers are cautioned not to place undue reliance on
ChampionX’s forward-looking statements. Forward-looking statements speak only as of the day they are made and ChampionX undertakes no obligation to update any forward-looking statement, except as
required by applicable law.
Non-GAAP Measures
This investor presentation, and the related discussions, contains certain non-GAAP financial measures, which should be considered only as supplemental to, and not as superior to financial measures prepared
in accordance with generally accepted accounting principles (“GAAP”). Please refer to the Appendix of this presentation for a reconciliation of these non-GAAP financial measures to the most directly
comparable financial measures prepared in accordance with GAAP and definitions and calculation methodologies of defined terms used in this investor presentation. For additional information about our non-
GAAP financial measures, see our filings with the SEC.
Results on a Pro Forma Basis
On June 3, 2020, Apergy Corporation closed on the acquisition of ChampionX Holding, Inc. (“the Transaction”) and changed its name ChampionX Corporation. “Reported results” reflect the respective
contributions from each company based on the close of the Transaction. For comparative purposes, management has also presented herein certain unaudited pro forma financial information as if the
Transaction was completed on January 1, 2019, including results on a pro forma basis for revenue, income before income taxes, income before income taxes margin, adjusted EBITDA, adjusted EBITDA
margin, segment revenue, segment operating profit (loss), segment adjusted EBITDA, segment adjusted EBITDA margin for the years ended December 31, 2020, and December 31, 2019, and the quarterly
periods ended December 31, 2020, September 30, 2020, and December 31, 2019. The financial results on a pro forma basis are provided to assist investors in assessing ChampionX’s performance on a basis
that includes the combined results of operations of both Apergy Corporation and ChampionX Holding, Inc. for the full reporting period. ChampionX management believes this unaudited pro forma historical
financial information helps investors understand the long-term profitability trends of its newly combined business giving effect to the Transaction and facilitates comparisons of our profitability to prior and future
periods and to our peers. The historical financial results on a pro forma basis herein may not be comparable to similarly titled measures reported by other companies.

Copyright 2020 ChampionX. All rights reserved. 3
▪ We are continuing to evaluate the full impact of the winter storm
▪ Due to winter storm impacts, we now expect first quarter 2021 Revenue and Adjusted EBITDA near the low end of our prior guidance range of $650 million to $700 million, and $90 million to $100 million, respectively
▪ Our Chemical Technologies businesses were the most impacted by the winter storm:• Raw materials supply chain disruptions due to shutdowns of Gulf Coast petrochemical and chemical plants
• Lower consumable production chemicals sales due to lost oil & gas production
• Repair and start up costs associated with repairing storm damage to facilities and associated lower absorption due to facility shut down
• Our teams are working hard to ensure supply assurance to our customers
• All our facilities are fully operational, but we continue to experience some raw material supply chain disruptions
▪ We expect Production & Automation Technologies and Drilling Technologies to fully recover from winter storm impacts within the first quarter, given improved activity levels in March
▪ We still expect exit 2021 adjusted EBITDA margin to exceed exit 2020 level, driven by volume and price improvements, and further realization of cost synergies
Winter Storm Impact Update
Note: See appendix for reconciliation of non-GAAP financial measures including adjusted EBITDA.
Copyright 2020 ChampionX. All rights reserved. 4
▪ Global leader in production-optimization solutions – focused on collaboratively solving
customer problems and enhancing productivity in the “long tail” production phase of the well
▪ Most trusted brands – recognized for quality, performance, and customer service
▪ Diversified global customer base and deep relationships with the largest and most stable
players in the oil and gas industry
▪ Global presence with balanced portfolio across regions and production types
▪ Strong financial profile – sustained profitability and free cash flow through business cycles
▪ Platform to capitalize on increasing customer adoption of digital solutions to drive wellsite
productivity
Unlocking energy to drive value for our customers, employees and shareholders
ChampionX Overview
4

Copyright 2020 ChampionX. All rights reserved. 5
ChampionX is Present Across the Wellsite
ARTIFICIAL LIFT
1. Progressive Cavity Pumps
2. Rod Lift
3. Plunger Lift
4. ESP
5. Gas Lift
10
1 2 3 4
15
DIGITAL
10. IIoT Enabled Technologies
11. Optimization Software
12. Remote Monitoring
11
10
11
DRILLING TECHNOLOGIES
6. Diamond Drill Bit Inserts
7. Diamond Bearings
12
6 7
CHEMICAL TECHNOLOGIES
8. Production Chemicals
9. Drilling & Completion Chemicals
8
9
5

Copyright 2020 ChampionX. All rights reserved.
Geography1 Business Mix1 Top 20 Customer Profile2
▪ Diversified geographic footprint with a
balanced international mix
▪ Scale, geographic presence in 55+
countries
▪ Diversified equipment and solutions
provider with significant production-
levered revenue
▪ Integrated platform of production-
optimization and services
▪ Top 20 customers represented 47% of
2020 consolidated pro forma revenue
▪ High exposure to large, stable, high-
quality National and International Oil
Companies
Production &
Automation
Technologies
6
ChampionX Portfolio ProfileProduction-oriented portfolio with strong product & technology offering
Drilling, Completions
& Other
13%
Production
Chemical
Technologies
Production
87%
OFS,
Independents &
Other
IOCs &
NOCs
Note: See appendix for reconciliation of non-GAAP financial measures including pro forma revenue.
1. Based on pro forma revenue for the year ended December 31, 2020.
2. Based on pro forma revenue for the year ended December 31, 2020.
U.S.
Canada
Europe & Russia
Middle East & Africa
Latin AmericaAPAC
47%
10%
11%
14%
13%
5%
78%
22%
6
Copyright 2020 ChampionX. All rights reserved.
% Total ChampionX1 Geography1 Domain Expertise
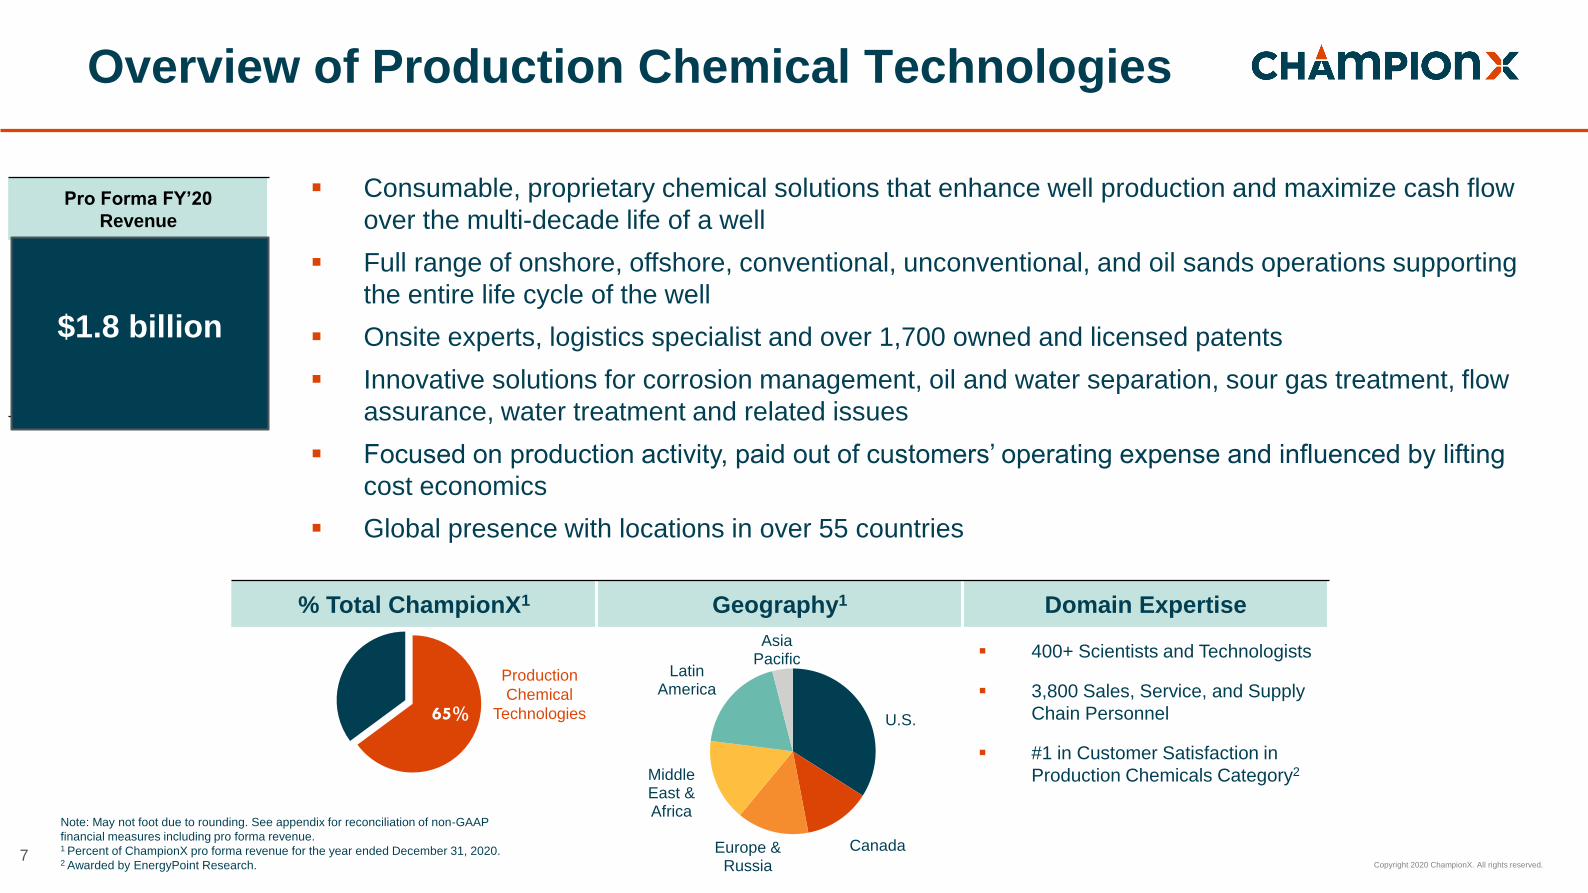
Pro Forma FY’20
Revenue
7
▪ 400+ Scientists and Technologists
▪ 3,800 Sales, Service, and Supply
Chain Personnel
▪ #1 in Customer Satisfaction in
Production Chemicals Category2
Overview of Production Chemical Technologies
Production
Chemical
Technologies
$1.8 billion
Note: May not foot due to rounding. See appendix for reconciliation of non-GAAP
financial measures including pro forma revenue.1 Percent of ChampionX pro forma revenue for the year ended December 31, 2020.2 Awarded by EnergyPoint Research.
65% U.S.
CanadaEurope & Russia
Middle East & Africa
Latin America
Asia Pacific
38%
13%
17%
16%4%
▪ Consumable, proprietary chemical solutions that enhance well production and maximize cash flow
over the multi-decade life of a well
▪ Full range of onshore, offshore, conventional, unconventional, and oil sands operations supporting
the entire life cycle of the well
▪ Onsite experts, logistics specialist and over 1,700 owned and licensed patents
▪ Innovative solutions for corrosion management, oil and water separation, sour gas treatment, flow
assurance, water treatment and related issues
▪ Focused on production activity, paid out of customers’ operating expense and influenced by lifting
cost economics
▪ Global presence with locations in over 55 countries
7

Copyright 2020 ChampionX. All rights reserved. 8
Production Chemical Technologies Has a Leading Position
in the Global Oilfield Chemicals Market
Source: Kimberlite International Oilfield Research and company estimates.
ChampionX benefits from top 3 leadership positions
across key categories:
▪ Corrosion management and control
▪ Scale management and control
▪ Bacteria management and control
▪ Oil and water separation
▪ Wax and asphaltene management and control
▪ Water shut off and control
▪ H2S management and control
▪ Hydrate management and control
▪ Automated chemical control and reporting
Estimated Global Production Chemicals Market Share
Competitor A
Competitor B
Competitor C
Competitor D
All Others
8

Copyright 2020 ChampionX. All rights reserved.
% Total ChampionX1 Product Mix2 Geography2 U.S. Basin2
74%2%
8%
16%
80%
16%
5%
Other
Production
Equip.
Artificial
Lift
Digital
FY’20 Revenue
9
▪ Leading provider of production & automation equipment and digital solutions for global E&P operators
▪ Proven brands known for performance reliability, technology, manufacturing quality and pre and post
sales support
▪ Broadest artificial lift portfolio that supports oil and gas operators over life of well
▪ Trusted partner to lower production costs for operators and optimize well efficiency
▪ Investment in New Product Development within ESP and our Digital platforms will continue to deliver
share of wallet gains in the cycle and further diversify our revenue mix
▪ Global sales & service locations: 110+ (North America) & 22 (Rest of World)
Overview of Production & Automation Technologies
Production &
Automation
Technologies
ROW
Bakken
Permian
Rockies
Mid-ConEurope
Asia
Pacific
U.S.
$616mm
Note: May not foot due to rounding. See appendix for reconciliation of non-GAAP financial measures including pro forma revenue.1 % of ChampionX pro forma revenue for the year ended December 31, 2020.2 % of segment revenue for the year ended December 31, 2020.
22%
49%
15%
6%
5%
25%
9
Other

Copyright 2020 ChampionX. All rights reserved.
Artificial Lift Product Offering
XSPOC™ Production Optimization Software Tools
Other 2
23% of Sales1
Electrical Submersible
Pump (ESP)
35% of Sales1
Gas Lift &
Hydraulic Lift
8% of Sales1
Rod Lift
35% of Sales1
10
Smarten™ Hardware (RTU/Controllers)
Managing the Life Cycle of the Well
FY’20
Artificial Lift
Revenue
$491mm
Illustrative Well Production and Optimal Form of Artificial Lift Progression
Primary ESP Secondary ESP
Gas Lift
Rod Lift
Plunger Lift
Time
Note: May not foot due to rounding.1 Represents % of FY 2020 worldwide artificial lift product revenue.2 Other includes PCP and plunger lift.
Flo
w R
ate
(b
bls
/d)
1 0
Copyright 2020 ChampionX. All rights reserved.
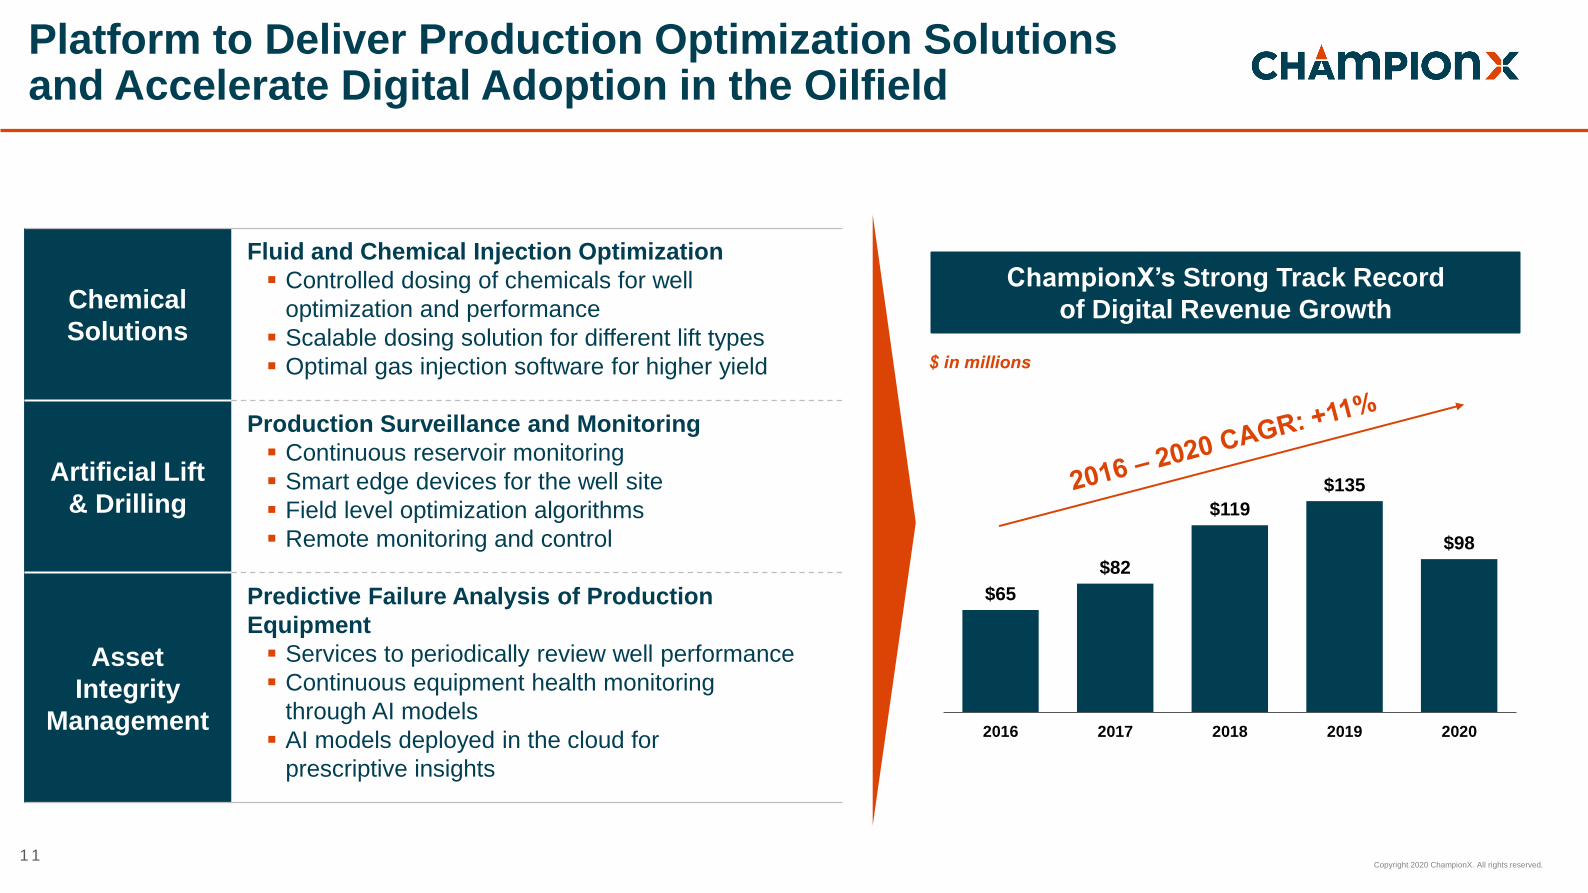
Platform to Deliver Production Optimization Solutions and Accelerate Digital Adoption in the Oilfield
Chemical
Solutions
Fluid and Chemical Injection Optimization
▪ Controlled dosing of chemicals for well
optimization and performance
▪ Scalable dosing solution for different lift types
▪ Optimal gas injection software for higher yield
Artificial Lift
& Drilling
Production Surveillance and Monitoring
▪ Continuous reservoir monitoring
▪ Smart edge devices for the well site
▪ Field level optimization algorithms
▪ Remote monitoring and control
Asset
Integrity
Management
Predictive Failure Analysis of Production
Equipment
▪ Services to periodically review well performance
▪ Continuous equipment health monitoring
through AI models
▪ AI models deployed in the cloud for
prescriptive insights
$65
$82
$119
$135
$98
2016 2017 2018 2019 2020
ChampionX’s Strong Track Record
of Digital Revenue Growth
1 1
Copyright 2020 ChampionX. All rights reserved.
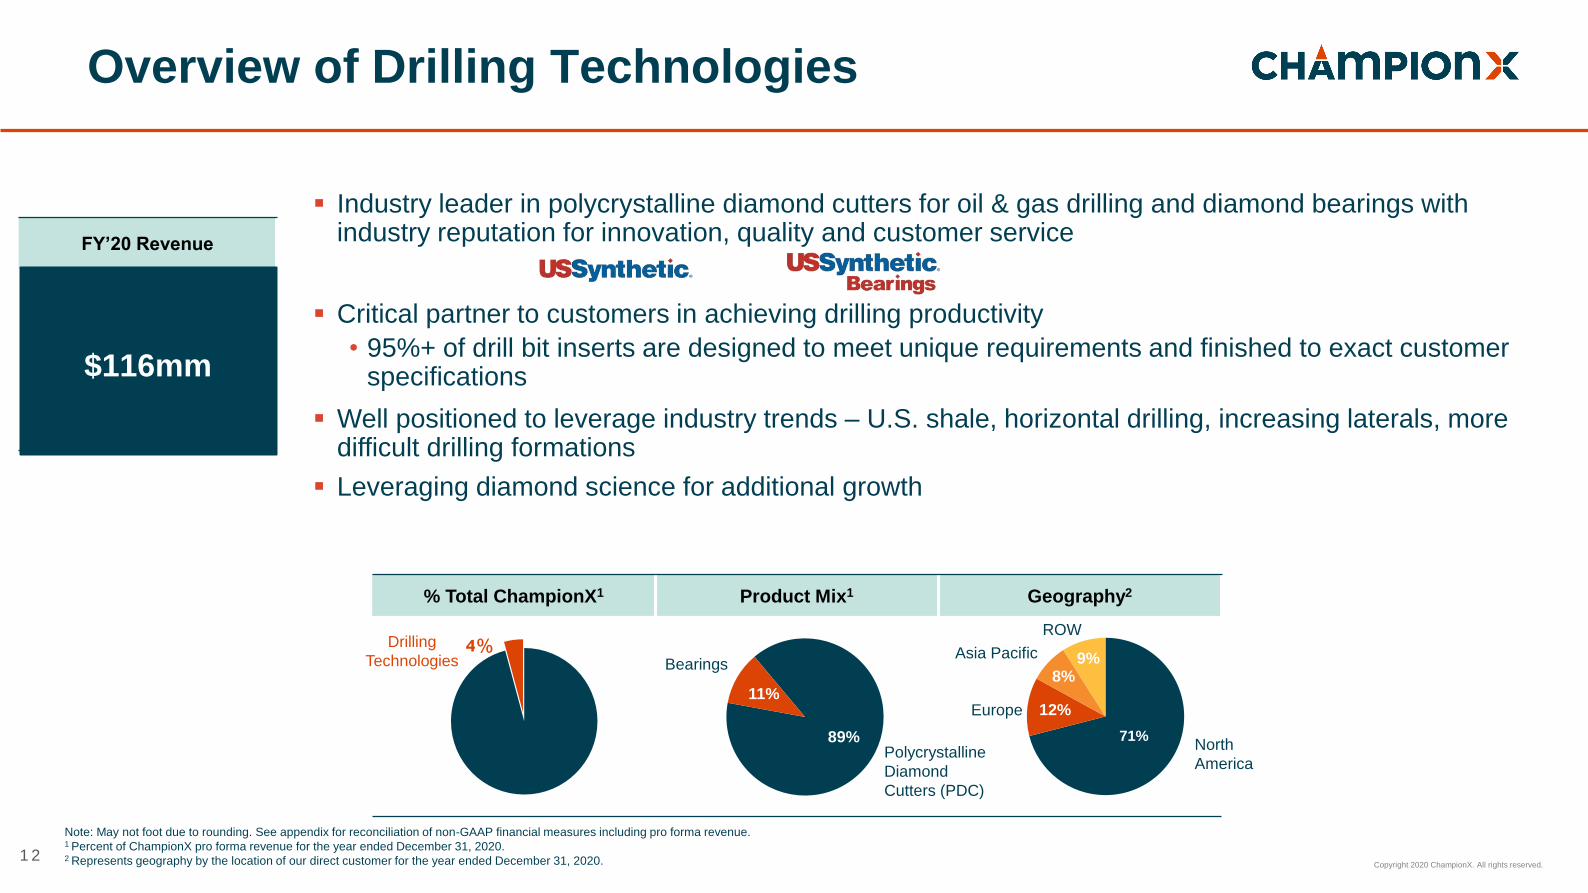
4%
1 2
Overview of Drilling Technologies
% Total ChampionX1 Product Mix1 Geography2
FY’20 Revenue
12
▪ Industry leader in polycrystalline diamond cutters for oil & gas drilling and diamond bearings with industry reputation for innovation, quality and customer service
▪ Critical partner to customers in achieving drilling productivity
• 95%+ of drill bit inserts are designed to meet unique requirements and finished to exact customer specifications
▪ Well positioned to leverage industry trends – U.S. shale, horizontal drilling, increasing laterals, more difficult drilling formations
▪ Leveraging diamond science for additional growth
71%
12%
8% 9%
North
America
ROW
Asia Pacific
Europe
89%
11%
Polycrystalline
Diamond
Cutters (PDC)
Note: May not foot due to rounding. See appendix for reconciliation of non-GAAP financial measures including pro forma revenue.1 Percent of ChampionX pro forma revenue for the year ended December 31, 2020. 2 Represents geography by the location of our direct customer for the year ended December 31, 2020.
Drilling
Technologies
$116mm
Bearings
1 2

Copyright 2020 ChampionX. All rights reserved.
Diamond Bearings
▪ Diamond bearings in downhole tools is a fast-growing
product line, which:
▪ Provides higher load capability
▪ Allows designs with seals, less prone to failure
▪ Longer life with lower repair cost
0
10
20
30
40
50
2015 2016 2017 2018 2019 2020
$ m
illi
on
1 3
Product Overview: Polycrystalline Diamond
Drill Bit Inserts & Bearings
Polycrystalline Diamond Drill Bit Inserts
▪ State of the art custom designed and manufactured drill bit
inserts
▪ Proprietary technology driven by constant innovation
▪ Uncompromising commitment to outstanding quality and
superior customer service
Drill Bit Inserts
Drill Bit
Diamond Bearings Revenue Trend
1 3
Copyright 2020 ChampionX. All rights reserved.
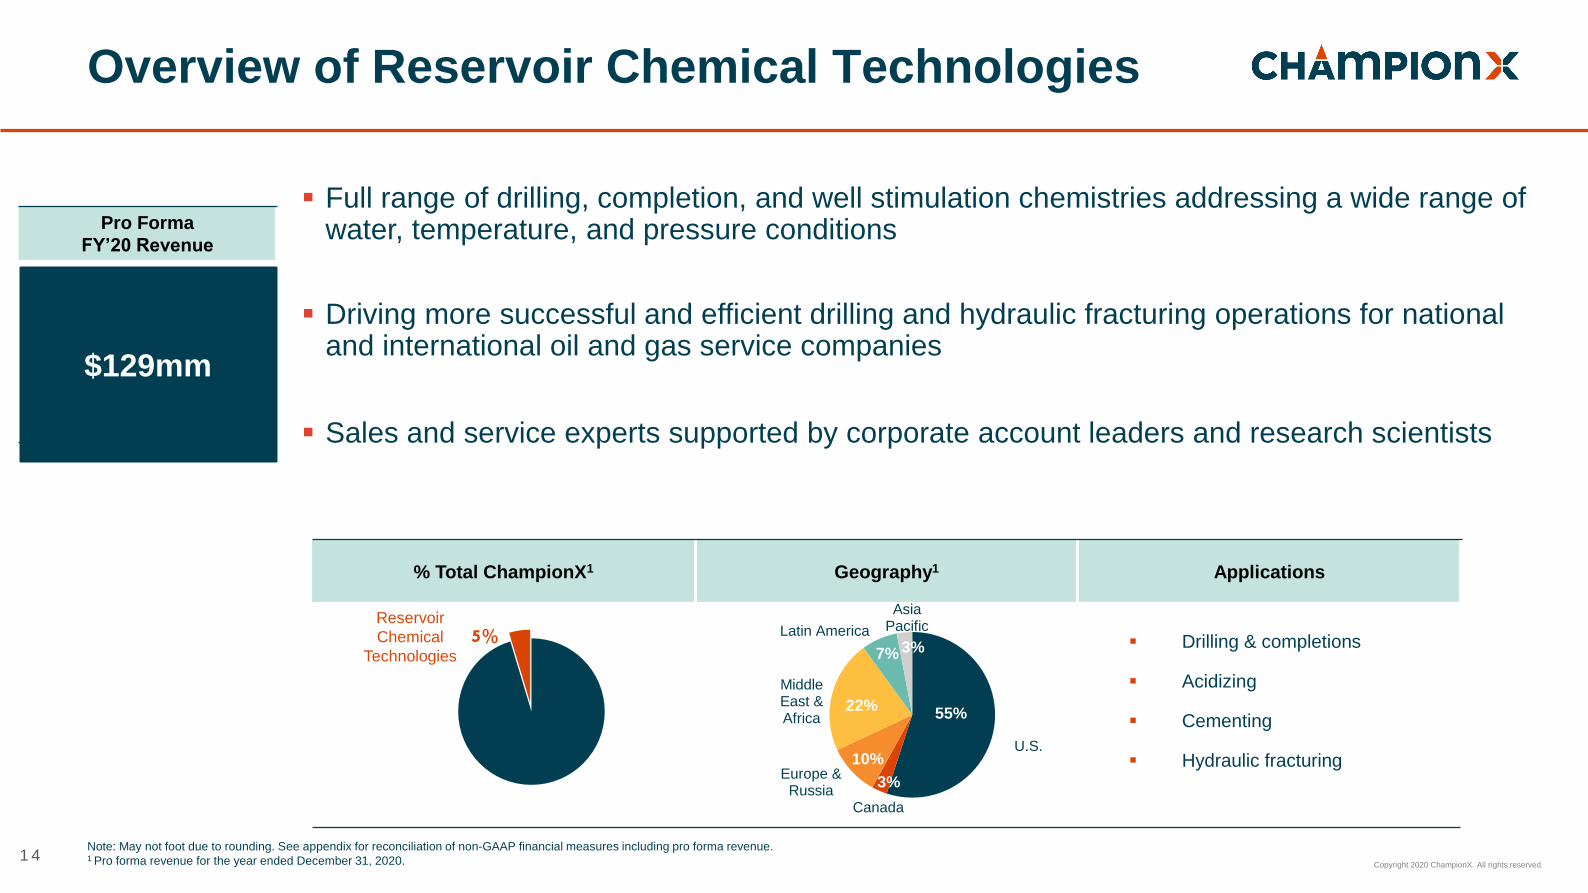
5%
1 4
Overview of Reservoir Chemical Technologies
% Total ChampionX1 Geography1 Applications
Pro Forma
FY’20 Revenue
14
▪ Full range of drilling, completion, and well stimulation chemistries addressing a wide range of water, temperature, and pressure conditions
▪ Driving more successful and efficient drilling and hydraulic fracturing operations for national and international oil and gas service companies
▪ Sales and service experts supported by corporate account leaders and research scientists
Note: May not foot due to rounding. See appendix for reconciliation of non-GAAP financial measures including pro forma revenue.1 Pro forma revenue for the year ended December 31, 2020.
Reservoir
Chemical
Technologies
$129mm
U.S.
Canada
Europe & Russia
Middle East & Africa
Latin America
Asia Pacific
55%
3%
10%
22%
7% 3% ▪ Drilling & completions
▪ Acidizing
▪ Cementing
▪ Hydraulic fracturing
1 4

Copyright 2020 ChampionX. All rights reserved. 1 5
Integration & Synergy Capture Status
Cost Synergy Annualized Run-Rate Tracker
$25M
$50M
$75M
$100M
$125M
Cost Synergies
▪ Cost synergies execution is on track
▪ Expect to achieve the increased cost synergies of $125 million within 24
months of closing, including corporate cost avoidance, as well as functional
savings opportunities and cost of goods sold efficiencies
▪ Separation from Ecolab is tracking ahead of schedule
Revenue Synergies
▪ Continued progress on North America Joint Sell, Digital and International
Artificial Lift Expansion growth opportunities
▪ Within our Production & Automation Technologies segment, we are seeing
early momentum and revenue uplift from Better Together joint sales efforts,
including recent wins in the Permian and Latin America regions
▪ Encouraging progress in expanding the portfolio of digitally-enabled products
(e.g., smart skids) as digital pilot trials are underway with three customers
Q3 exit
run-rate
Q2 exit
run-rate
Q4 exit
run-rate

Copyright 2020 ChampionX. All rights reserved. 1 6
Strong Financial Position$161MM Debt Reduction Since Merger Date; Focused on Glide Path to ~1.0x Leverage
Note: See the appendix of this investor presentation for reconciliation of non-GAAP financial measures including adjusted EBITDA, pro forma adjusted EBITDA, free
cash flow and adjusted free cash flow.
Capital Allocation Priorities
▪ Organic Growth Investments
▪ Critical R&D, Digital and Innovation Projects --- ~2% of Revenues
▪ Continued Debt Reduction
▪ Selective, Bolt-On Technology Acquisitions
Copyright 2020 ChampionX. All rights reserved. 1 7
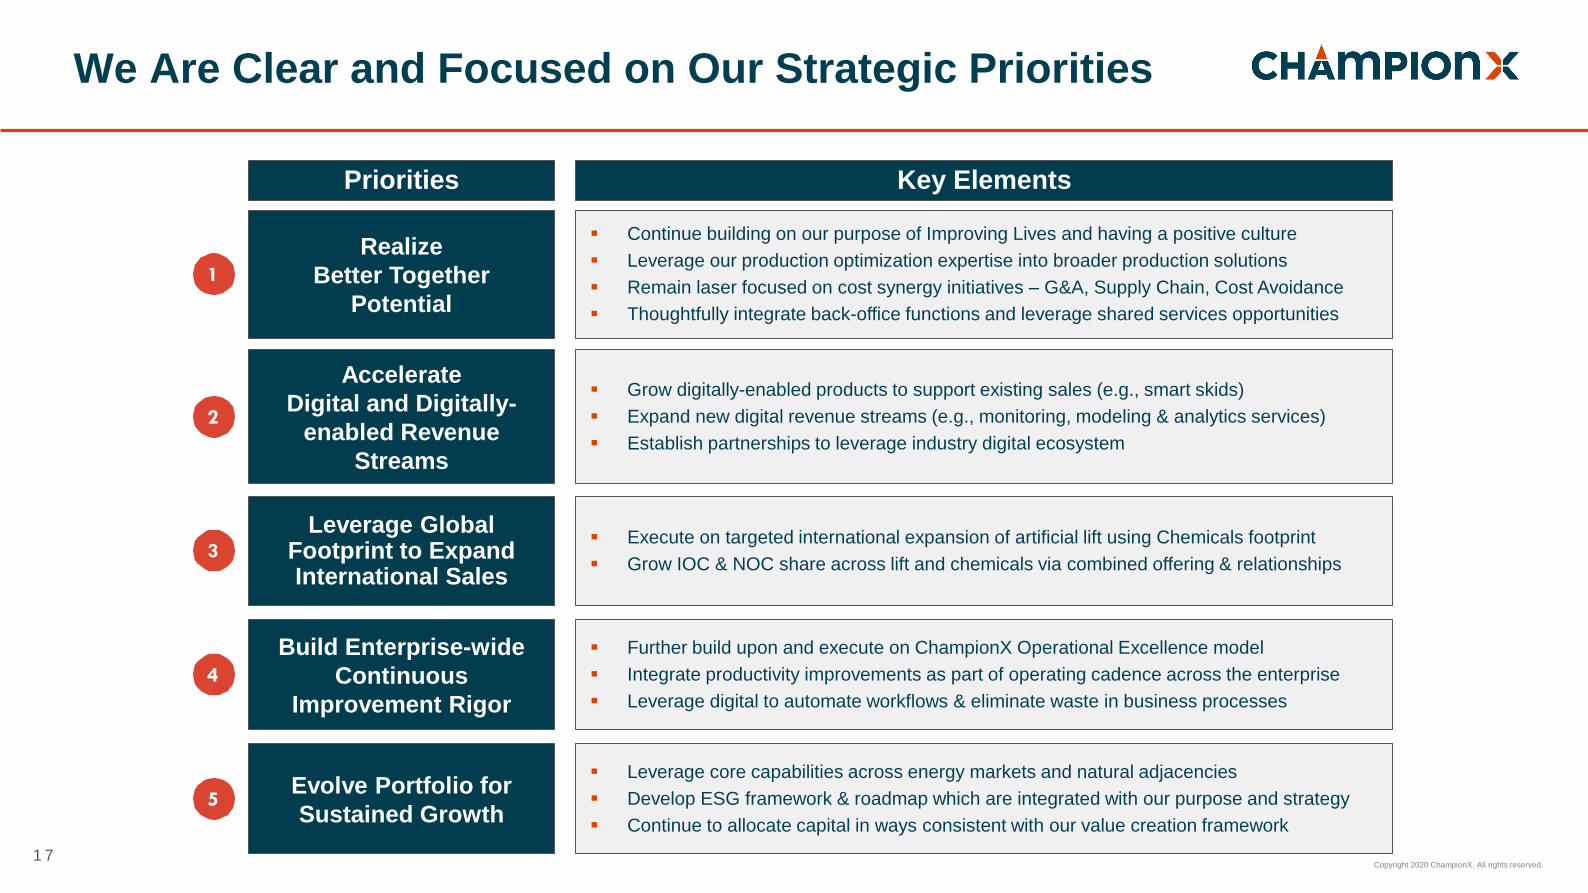
We Are Clear and Focused on Our Strategic Priorities
Realize
Better Together
Potential
Accelerate
Digital and Digitally-
enabled Revenue
Streams
Leverage Global Footprint to Expand International Sales
Build Enterprise-wide
Continuous
Improvement Rigor
▪ Grow digitally-enabled products to support existing sales (e.g., smart skids)
▪ Expand new digital revenue streams (e.g., monitoring, modeling & analytics services)
▪ Establish partnerships to leverage industry digital ecosystem
▪ Execute on targeted international expansion of artificial lift using Chemicals footprint
▪ Grow IOC & NOC share across lift and chemicals via combined offering & relationships
▪ Further build upon and execute on ChampionX Operational Excellence model
▪ Integrate productivity improvements as part of operating cadence across the enterprise
▪ Leverage digital to automate workflows & eliminate waste in business processes
Priorities Key Elements
▪ Continue building on our purpose of Improving Lives and having a positive culture
▪ Leverage our production optimization expertise into broader production solutions
▪ Remain laser focused on cost synergy initiatives – G&A, Supply Chain, Cost Avoidance
▪ Thoughtfully integrate back-office functions and leverage shared services opportunities
1
2
3
4
Evolve Portfolio for
Sustained Growth
▪ Leverage core capabilities across energy markets and natural adjacencies
▪ Develop ESG framework & roadmap which are integrated with our purpose and strategy
▪ Continue to allocate capital in ways consistent with our value creation framework
5
Copyright 2020 ChampionX. All rights reserved.
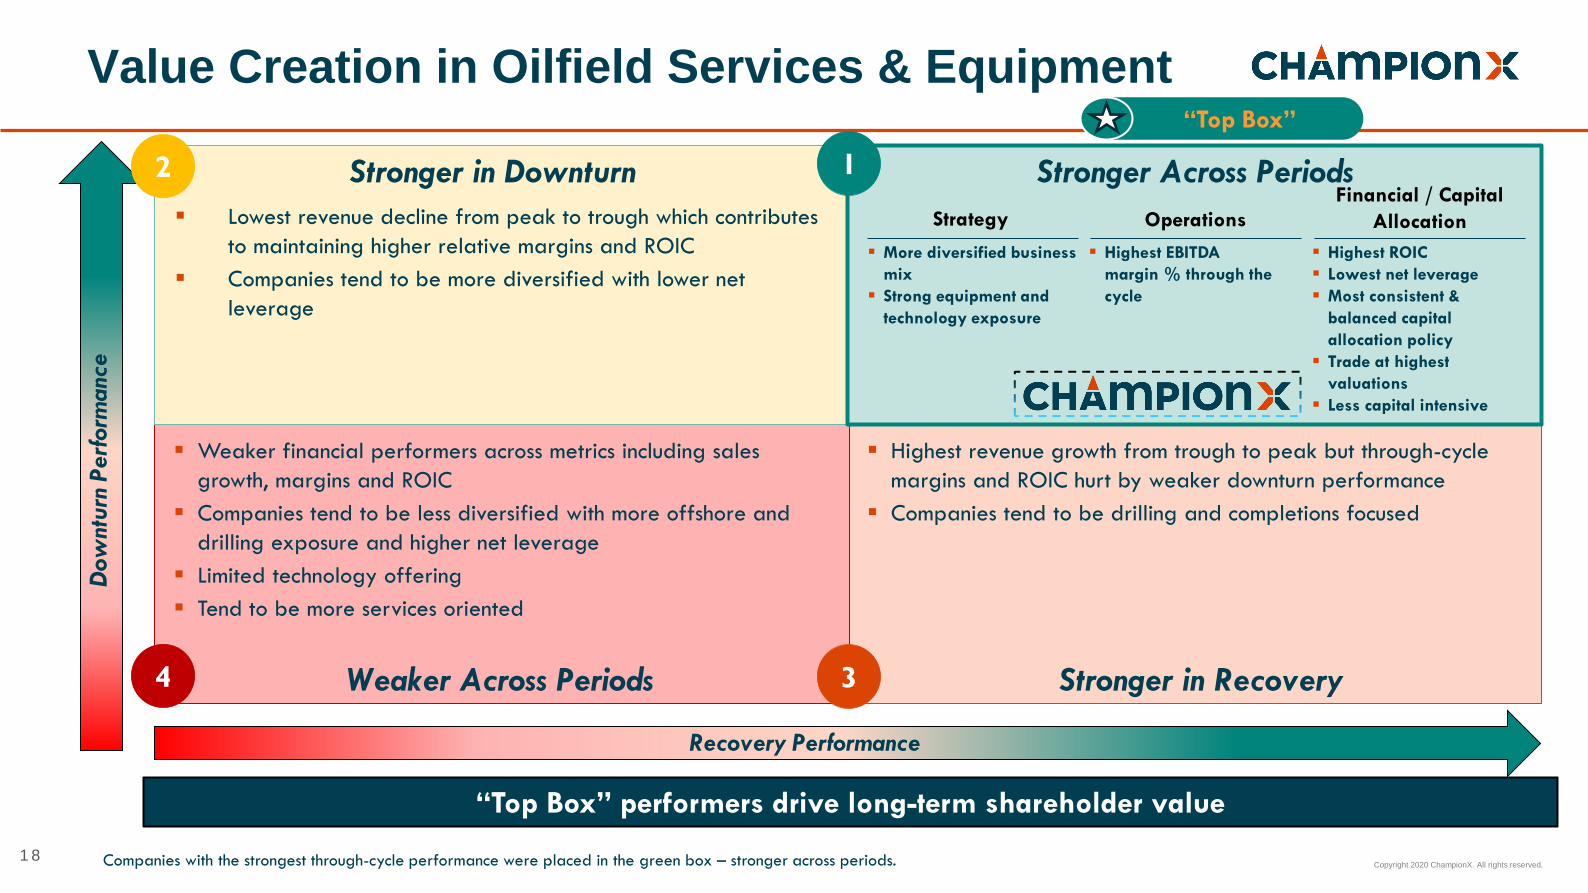
Stronger in Downturn Stronger Across Periods
Stronger in Recovery Weaker Across Periods
Dow
nturn
Perf
orm
anc
e
Recovery Performance
1 8
▪ Lowest revenue decline from peak to trough which contributes
to maintaining higher relative margins and ROIC
▪ Companies tend to be more diversified with lower net
leverage
Value Creation in Oilfield Services & Equipment
“Top Box” performers drive long-term shareholder value
▪ More diversified business
mix
▪ Strong equipment and
technology exposure
Companies with the strongest through-cycle performance were placed in the green box – stronger across periods.
Strategy Operations
Financial / Capital
Allocation
▪ Highest EBITDA
margin % through the
cycle
▪ Highest ROIC
▪ Lowest net leverage
▪ Most consistent &
balanced capital
allocation policy
▪ Trade at highest
valuations
▪ Less capital intensive
▪ Highest revenue growth from trough to peak but through-cycle
margins and ROIC hurt by weaker downturn performance
▪ Companies tend to be drilling and completions focused
▪ Weaker financial performers across metrics including sales
growth, margins and ROIC
▪ Companies tend to be less diversified with more offshore and
drilling exposure and higher net leverage
▪ Limited technology offering
▪ Tend to be more services oriented
“Top Box”
12
34
1 8

Copyright 2020 ChampionX. All rights reserved. 1 9
ChampionX’s Value Creation Algorithm
Revenue Growth Capital AllocationMargin Performance
✓ Focus on stable revenue
growth from a diversified
and differentiated product
portfolio
✓ Continue business mix
toward production; with
selected exposure to
drilling and completions
where we can win
✓ Maintain high margins
from product differentiation
& value delivered to
customers
✓ Leverage innovation to
deliver products and
services that solve
customers’ most critical
needs
✓ Continue productivity rigor
✓ After initial de-leveraging,
adopt a consistent &
balanced return-focused
capital allocation policy,
including return of cash to
shareholders
✓ Disciplined organic
investment plus M&A
approach which maintains
“top box” performance
+ +
1 2 3
Consistent with “Top Box” Characteristics
1 9
Copyright 2020 ChampionX. All rights reserved. 2 0
Appendix
Copyright 2020 ChampionX. All rights reserved. 2 1
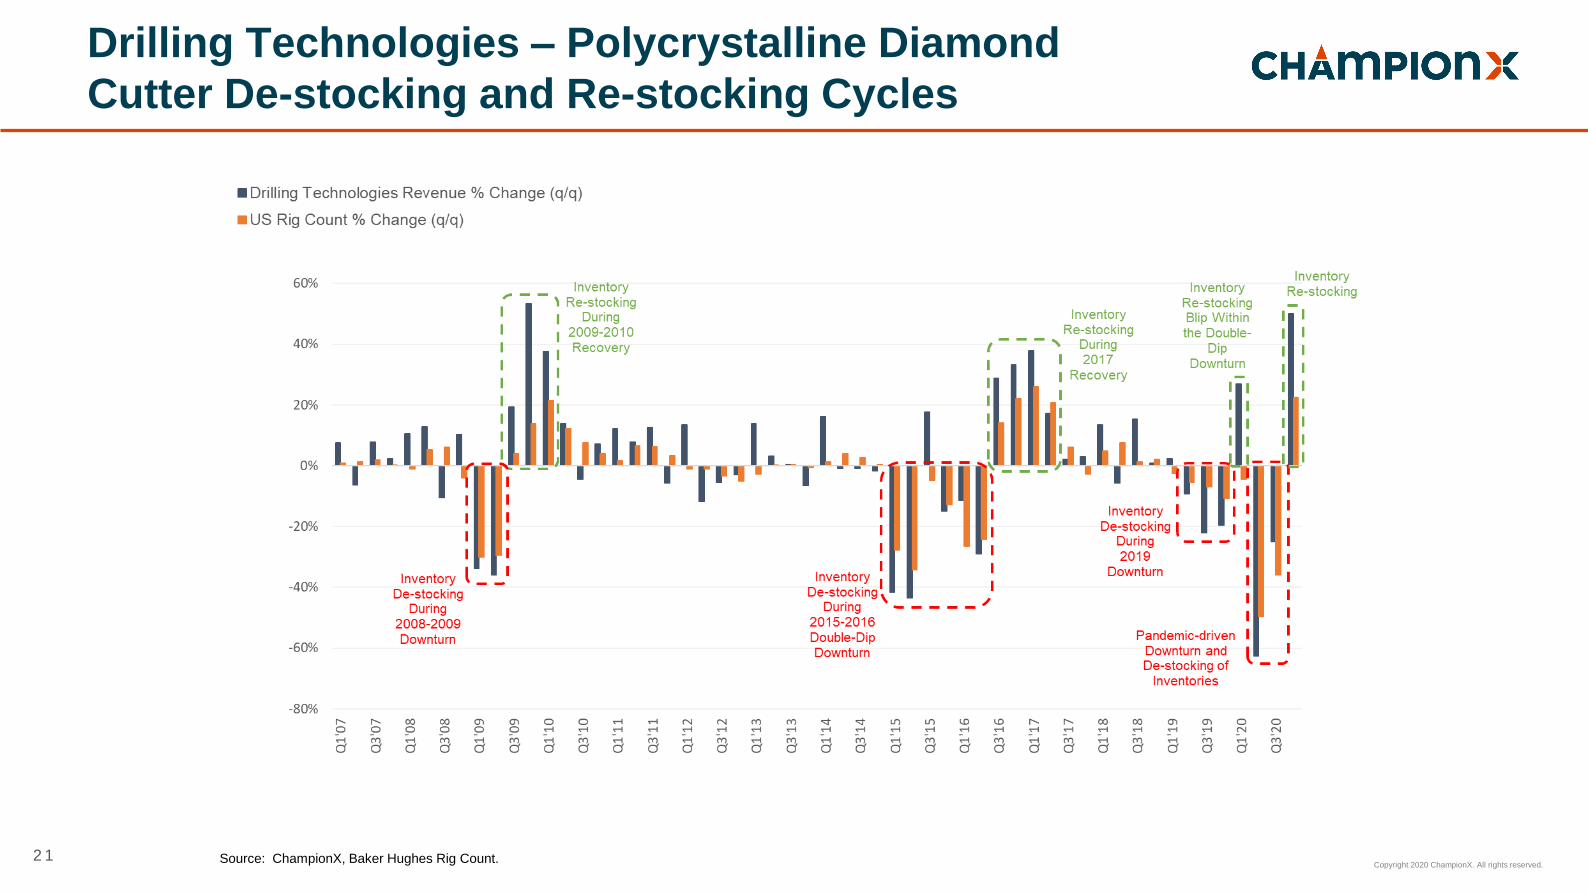
Drilling Technologies – Polycrystalline Diamond
Cutter De-stocking and Re-stocking Cycles
Source: ChampionX, Baker Hughes Rig Count.
Copyright 2020 ChampionX. All rights reserved. 2 2
Reconciliations of Non-GAAP Measures
Copyright 2020 ChampionX. All rights reserved. 2 3
Notices & Disclaimers
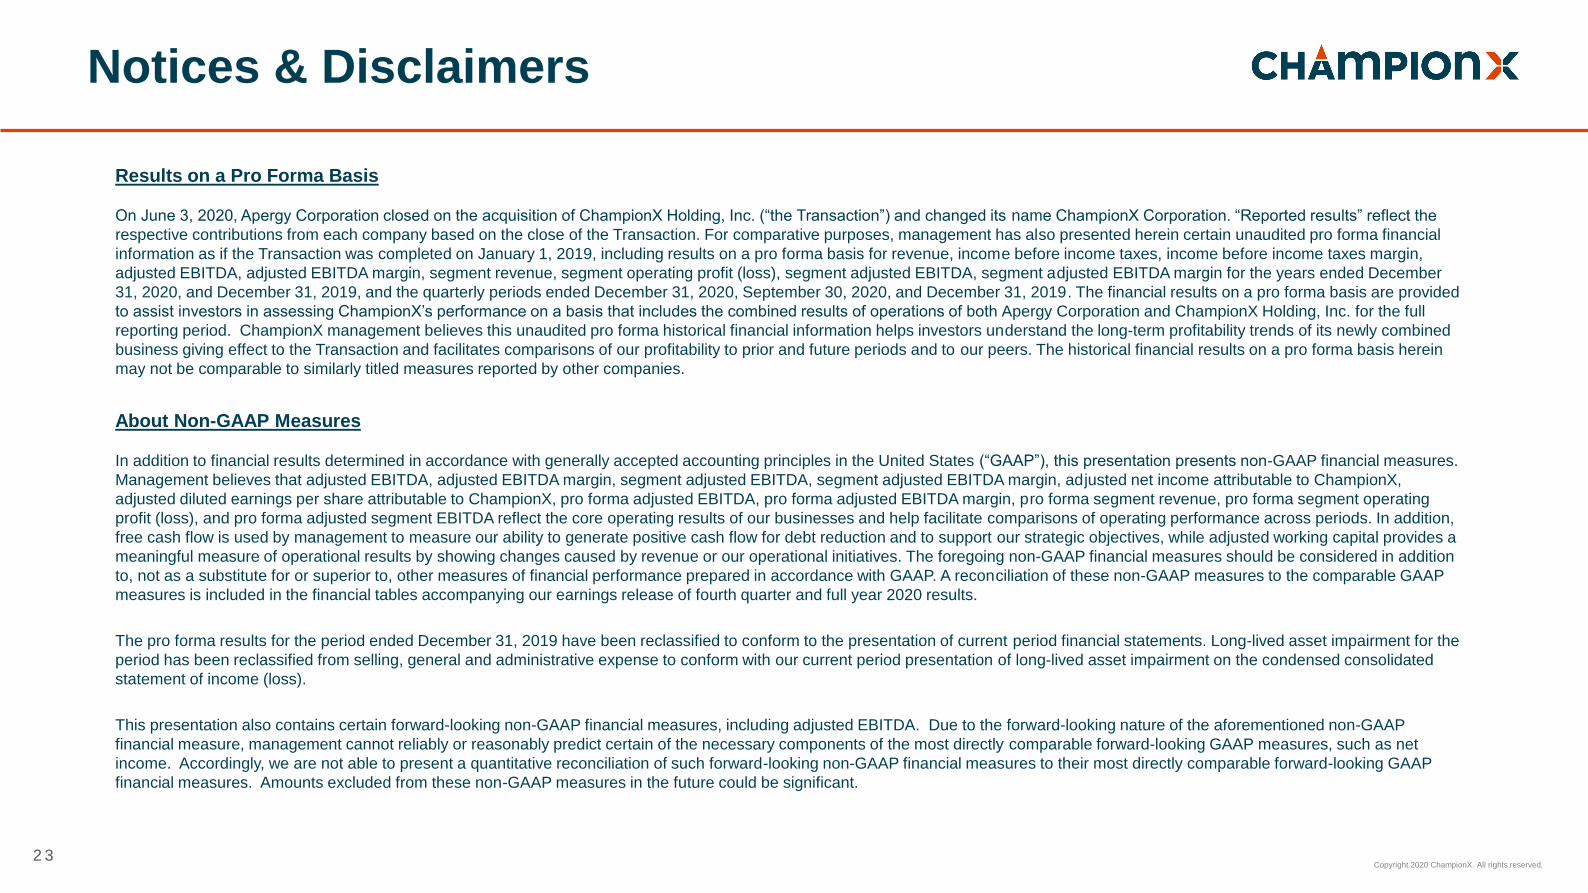
Results on a Pro Forma Basis
On June 3, 2020, Apergy Corporation closed on the acquisition of ChampionX Holding, Inc. (“the Transaction”) and changed its name ChampionX Corporation. “Reported results” reflect the
respective contributions from each company based on the close of the Transaction. For comparative purposes, management has also presented herein certain unaudited pro forma financial
information as if the Transaction was completed on January 1, 2019, including results on a pro forma basis for revenue, income before income taxes, income before income taxes margin,
adjusted EBITDA, adjusted EBITDA margin, segment revenue, segment operating profit (loss), segment adjusted EBITDA, segment adjusted EBITDA margin for the years ended December
31, 2020, and December 31, 2019, and the quarterly periods ended December 31, 2020, September 30, 2020, and December 31, 2019. The financial results on a pro forma basis are provided
to assist investors in assessing ChampionX’s performance on a basis that includes the combined results of operations of both Apergy Corporation and ChampionX Holding, Inc. for the full
reporting period. ChampionX management believes this unaudited pro forma historical financial information helps investors understand the long-term profitability trends of its newly combined
business giving effect to the Transaction and facilitates comparisons of our profitability to prior and future periods and to our peers. The historical financial results on a pro forma basis herein
may not be comparable to similarly titled measures reported by other companies.
About Non-GAAP Measures
In addition to financial results determined in accordance with generally accepted accounting principles in the United States (“GAAP”), this presentation presents non-GAAP financial measures.
Management believes that adjusted EBITDA, adjusted EBITDA margin, segment adjusted EBITDA, segment adjusted EBITDA margin, adjusted net income attributable to ChampionX,
adjusted diluted earnings per share attributable to ChampionX, pro forma adjusted EBITDA, pro forma adjusted EBITDA margin, pro forma segment revenue, pro forma segment operating
profit (loss), and pro forma adjusted segment EBITDA reflect the core operating results of our businesses and help facilitate comparisons of operating performance across periods. In addition,
free cash flow is used by management to measure our ability to generate positive cash flow for debt reduction and to support our strategic objectives, while adjusted working capital provides a
meaningful measure of operational results by showing changes caused by revenue or our operational initiatives. The foregoing non-GAAP financial measures should be considered in addition
to, not as a substitute for or superior to, other measures of financial performance prepared in accordance with GAAP. A reconciliation of these non-GAAP measures to the comparable GAAP
measures is included in the financial tables accompanying our earnings release of fourth quarter and full year 2020 results.
The pro forma results for the period ended December 31, 2019 have been reclassified to conform to the presentation of current period financial statements. Long-lived asset impairment for the
period has been reclassified from selling, general and administrative expense to conform with our current period presentation of long-lived asset impairment on the condensed consolidated
statement of income (loss).
This presentation also contains certain forward-looking non-GAAP financial measures, including adjusted EBITDA. Due to the forward-looking nature of the aforementioned non-GAAP
financial measure, management cannot reliably or reasonably predict certain of the necessary components of the most directly comparable forward-looking GAAP measures, such as net
income. Accordingly, we are not able to present a quantitative reconciliation of such forward-looking non-GAAP financial measures to their most directly comparable forward-looking GAAP
financial measures. Amounts excluded from these non-GAAP measures in the future could be significant.
Copyright 2020 ChampionX. All rights reserved. 2 4
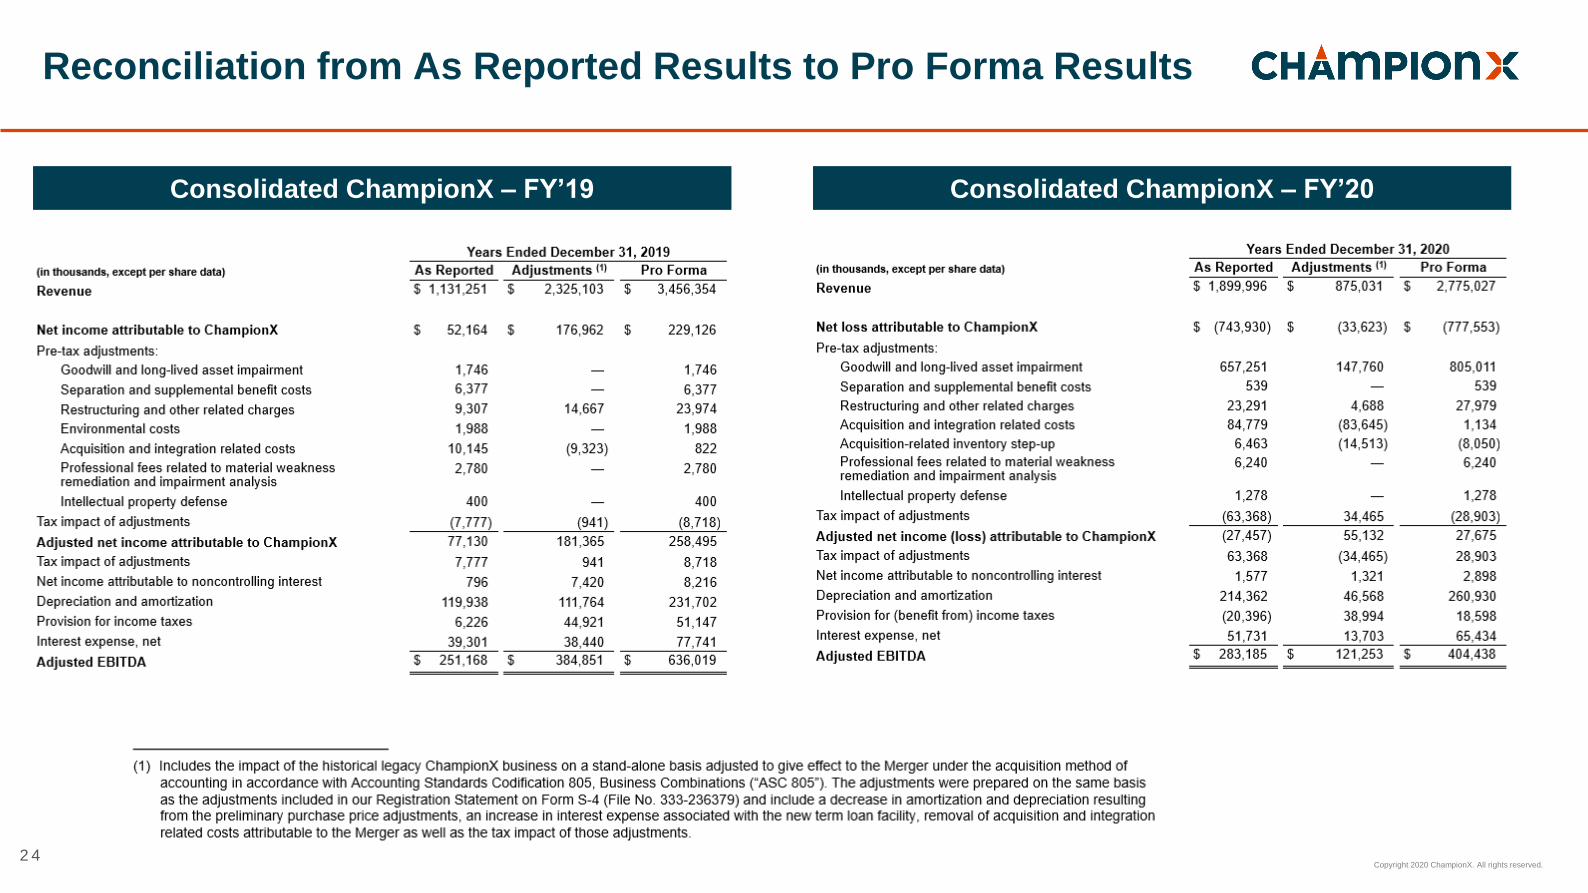
Reconciliation from As Reported Results to Pro Forma Results
2 4
Consolidated ChampionX – FY’19 Consolidated ChampionX – FY’20

Copyright 2020 ChampionX. All rights reserved. 2 5
Reconciliation from As Reported Results to Pro Forma Results
2 5
Consolidated ChampionX – Q3’20 Consolidated ChampionX – Q4’20
Copyright 2020 ChampionX. All rights reserved. 2 6
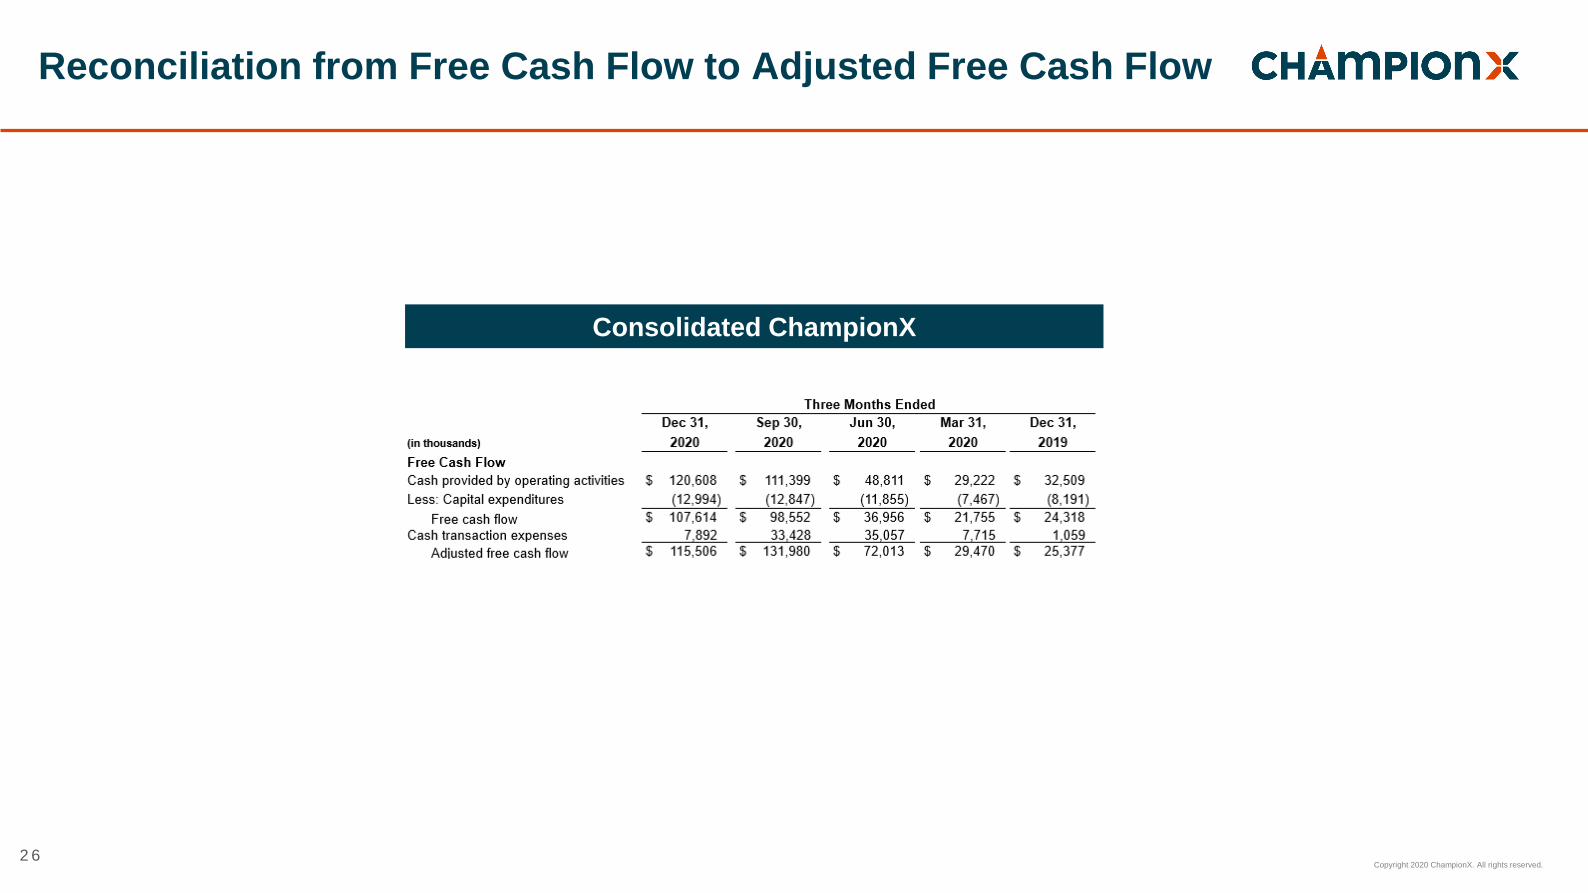
Reconciliation from Free Cash Flow to Adjusted Free Cash Flow
2 6
Consolidated ChampionX