Embed Size (px)
DESCRIPTION
ww
Citation preview

11th Americas Conference on Wind Engineering, San Juan, PR, USAJune 22-26, 2009
Wind Loading Codification in the Americas: Fundamentals for a Renewal
Emil Simiu1
1NIST Fellow, Building and Fire Research Laboratory, National Institute of Standards andTechnology, Gaithersburg, Maryland, USA,
Distinguished Research Professor, International Hurricane Research Center and Department ofCivil and Environmental Engineering, Florida International University, Miami, Florida, USA
ABSTRACT
A survey of current wind engineering practices and their reflection in codes and standardsreveals the existence of areas in which substantial progress needs to be made and is nowpossible. These areas belong to micrometerology, wind climatology, aerodynamics laboratorytesting, structural dynamics, aeroelasticity, statistics, structural reliability, multi-hazard design,wind effects estimation practice, and the standards development process from the points of viewof both form and substance. In particular, low-rise building aerodynamics need seriousattention, since both design and loss estimation are likely being seriously affected by theincorporation in the ASCE 7 Standard of test results that can differ significantly – in certaininstances by factors larger than two -- from actual values. It is pointed out that wind effects ontall buildings must be estimated by correctly accounting for wind directionality, one of the mainfactors that caused large differences between recent wind tunnel test results obtained byindependent wind engineering laboratories. Progress in terms of transparency and publicavailability of test and wind effects estimation records is also necessary to allow clearunderstanding by structural engineers, independent scrutiny, public accountability, and adefensible basis for wind engineering laboratory certification.
1. INTRODUCTION
This talk is motivated by the belief that it is useful to take a fresh look at our field and itsevolution in the last half-century, and re-examine some of its assumptions, results, andtechniques. This is in our opinion justified by recent findings according to which the state of theart in wind engineering, as reflected in codes, standards, and professional practice, hasshortcomings that need careful consideration and constructive debate. While not seeking to beexhaustive, we will attempt in this talk to provide the motivation for research, development, andactions that we believe are needed to markedly improve the basis for and the process of windloading codification. A vast and concerted research effort has achieved remarkable results in thefield of earthquake engineering. It is in our opinion high time for an effort of similar scope in ourfield, with a view to designing or retrofitting structures that better conform to the physics ofwind-structure interaction and satisfy more rational structural performance demands in a moreeconomical manner than is now the case, -- an effort that will help to achieve a more resilientbuilt environment under wind loads.
We start with a brief historical survey. Denmark’s Irminger is probably among the firstscientists or engineers to have produced experimental estimates of wind pressures on buildings.In praise of his achievements an American structural engineer wrote: “In 1894 J. O.V. Irminger,manager of the Copenhagen Gas Works, made a number of experiments on wind pressure... Theconclusion he drew was that if his experiments on models represent the facts with regard to

11th Americas Conference on Wind Engineering, San Juan, PR, USAJune 22-26, 2009
buildings, the methods with which roofs are commonly calculated for wind pressure needrevision. An enthusiastic admirer of Irminger wrote: ‘It will be due to him that we surely in thefuture shall save tons of materials in our roofs’ ” [1].
However, as has been known for some time, Irminger’s was in fact not the last word. Alarge compendium of wind pressures on a wide variety of structures, produced decades later inSwitzerland on the basis of tests performed in uniform, smooth flow and reproduced in a 1961American Society of Civil Engineers (ASCE) report [2], has long been viewed as obsolete. In theearly 1930s the great Goettingen aerodynamicist Ludwig Prandtl tasked Otto Flachsbart toperform research on building aerodynamics. Following a series of papers on trusses and othertypes of structure, in 1932 Flachsbart produced an internal report on the significant differencesbetween pressures on low-rise buildings in smooth flow on the one hand and shear flow on theother [3]. The report was not followed up by a journal paper because Flachsbart, having refusedto divorce his Jewish wife -- a punishable offense under Nazi rules, -- was no longer allowed topublish. So the sea change that Flachsbart’s finding could have been expected to produce in windengineering did not come to pass. Excerpts from his report, re-discovered in the library of theNational Bureau of Standards, became widely known only after their 1986 publication in [4].
In the 1950s Jensen – again in Denmark – performed tests on a small model of a houseand reached, independently, conclusions similar to Flachsbart’s. At about the same time Alan G.Davenport, a Bristol University graduate student working under Professor Sir Alfred Pugsley,applied the Liepmann [5] spectral approach to the calculation of turbulence-induced structuralresponse to the dynamic loading of line-like structures immersed in an atmospheric boundarylayer [6]. Davenport also used probabilistic and statistical procedures for estimating extremewind speeds developed by Gumbel. The wind flow was described micrometeorologically byimproving upon the Pagon [7] model of mean wind speed profiles, used in conjunction withmodels of the atmospheric boundary layer depth and models proposed by Davenport for thespectral and cross-spectral density of the longitudinal turbulent velocity fluctuations. Thisbeautiful synthesis started a new era in wind engineering, in which aerodynamic testing ofstructures was typically no longer conducted in aeronautical wind tunnels, but rather in shear,turbulent flows produced in so-called boundary layer wind tunnels. Most wind-tunnel testing inthose facilities was concerned with tall buildings and long-span bridges. However, from the late1970s on boundary-layer wind tunnels were also used for the aerodynamic testing of low-risebuildings, for which new wind loading provisions were introduced in the ASCE 7 Standard [8](hereinafter ASCE 7).
This very brief historical survey provides a framework for considering the question askedat the beginning of this talk. Is it appropriate, half a century after Jensen’s and Davenport’sseminal work, to proceed to a fundamental re-examination of current assumptions andtechniques? We will consider this question within the context of codification, with specificreference to ASCE 7. We will stress the need to document transparently wind engineeringprocedures and results, thus enabling effective scrutiny and accountability.
In the following sections we assess selected elements of the wind effects estimationprocess that draw on the following inter-related areas: micrometeorology, wind climatology,aerodynamics, structural dynamics, interfacing of directional wind climate and directionalaerodynamics/structural dynamics, aeroelasticity, statistics, structural reliability, multi-hazarddesign, wind effects estimation, and standards development. We will do so in a manner thatemphasizes the relevance of these areas to specific provisions in the ASCE 7 Standard. Webelieve our assessment and critique can stimulate fruitful discussions and help to put to good usethe experience and knowledge accumulated to date, while leading to a renewal of our field, thatis, to the development and/or adoption of improved technical approaches, and to fundamental
11th Americas Conference on Wind Engineering, San Juan, PR, USAJune 22-26, 2009
advances in codification in terms of both form and substance. Our concluding section willsummarize topics that, in our opinion, require consideration in the years to come, with a view toproviding the wind and structural engineering communities with standards and tools superior totheir existing counterparts.
2. MICROMETEOROLOGY
2.1 WIND SPEED PROFILES: LOGARITHMIC LAW VERSUS THE POWER LAW. VEERING ANGLE
Standards and codes, and wind tunnel practice, incorporate explicitly or implicitly models of thevariation of wind speed with height. Following Pagon’s work [6] such models were already usedin U.S. codes in the 1950s.
Unlike the Eurocode [9] and the Australian/New Zealand Standard [10], which use thelogarithmic law description of the wind profile, ASCE 7 uses the power law. One justificationfor this choice was the belief that the logarithmic law, now universally used inmicrometeorology, is valid only up to a 50 m-100 m height above the surface. Fluid mechanicstheory showed that for strong winds the logarithmic law is in fact valid up to hundreds of metersabove the surface [11, 12]. Experimental evidence confirming this finding was reported in [13].Nevertheless, that belief proved to have a long life, and a statement reflecting it was incorporatedinto a draft U.S. standard as late as 2006. A second justification, which was claimed to berelevant in the slide-rule era, was that power law calculations were easier to perform thancalculations based on the logarithmic. Finally, owing to the use of flow management devicessuch as, e.g., spires, which are invariably present even in the most modern wind tunnels for civilengineering applications, wind profiles achieved in the laboratory are not logarithmic. They canbe described, however, by the power law. If it is assumed that atmospheric flows are similar towind tunnel flows it follows that the power law holds not only in wind tunnels but in theatmosphere as well. (It should be remembered, however, that it is not the atmosphere thatattempts to mimic the wind tunnel, but the other way around.)
While it can legitimately be argued that the power law is reasonably adequate forpractical design purposes, it is rarely employed by professional micrometeorologists. Advancesin micrometeorology that wind engineers commonly draw on (e.g., advances on the structure ofwind in regions close to surface roughness changes, or on the description of turbulence intensityand spectra) are reported in terms of logarithmic law parameters, and their translation into powerlaw terms introduces unnecessary errors and inconsistencies. It is for this reason that thelogarithmic law has crept its way into parts of ASCE 7, probably the only standard that describeswind profiles in terms of the power law for some applications and of the logarithmic law forothers. Eliminating this inconsistency from future, modernized versions of ASCE 7 would helpinteractions between wind engineering and micrometerology, and render the standard cleaner andmore internally consistent. For a document that has been widely criticized for not beingsufficiently clear and user-friendly this may be a worthwhile goal.
Data on the variation of the veering angle of the mean speed with height above thesurface are scarce and preliminary, see [14, p. 15].
2.2 SUSTAINED WIND SPEEDS VERSUS 3-S PEAK GUSTS
ASCE 7 provisions are based on the use of 3-s peak wind gusts. This choice replaced fastest-milespeeds, an awkward measure of wind speeds adopted in the first half of the twentieth century onaccount of the widespread use in the U.S. of a type of measurement device that is now obsolete.Movement toward international standards appears to justify the use of 10-min mean speeds, thus

11th Americas Conference on Wind Engineering, San Juan, PR, USAJune 22-26, 2009
conforming to practice sanctioned by the World Meteorological Organization, or of otherinternationally acceptable measures of sustained wind speeds,
Perhaps equally importantly, the uncertainty in the estimation of the response to windincreases unnecessarily and fairly significantly if calculations are based on peak gust speedsinstead of on sustained wind speeds [15]. This is due to the considerable variability of the peakgust factor and is an additional reason for considering the use in future standards of sustainedwind speeds.
2.3 ATMOSPHERIC TURBULENCE: HURRICANE VS. LARGE-SCALE EXTRATROPICAL STORMS
Progress in the description of atmospheric turbulence was achieved in recent years mainly fortropical storm winds. Analyses of recent measurements yielded the result that the frequencycontent of fluctuating wind spectra, and the ratio between peak 3-s wind speeds and hourly windspeeds, are greater in tropical storms than in large-scale extratropical storms [16, 17]. This resultis relevant for design and should be incorporated into wind and structural engineering practicethrough appropriate standard provisions.
2.4 THUNDERSTORM WINDS
New standard provisions should accommodate the fact that the micrometerological structure ofthunderstorm winds, which dominate the wind climate in various U.S. regions, and the durationof strong winds in thunderstorms, differ from their counterparts in hurricanes and synopticwinds.
3. WIND CLIMATOLOGY
ASCE7-05 contains maps of basic wind speeds v. The basic wind speeds are defined by therequirement that their product by the wind load factor 1.6 yields wind speeds with a nominalmean recurrence interval (MRI) of about 720 years. For non-hurricane regions estimates of thebasic wind speeds are based on the Extreme Value Type I probabilistic model and correspond toa nominal 50-yr MRI. For hurricane-prone regions the estimates of the basic wind speeds arebased on a methodology whose basic concept was first developed in 1971 [18]; their nominalMRIs exceed 50 years and vary as a function of geographical position. The wind maps representwind speeds regardless of their direction.
In this section we briefly discuss issues related to the estimation of (a) ASCE 7 wind mapspeeds for non-hurricane regions, and (b) hurricane wind speeds; propose the use of recentlydeveloped tools for the improved estimation of wind speeds by using mixed-probabilitymodeling and newly available data; explain the rationale of and review a recently developedprocedure for augmenting wind speed data samples; and note the importance of the winddirectionality issue. The choice of the MRIs of the design wind speeds is dictated by implicitstructural reliability considerations and is discussed in a subsequent section.
3.1 NON-HURRICANE REGIONS: “SUPERSTATION” CONSTRUCTION AND MISESTIMATION OF
BASIC WIND SPEEDS
The ASCE 7 basic wind speed map was developed in 1998 [19] (for details seewww.nist.gov/wind, Section I, item 4), and is discussed in detail in by Simiu et al. [20, 21]. Toillustrate the approach used by these authors we show three maps that contain 23 stations from 5

11th Americas Conference on Wind Engineering, San Juan, PR, USAJune 22-26, 2009
states grouped into a large “superstation” (Fig. 1). The rationale for the grouping of individualstations into “superstations” is that the sample size for each station is relatively small. Bycreating a “superstation” the sample size increases, and the sampling errors correspondinglydecrease. For this rationale to be valid it is necessary that the individual stations be homogeneousmicrometeorologically and meteorologically, and should not be too close to each other so thatthe respective data be reasonably independent of each other. The estimated 50-yr speeds for the23 individual stations varied between 28 m/s (Devens, Mass. and Central Park, New York City),and 55 m/s (Milton, Mass.). Nevertheless all stations were included in a 40 m/s 50-yr wind speedzone. For numerous examples of similar discrepancies, see [20, 21]. This approach artificiallyhomogenizes the wind climate, that is, it hides differences between local wind climates, and ledto a division of all non-hurricane regions in the U.S. into two 50-yr wind speed zones: 40 m/s forall states except California, Oregon, and Washington, and 35 m/s for those three states. Theeastern political boundaries of those states coincide with the boundary between the 40 m/s and35 m/s zones in the ASCE 7 map.
The “superstation” approach has been applied in other disciplines, e.g., hydrology, and isanticipated to have a useful place in the development of a U.S. future wind map. Solid scientificmethodologies have been developed for its use, but were not employed in the work leading to thecurrent ASCE 7 wind map.
3.2 WIND SPEEDS IN HURRICANE-PRONE REGIONS
For hurricane-prone regions the wind speed data sets were obtained from Monte Carlosimulations applied to physical and probabilistic models of tropical cyclones and hurricanes(e.g., [22] and www.nist.gov/wind, for the only public domain directional hurricane wind speeddata sets for the Gulf and Atlantic coasts); [23, 24, 25]. Except for [23], in which reverse Weibulldistributions were used, the estimation of wind speeds with various MRIs was performed bythese authors non-parametrically, using order statistics and estimated storm arrival rates (fordetails see, e.g., [14, pp. 33-35].It is of interest to compare estimates of hurricane wind speeds. For four stations chosen atrandom the following speeds as estimated by various authors are listed in Table 1. Entries for[25] were obtained through division of reported 3-s peak gusts by the 1.64 ratio of 3-s peak gustto mean hourly speed approximately applicable to hurricane winds speeds [15].
Validation of 2000-yr estimates is not possible in practice, and for such estimatesmodeling errors of about 15-20 % would not be surprising given the elusive nature of someparameters (including, e.g., the Holland beta parameter, see [25]). Such errors are comparable tothe sampling errors inherent in the sample sizes available to date [26]. This suggests that seekingadditional precision in modeling of hurricane wind speeds may at some point yield diminishingreturns, since it may not lead to the significant reduction of the overall response uncertainties dueto the effect of all component uncertainties. A reliability-based approach to the development ofprobabilistically-based design criteria would make possible rational decisions on where to stop aquest for precision that, in the context of interest to structural engineers, may at some pointbecome irrelevant. Note that the comparisons of Table 1 are not complete, and that they do notdetract from the quality of the dedicated work performed to date in the hurricane wind speedestimation field, especially in [24, 25].

11th Americas Conference on Wind Engineering, San Juan, PR, USAJune 22-26, 2009
Figure 1: Locations of New Jersey, New York, Connecticut, Massachusetts, andRhode Island stations (marked as yellow lozenges) belonging to “superstation”99927 [20] (for continuation see next page).

11th Americas Conference on Wind Engineering, San Juan, PR, USAJune 22-26, 2009
Figure 2: Locations of New Jersey, New York, Connecticut, Massachusetts, and Rhode Island stations(marked as yellow lozenges) belonging to “superstation” 99927 [20] (continued).
Table 1: Hurricane wind speeds at coastline, hourly mean speeds at 10 m above open terrain, m/s1
Milestone2 200 700 1400 2300(S. of Brownsv., TX) (E. of N. Orl.) (Miami) (N. of C. Hatteras)
Batts et al. (1979)3
Whalen et al. (1996)3
Vickery, Twisdale (1995)3
Vickery et al. (2009)
34; 37; 47 32; 35; 44 36; 39; 47 30; 33; 44
35; 38; 46 33; 35; 41 36; 39; 46 31; 34; 43
30; 34; 45 34; 38; 50 35; 39; 51 29; 32; 45
30; 35; 49 33; 35; 49 35; 38; 52 25; 27; 38
1 Sets of three numbers separated by semi-colons are 50-yr; 100-yr; 2,000-yr speed, respectively.2 For milestone location see locator map [34, p. 110] or www.nist.gov/wind, Sect. I.3Hourly mean speeds [34, p. 117].
3.3 MIXED WIND SPEED DISTRIBUTIONS FOR SERVICEABILITY DESIGN CRITERIA AND FOR
EXTREME WIND ESTIMATES
For hurricane-prone regions mixed distributions are needed for the estimation of wind speedswith the relatively small MRIs relevant to serviceability design. For non-hurricane regions with
11th Americas Conference on Wind Engineering, San Juan, PR, USAJune 22-26, 2009
both thunderstorm and large-scale extratropical storm winds, mixed distributions are needed forthe improved estimation of extreme wind speeds [27-32].
In a climate with two types of wind, the probability that during the life of the structurewind speeds are smaller than a specified value v is equal to the probability that wind speeds ofthe first type, denoted by V1, are smaller than v, and winds speeds of the second type, denoted byV2, are smaller than v, that is,
Prob(V1<v, V2<v) = Prob(V1<v) Prob(V2<v). (1)
Mixed distributions of thunderstorm and large-scale extratropical storm winds were studied in[33] for future application to the development of the ASCE 7-15 Standard wind speed map.Software for extracting separate sets of data for the two types of storm from the NationalWeather Service Automated Surface Observing System (ASOS) is available onwww.nist.gov/wind
3.4 AUGMENTATION OF WIND SPEEDS DATA SETS
For rigid structures building codes use the assumption that wind effects are proportional to thesquare of the extreme wind speeds, regardless of their direction. This assumption allows theestimation of wind effects with large MRIs from probabilistic models of the extreme windspeeds. However, as will be shown later, for structures sensitive to wind directionality effects,including structures with significant dynamic response, the estimation of wind effects with largeMRIs requires the use of time series of directional wind speeds with size exceeding the length ofthe MRI of interest. For this reason it is necessary to construct synthetic directional wind speeddata sets that (1) have any specified sample size, and (2) are statistically consistent with theavailable records. The construction of synthetic wind speed data sets involves two steps. First,probabilistic models are developed for directional wind speeds, and these models are calibratedto the data. Second, the calibrated models are used to generate synthetic directional wind speedrecords. For details see [35].
4. AERODYNAMICS
Aerodynamics in civil engineering is concerned with bluff bodies, typically under high Reynoldsnumber conditions. It is based on the use of several tools: wind tunnel testing; full-scale testingin natural winds; full- or large-scale testing in high winds induced by powerful fans in facilitiesgenerically called Walls of Wind; and Computational Fluid Dynamics (CFD). We limit ourcomments on CFD to noting that it is beginning to make useful inroads in structural engineeringpractice, but cannot as yet be used as a substitute for design methods based on physical testing.
It is fitting at this point to pay tribute to University of Western Ontario (UWO)researchers who, in papers by Surry et al. [36], Ho et al. [37], and St.Pierre et al. [38], haveaddressed issues of aerodynamics testing and codification with uncompromising professionalismand integrity. They have shown, as have Fritz et al. [39] and Coffman et al. [40] and, in theirpioneering efforts as well as on professional committees, T. Stathopoulos and G. Harris, that atleast for low-rise buildings a massive effort is still needed to achieve the goal of providingstructural engineers with realistic provisions on wind-induced aerodynamic effects. To developsuch provisions two conditions must be satisfied. First, the data underlying the provisions mustbe adequate. Second, the provisions must not distort those data to an unacceptable extent.

11th Americas Conference on Wind Engineering, San Juan, PR, USAJune 22-26, 2009
4.1 AERODYNAMIC DATA UNDERLYING ASCE 7 PROVISIONS
Aerodynamic data on which ASCE 7 is based have significant shortcomings. They include dataobtained about three decades ago from tests in which the numbers of pressure taps were small --one to two orders of magnitude smaller than in recent UWO tests [37] in which, in addition,records were taken for many more mean flow directions using far more advanced pressuremeasurement technology. Although some calibration against full-scale measurements appears tohave been performed, no pertinent documentation is available for convenient public scrutiny.ASCE 7 also contains provisions based on aerodynamic data of unknown source measured underunknown testing conditions.
4.2 SPECIFICATION OF AERODYNAMIC DATA IN ASCE 7: “PSEUDO-PRESSURES”The aerodynamic pressures specified by ASCE 7 (referred to therein as “pseudo-pressures”)typically represent envelopes of actual pressures. This means that if the “pseudo-pressures” aresmaller than pressures measured in recent UWO tests, actual pressures underlying the ASCEprovisions may be unrealistically small. Investigations by [37, 38, 40] for a number of casesconcluded that the ASCE 7 “pseudo-pressures” can indeed be too small, in some cases by factorsof approximately two. It may be also be the case that for some cases ASCE 7 pressures are toolarge. Furthermore, many types of low-rise buildings of interest to designers, builders, andinsurers are not covered by the ASCE 7 aerodynamic provisions.
4.3 DEVELOPMENT OF AERODYNAMIC DATABASES. DATA COMPRESSION
The development of “pseudo-pressures” from actual pressures was intended to ensure thatcritical wind effects (e.g., bending moments at portal frame knees) are estimated conservatively.However, as the aforementioned investigations have shown, this goal was not achieved, or atleast it was not achieved consistently. Inadequate standard specifications on wind pressures leadnot only to inadequate designs, and therefore to unnecessary losses in high winds and/orunnecessary consumption of materials, but also to inadequate loss estimates, and therefore toinsurance rates that may not be commensurate with actual losses. A concerted effort may bewarranted aimed at replacing pressure coefficients specified in ASCE 7 with values based oncomprehensive tests yielding full records of aerodynamic data obtained at large numbers ofpressure taps on the exterior surface of the building models for as many as 36 wind directions, sothat effects of winds blowing from aerodynamically unfavorable directions are not missed. Thedirect use of such data in design, within a framework referred to as database-assisted design [41],is permitted by ASCE 7, subject to safeguards ensuring that the quality of the data is satisfactory
Hoerner [42] developed a large and widely used compendium of aerodynamic effectswhich, for civil engineering applications, is now obsolete. A 21st century electronic successor toHoerner’s compendium is in our opinion necessary. In view of the important consequences sucha compendium could have on design, retrofitting, codification, and insurance rates, it may wellbe in the interest of a broadly based group of stakeholders to support its development, much assteel industry stakeholders support the development of the AISC manual. Absent such an effortengineers will continue to base structural design of low-rise buildings on data accumulated bysuccessive accretions, of uncertain quality, and inadequately documented if documented at all.
Aerodynamic databases are large, and can be substantially compressed with nosignificant lossiness (the term used by data compression specialists, see, e.g., [43]) by using avariety of procedures. The use of compressed databases would be helpful in expanding the use of

11th Americas Conference on Wind Engineering, San Juan, PR, USAJune 22-26, 2009
aerodynamic databases. Standard procedures and provisions need to be developed for theconvenience of developers and users of compression techniques.
4.4 CALIBRATION AND CORRECTION OF WIND TUNNEL TEST RESULTS
As is suggested by Fig. 2, wind tunnel test results need to be calibrated and/or corrected againstresults of credible full-scale tests, e.g., [44, 45, 46]. For this to be possible compendiums of full-scale data in user-friendly formats and correction methodologies should be developed. Aconsensus on how this should be done has yet to be reached.
Figure 2: Pressures measured at building corner, eave level, Texas Tech University experimental building[46].
4.5 COMPARISONS OF PEAK WIND EFFECTS MEASURED IN DIFFERENT TESTS. THE NEED FOR
PUBLIC RECORDS.
In the past comparisons between data measured in different tests were hampered by the fact thatpeak pressures or other random wind effects are random variables, meaning that a peakcorresponding to, say, a 90 percentage point of its distribution would be compared to itscounterpart corresponding perhaps to a 5 percentage point. For comparisons to be effectivestatistics of peak effects (e.g., means, 90 % quantiles) are needed. Such statistics can now beestimated from single records using upcrossing theory. A user-friendly procedure for doing sowas developed in [47]. The requisite software, with improvements by J.A.Main, is available onwww.nist.gov/wind.
The ASCE 7 uses a peak factor incorporated in the specified aerodynamic pressure orforce coefficients, or used to multiply the root mean square value of the random process ofinterest. Except for pressures at some “hot spots,” the peak factor specified or implicit in ASCE 7typically has approximately the same value as the gust response factor specified in ASCE 7 for

11th Americas Conference on Wind Engineering, San Juan, PR, USAJune 22-26, 2009
the quasi-static along-wind response induced on a building by wind normal to a building face.This approach is computationally convenient but when applied by ASCE 7 to, e.g., effects onroofs, side walls, or leeward walls, it bears little or no relation to the respective actual peak windeffects.
According to Griffis [48] “there have been a large number of projects tested by more thanone wind tunnel laboratory where results were very close, typically within about 10 %.” To ourknowledge the comparisons to which this statement refers are not publicly available. The publicavailability of records of pressure, base moment, and base shear time histories obtained invarious wind tunnel laboratories for selected types of structure would allow independent publicscrutiny and comparisons, as well as serving as benchmarks for the oversight and certification ofwind tunnel facilities.
4.6 ATMOSPHERIC FLOW SIMULATIONS
The quality of the measured aerodynamic data depends to a large extent upon the laboratorysimulation of the atmospheric boundary layer flow. As was mentioned earlier, the simulation ofthe wind speed profile is not a trivial matter, especially for low-rise buildings, because, even forflow over homogeneous terrain, achieving a logarithmic profile over a sufficient height above thefloor is in practice not possible as long as spires are used as a flow management device, which isthe case for virtually all commercial wind tunnels. Even achieving specified power law profilesadequate for low-rise building tests should not be taken for granted, as was indeed concluded in[49], following careful analyses of various laboratory flows.
A recent draft standard on wind tunnels includes in its list of similarity criteria the so-called Jensen law. Jensen similarity states that replication in the wind tunnel of aerodynamiceffects on a full-scale structure requires that the ratio between the surface roughness length z0
and the structure’s height H be the same in the model and the prototype. Because z0 is typicallynot meaningful for defining civil engineering wind tunnel flows, the Jensen similarity criterion isin fact unusable. While the criterion is of interest from a historical point of view, it is in ouropinion not useful in a standard of practice for wind tunnels.
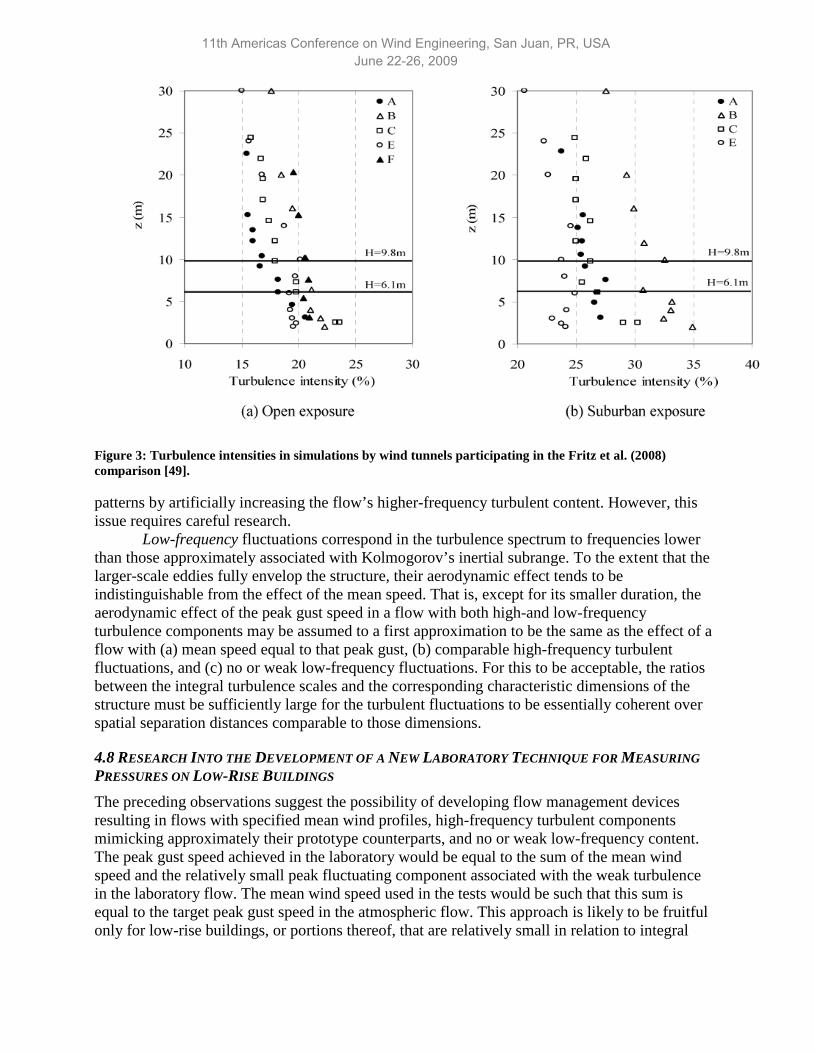
Modeling of the aerodynamic pressures also requires that the atmospheric turbulence bereproduced in the laboratory. Fig. 3 shows that this is not uniformly achieved by various windtunnels. According to [49], differences between laboratory simulations of mean windprofiles and of turbulence are responsible in large part for the discrepancies, by factors that canexceed two, between wind-tunnel based estimates of wind effects on low-rise structures reportedfor six wind tunnels in [39], five of which are denoted by block letters in Fig. 3.
4.7 HIGH-FREQUENCY AND LOW-FREQUENCY TURBULENT FLUCTUATIONS
High-frequency fluctuations tend to be weaker in the wind tunnel than in the atmosphere owingto internal friction effects that are more pronounced at smaller scales. Their main effect is totransport across separation layers fluid particles with high momentum from outside the layer intothe separation bubbles, thereby helping to overcome the effects of negative pressure gradientsand promote reattachment. It is likely that this small-scale turbulence deficit can in practice becompensated to a degree sufficient for an adequate reproduction of prototype reattachment
11th Americas Conference on Wind Engineering, San Juan, PR, USAJune 22-26, 2009
Figure 3: Turbulence intensities in simulations by wind tunnels participating in the Fritz et al. (2008)comparison [49].
patterns by artificially increasing the flow’s higher-frequency turbulent content. However, thisissue requires careful research.
Low-frequency fluctuations correspond in the turbulence spectrum to frequencies lowerthan those approximately associated with Kolmogorov’s inertial subrange. To the extent that thelarger-scale eddies fully envelop the structure, their aerodynamic effect tends to beindistinguishable from the effect of the mean speed. That is, except for its smaller duration, theaerodynamic effect of the peak gust speed in a flow with both high-and low-frequencyturbulence components may be assumed to a first approximation to be the same as the effect of aflow with (a) mean speed equal to that peak gust, (b) comparable high-frequency turbulentfluctuations, and (c) no or weak low-frequency fluctuations. For this to be acceptable, the ratiosbetween the integral turbulence scales and the corresponding characteristic dimensions of thestructure must be sufficiently large for the turbulent fluctuations to be essentially coherent overspatial separation distances comparable to those dimensions.
4.8 RESEARCH INTO THE DEVELOPMENT OF A NEW LABORATORY TECHNIQUE FOR MEASURING
PRESSURES ON LOW-RISE BUILDINGS
The preceding observations suggest the possibility of developing flow management devicesresulting in flows with specified mean wind profiles, high-frequency turbulent componentsmimicking approximately their prototype counterparts, and no or weak low-frequency content.The peak gust speed achieved in the laboratory would be equal to the sum of the mean windspeed and the relatively small peak fluctuating component associated with the weak turbulencein the laboratory flow. The mean wind speed used in the tests would be such that this sum isequal to the target peak gust speed in the atmospheric flow. This approach is likely to be fruitfulonly for low-rise buildings, or portions thereof, that are relatively small in relation to integral

11th Americas Conference on Wind Engineering, San Juan, PR, USAJune 22-26, 2009
turbulence scales in atmospheric flows. Laboratory flows of the type suggested here would haveboth low turbulence intensity and small integral turbulence scales. This would help to reduceerrors in aerodynamic output that are now common owing to the difficulty of faithfullysimulating atmospheric boundary layer flows close to the ground. Facilities generically calledWall of Wind (Figure 4) are currently capable of producing flows with large specified frequencycontent induced by controlled, quasiperiodically fluctuating rotational speeds of the fans [50].This capability was used by G. Bitsuamlak, A. Gan Chowdhury, R. Li, and the author to testsuccessfully the hypothesis that an increase in the mean speed is an aerodynamically effectivesubstitute for the low-frequency fluctuations effect on a small building. A larger and moremodern Wall of Wind facility is currently under construction at Florida International University.
Figure 4. Wall of Wind, International Hurricane Research Center, Florida International University [50].
5. STRUCTURAL DYNAMICS: TIME-DOMAIN METHODS
The frequency domain approach to the calculation of dynamic structural response in turbulentflow was first proposed in 1952 [5], when computers were too weak to solve routinely in thetime domain problems involving ordinary differential equations. The Fourier transformation ofNewton’s equations of motion had the advantage of converting their solution into one involvingalgebraic equations instead. Those computational constraints no longer exist, however, and time-domain calculations for wind engineering purposes are now easy to perform. They have overtheir frequency domain counterparts the significant advantage of preserving phase informationand rendering unnecessary the awkward estimation of cross-spectral effects. Consider forexample a problem in which the wind effect of interest, denoted by M, is a sum of wind effects,Mx and My, due to pressures acting in two orthogonal directions. What is the peak value of M? If
11th Americas Conference on Wind Engineering, San Juan, PR, USAJune 22-26, 2009
the phase information is lost the answer must be guessed, and combinations of the wind effectsmust be specified accordingly. This would also be necessary when adding individual componentsof demand-to-capacity ratios in structural interaction equations accounting for effects of axialforces and bending moments. In contrast, in the time domain all the phase information ispreserved, so time histories of all the relevant effects can simply be added algebraically, andstandard methods for the estimation of peaks are applied to the resulting sums. A singlecombination, which yields accurate results, is required, rather than large numbers ofcombinations that yield results of questionable accuracy and unnecessarily complicate thedesigner’s task.
A second advantage of making full use of current computational capabilities is the abilityto calculate internal forces by summing up records of pressure time histories measuredsynchronously at large numbers of taps, weighted by appropriate influence coefficients. Thiscapability was not available until the 1990s. A third advantage is the ability to use time historiesof synchronously recorded pressures to calculate internal forces at any elevation of the structureby using pressures measured in the laboratory. In contrast, if the High-Frequency Force Balance(HFFB) is used for buildings (a) affected by aerodynamic interference effects and (b) whosefundamental modes are not straight lines, the pressures must be guessed by the analyst. A fourthadvantage is the possibility of taking higher modes of vibration into account. Finally, windvelocity and response directionality can be accounted for jointly in a transparent and physicallyunimpeachable manner, as is briefly shown in the following section. For details and softwarepertaining to time-domain calculations, see [51, 52].
6. DIRECTIONAL WIND CLIMATOLOGICAL AND AERODYNAMICS/STRUCTURAL
DYNAMICS EFFECTS
6.1 ESTIMATION OF MEAN RECURRENCE INTERVALS OF WIND EFFECTS
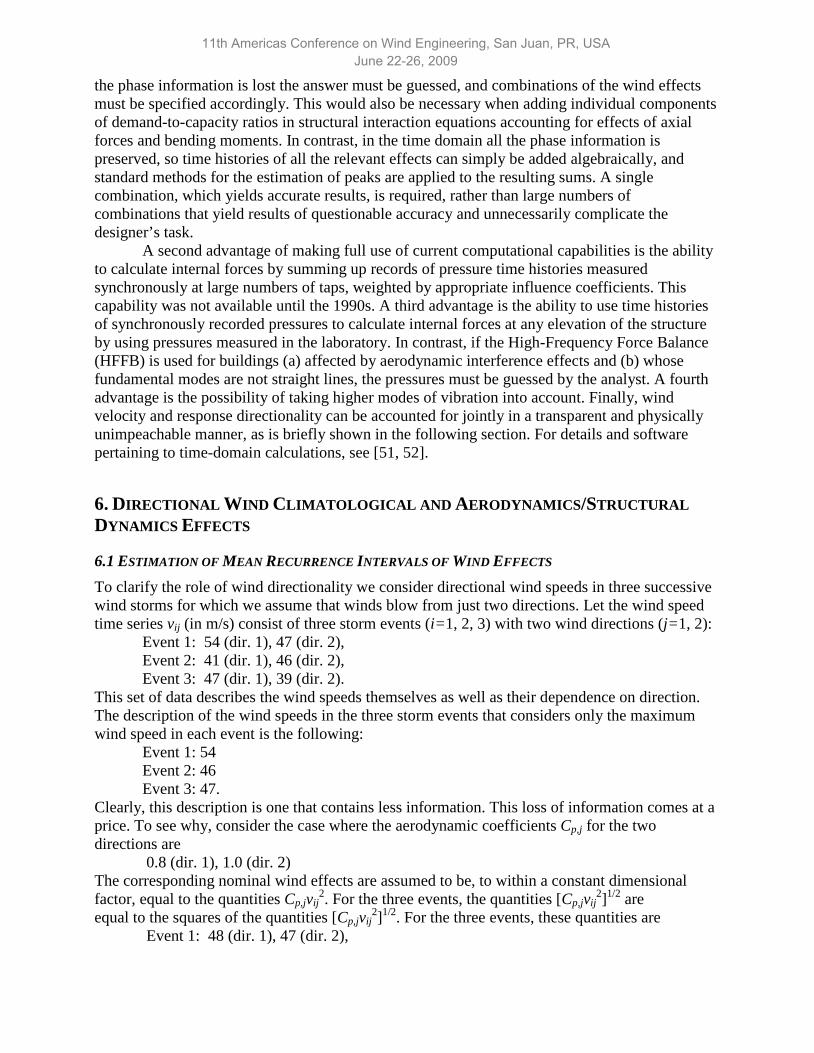
To clarify the role of wind directionality we consider directional wind speeds in three successivewind storms for which we assume that winds blow from just two directions. Let the wind speedtime series vij (in m/s) consist of three storm events (i=1, 2, 3) with two wind directions (j=1, 2):
Event 1: 54 (dir. 1), 47 (dir. 2),Event 2: 41 (dir. 1), 46 (dir. 2),Event 3: 47 (dir. 1), 39 (dir. 2).
This set of data describes the wind speeds themselves as well as their dependence on direction.The description of the wind speeds in the three storm events that considers only the maximumwind speed in each event is the following:
Event 1: 54Event 2: 46Event 3: 47.
Clearly, this description is one that contains less information. This loss of information comes at aprice. To see why, consider the case where the aerodynamic coefficients Cp,j for the twodirections are
0.8 (dir. 1), 1.0 (dir. 2)The corresponding nominal wind effects are assumed to be, to within a constant dimensionalfactor, equal to the quantities Cp,jvij
2. For the three events, the quantities [Cp,jvij2]1/2 are
equal to the squares of the quantities [Cp,jvij2]1/2. For the three events, these quantities are
Event 1: 48 (dir. 1), 47 (dir. 2),

11th Americas Conference on Wind Engineering, San Juan, PR, USAJune 22-26, 2009
Event 2: 37 (dir. 1), 46 (dir. 2), Event 3: 42 (dir. 1), 39 (dir. 2),(e.g., for event 1, dir. 1, [0.8 x 542]1/2=48).
Since for each storm event it is the largest nominal wind effect that matters, for design purposeswe extract from those quantities the following time series (in m/s):
Event 1: 48 Event 2: 46 Event 3: 42
Assuming further that the rate of occurrence of the storm events is 1/yr, it follows from the abovecalculations that the largest and second largest of these quantities are, respectively, 48 and 46m/s. The wind effects are proportional to the squares of these quantities, that is, to
2304 and 2116 (m/s)2
respectively. If the calculations were performed without accounting for the directionality of thewind speeds, and the largest pressure coefficient (i.e., Cp=1) were used for all directions, then thelargest and the second largest of the quantities [maxj(Cp,j)maxj(vij)
2] would be 542and 472, that is,2916 and 2209 (m/s)2.
A 0.85 directionality reduction factor has been adopted in ASCE 7 to account summarily fordirectionality effects on rigid buildings. However, estimates of extreme wind effects based onthat blanket factor, rather than accounting explicitly for wind directionality, can be in error eitheron the conservative or unconservative side. Multiplication of the 2916 (m/s)2 and 2209 (m/s)2
wind effects by 0.85 would yield largest and second largest wind effects of2480 and 1878 (m/s)2,
rather than 2304 and 2116 (m/s)2, as obtained by using a physically realistic model. Note that thelargest of the wind effects estimated by disregarding wind directionality and using the blanketdirectionality reduction factor (i.e., 2480 (m/s)2) is conservative with respect to the largestphysics-based estimate of the wind effect (i.e., 2304 (m/s)2). However, if the second largest windeffect were of interest, the difference between the result based on the use of the directionalityfactor (1878 (m/s)2) and the physics-based result (2116 (m/s)2) would be -11 %, that is, in thisinstance the directionality factor approach used in ASCE 7 yields an unconservative estimate).
It is commonly assumed that the MRI of the wind effect associated in ASCE 7 with non-directional wind speeds is the same as the nominal MRI of those speeds. This assumption is ingeneral not correct. For example, in our illustration it would be assumed that the ranking of thewind effect induced by the 47 m/s non-directional speed associated with storm event 3 is two.) Infact, if directional effects are taken into account, the ranking of the wind effect induced by storm3 is three.
The approach just described is applicable to any wind effects, including pressures,dynamic response, and sums of demand-to-capacity ratios used in axial force-bending momentsinteraction equations. The approach amounts to converting a multi-dimensional time seriesconsisting of the effects of m storms in p directions into a one-dimensional time series consistingof the largest effects induced by the m storms, regardless of their direction. To use terminologyintroduced in structural reliability, we do not operate in the space of wind speed variables, butrather in the space of wind effect variables.
Figure 5 represents a wind speed and direction dependent response surface for thedemand-to-capacity index of a member of tall building analyzed in [52]. Once such a responsesurface is developed, a one-dimensional time series of that index can be constructed from thematrix of directional wind speeds simulated for a large number of storm events. The value of thatindex for any MRI can be obtained immediately from that time series and the mean rate ofoccurrence of the storm events.

11th Americas Conference on Wind Engineering, San Juan, PR, USAJune 22-26, 2009
Figure 5. Response surface representing a member’s demand-to-capacity index bij as a function of wind speedand direction [52].
For critiques of alternative approaches to wind directionality, see [14, 53]. The critiquesaddresses the questions of whether the probabilistic basis of such approaches is correct, whetherinferences on rare events can be made from records of non-extreme wind speeds, and whetherthe approaches are sufficiently transparent for scrutiny by structural engineers. A critique by theNational Institute of Standards and Technology (NIST) of the method used by one laboratorywas judged in a Skidmore Owings and Merrill (SOM) report [54] to be “fairly compelling;” onthe upcrossing method used by another laboratory it was commented by SOM that “the methodis computationally complex and verification is not possible because sufficient details of themethod used to estimate the return period of extreme events are not provided.” This commentsuggests that more transparency in the presentation of wind tunnel laboratory reports isnecessary. That method that it tends to yield unconservative results; also, the low wind speeds ituses can be meteorologically different from high wind speeds, and may not be suitable forextrapolation to extreme wind speeds [14].
7. AEROELASTICITY
Aeroelastic wind tunnel modeling techniques for buildings are well documented, see e.g., [55].However, dependable predictive tools usable for design or at least preliminary design purposeshave yet to be developed. Progress in this direction has been made, e.g. in [56], which can behelpful for the qualitative estimation of vortex-induced effects on flexible buildings.
For structural reliability purposes documented estimates are needed of speeds at whichgalloping or, in some special cases, flutter oscillations could occur. A structure may wellexperience no significant aeroelastic effects under wind speeds with a, say, 720-yr MRI. Will

11th Americas Conference on Wind Engineering, San Juan, PR, USAJune 22-26, 2009
that structure be safe – will the aerodynamic effects affecting it be acceptable -- under, say, a2000-yr wind speed? This question is similar to the safety question that should have been askedby the designers of the Katrina levee. Basic knowledge needed for developing the requisiteestimation tools is available, although the effect of modal shapes on the aeroelastic forces needsadditional study. For galloping oscillations the development of such tools would require staticaerodynamic testing. In special cases entailing the possibility of flutter, tests under oscillatoryconditions similar to those developed for bridges would be required.
Aerodynamic damping is due to the relative speed of the oncoming wind velocityfluctuations with respect to the windward face of a building as the latter oscillates. This effecthas long been recognized, and as early as the 1960s Davenport proposed a simple test in anattempt to develop aerodynamic damping estimates. However, estimates based on Davenport’sattempt have not found acceptance in practice. The ingredients needed for a reliable estimationof the aerodynamic damping are: (1) a relation between fluctuating wind speeds impinging onthe building’s windward face and the pressures they induce on that face, (2) experimentalinformation on the time series of the pressures on the building’s windward face, now readilyavailable thanks to the development of transducers for measuring pressures simultaneously atmultiple taps; and (3) a time domain model of the building motion due to the action of thefluctuating speeds, also available (see Section “Structural Dynamics ...”). Approximate timehistories of the fluctuating speeds associated with the measured pressures can be obtained from(1) and (2). The requisite estimates are obtained by a simple iterative numerical procedure inwhich relative velocities of the wind speed with respect to the oscillating structure are used. Thisprocedure largely eliminates the need for aerodynamic damping estimates based on wind-tunnelaeroelastic tests [57].
8. STATISTICS
Statistics plays an important part in the specification of wind effects, and is used for: (1) theestimation of extreme wind speeds with specified MRIs (discussed in sections “WindClimatology”), (2) the estimation of extreme wind effects with specified MRIs (discussed insection “Directional Wind Climatological and Aerodynamics/Structural Dynamics Effects”), (3)the estimation of peaks of time series of wind effects (discussed in section “Comparing PeakWind Effects...”) (4) the assessment of uncertainties in the estimation of wind speeds and windeffects.
8.1 ESTIMATION OF UNCERTAINTIES IN THE WIND EFFECTS
Uncertainties in the estimation of wind effects are calculated by accounting for uncertainties inthe atmospheric boundary layer flow characterization, the wind tunnel flow simulation,aerodynamic pressure coefficient or force coefficient estimates, extreme wind speed estimates,and peak wind effects estimates; for flexible buildings natural frequencies and modal shapes areassociated with additional uncertainties. ASCE 7 includes no explicit estimates of uncertaintiesin the estimation of wind effects. However, these uncertainties are implicitly accounted for viawind load factors specified in ASCE 7, Chapter 2. A discussion of wind load factors is presentedin the following section.

11th Americas Conference on Wind Engineering, San Juan, PR, USAJune 22-26, 2009
9. STRUCTURAL RELIABILITY
Structures are designed for wind effects that are sufficiently large to ensure that, underreasonable assumptions regarding structural capacity, their probability of performinginadequately under wind and other loads is acceptably small. Design criteria aimed at assuringadequate structural reliability are specified in Chapter 2 of ASCE 7 in terms of wind loads thatinduce effects associated with either allowable stress design (ASD) or Strength Design (SD). Forflexible buildings additional criteria pertain to inter-story drift and top floor accelerations (see,e.g., [14, p. 169].
9.1 CURRENT ASCE 7 DESIGN CRITERIA
The purpose of the design criteria specified in ASCE 7, Chapter 2 is to assure that demand-to-capacity indexes (i.e., sums of demand-to-capacity ratios used in interaction equations) areadequate, see [14, pp. 160-164]. However, especially for new types of structural system,meeting the requirements implicit in those design criteria is a mere indication, not a guarantee,that a structure’s behavior under very strong winds will be adequate, and that the materialconsumption required to ensure adequate performance is not unnecessarily high. In someengineers’ opinion the experience of the last decades, during which no spectacular wind-inducedstructural collapses of engineering structures were recorded, and engineering judgment based onthat experience, support the belief that current design criteria are safe. However, it should be keptin mind that before the devastation wrought by Hurricane Katrina it was assumed by someengineers that the design criteria used for the New Orleans levees were also supported byexperience.
9.2 EXPLORATORY RESEARCH ON NONLINEAR BEHAVIOR AND INCIPIENT COLLAPSE
Given the approximations, simplifications, and uncertainties inherent in current design criteriafor wind, the most careful modeling possible of the relevant phenomena is warranted. Nonlinearanalyses accounting for post-elastic strength reserves under wind loads would be useful in thisregard, but in the present state of the art they can seldom be performed in practice, especially forstructures with significant dynamic and/or potential aeroelastic effects corresponding to longerMRIs than those that typically induce linear effects. From this point of view structural design isfar less advanced for wind than for earthquakes. Nevertheless, exploratory work was performedin recent years based on finite elements estimates of nonlinear structural behavior of rigidstructures under wind loads estimated from data measured simultaneously at large numbers oftaps [58, 59]. That work is a first step toward a structural reliability approach that accounts forthe behavior of the entire structure under wind loads up to incipient collapse, rather than just forthe behavior of individual members in the elastic range, as in ASCE 7.
9.3 IS THE ASCE 7 WIND LOAD FACTOR UNIVERSALLY VALID?
ASCE 7 is based on the assumption that a wind load factor of 1.6 applied to the effectsassociated with the basic wind effect assures an adequate nominal reliability with respect to windloads for all structures. The ASCE 7 Commentary defines the wind load factor as the square ofthe ratio between the wind speed, regardless of direction, with an approximately 720-yr MRI andthe basic wind speed specified in the ASCE wind map. This definition is consistent with thespecification of a wind load factor equal to 1.6.
In reality the wind load factor was originally defined as a function of uncertainties in theestimation of wind effects. In accordance with this definition, the 1.6 value is typically
11th Americas Conference on Wind Engineering, San Juan, PR, USAJune 22-26, 2009
appropriate for rigid buildings in non-hurricane regions [60]. It is recognized in ASCE 7 that aneffective wind load factor larger than 1.6 is warranted for hurricane-prone regions. For thoseregions the basic wind speed specified in ASCE 7 has a longer but unspecified MRI, and isapproximately equal to the ratio between the estimated wind speed with an approximately 720-yrMRI and the square root of 1.6. The adoption of a basic speed with an MRI larger than 50 yearsallows the use of the same numerical value of the load factor for both non-hurricane andhurricane regions, even though the probability distributions of extreme wind speeds have longertails for hurricane-prone than for non-hurricane regions and are therefore characterized by largerratios of 720-yr to 50-yr wind speeds. While this is a step in the right direction, it does notaccount for the fact that it is not just the aleatory variability of the wind speeds that is greater inhurricanes than in typical non-hurricane winds. In addition, hurricane wind speed estimates areaffected by modeling errors that are typically greater for hurricane than for non-hurricane winds.
Uncertainties inherent in wind effects on structures with significant dynamic effects canbe larger than for rigid buildings. This is due to (a) the presence of uncertainties in the dampingand natural frequencies, which are not relevant for rigid structures, and (b) the stronger effect onthe response of uncertainties in the wind speeds, since wind effects on flexible buildings areproportional to wind speeds raised to powers larger than two, rather than just two, as is the casefor rigid structures. For this reason wind load factors applied to flexible buildings shouldtypically be larger than 1.6 (i.e., larger than the square of the typical ratio between the nominal720-yr winds and the basic wind speeds) even for non-hurricane regions. The use of the 1.6 windload factor can therefore lead to situations where the nominal safety level inherent in theStrength Design approach would be lower for, say, a 500 m tall building than for an engineeredlow-rise building.
It has been suggested that using a 720-yr MRI of the wind effect for Strength Design willassure the same safety level for dynamically active structures and rigid structures. Thissuggestion disregards the fact that the nominal 720-yr MRI used for the Strength Design of rigidstructures in non-hurricane regions was calculated by assuming that the wind load factor is 1.6.Had a wind load factor commensurate with the uncertainties in the dynamic parameters beenestimated instead, the corresponding MRI of the wind effects for Strength Design wouldtypically have been larger than 720 years. Therefore, rather than relying on “magic numbers”(1.6, or its 720 years counterpart), it would be useful for structural designers of tall buildings touse a procedure aimed at assuring risk-consistency between members of tall structures on the onehand and members of rigid structures on the other. The procedure should account for all theuncertainties in the wind effects. Conceptually such a procedure is simple, based as it is onMonte Carlo simulations that cover all the significant uncertainties in the relevant wind andresponse parameters, and was in fact outlined in its simplest form in [60]. However, at the timecomputational capabilities were insufficient for its implementation. This has changed, and anadaptation of the procedure to newly developed tools for estimating dynamic response to windwas developed in [51, 61]. For the procedure to be broadly applicable a consensus needs to bereached on the appropriate definition of those uncertainties and on a method for ensuring that theMRI of the wind effect considered in design, and the percentage point of the probabilitydistribution of the uncertainty in the wind effect, are consistent with their counterparts for rigidstructures in non-hurricane regions. In other words, Strength Design would be based on a windeffect with an MRI N and a percentage point p of the uncertainty in the response, where, for thesake of risk-consistency, N and p are the same as for those counterparts. It would be appropriate,in our opinion, to assume, e.g., N=50 years, estimate on this basis the percentage point p inherentin the wind load factor 1.6 used for rigid structures in non-hurricane regions, and use the samevalues N and p for flexible structures and for structures in hurricane-prone regions or in other
11th Americas Conference on Wind Engineering, San Juan, PR, USAJune 22-26, 2009
regions where the ASCE 7 probabilistic assumptions concerning extreme wind speeds in non-hurricane regions do not apply.
10. MULTI-HAZARD DESIGN
10.1 MRIS OF STRUCTURES SUBJECTED TO BOTH WIND AND SEISMIC LOADS
In accordance with the ASCE Standard 7-05, in regions subjected to wind and earthquakes,structures are designed for loads induced by wind and, separately, by earthquakes, and the finaldesign is based on the more demanding of these two loading conditions. Implicit in this approachis the belief that the Standard assures risks of exceedance of the specified limit states that areessentially identical to the risks inherent in the provisions for regions where only wind orearthquakes occur. We draw the attention of designers, code writers, and insurers to the fact thatthis belief is, in general, unwarranted, and that ASCE 7 provisions are not risk-consistent, i.e., inregions with significant wind and seismic hazards, risks of exceedance of limit states can be upto twice as high as those for regions where one hazard dominates. This conclusion is valid evenif the limit states due to wind and earthquake are defined differently, as is the case in ASCE 7.We propose an approach to modifying ASCE 7 provisions which guarantees that risks implicit inminimum ASCE 7 requirements for regions where one hazard dominates are not exceeded forstructures in regions with strong wind and seismic hazards.
We now show that implicit in ASCE 7 provisions are risks of exceedance of limit statesdue to two distinct hazards that can be greater by a factor of up to two than risks for structuresexposed to only one hazard. An intuitive illustration of this statement follows. Assume that amotorcycle racer applies for insurance against personal injuries. The insurance company willcalculate an insurance premium commensurate with the risk that the racer will be hurt in amotorcycle accident. Assume now that the motorcycle racer is also a high-wire artist. In this casethe insurance rate would increase as the risk of injury, within a specified period of time, in eithera motorcycle or a high-wire accident will be larger than the risk due to only one of those twotypes of accident. This is true even though the nature of the injuries sustained in a motorcycleaccident and in a high-wire accident may differ. The argument is expressed formally as:
)()()( 2121 sPsPssP (2)
where P(s1) is the annual probability of event s1 (injury in motorcycle accident), P(s2) the annualprobability of event s2 (injury in high-wire accident), and )( 21 ssP is the annual probability ofinjury due to a motorcycle or a high-wire accident. (Note that s1 and s2 are, clearly, mutuallyexclusive events.)
Equation 2 similarly holds for a structure for which P(s1) is the probability of the event s1
that the wind loads are larger than those required to attain a limit state associated with design forwind, and P(s2) is the probability of the event s2 that the earthquake loads are larger than thoserequired to attain the same limit state associated with design for earthquakes. (Note that, as in theearlier example, it is assumed that s1 and s2 cannot occur at the same time.) )( 21 ssP is theprobability of the event that, in any one year, s1 or s2 occurs. It follows from Equation 2 that
)( 21 ssP > P(s1), and )( 21 ssP > P(s2), i.e., the risk that a limit state will be exceeded isincreased in a multi-hazard situation with respect to the case of only one significant hazard. If

11th Americas Conference on Wind Engineering, San Juan, PR, USAJune 22-26, 2009
P(s1) = P(s2) the increase is twofold [62]. Note that s1 and s2 can differ, as they typically dounder ASCE 7 design provisions. In spite of such differences, it is the case that, both forearthquakes and wind, inelastic behavior is allowed to occur during the structure’s lifetime. Forseismic loading, only the MRI of the maximum considered earthquake is specified; the MRI ofthe onset of post-elastic behavior is unknown. For wind loading, the MRI of the onset ofnonlinear behavior is specified; however, nonlinear behavior is also possible and allowed tooccur during the structure’s life. A useful way to make “apples and apples” comparisons is toestimate the MRI of the event W that incipient collapse will occur under wind loads and the MRIof the event E that it will occur under seismic loads. For example, if those MRIs are comparable,the MRI of the event that either W or E will occur will be approximately half the MRI of theevent W, and approximately half the MRI of event E. Therefore, risks of failure inherent in theload combinations specified in ASCE 7 can be up to twice as for some structures in regionsexposed to both strong winds and strong earthquakes than for their counterparts where only oneof these hazards is strong. That is, for the former, the minimum requirements with respect to therequisite safety level are violated by current ASCE 7 provisions. One example of a structure that,depending on geographical location, may belong to this category is the supporting structure of awater tower depicted in Figure 6. Tall buildings supported by columns at the lower floors areanother example.
Figure 6: Schematic of water tower.
10.2 OPTIMIZATION AS A MULTI-HAZARD DESIGN TOOL
A multi-disciplinary foundation of multi-hazard design theory naturally includes appropriateoptimization approaches. A useful formulation of the multi-hazard design problem rests on thefact that optimization under N hazards (N > 1) imposes mi (i=1, 2,.., N) sets of constraints, all ofwhich are applied simultaneously to the nonlinear programming problem (NLP) associated withthe design. For example, consider in a region exposed to both earthquakes and strong winds a setof cantilevered columns fixed at the base and supporting at their top a heavy pipe filled withwater. Such a structural assembly is used in some solar energy installations. The wind loadacting on the pipe is largest when the wind direction is normal to the pipe. The seismic load isindependent of direction. What is the optimal column shape? If earthquake was the only hazard acircular column would be optimal. If wind was the only hazard an elongated cross-sectional

11th Americas Conference on Wind Engineering, San Juan, PR, USAJune 22-26, 2009
shape with the long axis normal to the pipe would be appropriate. Given the two-hazardconstraint, a shape that would be intermediate between the two would be optimal. That shape canbe found effectively and elegantly through NLP. Note that in seeking the shape of the crosssection the stresses induced by loads parallel to the direction of the pipe a single-hazard approachis appropriate, since wind effects in that direction are small. However, in the direction normal tothe pipe the joint effect of wind and seismic loads can control the design. While this is a “toy”problem, a similar optimization approach, albeit more laborious, can be used for a wide varietyof multi-hazard structural problems, including the design of tall building for wind andearthquakes [63].
11. WIND EFFECTS ESTIMATION
Wind effects are estimated in ASCE 7 through the integration of pertinent micrometerological,wind climatological, aerodynamics, wind directional, structural reliability, and statisticalelements discussed earlier. The output of the estimation process consists: for ASD, of windeffects corresponding nominally (though not physically) to the MRIs of the basic wind speedsused in the calculations; for SD, of the wind effects corresponding nominally to a 720-yr MRI.The aerodynamic data in ASCE 7 are adversely affected by the specification of drasticallyreductive aerodynamic data sets, as well as by the quality of atmospheric boundary layersimulations achieved in insufficiently documented or undocumented wind tunnel tests.Directionality effects are accounted for, nominally rather than on physical grounds, by using ablanket wind directionality reduction factor. The ASCE 7 analytical procedure contains a methodfor estimating the along-wind dynamic response of tall buildings, which depends on the windloads and on the mechanical properties of the structure (fundamental modal shape and frequency,and damping ratio in the fundamental mode). The ASCE 7 simplified and analytical proceduresspecifically exclude aeroelastically active structures or wind effects due to vortex shedding.
The ASCE 7 provisions for the “Wind Tunnel Procedure” are not sufficient forestimating wind effects. For this reason they are complemented by in-house methodologieswhich do not always yield mutually consistent results. The best known instance is theindependent estimates by two laboratories of the response to wind of the World Trade Center’stwin towers, which differed by over 40 % [53]. Part of that difference was due to the respectivemethods for dealing with the effects of wind directionality. We suggested at the beginning of thispaper that seismic R&D can provide a useful model for wind engineers. One feature of designfor seismic loads is that there is a clear division of work between seismologists and structuraldesigners. In our opinion a similar division of work is in order for wind engineers and structuraldesigners of tall buildings. For structures not susceptible to significant aeroelastic effects thewind engineer needs to provide information on: (1) the wind climate (i.e., matrices of extremedirectional wind speed data for a large number of events, and the mean arrival rate of the events);(2) the ratio between the wind speeds at the reference height of the appropriate open terrainexposure meteorological site and the wind speeds at the location of the future building and at theelevation of its top, (3) the time-histories of the simultaneously measured pressures at largenumbers of taps on the building exterior surface. For cladding design, the wind engineer alsoneeds to provide (4) recommended internal pressures. With this information, the structuralengineer can, with the help of software already available (see, e.g., www.nist.gov/wind) orrequiring minor adjustments, design members for wind action in accordance with specifiedperformance criteria on strength and serviceability. Research is also ongoing on optimization ofstructural members and connections subjected to wind effects estimated by the realistic modelsincorporated in newly developed software.

11th Americas Conference on Wind Engineering, San Juan, PR, USAJune 22-26, 2009
12. STANDARDS DEVELOPMENT
In the 1960s the Uniform Building Code devoted just a few pages to wind loading provisions.The volume of wind loading provisions has since increased with regularity. ASCE 7-93contained 15 pages of standard provisions, and a 12-page Appendix; ASCE 7-95, 22 pages, and a20-page Commentary; ASCE 7-98, 48 pages and a 35-page Commentary; ASCE 7-05, 59 pagesand a 41-page Commentary, an almost fourfold increase in 12 years. ASCE 7-10 will againincrease. To help practitioners struggling with the increasingly complicated ASCE 7 provisions,ASCE has published several guides to their use, including a 125-page guide to ASCE 7-02.Nevertheless, standard provisions allowing the design of structures for wind loads by the windtunnel method currently do not exist, and in our opinion current efforts to produce a standard onwind tunnel testing are insufficient in this respect.
Some engineers have asked whether it is desirable to have voluminous standards, orrather to reduce their volume and provide references to approved research findings andprocedures. Some of the bulk of the standard is due to the decision to include numerous pagesthat save the designer the trouble of performing a multiplication (i.e., where pressures are equalto a constant times the square of the wind speed, large tables are included where the pressures arelisted for several speeds, instead of for just one speed), as well as numerous repetitions of exactlythe same material (e.g., footnotes to tables). In a future standard a more economical and elegantformatting style, fully consistent with the users’ needs, may have to be sought.
The computer revolution can have a powerful impact on codification. Efficient designmethods based on large aerodynamic databases can serve the profession well. A useful step inthis direction has been made by introducing provisions in ASCE 7 that allow the use of suchdatabases, subject to prudent safeguards regarding the quality of the data.
An issue that may have to be considered by standards writers and users is whetherstandards should be revised every few years, as has been the practice in recent decades. Becausethe standards writing process is slow, periods of a few years are usually not sufficient for theelaboration and careful scrutiny of new materials being submitted for incorporation in revisedversions of the standards. One example is the ASCE 7 wind map discussed earlier in this paper.Another example are aerodynamics provisions whose questionable validity is disregarded. Athird example is the wind load factor, which according to the ASCE 7 Commentary should beabout 1.5, but somehow got transformed in the body of the Standard into 1.6. The problem isequally acute for changes of format. Time is needed to ensure that they result in functional, user-friendly provisions.
It has been argued that the current system for standard development is good enough anddoes not need improvement. This view may have to be reconsidered. The unhappiness of manypractitioners over what they perceive as the difficulty of using ASCE 7 provisions for wind loadsis due in part to the insufficiency of the current length of the revision cycle periods, and tomechanisms and resources that, in practice, do not allow a thorough and effective participationby the broad users’ community in the standard’s critique and development. In our opinion moreeffective mechanisms and more resources for ensuring such participation may be warranted. Inconsidering the possibility of allocating more resources to enable a broadly based scrutiny andcritique of a draft standard it should be kept in mind that saving on such resources can – usuallydoes -- yield a less than satisfactory product. This can result in social costs, both in terms ofusers’ time and less than satisfactory designs, which can far outweigh the costs of testing draftstandards by designated, independent practitioners.
11th Americas Conference on Wind Engineering, San Juan, PR, USAJune 22-26, 2009
13. SUMMARY AND CONCLUSIONS
We have attempted to highlight a number of fundamental issues that we believe need to beaddressed to allow the development of a new, significantly improved new generation ofstandards for wind loads. Topics discussed in the paper include: the representation of mean windspeed profiles, the use in standard provisions of sustained wind speeds in lieu of 3-s peak gusts,accounting for larger peak gust factors in tropical storm than in large-scale synoptic storm winds,and the micrometerological description of thunderstorm winds; the use and misuse ofsuperstations in extreme wind climatology, the estimation of wind speeds in hurricane-proneregions, the development of mixed-climate models in hurricane-prone regions and in regionswith both synoptic and thunderstorm winds, and the augmentation through modeling andsimulation of wind speed data sets; the quality of the aerodynamic data underlying the ASCE 7Standard, the development and use of aerodynamic databases, data compression, the calibrationand correction of wind tunnel test results, the need for developing and maintaining transparentand comprehensive public records of laboratory measurements, wind speed data, and windeffects estimates, atmospheric flow simulation, and the possibility of developing a new paradigmfor testing of a class of low-rise buildings; replacing where appropriate frequency domain bytime domain methods, accounting correctly for directional wind climatology andaerodynamics/structural dynamics effects, and estimating mean recurrence intervals (MRIs) ofwind effects as opposed to MRIs of wind speeds; the estimation for structural reliability purposesof aeroelastic effects for winds with longer MRIs than those inducing linear structural response,and the development of possible design aids for estimating aeroelastic effects, includinggalloping, on typical tall building shapes; uncertainties in the estimation of wind effects; the needto update current wind speed design criteria to assure risk-consistent performance-based designand safety margins no less realistic than those employed for seismic design, and studies onuncertainty-dependent wind load factors and nonlinear behavior to support such updating; multi-hazard design and its influence on design criteria for regions with wind and earthquake hazards;and proposed improvements in the standards development process.
We begin our conclusions by quoting from the Skidmore Owings and Merril report[53]: “…wind engineering is an emerging technology and there is no consensus on certainaspects of current practice. Such aspects include the correlation of wind tunnel tests to full-scale(building) behavior; methods and computational details of treating local (historical) wind data inoverall predictions of structural response; and types of suitable aeroelastic models for extremelytall and slender structures.” In our opinion the topics listed in this talk, among others, deserve tobe carefully debated and researched, and progress in the seismic design field, which has faroutpaced its wind design counterpart, should be vigorously emulated in the future.
Based on the material presented in the talk, it is our opinion necessary and possible toproduce standards that will be clearer, and more accurate, comprehensive, compact, andresponsive to advances in wind engineering than the current ASCE 7 Standard. It also necessaryto achieve significant improvements in the wind tunnel method that render it more transparent,accurate, and attuned to current computational and measurement capabilities so that time-domainapproaches, multi-modal analyses, and large sets of aerodynamic data can be routinely used, aswell as more attentive to the structural engineer’s needs and role in estimating structuralresponse. Finally, it is essential to develop a culture wherein results being used forstandardization and design purposes are documented in a thorough, easily accessible, and user-friendly way. Wind engineering has a great future!

11th Americas Conference on Wind Engineering, San Juan, PR, USAJune 22-26, 2009
ACKNOWLEDGEMENTS
The author gratefully acknowledges valuable contributions by and/or fruitful interactions with G.Bitsuamlak, C. Crosti, S. M. C. Diniz, D. Duthinh, J.J. Filliben, W.P. Fritz, M. Gioffrè, A.Grazini, R.D. Gabbai, A. Gan Chowdhury, M. D. Grigoriu, G. Harris, N.A. Heckert, E. Ho, M.Kasperski, F. T. Lombardo, J. A. Main, F. Minciarelli, J.-P. Pinelli, A. Possolo, F.A. Potra, F.Sadek, C. Schuyler, S. J. M. Spence, R.E. Vega, I. Venanzi, and T.A. Whalen.
REFERENCES
[1] R. Fleming, Wind Stresses, Engineering News, New York, 1915.
[2]Wind Forces on Structures, Transactions, American Society of Civil Engineers, 126, Part 2 (1961),1124-1196.
[3] O. Flachsbart, Winddruck auf geschlossene und offene Gebaeude, Ergebnisse der AerodynamischenVersuchanstalt zu Goettingen, IV Lieferung, L. Prandtl and A. Betz, eds., Verlag von Oldenburg, Munichand Berlin, 1932.
[4] E. Simiu, R. H. Scanlan, Wind Effects on Structures, 2nd Edition, Wiley, New York, 1986.
[5] H.W. Liepmann, On the Application of Statistical Concepts to the Buffeting Problem, J. Aeronaut.Sciences 19 (1952) 793-800, 822.
[6] A.G. Davenport, The Application of Statistical Concepts to the Wind Loading of Structures, Proc.Institution of Civil Engrs. 19 (1961) 449-472.
[7] W.W. Pagon, Wind Velocity in Relation to Height Above Ground, Eng. News Rec. 114 (19350 742-745.
[8] ASCE Standard ASCE/SEI 7-05, Minimum Design Loads for Buildings and Other Structures,American Society of Civil Engineers, 2006.
[9] Eurocode 1: Actions on structure - General Actions – Part 1-4: Wind actions, European Committeefor Standardization, Brussels, 2004.
[10] Australian/New Zealand Standard, Structural design actions, Part 2: Wind Actions, StandardsAustralia/Standards New Zealand, AS/NZS 1170.2:2002.
[11] G.T. Csanady, On the Resistance Law of a Turbulent Ekman Layer, J. Atmosph. Sciences 24 (1967)467-471.
[12] E. Simiu, Logarithmic Profiles and Design Wind Speeds, J. Eng. Mech. Div., ASCE 99 (1973) 1073-1083.
[13] M.D. Powell, P.J. Vickery, T.A. Reinhold, Reduced drag coefficient for high wind speeds in tropicalcyclones, Nature 422 (2003) 279-283.
[14] E. Simiu and T. Miyata, Design of Buildings and Bridges for Wind, Wiley, New York, 2006.
[15] J.J. Filliben, E. Simiu, Tall Building Response Parameters: Sensitivity Study Based on OrthogonalFactorial Experiment Design Technique, J. Struct. Eng. (submitted).
11th Americas Conference on Wind Engineering, San Juan, PR, USAJune 22-26, 2009
[16] Paulsen, B. M., and J. L. Schroeder, An Examination of Tropical and Extratropical Gust Factorsand the Associated Wind Speed Histograms, J. Appl. Met. 44 (2005) 270-280.
[17] B. Yu, A. Gan Chowdhury, Gust Factors and Turbulence Intensities for the Tropical CycloneEnvironment, J. Appl. Met. And Climatol. 48 (2009) 534-552.
[18] L. Russell, Probability Distributions for Hurricane Effects, J. Waterways, Harbors, and CoastalEng. Div, ASCE, 97 (1971) 139-154.
[19] J.A. Peterka, S. Shahid, S., Design Gust Wind Speeds in the United States, J. Struct. Eng., 124(1998) 207-214.
[20] E. Simiu, R. Wilcox, R., F. Sadek, J.J. Filliben, Wind speeds in ASCE 7 Standard Peak-Gust Map:Assessment, NIST Building Science Series 178, National Institute of Standards and Technology, 2001.
[21] E. Simiu, R. Wilcox, F. Sadek, J.J. Filliben, Wind speeds in ASCE 7 Standard Peak-Gust Map:Assessment, J. Struct. Eng. 129 (2003) 427-439.
[22] Batts, M. E., Russell, L.R., and Simiu, E., “Hurricane Wind Speeds in the United States,” J. Struct.Div., ASCE 100 (1980) 2001-2015.
[23] E. Simiu, N. Heckert, T. Whalen, Estimates of Hurricane Wind Speeds by Peaks over ThresholdMethod, J. Struct. Eng. 124 (1998) 445-449.
[24] P.J. Vickery, L.A. Twisdale, L. A., Prediction of Hurricane Wind Speeds in the United States, J.Struct. Eng. 121 (1995) 1691-1699.
[25] P.J. Vickery, P.J., D. Wadhera, D., L.A. Twisdale, I. Lavelle, I., U.S. Hurricane Wind Risk andUncertainty, J. Struct. Eng., 135 (2009) 310-330.
[26] S. Coles, E. Simiu, “Estimating Uncertainty in the Extreme Wind Analysis of Data Generated by aHurricane Simulation,” J. Eng. Mech. 129 (2003) 1288-1294.
[27] L. Gomes, B.J. Vickery, Extreme wind speeds in mixed climate, J. Ind. Aerodyn. 2 (1978) 331–344.
[28] L.A. Twisdale, P.J. Vickery, Research on thunderstorm wind design parameters, J. Wind Eng. Ind.Aerodyn. 41–44 (1992) 545–556.
[29] E.C.C. Choi, A. Tanurdjaja, Extreme wind studies in Singapore. An area with mixed weather system,J. Wind Eng. Ind. Aerodyn. 90 (2000) 1611–1630.
[30] Cook, N.J., Harris, R.I., Whiting, R,,. Extreme wind speeds in mixed climates revisited. J. Wind Eng.Ind. Aerodyn. 91 (2003), 403–422.
[31] C. Letchford, M ,Ghosalka, Extreme wind speed climatology in the United States Mid-West. TheSixth UK Conference on Wind Engineering, Cranfield University,UK, 2004.
[32] J.D. Holmes, Wind Loading of Structure, 2nd ed., Taylor and Francis, London, 2007.
[33] F.T. Lombardo, J.A. Main, E. Simiu, Automated extraction and classification of thunderstorm andnon-thunderstorm wind data for extreme-value analysis, J. Wind Eng. Ind. Aerodyn. (in press)http://dx.doi.org/10.1016/j.jweia.2009.03.001.

11th Americas Conference on Wind Engineering, San Juan, PR, USAJune 22-26, 2009
[34] E. Simiu, R. H. Scanlan, Wind Effects on Structures, 3rd Edition, Wiley, New York, 1996.
[35] M. Grigoriu, Algorithms for Generating Large Sets of Synthetic Directional Wind Speed Data forHurricane, Thunderstorm, and Synoptic Winds, NIST Technical Note 1636, National Institute ofStandards and Technology, Gaithersburg, MD (2009).
[36] D. Surry, T.C.E. Ho, G.A. Kopp, Measuring Pressures is Easy, Isn’t It? Proceedings, InternationalConf. on Wind Engineering, Texas Tech University, Lubbock, TX, 2 (2003) 2618-2623.
[37] T.C.E. Ho, D. Surry, D. Morrish, G.A. Kopp, The UWO contribution to the NIST aerodynamicdatabase for wind loads on low buildings: Part I. Archiving format and basic aerodynamic data, J. WindEng. Ind. Aerodyn. 93 (2005) 1-30.
[38] L.M. St. Pierre, G.A. Kopp, D. Surry, T.C.E. Ho, The UWO contribution to the NIST aerodynamicdatabase for wind loads on low buildings: Part II. Comparison of data with wind load provisions,” J.Wind Eng. Ind. Aerodyn. 93 (2005) 31-59.
[39] W.P. Fritz, B. Bienkiewicz, B. Cui, O. Flamand, T.C.E. Ho, H. Kikitsu, C.W. Letchford, E.Simiu,International Comparison of Wind Tunnel Estimates of Wind Effects on Low-Rise Buildings: Test-RelatedUncertainties, J. Struct. Eng., 134 (2008)1887-1890.
[40] B.F. Coffman, J.A. Main, D. Duthinh, E. Simiu, Wind effects on low-rise buildings: Database-assisted design vs. ASCE 7-05 Standard estimates.J. Struct. Eng. (in press).
[41] J.A. Main, W.P. Fritz, Database-Assisted Design for Wind: Concepts, Software, and Examples forRigid and Flexible Buildings, Building Science Series 180, Chapter 3, Building Science Series 180, 2006.
[42] S.F. Hoerner, Fluid Dynamic Drag, published by the author, 1965.
[43] A. Possolo, M. Kasperski, E. Simiu, Tunalble Compression of Wind Tunnel Data, Wind andStructures (submitted).
[44] P.J. Richards, R.P. Hoxey, J.L. Short, Wind Pressures on a 6 m Cube, J. Wind Eng. Ind. Aerodyn. 92(2004) 1173-2001.
[45] D. A. Smith et al., http://www.wind.ttu.edu/Research/FullScale/ WERFL_4th. php).
[46] F. Long, D.A. Smith, H. Zhu, K. Gilliam, Uncertainties Associated with the Full-scale to WindTunnel Pressure Coefficient Extrapolation, Report submitted to NIST under Department of CommerceNIST/TTU Cooperative Agreement Award 70NANB3H5003, Texas Tech University, Lubbock, TX, Feb. 9,2006.
[47] F. Sadek and E. Simiu, Peak Non-Gaussian Wind Effects for Database-Assisted Low-Rise BuildingDesign, J. Eng. Mech. 128 (2002) 530-539.
[48] L. Griffis, Wind Tunnel Testing Moving Forward, Structure Magazine, 7 (March 2006).
[49] B. Bienkiewicz, M. Endo, J.A. Main, Comparative Inter-laboratory Study of Wind Loading on Low-rise Industrial Buildings, ASCE/SEI Structural Congress, April 30-May 2, 2009, American Society ofCivil Engineers, Austin, Texas.
[50] P. Huang, A. Gan Chowdhury, G. Bitsuamlak, R. Liu, Development of devices and methods forsimulation of hurricane winds in a full-scale testing facility, Wind and Structures 12 (in press).
11th Americas Conference on Wind Engineering, San Juan, PR, USAJune 22-26, 2009
[51] E. Simiu, R.D. Gabbai, W.P. Fritz, Wind-induced tall building response: a time-domain approach,Wind and Structures 11 (2008) 427-440.
[52] Spence, S.M.J., High-Rise Database-Assisted Design 1.1 (HR_DAD_1.1): Concepts, Software, andExamples. NIST Building Science Series (in press), 2009.
[53] R.E. Vega [2008], Wind directionality: A reliability-based approach. Doctoral thesis, Texas TechUniversity, Lubbock, TX.
[54] Federal Building and Fire Safety Investigation of the World Trade Center Disaster: Final Report ofthe National Construction Safety Team on the Collapses of the World Trade Center Tower, NIST,NCSTAR 1-2: Baseline Structural Performance and Aircraft Impact Damage Analysis of the World TradeCenter Towers, Appendix D, wtc.nist.gov, 2005.
[55] Y. Zhou, A. Kareem, Aeroelastic Balance, J. Eng. Mech. 129 (2003) 283-292.
[56] A. Kareem et al., http://aerodata.ce.nd.edu/pubs.html
[57] R. D. Gabbai and E. Simiu, Aerodynamic Damping in the Along-Wind Response of a Tall Building,J. Struct. Eng. (submitted).
[58] S. Jang, L.W. Lu, F. Sadek, E. Simiu, Database-Assisted Design Wind Load CapacityEstimates for Low-rise Steel Frames, J. Struct. Eng, 128 (2002)1594-1603.
[59] D. Duthinh, J. A. Main, A. P. Wright, and E. Simiu, “Low-Rise Steel Structures underDirectional Winds: Mean Recurrence Interval of Failure,” J. Struct. Engrg. 134 (2008) 1383-1387.
[60] B. Ellingwood, T.V. Galambos, J.G. MacGregor, A.C. Cornell, Development of a Probability BasedLoad Criterion for American National Standard A 58, National Bureau of Standards, Washington, D.C.,1980.
[61] Gabbai, R.D., Fritz, W.P., Wright, A. P., and Simiu, E., “Assessment of ASCE 7 Standard WindLoad Factors for Tall Building Response Estimates,” J. Struct. Eng. 134 (2008) 843-845..
[62] D. Duthinh, E. Simiu, “A Multi-hazard Approach to the Structural Safety of Buildings Exposed toStrong Winds and Earthquakes,” Proceedings, U.S.-Japan Cooperative Program in Natural Resources,Panel on Wind and Earthquake Effects, 2006, N. Raufaste, ed., National Institute of Standards andTechnology, Gaithersburg, Maryland, 2008.
[63] F. Potra, E. Simiu, Optimization and Multi-Hazard Structural Design, J. Eng. Mech. (in press).


![[XLS] · Web viewQ:\IPAMS\Colorado\DJ_basin\baseline_emiss\DJ_basin_emission_summary_020608.xls:readme 2009 2006 2009 2006 2009 2006 2009 2006 2009 2006 1407.8375628476231 1290.1091452411449](https://img.pdfslide.us/doc/110x75/5ae8065a7f8b9acc268f812c/xls-viewqipamscoloradodjbasinbaselineemissdjbasinemissionsummary020608xlsreadme.jpg)