Embed Size (px)
Citation preview
Silicon Valley Leadership Group2001 Gateway Place Suite 101ESan Jose, CA 95110SVLG.ORG@SVLeadershipGrp
2016
CEOSURVEYB U S I N E S S C L I M A T E
SILICON VALLEYC
M
Y
CM
MY
CY
CMY
K
2016_CEOSURVEY_cover.pdf 1 4/11/2016 2:57:47 PM

The Silicon Valley Leadership Group, founded in 1978 by David Packard of Hewlett-Packard, represents more than 400 of Silicon Valley's most respected employers on issues, programs and campaigns that affect the economic health and quality of life in Silicon Valley, including energy, transportation, education, housing, health care, tax policies, economic vitality and the environment. Leadership Group members collectively provide nearly one of every three private sector jobs in Silicon Valley.
Board Officers:Chairman: Greg Becker, SVB Financial GroupPast Chairman: Steve Berglund, Trimble NavigationPast Chairman: Tom Werner, SunPowerPast Chairman: Aart de Geus, SynopsysVice Chair: Ken Kannappan, PlantronicsSecretary/Treasurer: John Adams, Wells Fargo BankPresident & CEO: Carl Guardino, Silicon Valley Leadership Group
Board Members:Sam Alkharrat, SAPLaura Guio, IBMMartin Anstice, Lam ResearchJames Gutierrez, InsiktShellye Archambeau, MetricStreamMark Hawkins, SalesForceAndy Ball, Suffolk ConstructionJeffrey Johnson, San Francisco ChronicleGeorge Blumenthal, University of California, Santa CruzAarif Khakoo, AMGENJohn Boland, KQEDGary Lauer, eHealthChris Boyd, Kaiser PermanenteEnrique Lores, HPRami Branitzky, Sapphire VenturesMatt Mahan, BrigadeGary Briggs, Facebook Tarkan Maner, NexentaBradley J. Bullington, XenioKen McNeely, AT&THelen Burt, Pacific Gas & ElectricStephen Milligan, Western Digital CorporationBill Coleman, Veritas TechnologiesKevin Murai, SynnexDavid Cush, Virgin AmericaJes Pedersen, Webcor BuildersChristopher Dawes, Lucile Children’s Hospital StanfordKim Polese, ClearStreetMichael Engh, S.J., Santa Clara UniversityTomi Ryba, El Camino HospitalTom Fallon, InfineraAlan Salzman, Vantage Point Capital PartnersBrant Fish, ChevronRon Sege, EchelonHank Fore, ComcastTed Ullyot , Andreessen HorowitzRaquel Gonzalez, Bank of AmericaKen Xie, FortinetDoug Graham, Lockheed MartinJed York, San Francisco 49ersKen Goldman, Yahoo!
SILICON VALLEY LEADERSHIP GROUP 01
The 2016 CEO Business Climate Survey is produced by the Silicon Valley Leadership Group.
2016
CEOSURVEYB U S I N E S S C L I M A T E
SILICON VALLEY
In Silicon Valley, the annual CEO Business Climate Survey serves as a powerful metric for the overall condi-tion of the region and its various industry sectors. By meticulously assembling a battery of data provided by the Valley’s key leaders in the private and public sectors, the survey offers a comprehensive account of the area’s performance as well as a forecast of the conditions ahead. Notably, the survey has been incredibly prescient in the past. Given this history, observers of the Valley’s track record can feel secure that the survey’s findings will serve as a reliable barometer of the Valley’s current health and guide for the upcoming year.
In the working world, every professional field has its own vocabulary, a special set of words and concepts that define the unique values, issues, circumstances and outputs related to its area of activity and expertise. For musicologists it may be something like “timbre,” while for economists it may be “aggregate demand curve.” The
point is that these terms are distinctive to a particular specialty or endeavor; they also provide insight into the essence of a particular corporate mission.
It’s no different in Silicon Valley, which has its own defining terminology. Here one of the most salient words of the region is “metric,” which is the term for measuring quantitative performances of the products and services of a company and its employees. Metrics are critically important in the Valley because of the many enterprises that calibrate success in terms of real time, sometimes on a very short financial leash, under severe time constraints, or in the face of fierce competitive conditions either at home or abroad.
02 CEO BUSINESS CLIMATE SURVEY 2016 SILICON VALLEY LEADERSHIP GROUP 03
Analysis by:Larry N. Gerston, Ph.D.,Professor of Political Science,San José State University
Overview

Employment• Added jobs in 2015: 62 percent, compared
with 67 percent in 2014
• Subtracted jobs in 2015: 7 percent, compared with 9 percent in 2014
• Expected to add jobs in 2016: 58 percent, compared with 64 percent in 2015
• Expected to subtract jobs in 2015: 5 percent, compared to 2 percent in 2014
Other Job-Related Observations• Employee movement out of state: 20 percent,
up from 19 percent in 2015; 39 percent cited reduced employee costs as the most important reason
• Physical presence in other states: 75 percent, up from 71 percent in 2015; Texas, New York and Massachusetts are cited the most
• Multinational presence: 50 percent
• Possible “Gross Receipts Tax” in San José: 59 percent would either discourage their company from locating in San José, discourage expansion, or encourage their company to leave
Strengths of Silicon Valley 1. Access to skilled labor (#2 in 2015)
2. Entrepreneurial mindset (#1 in 2015)
3. Climate/weather (#4 in 2015)
4. Proximity to customers (#3 in 2015)
5. World class universities (#5 in 2015)
Business Challenges• High housing costs for employees (#1 in 2015)
• Traffic congestion (#3 in 2015)
• Employee recruitment/retention costs (#2 in 2015)
• Business taxes (#5 in 2015)
• Business regulations (#4 in 2015)
Cost of living challenges for employees and their families
1. Housing costs (#1 in 2015)
2. Traffic congestion (#2 in 2015)
3. High taxes (#3 in 2015)
Recommendations to local government• Ease local street and road congestion (#1 in
2015)
• Approve more affordable home developments (#2 in 2015)
• Improve K-12 public education (#3 in 2015)
Recommendations to state government • Invest in traffic relief/transportation
improvements (#1 on 2015)
• Help create more affordable housing (#2 in 2015)
• Strengthen K-12 public education funding (#3 in 2015)
Recommendations to federal government • STEM education support (#3 in 2015)
• Comprehensive tax reform (#1 in 2015)
• H1-B visa/green card reform (#2 in 2015)
• Cybersecurity (#5 in 2015)
• Repatriation of foreign earnings
The Silicon Valley Leadership Group conducted its 13th annual CEO Business Climate Survey between January 11, 2016 and March 11, 2016. During this period, surveys were distributed electronically to the organization’s 400 members. By the response cutoff date, the Leadership Group received replies from 178 members, or a participation rate of 44.5 percent, well beyond expectations for this form of research.
As in the past, the survey covered a multitude of areas regarding virtually all aspects of life in the Valley. Key areas of inquiry included the region’s general business climate; employee living and working conditions; business concerns; the responsiveness of governments to Valley interests; and challenges and opportunities for the coming year. The survey dedicated attention to questions about current public policy matters as well as issues of concern to the Leadership Group and Silicon Valley residents. In an attempt to assess future conditions, the survey asked respondents to forecast the state and local economy for the coming year and, based on their responses, their recommendations for specific government action steps that might improve important policy areas in need of attention. In addition to the above, this year’s survey delved into a current issue before the San José City Council concerning a possible elevation of the city’s local business tax.
04 CEO BUSINESS CLIMATE SURVEY 2016 SILICON VALLEY LEADERSHIP GROUP 05
the SurveyAbout FindingsKey
Which of the following most closelydescribes your industry sector?
Energy/CleanTech/Utilities
222212%
Financial/Professional/Venture Capital
232313%
High-Tech Manufacturing/Semiconductor
252514%
Internet/Communications
242414%
Software
292916%
Education/University
77
1+1=2
4%
Other
12127%
Social Media
332%
Bio-tech/Med-tech/Pharma
885%
Transportation
442%
Gen. Manufacturing/Aerospace/Defense
13137%
Health & Hospital System
774%

Employment• Added jobs in 2015: 62 percent, compared
with 67 percent in 2014
• Subtracted jobs in 2015: 7 percent, compared with 9 percent in 2014
• Expected to add jobs in 2016: 58 percent, compared with 64 percent in 2015
• Expected to subtract jobs in 2016: 5 percent, compared to 2 percent in 2015
Other Job-Related Observations• Employee movement out of state: 20 percent,
up from 19 percent in 2015; 39 percent cited reduced employee costs as the most important reason
• Physical presence in other states: 75 percent, up from 71 percent in 2015; Texas, New York and Massachusetts are cited the most
• Multinational presence: 50 percent
• Possible “Gross Receipts Tax” in San José: 59 percent would either discourage their company from locating in San José, discourage expansion, or encourage their company to leave
Strengths of Silicon Valley 1. Access to skilled labor (#2 in 2015)
2. Entrepreneurial mindset (#1 in 2015)
3. Climate/weather (#4 in 2015)
4. Proximity to customers (#3 in 2015)
5. World class universities (#5 in 2015)
Business Challenges• High housing costs for employees (#1 in 2015)
• Traffic congestion (#3 in 2015)
• Employee recruitment/retention costs (#2 in 2015)
• Business taxes (#5 in 2015)
• Business regulations (#4 in 2015)
Cost of living challenges for employees and their families
1. Housing costs (#1 in 2015)
2. Traffic congestion (#2 in 2015)
3. High taxes (#3 in 2015)
Recommendations to local government• Ease local street and road congestion (#1 in
2015)
• Approve more affordable home developments (#2 in 2015)
• Improve K-12 public education (#3 in 2015)
Recommendations to state government • Invest in traffic relief/transportation
improvements (#1 on 2015)
• Help create more affordable housing (#2 in 2015)
• Strengthen K-12 public education funding (#3 in 2015)
Recommendations to federal government • STEM education support (#3 in 2015)
• Comprehensive tax reform (#1 in 2015)
• H1-B visa/green card reform (#2 in 2015)
• Cybersecurity (#5 in 2015)
• Repatriation of foreign earnings
The Silicon Valley Leadership Group conducted its 13th annual CEO Business Climate Survey between January 11, 2016 and March 11, 2016. During this period, surveys were distributed electronically to the organization’s 400 members. By the response cutoff date, the Leadership Group received replies from 178 members, or a participation rate of 44.5 percent, well beyond expectations for this form of research.
As in the past, the survey covered a multitude of areas regarding virtually all aspects of life in the Valley. Key areas of inquiry included the region’s general business climate; employee living and working conditions; business concerns; the responsiveness of governments to Valley interests; and challenges and opportunities for the coming year. The survey dedicated attention to questions about current public policy matters as well as issues of concern to the Leadership Group and Silicon Valley residents. In an attempt to assess future conditions, the survey asked respondents to forecast the state and local economy for the coming year and, based on their responses, their recommendations for specific government action steps that might improve important policy areas in need of attention. In addition to the above, this year’s survey delved into a current issue before the San José City Council concerning a possible elevation of the city’s local business tax.
04 CEO BUSINESS CLIMATE SURVEY 2016 SILICON VALLEY LEADERSHIP GROUP 05
the SurveyAbout FindingsKey
Which of the following most closelydescribes your industry sector?
Energy/CleanTech/Utilities
222212%
Financial/Professional/Venture Capital
232313%
High-Tech Manufacturing/Semiconductor
252514%
Internet/Communications
242414%
Software
292916%
Education/University
77
1+1=2
4%
Other
12127%
Social Media
332%
Bio-tech/Med-tech/Pharma
885%
Transportation
442%
Gen. Manufacturing/Aerospace/Defense
13137%
Health & Hospital System
774%
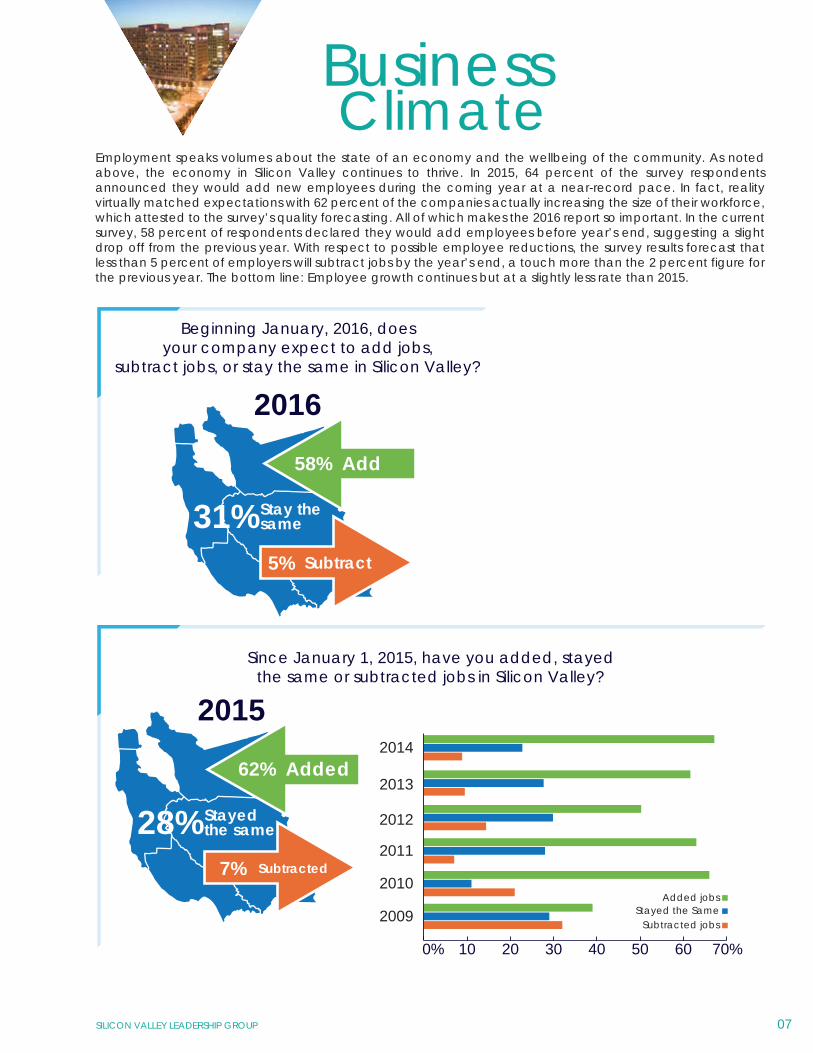
Employment speaks volumes about the state of an economy and the wellbeing of the community. As noted above, the economy in Silicon Valley continues to thrive. In 2015, 64 percent of the survey respondents announced they would add new employees during the coming year at a near-record pace. In fact, reality virtually matched expectations with 62 percent of the companies actually increasing the size of their workforce, which attested to the survey’s quality forecasting. All of which makes the 2016 report so important. In the current survey, 58 percent of respondents declared they would add employees before year’s end, suggesting a slight drop off from the previous year. With respect to possible employee reductions, the survey results forecast that less than 5 percent of employers will subtract jobs by the year’s end, a touch more than the 2 percent figure for the previous year. The bottom line: Employee growth continues but at a slightly less rate than 2015.
06 07
In the past few years, Silicon Valley has been unrivaled as the economic juggernaut of the state and nation. No area has fared as well. A study conducted by the Milken Institute in 2015 rated Santa Clara County as the top economic performer in the nation; San Francisco/San Mateo ranked second. During the past year, jobs in Santa Clara County grew by 4.6 percent; employment in the San Francisco/San Mateo County area grew by 5.2 percent1. Unemploy-ment in the San José/Sunnyvale/Santa Clara Metropolitan Statistical area in February 2016 was 3.9 percent, one point below the national aver-age and a full two points below the state average2. These numbers reflect full employment in the truest sense, a condition found in few other areas of the country.
The region’s success is the result of an unequalled workforce that serves as the foundation of inno-vation, production and distribution of world class products and services. Bearing in mind the critical value of the region’s workforce, the CEO Business
Climate Survey asked respondents to name the three most compelling cost of living challenges for their employees and their families.
As in the past, the high cost of housing easily eclipsed all categories, with 92 percent citing this area. The percentage equals that answered in 2015 and stands as the highest since 2009. There is good reason for this concern. As a general rule of thumb, housing in the region costs approximately three times the national average, and it continues to soar. As of October 2015, the median national cost of homes remained 7 percent below the onset of the Great Recession; however, housing prices in San José were 21 percent higher for the same period3. Traffic congestion attracts the concern of two-thirds of the respondents, followed by high taxes which are cited by more than half the survey participants. But housing weighs on the minds of virtually all the respondents inasmuch it represents a potential obstacle for attracting would-be employees, and therefore a hindrance for Valley companies to maintain a first class workforce.
CEO BUSINESS CLIMATE SURVEY 2016 SILICON VALLEY LEADERSHIP GROUP
2015
2014
2013
2012
2011
87%
86%
90%
84%
2010
2009
2008
2007
2006
99%
96%
99%97%
What are the top cost of livingchallenges in Silicon Valley for
workers and families?
92%Housing costs
68%Traffic congestion
27%Child care
18%K-12 education
Percent of responderswho chose housing as the top
cost challenge from previous years.
52%High taxes
86%92%
1+1=2
Since January 1, 2015, have you added, stayedthe same or subtracted jobs in Silicon Valley?
Subtracted jobsStayed the Same
Added jobs
0% 10 20 30 40 50 60 70%
2011
2012
2013
2014
2010
2009
62% Added
7% Subtracted
2015
Stayedthe same28%
Beginning January, 2016, doesyour company expect to add jobs,
subtract jobs, or stay the same in Silicon Valley?
58% Add
Stay thesame
5% Subtract
2016
31%
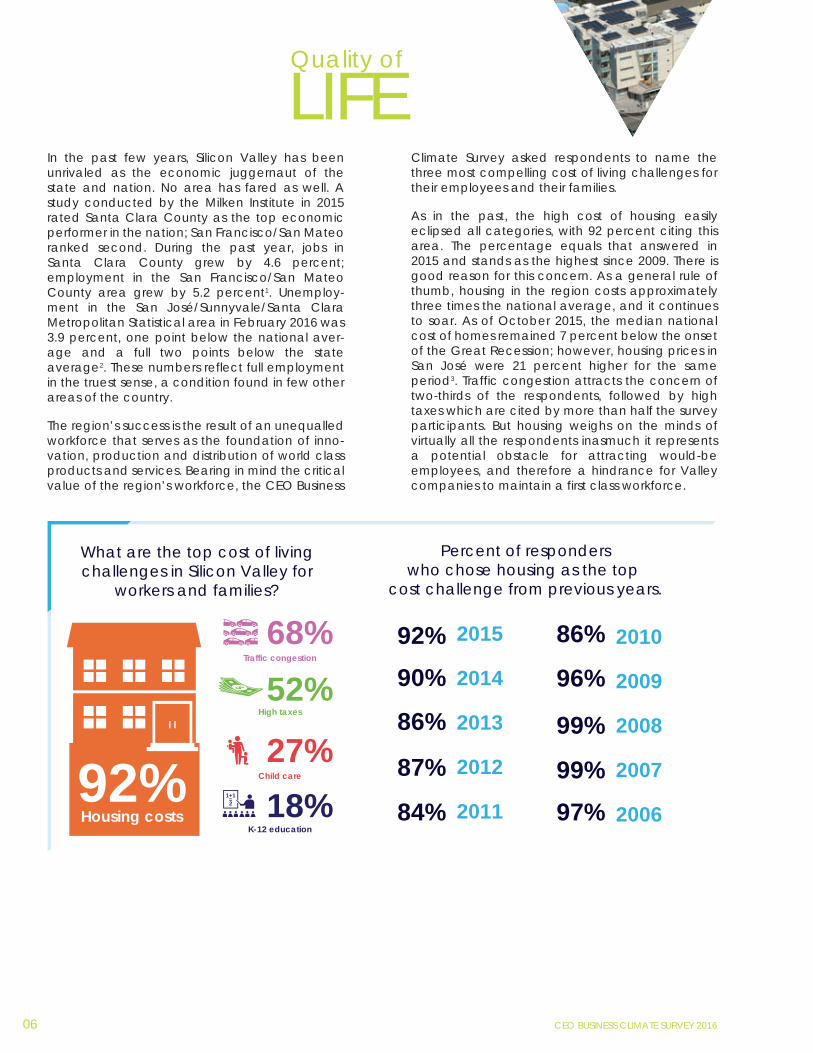
ClimateBusinessLIFE
Quality of
Employment speaks volumes about the state of an economy and the wellbeing of the community. As noted above, the economy in Silicon Valley continues to thrive. In 2015, 64 percent of the survey respondents announced they would add new employees during the coming year at a near-record pace. In fact, reality virtually matched expectations with 62 percent of the companies actually increasing the size of their workforce, which attested to the survey’s quality forecasting. All of which makes the 2016 report so important. In the current survey, 58 percent of respondents declared they would add employees before year’s end, suggesting a slight drop off from the previous year. With respect to possible employee reductions, the survey results forecast that less than 5 percent of employers will subtract jobs by the year’s end, a touch more than the 2 percent figure for the previous year. The bottom line: Employee growth continues but at a slightly less rate than 2015.
06 07
In the past few years, Silicon Valley has been unrivaled as the economic juggernaut of the state and nation. No area has fared as well. A study conducted by the Milken Institute in 2015 rated Santa Clara County as the top economic performer in the nation; San Francisco/San Mateo ranked second. During the past year, jobs in Santa Clara County grew by 4.6 percent; employment in the San Francisco/San Mateo County area grew by 5.2 percent1. Unemploy-ment in the San José/Sunnyvale/Santa Clara Metropolitan Statistical area in February 2016 was 3.9 percent, one point below the national aver-age and a full two points below the state average2. These numbers reflect full employment in the truest sense, a condition found in few other areas of the country.
The region’s success is the result of an unequalled workforce that serves as the foundation of inno-vation, production and distribution of world class products and services. Bearing in mind the critical value of the region’s workforce, the CEO Business
Climate Survey asked respondents to name the three most compelling cost of living challenges for their employees and their families.
As in the past, the high cost of housing easily eclipsed all categories, with 92 percent citing this area. The percentage equals that answered in 2015 and stands as the highest since 2009. There is good reason for this concern. As a general rule of thumb, housing in the region costs approximately three times the national average, and it continues to soar. As of October 2015, the median national cost of homes remained 7 percent below the onset of the Great Recession; however, housing prices in San José were 21 percent higher for the same period3. Traffic congestion attracts the concern of two-thirds of the respondents, followed by high taxes which are cited by more than half the survey participants. But housing weighs on the minds of virtually all the respondents inasmuch it represents a potential obstacle for attracting would-be employees, and therefore a hindrance for Valley companies to maintain a first class workforce.
CEO BUSINESS CLIMATE SURVEY 2016 SILICON VALLEY LEADERSHIP GROUP
2015
2014
2013
2012
2011
87%
86%
90%
84%
2010
2009
2008
2007
2006
99%
96%
99%97%
What are the top cost of livingchallenges in Silicon Valley for
workers and families?
92%Housing costs
68%Traffic congestion
27%Child care
18%K-12 education
Percent of responderswho chose housing as the top
cost challenge from previous years.
52%High taxes
86%92%
1+1=2
Since January 1, 2015, have you added, stayedthe same or subtracted jobs in Silicon Valley?
Subtracted jobsStayed the Same
Added jobs
0% 10 20 30 40 50 60 70%
2011
2012
2013
2014
2010
2009
62% Added
7% Subtracted
2015
Stayedthe same28%
Beginning January, 2016, doesyour company expect to add jobs,
subtract jobs, or stay the same in Silicon Valley?
58% Add
Stay thesame
5% Subtract
2016
31%
ClimateBusinessLIFE
Quality of
08 09CEO BUSINESS CLIMATE SURVEY 2016 SILICON VALLEY LEADERSHIP GROUP
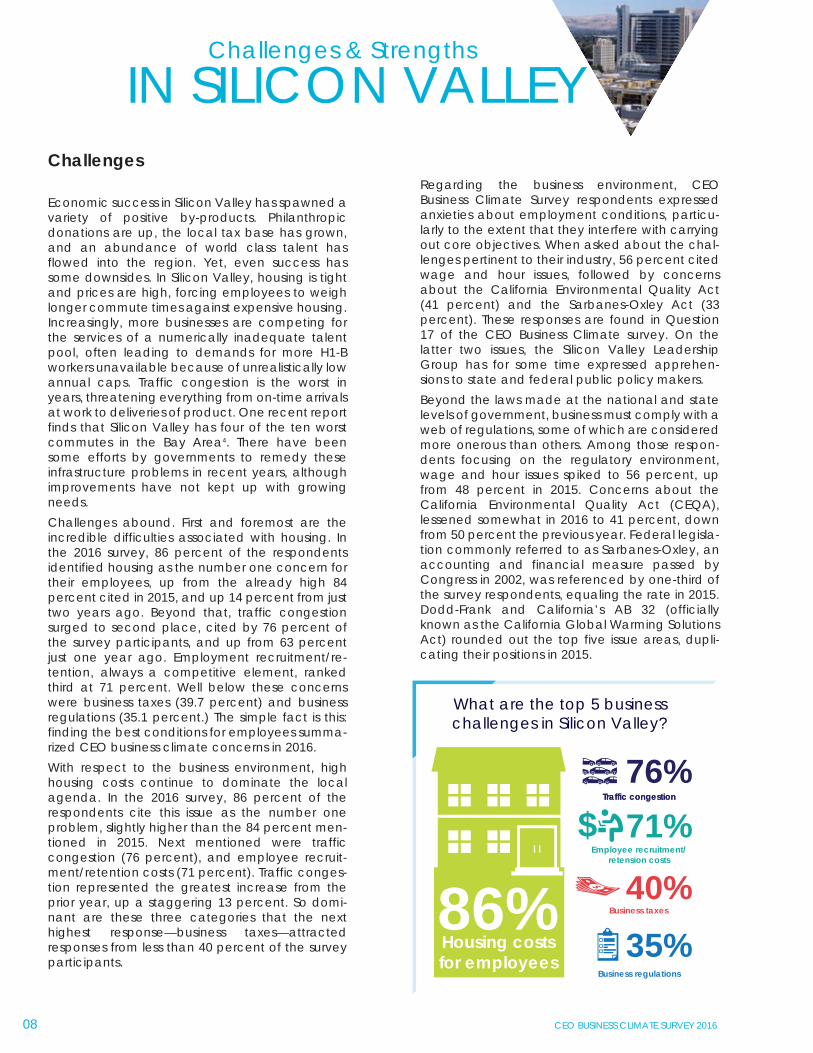
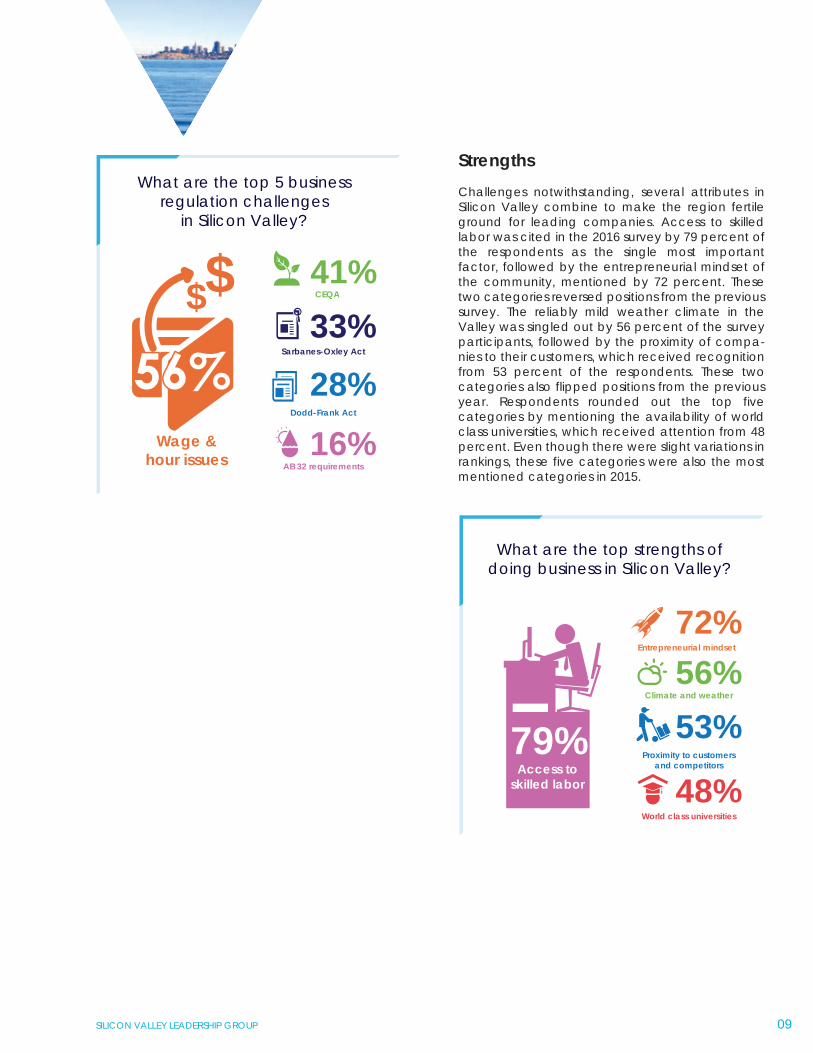
IN SILICON VALLEYStrengthsChallenges notwithstanding, several attributes in Silicon Valley combine to make the region fertile ground for leading companies. Access to skilled labor was cited in the 2016 survey by 79 percent of the respondents as the single most important factor, followed by the entrepreneurial mindset of the community, mentioned by 72 percent. These two categories reversed positions from the previous survey. The reliably mild weather climate in the Valley was singled out by 56 percent of the survey participants, followed by the proximity of compa-nies to their customers, which received recognition from 53 percent of the respondents. These two categories also flipped positions from the previous year. Respondents rounded out the top five categories by mentioning the availability of world class universities, which received attention from 48 percent. Even though there were slight variations in rankings, these five categories were also the most mentioned categories in 2015.
Challenges & Strengths
What are the top 5 businesschallenges in Silicon Valley?
86%Housing costsfor employees
71%Employee recruitment/
retension costs
35%Business regulations
$76%
Traffic congestionTraffic congestion
40%Business taxes
What are the top 5 businessregulation challenges
in Silicon Valley?
41%
Wage &hour issues
CEQA$$
28%Dodd-Frank Act
33%Sarbanes-Oxley Act
16%AB 32 requirements
What are the top strengths ofdoing business in Silicon Valley?
72%Entrepreneurial mindset
53%Proximity to customers
and competitors
48%World class universities
56%Climate and weather
79%Access to
skilled labor
Challenges
Economic success in Silicon Valley has spawned a variety of positive by-products. Philanthropic donations are up, the local tax base has grown, and an abundance of world class talent has flowed into the region. Yet, even success has some downsides. In Silicon Valley, housing is tight and prices are high, forcing employees to weigh longer commute times against expensive housing. Increasingly, more businesses are competing for the services of a numerically inadequate talent pool, often leading to demands for more H1-B workers unavailable because of unrealistically low annual caps. Traffic congestion is the worst in years, threatening everything from on-time arrivals at work to deliveries of product. One recent report finds that Silicon Valley has four of the ten worst commutes in the Bay Area4. There have been some efforts by governments to remedy these infrastructure problems in recent years, although improvements have not kept up with growing needs.Challenges abound. First and foremost are the incredible difficulties associated with housing. In the 2016 survey, 86 percent of the respondents identified housing as the number one concern for their employees, up from the already high 84 percent cited in 2015, and up 14 percent from just two years ago. Beyond that, traffic congestion surged to second place, cited by 76 percent of the survey participants, and up from 63 percent just one year ago. Employment recruitment/re-tention, always a competitive element, ranked third at 71 percent. Well below these concerns were business taxes (39.7 percent) and business regulations (35.1 percent.) The simple fact is this: finding the best conditions for employees summa-rized CEO business climate concerns in 2016. With respect to the business environment, high housing costs continue to dominate the local agenda. In the 2016 survey, 86 percent of the respondents cite this issue as the number one problem, slightly higher than the 84 percent men-tioned in 2015. Next mentioned were traffic congestion (76 percent), and employee recruit-ment/retention costs (71 percent). Traffic conges-tion represented the greatest increase from the prior year, up a staggering 13 percent. So domi-nant are these three categories that the next highest response—business taxes—attracted responses from less than 40 percent of the survey participants.
Regarding the business environment, CEO Business Climate Survey respondents expressed anxieties about employment conditions, particu-larly to the extent that they interfere with carrying out core objectives. When asked about the chal-lenges pertinent to their industry, 56 percent cited wage and hour issues, followed by concerns about the California Environmental Quality Act (41 percent) and the Sarbanes-Oxley Act (33 percent). These responses are found in Question 17 of the CEO Business Climate survey. On the latter two issues, the Silicon Valley Leadership Group has for some time expressed apprehen-sions to state and federal public policy makers. Beyond the laws made at the national and state levels of government, business must comply with a web of regulations, some of which are considered more onerous than others. Among those respon-dents focusing on the regulatory environment, wage and hour issues spiked to 56 percent, up from 48 percent in 2015. Concerns about the California Environmental Quality Act (CEQA), lessened somewhat in 2016 to 41 percent, down from 50 percent the previous year. Federal legisla-tion commonly referred to as Sarbanes-Oxley, an accounting and financial measure passed by Congress in 2002, was referenced by one-third of the survey respondents, equaling the rate in 2015. Dodd-Frank and California’s AB 32 (officially known as the California Global Warming Solutions Act) rounded out the top five issue areas, dupli-cating their positions in 2015.
08 09CEO BUSINESS CLIMATE SURVEY 2016 SILICON VALLEY LEADERSHIP GROUP
IN SILICON VALLEYStrengthsChallenges notwithstanding, several attributes in Silicon Valley combine to make the region fertile ground for leading companies. Access to skilled labor was cited in the 2016 survey by 79 percent of the respondents as the single most important factor, followed by the entrepreneurial mindset of the community, mentioned by 72 percent. These two categories reversed positions from the previous survey. The reliably mild weather climate in the Valley was singled out by 56 percent of the survey participants, followed by the proximity of compa-nies to their customers, which received recognition from 53 percent of the respondents. These two categories also flipped positions from the previous year. Respondents rounded out the top five categories by mentioning the availability of world class universities, which received attention from 48 percent. Even though there were slight variations in rankings, these five categories were also the most mentioned categories in 2015.
Challenges & Strengths
What are the top 5 businesschallenges in Silicon Valley?
86%Housing costsfor employees
71%Employee recruitment/
retension costs
35%Business regulations
$76%
Traffic congestionTraffic congestion
40%Business taxes
What are the top 5 businessregulation challenges
in Silicon Valley?
41%
Wage &hour issues
CEQA$$
28%Dodd-Frank Act
33%Sarbanes-Oxley Act
16%AB 32 requirements
What are the top strengths ofdoing business in Silicon Valley?
72%Entrepreneurial mindset
53%Proximity to customers
and competitors
48%World class universities
56%Climate and weather
79%Access to
skilled labor
Challenges
Economic success in Silicon Valley has spawned a variety of positive by-products. Philanthropic donations are up, the local tax base has grown, and an abundance of world class talent has flowed into the region. Yet, even success has some downsides. In Silicon Valley, housing is tight and prices are high, forcing employees to weigh longer commute times against expensive housing. Increasingly, more businesses are competing for the services of a numerically inadequate talent pool, often leading to demands for more H1-B workers unavailable because of unrealistically low annual caps. Traffic congestion is the worst in years, threatening everything from on-time arrivals at work to deliveries of product. One recent report finds that Silicon Valley has four of the ten worst commutes in the Bay Area4. There have been some efforts by governments to remedy these infrastructure problems in recent years, although improvements have not kept up with growing needs.Challenges abound. First and foremost are the incredible difficulties associated with housing. In the 2016 survey, 86 percent of the respondents identified housing as the number one concern for their employees, up from the already high 84 percent cited in 2015, and up 14 percent from just two years ago. Beyond that, traffic congestion surged to second place, cited by 76 percent of the survey participants, and up from 63 percent just one year ago. Employment recruitment/re-tention, always a competitive element, ranked third at 71 percent. Well below these concerns were business taxes (39.7 percent) and business regulations (35.1 percent.) The simple fact is this: finding the best conditions for employees summa-rized CEO business climate concerns in 2016. With respect to the business environment, high housing costs continue to dominate the local agenda. In the 2016 survey, 86 percent of the respondents cite this issue as the number one problem, slightly higher than the 84 percent men-tioned in 2015. Next mentioned were traffic congestion (76 percent), and employee recruit-ment/retention costs (71 percent). Traffic conges-tion represented the greatest increase from the prior year, up a staggering 13 percent. So domi-nant are these three categories that the next highest response—business taxes—attracted responses from less than 40 percent of the survey participants.
Regarding the business environment, CEO Business Climate Survey respondents expressed anxieties about employment conditions, particu-larly to the extent that they interfere with carrying out core objectives. When asked about the chal-lenges pertinent to their industry, 56 percent cited wage and hour issues, followed by concerns about the California Environmental Quality Act (41 percent) and the Sarbanes-Oxley Act (33 percent). These responses are found in Question 17 of the CEO Business Climate survey. On the latter two issues, the Silicon Valley Leadership Group has for some time expressed apprehen-sions to state and federal public policy makers. Beyond the laws made at the national and state levels of government, business must comply with a web of regulations, some of which are considered more onerous than others. Among those respon-dents focusing on the regulatory environment, wage and hour issues spiked to 56 percent, up from 48 percent in 2015. Concerns about the California Environmental Quality Act (CEQA), lessened somewhat in 2016 to 41 percent, down from 50 percent the previous year. Federal legisla-tion commonly referred to as Sarbanes-Oxley, an accounting and financial measure passed by Congress in 2002, was referenced by one-third of the survey respondents, equaling the rate in 2015. Dodd-Frank and California’s AB 32 (officially known as the California Global Warming Solutions Act) rounded out the top five issue areas, dupli-cating their positions in 2015.
Throughout history, business and government have had a complex relationship. It’s no different today. On the one hand, they serve different constituencies. Businesses employ workers who create products, which in turn, are sold and distributed to customers. Governments exist to provide a framework for society, generating funds for that framework from taxes and then using those funds to distribute various services to the public. At first blush, it would seem that these two bodies operate in different environments with different objectives. Of course, we know this is not entirely the case.
More than ever, the 21st century economy consists of complex interaction between the private and public sectors. Bearing in mind this relationship, the Silicon Valley Leadership Group provides data, reports, and analy-ses for government leaders on a continuing basis. Information is shared through a variety of conduits, including symposia, exchanges between the corporate sector and academia, and one-on-one meetings between Lead-ership Group members and elected officials and regulators in Sacramento and Washington, D.C. These commu-nications strategies are critical to policy makers, who often benefit from insights they otherwise would not have. At the state level, Leadership Group members pay close attention to the governor, legislators, and regulators, where they seek to find common ground on issues of concern.
Legislation
With an economy equal to that of the seventh largest nation in the world, California stands out as the nation’s most populous and important state. The legislative process in the Golden State is extraordinarily complicated due to the large number of bills introduced each two-year session (typically between 4,500 and 5,000), the com-mittee system, and leadership in the two legislative chambers. Generally speaking, close to half of the bills pass both chambers, and about 85 percent of those are signed into law by the governor. On this complex network of activities, part of the work of the Silicon Valley Leadership Group centers on recommending legislation impor-tant to the members and the general community as well as following and speaking on proposals wending their way through the legislative process.
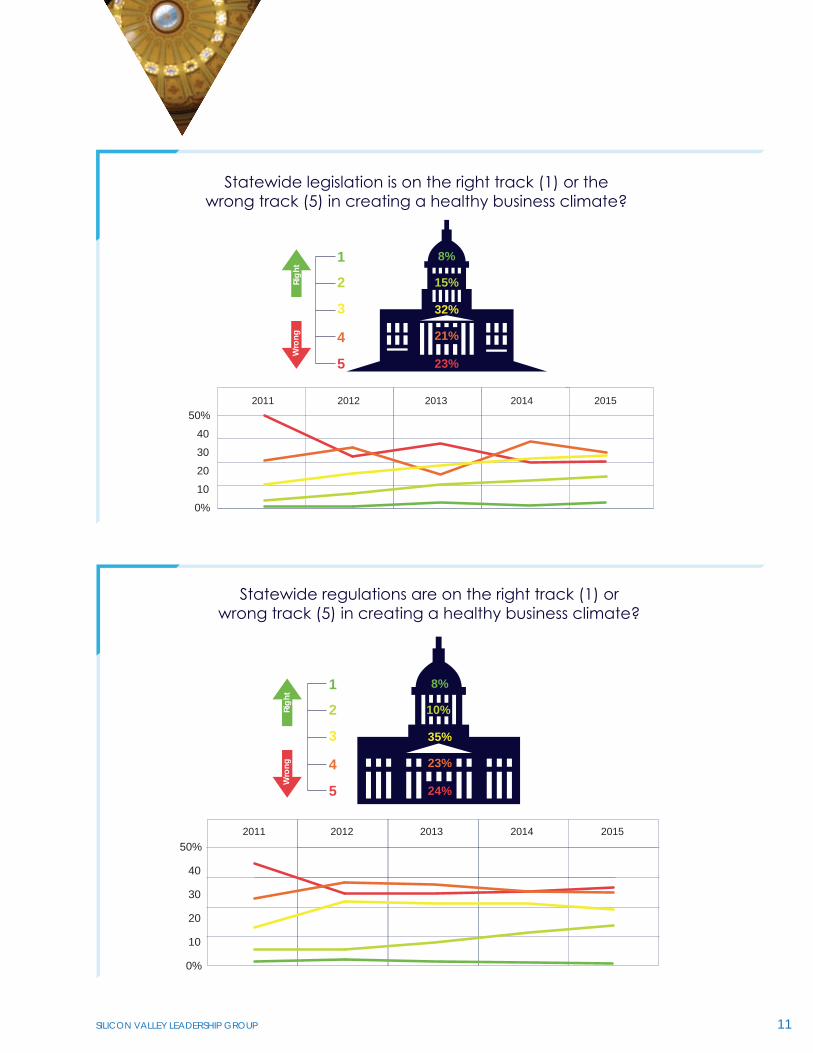
Of particular concern are issues such as K-12 public education funding, transportation and other infrastructure components, environmental management, workplace conditions, and regulation and taxation. In one way or another, each of these broad areas intersects with longstanding efforts of Leadership Group companies to keep the local economy successful and vibrant. All of which begs the question, how is the state legislature perform-ing? In keeping with past surveys, the 2016 instrument asked respondents to evaluate the legislature’s work over the past year on a one-to-five scale, with one being the best and five being the worst. For the 2016 survey, 44 percent classified the legislature’s policies as being on “the wrong track” (categories 4 and 5 combined), whereas 23 percent declared the legislature’s policies on “the right track” (categories 1 and 2 combined). These data show a marked improvement from 2015, when 53 percent viewed the legislature on “the wrong track” and 18 percent classified the legislature on “the right track.” Of significance is that the 2016 responses show better scores for the state legislature for the second consecutive year.
Regulations
Beyond the legislative arena, California has a catacomb of more than 200 regulatory agencies and 100 boards. Often removed from the public eye, these policy making bodies have major impacts on businesses and the general economy. Whether on working conditions, environmental rules, licensing requirements, or other condi-tions, these agencies can either impede or facilitate economic growth and vitality. In the 2016 survey, respon-dents continued past evaluations with negative reviews of the state’s regulatory apparatus, although the criticism was a bit diminished; 47 percent declared regulatory activities on “the wrong track,” compared with 18 percent who said they were on “the right track.” For 2015, the responses were 60 percent and 19 percent, respectively. Although the evaluations of the state regulatory environment have improved a bit in 2016, they still are negative by a greater than two-to-one margin.
10 11CEO BUSINESS CLIMATE SURVEY 2016 SILICON VALLEY LEADERSHIP GROUP
OFFICIALSElected
8%
15%
32%
21%
23%
1
2
3
4
5
Righ
tW
rong
Statewide legislation is on the right track (1) or thewrong track (5) in creating a healthy business climate?
2011 2012 2013 2014 2015
0%10203040
50%
8%
10%
35%
23%
24%
1
2
3
4
5
Righ
tW
rong
Statewide regulations are on the right track (1) orwrong track (5) in creating a healthy business climate?
2011 2012 2013 2014 2015
0%
10
20
30
40
50%
Throughout history, business and government have had a complex relationship. It’s no different today. On the one hand, they serve different constituencies. Businesses employ workers who create products, which in turn, are sold and distributed to customers. Governments exist to provide a framework for society, generating funds for that framework from taxes and then using those funds to distribute various services to the public. At first blush, it would seem that these two bodies operate in different environments with different objectives. Of course, we know this is not entirely the case.
More than ever, the 21st century economy consists of complex interaction between the private and public sectors. Bearing in mind this relationship, the Silicon Valley Leadership Group provides data, reports, and analy-ses for government leaders on a continuing basis. Information is shared through a variety of conduits, including symposia, exchanges between the corporate sector and academia, and one-on-one meetings between Lead-ership Group members and elected officials and regulators in Sacramento and Washington, D.C. These commu-nications strategies are critical to policy makers, who often benefit from insights they otherwise would not have. At the state level, Leadership Group members pay close attention to the governor, legislators, and regulators, where they seek to find common ground on issues of concern.
Legislation
With an economy equal to that of the seventh largest nation in the world, California stands out as the nation’s most populous and important state. The legislative process in the Golden State is extraordinarily complicated due to the large number of bills introduced each two-year session (typically between 4,500 and 5,000), the com-mittee system, and leadership in the two legislative chambers. Generally speaking, close to half of the bills pass both chambers, and about 85 percent of those are signed into law by the governor. On this complex network of activities, part of the work of the Silicon Valley Leadership Group centers on recommending legislation impor-tant to the members and the general community as well as following and speaking on proposals wending their way through the legislative process.
Of particular concern are issues such as K-12 public education funding, transportation and other infrastructure components, environmental management, workplace conditions, and regulation and taxation. In one way or another, each of these broad areas intersects with longstanding efforts of Leadership Group companies to keep the local economy successful and vibrant. All of which begs the question, how is the state legislature perform-ing? In keeping with past surveys, the 2016 instrument asked respondents to evaluate the legislature’s work over the past year on a one-to-five scale, with one being the best and five being the worst. For the 2016 survey, 44 percent classified the legislature’s policies as being on “the wrong track” (categories 4 and 5 combined), whereas 23 percent declared the legislature’s policies on “the right track” (categories 1 and 2 combined). These data show a marked improvement from 2015, when 53 percent viewed the legislature on “the wrong track” and 18 percent classified the legislature on “the right track.” Of significance is that the 2016 responses show better scores for the state legislature for the second consecutive year.
Regulations
Beyond the legislative arena, California has a catacomb of more than 200 regulatory agencies and 100 boards. Often removed from the public eye, these policy making bodies have major impacts on businesses and the general economy. Whether on working conditions, environmental rules, licensing requirements, or other condi-tions, these agencies can either impede or facilitate economic growth and vitality. In the 2016 survey, respon-dents continued past evaluations with negative reviews of the state’s regulatory apparatus, although the criticism was a bit diminished; 47 percent declared regulatory activities on “the wrong track,” compared with 18 percent who said they were on “the right track.” For 2015, the responses were 60 percent and 19 percent, respectively. Although the evaluations of the state regulatory environment have improved a bit in 2016, they still are negative by a greater than two-to-one margin.
10 11CEO BUSINESS CLIMATE SURVEY 2016 SILICON VALLEY LEADERSHIP GROUP
OFFICIALSElected
8%
15%
32%
21%
23%
1
2
3
4
5
Righ
tW
rong
Statewide legislation is on the right track (1) or thewrong track (5) in creating a healthy business climate?
2011 2012 2013 2014 2015
0%10203040
50%
8%
10%
35%
23%
24%
1
2
3
4
5
Righ
tW
rong
Statewide regulations are on the right track (1) orwrong track (5) in creating a healthy business climate?
2011 2012 2013 2014 2015
0%
10
20
30
40
50%
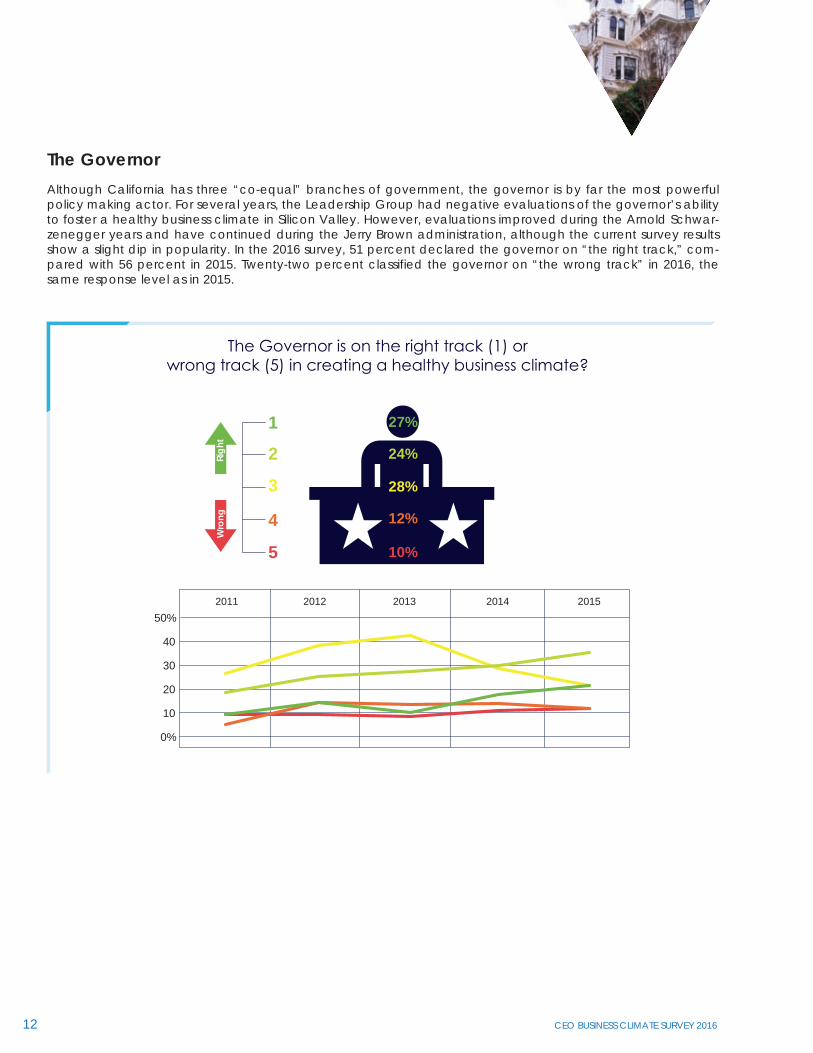
The GovernorAlthough California has three “co-equal” branches of government, the governor is by far the most powerful policy making actor. For several years, the Leadership Group had negative evaluations of the governor’s ability to foster a healthy business climate in Silicon Valley. However, evaluations improved during the Arnold Schwar-zenegger years and have continued during the Jerry Brown administration, although the current survey results show a slight dip in popularity. In the 2016 survey, 51 percent declared the governor on “the right track,” com-pared with 56 percent in 2015. Twenty-two percent classified the governor on “the wrong track” in 2016, the same response level as in 2015.
GovernmentIMPROVING
As an organization dedicated to promoting world class public policy in the region, state and nation, the Silicon Valley Leadership Group dedicates considerable resources to improving the working conditions and quality of life in California and the Valley. Locally, the organization has vigorously promoted voter approval on transporta-tion, environmental, education and affordable housing measures, including a $12 parcel tax on the June 7, 2016 ballot for Bay Area counties to protect San Francisco Bay. Whether on working conditions, environmental rules, licensing requirements, or other conditions, the Leadership Group has sought to better the setting for its member companies, employees, and society at all levels of governmental activity.
12 13CEO BUSINESS CLIMATE SURVEY 2016 SILICON VALLEY LEADERSHIP GROUP
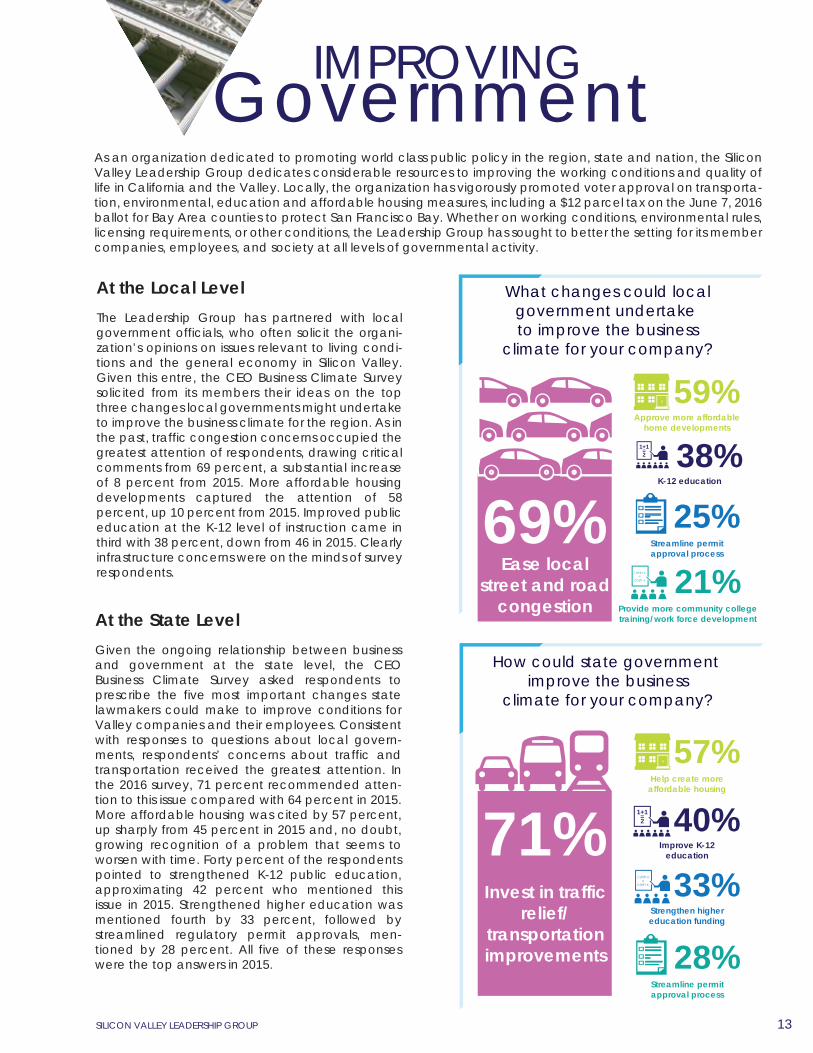
At the Local LevelThe Leadership Group has partnered with local government officials, who often solicit the organi-zation’s opinions on issues relevant to living condi-tions and the general economy in Silicon Valley. Given this entre, the CEO Business Climate Survey solicited from its members their ideas on the top three changes local governments might undertake to improve the business climate for the region. As in the past, traffic congestion concerns occupied the greatest attention of respondents, drawing critical comments from 69 percent, a substantial increase of 8 percent from 2015. More affordable housing developments captured the attention of 58 percent, up 10 percent from 2015. Improved public education at the K-12 level of instruction came in third with 38 percent, down from 46 in 2015. Clearly infrastructure concerns were on the minds of survey respondents.
At the State LevelGiven the ongoing relationship between business and government at the state level, the CEO Business Climate Survey asked respondents to prescribe the five most important changes state lawmakers could make to improve conditions for Valley companies and their employees. Consistent with responses to questions about local govern-ments, respondents’ concerns about traffic and transportation received the greatest attention. In the 2016 survey, 71 percent recommended atten-tion to this issue compared with 64 percent in 2015. More affordable housing was cited by 57 percent, up sharply from 45 percent in 2015 and, no doubt, growing recognition of a problem that seems to worsen with time. Forty percent of the respondents pointed to strengthened K-12 public education, approximating 42 percent who mentioned this issue in 2015. Strengthened higher education was mentioned fourth by 33 percent, followed by streamlined regulatory permit approvals, men-tioned by 28 percent. All five of these responses were the top answers in 2015.
27%
24%
28%
12%
10%
1
2
3
4
5
Righ
tW
rong
The Governor is on the right track (1) orwrong track (5) in creating a healthy business climate?
0%
10
20
30
40
50%2011 2012 2013 2014 2015
What changes could localgovernment undertake to improve the business
climate for your company?
69%Ease local
street and roadcongestion
59%Approve more affordable
home developments
25%Streamline permitapproval process
38%K-12 education
1+1=2
21%Provide more community collegetraining/work force development
How could state government improve the business
climate for your company?
71%Invest in traffic
relief/transportationimprovements
40%Improve K-12
education
1+1=2
33%Strengthen highereducation funding
57%Help create more
affordable housing
28%Streamline permitapproval process
The GovernorAlthough California has three “co-equal” branches of government, the governor is by far the most powerful policy making actor. For several years, the Leadership Group had negative evaluations of the governor’s ability to foster a healthy business climate in Silicon Valley. However, evaluations improved during the Arnold Schwar-zenegger years and have continued during the Jerry Brown administration, although the current survey results show a slight dip in popularity. In the 2016 survey, 51 percent declared the governor on “the right track,” com-pared with 56 percent in 2015. Twenty-two percent classified the governor on “the wrong track” in 2016, the same response level as in 2015.
GovernmentIMPROVING
As an organization dedicated to promoting world class public policy in the region, state and nation, the Silicon Valley Leadership Group dedicates considerable resources to improving the working conditions and quality of life in California and the Valley. Locally, the organization has vigorously promoted voter approval on transporta-tion, environmental, education and affordable housing measures, including a $12 parcel tax on the June 7, 2016 ballot for Bay Area counties to protect San Francisco Bay. Whether on working conditions, environmental rules, licensing requirements, or other conditions, the Leadership Group has sought to better the setting for its member companies, employees, and society at all levels of governmental activity.
12 13CEO BUSINESS CLIMATE SURVEY 2016 SILICON VALLEY LEADERSHIP GROUP
At the Local LevelThe Leadership Group has partnered with local government officials, who often solicit the organi-zation’s opinions on issues relevant to living condi-tions and the general economy in Silicon Valley. Given this entre, the CEO Business Climate Survey solicited from its members their ideas on the top three changes local governments might undertake to improve the business climate for the region. As in the past, traffic congestion concerns occupied the greatest attention of respondents, drawing critical comments from 69 percent, a substantial increase of 8 percent from 2015. More affordable housing developments captured the attention of 58 percent, up 10 percent from 2015. Improved public education at the K-12 level of instruction came in third with 38 percent, down from 46 in 2015. Clearly infrastructure concerns were on the minds of survey respondents.
At the State LevelGiven the ongoing relationship between business and government at the state level, the CEO Business Climate Survey asked respondents to prescribe the five most important changes state lawmakers could make to improve conditions for Valley companies and their employees. Consistent with responses to questions about local govern-ments, respondents’ concerns about traffic and transportation received the greatest attention. In the 2016 survey, 71 percent recommended atten-tion to this issue compared with 64 percent in 2015. More affordable housing was cited by 57 percent, up sharply from 45 percent in 2015 and, no doubt, growing recognition of a problem that seems to worsen with time. Forty percent of the respondents pointed to strengthened K-12 public education, approximating 42 percent who mentioned this issue in 2015. Strengthened higher education was mentioned fourth by 33 percent, followed by streamlined regulatory permit approvals, men-tioned by 28 percent. All five of these responses were the top answers in 2015.
27%
24%
28%
12%
10%
1
2
3
4
5
Righ
tW
rong
The Governor is on the right track (1) orwrong track (5) in creating a healthy business climate?
0%
10
20
30
40
50%2011 2012 2013 2014 2015
What changes could localgovernment undertake to improve the business
climate for your company?
69%Ease local
street and roadcongestion
59%Approve more affordable
home developments
25%Streamline permitapproval process
38%K-12 education
1+1=2
21%Provide more community collegetraining/work force development
How could state government improve the business
climate for your company?
71%Invest in traffic
relief/transportationimprovements
40%Improve K-12
education
1+1=2
33%Strengthen highereducation funding
57%Help create more
affordable housing
28%Streamline permitapproval process
At the State LevelGiven the ongoing relationship between business and government at the state level, the CEO Business Climate Survey asked respondents to prescribe the five most important changes state lawmakers could make to improve conditions for Valley companies and their employees. Consistent with responses to questions about local govern-ments, respondents’ concerns about traffic and transportation received the greatest attention. In the 2016 survey, 71 percent recommended atten-tion to this issue compared with 64 percent in 2015. More affordable housing was cited by 57 percent, up sharply from 45 percent in 2015 and, no doubt, growing recognition of a problem that seems to worsen with time. Forty percent of the respondents pointed to strengthened K-12 public education, approximating 42 percent who mentioned this issue in 2015. Strengthened higher education was mentioned fourth by 33 percent, followed by streamlined regulatory permit approvals, men-tioned by 28 percent. All five of these responses were the top answers in 2015.
GovernmentImproving
IssuesAs part of its effort to gauge member concerns, the CEO Business Climate Survey routinely enquires about loom-ing public policy issues. In the 2016 report, members were asked about the Trans-Pacific Partnership trade pack-age, the state surplus, and a proposal to add a “gross receipts tax” on San José businesses with annual revenues of one million dollars or more, whether they are profitable or not.
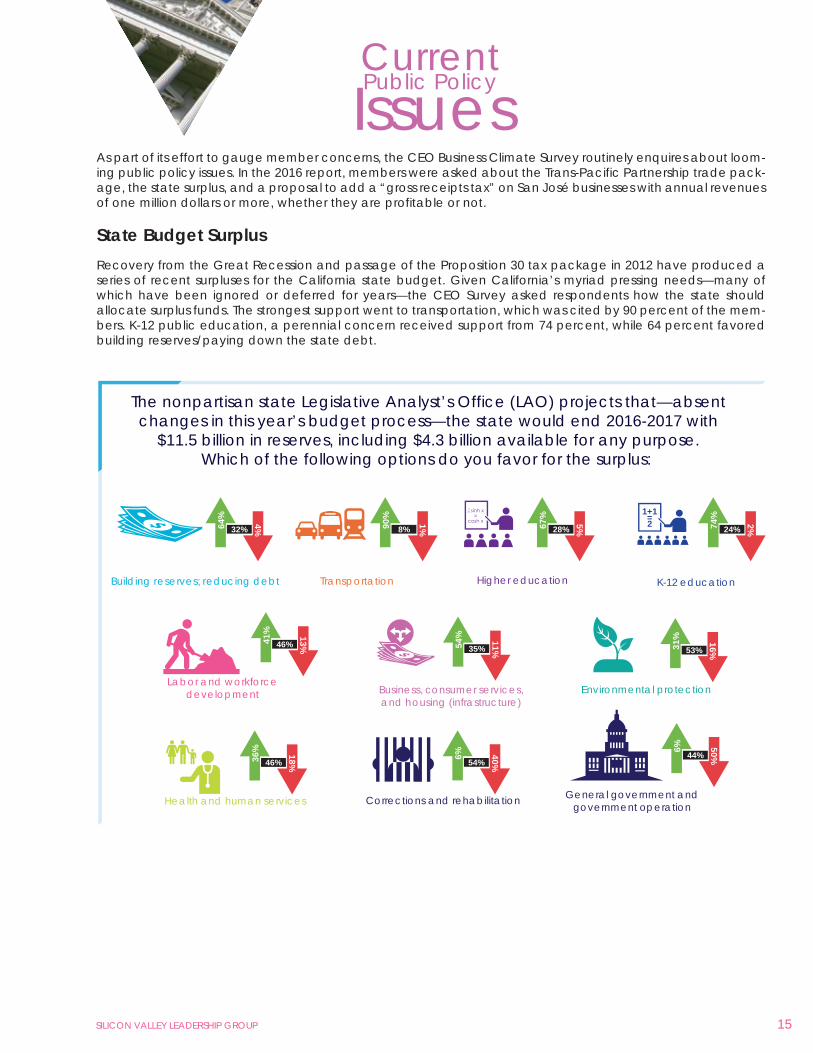
State Budget SurplusRecovery from the Great Recession and passage of the Proposition 30 tax package in 2012 have produced a series of recent surpluses for the California state budget. Given California’s myriad pressing needs—many of which have been ignored or deferred for years—the CEO Survey asked respondents how the state should allocate surplus funds. The strongest support went to transportation, which was cited by 90 percent of the mem-bers. K-12 public education, a perennial concern received support from 74 percent, while 64 percent favored building reserves/paying down the state debt.
14 15CEO BUSINESS CLIMATE SURVEY 2016 SILICON VALLEY LEADERSHIP GROUP
Public PolicyCurrent
The nonpartisan state Legislative Analyst’s Office (LAO) projects that—absentchanges in this year’s budget process—the state would end 2016-2017 with
$11.5 billion in reserves, including $4.3 billion available for any purpose.Which of the following options do you favor for the surplus:
90%
8%
1%
Transportation
31%
53%
16%
Environmental protection
41%
46%
13%
Labor and workforcedevelopment
6% 44%
50%
General government andgovernment operation
64%
32%
4%
Building reserves; reducing debt
1+1=2 74%
24%
2%
K-12 education
67%
28%
5%
Higher education
36%
46%
18%
Health and human services
6% 54%
40%
Corrections and rehabilitation
54%
35%
11%
Business, consumer services,and housing (infrastructure)
How could federal governmentimprove the business climate
for your company?
28%Repatriation of
foreign earnings
$$$
53%H1-b visa/green card reform
56%Comprehensive
tax reform
47%Cybersecurity
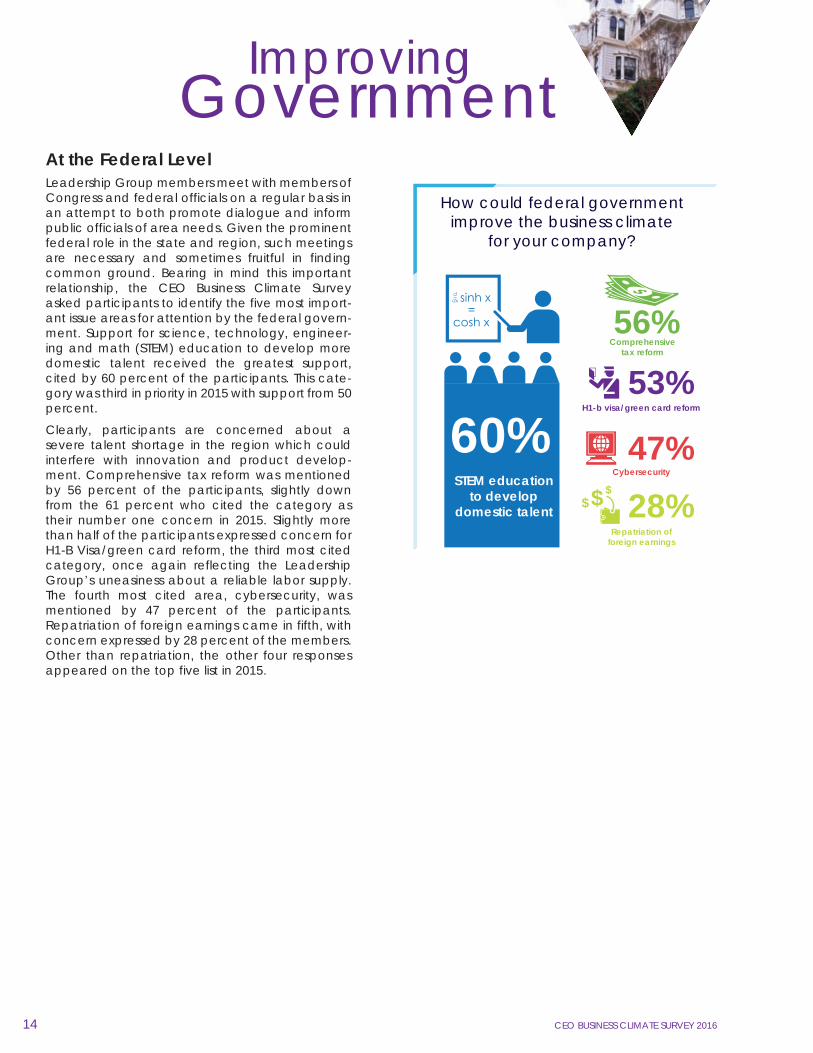
60%STEM education
to developdomestic talent
At the Federal LevelLeadership Group members meet with members of Congress and federal officials on a regular basis in an attempt to both promote dialogue and inform public officials of area needs. Given the prominent federal role in the state and region, such meetings are necessary and sometimes fruitful in finding common ground. Bearing in mind this important relationship, the CEO Business Climate Survey asked participants to identify the five most import-ant issue areas for attention by the federal govern-ment. Support for science, technology, engineer-ing and math (STEM) education to develop more domestic talent received the greatest support, cited by 60 percent of the participants. This cate-gory was third in priority in 2015 with support from 50 percent.
Clearly, participants are concerned about a severe talent shortage in the region which could interfere with innovation and product develop-ment. Comprehensive tax reform was mentioned by 56 percent of the participants, slightly down from the 61 percent who cited the category as their number one concern in 2015. Slightly more than half of the participants expressed concern for H1-B Visa/green card reform, the third most cited category, once again reflecting the Leadership Group’s uneasiness about a reliable labor supply. The fourth most cited area, cybersecurity, was mentioned by 47 percent of the participants. Repatriation of foreign earnings came in fifth, with concern expressed by 28 percent of the members. Other than repatriation, the other four responses appeared on the top five list in 2015.
At the State LevelGiven the ongoing relationship between business and government at the state level, the CEO Business Climate Survey asked respondents to prescribe the five most important changes state lawmakers could make to improve conditions for Valley companies and their employees. Consistent with responses to questions about local govern-ments, respondents’ concerns about traffic and transportation received the greatest attention. In the 2016 survey, 71 percent recommended atten-tion to this issue compared with 64 percent in 2015. More affordable housing was cited by 57 percent, up sharply from 45 percent in 2015 and, no doubt, growing recognition of a problem that seems to worsen with time. Forty percent of the respondents pointed to strengthened K-12 public education, approximating 42 percent who mentioned this issue in 2015. Strengthened higher education was mentioned fourth by 33 percent, followed by streamlined regulatory permit approvals, men-tioned by 28 percent. All five of these responses were the top answers in 2015.
GovernmentImproving
IssuesAs part of its effort to gauge member concerns, the CEO Business Climate Survey routinely enquires about loom-ing public policy issues. In the 2016 report, members were asked about the Trans-Pacific Partnership trade pack-age, the state surplus, and a proposal to add a “gross receipts tax” on San José businesses with annual revenues of one million dollars or more, whether they are profitable or not.
State Budget SurplusRecovery from the Great Recession and passage of the Proposition 30 tax package in 2012 have produced a series of recent surpluses for the California state budget. Given California’s myriad pressing needs—many of which have been ignored or deferred for years—the CEO Survey asked respondents how the state should allocate surplus funds. The strongest support went to transportation, which was cited by 90 percent of the mem-bers. K-12 public education, a perennial concern received support from 74 percent, while 64 percent favored building reserves/paying down the state debt.
14 15CEO BUSINESS CLIMATE SURVEY 2016 SILICON VALLEY LEADERSHIP GROUP
Public PolicyCurrent
The nonpartisan state Legislative Analyst’s Office (LAO) projects that—absentchanges in this year’s budget process—the state would end 2016-2017 with
$11.5 billion in reserves, including $4.3 billion available for any purpose.Which of the following options do you favor for the surplus:
90%
8%
1%
Transportation
31%
53%
16%
Environmental protection
41%
46%
13%
Labor and workforcedevelopment
6% 44%
50%
General government andgovernment operation
64%
32%
4%
Building reserves; reducing debt
1+1=2 74%
24%
2%
K-12 education
67%
28%
5%
Higher education
36%
46%
18%
Health and human services
6% 54%
40%
Corrections and rehabilitation
54%
35%
11%
Business, consumer services,and housing (infrastructure)
How could federal governmentimprove the business climate
for your company?
28%Repatriation of
foreign earnings
$$$
53%H1-b visa/green card reform
56%Comprehensive
tax reform
47%Cybersecurity
60%STEM education
to developdomestic talent
At the Federal LevelLeadership Group members meet with members of Congress and federal officials on a regular basis in an attempt to both promote dialogue and inform public officials of area needs. Given the prominent federal role in the state and region, such meetings are necessary and sometimes fruitful in finding common ground. Bearing in mind this important relationship, the CEO Business Climate Survey asked participants to identify the five most import-ant issue areas for attention by the federal govern-ment. Support for science, technology, engineer-ing and math (STEM) education to develop more domestic talent received the greatest support, cited by 60 percent of the participants. This cate-gory was third in priority in 2015 with support from 50 percent.
Clearly, participants are concerned about a severe talent shortage in the region which could interfere with innovation and product develop-ment. Comprehensive tax reform was mentioned by 56 percent of the participants, slightly down from the 61 percent who cited the category as their number one concern in 2015. Slightly more than half of the participants expressed concern for H1-B Visa/green card reform, the third most cited category, once again reflecting the Leadership Group’s uneasiness about a reliable labor supply. The fourth most cited area, cybersecurity, was mentioned by 47 percent of the participants. Repatriation of foreign earnings came in fifth, with concern expressed by 28 percent of the members. Other than repatriation, the other four responses appeared on the top five list in 2015.
Results from the 2016 CEO Business Climate Survey would seem to suggest a sense of ongoing but cautious optimism for the Leadership Group, their employees, and Silicon Valley. On the one hand, Valley companies intend to expand in the coming year, although not quite at the rate of the previous year. The governor continues to have strong support and concerns about constraining regulations has abated a bit. On the other hand, Valley companies persist with concerns about high housing costs for employees, worries about K-12 public education, and a potentially untrained and unreliable labor pool. In short, this is a time to be vigilant.
Threats to the region abound, ranging from an outdated H1-B program to an outmoded transportation network which threatens delivery of products as well as the commuting abilities of employees. The uncertain status of the Trans-Pacific Partnership trade agreement and the potential of new taxes are new causes for concern in the short term. In a competitive environment such as this, small changes can lead to big problems.
Some elected officials are clearly aware of the dynamic tensions in the region and have shown a willingness to partner with the Leadership Group on important issues such as sales tax increases for public safety and other pressing needs, the Housing Trust Silicon Valley, and the extension of the Bay Area Rapid Transit system. These successes may well serve as templates for other areas of cooperation in the future.
-Larry N. Gerston
______________________________________________________________________________________
1. “State’s golden for job market,” San José Mercury News, December 10, 2015, pp. B5, B6.
2. San José/Sunnyvale/Santa Clara Metropolitan Statistical Area, State of California, Employment Development Department, March 18, 2016, http://www.calmis.ca.gov/file/lfmonth/sjos$pds.pdf.
3. “These numbers show some of the biggest tech companies are driving Bay Area’s housing prices to crazy levels,” Bay Area Insider, http://www.businessinsider.com/bay-area-housing-prices-by-zillow-report-2015-11, November 13, 2015.
4. “Avoid Highway 101 like the plague, new transit study implies,” Silicon Valley Business Journal, December 18, 2015, http://www.bizjournals.com/sanjose/news/2015/12/18/avoid-highway-101-like-the-plague-new.html.
5. “Signing of Trans-Pacific Partnership trade deal opens up tough battle in U.S.,” Los Angeles Times, February 4, 2016, http://www.latimes.com/business/la-fi-pacific-trade-agreement-signed-20160204-story.html.
16 17
Conclusion
CEO BUSINESS CLIMATE SURVEY 2016 SILICON VALLEY LEADERSHIP GROUP
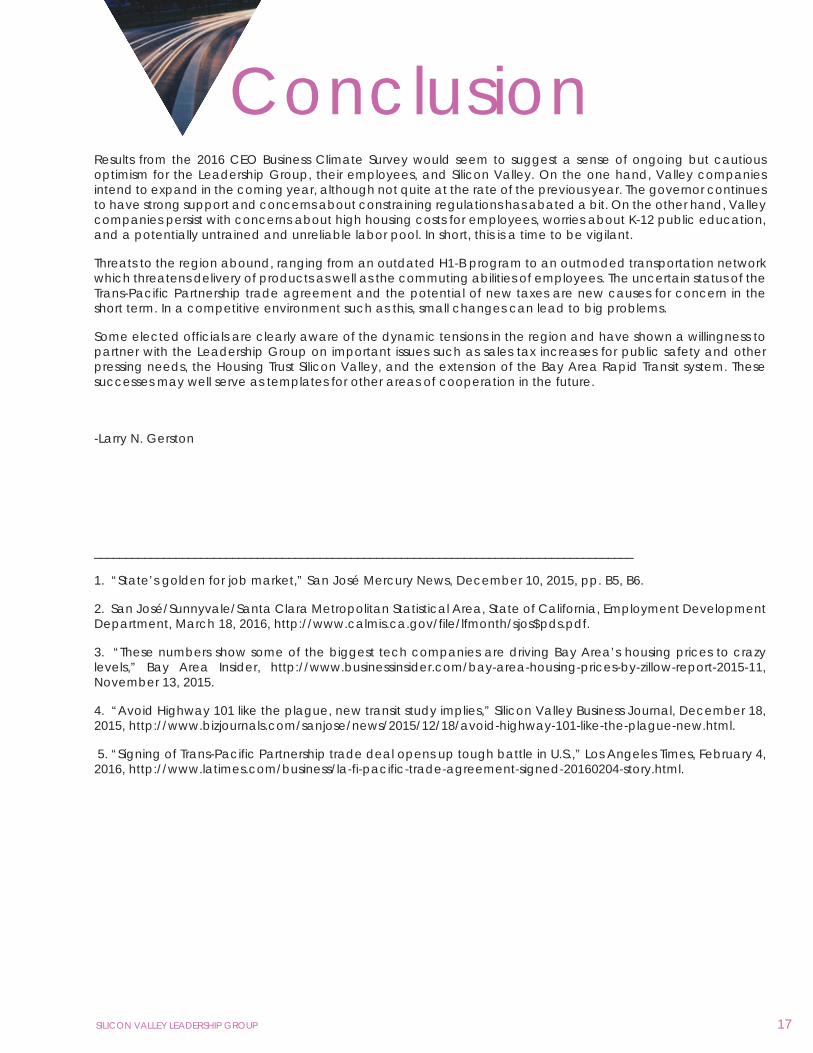
San José Gross Receipts TaxIn recent months, some critics of San José’s revenue structure have called on the city to adopt a “gross receipts tax” on any business with annual receipts of one million dollars or more, whether it is profitable or not. At the time of the survey, this was a fluid question which might be resolved through a policy change by the San José City Council or the voters in a future election. Given that fair taxation is a concern of many Leadership Group members, the CEO Survey asked how their companies would respond to a seven fold increase in the business tax collected. Most members oppose the idea in various degrees. More than one-third (35 percent) said such a change would discourage their com-pany from locating in San José. Fifteen percent replied that the new tax would discourage their company from expanding in San José, and 10 percent replied that their company would consider locations other than San José. Forty-one percent said the new tax would have no impact on their companies.
The City of San José is consideringadoption of an annual “GrossReceipts Tax”on business that
have annual receipts of$1 million or more. If thetax is passed, would this
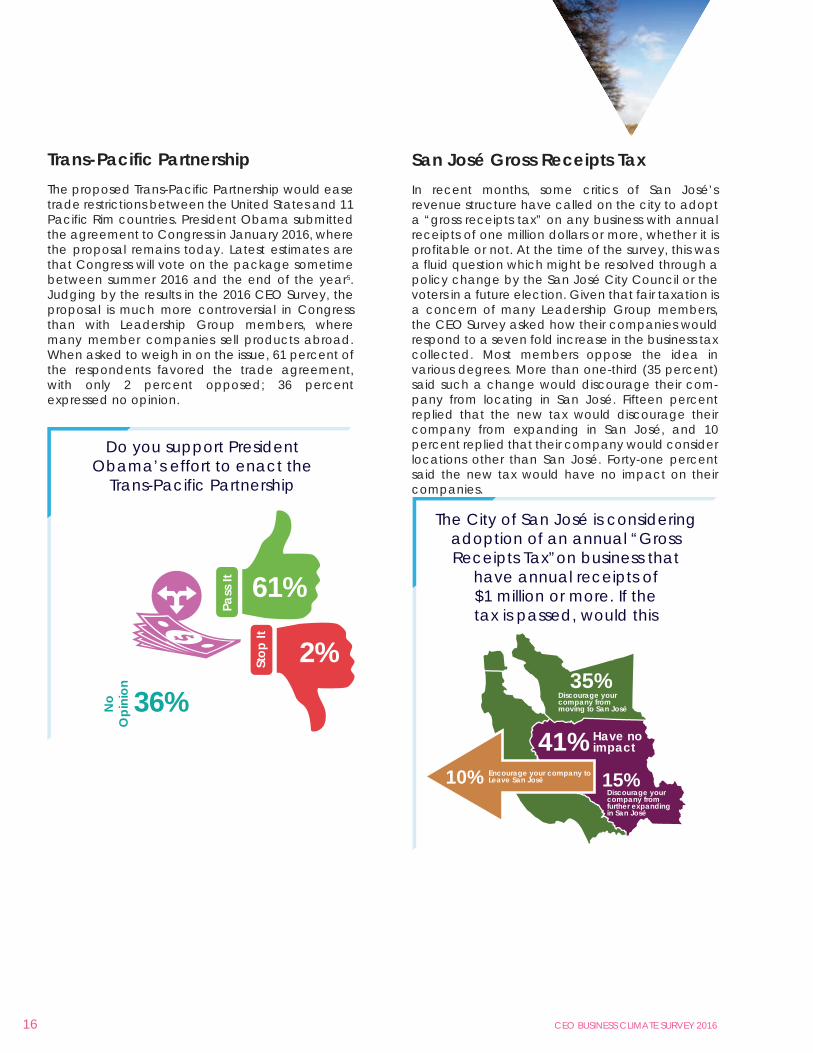
Trans-Pacific PartnershipThe proposed Trans-Pacific Partnership would ease trade restrictions between the United States and 11 Pacific Rim countries. President Obama submitted the agreement to Congress in January 2016, where the proposal remains today. Latest estimates are that Congress will vote on the package sometime between summer 2016 and the end of the year5. Judging by the results in the 2016 CEO Survey, the proposal is much more controversial in Congress than with Leadership Group members, where many member companies sell products abroad. When asked to weigh in on the issue, 61 percent of the respondents favored the trade agreement, with only 2 percent opposed; 36 percent expressed no opinion.
Do you support PresidentObama’s effort to enact the
Trans-Pacific Partnership
Pass
It 61%
Stop
It 2%
No
Opi
nion 36%
Discourage yourcompany fromfurther expandingin San José
10% Encourage your company toLeave San José
Have noimpact41%
Discourage yourcompany frommoving to San José
35%
15%
Results from the 2016 CEO Business Climate Survey would seem to suggest a sense of ongoing but cautious optimism for the Leadership Group, their employees, and Silicon Valley. On the one hand, Valley companies intend to expand in the coming year, although not quite at the rate of the previous year. The governor continues to have strong support and concerns about constraining regulations has abated a bit. On the other hand, Valley companies persist with concerns about high housing costs for employees, worries about K-12 public education, and a potentially untrained and unreliable labor pool. In short, this is a time to be vigilant.
Threats to the region abound, ranging from an outdated H1-B program to an outmoded transportation network which threatens delivery of products as well as the commuting abilities of employees. The uncertain status of the Trans-Pacific Partnership trade agreement and the potential of new taxes are new causes for concern in the short term. In a competitive environment such as this, small changes can lead to big problems.
Some elected officials are clearly aware of the dynamic tensions in the region and have shown a willingness to partner with the Leadership Group on important issues such as sales tax increases for public safety and other pressing needs, the Housing Trust Silicon Valley, and the extension of the Bay Area Rapid Transit system. These successes may well serve as templates for other areas of cooperation in the future.
-Larry N. Gerston
______________________________________________________________________________________
1. “State’s golden for job market,” San José Mercury News, December 10, 2015, pp. B5, B6.
2. San José/Sunnyvale/Santa Clara Metropolitan Statistical Area, State of California, Employment Development Department, March 18, 2016, http://www.calmis.ca.gov/file/lfmonth/sjos$pds.pdf.
3. “These numbers show some of the biggest tech companies are driving Bay Area’s housing prices to crazy levels,” Bay Area Insider, http://www.businessinsider.com/bay-area-housing-prices-by-zillow-report-2015-11, November 13, 2015.
4. “Avoid Highway 101 like the plague, new transit study implies,” Silicon Valley Business Journal, December 18, 2015, http://www.bizjournals.com/sanjose/news/2015/12/18/avoid-highway-101-like-the-plague-new.html.
5. “Signing of Trans-Pacific Partnership trade deal opens up tough battle in U.S.,” Los Angeles Times, February 4, 2016, http://www.latimes.com/business/la-fi-pacific-trade-agreement-signed-20160204-story.html.
16 17
Conclusion
CEO BUSINESS CLIMATE SURVEY 2016 SILICON VALLEY LEADERSHIP GROUP
San José Gross Receipts TaxIn recent months, some critics of San José’s revenue structure have called on the city to adopt a “gross receipts tax” on any business with annual receipts of one million dollars or more, whether it is profitable or not. At the time of the survey, this was a fluid question which might be resolved through a policy change by the San José City Council or the voters in a future election. Given that fair taxation is a concern of many Leadership Group members, the CEO Survey asked how their companies would respond to a seven fold increase in the business tax collected. Most members oppose the idea in various degrees. More than one-third (35 percent) said such a change would discourage their com-pany from locating in San José. Fifteen percent replied that the new tax would discourage their company from expanding in San José, and 10 percent replied that their company would consider locations other than San José. Forty-one percent said the new tax would have no impact on their companies.
The City of San José is consideringadoption of an annual “GrossReceipts Tax”on business that
have annual receipts of$1 million or more. If thetax is passed, would this
Trans-Pacific PartnershipThe proposed Trans-Pacific Partnership would ease trade restrictions between the United States and 11 Pacific Rim countries. President Obama submitted the agreement to Congress in January 2016, where the proposal remains today. Latest estimates are that Congress will vote on the package sometime between summer 2016 and the end of the year5. Judging by the results in the 2016 CEO Survey, the proposal is much more controversial in Congress than with Leadership Group members, where many member companies sell products abroad. When asked to weigh in on the issue, 61 percent of the respondents favored the trade agreement, with only 2 percent opposed; 36 percent expressed no opinion.
Do you support PresidentObama’s effort to enact the
Trans-Pacific Partnership
Pass
It 61%
Stop
It 2%
No
Opi
nion 36%
Discourage yourcompany fromfurther expandingin San José
10% Encourage your company toLeave San José
Have noimpact41%
Discourage yourcompany frommoving to San José
35%
15%
18 CEO BUSINESS CLIMATE SURVEY 2016 SILICON VALLEY LEADERSHIP GROUP 19
15. What are the top five business challenges in Silicon Valley?
High housing costs for employeesTraffic congestionEmployee recruitment / retention costsBusiness taxesBusiness regulationsImmigration: H1-B visas and / or green cardsShortage of Skilled workersHealth care costsFrivolous lawsuitsWorkers' compensation costsEnergy costsWaterIntellectual property protection costsLack of skilled workersAccess to capitalPaid family leaveAir transportation / cargoDon't know/no answerOther, please specify
149132124696152373424201412101055327
85.6%75.9%71.3%39.7%35.1%29.9%21.3%19.5%13.8%11.5%8.0%6.9%5.7%5.7%2.9%2.9%1.7%1.1%4.0%
16. Because you answered "Business Regulations" forbusiness challenges, which of thefollowing challenges applied:
Wage and hour issuesCalifornia Environmental Quality Act (CEQA)Sarbanes-Oxley ActDodd-Frank Act (a.k.a. financial services reform), including the Volker RuleAB 32 requirements, including Cap-and-TradeGreen chemistry regulationsImport-export controlsDon't know/no answerOther, please specify
34252017
1010829
55.7%41.0%32.8%27.9%
16.4%16.4%13.1%3.3%14.8%
17. What are the top three cost of living challengesin Silicon Valley for workers and their families?
Housing CostsTraffic CongestionHigh TaxesChild Care CostsHealth CareK-12 EducationHigher EducationEnergy CostsDon't Know/No answerOther, please specify
1571158845312312920
92.4%67.6%51.8%26.5%18.2%13.5%7.1%5.3%1.2%0.0%
18. What top three changes could local government undertaketo improve the business climate for your company?
Ease local street and road congestionApprove more affordable home developmentsImprove K-12 public educationStreamline permit approval processProvide more community college raining/work force developmentReduce public pension costsFund more street maintenance/pothole repairsImprove public safetyEnhance arts and cultureProvide more parks and open spaceDon't know/no answerOther, please specify
117101654336
32251784412
68.8%59.4%38.2%25.3%21.2%
18.8%14.7%10.0%4.7%2.4%2.4%7.1%
19. What top five actions could the state government taketo improve the business climate for your company?
Invest in traffic relief / transportation improvementsHelp create more affordable housingStrengthen K-12 education fundingStrengthen higher education fundingStreamline regulatory and permit approvalsLimit frivolous lawsuitsReform California Environmental Quality Act (CEQA), stop the abuses from CEQAEnhance and make permanent the research and development tax creditFurther reduce public pension costsInvest in broadband deploymentReduce workers compensation ratesProvide a financing mechanism for water infrastructure improvements and promote water supply reliabilityOffer full sales tax exemption for purchases of manufacturing equipmentLower energy costsAdopt performance-based budgetingAvoid split roll taxDon’t know/no answerOther, please specify
120976756474644
38
37252523
22
18171374
71.0%57.4%39.6%33.1%27.8%27.2%26.0%
22.5%
21.9%14.8%14.8%13.6%
13.0%
10.7%10.1%7.7%4.1%2.4%
20. Which 5 of the following issue areas deserve the mostattention from the federal government for Silicon Valley:
STEM (science, technology, engineering and math) education to develop domestic talentComprehensive tax reformH1-B visa / green card reformCybersecurityRepatriation of foreign earningsFederal debt and deficitClimate change legislation to reduce greenhouse gases and increase energy securityIntellectual property protectionComprehensive energy policiesDodd-Frank reform, a.k.a. financial services reformsThe Trans-Pacific Partnership (Trade Agreement w/ 12 Asia Pacific Countries)Internet privacyImplementation of the Patient Protection and Affordable Care Act of 2010, a.k.a. national comprehensive health care reformSarbanes-Oxley reformBroadband deploymentOther, please specify
101
958979474642
36353430
2625
19188
59.8%
56.2%52.7%46.7%27.8%27.2%24.9%
21.3%20.7%20.1%17.8%
15.4%14.8%
11.2%10.7%4.7%
YesNo
12843
74.9%25.1%
21. Does your company have a physicalpresence in states other than California?
Full Survey
2. Number of employees in Silicon Valley:
1-2021-100101-500501-1,0001,001-5,0005,001-10,00010,001 or higherDon’t know/no answer
3731392232953
20.8%17.4%21.9%12.4%18.0%5.1%2.8%1.7%
3. Since January 1, 2015, have you added, stayedthe same or subtracted jobs in Silicon Valley?
Added jobsStayed the sameSubtracted jobsDon’t know/no answer
11049136
61.8%27.5%7.3%3.4%
4. If added, how many?1-2021-100101-250251-500501-1,000More than 1,000Don’t know/no answer
4938115231
45.0%34.9%10.1%4.6%1.8%2.8%0.9%
5. If subtracted, how many?
1-2021-100101-250251-500501-1,000More than 1,000Don’t know/no answer
3621100
23.1%46.2%15.4%7.7%7.7%0.0%0.0%
6. Beginning January, 2016, does your company expectto add jobs, subtract jobs, or stay the same in Silicon Valley?
Add JobsStay the SameSubtract JobsDon't Know/No Answer
10254811
58.3%30.9%4.6%6.3%
7. How many jobs do you expect to add?
1-2021-100101-250251-500501-1000More than 1000Don’t Know/No Answer
572466018
55.9%23.5%5.9%5.9%0.0%1.0%7.8%
8. How many jobs do you expect to subtract?
1-2021-100 101-250251-500501-1000More than 1000Don't know/no answer
5500013
35.7%35.7%0.0%0.0%0.0%7.1%
21.4%
9. Did your company move jobs to another state since January 1, 2015?YesNo Don't know/no answer
341328
19.5%75.9%4.6%
10. What was the MOST important reason your companymoved jobs out of the U.S. since January 1, 2015?
State and corporate taxesReduced labor costsProximity to customersOtherMore available workforceLower land / lower infrastructure costsLess regulationGovernment incentives in new location / lack of tax policy incentives in CADon't know/no answerOther
145442100006
38.9%13.9%11.1%11.1%5.6%2.8%0.0%0.0%0.0%0.0%
16.7%
11. Did your company move jobs to another country since January 1, 2015?
Yes No Don't know/no answer
251418
14.4%81.0%4.6%
12. What was the most important reason your company moved jobsout of the U.S. since January 1, 2015?
Reduced labor costsGovernment incentives in new locationMore available workforceProximity to customersLess federal regulationLower land / lower infrastructure costsMore convenient supply chainU.S. corporate tax ratesDon't know/no answerOther, please specify
13333111000
52.0%12.0%12.0%12.0%4.0%4.0%4.0%0.0%0.0%0.0%
13. How do you see job growth in Silicon Valleyin your industry sector in 2016?
Better Worse No change Don't know/no answer
14. What are the top 5 benefits/strengthsof doing business in Silicon Valley?
Access to skilled laborEntrepreneurial mindsetClimate / weatherProximity to customers and competitorsWorld class universitiesAccess to venture capitalEthnic diversityMerit-based work environmentAccess to airports / seaportsArts and culturePacific Rim locationsDon’t know/no answerOther, please specify
13712497928365624534221918
79.2%71.7%56.1%53.2%48.0%37.6%35.8%26.0%19.7%12.7%11.0%0.6%4.6%
SoftwareHigh-Tech Manufacturing / SemiconductorInternet/CommunicationsFinancial / Professional / Venture CapitalEnergy / Clean Tech / UtilitiesGen. Manufacturing / Aerospace / DefenseBio-Tech / Med-Tech / PharmaEducation / UniversityHealth & Hospital SystemTransportationSocial MediaDon't know/No AnswerOther: Please specify
29252423221387743112
16.3%14.0%13.5%12.9%12.4%7.3%4.5%3.9%3.9%2.2%1.7%0.6%6.7%
1. Which of the following most closely describesyour industry sector:
Results
8328576
47.7%16.1%32.8%3.4%
18 CEO BUSINESS CLIMATE SURVEY 2016 SILICON VALLEY LEADERSHIP GROUP 19
15. What are the top five business challenges in Silicon Valley?
High housing costs for employeesTraffic congestionEmployee recruitment / retention costsBusiness taxesBusiness regulationsImmigration: H1-B visas and / or green cardsShortage of Skilled workersHealth care costsFrivolous lawsuitsWorkers' compensation costsEnergy costsWaterIntellectual property protection costsLack of skilled workersAccess to capitalPaid family leaveAir transportation / cargoDon't know/no answerOther, please specify
149132124696152373424201412101055327
85.6%75.9%71.3%39.7%35.1%29.9%21.3%19.5%13.8%11.5%8.0%6.9%5.7%5.7%2.9%2.9%1.7%1.1%4.0%
16. Because you answered "Business Regulations" forbusiness challenges, which of thefollowing challenges applied:
Wage and hour issuesCalifornia Environmental Quality Act (CEQA)Sarbanes-Oxley ActDodd-Frank Act (a.k.a. financial services reform), including the Volker RuleAB 32 requirements, including Cap-and-TradeGreen chemistry regulationsImport-export controlsDon't know/no answerOther, please specify
34252017
1010829
55.7%41.0%32.8%27.9%
16.4%16.4%13.1%3.3%14.8%
17. What are the top three cost of living challengesin Silicon Valley for workers and their families?
Housing CostsTraffic CongestionHigh TaxesChild Care CostsHealth CareK-12 EducationHigher EducationEnergy CostsDon't Know/No answerOther, please specify
1571158845312312920
92.4%67.6%51.8%26.5%18.2%13.5%7.1%5.3%1.2%0.0%
18. What top three changes could local government undertaketo improve the business climate for your company?
Ease local street and road congestionApprove more affordable home developmentsImprove K-12 public educationStreamline permit approval processProvide more community college raining/work force developmentReduce public pension costsFund more street maintenance/pothole repairsImprove public safetyEnhance arts and cultureProvide more parks and open spaceDon't know/no answerOther, please specify
117101654336
32251784412
68.8%59.4%38.2%25.3%21.2%
18.8%14.7%10.0%4.7%2.4%2.4%7.1%
19. What top five actions could the state government taketo improve the business climate for your company?
Invest in traffic relief / transportation improvementsHelp create more affordable housingStrengthen K-12 education fundingStrengthen higher education fundingStreamline regulatory and permit approvalsLimit frivolous lawsuitsReform California Environmental Quality Act (CEQA), stop the abuses from CEQAEnhance and make permanent the research and development tax creditFurther reduce public pension costsInvest in broadband deploymentReduce workers compensation ratesProvide a financing mechanism for water infrastructure improvements and promote water supply reliabilityOffer full sales tax exemption for purchases of manufacturing equipmentLower energy costsAdopt performance-based budgetingAvoid split roll taxDon’t know/no answerOther, please specify
120976756474644
38
37252523
22
18171374
71.0%57.4%39.6%33.1%27.8%27.2%26.0%
22.5%
21.9%14.8%14.8%13.6%
13.0%
10.7%10.1%7.7%4.1%2.4%
20. Which 5 of the following issue areas deserve the mostattention from the federal government for Silicon Valley:
STEM (science, technology, engineering and math) education to develop domestic talentComprehensive tax reformH1-B visa / green card reformCybersecurityRepatriation of foreign earningsFederal debt and deficitClimate change legislation to reduce greenhouse gases and increase energy securityIntellectual property protectionComprehensive energy policiesDodd-Frank reform, a.k.a. financial services reformsThe Trans-Pacific Partnership (Trade Agreement w/ 12 Asia Pacific Countries)Internet privacyImplementation of the Patient Protection and Affordable Care Act of 2010, a.k.a. national comprehensive health care reformSarbanes-Oxley reformBroadband deploymentOther, please specify
101
958979474642
36353430
2625
19188
59.8%
56.2%52.7%46.7%27.8%27.2%24.9%
21.3%20.7%20.1%17.8%
15.4%14.8%
11.2%10.7%4.7%
YesNo
12843
74.9%25.1%
21. Does your company have a physicalpresence in states other than California?
Full Survey
2. Number of employees in Silicon Valley:
1-2021-100101-500501-1,0001,001-5,0005,001-10,00010,001 or higherDon’t know/no answer
3731392232953
20.8%17.4%21.9%12.4%18.0%5.1%2.8%1.7%
3. Since January 1, 2015, have you added, stayedthe same or subtracted jobs in Silicon Valley?
Added jobsStayed the sameSubtracted jobsDon’t know/no answer
11049136
61.8%27.5%7.3%3.4%
4. If added, how many?1-2021-100101-250251-500501-1,000More than 1,000Don’t know/no answer
4938115231
45.0%34.9%10.1%4.6%1.8%2.8%0.9%
5. If subtracted, how many?
1-2021-100101-250251-500501-1,000More than 1,000Don’t know/no answer
3621100
23.1%46.2%15.4%7.7%7.7%0.0%0.0%
6. Beginning January, 2016, does your company expectto add jobs, subtract jobs, or stay the same in Silicon Valley?
Add JobsStay the SameSubtract JobsDon't Know/No Answer
102548
11
58.3%30.9%4.6%6.3%
7. How many jobs do you expect to add?
1-2021-100101-250251-500501-1000More than 1000Don’t Know/No Answer
572466018
55.9%23.5%5.9%5.9%0.0%1.0%7.8%
8. How many jobs do you expect to subtract?
1-2021-100 101-250251-500501-1000More than 1000Don't know/no answer
5500013
35.7%35.7%0.0%0.0%0.0%7.1%
21.4%
9. Did your company move jobs to another state since January 1, 2015?YesNo Don't know/no answer
341328
19.5%75.9%4.6%
10. What was the MOST important reason your companymoved jobs out of the U.S. since January 1, 2015?
State and corporate taxesReduced labor costsProximity to customersOtherMore available workforceLower land / lower infrastructure costsLess regulationGovernment incentives in new location / lack of tax policy incentives in CADon't know/no answerOther
145442100006
38.9%13.9%11.1%11.1%5.6%2.8%0.0%0.0%0.0%0.0%
16.7%
11. Did your company move jobs to another country since January 1, 2015?
Yes No Don't know/no answer
251418
14.4%81.0%4.6%
12. What was the most important reason your company moved jobsout of the U.S. since January 1, 2015?
Reduced labor costsGovernment incentives in new locationMore available workforceProximity to customersLess federal regulationLower land / lower infrastructure costsMore convenient supply chainU.S. corporate tax ratesDon't know/no answerOther, please specify
13333111000
52.0%12.0%12.0%12.0%4.0%4.0%4.0%0.0%0.0%0.0%
13. How do you see job growth in Silicon Valleyin your industry sector in 2016?
Better Worse No change Don't know/no answer
14. What are the top 5 benefits/strengthsof doing business in Silicon Valley?
Access to skilled laborEntrepreneurial mindsetClimate / weatherProximity to customers and competitorsWorld class universitiesAccess to venture capitalEthnic diversityMerit-based work environmentAccess to airports / seaportsArts and culturePacific Rim locationsDon’t know/no answerOther, please specify
13712497928365624534221918
79.2%71.7%56.1%53.2%48.0%37.6%35.8%26.0%19.7%12.7%11.0%0.6%4.6%
SoftwareHigh-Tech Manufacturing / SemiconductorInternet/CommunicationsFinancial / Professional / Venture CapitalEnergy / Clean Tech / UtilitiesGen. Manufacturing / Aerospace / DefenseBio-Tech / Med-Tech / PharmaEducation / UniversityHealth & Hospital SystemTransportationSocial MediaDon't know/No AnswerOther: Please specify
292524232213877431
12
16.3%14.0%13.5%12.9%12.4%7.3%4.5%3.9%3.9%2.2%1.7%0.6%6.7%
1. Which of the following most closely describesyour industry sector:
Results
8328576
47.7%16.1%32.8%3.4%
20 CEO BUSINESS CLIMATE SURVEY 2016 SILICON VALLEY LEADERSHIP GROUP 21
22. Please select the states in whichyou have a physical presence:
CaliforniaTexasNew YorkMassachusettsGeorgiaWashingtonColoradoFloridaIllinoisArizonaDistrict of ColumbiaOregonNew JerseyVirginiaNorth CarolinaPennsylvaniaOhioUtahMarylandTennesseeAlabamaMichiganMinnesotaNevadaConnecticutIdahoHawaiiIndianaSouth CarolinaNew HampshireKentuckyMississippiNew MexicoWisconsinLouisianaOklahomaArkansasDelawareMissouriKansasRhode IslandMaineIowaMontanaNebraskaVermontWest VirginiaAlaskaNorth DakotaSouth DakotaWyoming
72684746444442424039383631302929272725242222222220191817171615151515141413131312121110101010109666
57.1%54.0%37.3%36.5%34.9%34.9%33.3%33.3%31.7%31.0%30.2%28.6%24.6%23.8%23.0%23.0%21.4%21.4%19.8%19.0%17.5%17.5%17.5%17.5%15.9%15.1%14.3%13.5%13.5%12.7%11.9%11.9%11.9%11.9%11.1%11.1%10.3%10.3%10.3%9.5%9.5%8.7%7.9%7.9%7.9%7.9%7.9%7.1%4.8%4.8%4.8%
23. Please select the cities in whichyou have a physical presence:
San José, CaliforniaSan Francisco, CaliforniaLos Angeles, CaliforniaBoston, MassachusettsWashington, District of ColumbiaDallas, TexasSeattle, WashingtonAtlanta, GeorgiaAustin, TexasDenver, ColoradoChicago, IllinoisNew York, New YorkPhoenix, ArizonaPortland, OregonSan Diego, CaliforniaHouston, TexasOther, please specifySacramento, CaliforniaRaleigh, North Carolina
79514339383835343432323130292725242322
63.7%41.1%34.7%31.5%30.6%30.6%28.2%27.4%27.4%25.8%25.8%25.0%24.2%23.4%21.8%20.2%19.4%18.5%17.7%
24. Are you a multinational corporation?
YesNo
8685
50.3%49.7%
25. What are your top three reasons for having aphysical presence outside of the U.S.?
Closer to CustomersLower Cost of Doing BusinessTalent / WorkforceCloser to Supply ChainLower Corporate Tax RateMore Competitive Incentives than U.S.U.S. RegulationsOther, please specify
5539362618155
11
66.3%47.0%43.4%31.3%21.7%18.1%6.0%
13.3%
26. What percentage of your 2015 revenueis from sales outside of the U.S.?
0-10%11-20%21-30%31-40%41-50%51-60%61-70%71-80%81-90%91-100%
161297766533
21.6%16.2%12.2%9.5%9.5%8.1%8.1%6.8%4.1%4.1%
27. Do you support President Obama’s effort to enact the Trans-PacificPartnership
Pass it Stop it No opinion/no answer
1014
60
61.2%2.4%
36.4%
Philadelphia, PennsylvaniaMiami, FloridaOakland, CaliforniaLas Vegas, NevadaBaltimore, MarylandMinneapolis, MinnesotaDetroit, MichiganCharlotte, North CarolinaColumbus, OhioSan Antonio, TexasNashville, TennesseeTucson, ArizonaColorado Springs, ColoradoCleveland, OhioJacksonville, FloridaIndianapolis, IndianaMemphis, TennesseeFort Worth, TexasLong Beach, CaliforniaMesa, ArizonaKansas City, MissouriAlbuquerque, New MexicoOklahoma City, OklahomaMilwaukee, WisconsinLouisville, KentuckyTulsa, OklahomaEl Paso, TexasArlington, TexasFresno, CaliforniaOmaha, NebraskaVirginia Beach, VirginiaWichita, Kansas
222018181616151414141312121211111111109999988876665
17.7%16.1%14.5%14.5%12.9%12.9%12.1%11.3%11.3%11.3%10.5%9.7%9.7%9.7%8.9%8.9%8.9%8.9%8.1%7.3%7.3%7.3%7.3%7.3%6.5%6.5%6.5%5.6%4.8%4.8%4.8%4.0%
28. The nonpartisan state Legislative Analyst Office (LAO) projectsan up to $4.3 billion state budget surplus. Based on thestate's current 2016-2017 budget, which of the following areaswould you support changes in state expenditures?
K-12 educationHigher educationHealth and human servicesCorrections and rehabilitationBusiness, Consumer Services, and Housing (infrastructure)TransportationEnvironmental Protection and Natural ResourcesLabor and Workforce DevelopmentGeneral Government and Government OperationBuilding Reserves; Reducing debt
Increase Decrease Stay theSame
1039045872
13043
56
8
86
37235014
222
17
65
5
3337586747
1273
63
57
43
29. Generally speaking, would you say that:
Statewide legislationis on the righttrack (1) or thewrong track (5) increating a healthybusiness climate?
Statewide regulationsare on the righttrack (1) or wrongtrack (5) in creatinga healthy business climate?
Governor Brownis on the right track (1)or wrong track (5) in creatinga healthy business climate?
The state legislature ison the right track(1) or wrong track (5)in creating a healthybusiness climate?
8%
8%
27%
8%
15%
10%
24%
16%
32%
35%
28%
31%
21%
23%
12%
21%
23%
24%
10%
25%
3.36
3.46
2.53
3.38
30. In this economy, what should be the top threepriority issues for the Silicon Valley Leadership Groupthat would be worth your personal involvement?
Transportation Funding Measures in Santa Clara, Santa Cruz & San Francisco CountiesEducation: K-12Housing/Land UseCybersecurityImmigration Reform: H1B Visas and Green Cards for Highly Skilled WorkersTax Policy: Comprehensive Federal Tax ReformEducation: Higher EdEnvironmentRegulatory reform: California Environmental Quality Act (CEQA)EnergyHealth CareData PrivacyState Budget and Governance ReformBay Restoration & Flood ProtectionEducation: Pre-KTax Policy: State R&D Tax CreditsTrade: Enact the Trans-Pacific PartnershipOther, please specify
60
46393530
30282522
171716141312111010
39.2%
30.1%25.5%22.9%19.6%
19.6%18.3%16.3%14.4%
11.1%11.1%10.5%9.2%8.5%7.8%7.2%6.5%6.5%
31. The City of San José is considering adoption of an annual"Gross Receipts Tax" on businesses that have annual receiptsof $1 million or more. If the tax is passed, would this:
Discourage your company from locating in San JoséDiscourage your company, if already located in San José, from expanding further in San JoséEncourage your company to leave San José for other more business friendly locationsHave no impact on your decision to stay or come to San José
5624
16
66
34.6%14.8%
9.9%
40.7%
Right 2 3 4 Wrong AverageRating
Leadership Group
22 CEO BUSINESS CLIMATE SURVEY 2016
The Silicon Valley Leadership Group, founded in 1978 by David Packard of Hewlett-Packard, represents more than 400 of Silicon Valley's most respected employers on issues, programs and campaigns that affect the economic health and quality of life in Silicon Valley, including energy, transportation, education, housing, health care, tax policies, economic vitality and the environment. Leadership Group members collectively provide nearly one of every three private sector jobs in Silicon Valley.
Board Officers:Chairman: Greg Becker, SVB Financial GroupPast Chairman: Steve Berglund, Trimble NavigationPast Chairman: Tom Werner, SunPowerPast Chairman: Aart de Geus, SynopsysVice Chair: Ken Kannappan, PlantronicsSecretary/Treasurer: John Adams, Wells Fargo BankPresident & CEO: Carl Guardino, Silicon Valley Leadership Group
Board Members:Sam Alkharrat, SAPLaura Guio, IBMMartin Anstice, Lam ResearchJames Gutierrez, InsiktShellye Archambeau, MetricStreamMark Hawkins, SalesForceAndy Ball, Suffolk ConstructionJeffrey Johnson, San Francisco ChronicleGeorge Blumenthal, University of California, Santa CruzAarif Khakoo, AMGENJohn Boland, KQEDGary Lauer, eHealthChris Boyd, Kaiser PermanenteEnrique Lores, HPRami Branitzky, Sapphire VenturesMatt Mahan, BrigadeGary Briggs, Facebook Tarkan Maner, NexentaBradley J. Bullington, XenioKen McNeely, AT&THelen Burt, Pacific Gas & ElectricStephen Milligan, Western Digital CorporationBill Coleman, Veritas TechnologiesKevin Murai, SynnexDavid Cush, Virgin AmericaJes Pedersen, Webcor BuildersChristopher Dawes, Lucile Children’s Hospital StanfordKim Polese, ClearStreetMichael Engh, S.J., Santa Clara UniversityTomi Ryba, El Camino HospitalTom Fallon, InfineraAlan Salzman, Vantage Point Capital PartnersBrant Fish, ChevronRon Sege, EchelonHank Fore, ComcastTed Ullyot , Andreessen HorowitzRaquel Gonzalez, Bank of AmericaKen Xie, FortinetDoug Graham, Lockheed MartinJed York, San Francisco 49ersKen Goldman, Yahoo!
Special thanks to Catharine Ingram and Nancy Sánchez
Report Design by Colin Buckner, Creative Director
© 2016 Silicon Valley Leadership Group
Silicon Valley Leadership Group2001 Gateway Place, Suite 101E408.501.7864SVLG.ORG@SVLeadershipGrp
About the
#YesWeCode4PIAA10 NetworksAccentureAdvanced Micro Devices, Inc. (AMD)Allied Telesis Inc.ALOMAlta DevicesANAAnaerobe SystemsApple Inc.Applied MaterialsAppvanceArcus BiosciensesAvayaBank of AmericaBarclays (San Francisco)Bay Area News GroupBlach Construction CompanyBloom EnergyBoston PrivateBrigadeBridgeluxBrigadeChargePointChevron USACinnamon SolarClearStreet Inc.ComcastCommunications & Power Industries, LLCdeCartaDeloitteDignity HealthDirect Resource Management, Inc.Echelon Corp.EFIeHealth, Inc.El Camino HospitaleLynxEmpire Broadcasting CorpEnerNOC, Inc.EricssonETMExciteMEYFineliteFortinetFrontier Renewables, LLCFujifilm DimatixGilead SciencesGlencore RecyclingGlobal ThermostatGoodwill of Silicon ValleyGood Samaritan HospitalGordon BierschGreenBiz GroupGRI Technology Solutions, Inc.Heritage Bank of CommerceHipcampHuaweiInfineraInsikt, Inc.IntelliCorpIntuitive SurgicalJan MedicalJohnson & JohnsonKaiser PermanenteKeasKLA-TencorKQEDLam ResearchLawrence Livermore National LaboratoryLecorpio, LLCLockheed Martin
Lucile Packard Children's Hospital/Stanford Children's HealthLumiledsLuminixMetricStreamMetropolitan Education DistrictNASA Ames Research CenterNasdaqNextEVNortheastern UniversityOpen DataOportunOSIsoftPAMF SutterhealthPayPalPecabu Inc.Pinnacle BankPlantronics POPVOXPlanetEcosystemsPresencia, LLCProterra, Inc.PwCRippleSalesforceSan José City CollegeSan Francisco ChronicleSan José SharksSan José Water CompanySanmina CorporationSanta Clara UniversitySAPSapphire VenturesSendHubSilicon Graphics (SGI)Silicon Valley BankSilicon Valley Leadership GroupSmileyGo CorporationSnafu CorpSplunkStrykerSuffolkSunPower CorpSynapticsSYNNEX CorporationSynopsys Inc.TaosTech CUTeenForceTesseraTexas InstrumentsTrimbleTrinetTSMC NAUmpqua BankUnitiveUniversity of California Santa CruzUniversity of Notre DameUniversity of Phoenix, Bay Area CampusUPSUtilitAPIVarian Medical SystemsVerdafero IncVerizonVirgin AmericaVoomWebcor BuildersWells FargoWestern Digital
*Several company responses declined to self identify
Participants
SILICON VALLEY LEADERSHIP GROUP 23