Embed Size (px)
DESCRIPTION
good book for learning detection theory
Citation preview
SIGNAL DETECTION THEORY
Week 7 – BCS 208 Spring 2012
Baggage screening example
Signal Detection Theory
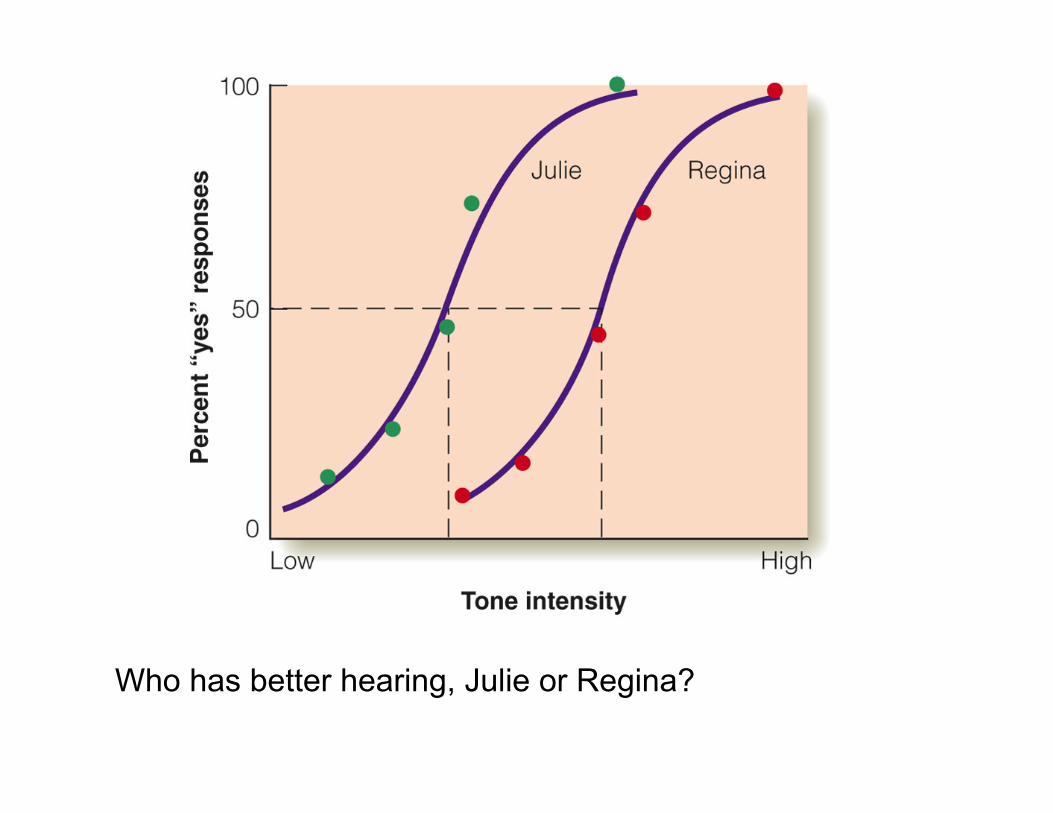
Who has better hearing, Julie or Regina?
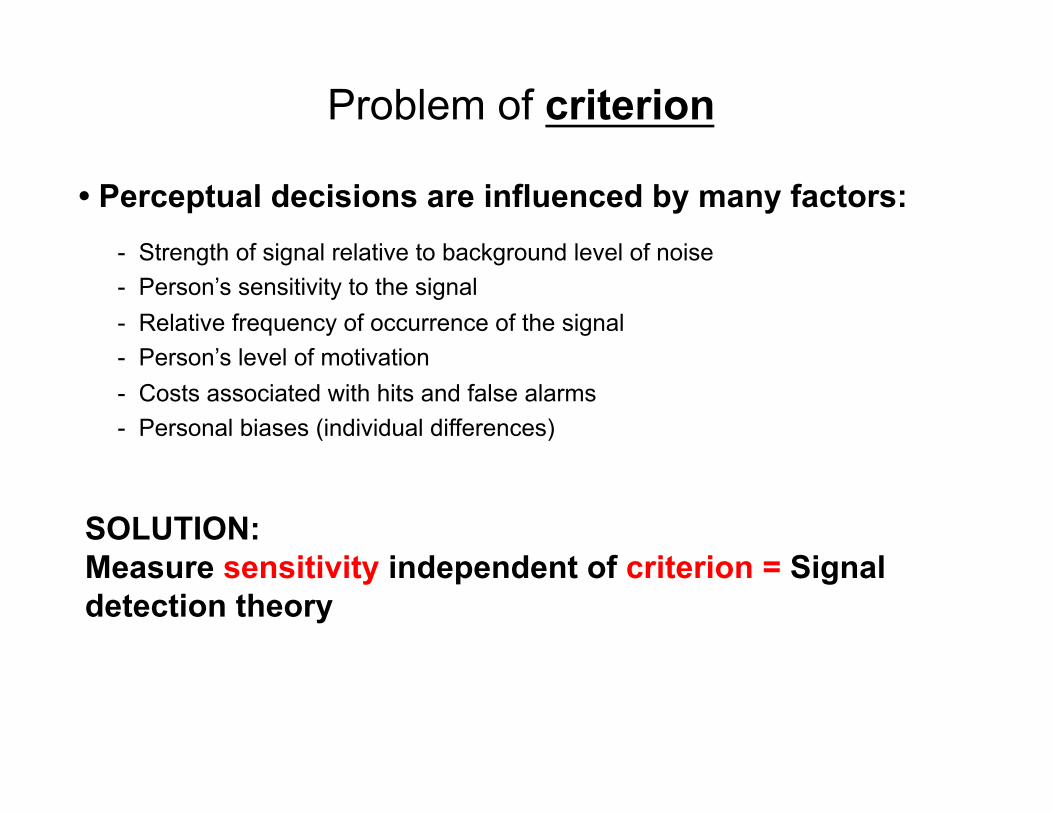
Problem of criterion
• Perceptual decisions are influenced by many factors:
SOLUTION: Measure sensitivity independent of criterion = Signal detection theory
- Strength of signal relative to background level of noise - Person’s sensitivity to the signal - Relative frequency of occurrence of the signal - Person’s level of motivation -! Costs associated with hits and false alarms -! Personal biases (individual differences)
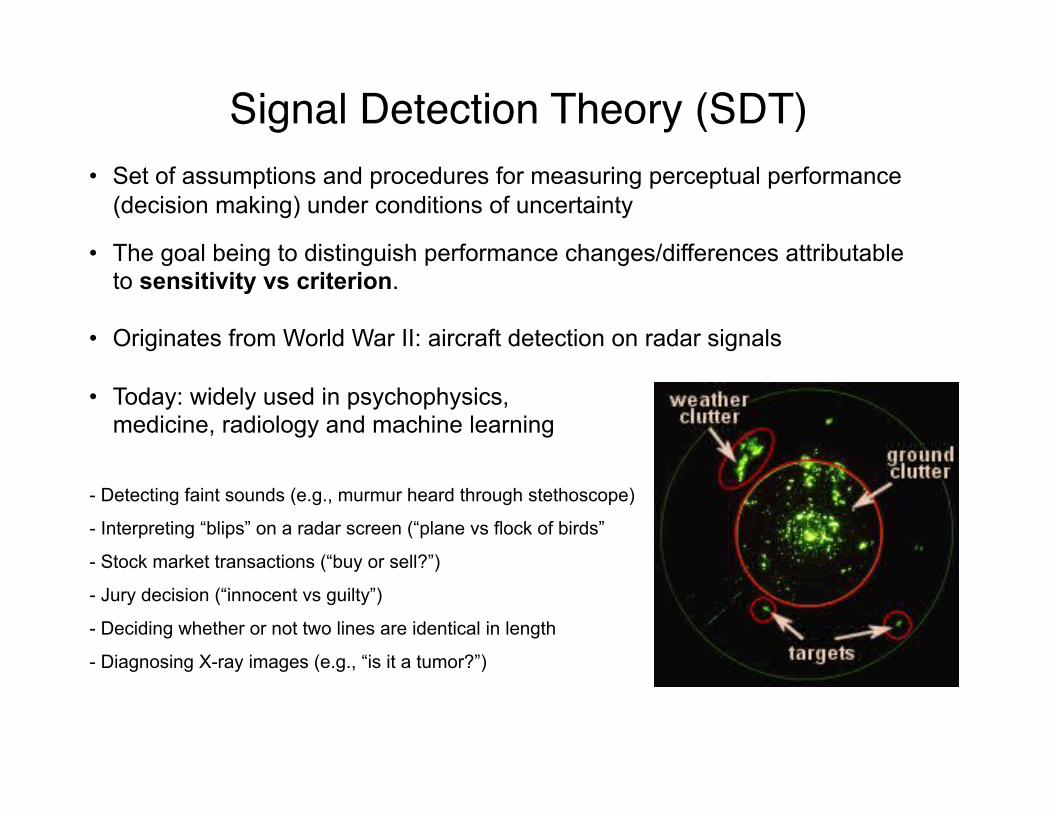
Signal Detection Theory (SDT)"
- Detecting faint sounds (e.g., murmur heard through stethoscope)
- Diagnosing X-ray images (e.g., “is it a tumor?”)
- Interpreting “blips” on a radar screen (“plane vs flock of birds”
- Stock market transactions (“buy or sell?”)
- Jury decision (“innocent vs guilty”)
- Deciding whether or not two lines are identical in length
•! Set of assumptions and procedures for measuring perceptual performance (decision making) under conditions of uncertainty
•! The goal being to distinguish performance changes/differences attributable to sensitivity vs criterion.
•! Originates from World War II: aircraft detection on radar signals
•! Today: widely used in psychophysics, medicine, radiology and machine learning
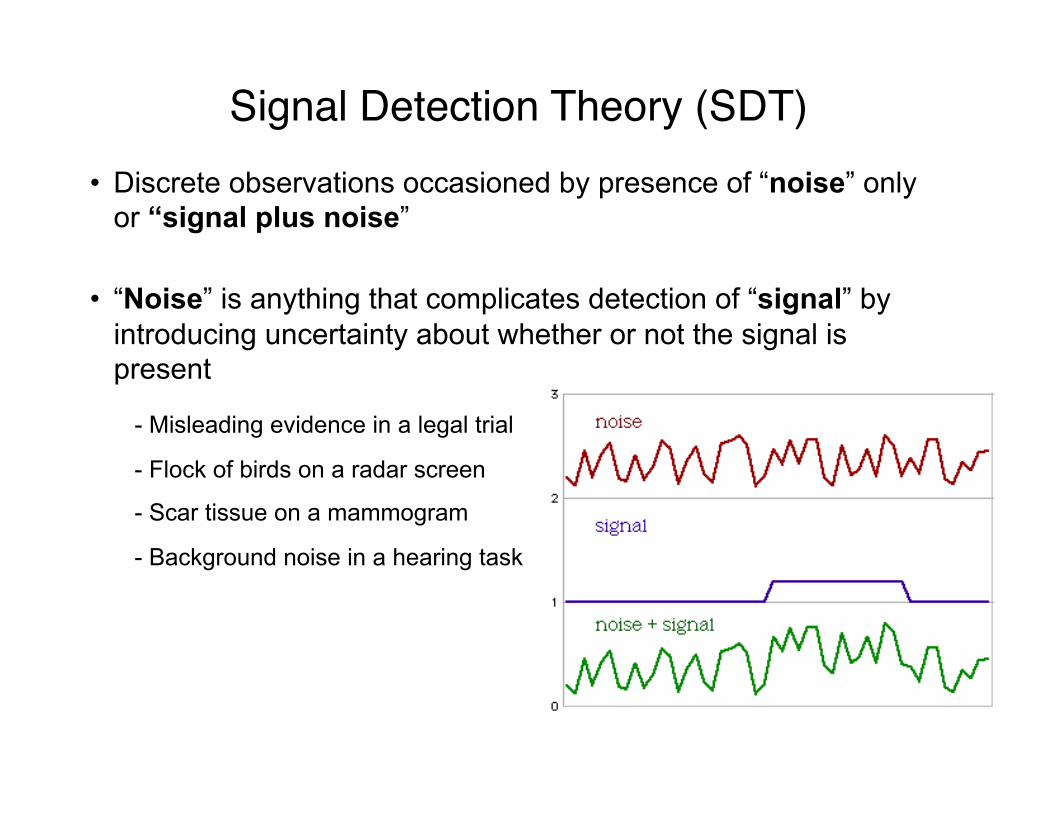
- Background noise in a hearing task
- Misleading evidence in a legal trial
- Flock of birds on a radar screen
- Scar tissue on a mammogram
Signal Detection Theory (SDT)"•! Discrete observations occasioned by presence of “noise” only
or “signal plus noise”
•! “Noise” is anything that complicates detection of “signal” by introducing uncertainty about whether or not the signal is present
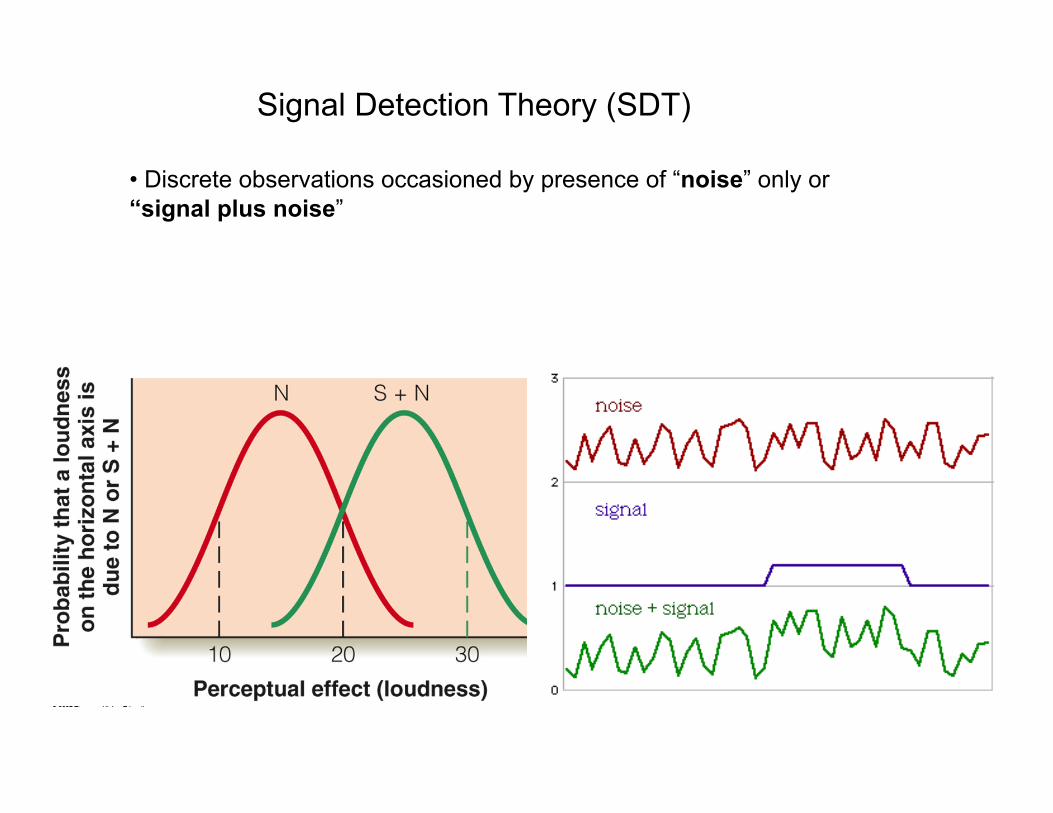
• Discrete observations occasioned by presence of “noise” only or “signal plus noise”
Signal Detection Theory (SDT)
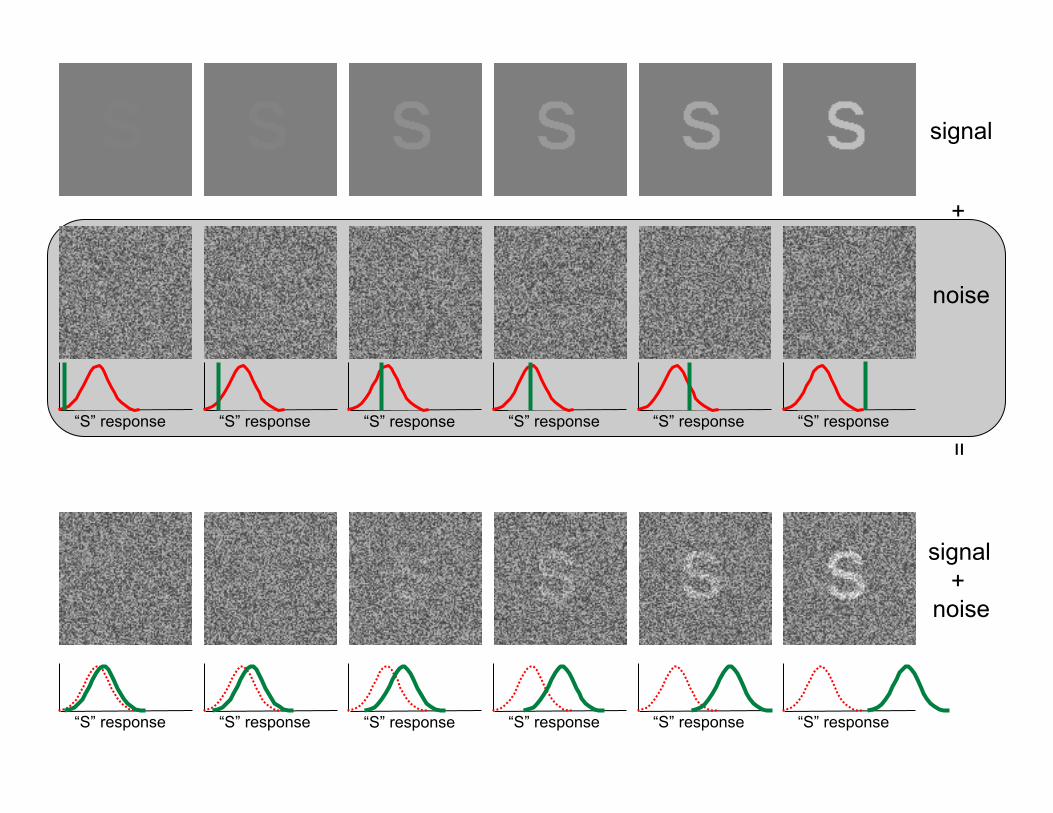
signal
signal +
noise
“S” response “S” response “S” response “S” response “S” response “S” response
noise
“S” response “S” response “S” response “S” response “S” response “S” response
+
=
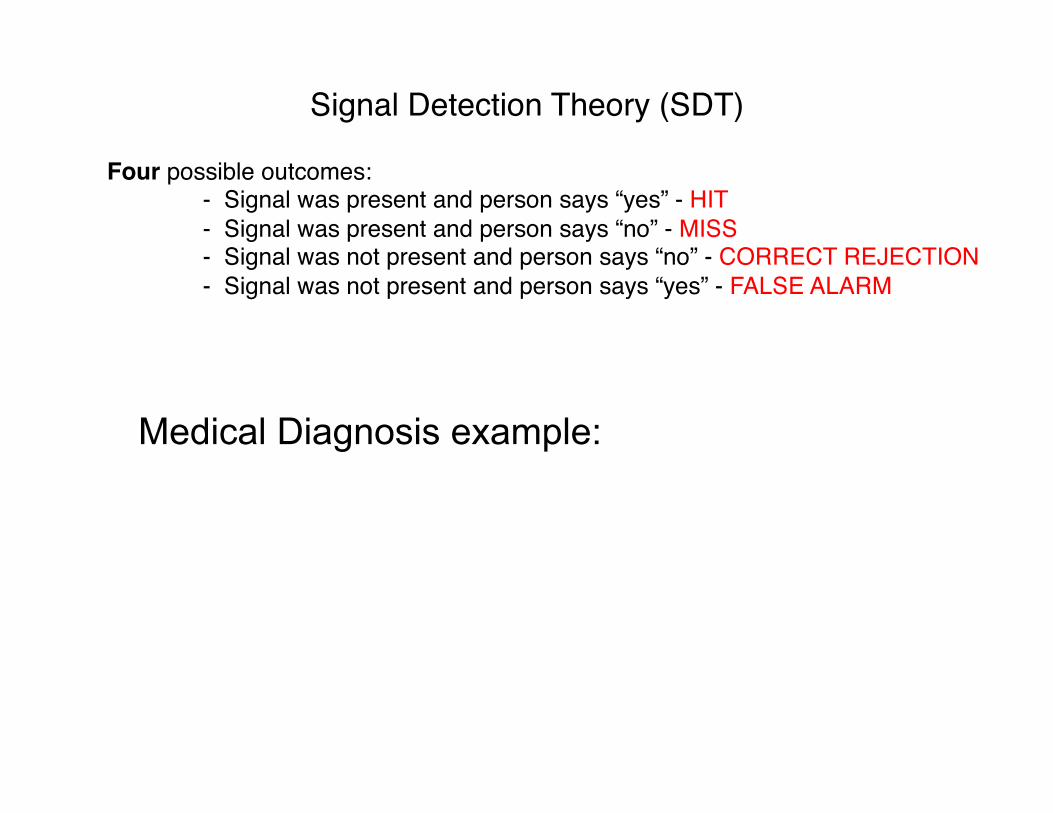
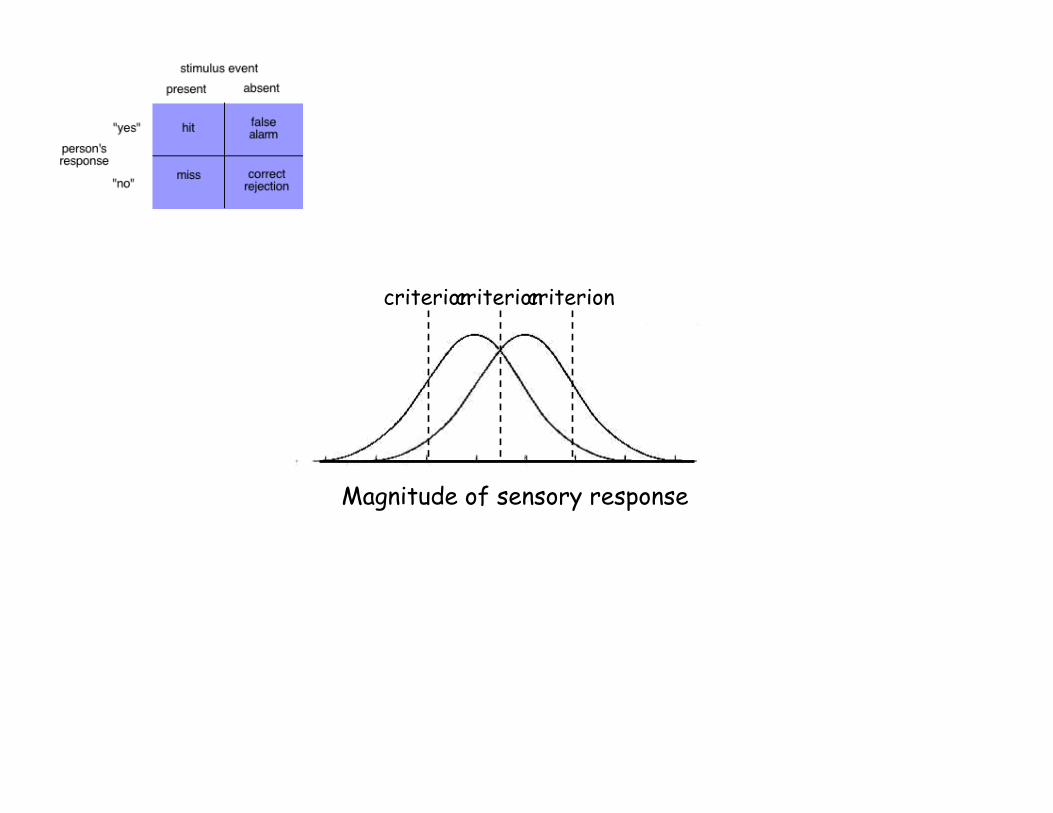
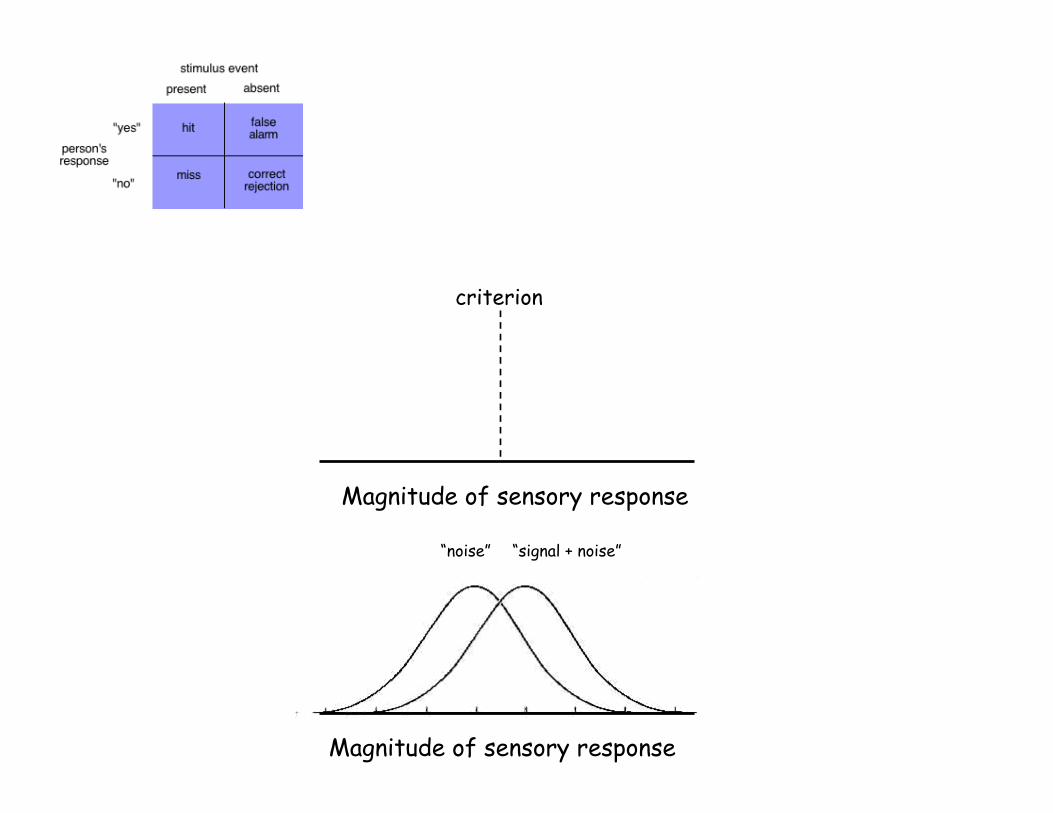
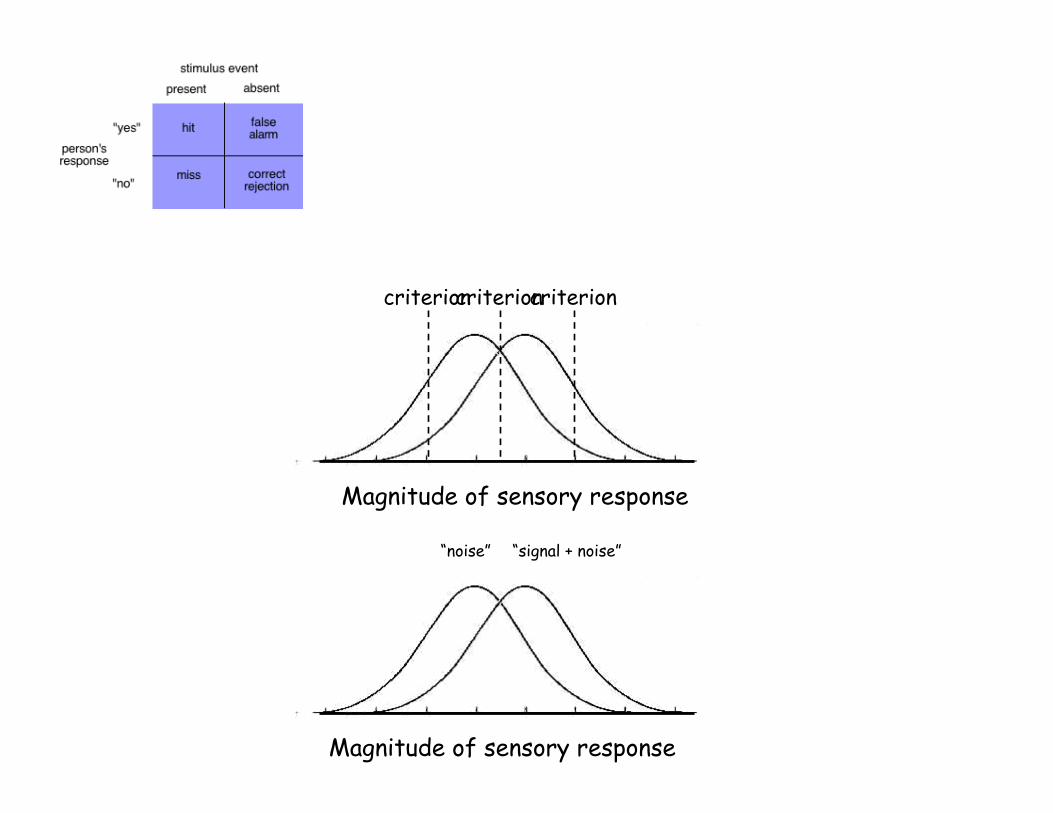
Four possible outcomes:""- Signal was present and person says “yes” - HIT""- Signal was present and person says “no” - MISS""- Signal was not present and person says “no” - CORRECT REJECTION""- Signal was not present and person says “yes” - FALSE ALARM"
Signal Detection Theory (SDT)"
Medical Diagnosis example:
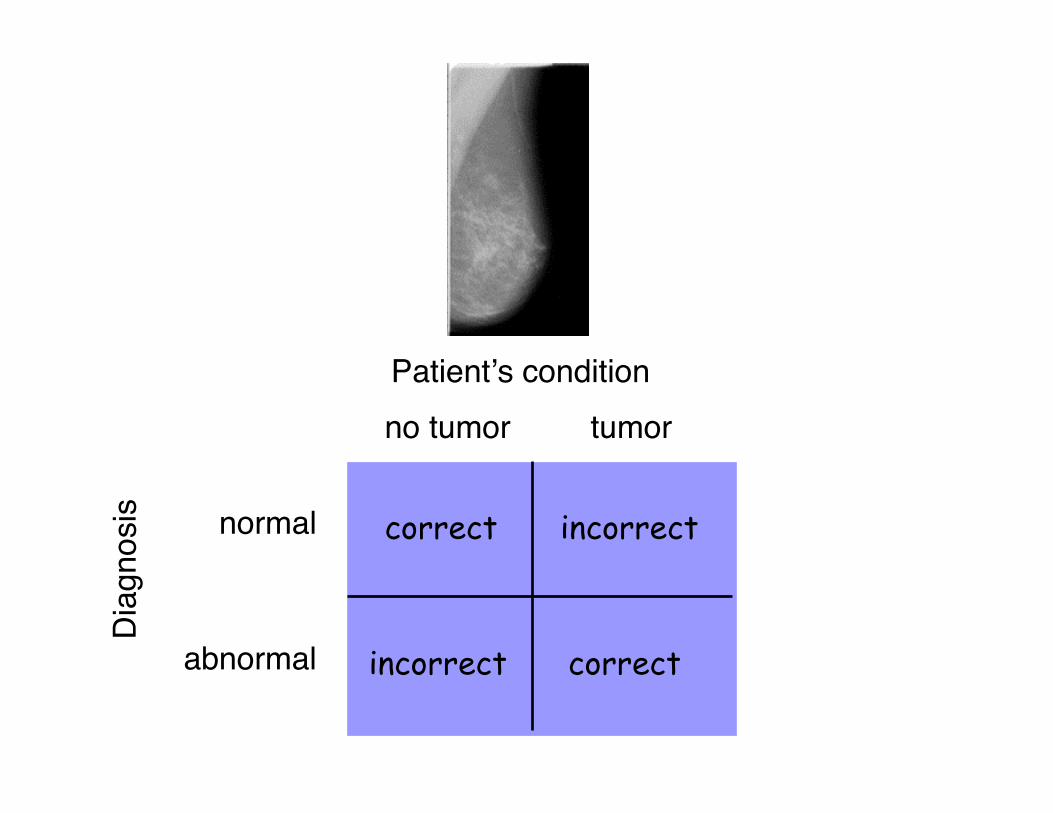
tumor Patient#s condition no tumor
Dia
gnos
is
abnormal
normal correct
correct
incorrect
incorrect
tumor Patient#s condition no tumor
Dia
gnos
is
abnormal
normal correct
correct
incorrect
incorrect
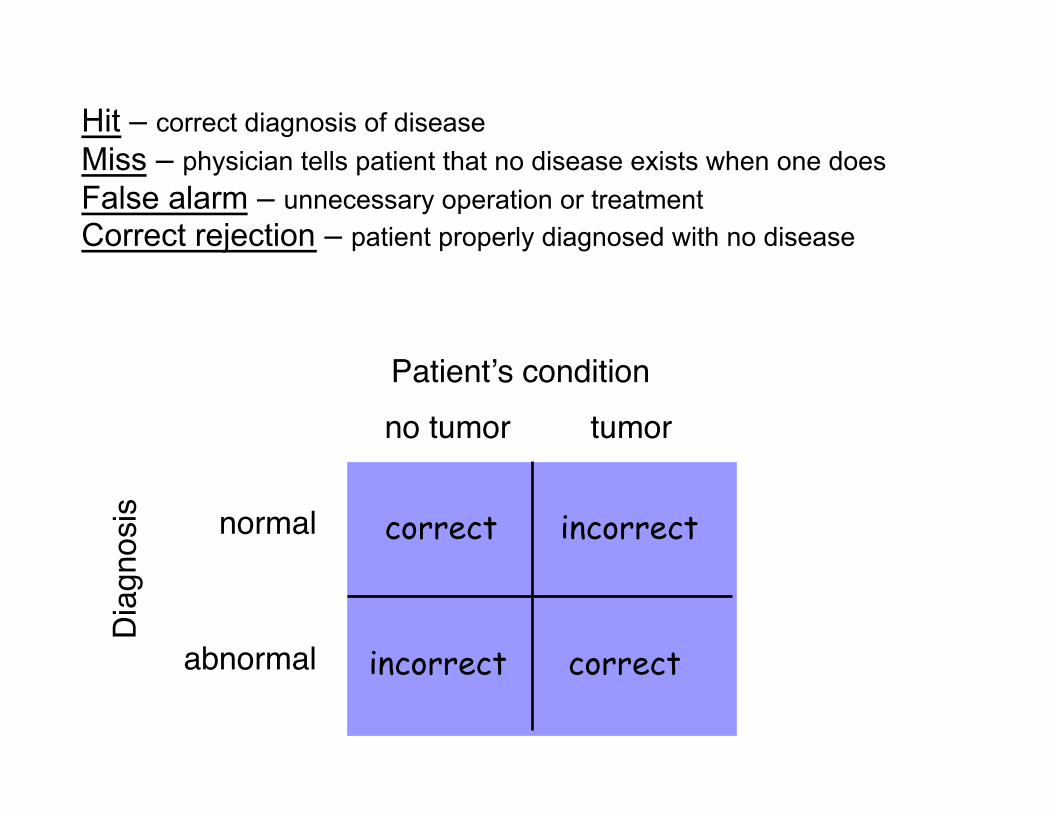
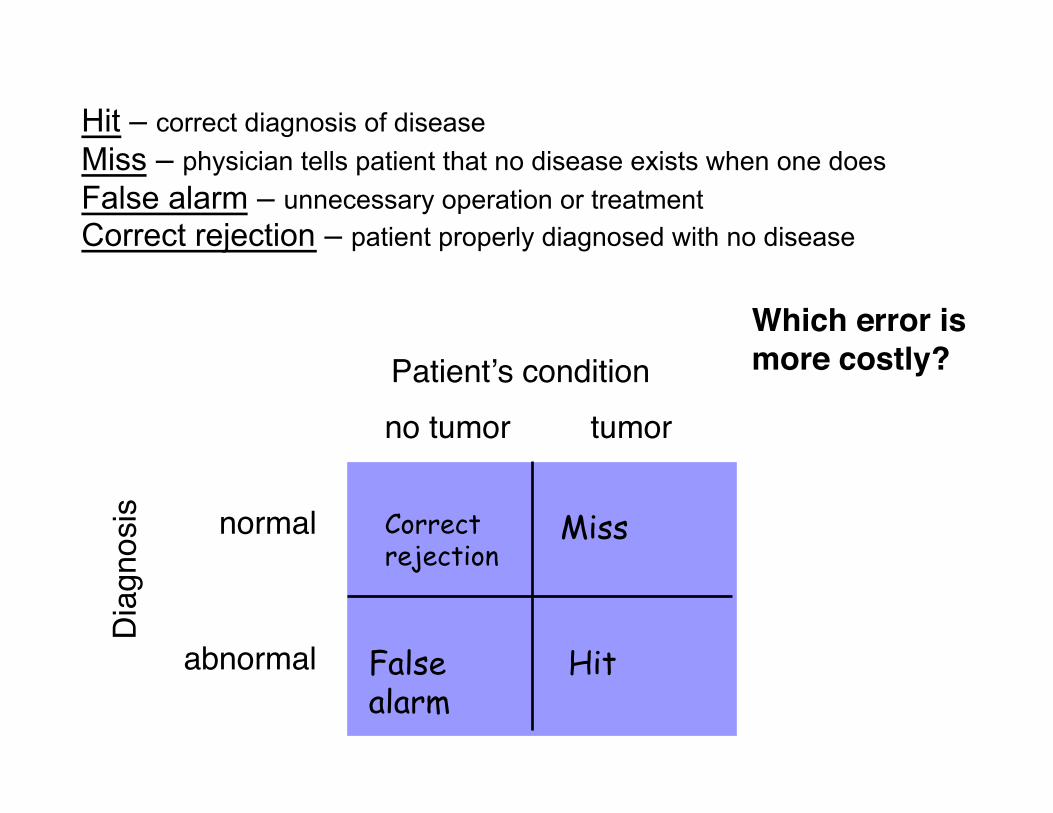
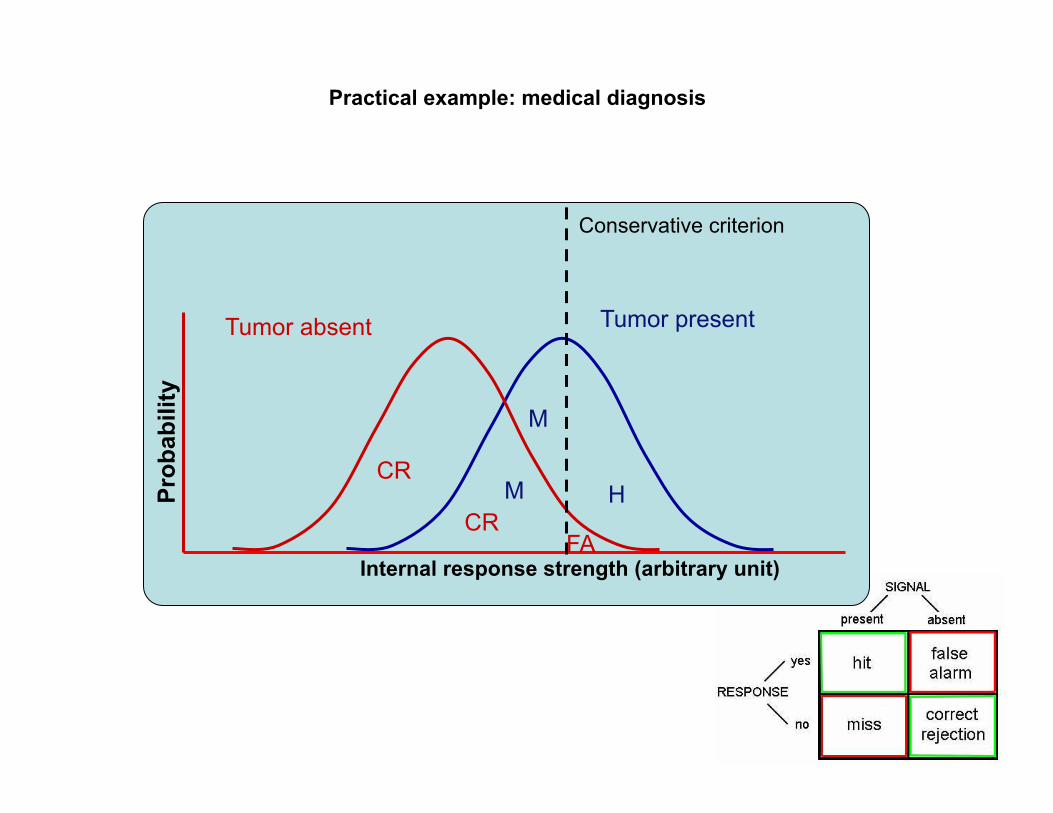
Hit – correct diagnosis of disease Miss – physician tells patient that no disease exists when one does False alarm – unnecessary operation or treatment Correct rejection – patient properly diagnosed with no disease
tumor Patient#s condition no tumor
Dia
gnos
is
abnormal
normal Correct rejection
Hit
Miss
False alarm
Hit – correct diagnosis of disease Miss – physician tells patient that no disease exists when one does False alarm – unnecessary operation or treatment Correct rejection – patient properly diagnosed with no disease
Which error is more costly?!
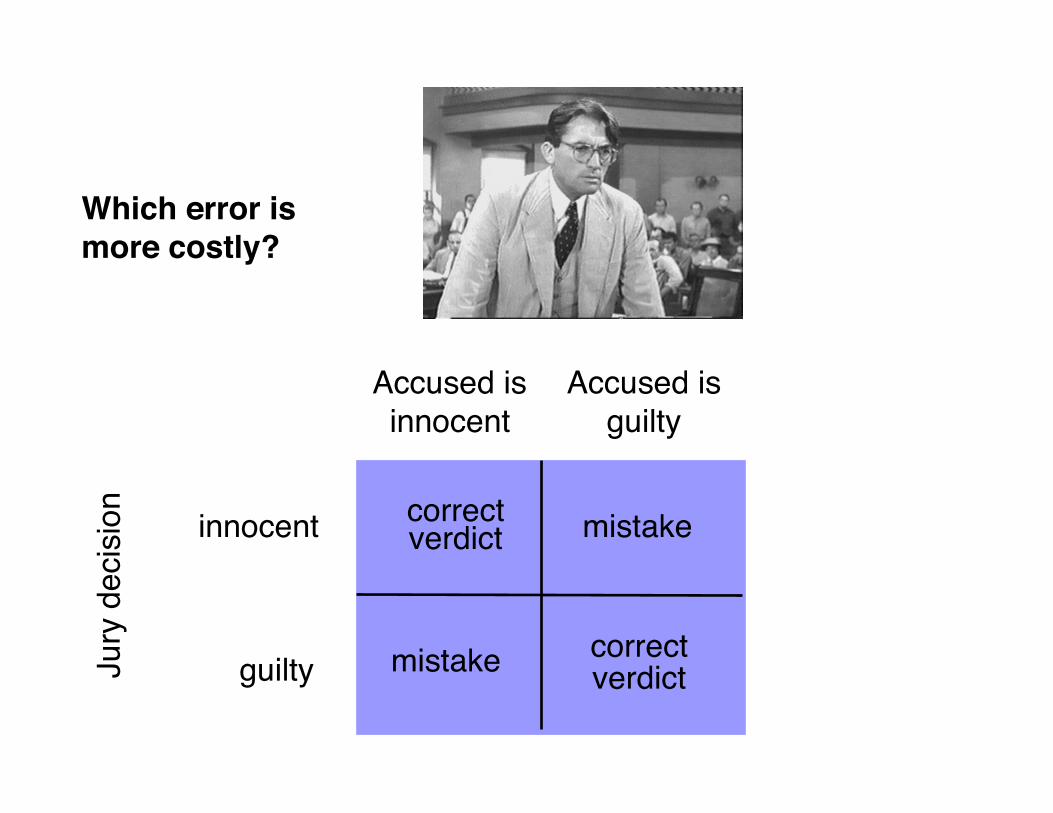
Accused is"guilty
Accused is"innocent
innocent
Jury
dec
isio
n
guilty
correct
verdict
verdict
correct
mistake
mistake
Which error is more costly?!
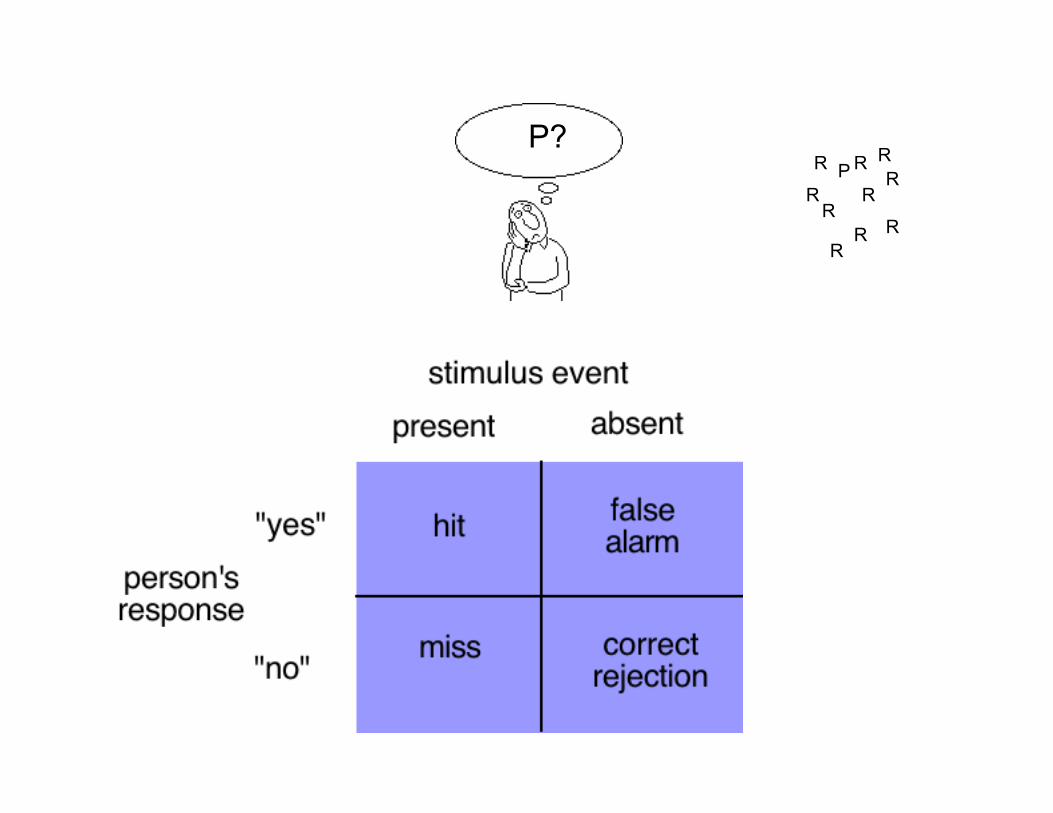
P? P
R R
R
R
R
R
R
R
R
R
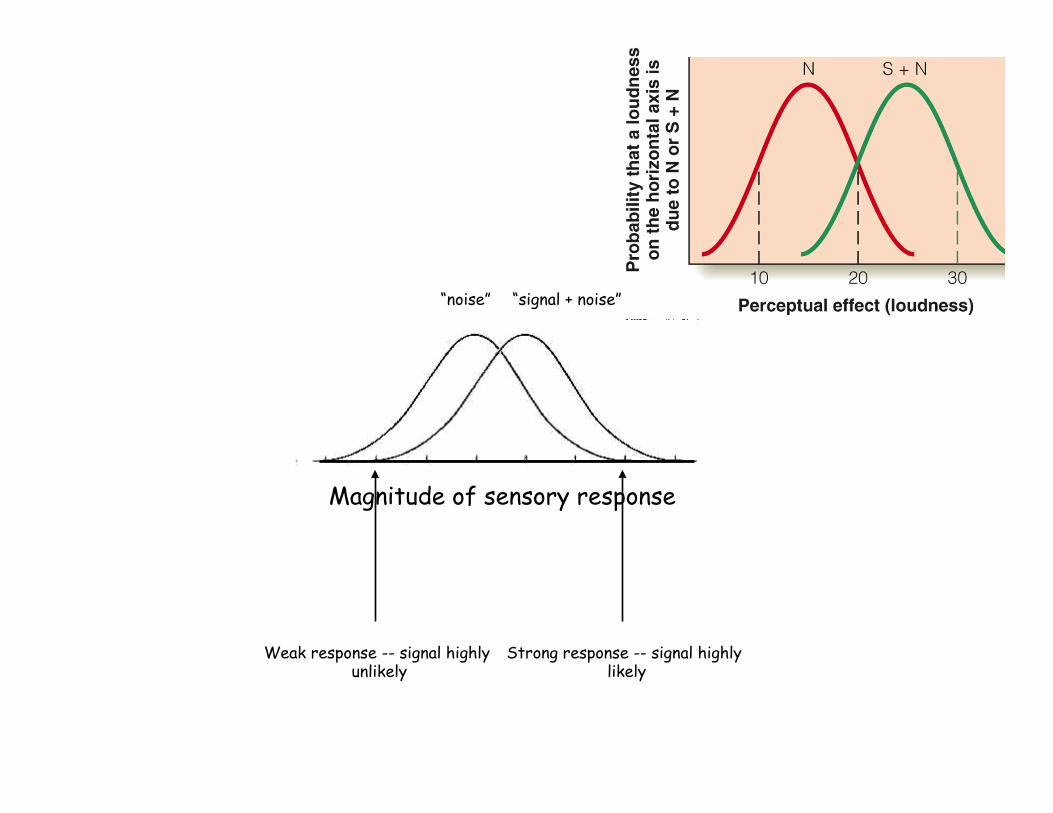
“noise” “signal + noise”
Magnitude of sensory response
Strong response -- signal highly likely
Weak response -- signal highly unlikely
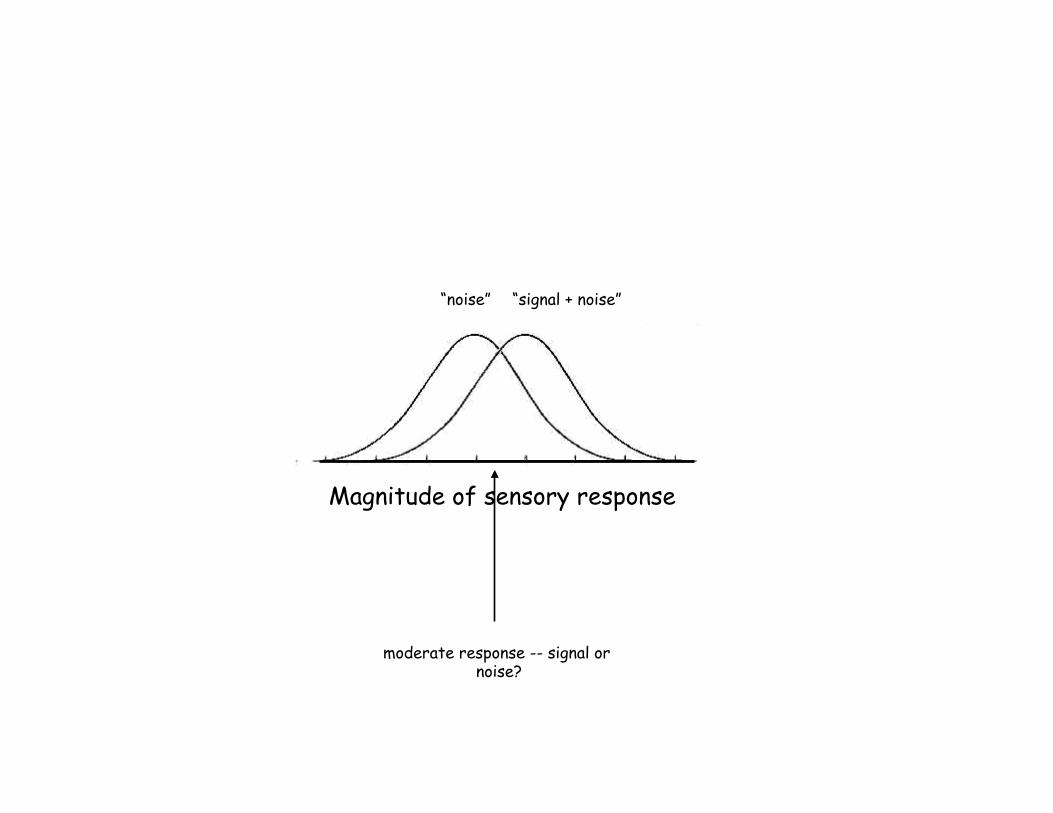
“noise” “signal + noise”
Magnitude of sensory response
moderate response -- signal or noise?
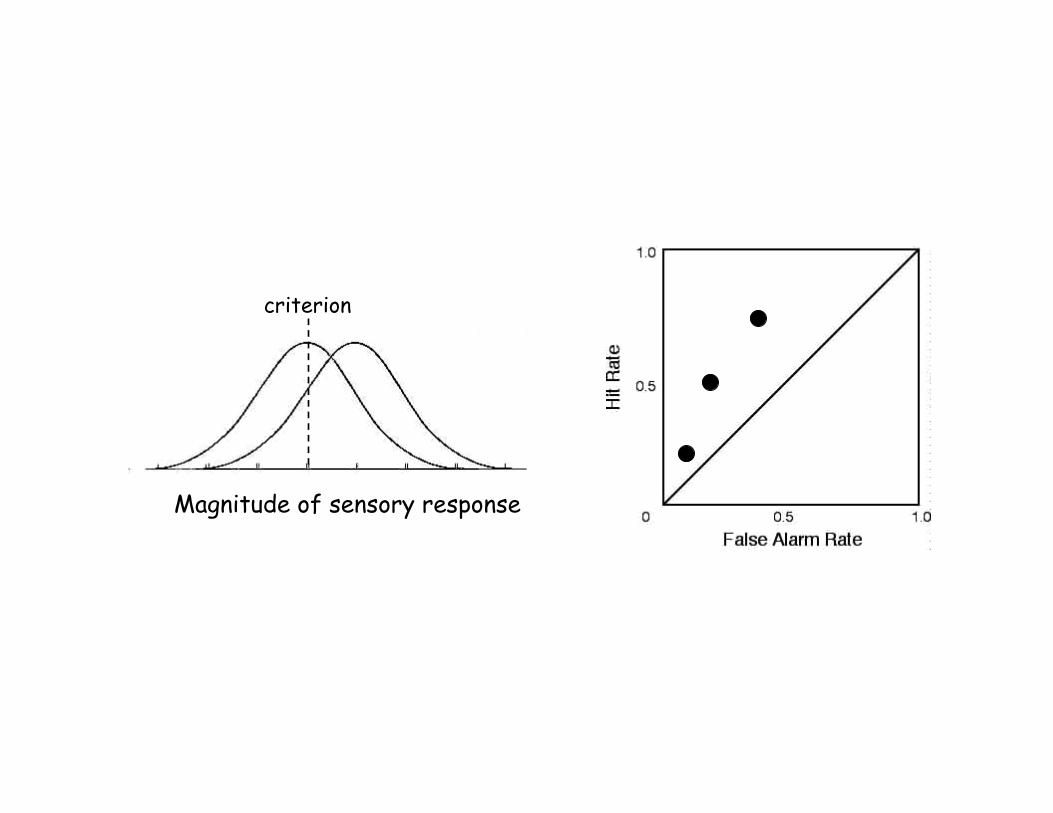
Magnitude of sensory response
criterion criterion criterion
Magnitude of sensory response
criterion
“noise” “signal + noise”
Magnitude of sensory response
Magnitude of sensory response
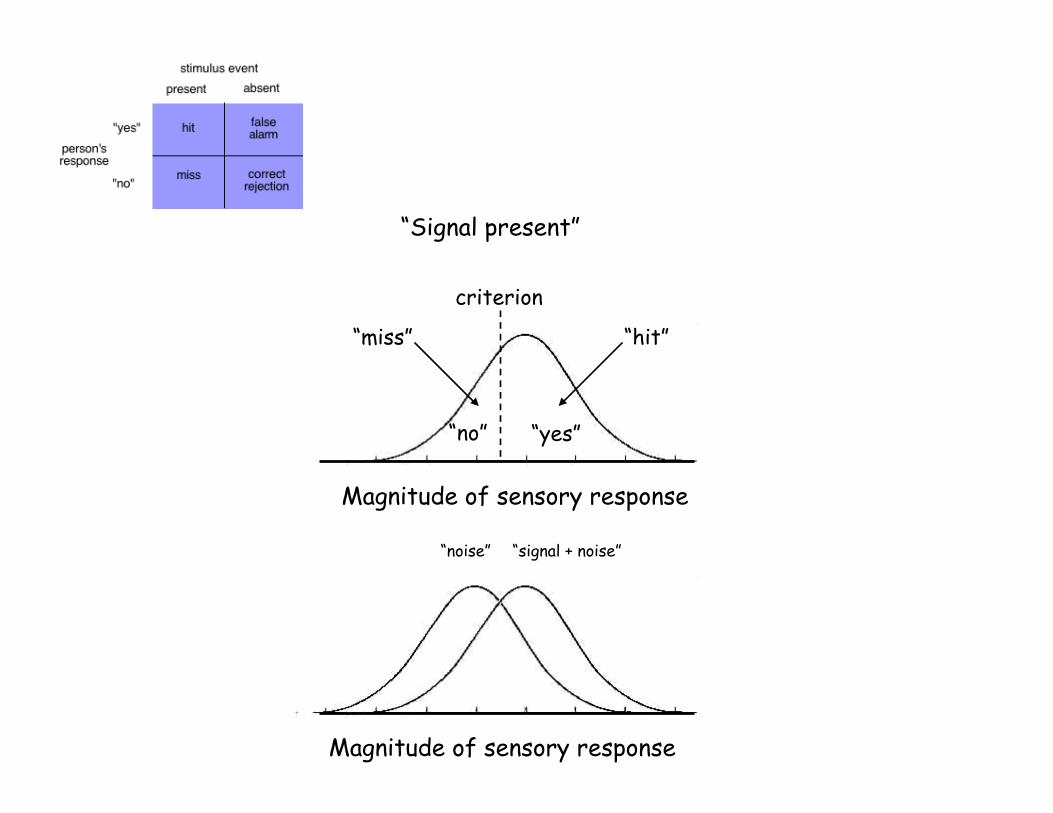
criterion
“hit” “miss”
“Signal present”
“no” “yes”
“noise” “signal + noise”
Magnitude of sensory response
Magnitude of sensory response
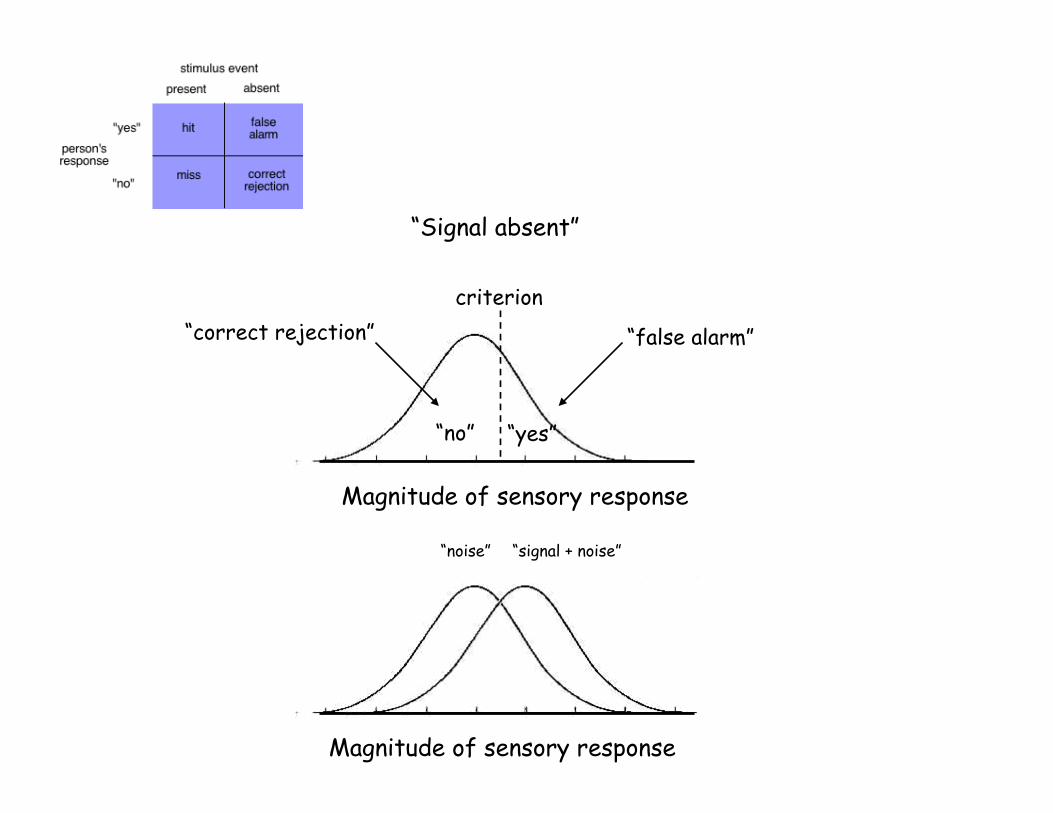
criterion
“false alarm” “correct rejection”
“Signal absent”
“no” “yes”
“noise” “signal + noise”
Magnitude of sensory response
Magnitude of sensory response
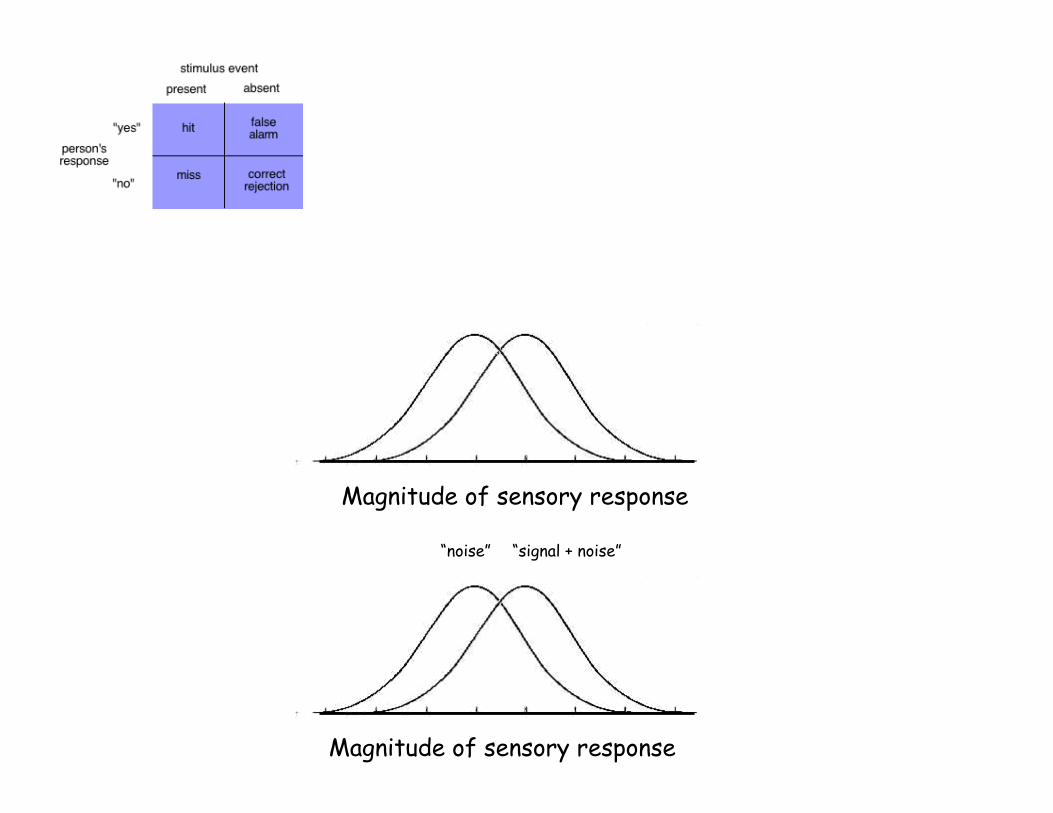
“noise” “signal + noise”
Magnitude of sensory response
Magnitude of sensory response
criterion criterion criterion
“noise” “signal + noise”
Magnitude of sensory response
Magnitude of sensory response
criterion criterion criterion
“noise” “signal + noise”
Magnitude of sensory response
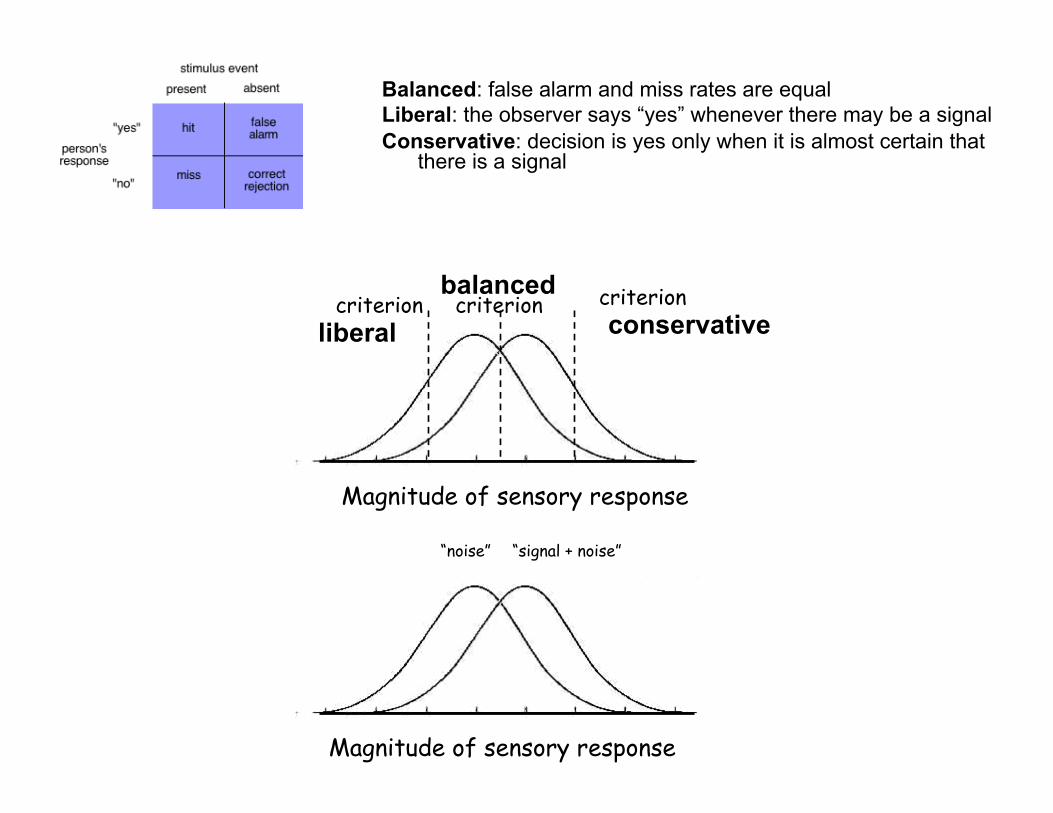
balanced conservative liberal
Balanced: false alarm and miss rates are equal Liberal: the observer says “yes” whenever there may be a signal Conservative: decision is yes only when it is almost certain that
there is a signal
Magnitude of sensory response
criterion
“noise” “signal + noise”
Magnitude of sensory response
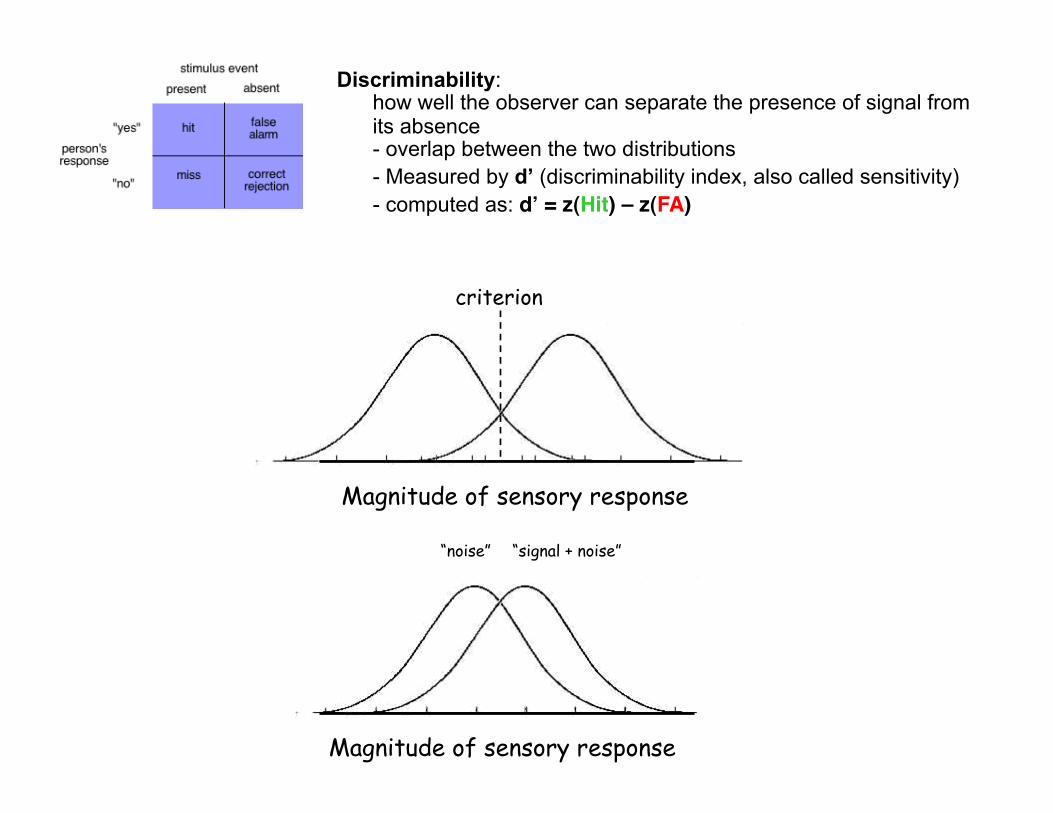
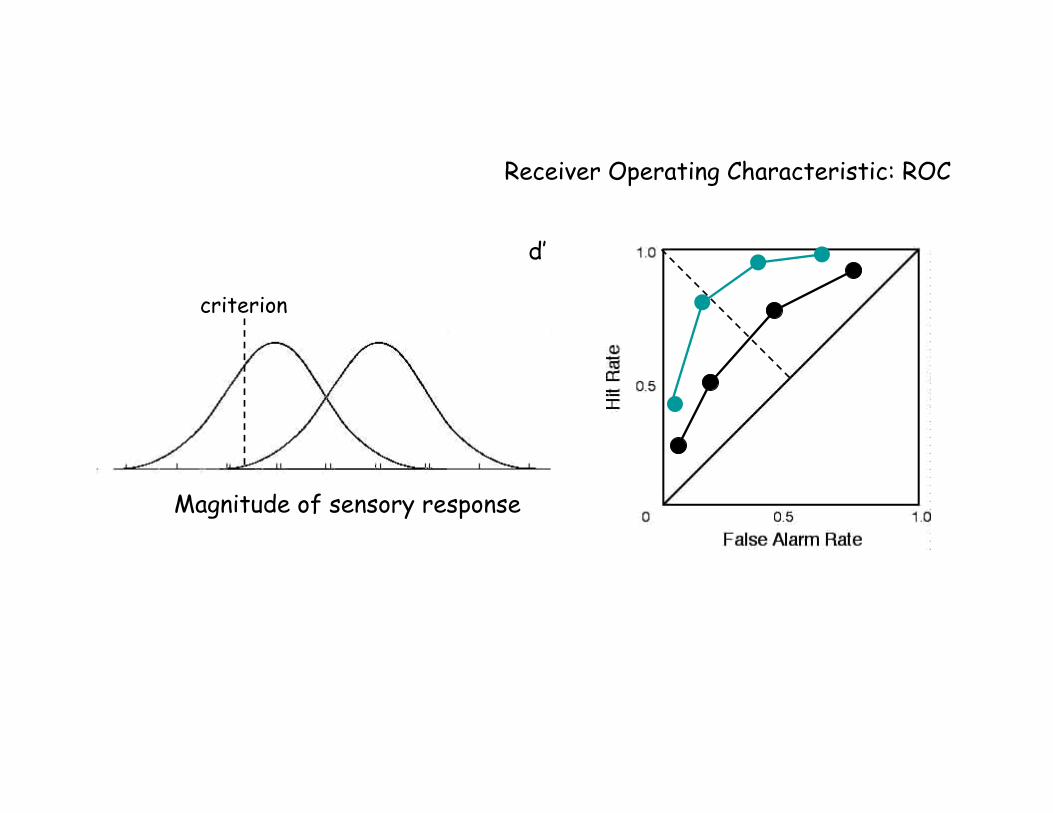
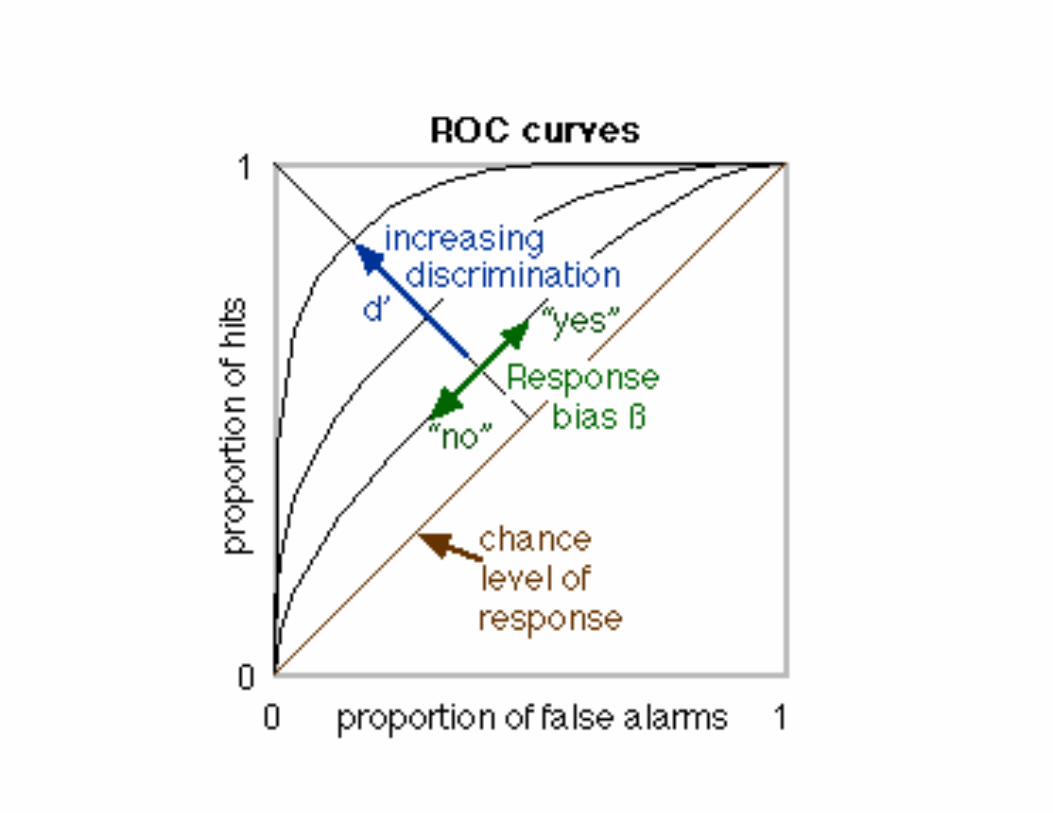
Discriminability: how well the observer can separate the presence of signal from its absence - overlap between the two distributions - Measured by d’ (discriminability index, also called sensitivity) - computed as: d" = z(Hit) – z(FA)
Prob
abili
ty
Internal response strength (arbitrary unit)
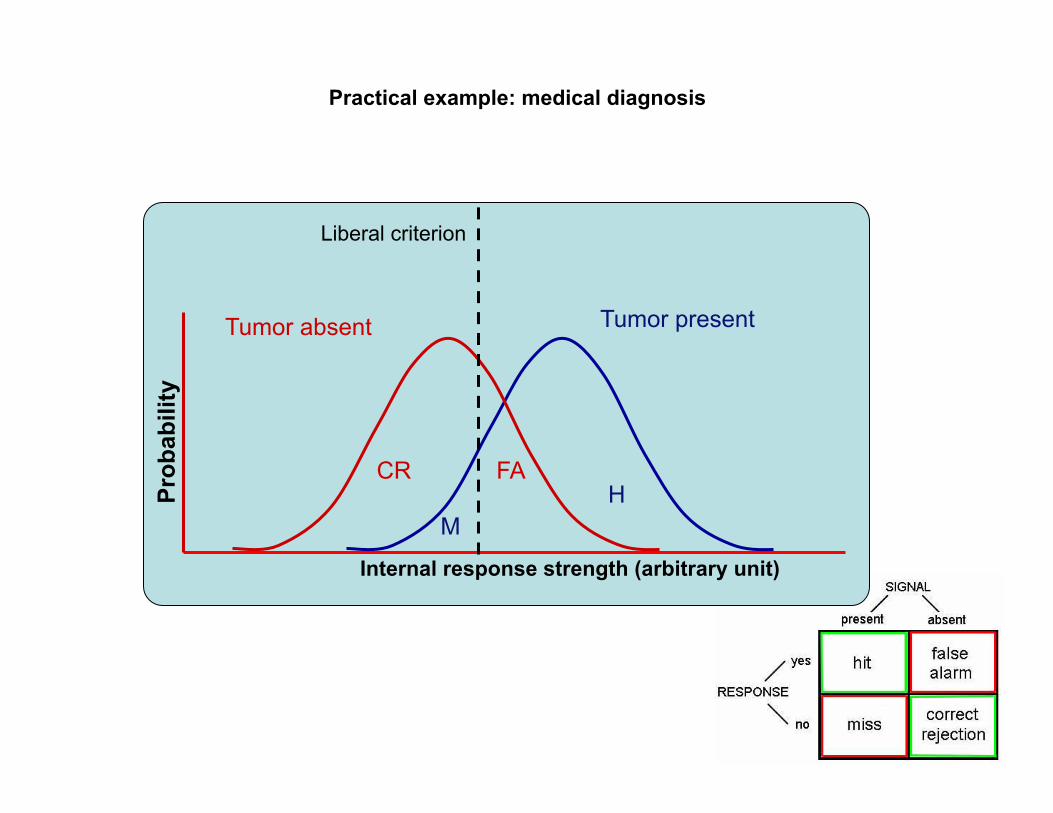
Tumor absent Tumor present
CR FA
M H
Liberal criterion
Practical example: medical diagnosis
Prob
abili
ty
Internal response strength (arbitrary unit)
Tumor absent Tumor present
CR H
Conservative criterion
FA
M
M CR
Practical example: medical diagnosis
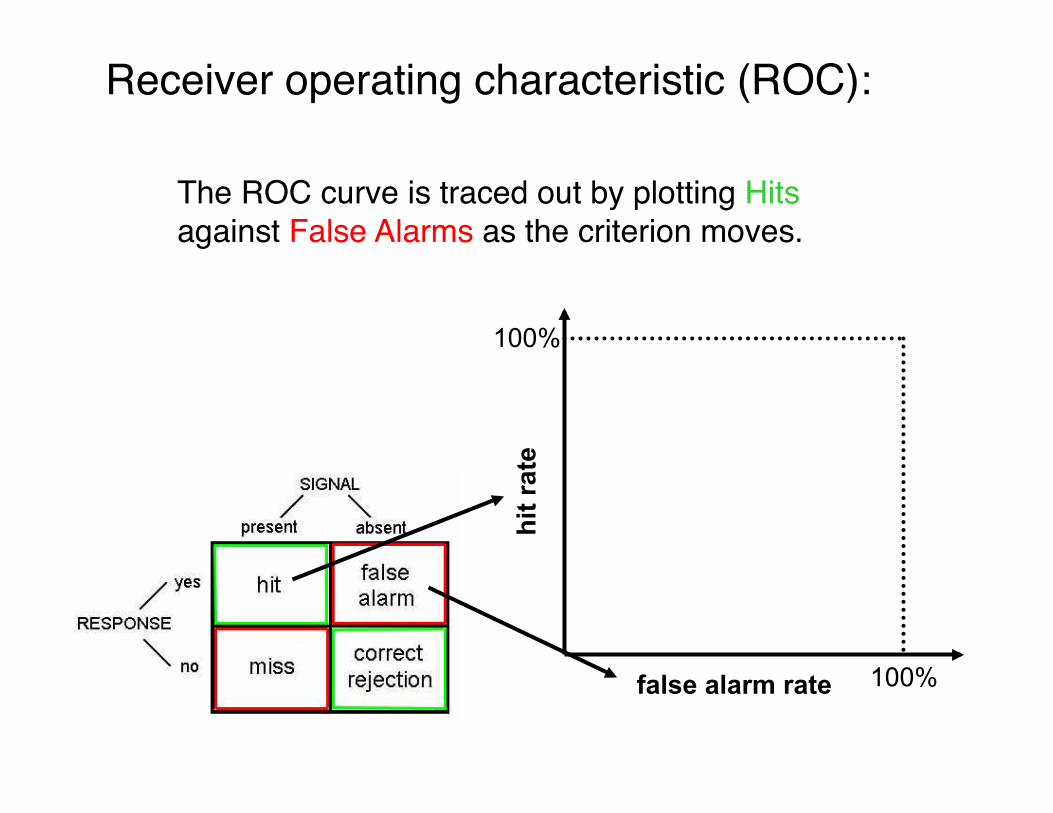
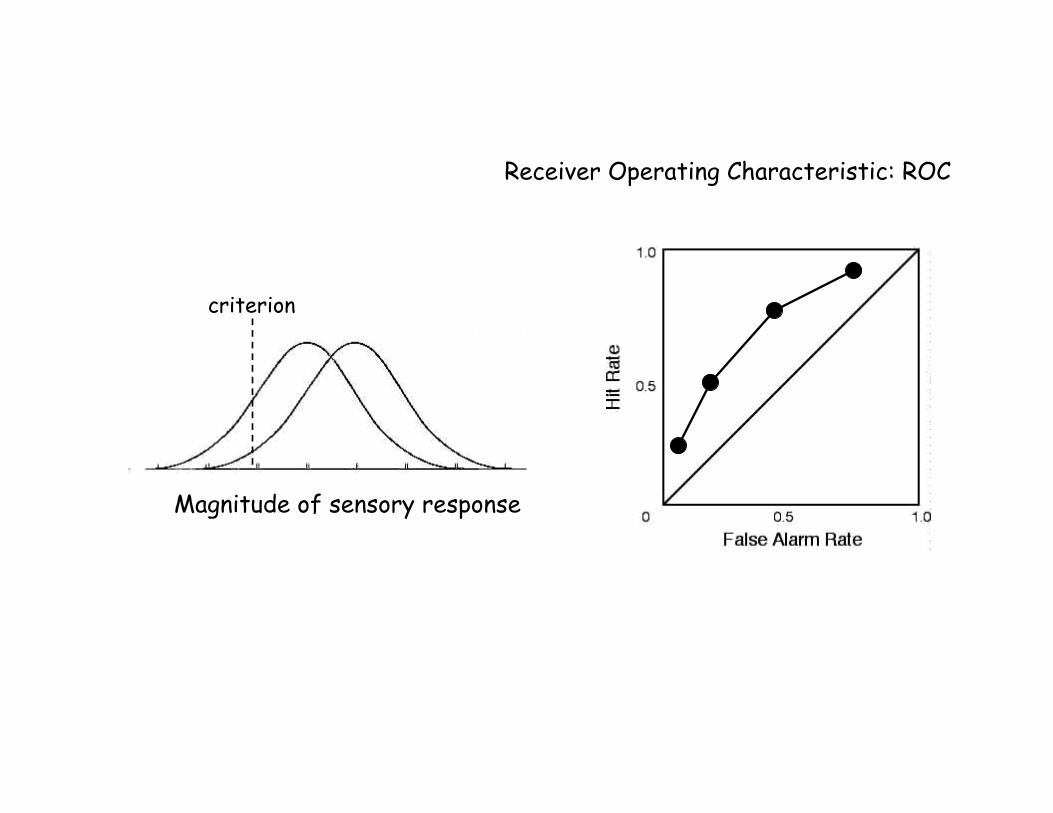
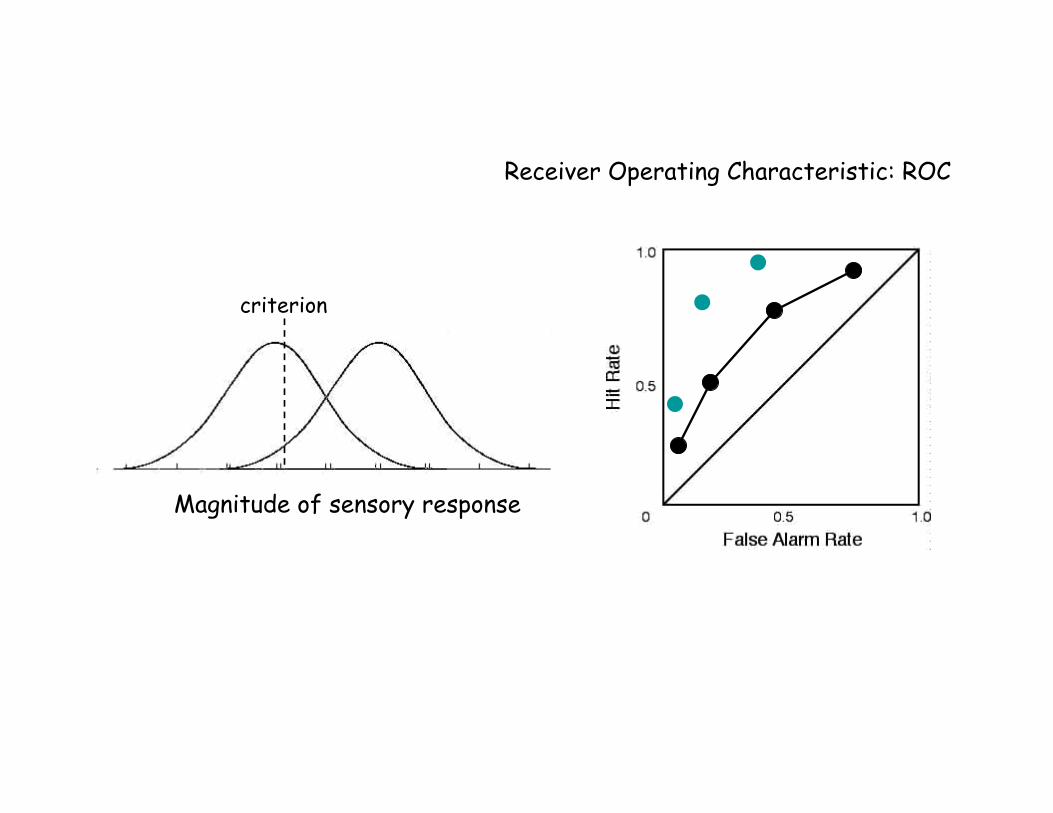
Receiver operating characteristic (ROC):"
false alarm rate
hit r
ate
100%
100%
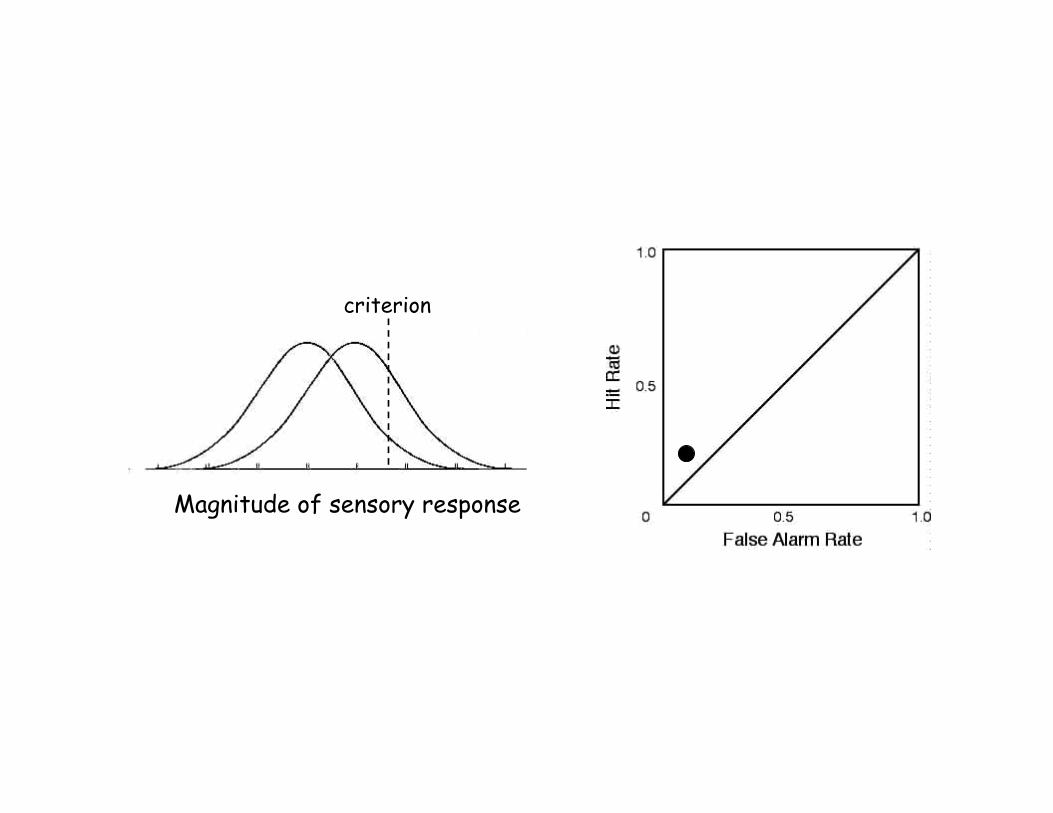
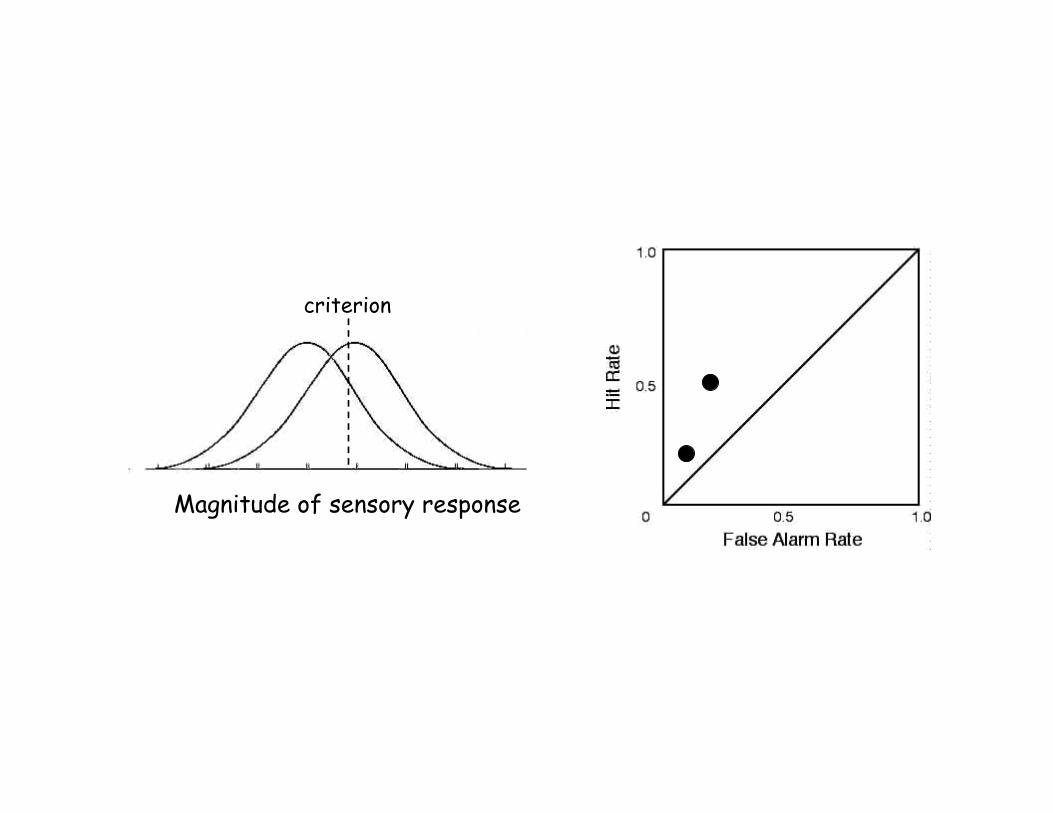
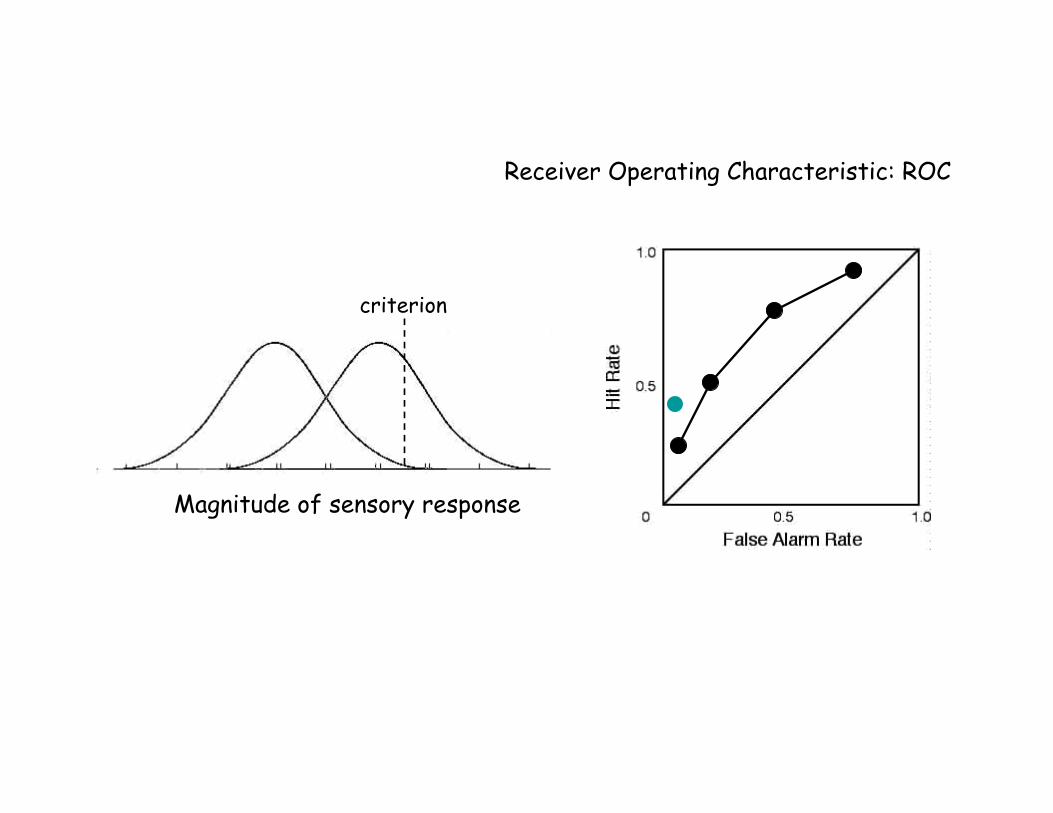
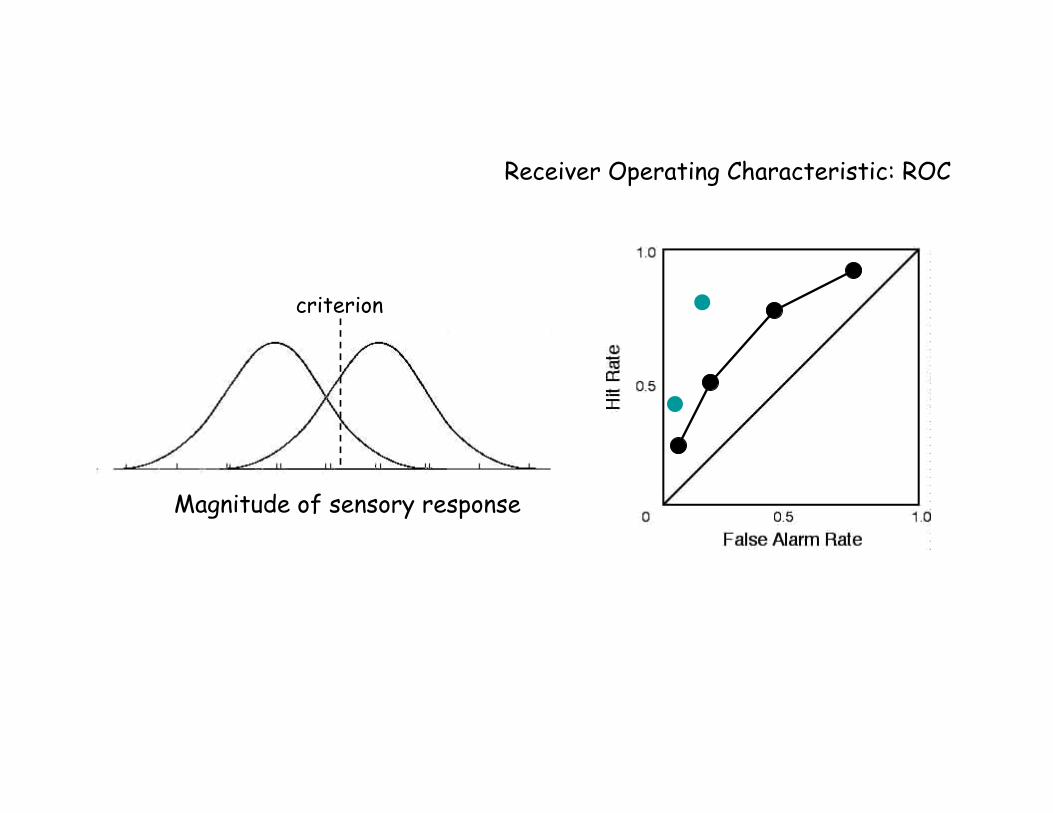
The ROC curve is traced out by plotting Hits against False Alarms as the criterion moves."
Magnitude of sensory response
criterion
Magnitude of sensory response
criterion
Magnitude of sensory response
criterion
Magnitude of sensory response
criterion
Receiver Operating Characteristic: ROC
Magnitude of sensory response
criterion
Receiver Operating Characteristic: ROC
Magnitude of sensory response
criterion
Receiver Operating Characteristic: ROC
Magnitude of sensory response
criterion
Receiver Operating Characteristic: ROC
Magnitude of sensory response
criterion
Receiver Operating Characteristic: ROC
d’

ROC Curve Questions"•! Why do ROC curves start at (0,0)? Why do they go to (100,100)?"•! If d-prime is zero, what is the shape of the ROC curve?"•! If d-prime is large (e.g. 4 or larger) what is the shape of the ROC curve?"
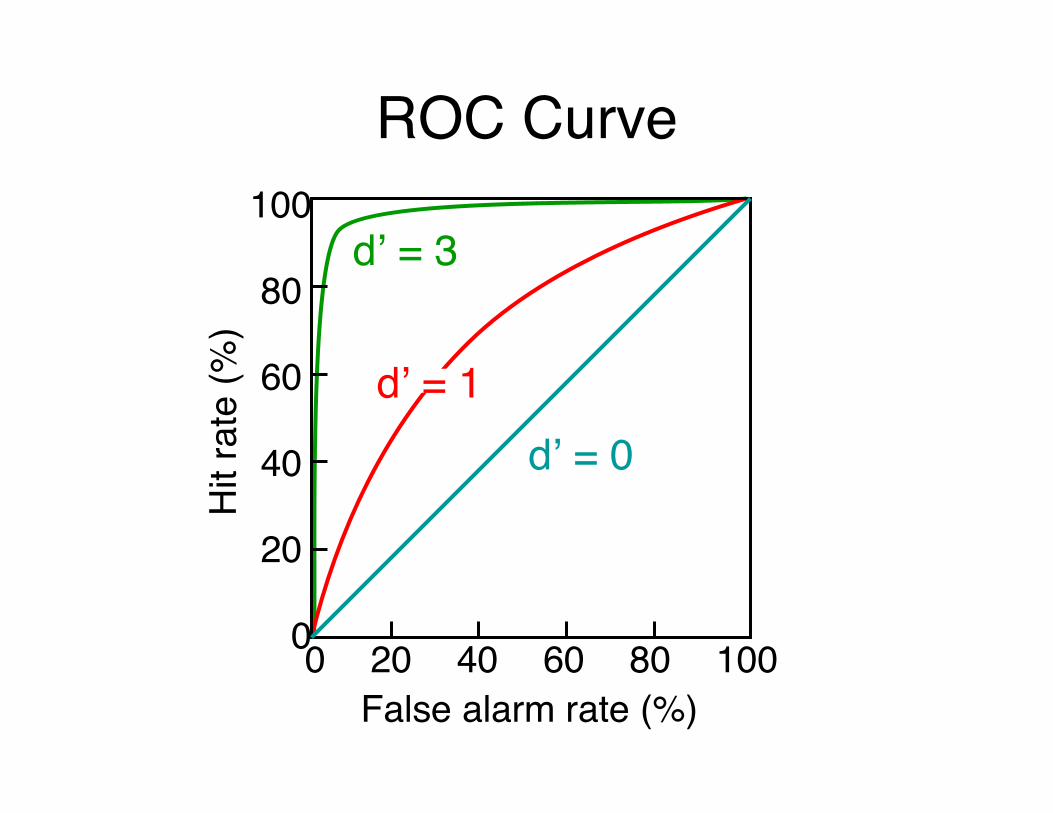
ROC Curve"
False alarm rate (%)"
Hit
rate
(%)"
0"
20"
40"
60"
80"
100"
0" 20" 40" 60" 80" 100"
d# = 0"d# = 1"
d# = 3"
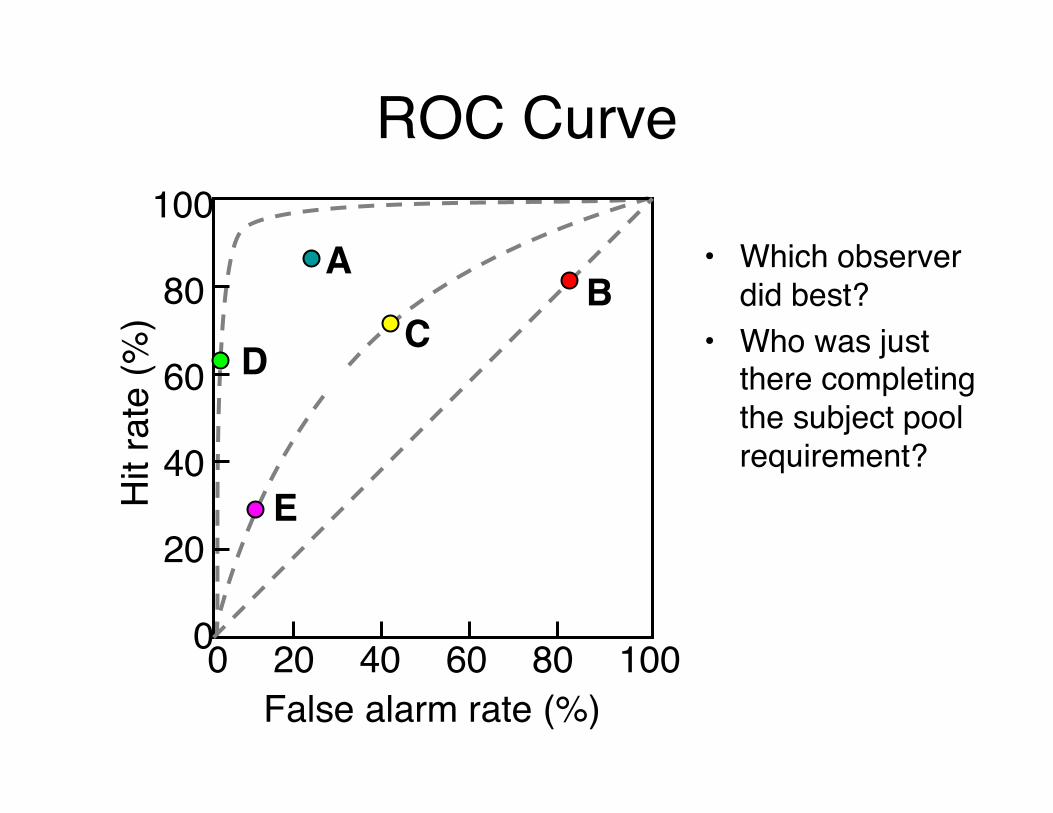
ROC Curve"
False alarm rate (%)"
Hit
rate
(%)"
0"
20"
40"
60"
80"
100"
0" 20" 40" 60" 80" 100"
D!
A!
C!B!
•! Which observer did best?"
•! Who was just there completing the subject pool requirement?"
E!
http://www-psych.stanford.edu/~lera/psych115s/notes/signal/
http://psych.hanover.edu/JavaTest/Media/Chapter02.html Interactive Model 2.x: Signal Detection Theory Interactive Model 2.x: Signal Detection Illustration Interactive Model 2.x: Decisions In SDT Interactive Model 2.x: Receiver Operating Characteristic
Signal Detection Theory (SDT)- Online demos
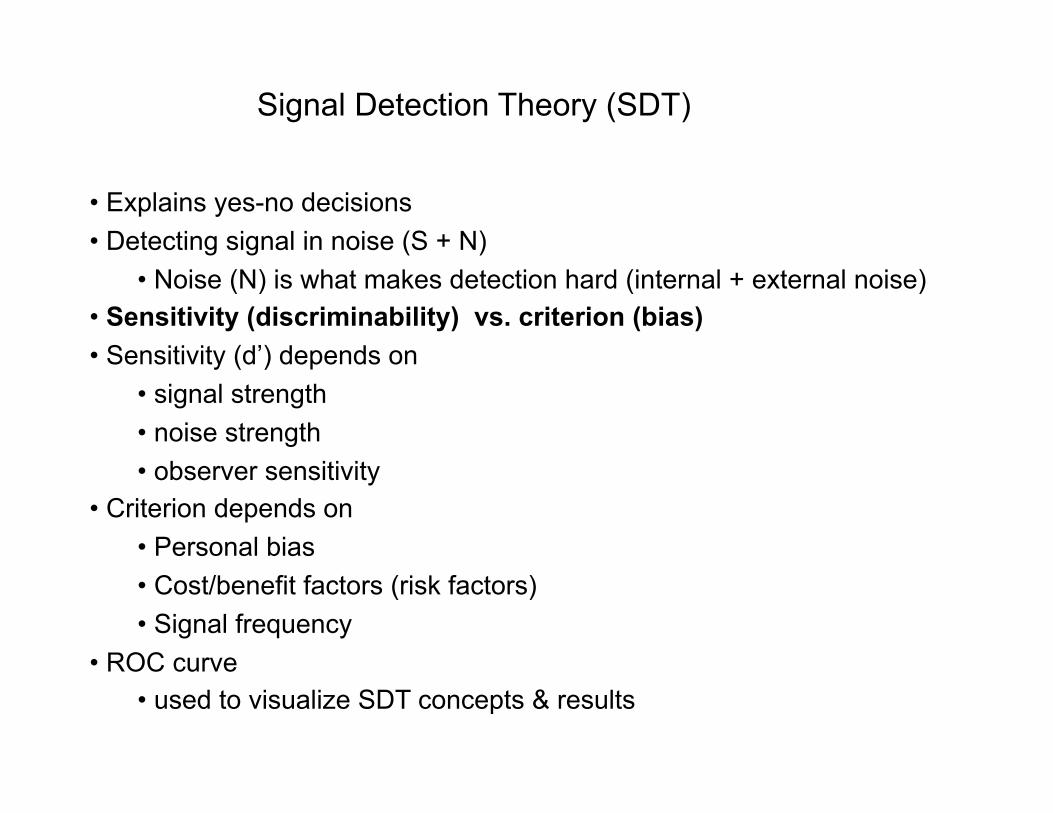
Signal Detection Theory (SDT)
•! Explains yes-no decisions •! Detecting signal in noise (S + N)
•! Noise (N) is what makes detection hard (internal + external noise) •! Sensitivity (discriminability) vs. criterion (bias) •! Sensitivity (d’) depends on
•! signal strength •! noise strength •! observer sensitivity
•! Criterion depends on •! Personal bias •! Cost/benefit factors (risk factors) •! Signal frequency
•! ROC curve •! used to visualize SDT concepts & results
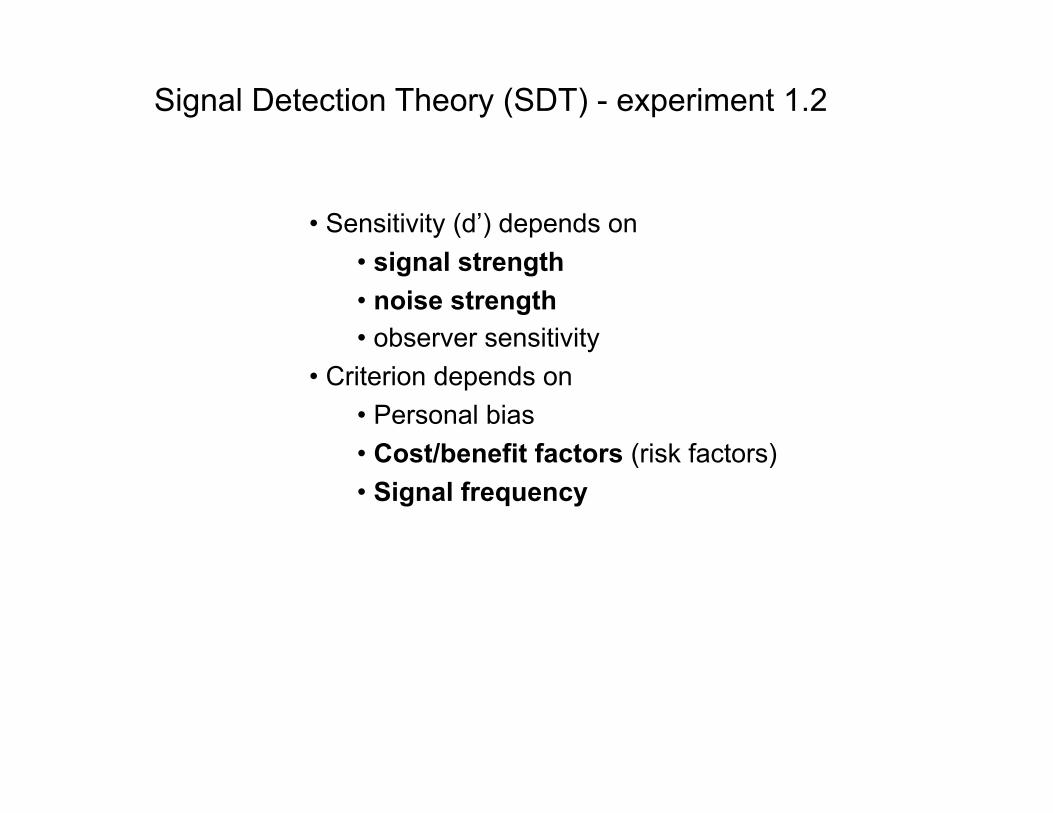
Signal Detection Theory (SDT) - experiment 1.2
•! Sensitivity (d’) depends on •! signal strength •! noise strength •! observer sensitivity
•! Criterion depends on •! Personal bias •! Cost/benefit factors (risk factors) •! Signal frequency
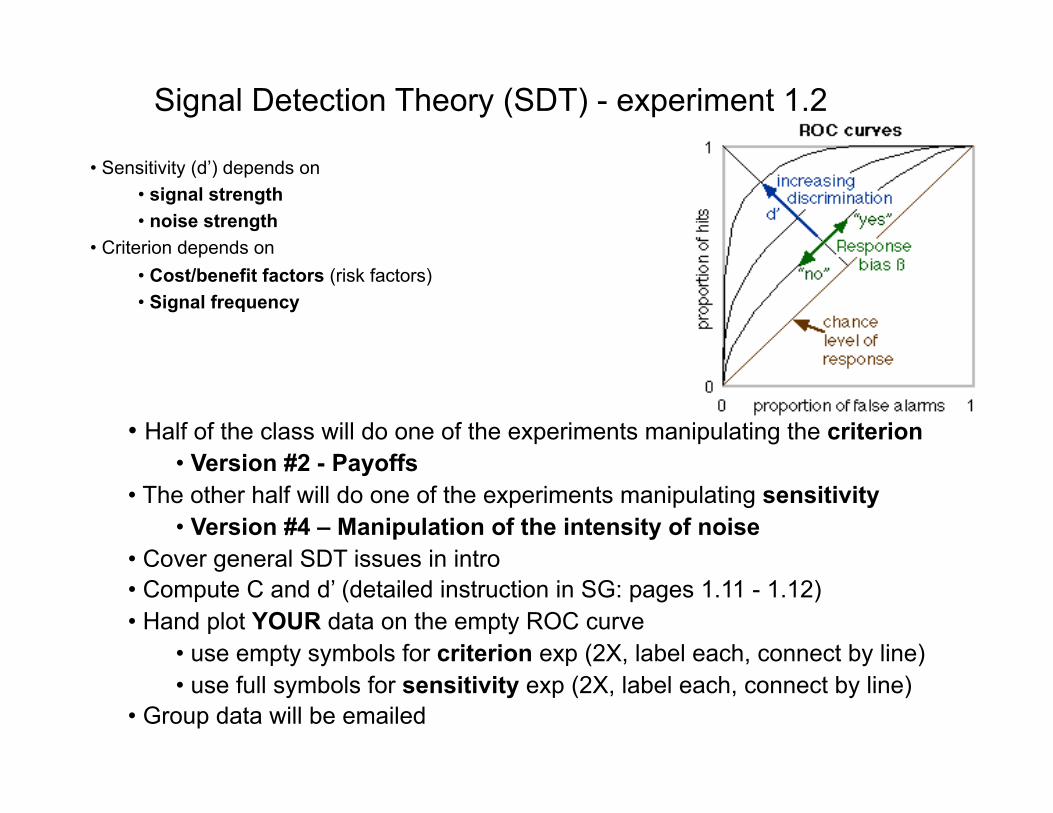
Signal Detection Theory (SDT) - experiment 1.2
•! Sensitivity (d’) depends on •! signal strength •! noise strength
•! Criterion depends on •! Cost/benefit factors (risk factors) •! Signal frequency
•! Half of the class will do one of the experiments manipulating the criterion •! Version #2 - Payoffs
•! The other half will do one of the experiments manipulating sensitivity •! Version #4 – Manipulation of the intensity of noise
•! Cover general SDT issues in intro •! Compute C and d’ (detailed instruction in SG: pages 1.11 - 1.12) •! Hand plot YOUR data on the empty ROC curve
•! use empty symbols for criterion exp (2X, label each, connect by line) •! use full symbols for sensitivity exp (2X, label each, connect by line)
•! Group data will be emailed