Embed Size (px)
Citation preview
Sign Classification for the Visually Impaired�
Marwan A. MattarComputer Vision Laboratory
Department of Computer ScienceUniversity of Massachusetts, Amherst
Amherst, MA [email protected]
Allen R. HansonComputer Vision Laboratory
Dpartment of Computer ScienceUniversity of Massachusetts, Amherst
Amherst, MA [email protected]
Erik G. Learned-MillerComputer Vision Laboratory
Department of Computer ScienceUniversity of Massachusetts, Amherst
Amherst, MA [email protected]
Abstract
Our world is populated with visual information that a sighted person makes use of daily. Unfor-tunately, the visually impaired are deprived from such information, which limits their mobility inunconstrained environments. To help alleviate this we are developing a wearable system that iscapable of detecting and recognizing signs in natural scenes. The system is composed of two maincomponents, sign detection and recognition. The sign detector, uses a conditional maximum entropymodel to find regions in an image that correspond to a sign. The sign recognizer matches the hy-pothesized sign regions with sign images in a database. The system decides if the most likely sign iscorrect or if the hypothesized sign region does not belong to a sign in the database. Our data setsencompass a wide range of variability including changes in lighting, orientation and viewing angle.In this paper, we present an overview of the system and the performance of its two main components,while paying particular attention to the recognition phase. Tested on 3,975 sign images from twodifferent data sets, the recognition phase achieves 99.5% with 35 distinct signs and 92.8% with 65distinct signs.
1 Introduction
The development of an effective visual information system will significantly improve the degree towhich the visually impaired can interact with their environment. It has been argued that a visuallyimpaired individual seeks the same sort of cognitive information that a sighted person does [6]. Forexample, when a sighted person arrives at a new airport or city they navigate from signs and maps.The visually impaired would also benefit from the information provided by signs. Signs (textualor otherwise) can be seen marking buildings, streets, entrances, floors and myriad other places. In
�
This technical report is a preliminary version of “Sign Classification using Local and Meta Features,”accepted for publication in the IEEE Workshop on Computer Vision Applications for the Visually Impaired (inconjunction with CVPR 2005).
User requestData Input: Processing:
Sign Detection
ImageAcquisition
Processing:Sign
Recognition
Synthesized Voice:Outputs signs existant in the
image Sign
Database
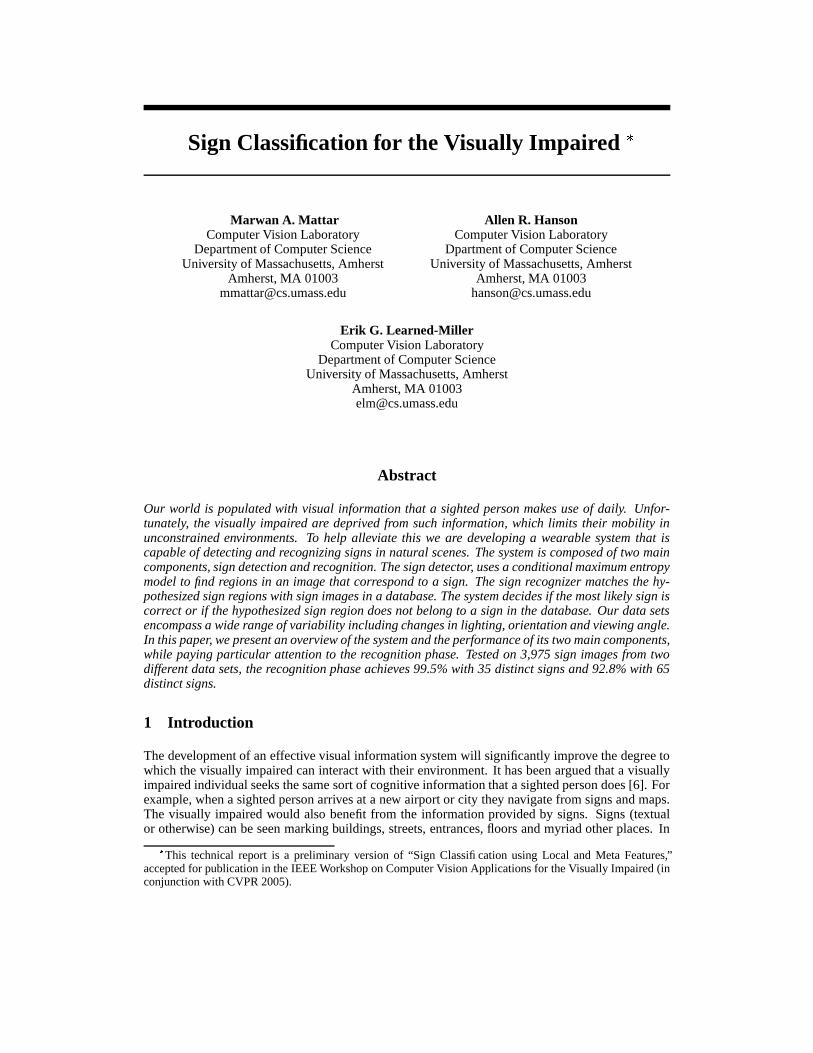
Figure 1: System Layout: An overview of the four modules (solid line) in our system.
this research, a “sign” or “sign class” is defined as any physical sign, including traffic, government,public, and commercial. This wide variability of signs adds to the complexity of the problem.
The wearable system will be composed of four modules (Figure 1). The first module is a head-mounted camera used to capture an image at the users request. The second module is a sign detector,which takes in the image from the camera and finds regions that correspond to a sign. The thirdmodule is a sign recognizer which classifies each image region into one of the signs in its database.Finally, the fourth module, a speech synthesizer, outputs information about the signs found in theimage.
Techniques for recognizing signs have recently gained attention from several researchers. However,the main focus in previous work has been recognition and identification of standard traffic signs,using color thresholding as the main method for detection. Sekanina and Torreson [17] used acolor-based filtering and template matching scheme to locate and read Norwegian speed limit signs.Liu and Ran [10] used color thresholding to segment images and recognize Stop signs using a neuralnetwork. Escalera et al. [5] detected signs using shape analysis and color thresholding and also usinga neural network for classification. Several techniques for text detection have been developed [8, 9,20]. More recently Chen and Yuille [3] developed a visual aid system for the blind that is capable ofreading text off of various signs.
Unlike most previous work, our system is not limited to recognizing a specific class of signs, suchas text or traffic. In this application a “sign” is simply any physical object that displays informationthat may be helpful for the blind. This system is faced with several challenges, that mainly arisefrom the large variability in the environment. This variability may be caused by, the wide range oflighting conditions, different viewing angles, occlusion and clutter, and the broad variation in text,symbolic structure, color and shapes that signs can possess.
The recognition phase is faced with yet another challenging problem. Given that the detector istrained on specific texture features, it produces hypothesized sign regions that may not contain signsor may contain signs that are not in our database. It is the responsibility of the recognizer to ensurethat a decision is only made for a specific image region if it contains a sign in the database. Falsepositives come at a high cost for a visually impaired person using this system.
2 Data Sets
For our experiments, we used three different data sets. Two of the data sets where compiled fortesting the recognition phase and the third data set was compiled to test the detection phase. Theimages of signs were taken using a still digital camera (Nikon Coolpix 995) with the automaticwhite balance on. Manual +/- exposure adjustment along with spot metering was used to controlthe amount of light projected onto the camera sensor. The following subsections provide moreinformation regarding each of the data sets.

Figure 2: Two sample images in the detection data set.
Figure 3: An example of the different lighting conditions captured by the five different images inthe 35 sign data set.
2.1 Detection Data
This data set contains 309 images of natural scenes from a town center. Two sample images areshown in Figure 2. The purpose of this data set is to test the performance of the sign detector. Thesigns in the images were manually segmented from the background to provide training and testingimages for the detector. The ratio of background to sign patches is more than 13:1 in this data set.
2.2 Recognition I: Lighting and Orientation
The purpose of this data set is to test the robustness of the sign recognizer with respect to variousillumination changes and in plane rotations. Frontal images of signs were taken at five different timesof the day, from sunrise to sunset. See Figure 3 for an example of the different lighting conditionscaptured in the five images. The images were manually segmented to remove the background. Wethen rotated each image from � ����� to
�����at � ��� intervals, resulting in 95 synthetic images per sign.
We synthesized views for 35 different signs resulting in a database of 3325 images.
2.3 Recognition II: Viewing Angle
We compiled a second recognition data set to test the robustness of the recognizer with respectto different viewing angles. This second database contains ten images of 65 different signs undervarious viewing angles. Figure 5 provides sample viewing angles of nine signs in the 65-classdata set. As before, all the images were manually segmented to remove any background. Thedifferent viewing angles where taken by moving the camera around the sign (i.e. the data was notsynthesized).
Query Image
ExtractLocal
Features
Local Featuresof training
images
Matchlocal
features
Computematch scores
with each class
Pick highest
matched class?
Trained SVMclassifier
no
Output nothing
Output highest
matched class
yes
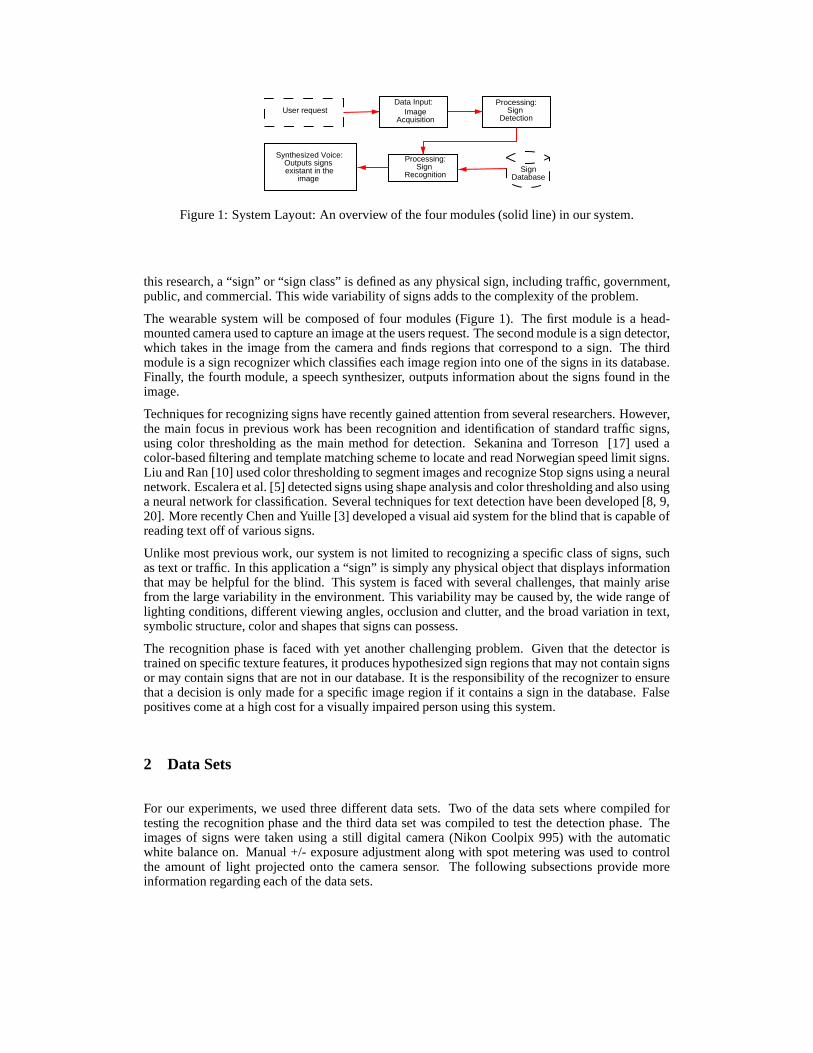
Figure 4: An overview the sign recognition phase.
3 Detection Phase
Sign detection is an extremely challenging problem. In this application we aim to detect signscontaining a broad set of fonts and color. Our overall approach [19] operates on the assumption thatsigns belong to a generic class of textures, and we seek to discriminate this class from the manyothers present in natural images.
When an image is provided to the detector, it is first divided into square patches that are the atomicunits for a binary classification decision on whether the patch contains a sign or not (Figure 6).We employ a wide range of features that are based on multiscale, oriented band-pass-filters, andnon-linear grating cells. These features have been shown to be effective at detecting signs in uncon-strained outdoor images [1]. Once features are calculated at each patch, we classify them as beingeither sign or background using a conditional random field classifier. After training, classificationinvolves checking whether the probability that an image patch is sign is above a threshold. We thencreate hypothesized sign regions in the image by running a connected components algorithm on thepatches that were classified as sign. Figure 6 shows the results of the sign detector on the images inFigure 2.
Images in the detection data set were divided into 713 overlapping patches ( ��������� pixels). Forevaluation, we performed ten fold cross validation. Using a MAP threshold ��� ���
we obtained � ����� sign detection rate with average sign coverage of ��������� . The majority of signs that were
not detected had poor image quality. (See [1] for more analysis of the detection phase.)
4 Recognition Phase
The recognition phase is composed of two classifiers. The first classifier computes a match scorebetween the query sign region and each sign class in the database. The second classifier uses thatmatch scores to decide whether the class with the highest match score is the correct one or whetherthe query sign region does not belong to any of the classes in the database. Figure 4 shows anoverview of the recognition system.
4.1 Global and Local Image Features
Image features can be roughly grouped into two categories, local or global. Global features, such astexture descriptors, are computed over the entire image and result in one feature vector per image.
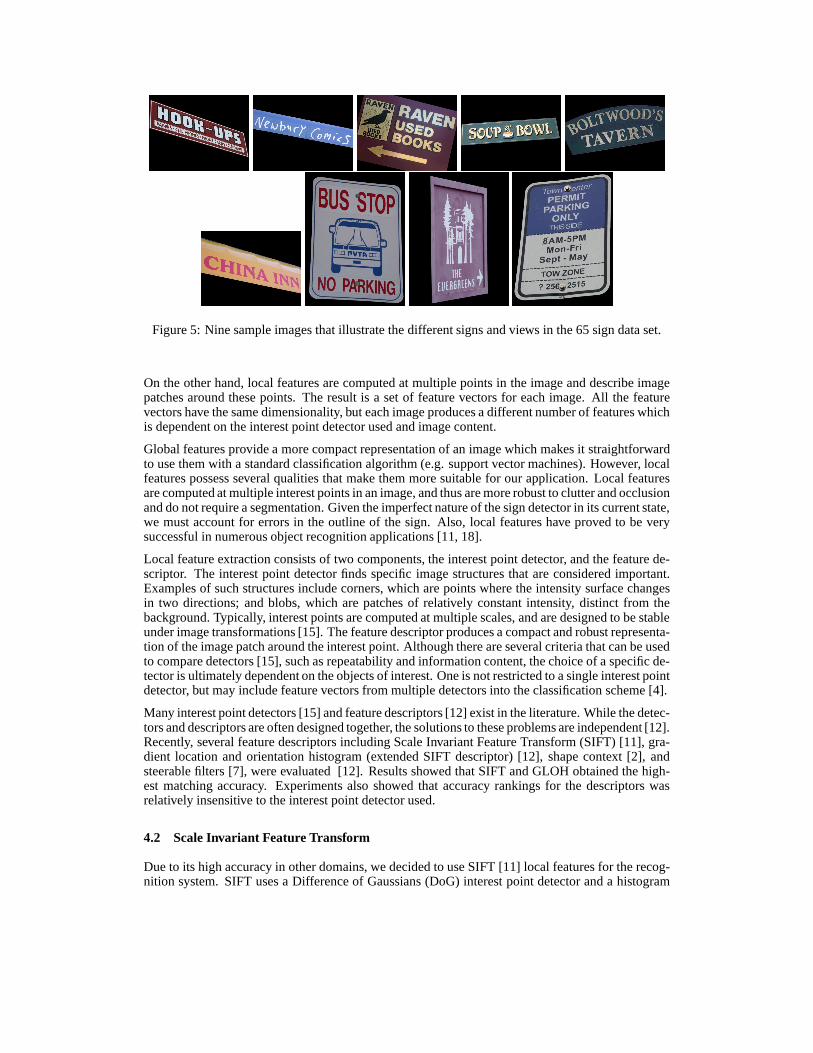
Figure 5: Nine sample images that illustrate the different signs and views in the 65 sign data set.
On the other hand, local features are computed at multiple points in the image and describe imagepatches around these points. The result is a set of feature vectors for each image. All the featurevectors have the same dimensionality, but each image produces a different number of features whichis dependent on the interest point detector used and image content.
Global features provide a more compact representation of an image which makes it straightforwardto use them with a standard classification algorithm (e.g. support vector machines). However, localfeatures possess several qualities that make them more suitable for our application. Local featuresare computed at multiple interest points in an image, and thus are more robust to clutter and occlusionand do not require a segmentation. Given the imperfect nature of the sign detector in its current state,we must account for errors in the outline of the sign. Also, local features have proved to be verysuccessful in numerous object recognition applications [11, 18].
Local feature extraction consists of two components, the interest point detector, and the feature de-scriptor. The interest point detector finds specific image structures that are considered important.Examples of such structures include corners, which are points where the intensity surface changesin two directions; and blobs, which are patches of relatively constant intensity, distinct from thebackground. Typically, interest points are computed at multiple scales, and are designed to be stableunder image transformations [15]. The feature descriptor produces a compact and robust representa-tion of the image patch around the interest point. Although there are several criteria that can be usedto compare detectors [15], such as repeatability and information content, the choice of a specific de-tector is ultimately dependent on the objects of interest. One is not restricted to a single interest pointdetector, but may include feature vectors from multiple detectors into the classification scheme [4].
Many interest point detectors [15] and feature descriptors [12] exist in the literature. While the detec-tors and descriptors are often designed together, the solutions to these problems are independent [12].Recently, several feature descriptors including Scale Invariant Feature Transform (SIFT) [11], gra-dient location and orientation histogram (extended SIFT descriptor) [12], shape context [2], andsteerable filters [7], were evaluated [12]. Results showed that SIFT and GLOH obtained the high-est matching accuracy. Experiments also showed that accuracy rankings for the descriptors wasrelatively insensitive to the interest point detector used.
4.2 Scale Invariant Feature Transform
Due to its high accuracy in other domains, we decided to use SIFT [11] local features for the recog-nition system. SIFT uses a Difference of Gaussians (DoG) interest point detector and a histogram

of gradient orientations as the feature descriptor. The SIFT algorithm is composed of four mainstages: (1) scale-space peak detection; (2) keypoint localization; (3) orientation assignment; (4)keypoint descriptor. In the first stage, potential interest points are found by searching across im-age location and scale. This is implemented efficiently by finding local peaks in a series of DoGfunctions. The second stage, fits a model to each candidate point to determine location and scale,and discards any points that are found unstable. The third stage finds the dominant orientation foreach keypoint based on its local image patch. All future operations are performed on image datathat has been transformed relative to the assigned orientation, location and scale to provide invari-ance to these transformations. The final stage computes 8 bin histograms of gradient orientationsat 16 patches around the interest point resulting in a 128 dimensional feature vector. The vectorsare then normalized and any vectors with small magnitude are discarded. SIFT has been shown tobe very effective in numerous object recognition problems [11, 12, 4, 13]. Also, the features arecomputed over gray scale images which increases their robustness to varying illumination changes,a very useful property for an outdoor sign recognition system.
4.3 Image Similarity Measure
One technique for classification with local features is to find point correspondences between twoimages. A feature ��� in image A corresponds or matches to a feature ��� in image B if the nearestneighbor of � � in image B is � � and the Euclidean distance between them falls below a threshold.The Euclidean distance is usually used with histogram-based descriptors, such as SIFT, while otherfeatures such as Differential features are compared using the Mahalanobis distance, because therange of values of their components differ by orders of magnitude.
For our recognition system, we will use the number of point correspondences between two imageas our similarity measure. There are two main advantages with this measure. First, SIFT featurematching has been shown to be very robust with respect to image deformation [12]. Second, nearestneighbor search can be implemented efficiently using a k-d-b tree [14] which allows for fast classi-fication. Thus, we can define an image similarity measure that is based on the number of matchesbetween the images. Since the number of matches between image ��� and �� is different from thenumber of matches between image �� and �� , we define our bi-directional image similarity measureas: � � � ��� � ����� �
� �� � �� ��� �� �� � �� �
� �where �
��� ����� is the number of matches between A and B.
Sign images that belong to the same class will have similar local features since each class containsthe same sign under different viewing conditions. We will use that property to increase our classi-fication accuracy by grouping all the features that belong to the same class into one bag. Thus, wewill end up with one bag of keypoints for each class. Now we can match each test image with a bagand produce a match score for each class. We define a new similarity measure between an image �and a class
�that contains � images
���as:
� � � � � ������! �
� � � � �"� �
4.4 Rejecting Most Likely Class
Given the match score for each class, we train a Support Vector Machine (SVM) meta-classifier todecide if the class with the highest match score is the correct class or if the test image does notbelong to any of the signs in the database. We have observed that when a test image does not belongto any of the signs in the database, the match scores are relatively low and have approximately thesame value. Thus, for the SVM classifier we compute features from the match scores that capturethat information.

First, we sort the match scores from all the classes in descending order, then we subtract adjacentmatch scores to get the difference between the scores of the first and second class, the second andthird class, etc. However, since the difference between lower ranked classes are insignificant welimit our differences to the top 11 classes resulting in 10 features. We also use the highest matchscore as another feature along with the probability of that class. We obtain a posterior probabilitydistribution over class labels by simply normalizing the match scores. Thus, the probability thatimage � belongs to class � � is defined as
� � � ��� � ���� � � � � � ����� � � � � � � � � �
where � is the number of classes. We also compute the entropy of the probability distribution overclass labels. Entropy is an information-theoretic quantity that measures the uncertainty in a randomvariable. The entropy � � � of a random variable
with a probability mass function � � � is
defined by� � ��� �
�� ���
� �� ����� � � �� �
Using these 13 features we train an SVM classifier to decided if the class with the highest score isthe correct one.
The approach of using the output of a classifier for input to another meta-classifier is similar to anensemble algorithm known as “stacking.” Stacking [16] improves classification accuracy by com-bining the outputs of multiple component classifiers. It concatenates the probability distributionsover class labels produced by each component classifier and uses that as input to a meta-classifier.Stacking can also be used with just one component classifier. In the case of stacking both the com-ponent classifiers and the meta-classifier are solving the same � -class problem. However, in ourcase we use the meta-classifier to solve a different problem than the component classifier.
We adapt the idea of stacking by using the probability distribution as the sole features for the meta-classifier. In experiment 3 of the following section we compare our choice of features with that ofstacking.
5 Experiments and Results
We performed 3 different experiments to test the various aspects of the recognition phase. Thefirst experiment tested the recognizer on the 35 sign database. The second tested it on the 65 signdatabase. Finally, the third experiment tested the recognizer on the 65 class database while omittinghalf of the sign classes from the training data to evaluate how well it performs on ruling out a signimage that does not belong to any of the signs in the training set. Table 1 summarizes the results ofthe recognizer for the different experiments. The following subsections describe the experimentalset up in more detail.
5.1 Recognition: 35-class data set
This data set contains 3325 sign images from 35 different signs. We performed a leave-one-outexperiment using 3325 test images, while using only 175 training instances. Although each signcontains 95 instances, there are only 5 unique ones since the remaining 90 correspond to the syntheticrotations. For our training set we only kept the five unique images from each sign. We comparedeach test image to 174 training images leaving out the one that corresponds to the rotated version ofthe test image.
The results of both the image matching and feature bagging were identical and extremely high,achieving a 99.5% accuracy. The main reason that the feature bagging did not improve accuracy inthis case was because the small number of test instances that were classified incorrectly using image
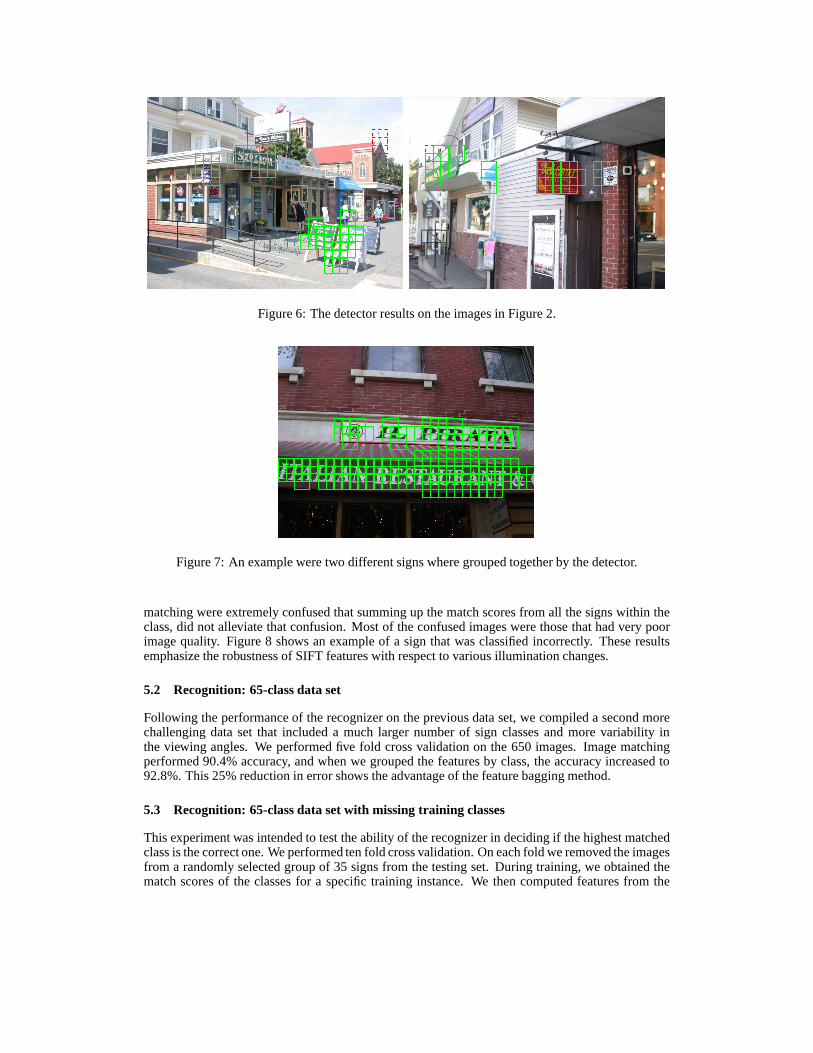
Figure 6: The detector results on the images in Figure 2.
Figure 7: An example were two different signs where grouped together by the detector.
matching were extremely confused that summing up the match scores from all the signs within theclass, did not alleviate that confusion. Most of the confused images were those that had very poorimage quality. Figure 8 shows an example of a sign that was classified incorrectly. These resultsemphasize the robustness of SIFT features with respect to various illumination changes.
5.2 Recognition: 65-class data set
Following the performance of the recognizer on the previous data set, we compiled a second morechallenging data set that included a much larger number of sign classes and more variability inthe viewing angles. We performed five fold cross validation on the 650 images. Image matchingperformed 90.4% accuracy, and when we grouped the features by class, the accuracy increased to92.8%. This 25% reduction in error shows the advantage of the feature bagging method.
5.3 Recognition: 65-class data set with missing training classes
This experiment was intended to test the ability of the recognizer in deciding if the highest matchedclass is the correct one. We performed ten fold cross validation. On each fold we removed the imagesfrom a randomly selected group of 35 signs from the testing set. During training, we obtained thematch scores of the classes for a specific training instance. We then computed features from the

Figure 8: The image on the left is a sample sign that was misclassified in the 35 sign experiment. Itwas classified as a member of the sign on the right.
Experiment Mean Accuracy STD (+/-)35 sign: Image Matching 99.5% N/A35 sign: Feature Grouping 99.5% N/A65 sign: Image Matching 90.4% 2.75%65 sign: Feature Grouping 92.8% 2.73%65 sign: Stacking 82.25% 0.19%65 sign: Our-meta 90.8% 0.26%
Table 1: Summary of results for the sign recognizer.
match scores and then attached a class label of 1 if the training instance belonged to a class in thenew test set, 0 otherwise. We then train the SVM classifier and use the trained model to classify thetest data.
Using our 13 features, the meta-classifier achieved 90.8% accuracy, while using the probabilitydistribution we only acheived 82.25%. These results strengthen our choice of features and show thatthey contain more useful information than the probability distribution.
This is mainly because the probability distribution can be misleading with respect to the matchscores. For example, assume that we have two classes in our database, and we are presented with animage that truly does not belong to either. Assume also that when we match the image with the twoclasses we get 1 and 0 match scores respectively. Although it is obvious that the match scores are toolow for the image to belong to any of the classes, when we normalize, we obtain a 100% probabilitythat the first class is the correct class, which is obviously incorrect. Our features caputure most ofthe relevant information from the match scores which is important for the classification.
6 Conclusion and Future Work
We have presented algorithms for sign detection and recognition for a wearable system to be used bythe blind. The sign detector uses a wide array of features with a conditional random field classifierto find sign regions in the image. The sign recognizer matches each of the hypothesized sign regionswith the sign classes in a database and then decides if the highest matched class is the correct one orif the region does not belong to any of the sign classes.
Each of the components perform well on their respective tasks. We are currently in the process ofintegrating the two components to obtain a complete working system. Figure 9 shows initial sampleresults of the two components working together. We are also working on improving the accuracy ofthe individual components. We plan to improve the sign detection rate by using Markov fields withICM for fast approximate inference. Also the sign recognizer has to be extended to be able to deal
with cases were a hypothesized sign region contains more than one sign in the database (Figure 7).Future work also includes adding the final two modules to the system, the head-mounted cameraand the voice synthesizer.
Acknowledgments
This material is based upon work supported by the National Science Foundation under Grant No.IIS-0100851.
References
[1] Anonymous.
[2] S. Belongie, J. Malik, and J. Puzicha. Shape matching and object recognition using shapecontexts. IEEE Transaction on Pattern Analysis and Machine Intelligence, 24(4), 2002.
[3] X. Chen and A.L.Yuille. Detecting and reading text in natural scenes. In Proceedings of IEEEConference on Computer Vision and Pattern Recognition, Washington, DC, June 2004.
[4] Gyuri Dorko and Cordelia Schmid. Object class recognition using discriminative local features.Submitted to IEEE Transactions on Pattern Analysis and Machine Intelligence, 2004.
[5] A. Escalera, L. Moreno, M. Salichs, and J. Armingol. Road traffic sign detection and classifi-cation. IEEE Transactions on Industrial Electronics, 44:848–859, 1997.
[6] Electronic Travel Aids: New Directions for Research Working Group on Mobility Aids for theVisually Impaired and Blind. Committee on Vision, National Research Council, NationalAcademy Press, Washington, D.C., 1986.
[7] W. T. Freeman and E. H. Adelson. The design and use of steerable filters. IEEE Transactionson Pattern Analysis and Machine Intelligence, 13(9), 1991.
[8] C. Garcia and X. Apostolidis. Text detection and segmentation in complex color images. InProceedings of 2000 IEEE International Conference on Acoustics, Speech and Signal Process-ing (ICASSP2000), volume 4, pages 2326–2330, June 2000.
[9] A.K. Jain and S. Bhattacharjee. Text segmentation using Gabor filters for automatic documentprocessing. Machine Vision Applications, 5:169–184, 1992.
[10] H. X. Liu and B. Ran. Vision-based stop sign detection and recognition system for intelligentvehicles. Advanced Traffic Management Systems and Vehicle-Highway Automation, pages161–166, 2002.
[11] David G. Lowe. Distinctive image features from scale-invariant keypoints. International Jour-nal of Computer Vision, 2004.
[12] Krystian Mikolajczyk and Cordelia Schmid. A performance evaluation of local descriptors.Submitted to IEEE Transactions on Pattern Analysis and Machine Intelligence, 2004.
[13] Pierre Moreels and Pietro Perona. Common-frame model for object recognition. InLawrence K. Saul, Yair Weiss, and Leon Bottou, editors, Advances in Neural InformationProcessing Systems 17. MIT Press, Cambridge, MA, 2005.
[14] J. T. Robinson. The k-d-b-tree: A search structure for large multidimensional receptive fieldhistograms. Transactions of the Associateion for Computing Machinery, 1981.
[15] Cordelia Schmid, Roger Mohr, and Christian Bauckhage. Evaluation of interest point detec-tors. International Journal of Computer Vision, 37(2):151–172, 2000.
[16] Alexander K. Seewald. Towards Understanding Stacking - Studies of a General EnsembleLearning Scheme. PhD thesis, Austrian Research Institute for Artificial Intelligence (FAI),2003.

[17] L. Sekanina and J. Torresen. Detection of norwegian speed limit signs. In Proceedings of theEuropean Simulation Multiconference, pages 337–340, 2002.
[18] T.Tuytelaars V. Ferrari and L.Van Gool. Simultaneous object recognition and segmentation byimage exploration. In Proc. 8th European Conference on Computer Vision, 2004.
[19] J. Weinman, A. Hanson, and A. McCallum. Sign detection in natural images with conditionalrandom fields. In Proc. of IEEE International Workshop on Machine Learning for SignalProcessing, pages 549–558, Sao Luıs, Brazil, Sep. 2004.
[20] Victor Wu, R. Manmatha, and Edward M. Riseman. Finding text in images. In DL’97: Pro-ceedings of the 2nd ACM International Conference on Digital Libraries, Images, and Multi-media, pages 3–12, 1997.
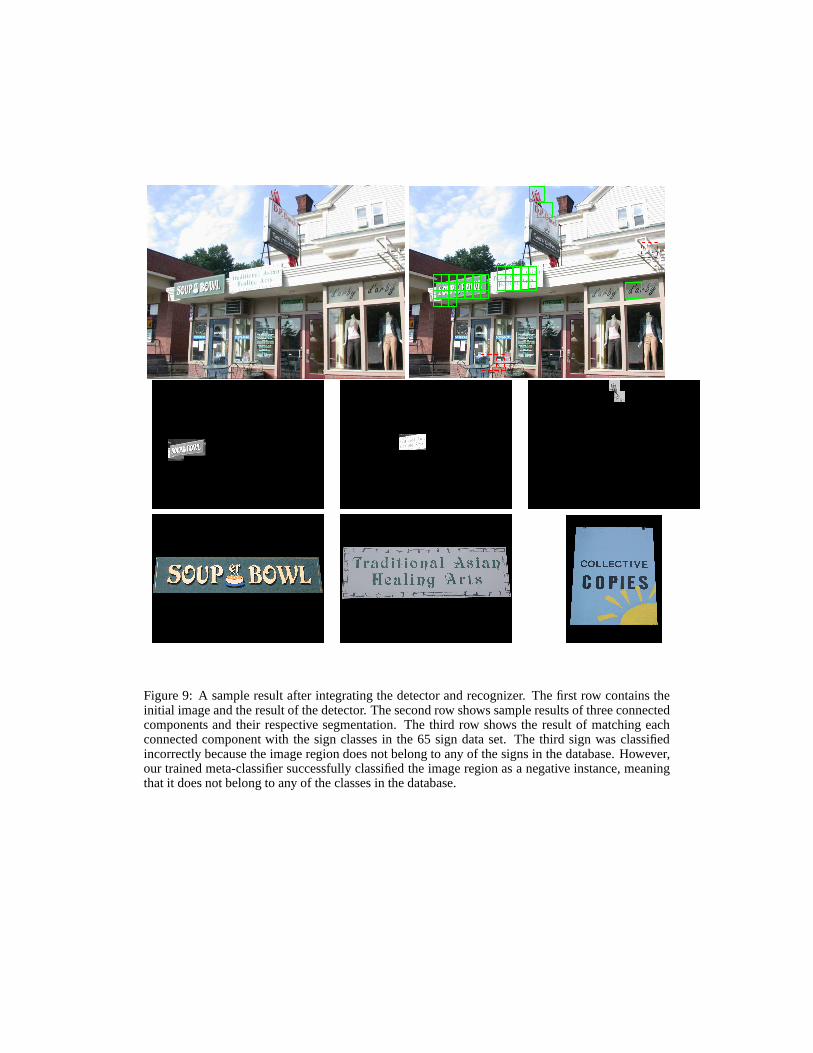
Figure 9: A sample result after integrating the detector and recognizer. The first row contains theinitial image and the result of the detector. The second row shows sample results of three connectedcomponents and their respective segmentation. The third row shows the result of matching eachconnected component with the sign classes in the 65 sign data set. The third sign was classifiedincorrectly because the image region does not belong to any of the signs in the database. However,our trained meta-classifier successfully classified the image region as a negative instance, meaningthat it does not belong to any of the classes in the database.


![SMART CANE FOR VISUALLY IMPAIRED PEOPLEgreenskill.net/suhailan/fyp/report/037454.pdf · visually-impaired people. First, Smart Cane: Assistive Cane for Visually-impaired People [9]](https://img.pdfslide.us/doc/110x75/5fc7e53d210a4218aa7c699a/smart-cane-for-visually-impaired-visually-impaired-people-first-smart-cane-assistive.jpg)