Embed Size (px)
Citation preview
PRESENTED BY
NEW YORK 120 Broadway, 35th Floor | New York N.Y. 10271 | WASHINGTON 1101 New York Avenue, NW, 8th Floor | Washington, D.C. 20005
SIFMA U.S. Capital Markets Deck
SIFMA RESEARCHSeptember 6, 2018
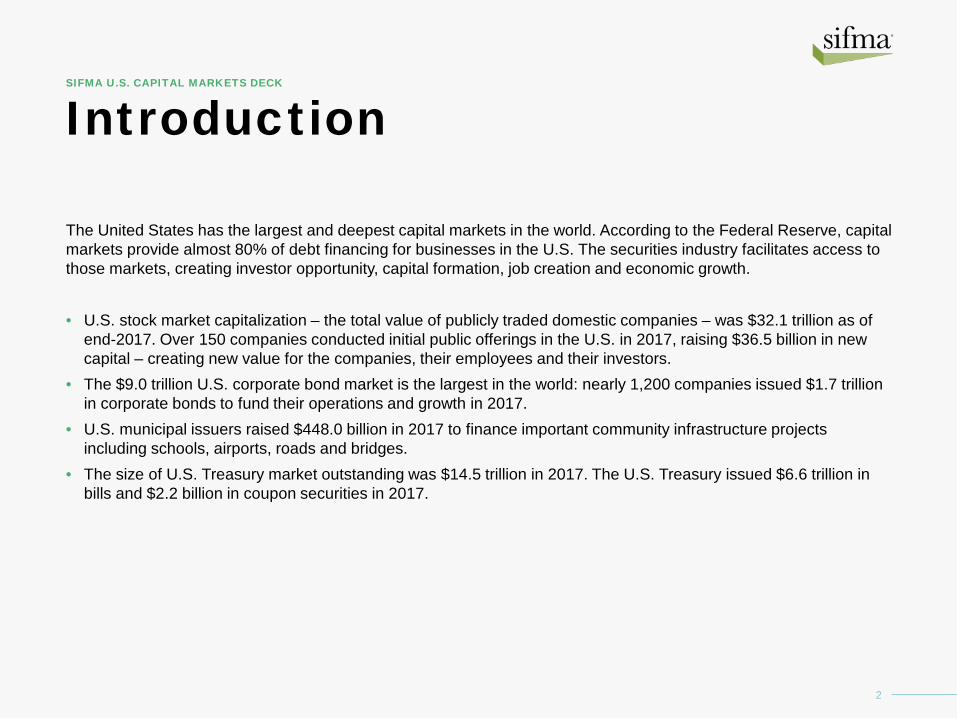
Introduction
The United States has the largest and deepest capital markets in the world. According to the Federal Reserve, capital markets provide almost 80% of debt financing for businesses in the U.S. The securities industry facilitates access to those markets, creating investor opportunity, capital formation, job creation and economic growth.
• U.S. stock market capitalization – the total value of publicly traded domestic companies – was $32.1 trillion as of end-2017. Over 150 companies conducted initial public offerings in the U.S. in 2017, raising $36.5 billion in new capital – creating new value for the companies, their employees and their investors.
• The $9.0 trillion U.S. corporate bond market is the largest in the world: nearly 1,200 companies issued $1.7 trillion in corporate bonds to fund their operations and growth in 2017.
• U.S. municipal issuers raised $448.0 billion in 2017 to finance important community infrastructure projects including schools, airports, roads and bridges.
• The size of U.S. Treasury market outstanding was $14.5 trillion in 2017. The U.S. Treasury issued $6.6 trillion in bills and $2.2 billion in coupon securities in 2017.
2
SIFMA U.S. CAPITAL MARKETS DECK
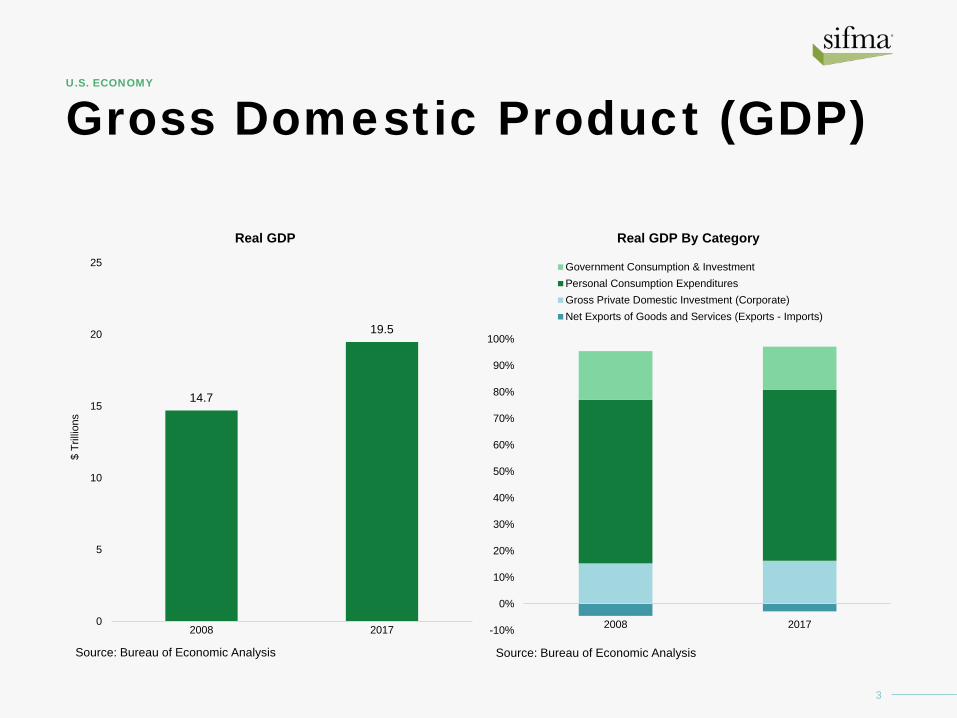
Gross Domestic Product (GDP)
3
U.S. ECONOMY
14.7
19.5
0
5
10
15
20
25
2008 2017
$ Tr
illion
s
Real GDP
Source: Bureau of Economic Analysis
-10%
0%
10%
20%
30%
40%
50%
60%
70%
80%
90%
100%
2008 2017
Real GDP By Category
Government Consumption & InvestmentPersonal Consumption ExpendituresGross Private Domestic Investment (Corporate)Net Exports of Goods and Services (Exports - Imports)
Source: Bureau of Economic Analysis
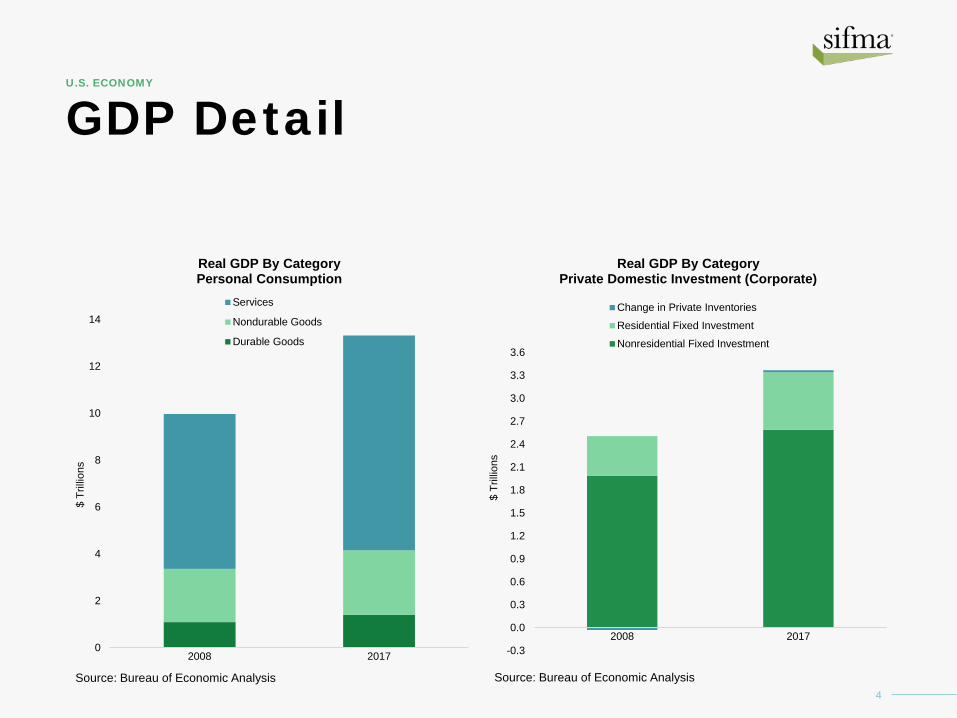
GDP Detail
4
U.S. ECONOMY
0
2
4
6
8
10
12
14
2008 2017
$ Tr
illion
s
Real GDP By CategoryPersonal Consumption
Services
Nondurable Goods
Durable Goods
Source: Bureau of Economic Analysis
-0.3
0.0
0.3
0.6
0.9
1.2
1.5
1.8
2.1
2.4
2.7
3.0
3.3
3.6
2008 2017
$ Tr
illion
s
Real GDP By CategoryPrivate Domestic Investment (Corporate)
Change in Private InventoriesResidential Fixed InvestmentNonresidential Fixed Investment
Source: Bureau of Economic Analysis

GDP in Perspective
5
U.S. ECONOMY
• In 2008, total U.S. GDP was more than three times as large as both Japan’s and China’s GDP and 22.7% smaller than the European Union’s GDP. In 2017, total U.S. GDP reached more than four times that of Japan, 1.62 times large as China’s GDP and 14.8% larger than the European Union’s GDP.
• In 2008, US GDP per capita was 127.6% larger than the European Union and Japan, and over 14 times that of China. In 2017, US GDP per capita was 154.9% larger than Japan, 176.6% larger than European Union’s GDP, and almost 7 times that of China.
0
5
10
15
20
25
2008 2017
$ Tr
illion
s
GDP by Region
Japan US European Union China
Note: European Union includes the 28 member statesSource: World Bank
010203040506070
2008 2017
$ Th
ousa
nds
GDP Per Capita by Region
Japan US European Union China
Note: European Union includes the 28 member statesSource: World Bank
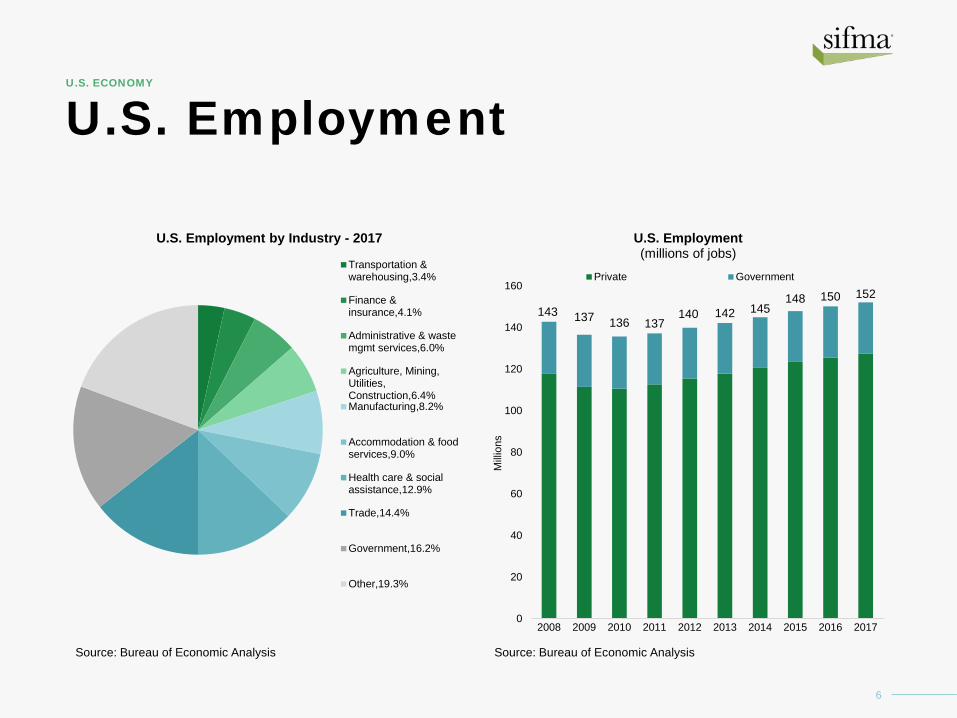
U.S. Employment
6
U.S. ECONOMY
U.S. Employment by Industry - 2017
Transportation &warehousing,3.4%
Finance &insurance,4.1%
Administrative & wastemgmt services,6.0%
Agriculture, Mining,Utilities,Construction,6.4%Manufacturing,8.2%
Accommodation & foodservices,9.0%
Health care & socialassistance,12.9%
Trade,14.4%
Government,16.2%
Other,19.3%
Source: Bureau of Economic Analysis
143 137 136 137140 142 145
148 150 152
0
20
40
60
80
100
120
140
160
2008 2009 2010 2011 2012 2013 2014 2015 2016 2017
Milli
ons
U.S. Employment(millions of jobs)
Private Government
Source: Bureau of Economic Analysis
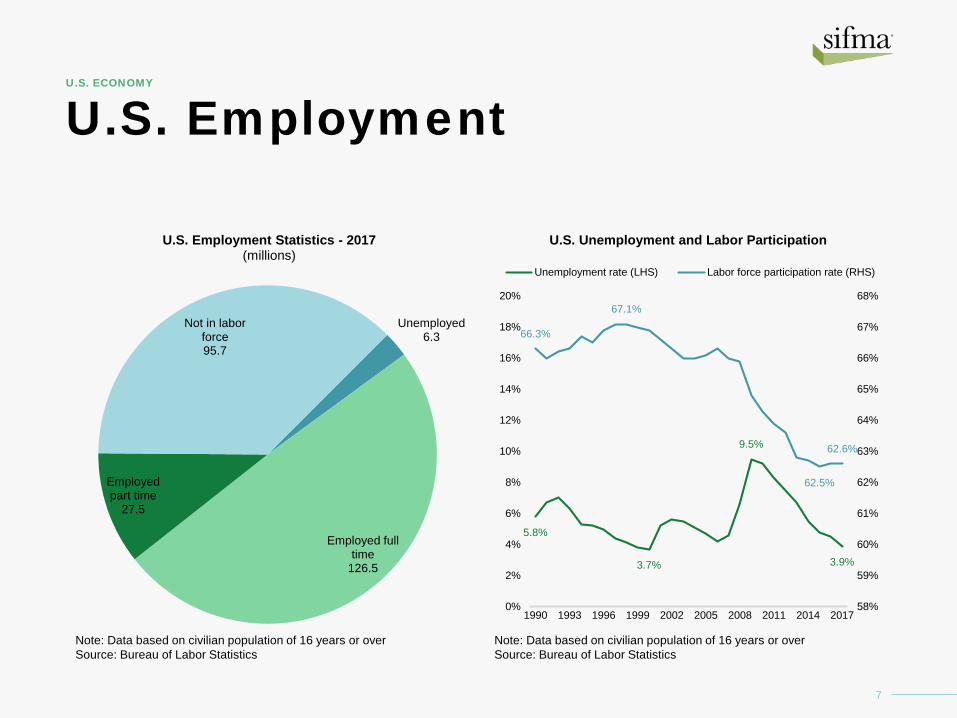
U.S. Employment
7
U.S. ECONOMY
Unemployed6.3
Employed full time
126.5
Employed part time
27.5
Not in labor force95.7
U.S. Employment Statistics - 2017(millions)
Note: Data based on civilian population of 16 years or overSource: Bureau of Labor Statistics
5.8%
3.7%
9.5%
3.9%
66.3%
67.1%
62.5%
62.6%
58%
59%
60%
61%
62%
63%
64%
65%
66%
67%
68%
0%
2%
4%
6%
8%
10%
12%
14%
16%
18%
20%
1990 1993 1996 1999 2002 2005 2008 2011 2014 2017
U.S. Unemployment and Labor Participation
Unemployment rate (LHS) Labor force participation rate (RHS)
Note: Data based on civilian population of 16 years or overSource: Bureau of Labor Statistics
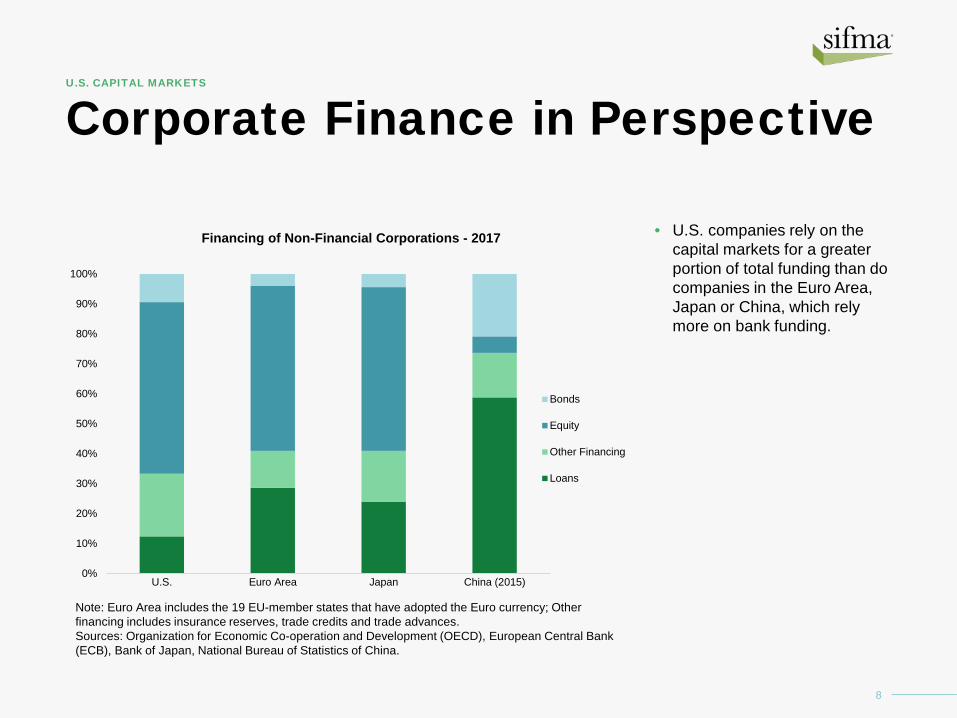
Corporate Finance in Perspective
• U.S. companies rely on the capital markets for a greater portion of total funding than do companies in the Euro Area, Japan or China, which rely more on bank funding.
8
U.S. CAPITAL MARKETS
0%
10%
20%
30%
40%
50%
60%
70%
80%
90%
100%
U.S. Euro Area Japan China (2015)
Financing of Non-Financial Corporations - 2017
Bonds
Equity
Other Financing
Loans
Note: Euro Area includes the 19 EU-member states that have adopted the Euro currency; Other financing includes insurance reserves, trade credits and trade advances.Sources: Organization for Economic Co-operation and Development (OECD), European Central Bank (ECB), Bank of Japan, National Bureau of Statistics of China.
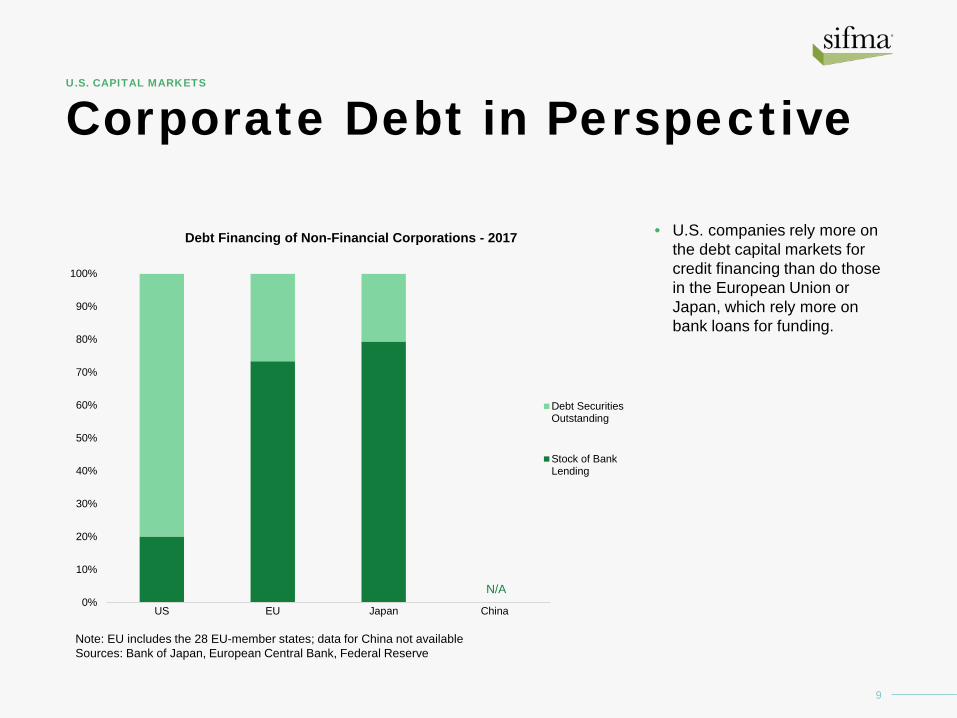
Corporate Debt in Perspective
• U.S. companies rely more on the debt capital markets for credit financing than do those in the European Union or Japan, which rely more on bank loans for funding.
9
U.S. CAPITAL MARKETS
0%
10%
20%
30%
40%
50%
60%
70%
80%
90%
100%
US EU Japan China
Debt Financing of Non-Financial Corporations - 2017
Debt SecuritiesOutstanding
Stock of BankLending
Note: EU includes the 28 EU-member states; data for China not availableSources: Bank of Japan, European Central Bank, Federal Reserve
N/A
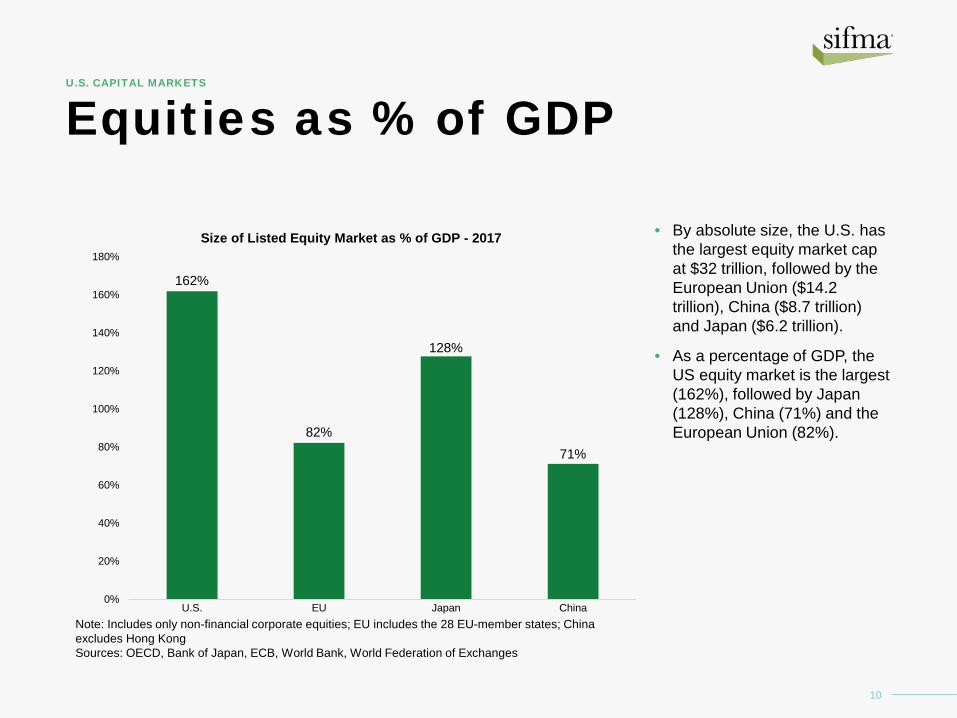
Equities as % of GDP
• By absolute size, the U.S. has the largest equity market cap at $32 trillion, followed by the European Union ($14.2 trillion), China ($8.7 trillion) and Japan ($6.2 trillion).
• As a percentage of GDP, the US equity market is the largest (162%), followed by Japan (128%), China (71%) and the European Union (82%).
10
U.S. CAPITAL MARKETS
162%
82%
128%
71%
0%
20%
40%
60%
80%
100%
120%
140%
160%
180%
U.S. EU Japan China
Size of Listed Equity Market as % of GDP - 2017
Note: Includes only non-financial corporate equities; EU includes the 28 EU-member states; China excludes Hong KongSources: OECD, Bank of Japan, ECB, World Bank, World Federation of Exchanges
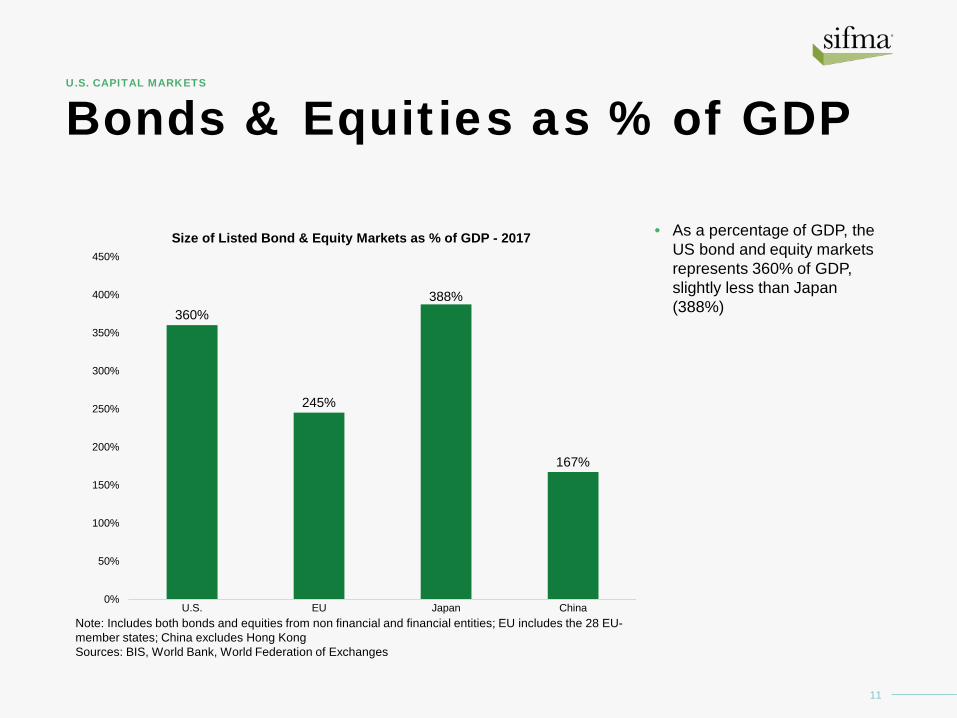
Bonds & Equities as % of GDP
11
U.S. CAPITAL MARKETS
360%
245%
388%
167%
0%
50%
100%
150%
200%
250%
300%
350%
400%
450%
U.S. EU Japan China
Size of Listed Bond & Equity Markets as % of GDP - 2017
Note: Includes both bonds and equities from non financial and financial entities; EU includes the 28 EU-member states; China excludes Hong KongSources: BIS, World Bank, World Federation of Exchanges
• As a percentage of GDP, the US bond and equity markets represents 360% of GDP, slightly less than Japan (388%)
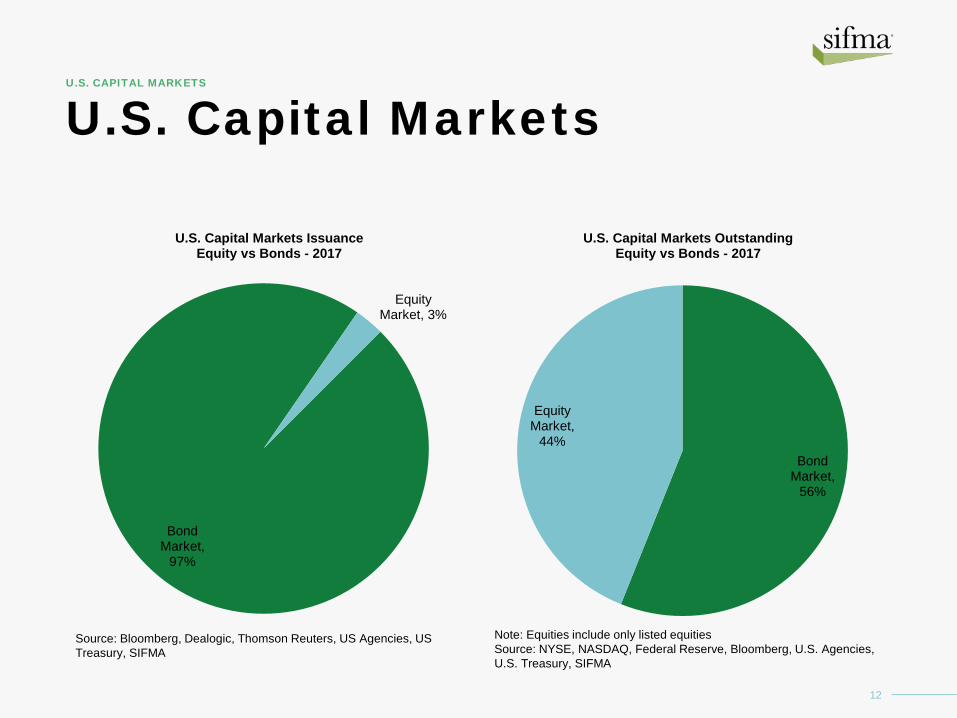
U.S. Capital Markets
12
U.S. CAPITAL MARKETS
Bond Market,
97%
Equity Market, 3%
U.S. Capital Markets IssuanceEquity vs Bonds - 2017
Source: Bloomberg, Dealogic, Thomson Reuters, US Agencies, US Treasury, SIFMA
Bond Market,
56%
Equity Market,
44%
U.S. Capital Markets Outstanding Equity vs Bonds - 2017
Note: Equities include only listed equities Source: NYSE, NASDAQ, Federal Reserve, Bloomberg, U.S. Agencies, U.S. Treasury, SIFMA
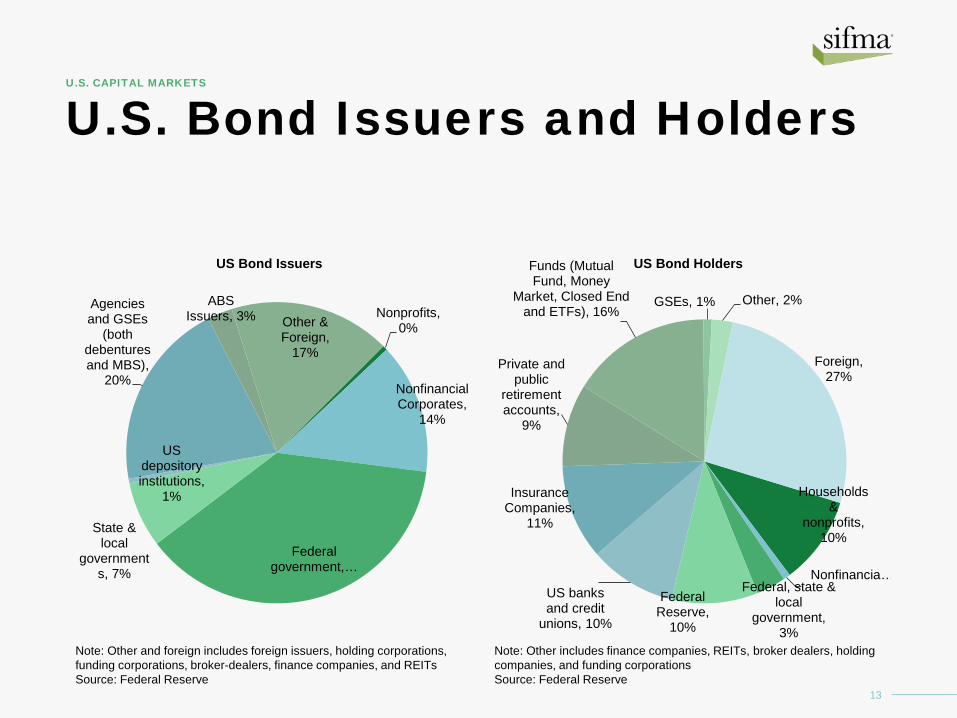
U.S. Bond Issuers and Holders
13
U.S. CAPITAL MARKETS
Nonprofits, 0%
Nonfinancial Corporates,
14%
Federal government, …
State & local
governments, 7%
US depository institutions,
1%
Agencies and GSEs
(both debentures and MBS),
20%
ABS Issuers, 3% Other &
Foreign, 17%
US Bond Issuers
Note: Other and foreign includes foreign issuers, holding corporations, funding corporations, broker-dealers, finance companies, and REITs Source: Federal Reserve
Households &
nonprofits, 10%
Nonfinancia…Federal, state &
local government,
3%
Federal Reserve,
10%
US banks and credit
unions, 10%
Insurance Companies,
11%
Private and public
retirement accounts,
9%
Funds (Mutual Fund, Money
Market, Closed End and ETFs), 16%
GSEs, 1% Other, 2%
Foreign, 27%
US Bond Holders
Note: Other includes finance companies, REITs, broker dealers, holding companies, and funding corporationsSource: Federal Reserve
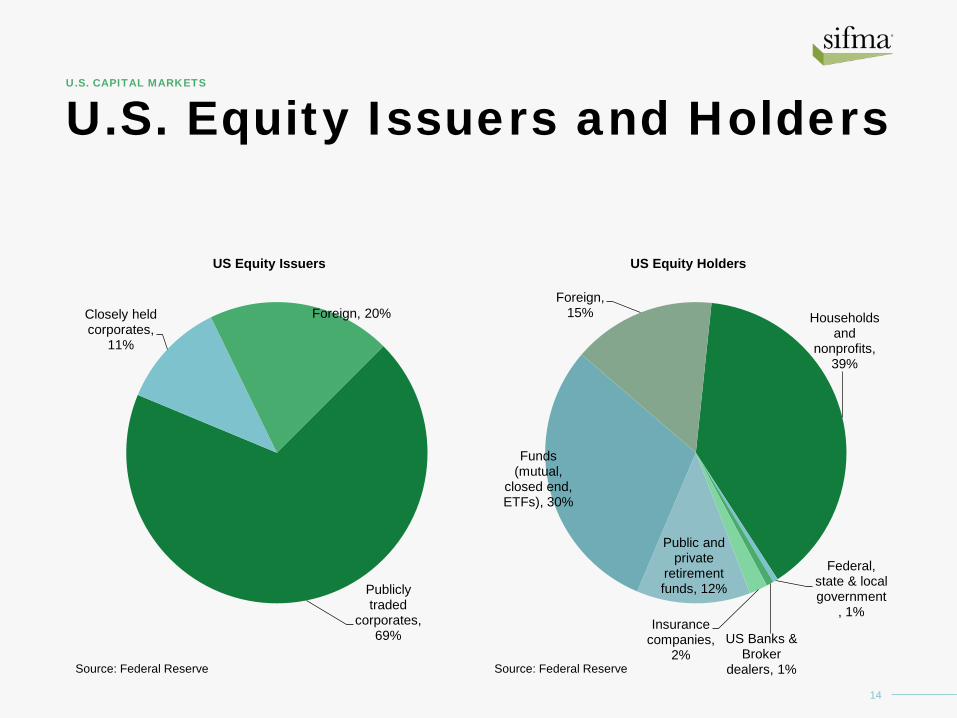
U.S. Equity Issuers and Holders
14
U.S. CAPITAL MARKETS
Publicly traded
corporates, 69%
Closely held corporates,
11%
Foreign, 20%
US Equity Issuers
Source: Federal Reserve
Households and
nonprofits, 39%
Federal, state & local government
, 1%
US Banks & Broker
dealers, 1%
Insurance companies,
2%
Public and private
retirement funds, 12%
Funds (mutual,
closed end, ETFs), 30%
Foreign, 15%
US Equity Holders
Source: Federal Reserve
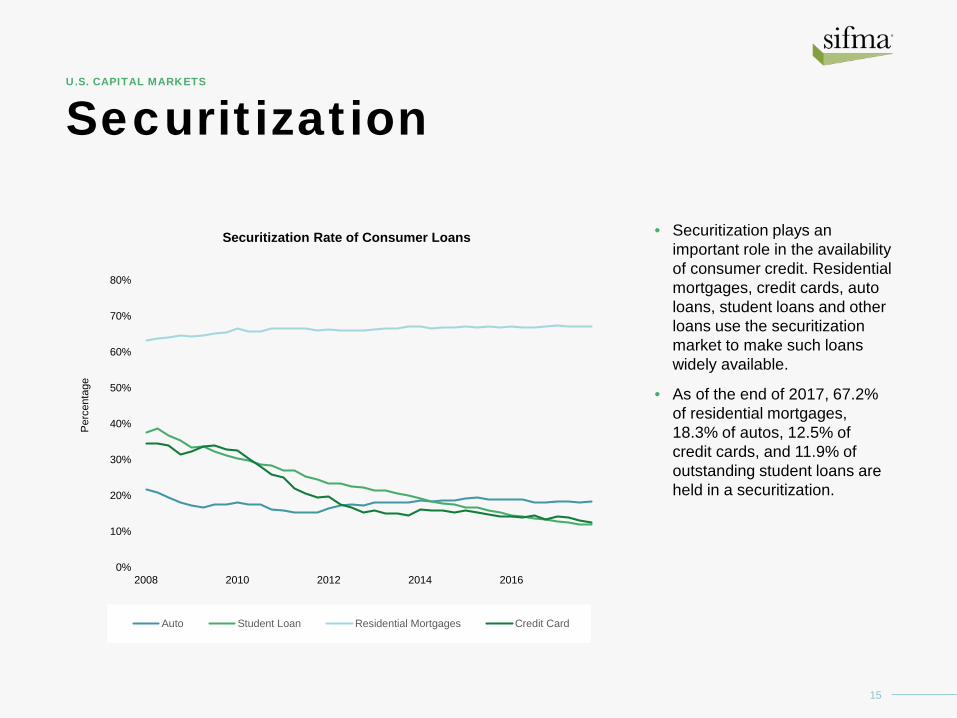
Securitization
• Securitization plays an important role in the availability of consumer credit. Residential mortgages, credit cards, auto loans, student loans and other loans use the securitization market to make such loans widely available.
• As of the end of 2017, 67.2% of residential mortgages, 18.3% of autos, 12.5% of credit cards, and 11.9% of outstanding student loans are held in a securitization.
15
U.S. CAPITAL MARKETS
0%
10%
20%
30%
40%
50%
60%
70%
80%
2008 2010 2012 2014 2016
Perc
enta
ge
Securitization Rate of Consumer Loans
Auto Student Loan Residential Mortgages Credit Card

16
BondsA Closer Look
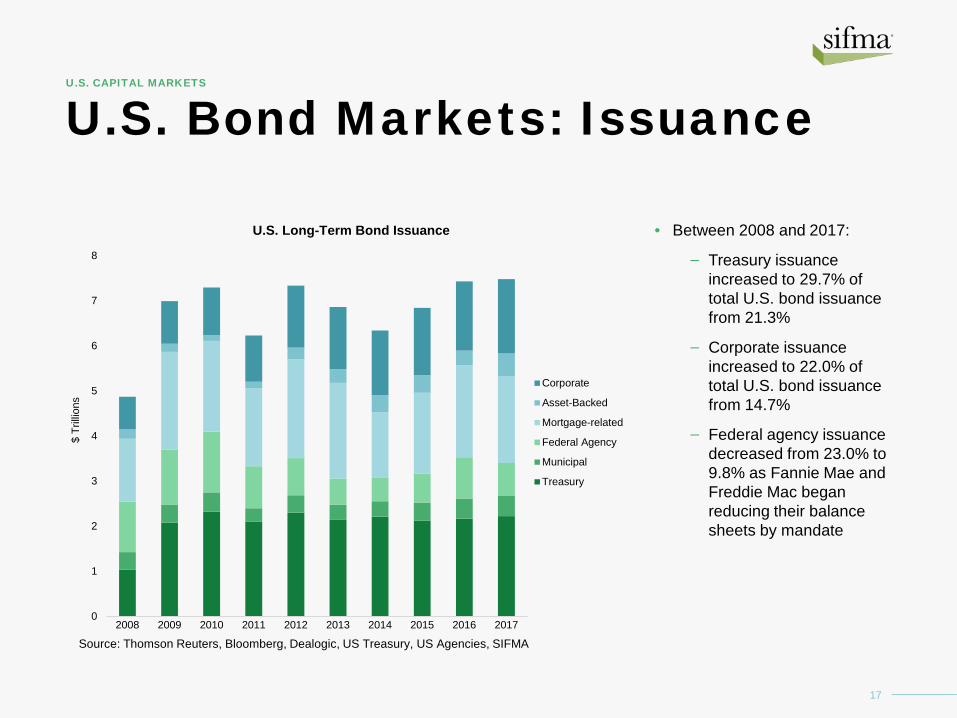
U.S. Bond Markets: Issuance
• Between 2008 and 2017:
– Treasury issuance increased to 29.7% of total U.S. bond issuance from 21.3%
– Corporate issuance increased to 22.0% of total U.S. bond issuance from 14.7%
– Federal agency issuance decreased from 23.0% to 9.8% as Fannie Mae and Freddie Mac began reducing their balance sheets by mandate
17
U.S. CAPITAL MARKETS
0
1
2
3
4
5
6
7
8
2008 2009 2010 2011 2012 2013 2014 2015 2016 2017
$ Tr
illion
s
U.S. Long-Term Bond Issuance
Corporate
Asset-Backed
Mortgage-related
Federal Agency
Municipal
Treasury
Source: Thomson Reuters, Bloomberg, Dealogic, US Treasury, US Agencies, SIFMA
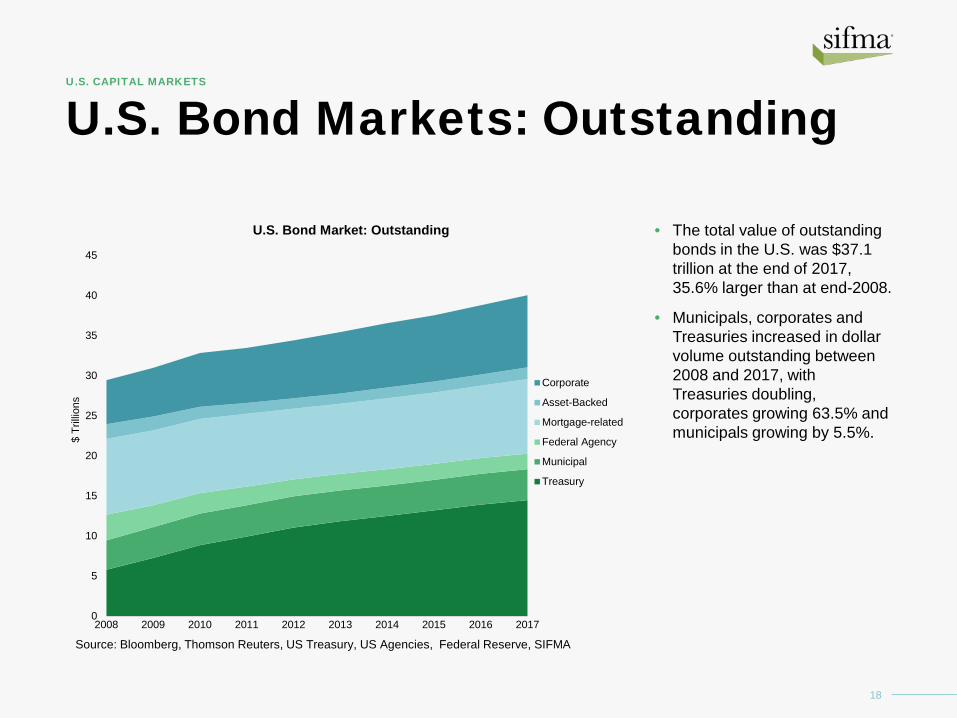
U.S. Bond Markets: Outstanding
• The total value of outstanding bonds in the U.S. was $37.1 trillion at the end of 2017, 35.6% larger than at end-2008.
• Municipals, corporates and Treasuries increased in dollar volume outstanding between 2008 and 2017, with Treasuries doubling, corporates growing 63.5% and municipals growing by 5.5%.
18
U.S. CAPITAL MARKETS
0
5
10
15
20
25
30
35
40
45
2008 2009 2010 2011 2012 2013 2014 2015 2016 2017
$ Tr
illion
s
U.S. Bond Market: Outstanding
Corporate
Asset-Backed
Mortgage-related
Federal Agency
Municipal
Treasury
Source: Bloomberg, Thomson Reuters, US Treasury, US Agencies, Federal Reserve, SIFMA
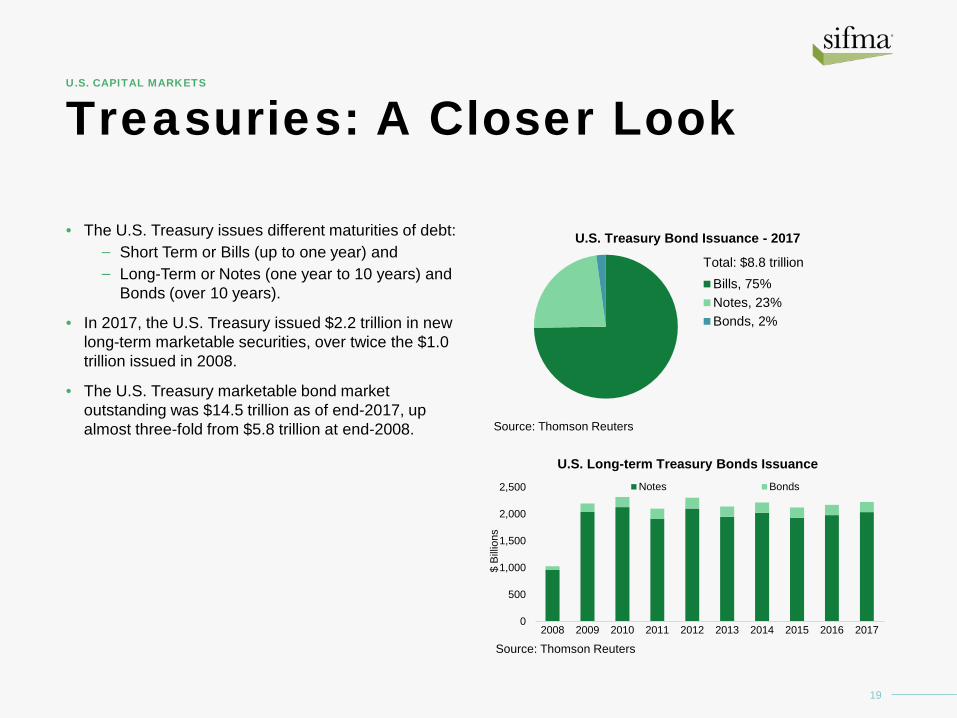
Treasuries: A Closer Look
• The U.S. Treasury issues different maturities of debt: – Short Term or Bills (up to one year) and – Long-Term or Notes (one year to 10 years) and
Bonds (over 10 years).
• In 2017, the U.S. Treasury issued $2.2 trillion in new long-term marketable securities, over twice the $1.0 trillion issued in 2008.
• The U.S. Treasury marketable bond market outstanding was $14.5 trillion as of end-2017, up almost three-fold from $5.8 trillion at end-2008.
19
U.S. CAPITAL MARKETS
U.S. Treasury Bond Issuance - 2017
Bills, 75%Notes, 23%Bonds, 2%
Source: Thomson Reuters
Total: $8.8 trillion
0
500
1,000
1,500
2,000
2,500
2008 2009 2010 2011 2012 2013 2014 2015 2016 2017
$ Bi
llions
U.S. Long-term Treasury Bonds IssuanceNotes Bonds
Source: Thomson Reuters
Municipals: A Closer Look
20
U.S. CAPITAL MARKETS
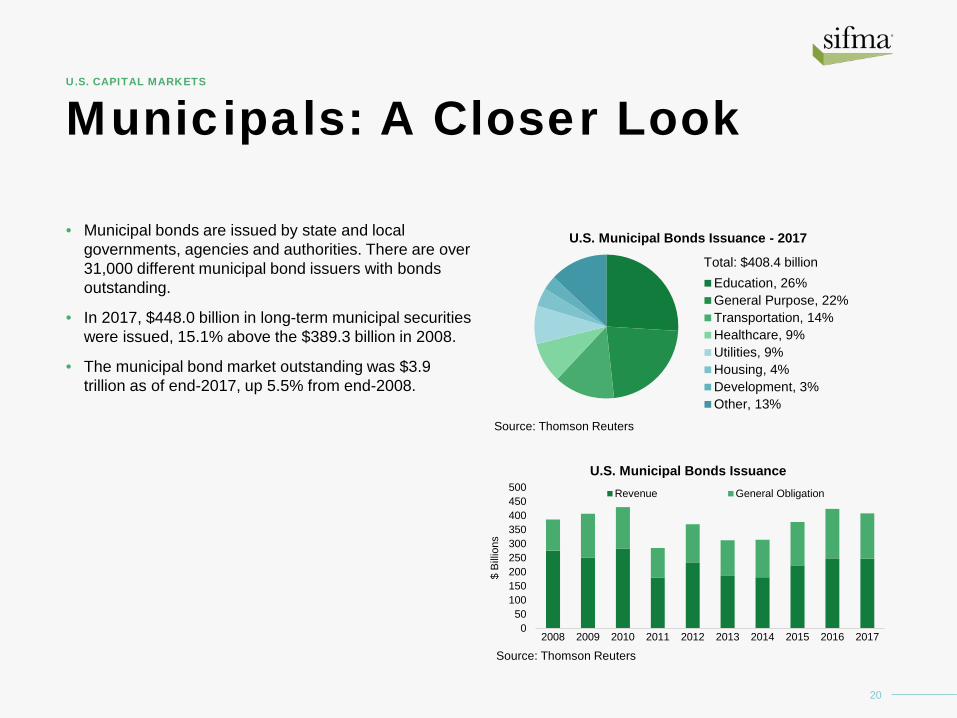
• Municipal bonds are issued by state and local governments, agencies and authorities. There are over 31,000 different municipal bond issuers with bonds outstanding.
• In 2017, $448.0 billion in long-term municipal securities were issued, 15.1% above the $389.3 billion in 2008.
• The municipal bond market outstanding was $3.9 trillion as of end-2017, up 5.5% from end-2008.
050
100150200250300350400450500
2008 2009 2010 2011 2012 2013 2014 2015 2016 2017
$ Bi
llions
U.S. Municipal Bonds IssuanceRevenue General Obligation
Source: Thomson Reuters
U.S. Municipal Bonds Issuance - 2017
Education, 26%General Purpose, 22%Transportation, 14%Healthcare, 9%Utilities, 9%Housing, 4%Development, 3%Other, 13%
Source: Thomson Reuters
Total: $408.4 billion
Corporates: A Closer Look
21
U.S. CAPITAL MARKETS
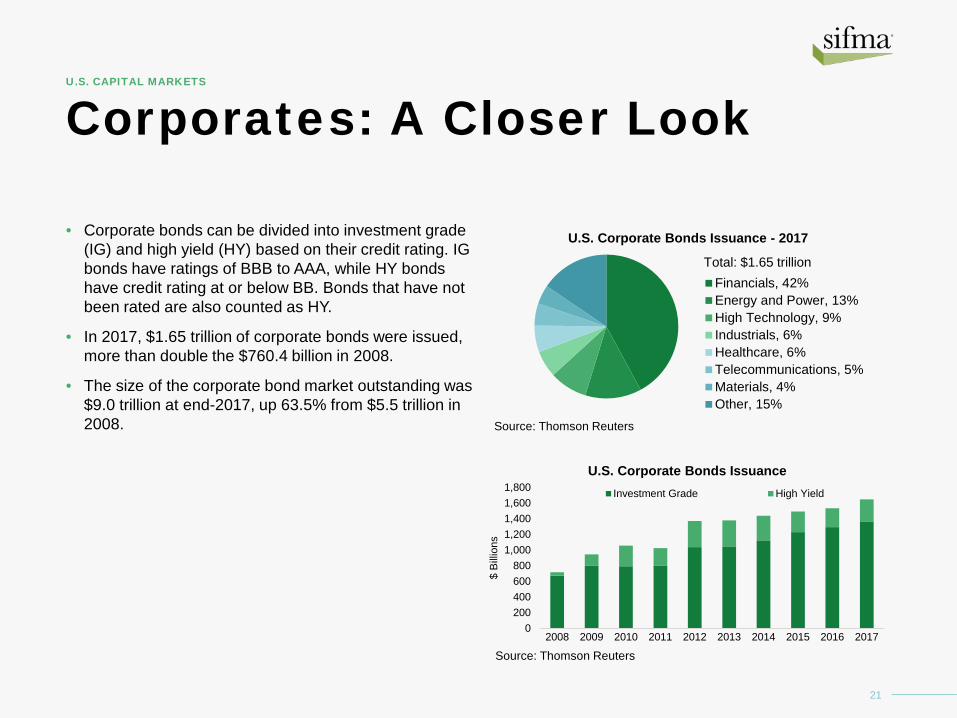
• Corporate bonds can be divided into investment grade (IG) and high yield (HY) based on their credit rating. IG bonds have ratings of BBB to AAA, while HY bonds have credit rating at or below BB. Bonds that have not been rated are also counted as HY.
• In 2017, $1.65 trillion of corporate bonds were issued, more than double the $760.4 billion in 2008.
• The size of the corporate bond market outstanding was $9.0 trillion at end-2017, up 63.5% from $5.5 trillion in 2008.
0200400600800
1,0001,2001,4001,6001,800
2008 2009 2010 2011 2012 2013 2014 2015 2016 2017
$ Bi
llions
U.S. Corporate Bonds IssuanceInvestment Grade High Yield
Source: Thomson Reuters
U.S. Corporate Bonds Issuance - 2017
Financials, 42%Energy and Power, 13%High Technology, 9%Industrials, 6%Healthcare, 6%Telecommunications, 5%Materials, 4%Other, 15%
Source: Thomson Reuters
Total: $1.65 trillion

Mortgage-Related: A Closer Look
22
U.S. CAPITAL MARKETS
• The mortgage-related securities market is comprised of:
– Agency mortgage-backed securities (MBS) and collateralized mortgage obligations (CMOs)
– Non-agency commercial residential mortgage-backed securities (CMBS) and residential mortgage-backed securities (RMBS).
• In 2017, mortgage-related securities issuance totaled $1.9 trillion, 38.5% higher than the $1.4 trillion in 2008.
• The mortgage-related market had $9.3 trillion outstanding at end-2017, down 1.7% from $9.5 trillion in 2008.
0
500
1,000
1,500
2,000
2,500
2008 2009 2010 2011 2012 2013 2014 2015 2016 2017
$ Bi
llions
U.S. Mortgage-Related IssuanceAgency Non-Agency
Sources: US Federal Agencies, Bloomberg, Dealogic, Thomson Reuters
U.S. Mortgage-Related Issuance - 2017
Agency MBS, 72%Agency CMO, 16%Non-Agency RMBS, 7%Non-Agency CMBS, 5%
Sources: US Federal Agencies, Bloomberg, Dealogic, Thomson Reuters
Total: $1.93 trillion
Asset-Backed: A Closer Look
23
U.S. CAPITAL MARKETS
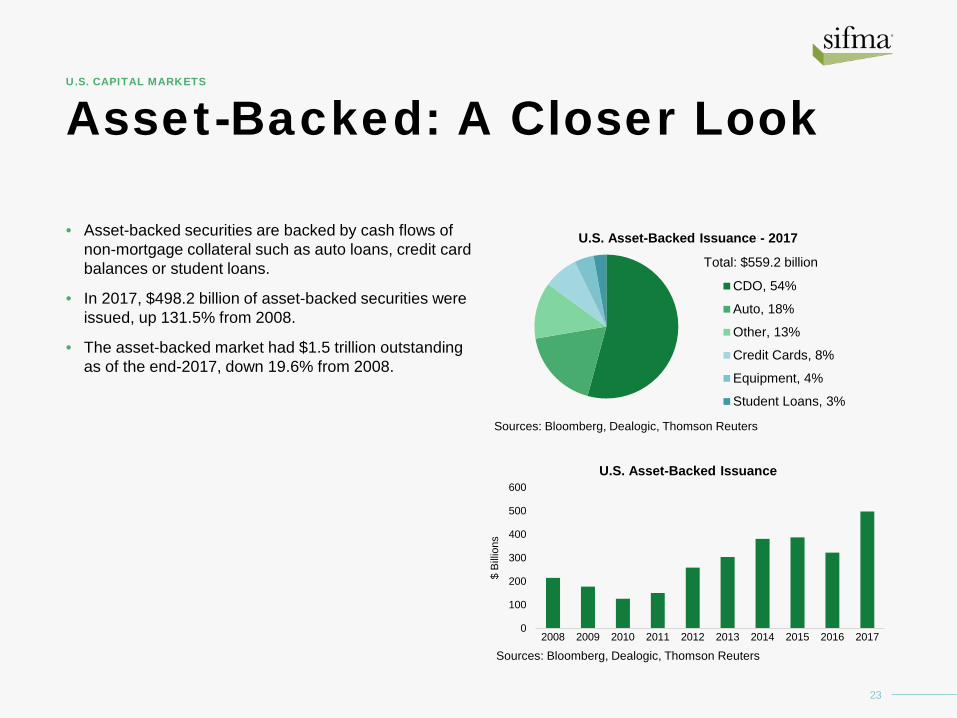
• Asset-backed securities are backed by cash flows of non-mortgage collateral such as auto loans, credit card balances or student loans.
• In 2017, $498.2 billion of asset-backed securities were issued, up 131.5% from 2008.
• The asset-backed market had $1.5 trillion outstanding as of the end-2017, down 19.6% from 2008.
0
100
200
300
400
500
600
2008 2009 2010 2011 2012 2013 2014 2015 2016 2017
$ Bi
llions
U.S. Asset-Backed Issuance
Sources: Bloomberg, Dealogic, Thomson Reuters
U.S. Asset-Backed Issuance - 2017
CDO, 54%
Auto, 18%
Other, 13%
Credit Cards, 8%
Equipment, 4%
Student Loans, 3%
Sources: Bloomberg, Dealogic, Thomson Reuters
Total: $559.2 billion
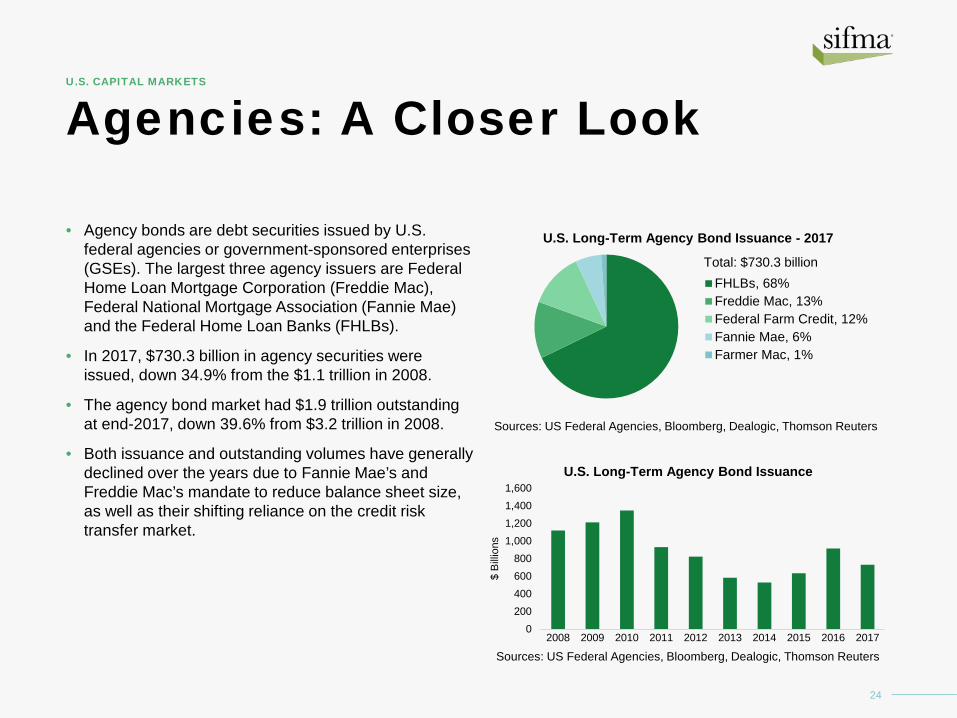
Agencies: A Closer Look
24
U.S. CAPITAL MARKETS
• Agency bonds are debt securities issued by U.S. federal agencies or government-sponsored enterprises (GSEs). The largest three agency issuers are Federal Home Loan Mortgage Corporation (Freddie Mac), Federal National Mortgage Association (Fannie Mae) and the Federal Home Loan Banks (FHLBs).
• In 2017, $730.3 billion in agency securities were issued, down 34.9% from the $1.1 trillion in 2008.
• The agency bond market had $1.9 trillion outstanding at end-2017, down 39.6% from $3.2 trillion in 2008.
• Both issuance and outstanding volumes have generally declined over the years due to Fannie Mae’s and Freddie Mac’s mandate to reduce balance sheet size, as well as their shifting reliance on the credit risk transfer market.
0200400600800
1,0001,2001,4001,600
2008 2009 2010 2011 2012 2013 2014 2015 2016 2017
$ Bi
llions
U.S. Long-Term Agency Bond Issuance
Sources: US Federal Agencies, Bloomberg, Dealogic, Thomson Reuters
U.S. Long-Term Agency Bond Issuance - 2017
FHLBs, 68%Freddie Mac, 13%Federal Farm Credit, 12%Fannie Mae, 6%Farmer Mac, 1%
Sources: US Federal Agencies, Bloomberg, Dealogic, Thomson Reuters
Total: $730.3 billion

25
EquitiesA Closer Look

Equities: A Closer Look
26
U.S. CAPITAL MARKETS
• Most of the equity issued in the U.S. is in the form of common stock, which represents ownership in a corporation, with the balance issued in preferred stock, which combines features of debt and equity. Common stock can be divided further into Initial Public Offerings (IPOs) – the first sale of stock to the public and secondary offerings – every subsequent stock issuance.
• In 2017, stock offerings raised $220.1 billion, down 14.1% from $256.3 billion in 2008.
• As of end-2017, U.S. domestic equity market capitalization stood at $32.1 trillion, almost triple the $11.6 trillion in 2008.
U.S. Equity Market Issuance - 2017
Follow-ons, 70%Initial Public Offerings, 18%Preferred Stock, 12%
Source: Dealogic
Total: $220.1 billion
0
50
100
150
200
250
300
350
2008 2009 2010 2011 2012 2013 2014 2015 2016 2017
$ Bi
llions
U.S. Equity Market IssuanceFollow-ons Initial Public Offerings Preferred Stock
Source: DealogicNote: Excludes BDCs, SPACs, closed-end funds, and rights offers
IPOs: A Closer Look
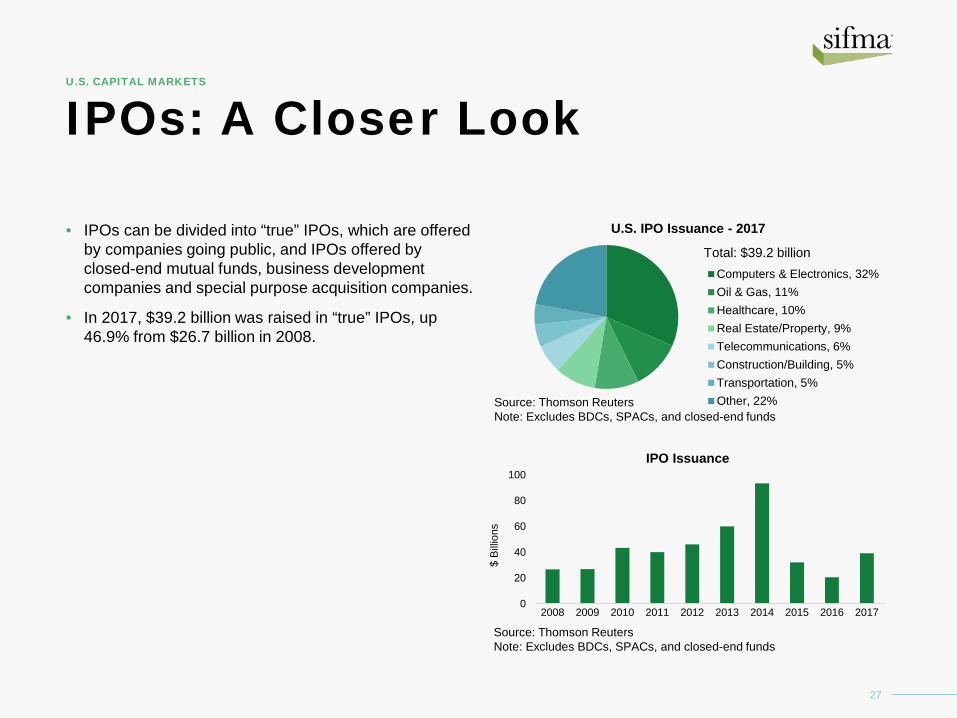
• IPOs can be divided into “true” IPOs, which are offered by companies going public, and IPOs offered by closed-end mutual funds, business development companies and special purpose acquisition companies.
• In 2017, $39.2 billion was raised in “true” IPOs, up 46.9% from $26.7 billion in 2008.
27
U.S. CAPITAL MARKETS
U.S. IPO Issuance - 2017
Computers & Electronics, 32%Oil & Gas, 11%Healthcare, 10%Real Estate/Property, 9%Telecommunications, 6%Construction/Building, 5%Transportation, 5%Other, 22%Source: Thomson Reuters
Note: Excludes BDCs, SPACs, and closed-end funds
Total: $39.2 billion
0
20
40
60
80
100
2008 2009 2010 2011 2012 2013 2014 2015 2016 2017
$ Bi
llions
IPO Issuance
Source: Thomson ReutersNote: Excludes BDCs, SPACs, and closed-end funds
IPOs: A Closer Look
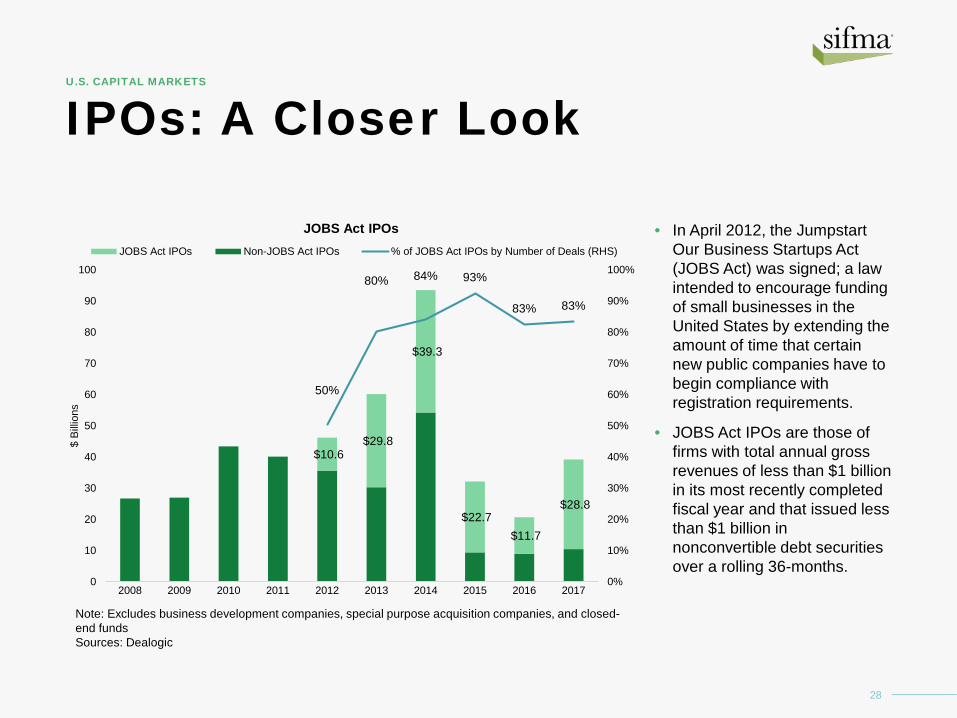
• In April 2012, the Jumpstart Our Business Startups Act (JOBS Act) was signed; a law intended to encourage funding of small businesses in the United States by extending the amount of time that certain new public companies have to begin compliance with registration requirements.
• JOBS Act IPOs are those of firms with total annual gross revenues of less than $1 billion in its most recently completed fiscal year and that issued less than $1 billion in nonconvertible debt securities over a rolling 36-months.
28
U.S. CAPITAL MARKETS
$10.6 $29.8
$39.3
$22.7 $11.7
$28.8
50%
80% 84% 93%
83% 83%
0%
10%
20%
30%
40%
50%
60%
70%
80%
90%
100%
0
10
20
30
40
50
60
70
80
90
100
2008 2009 2010 2011 2012 2013 2014 2015 2016 2017
$ Bi
llions
JOBS Act IPOsJOBS Act IPOs Non-JOBS Act IPOs % of JOBS Act IPOs by Number of Deals (RHS)
Note: Excludes business development companies, special purpose acquisition companies, and closed-end fundsSources: Dealogic
Publicly Traded Companies
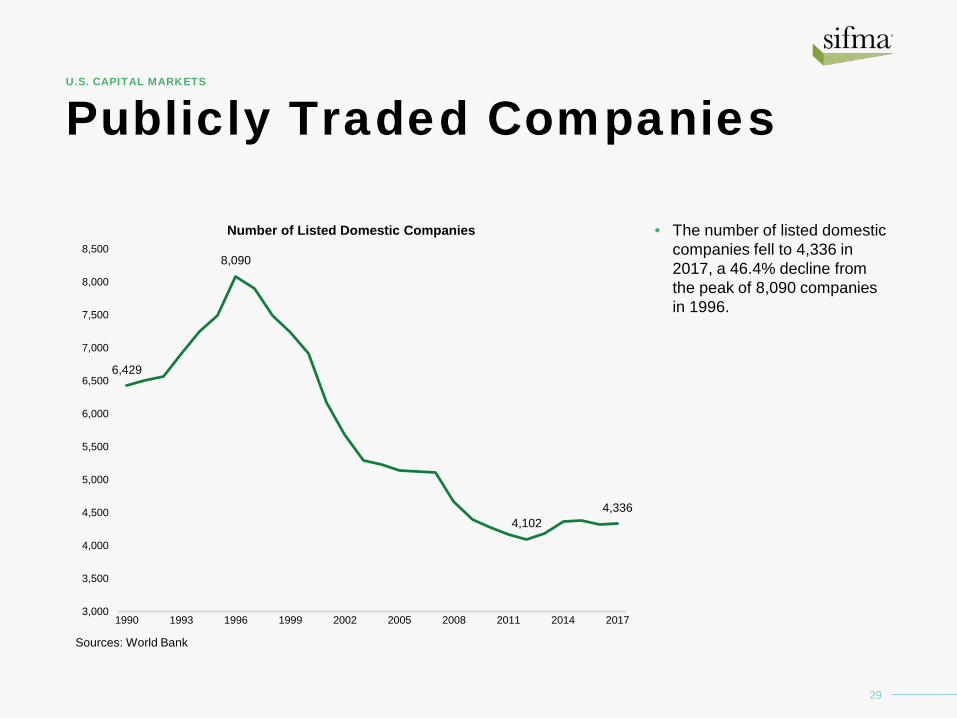
• The number of listed domestic companies fell to 4,336 in 2017, a 46.4% decline from the peak of 8,090 companies in 1996.
29
U.S. CAPITAL MARKETS
6,429
8,090
4,102 4,336
3,000
3,500
4,000
4,500
5,000
5,500
6,000
6,500
7,000
7,500
8,000
8,500
1990 1993 1996 1999 2002 2005 2008 2011 2014 2017
Number of Listed Domestic Companies
Sources: World Bank

The report is subject to the Terms of Use applicable to SIFMA's website, available here: http://www.sifma.org/legal/
SIFMA is the leading trade association for broker-dealers, investment banks and asset managers operating in the U.S. and global capital markets. On behalf of our industry’s nearly 1 million employees, we advocate on legislation, regulation and business policy, affecting retail and institutional investors, equity and fixed income markets and related products and services. We serve as an industry coordinating body to promote fair and orderly markets, informed regulatory compliance, and efficient market operations and resiliency. We also provide a forum for industry policy and professional development. SIFMA, with offices in New York and Washington, D.C., is the U.S. regional member of the Global Financial Markets Association (GFMA). For more information, visit http://www.sifma.org.
TO VIEW MORE STATISTICS AND REPORTS FROM SIFMA RESEARCH, VISIT HTTP://WWW.SIFMA.ORG/RESEARCH.