Embed Size (px)
Citation preview

Introduction
2021 Capital Markets Fact Book Page | 1
2021 Capital Markets Fact Book
July 2021

Introduction
2021 Capital Markets Fact Book Page | 2
Contents Introduction ................................................................................................................................................................................................. 6 Capital Markets Fuel Economies ................................................................................................................................................................ 6 US Capital Markets Are the Largest in the World ....................................................................................................................................... 7 Highlights .................................................................................................................................................................................................... 8 US Capital Markets .................................................................................................................................................................................... 8 Global Capital Markets ............................................................................................................................................................................... 8 Investor Participation .................................................................................................................................................................................. 8 Savings & Investment ................................................................................................................................................................................. 9 US Securities Industry ................................................................................................................................................................................ 9 US Capital Markets .................................................................................................................................................................................. 10 US Fixed Income Securities Issuance - Value .......................................................................................................................................... 10 US Fixed Income Securities Issuance – Number of Issues ...................................................................................................................... 11 US Equity Issuance – Value ..................................................................................................................................................................... 12 US Equity Issuance – Number of Issues .................................................................................................................................................. 13 US Corporate Bonds and Equity Issuance and Initial Public Offerings – Charts ...................................................................................... 14 US Private Placements – Value ............................................................................................................................................................... 15 US Private Placements – Number of Issues ............................................................................................................................................. 16 US Long-Term Municipal Bond Issuance – Value .................................................................................................................................... 17 US Long-Term Municipal Bond Issuance – Number of Issues ................................................................................................................. 18 US Long-Term Municipal Bond Issuance – Number of Issuers ................................................................................................................ 19 Bank Qualified US Municipal Bond Issuance ........................................................................................................................................... 20 US Equity and Debt Outstanding .............................................................................................................................................................. 21 US Stock Market Capitalization ................................................................................................................................................................ 22 US Stock Market Indices .......................................................................................................................................................................... 23 US Interest Rates and Bond Yields .......................................................................................................................................................... 24 US Mergers and Acquisitions – Announced and Completed .................................................................................................................... 25 US Fixed Income Securities Average Daily Trading Volume .................................................................................................................... 26 Municipal Bond Average Daily Trading – Dollar Volume .......................................................................................................................... 27 Municipal Bond Average Daily Trading – Number of Trades .................................................................................................................... 28 US Equity Markets Average Daily Trading Volume – Charts .................................................................................................................... 29 Trading Activity of NYSE- and Nasdaq-listed Stocks ............................................................................................................................... 30 Futures Contracts Traded on US Exchanges ........................................................................................................................................... 31 Options Contracts Traded on US Exchanges ........................................................................................................................................... 32 US Mutual Fund Assets ............................................................................................................................................................................ 33

Introduction
2021 Capital Markets Fact Book Page | 3
US Mutual Fund Net New Cash Flow ....................................................................................................................................................... 34 Net Assets and Number of Exchange-Traded Funds (ETFs) - Chart ....................................................................................................... 35 Global Capital Markets ............................................................................................................................................................................. 36 Global Bond and Equity Issuance - Charts ............................................................................................................................................... 36 Global Long-Term Bond Issuance ............................................................................................................................................................ 37 Global Equity Issuance ............................................................................................................................................................................. 38 International Security Offerings by All Issuers - Market Value .................................................................................................................. 39 International Security Offerings by All Issuers - Number of Issues ........................................................................................................... 40 International Security Offerings by US Issuers - Market Value ................................................................................................................. 41 International Security Offerings by US Issuers - Number of Issues .......................................................................................................... 42 Global Bond Market Outstanding and Global Equity Market Capitalization - Charts ................................................................................ 43 Global Bond Market Outstanding - Value ................................................................................................................................................. 44 Global Bond Market Outstanding - Share of Total .................................................................................................................................... 45 Global Equity Markets Capitalization - Market Value ................................................................................................................................ 46 Global Equity Markets Capitalization - Share of Total .............................................................................................................................. 47 Global Derivatives Market Outstanding - Notional Principal ..................................................................................................................... 48 Global Investment Banking Net Revenues by Product - Charts ............................................................................................................... 49 Global Investment Banking Net Revenues by Region .............................................................................................................................. 50 Global Mergers and Acquisitions – Announced and Completed ............................................................................................................... 51 US Holdings of Foreign Securities ............................................................................................................................................................ 52 US Gross Activity in Foreign Securities .................................................................................................................................................... 53 US Net Purchases of Foreign Securities .................................................................................................................................................. 54 US Gross Activity in Foreign Equities by Region/Country ........................................................................................................................ 55 US Net Purchases of Foreign Equities by Region/Country....................................................................................................................... 56 Foreign Holdings of US Securities ............................................................................................................................................................ 57 Foreign Gross Activity in US Securities .................................................................................................................................................... 58 Foreign Net Purchases of US Securities .................................................................................................................................................. 59 Foreign Gross Activity in US Equities by Region/Country ........................................................................................................................ 60 Foreign Net Purchases of US Equities by Region/Country....................................................................................................................... 61 Major Global Stock Market Indexes .......................................................................................................................................................... 62 Foreign Exchange Rates .......................................................................................................................................................................... 63 American Depositary Receipts (ADRs) .................................................................................................................................................... 64 US Investor Participation .......................................................................................................................................................................... 65 US Holdings of Equities – Market Value ................................................................................................................................................... 65 US Family Holdings of Stock .................................................................................................................................................................... 66 US Household Equity Ownership ............................................................................................................................................................. 67 US Household Liquid Financial Assets - Market Value ............................................................................................................................ 68

Introduction
2021 Capital Markets Fact Book Page | 4
US Household Liquid Financial Assets - Share of Total ........................................................................................................................... 69 US Holdings of Equities by Type of Holder - Market Value ...................................................................................................................... 70 US Holdings of Equities by Type of Holder - Share of Total ..................................................................................................................... 71 US Net Acquisitions of Corporate Equities by Type of Holder .................................................................................................................. 72 Savings & Investment ............................................................................................................................................................................... 73 US Retirement Assets .............................................................................................................................................................................. 73 US Private Pension Funds Assets ............................................................................................................................................................ 74 US Private Pension Fund Assets Investment Mix .................................................................................................................................... 75 US Defined Benefit Plan Asset Investment Mix ........................................................................................................................................ 76 US Defined Contribution Plan Asset Investment Mix ................................................................................................................................ 77 US Individual Retirement Account (IRA) Assets ....................................................................................................................................... 78 US Individual Retirement Account (IRA) Assets ....................................................................................................................................... 79 Household Saving Rates of Major Nations ............................................................................................................................................... 80 US Economic Indicators ........................................................................................................................................................................... 81 US Federal Receipts, Outlays, Deficit and Debt ....................................................................................................................................... 82 Securities Industry .................................................................................................................................................................................... 83 FINRA-Registered Broker-Dealers Financial Results ............................................................................................................................... 83 FINRA-Registered Firms and Registered Representative - Charts .......................................................................................................... 84 NYSE Member Firms Aggregate Financial Results .................................................................................................................................. 85 NYSE Member Firms Aggregate Total Capital and Equity Capital - Charts ............................................................................................. 86 US Securities Industry Employment ......................................................................................................................................................... 87 US Investment Banking Net Revenues by Product - Charts..................................................................................................................... 88 FINRA-Registered Broker-Dealers by State - Map ................................................................................................................................... 89 FINRA-Registered Representatives by State - Map ................................................................................................................................. 90 SEC- and State-Registered Investment Advisors by State - Map ............................................................................................................. 91 Authors ..................................................................................................................................................................................................... 92

Introduction
2021 Capital Markets Fact Book Page | 5
SIFMA is the leading trade association for broker-dealers, investment banks and asset managers operating in the U.S. and global capital markets. On behalf of our industry’s nearly 1 million employees, we advocate on legislation, regulation and business policy, affecting retail and institutional investors, equity and fixed income markets and related products and services. We serve as an industry coordinating body to promote fair and orderly markets, informed regulatory compliance, and efficient market operations and resiliency. We also provide a forum for industry policy and professional development. SIFMA, with offices in New York and Washington, D.C., is the U.S. regional member of the Global Financial Markets Association (GFMA). For more information, visit http://www.sifma.org.
This report is subject to the Terms of Use applicable to SIFMA’s website, available at http://www.sifma.org/legal. Copyright © 2021
Associated Reports
Please also see the SIFMA Research databases and other publications at: https://www.sifma.org/ research
SIFMA Insights Primers: The SIFMA Insights primer series is a reference tool that goes beyond a typical 101 series. By illustrating important technical and regulatory nuances, SIFMA Insights primers provide a fundamental understanding of the marketplace and set the scene to address complex issues arising in today’s markets. The SIFMA Insights market structure primer series includes: global capital markets & financial institutions; U.S. fixed income markets; U.S. equity markets; U.S. multi-listed options markets; U.S. ETF markets; and U.S. capital formation and listings exchanges. The primers and other Insights reports can be found at: https://www.sifma.org/primers

Introduction
2021 Capital Markets Fact Book Page | 6
Introduction Capital markets recognize and drive capital to the best ideas and enterprises. Coupled with the free flow of capital, innovation is an integral component to a country for supporting job creation, economic development, and prosperity. Markets facilitate the transfer of funds from those who seek a return on their assets to those who need capital and credit to expand.
Clients benefiting from healthy capital markets include not just individual investors but also institutional investors, governments, and corporations. Capital, raised through equity and debt, can be used to grow businesses, finance investments in new plant, equipment and technology and fund infrastructure projects. This creates jobs and flows money into the economy. Additionally, individuals and businesses can invest in securities to generate wealth.
Capital Markets Fuel Economies In the U.S., capital markets provided 73% of funding for economic activity, in terms of equity and debt financing of non-financial corporations. Capital markets enable debt issuance, which is a more efficient, stable, and less restrictive form of borrowing for corporations. The use of debt capital markets to fuel economic growth is more prevalent in the U.S, at 80% of the total, whereas bank lending is more dominant in other regions, around 20% on average.
On the equities side, companies need capital for various business purposes – to invest in growth, fund mergers and acquisitions, etc. – and firms have several ways they can generate capital, including issuing IPOs. IPOs allow businesses to grow, innovate and better serve their customers.
In short, U.S. capital markets are the bedrock of our nation’s economy.
Source: OECD, Federal Reserve, ECB, Bank of Japan, National Bureau of Statistics of China Note: As of 2020, China 2017; Euro Area = 19 EU-member states using the Euro; other financing (ex-China) = insurance reserves, trade credits and trade advances; other financing (China) = other, direct investments; economic activity defined as financing of non-financial corporations; EU = 27 EU-member states; DCM = debt capital markets = corporate bonds only
65.5%54.6% 55.8% 53.6%
7.7%
7.4%
4.2% 8.1%4.7%
2.0%
11.1%28.2% 21.5% 26.0%
87.8%
16.0% 13.1% 14.5% 15.6%2.4%
0%
10%
20%
30%
40%
50%
60%
70%
80%
90%
100%
US Euro Area UK Japan China
Financing of Non-Financial CorporationsEquity Bonds Loans Other
79.8%
24.7% 27.5% 20.8%2.3%
20.2%
75.3% 72.5% 79.2%97.7%
0%
10%
20%
30%
40%
50%
60%
70%
80%
90%
100%
US EU UK Japan China
Debt Financing of Non-Financial CorporationsDCM Loans

Introduction
2021 Capital Markets Fact Book Page | 7
US Capital Markets Are the Largest in the World The U.S. capital markets are largest in the world and continue to be among the deepest, most liquid, and most efficient.
Equities: U.S. equity markets represent 38.5% of the $105.8 trillion in global equity market cap, or $40.7 trillion; this is 3.7x the next largest market, the EU.
Source: World Federation of Exchanges, SIFMA estimates Note: For listed domestic companies; EM = emerging markets, DM = developed markets
Fixed Income: U.S. fixed income markets comprise 38.3% of the $123.5 trillion securities outstanding across the globe, or $47.2 trillion; this is 1.9x the next largest market, the EU.
Source: Bank for International Settlements, SIFMA estimates Note: EM = emerging markets, DM = developed markets
US38.5%
EU2710.5%UK
3.8%
Japan6.3%
Other DM
19.8%
EM21.1%
Global Equity Market Cap 2020 - $105.8 Trillion
US38.3%
EU2720.4%UK
5.8%
Japan11.9%
Other DM
7.2%
EM16.5%
Global Bond Market Outstanding2020 - $123.5 Trillion

Highlights
2021 Capital Markets Fact Book Page | 8
Highlights
US Capital Markets In 2020, U.S. long-term fixed income issuance reached $12.2 trillion, a 48.1% increase from the previous year. Mortgage-backed securities issuance increased by 96.2% to $4.0 trillion, followed by corporate bonds (+60.4% to $2.3 trillion) and Treasury securities (+32.7% to $3.9 trillion). U.S. long-term municipal bond issuance increased 13.6% to $484.5 billion, while federal agency securities increased 26.5% to $1.3 trillion. Asset-backed securities issuance volume fell 30.0% to $304.3 billion.
Equity issuance, including common and preferred shares, totaled $390.0 billion in 2020, a 71.0% increase year-over-year. Initial public offering (IPO) volume, excluding closed-end funds, was $85.3 billion, up 74.7% from the previous year. Follow-on, or secondary, issuance totaled $258.5 billion, up 77.8% from last year. U.S. merger and acquisition announced deals totaled $1.5 trillion in 2020, a 17.2% decrease from last year, while the value of completed M&A deals decreased by 15.5% to $1.5 trillion.
The U.S. stock markets recorded increases in 2020: the Dow Jones Industrial Average (DJIA) rose by 7.2%, ending the year at 30,606.48; the S&P 500 Index was up 16.3% to close 2020 at 3,756.07; the Nasdaq Composite Index increased by 43.6% to 12,888.28; and the Russell 2000 Index gained 18.4% to end 2020 at 1,974.86. In 2020, the average daily trading volume for equities was 10.9 billion shares, up 55.4% year-over-year.
Global Capital Markets Global bond markets outstanding value increased by 16.5% to $123.5 trillion in 2020, while global long-term bond issuance increased by 19.9% to $27.3 trillion.
Global equity market capitalization increased by 18.2% year-over-year to $105.8 trillion in 2020, while global equity issuance decreased by 52.9% to $826.8 billion.
U.S. gross activity (purchases and sales) in foreign securities increased to $46.1 trillion in 2020, up 24.7% from 2019. Foreign gross activity in U.S. securities increased by 19.6% to $98.3 trillion in 2020.
Investor Participation Federal Reserve Board data showed the value of U.S households’ liquid assets increased by 16.7% to $58.5 trillion in 2020 from $50.2 trillion in 2019. Of total liquid assets held by U.S. households, 44.2% was in equities, 23.4% in bank depos-its and CDs and 19.2% in mutual funds, with the remaining 13.2% split between U.S. Treasury securities; agency & GSE securities; municipal bonds; money market funds; and corporate bonds.

Highlights
2021 Capital Markets Fact Book Page | 9
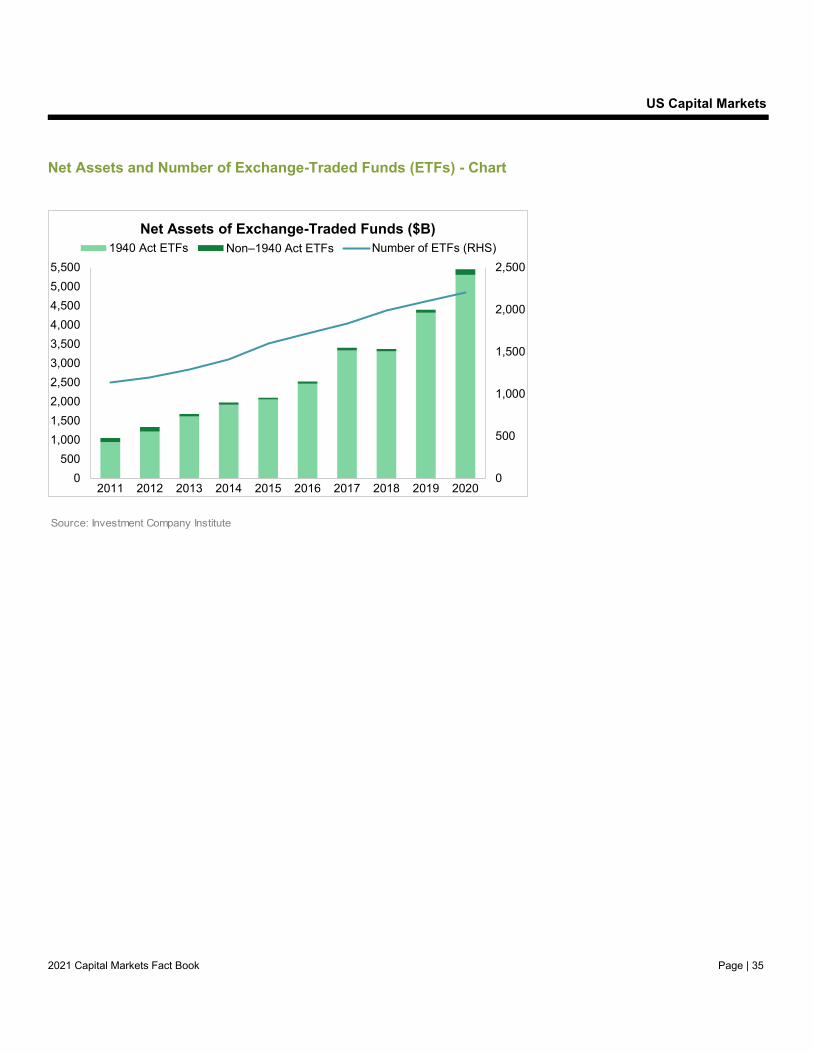
Savings & Investment Total value of U.S. retirement assets increased by 8.1% to $41.8 trillion in 2020, according to Federal Reserve Flow of Funds accounts. Total pension assets rose 76.3% to $29.6 trillion while assets held in individual retirement accounts increased by 12.5% to $12.2 trillion.
US Securities Industry The number of FINRA-registered broker-dealers decreased by 2.3% to 3,435 in 2020.
Pre-tax net income (profits) for FINRA-registered broker-dealers rose to $77.2 billion in 2020, up 75.7% from $43.9 billion in 2019. Gross revenues totaled $362.0 billion in 2020, down 6.7% from the previous year, while total expenses declined by 17.3% to $284.8 billion.
National securities industry employment, as reported by the U.S. Department of Labor, reached 975,600 jobs in 2020, an increase of 0.9% from 967,300 year-over-year.

US Capital Markets
2021 Capital Markets Fact Book Page | 10
US Capital Markets US Fixed Income Securities Issuance - Value
Municipal Treasury MBSCorporate
Bonds
Federal Agency
Securities ABSTotal Fixed
Income2006 387.9 788.5 2,691.1 1,126.0 691.8 658.2 6,343.52007 429.2 752.2 2,434.2 1,222.7 831.2 795.9 6,465.42008 389.3 1,029.4 1,394.0 757.5 924.8 215.2 4,710.22009 409.6 2,197.2 2,172.1 979.5 1,244.4 177.9 7,180.82010 433.3 2,319.8 2,012.6 1,087.7 1,362.1 125.9 7,341.52011 295.1 2,103.3 1,724.8 1,045.9 1,025.3 151.0 6,345.42012 382.7 2,304.6 2,195.1 1,397.6 925.5 259.0 7,464.52013 335.4 2,140.0 2,120.2 1,428.3 652.9 304.1 6,980.92014 339.1 2,215.2 1,439.6 1,486.2 558.7 393.4 6,432.32015 405.1 2,122.4 1,800.7 1,515.3 645.5 333.4 6,822.42016 451.9 2,169.4 2,044.2 1,554.9 927.9 325.4 7,473.82017 449.0 2,224.3 1,934.8 1,680.3 731.3 550.3 7,570.12018 346.8 2,684.7 1,874.6 1,380.7 653.6 516.9 7,457.32019 426.4 2,935.5 2,036.8 1,423.0 989.3 434.7 8,245.72020 484.5 3,895.8 3,996.5 2,282.0 1,251.3 304.3 12,214.5
Average 397.7 2,125.5 2,124.7 1,357.9 894.4 369.7 7,269.9Y/Y % Change 13.6% 32.7% 96.2% 60.4% 26.5% -30.0% 48.1%5-Year CAGR 3.6% 12.9% 17.3% 8.5% 14.2% -1.8% 12.4%10-Year CAGR 1.1% 5.3% 7.1% 7.7% -0.8% 9.2% 5.2%
Note: MBS = mortgage-backed securities, ABS = asset-backed securities. Includes long-term securities only. Corporate debt includes public and private, convertible and non-convertible, investment grade and high yield bonds.
$ Billions
Sources: Bloomberg, Refinitiv, Treasury, US Agencies

US Capital Markets
2021 Capital Markets Fact Book Page | 11
US Fixed Income Securities Issuance – Number of Issues
Municipal Treasury MBSCorporate
Bonds
Federal Agency
Securities ABS2006 12,671 n/a n/a 2,510 n/a 1,0982007 12,591 n/a n/a 2,238 n/a 1,4482008 10,781 n/a n/a 1,126 n/a 3132009 11,691 n/a n/a 1,441 n/a 2892010 13,805 n/a n/a 1,701 n/a 3182011 10,585 n/a n/a 1,477 n/a 3132012 13,151 n/a n/a 1,934 n/a 5032013 11,505 n/a n/a 1,855 n/a 6262014 11,144 n/a n/a 1,686 n/a 7382015 13,302 n/a n/a 1,406 n/a 7332016 13,556 n/a n/a 1,518 n/a 7402017 12,061 n/a n/a 1,771 n/a 1,1662018 9,612 n/a n/a 1,370 n/a 7112019 11,603 n/a n/a 1,407 n/a 4,5482020 13,312 n/a n/a 2,097 n/a 2,988
Average 12,091 n/a n/a 1,702 n/a 1,102Y/Y % Change 14.7% n/a n/a 49.0% n/a -34.3%5-Year CAGR 0.0% n/a n/a 8.3% n/a 32.5%10-Year CAGR -0.4% n/a n/a 2.1% n/a 25.1%
Note: MBS = mortgage-backed securities, ABS = asset-backed securities. Includes long-term securities only. Corporate debt includes public and private, convertible and non-convertible, investment grade and high yield bonds.
Sources: Bloomberg, Refinitiv
Number of Issues

US Capital Markets
2021 Capital Markets Fact Book Page | 12
US Equity Issuance – Value
IPOs Follow-Ons
Total Common
StockPreferred
Stock Total Equity2006 46.4 106.9 153.3 40.9 194.22007 52.3 111.7 164.0 62.9 226.92008 26.7 174.9 201.6 54.7 256.42009 27.0 230.8 257.9 7.0 264.92010 43.5 169.5 213.0 6.2 219.22011 40.1 139.3 179.4 5.5 184.92012 46.2 183.7 230.0 34.6 264.62013 60.0 194.8 254.8 30.2 285.02014 93.5 171.9 265.4 38.5 304.02015 32.2 184.5 216.7 32.1 248.82016 20.7 157.3 178.0 25.0 203.02017 39.2 155.0 194.2 26.1 220.32018 49.9 154.6 204.5 17.2 221.62019 48.8 145.3 194.1 34.0 228.12020 85.3 258.5 343.7 46.3 390.0
Average 47.5 169.3 216.7 30.7 247.5Y/Y % Change 74.7% 77.8% 77.0% 36.2% 71.0%5-Year CAGR 21.5% 7.0% 9.7% 7.6% 9.4%10-Year CAGR 7.0% 4.3% 4.9% 22.2% 5.9%
Note: Includes rank eligible deals, excludes BDCs, SPACs, ETFs, CLEFs and rights offers.
$ Billions
Source: Dealogic
US Capital Markets
2021 Capital Markets Fact Book Page | 13
US Equity Issuance – Number of Issues
IPOs Follow-Ons
Total Common
StockPreferred
Stock Total Equity2006 206 517 723 93 7782007 215 465 680 90 8162008 33 267 300 43 7702009 63 653 716 14 3432010 158 600 758 23 7302011 124 502 626 37 7792012 131 575 706 118 6632013 215 782 997 103 8242014 275 724 999 77 1,1002015 153 701 854 47 1,0762016 98 617 715 78 9012017 154 728 882 91 7922018 185 685 870 46 9752019 151 653 804 82 9162020 209 864 1,073 83 886
Average 158 622 780 68 823Y/Y % Change 38.4% 32.3% 33.5% 1.2% -3.3%5-Year CAGR 6.4% 4.3% 4.7% 12.0% -3.8%10-Year CAGR 2.8% 3.7% 3.5% 13.7% 2.0%
Note: Includes rank eligible deals, excludes BDCs, SPACs, ETFs, CLEFs and rights offers.
Number of Deals
Source: Dealogic

US Capital Markets
2021 Capital Markets Fact Book Page | 14
US Corporate Bonds and Equity Issuance and Initial Public Offerings – Charts
1.2
1.7 1.7 1.8 1.8 1.81.9
1.6 1.7
2.7
0.0
0.5
1.0
1.5
2.0
2.5
3.0
2011 2012 2013 2014 2015 2016 2017 2018 2019 2020
Corporate Bonds and Equity Issuance in the U.S. ($T)Corporate Bonds Equity
40.146.2
60.0
93.5
32.2
20.7
39.2
49.9 48.8
85.3
0
20
40
60
80
100
2011 2012 2013 2014 2015 2016 2017 2018 2019 2020
Initial Public Offerings in the U.S. ($B)
Source: Bloomberg, Dealogic, RefinitivNote: Corporate capital includes underw ritten, privately placed, and medium-term notes; U.S. IPOsinclude rank eligible deals, exclude BDCs, SPACs, ETFs, CLEFs and rights offers.

US Capital Markets
2021 Capital Markets Fact Book Page | 15
US Private Placements – Value
Debt Equity Total2006 413.9 17.0 430.92007 491.4 33.6 525.12008 112.0 53.1 165.12009 157.9 8.2 166.02010 140.2 27.2 167.32011 114.4 25.5 139.92012 135.0 13.4 148.52013 132.2 45.4 177.62014 130.9 7.8 138.72015 130.8 12.0 142.72016 133.1 19.2 152.32017 221.1 14.2 235.22018 213.1 12.3 225.42019 282.7 20.3 303.02020 314.4 15.8 330.1
Average 208.2 21.7 229.9Y/Y % Change 11.2% -22.4% 9.0%5-Year CAGR 19.2% 5.6% 18.3%10-Year CAGR 8.4% -5.3% 7.0%
$ Billions
Source: RefinitivNote: Includes private placements in the U.S. from all issuers.

US Capital Markets
2021 Capital Markets Fact Book Page | 16
US Private Placements – Number of Issues
Debt Equity Total2006 2,108 726 2,8282007 1,659 968 2,6192008 473 855 1,3242009 495 523 1,0152010 535 650 1,1812011 482 546 1,0232012 498 347 8362013 549 206 7442014 491 126 6132015 481 192 6672016 462 248 7062017 601 102 6942018 580 42 6142019 651 57 7052020 647 54 694
Average 714 376 1,084Y/Y % Change -0.6% -5.3% -1.6%5-Year CAGR 6.1% -22.4% 0.8%10-Year CAGR 1.9% -22.0% -5.2%
Number of Deals
Source: RefinitivNote: Includes private placements in the U.S. from all issuers.

US Capital Markets
2021 Capital Markets Fact Book Page | 17
US Long-Term Municipal Bond Issuance – Value
Revenue Competitive
Revenue Negotiated
Total Revenue
General Obligation
Competitive
General Obligation Negotiated
Total General
ObligationPrivate
PlacementsTotal
Municipal2006 20.8 245.6 266.5 48.5 67.0 115.6 5.8 387.92007 21.7 270.7 292.4 51.0 80.8 131.8 5.0 429.22008 15.5 260.5 276.0 37.8 72.4 110.2 3.2 389.32009 11.8 239.3 251.1 46.1 108.7 154.8 3.7 409.62010 24.2 254.2 278.4 49.0 98.0 146.9 7.9 433.32011 18.7 161.4 180.1 40.8 64.2 105.1 9.9 295.12012 26.4 208.1 234.6 47.7 87.5 135.3 12.8 382.72013 18.1 170.1 188.2 51.3 73.3 124.6 22.7 335.42014 20.5 161.3 181.8 51.4 81.5 132.9 24.5 339.12015 23.3 200.2 223.5 64.0 89.9 153.8 27.8 405.12016 29.4 219.0 248.4 69.3 106.1 175.5 28.1 451.92017 29.4 218.3 247.6 68.9 91.9 160.8 40.6 449.02018 23.9 175.5 199.4 58.1 62.9 120.9 26.5 346.82019 27.2 218.9 246.0 72.0 88.7 160.7 19.6 426.42020 24.9 236.5 261.3 68.1 121.9 190.0 33.2 484.5
Average 22.4 216.0 238.4 54.9 86.3 141.3 18.1 397.7Y/Y % Change -8.5% 8.1% 6.2% -5.4% 37.4% 18.2% 69.2% 13.6%5-Year CAGR 1.3% 3.4% 3.2% 1.3% 6.3% 4.3% 3.6% 3.6%10-Year CAGR 0.3% -0.7% -0.6% 3.3% 2.2% 2.6% 15.4% 1.1%
Source: Refinitiv
$ Billion
Note: Includes securities issued by a state, territory, municipality, county, or certain non-profit organizations; excludes securities w ith maturities under 13 months.

US Capital Markets
2021 Capital Markets Fact Book Page | 18
US Long-Term Municipal Bond Issuance – Number of Issues
Revenue Competitive
Revenue Negotiated
Total Revenue
General Obligation
Competitive
General Obligation Negotiated
Total General
ObligationPrivate
PlacementsTotal
Municipal2006 663 5,221 5,884 3,124 3,363 6,487 300 12,6712007 622 5,339 5,961 2,983 3,242 6,225 405 12,5912008 482 4,240 4,722 2,870 2,825 5,695 364 10,7812009 515 3,727 4,242 3,125 3,992 7,117 332 11,6912010 791 4,434 5,225 3,437 4,770 8,207 373 13,8052011 552 3,009 3,561 2,943 3,667 6,610 414 10,5852012 760 3,542 4,302 3,530 4,731 8,261 588 13,1512013 548 3,012 3,560 3,274 3,741 7,015 930 11,5052014 559 2,820 3,379 3,260 3,528 6,788 977 11,1442015 662 3,575 4,237 3,779 4,064 7,843 1,222 13,3022016 790 3,647 4,437 3,847 3,987 7,834 1,285 13,5562017 549 3,350 3,899 3,468 3,220 6,688 1,474 12,0612018 515 2,759 3,274 3,202 2,073 5,275 1,063 9,6122019 609 3,334 3,943 3,488 3,177 6,665 995 11,6032020 601 3,520 4,121 3,761 3,970 7,731 1,460 13,312
Average 615 3,702 4,316 3,339 3,623 6,963 812 12,091Y/Y % Change -1.3% 5.6% 4.5% 7.8% 25.0% 16.0% 46.7% 14.7%5-Year CAGR -1.9% -0.3% -0.6% -0.1% -0.5% -0.3% 3.6% 0.0%10-Year CAGR -2.7% -2.3% -2.3% 0.9% -1.8% -0.6% 14.6% -0.4%
Number of Deals
Source: RefinitivNote: Includes securities issued by a state, territory, municipality, county, or certain non-profit organizations; excludes securities w ith maturities under 13 months.

US Capital Markets
2021 Capital Markets Fact Book Page | 19
US Long-Term Municipal Bond Issuance – Number of Issuers
Total IssuesUnique Issuers
Unique Issuer as %
of Total Issues
2006 12,671 8,069 63.7%2007 12,591 7,921 62.9%2008 10,781 6,849 63.5%2009 11,691 7,358 62.9%2010 13,805 8,234 59.6%2011 10,585 7,143 67.5%2012 13,151 8,838 67.2%2013 11,505 7,663 66.6%2014 11,144 7,396 66.4%2015 13,302 8,583 64.5%2016 13,556 8,889 65.6%2017 12,061 7,574 62.8%2018 9,612 6,301 65.6%2019 11,603 7,420 63.9%2020 13,313 8,366 62.8%
Average 12,091 7,774 64.4%Y/Y % Change 14.7% 12.7% -1.7%5-Year CAGR 0.0% -0.5% -0.5%10-Year CAGR -0.4% 0.2% 0.5%
Note: Includes securities issued by a state, territory, municipality, county, or certain non-profit organizations; excludes securities w ith maturities under 13 months.
Source: Refinitiv
Number

US Capital Markets
2021 Capital Markets Fact Book Page | 20
Bank Qualified US Municipal Bond Issuance
# DealsIssuance
($ Millions)
Average Deal Size
($ Millions)2006 4,706 17,317.4 3.72007 4,469 16,233.0 3.62008 4,169 15,267.6 3.72009 5,992 33,028.6 5.52010 6,713 36,794.5 5.52011 5,157 18,836.9 3.72012 6,353 25,122.9 4.02013 5,248 20,252.9 3.92014 4,943 20,020.2 4.12015 5,422 22,670.7 4.22016 5,358 22,838.8 4.32017 4,217 17,662.0 4.22018 3,071 11,970.4 3.92019 3,702 14,901.2 4.02020 4,162 16,504.6 4.0
Average 4,912 20,628.1 4.1Y/Y % Change 12.4% 10.8% -1.5%5-Year CAGR -5.2% -6.2% -1.1%10-Year CAGR -4.7% -7.7% -3.2%
Note: "Bank qualif ied" municipal bonds are defined as short-term and long-term municipal bonds under the Tax Reform Act of 1986 (265b) w here, w hen purchased by a commercial bank for its portfolio, the bank may deduct a portion of interest cost of carry for the position.
Source: Refinitiv

US Capital Markets
2021 Capital Markets Fact Book Page | 21
US Equity and Debt Outstanding
ABSCorporate
BondsCorporate Equities
Federal Agencies Securities
Money Markets MBS Municipal Treasury
2006 1,656.9 4,889.5 24,833.3 2,631.7 1,958.4 8,389.9 3,285.2 4,322.92007 1,963.5 5,328.8 26,199.5 2,905.9 1,788.9 9,386.0 3,550.5 4,516.72008 1,829.5 5,514.8 16,263.5 3,208.5 1,599.8 9,467.4 3,666.7 5,774.22009 1,712.1 6,099.2 20,649.0 2,726.3 1,138.0 9,352.5 3,851.0 7,260.62010 1,507.8 6,738.1 24,077.2 2,537.5 1,057.6 9,258.4 3,968.3 8,853.02011 1,359.0 6,850.2 23,333.6 2,326.9 969.3 9,075.5 3,931.2 9,928.42012 1,280.3 7,285.8 26,833.5 2,095.8 952.3 8,838.1 3,932.8 11,046.12013 1,285.7 7,687.8 34,445.8 2,058.3 951.6 8,742.6 3,868.1 11,854.42014 1,349.4 8,048.6 38,096.4 2,028.7 930.4 8,842.0 3,824.3 12,504.82015 1,376.6 8,277.7 37,211.1 1,995.4 941.5 8,894.8 3,840.4 13,191.62016 1,391.8 8,684.4 40,168.0 1,971.7 884.9 9,023.4 3,887.5 13,908.22017 1,457.9 9,008.9 47,919.8 1,934.7 965.9 9,304.5 3,901.8 14,468.82018 1,615.6 9,237.2 43,715.3 1,841.6 996.0 9,732.3 3,844.5 15,608.02019 1,663.2 9,579.9 54,624.9 1,726.2 1,045.2 10,227.6 3,864.7 16,673.32020 1,535.8 10,562.7 65,207.7 1,693.6 986.9 11,214.0 3,949.9 20,973.1
Average 1,532.3 7,586.2 34,905.2 2,245.5 1,144.5 9,316.6 3,811.1 11,392.3Y/Y % Change -7.7% 10.3% 19.4% -1.9% -5.6% 9.6% 2.2% 25.8%5-Year CAGR 2.2% 5.0% 11.9% -3.2% 0.9% 4.7% 0.6% 9.7%10-Year CAGR 0.2% 4.6% 10.5% -4.0% -0.7% 1.9% 0.0% 9.0%
Note: Corporate equities include both listed on exchanges and closely held common and preferred shares issued by domestic corporations and U.S. purchases of shares issued by foreign corporations; MBS = mortgage-backed securities include GNMA, FNMA, and FHLMC MBS and CMOs and private-label MBS/CMOs; Treasury securities include only interest bearing marketable public debt.
Sources: Bloomberg, Federal Agencies, Refinitiv, SIFMA, The Federal Reserve, U.S. Department of Treasury
$ Billions

US Capital Markets
2021 Capital Markets Fact Book Page | 22
US Stock Market Capitalization
NYSE Nasdaq Total2006 15,421.2 3,865.0 19,286.22007 15,650.8 4,013.7 19,664.52008 9,208.9 2,249.0 11,457.92009 11,837.8 3,239.5 15,077.32010 13,394.1 3,889.4 17,283.52011 11,795.6 3,845.1 15,640.72012 14,085.9 4,582.4 18,668.32013 17,949.9 6,085.0 24,034.92014 19,351.4 6,979.2 26,330.62015 17,786.8 7,280.8 25,067.52016 19,573.1 7,779.1 27,352.22017 22,081.4 10,039.3 32,120.72018 20,679.5 9,756.8 30,436.32019 20,888.8 13,002.0 33,890.82020 21,659.3 19,060.4 40,719.7
Average 16,757.6 7,044.4 23,802.1Y/Y % Change 3.7% 46.6% 20.1%5-Year CAGR 4.0% 21.2% 10.2%10-Year CAGR 4.9% 17.2% 8.9%
Source: World Federation of ExchangesNote: Includes market capitalization of domestic companies only.
$ Billions

US Capital Markets
2021 Capital Markets Fact Book Page | 23
US Stock Market Indices
Dow Jones Industrial Average S&P 500
Nasdaq Composite Russell 2000
2006 12,463.15 1,418.30 2,415.29 787.682007 13,264.82 1,468.36 2,652.28 766.042008 8,776.39 903.25 1,577.03 499.452009 10,428.05 1,115.10 2,269.15 625.392010 11,577.51 1,257.64 2,652.87 783.652011 12,217.56 1,257.61 2,605.15 740.922012 13,104.14 1,426.19 3,019.51 849.352013 16,576.66 1,848.36 4,176.59 1,163.642014 17,823.07 2,058.90 4,736.05 1,204.702015 17,425.03 2,043.94 5,007.41 1,135.892016 19,762.60 2,238.83 5,383.12 1,357.132017 24,719.22 2,673.61 6,903.39 1,535.512018 23,327.46 2,506.85 6,635.28 1,348.562019 28,538.44 3,230.78 8,972.60 1,668.472020 30,606.48 3,756.07 12,888.28 1,974.86
Average 17,374.0 1,946.9 4,792.9 1,096.1Y/Y % Change 7.2% 16.3% 43.6% 18.4%5-Year CAGR 11.9% 12.9% 20.8% 11.7%10-Year CAGR 10.2% 11.6% 17.1% 9.7%
Value (At Year-End)
Source: Bloomberg

US Capital Markets
2021 Capital Markets Fact Book Page | 24
US Interest Rates and Bond Yields
3-Month T-Bills
2-Year Treasury
Bonds
10-Year Treasury
Bonds
30-Year Treasury
Bonds
Aaa Corporates (Moody's)
Baa Corporates (Moody's)
20-Year High Grade Municipal
Bonds (S&P)
Bank Prime Rate
Effective Federal Funds Rate
2006 4.85% 4.82% 4.80% 4.91% 5.59% 6.48% 4.42% 7.96% 4.96%2007 4.48% 4.36% 4.63% 4.84% 5.56% 6.48% 4.42% 8.05% 5.03%2008 1.40% 2.01% 3.66% 4.28% 5.63% 7.44% 4.80% 5.07% 1.94%2009 0.15% 0.96% 3.26% 4.08% 5.31% 7.29% 4.64% 3.25% 0.16%2010 0.14% 0.70% 3.22% 4.25% 4.94% 6.04% 4.16% 3.25% 0.18%2011 0.05% 0.45% 2.78% 3.91% 4.64% 5.66% 4.29% 3.25% 0.10%2012 0.09% 0.28% 1.80% 2.92% 3.67% 4.94% 3.25% 3.25% 0.14%2013 0.06% 0.31% 2.35% 3.45% 4.23% 5.10% 3.96% 3.25% 0.11%2014 0.03% 0.46% 2.54% 3.34% 4.16% 4.85% 3.78% 3.25% 0.09%2015 0.05% 0.69% 2.14% 2.84% 3.89% 5.00% 3.48% 3.26% 0.13%2016 0.32% 0.83% 1.84% 2.59% 3.66% 4.71% 3.07% 3.51% 0.39%2017 0.95% 1.40% 2.33% 2.89% 3.74% 4.44% 3.36% 4.10% 1.00%2018 1.97% 2.53% 2.91% 3.11% 3.93% 4.80% 3.53% 4.90% 1.83%2019 2.11% 1.97% 2.14% 2.58% 3.39% 4.37% 3.38% 5.29% 2.16%2020 0.36% 0.39% 0.89% 1.56% 2.48% 3.60% 2.41% 3.53% 0.36%
Average 1.13% 1.48% 2.75% 3.44% 4.32% 5.41% 3.80% 4.34% 1.24%Y/Y % Change -82.9% -80.3% -58.5% -39.7% -26.9% -17.6% -28.8% -33.2% -83.2%5-Year CAGR 47.0% -10.8% -16.1% -11.3% -8.6% -6.3% -7.1% 1.6% 22.0%10-Year CAGR 10.0% -5.8% -12.1% -9.6% -6.7% -5.0% -5.3% 0.8% 7.4%
Source: Federal Reserve Board, St. Louis Federal Reserve Bank, S&P Dow Jones Indices
Annual Average %

US Capital Markets
2021 Capital Markets Fact Book Page | 25
US Mergers and Acquisitions – Announced and Completed
Value ($ Billions) # of Deals
Value ($ Billions) # of Deals
2006 1,539.6 10,354 2006 1,424.8 10,3832007 1,562.2 10,887 2007 1,785.2 10,8862008 1,021.2 8,987 2008 1,145.8 9,2332009 802.6 7,497 2009 793.9 7,3862010 900.3 10,229 2010 822.8 10,2372011 998.9 10,714 2011 992.9 10,6932012 976.7 12,465 2012 1,041.1 12,3482013 1,123.7 10,356 2013 1,028.4 10,4122014 1,509.2 10,944 2014 1,249.2 10,7782015 2,073.2 10,702 2015 1,763.3 10,6402016 1,734.0 9,771 2016 1,697.1 9,8982017 1,401.7 10,425 2017 1,624.4 10,5412018 1,770.6 8,553 2018 1,913.5 8,5082019 1,863.7 9,999 2019 1,761.8 10,0362020 1,542.3 8,318 2020 1,488.7 8,277
Average 1,388.0 10,013 Average 1,368.9 10,017Y/Y % Change -17.2% -16.8% Y/Y % Change -15.5% -17.5%5-Year CAGR -5.7% -4.9% 5-Year CAGR -3.3% -4.9%10-Year CAGR 5.5% -2.0% 10-Year CAGR 6.1% -2.1%
Source: Dealogic
Announced Completed

US Capital Markets
2021 Capital Markets Fact Book Page | 26
US Fixed Income Securities Average Daily Trading Volume
Municipal Treasury MBSCorporate
Bonds
Federal Agency
Securities ABS2006 23.1 524.4 254.6 16.9 - -2007 25.1 566.0 320.1 16.4 - -2008 19.4 553.3 344.9 14.3 - -2009 12.5 409.8 299.9 19.9 - -2010 13.3 523.8 320.6 20.5 11.5 -2011 11.3 571.0 247.7 20.6 9.9 1.52012 11.3 519.5 284.9 22.6 10.7 1.52013 11.2 546.5 226.9 24.7 7.3 1.32014 9.9 505.0 181.7 26.7 6.0 1.52015 8.6 490.0 196.1 27.9 5.2 1.42016 11.1 519.1 209.5 30.0 5.4 1.32017 10.8 505.2 211.6 30.9 4.2 1.42018 11.6 547.8 220.6 31.5 3.5 1.42019 11.5 593.6 250.4 34.3 4.2 1.52020 12.0 603.2 293.0 38.9 5.3 1.9
Average 13.5 531.9 257.5 25.1 6.7 1.5Y/Y % Change 4.2% 1.6% 17.0% 13.7% 28.3% 23.2%5-Year CAGR 6.8% 4.2% 8.4% 6.9% 0.3% 5.6%10-Year CAGR -1.1% 1.4% -0.9% 6.7% -7.4% N/A
Notes:MunicipalTreasuryMBS
ABS
CorporateFederal Agency Data sourced from FINRA TRACE Fact Book.
Figures include public and 144A trades. Data sourced from FINRA TRACE Fact Book.
$ Billions
Annual daily average f igures are sourced from daily reporting volumes and not from MSRB's Yearbook.Trading volumes are the U.S. primary dealer trading volumes.Starting in 2011, data includes non-ggency MBS trading f igures w hich include CMBS; daily f igures include 144A trades but do not include certain subcategories in w hich there are <5 trades per day. New issue transactions are sometimes included.ABS figures do not include CMBS, but do include CDO and Other trading volumes; daily f igures include 144A trades but do not include certain subcategories in w hich there are <5 trades per day. New issue
Source: Federal Reserve Bank of New York, Municipal Securities Rulemaking Board, FINRA TRACE

US Capital Markets
2021 Capital Markets Fact Book Page | 27
Municipal Bond Average Daily Trading – Dollar Volume
Retail Institutional Total2008 1,209.1 20,587.0 21,796.12009 1,107.2 13,937.9 15,045.12010 1,101.3 13,778.8 14,880.12011 1,084.6 11,953.7 13,038.32012 1,028.5 11,771.8 12,800.32013 1,119.6 11,260.6 12,380.22014 928.3 10,076.6 11,004.92015 979.2 8,616.8 9,596.02016 991.8 10,066.4 11,058.22017 1,047.3 9,712.5 10,759.82018 1,083.8 10,572.2 11,656.02019 893.6 10,602.6 11,496.22020 834.0 11,148.2 11,982.3
Average 1,031.4 11,852.7 12,884.1Y/Y % Change -6.7% 5.1% 4.2%5-Year CAGR -3.2% 5.3% 4.5%10-Year CAGR -2.7% -2.1% -2.1%
$ Millions
Source: Municipal Securities Rulemaking BoardNote: Institutional trades defined as trade sizes greater than $100,000.

US Capital Markets
2021 Capital Markets Fact Book Page | 28
Municipal Bond Average Daily Trading – Number of Trades
Retail Institutional Total2008 32,854 10,533 43,3872009 33,304 7,805 41,1092010 33,941 7,716 41,6572011 34,030 7,226 41,2562012 31,148 7,396 38,5442013 35,008 7,180 42,1882014 28,764 6,596 35,3602015 29,921 6,814 36,7352016 29,691 7,273 36,9642017 31,721 7,503 39,2242018 32,742 7,672 40,4142019 27,249 7,410 34,6592020 26,194 7,341 33,535
Average 31,274 7,574 38,849Y/Y % Change -3.9% -0.9% -3.2%5-Year CAGR -2.6% 1.5% -1.8%10-Year CAGR -2.6% -0.5% -2.1%
Number of Trades
Source: Municipal Securities Rulemaking BoardNote: Institutional trades defined as trade sizes greater than $100,000.

US Capital Markets
2021 Capital Markets Fact Book Page | 29
US Equity Markets Average Daily Trading Volume – Charts
253211 223
260 278 273 271
357322
479
0
100
200
300
400
500
600
2011 2012 2013 2014 2015 2016 2017 2018 2019 2020
U.S. Equity Markets ADV ($B)NYSE Nasdaq Regional
7.8
6.4 6.2 6.46.9
7.36.5
7.3 7.0
10.9
0
2
4
6
8
10
12
2011 2012 2013 2014 2015 2016 2017 2018 2019 2020
U.S. Equity Markets ADV (B of shares)NYSE Nasdaq Regional
Source: Cboe Exchange, Inc.

US Capital Markets
2021 Capital Markets Fact Book Page | 30
Trading Activity of NYSE- and Nasdaq-listed Stocks
Annual Share
Volume (Millions)
Annual Value
of Shares Traded
($ Billions)
Average Daily Share
Volume (Millions)
Average Daily Dollar
Volume ($ Billions)
Annual Share
Volume (Millions)
Annual Value
of Shares Traded
($ Billions)
Average Daily Share
Volume (Millions)
Average Daily Dollar
Volume ($ Billions)
2006 2006 502,486 11,676 2,001.9 46.52007 2007 537,263 15,116 2,132.0 60.02008 2008 580,909 15,105 2,296.1 59.72009 1,420,980 27,997.2 5,638.8 111.1 2009 563,398 10,512 2,235.7 41.72010 1,216,841 29,563.7 4,828.7 117.3 2010 552,466 12,811 2,192.3 50.82011 1,094,332 30,543.8 4,342.6 121.2 2011 509,523 13,920 2,021.9 55.22012 908,892 25,663.6 3,635.6 102.7 2012 437,352 13,373 1,749.4 53.52013 848,098 27,227.2 3,365.5 108.0 2013 444,114 14,223 1,762.4 56.42014 847,594 31,475.1 3,363.5 124.9 2014 492,188 17,852 1,953.1 70.82015 923,306 33,055.9 3,663.9 131.2 2015 477,058 19,010 1,893.1 75.42016 984,312 32,510.2 3,906.0 129.0 2016 480,484 18,015 1,906.7 71.52017 858,465 31,738.4 3,420.2 126.4 2017 481,993 20,935 1,920.3 83.42018 912,322 37,583.6 3,634.7 149.5 2018 565,173 30,407 2,251.7 121.12019 896,773 34,756.3 3,558.6 137.9 2019 541,092 27,375 2,147.2 108.62020 1,245,381 44,481 4,922.5 175.8 2020 1,015,287 50,345 4,013.0 199.0
Average 1,013,108 32,216.4 4,023.4 127.9 Average 545,386 19,378.2 2,165.1 76.9Y/Y % Change 38.9% 28.0% 38.3% 27.5% Y/Y % Change 87.6% 83.9% 86.9% 83.2%5-Year CAGR 6.2% 6.1% 6.1% 6.0% 5-Year CAGR 16.3% 21.5% 16.2% 21.4%10-Year CAGR 0.2% 4.2% 0.2% 4.1% 10-Year CAGR 6.3% 14.7% 6.2% 14.6%
Note: Trading activity of NYSE- and Nasdaq-listed stocks; NYSE data available from 2009.
NYSE-listed stocks Nasdaq-listed stocks
Source: Cboe Exchange, Inc., Nasdaq

US Capital Markets
2021 Capital Markets Fact Book Page | 31
Futures Contracts Traded on US Exchanges
Agriculture Currency EnergyEquityIndex
Individual Equity
Interest Rates
Precious Metals
Non-Precious Metals Other Total
2006 157.5 114.0 190.9 500.4 7.8 1,034.6 34.3 3.3 1.2 2,043.92007 193.3 143.0 240.9 676.9 7.9 1,333.1 44.1 3.8 1.5 2,644.62008 215.4 155.8 285.9 904.9 3.7 1,213.1 56.2 4.6 13.0 2,852.52009 196.6 156.3 313.1 744.7 2.7 854.6 48.8 6.4 4.8 2,328.12010 239.5 229.0 350.6 740.6 4.8 1,123.0 63.8 10.4 3.1 2,764.82011 265.9 231.6 374.1 813.9 3.6 1,277.6 76.3 12.6 1.0 3,056.52012 280.7 210.7 428.3 650.8 6.4 1,008.3 63.7 16.2 0.9 2,666.02013 264.5 208.9 627.4 663.0 6.7 1,202.0 68.6 17.2 0.9 3,059.32014 273.9 186.0 553.8 675.0 8.0 1,401.9 60.2 14.7 1.1 3,174.82015 315.8 212.0 619.7 667.3 8.8 1,312.5 61.3 17.3 1.5 3,216.32016 333.4 205.4 746.6 731.0 9.7 1,440.4 82.9 21.9 1.7 3,573.02017 342.0 220.0 778.8 639.6 12.2 1,524.8 103.8 27.4 2.7 3,651.42018 382.4 243.8 751.1 816.6 5.9 1,900.5 113.6 33.1 2.9 4,249.92019 383.1 211.9 694.9 822.0 6.3 1,911.5 124.6 24.4 2.7 4,181.32020 375.8 217.5 708.4 1,358.9 2.5 1,572.7 134.8 24.9 2.1 4,397.6
Average 281.3 196.4 511.0 760.4 6.5 1,340.7 75.8 15.9 2.7 3,190.7Y/Y % Change -1.9% 2.7% 1.9% 65.3% -60.3% -17.7% 8.2% 1.8% -23.0% 5.2%5-Year CAGR 3.5% 0.5% 2.7% 15.3% -22.4% 3.7% 17.1% 7.6% 6.7% 6.5%10-Year CAGR 4.6% -0.5% 7.3% 6.3% -6.4% 3.4% 7.8% 9.2% -3.9% 4.8%
Source: Futures Industry Association
Millions

US Capital Markets
2021 Capital Markets Fact Book Page | 32
Options Contracts Traded on US Exchanges
Agriculture Currency EnergyEquityIndex
Individual Equity
Interest Rates
Precious Metals
Non-Precious Metals Other Total
2006 35.3 3.5 54.5 338.0 1,717.7 374.2 5.6 0.1 0.6 2,529.42007 43.4 6.5 71.1 522.1 2,379.1 417.7 4.9 0.0 1.5 3,446.42008 56.7 11.2 79.1 336.7 3,284.8 326.4 6.1 0.0 0.5 4,101.52009 43.3 6.2 64.5 276.1 3,367.0 223.9 5.8 0.0 0.3 3,987.12010 56.0 11.9 71.3 328.3 3,610.4 268.7 9.4 0.0 0.3 4,356.52011 68.1 10.9 74.2 398.7 4,224.6 274.0 12.4 0.0 0.2 5,063.22012 70.6 11.0 84.3 381.6 3,681.8 227.8 11.5 0.0 0.2 4,468.92013 61.9 16.3 119.5 1,930.2 2,273.8 285.9 13.1 0.1 0.1 4,700.82014 69.0 18.8 104.6 2,054.2 2,342.9 364.9 10.8 0.0 0.1 4,965.52015 75.1 24.7 117.4 2,105.3 2,180.3 388.2 9.1 0.1 0.1 4,900.22016 76.0 23.5 126.3 2,251.0 1,975.5 454.3 11.7 0.1 0.1 4,918.62017 70.5 26.7 131.6 2,269.1 2,092.1 531.2 11.8 0.2 0.1 5,133.32018 79.2 27.8 117.0 2,781.9 2,565.7 607.7 14.4 0.4 0.1 6,194.12019 77.6 20.4 89.7 2,422.9 2,641.0 696.4 19.2 0.7 0.2 5,968.02020 75.6 21.3 108.9 3,212.1 4,438.3 459.6 17.5 0.4 0.0 8,333.7
Average 63.9 16.1 94.3 1,440.5 2,851.7 393.4 10.9 0.2 0.3 4,871.1Y/Y % Change -2.5% 4.3% 21.4% 32.6% 68.1% -34.0% -9.0% -38.3% -78.5% 39.6%5-Year CAGR 0.1% -2.9% -1.5% 8.8% 15.3% 3.4% 14.0% 30.5% -22.3% 11.2%10-Year CAGR 3.0% 6.0% 4.3% 25.6% 2.1% 5.5% 6.4% 37.6% -20.6% 6.7%
Source: Futures Industry Association
Millions

US Capital Markets
2021 Capital Markets Fact Book Page | 33
US Mutual Fund Assets
Equity Hybrid BondMoney Market Total
2006 5,831.6 731.5 1,493.7 2,338.5 10,395.22007 6,412.6 821.5 1,675.6 3,085.5 11,995.22008 3,654.6 562.3 1,569.7 3,832.2 9,618.72009 4,871.5 717.6 2,204.0 3,315.9 11,109.02010 5,596.2 842.2 2,589.2 2,803.5 11,831.12011 5,212.8 884.0 2,842.7 2,690.9 11,630.42012 5,938.8 1,032.5 3,389.2 2,693.2 13,053.62013 7,762.6 1,284.7 3,283.9 2,717.8 15,049.02014 8,314.0 1,379.2 3,458.8 2,724.6 15,876.62015 8,149.6 1,341.5 3,412.1 2,754.7 15,657.92016 8,577.3 1,399.9 3,648.2 2,728.1 16,353.52017 10,305.2 1,547.1 4,065.3 2,847.3 18,764.92018 9,227.5 1,384.0 4,061.0 3,037.0 17,709.52019 11,375.6 1,579.1 4,704.3 3,632.0 21,291.12020 12,728.4 1,620.0 5,214.1 4,333.3 23,895.8
Average 7,597.2 1,141.8 3,174.1 3,035.6 14,948.8Y/Y % Change 11.9% 2.6% 10.8% 19.3% 12.2%5-Year CAGR 9.3% 3.8% 8.9% 9.5% 8.8%10-Year CAGR 8.6% 6.8% 7.3% 4.5% 7.3%
$ Billions
Source: Investment Company InstituteNote: Data for funds that invest primarily in other mutual funds w ere excluded.

US Capital Markets
2021 Capital Markets Fact Book Page | 34
US Mutual Fund Net New Cash Flow
Equity Hybrid BondMoney Market Total
2006 147.2 19.9 59.7 245.2 472.02007 73.2 40.4 110.6 654.3 878.52008 -216.5 -25.5 31.2 637.7 426.92009 2.2 19.8 371.4 -539.2 -145.82010 -24.4 35.6 232.4 -525.1 -281.52011 -129.5 39.7 118.0 -124.1 -95.92012 -152.7 46.3 306.5 -0.2 199.92013 159.5 74.7 -71.2 15.1 178.12014 25.5 30.4 43.9 6.2 106.02015 -75.6 -19.0 -24.9 21.5 -98.02016 -258.0 -41.9 106.9 -30.2 -223.22017 -159.2 -28.5 259.7 106.9 178.92018 -256.8 -91.3 2.1 158.8 -187.22019 -362.2 -49.3 312.3 552.7 453.52020 -646.2 -84.0 244.4 690.8 205.0
Average -124.9 -2.2 140.2 124.7 137.8Y/Y % Change -78.4% -70.4% -21.7% 25.0% -54.8%
$ Billions
Source: Investment Company InstituteNote: Net new cash f low is the dollar value of new sales minus redemptions, combined w ith net exchanges. Data for funds that invest primarily in other mutual funds w ere excluded.
US Capital Markets
2021 Capital Markets Fact Book Page | 35
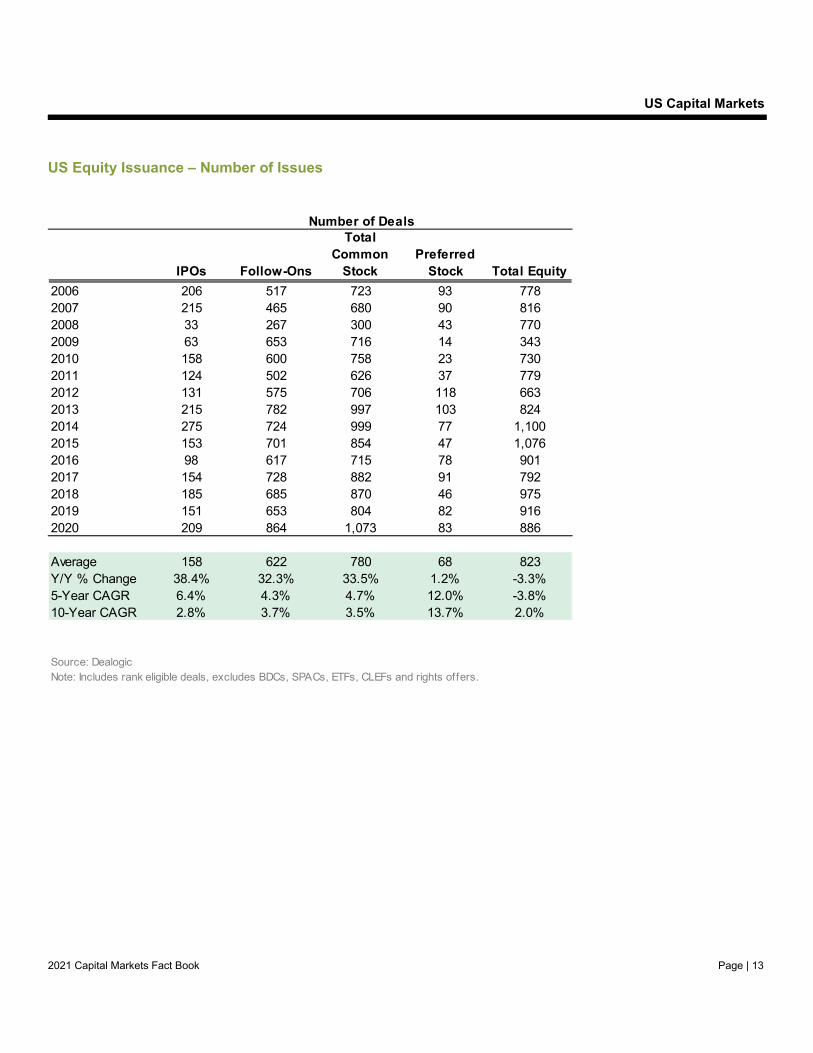
Net Assets and Number of Exchange-Traded Funds (ETFs) - Chart
0
500
1,000
1,500
2,000
2,500
0500
1,0001,5002,0002,5003,0003,5004,0004,5005,0005,500
2011 2012 2013 2014 2015 2016 2017 2018 2019 2020
Net Assets of Exchange-Traded Funds ($B)1940 Act ETFs Non–1940 Act ETFs Number of ETFs (RHS)
Source: Investment Company Institute

Global Capital Markets
2021 Capital Markets Fact Book Page | 36
Global Capital Markets Global Bond and Equity Issuance - Charts
18.2 19.017.3 18.0
20.1 20.518.7 18.1
22.8
27.3
0
5
10
15
20
25
30
2011 2012 2013 2014 2015 2016 2017 2018 2019 2020
Global Long-Term Bond Issuance ($T)
474531
649731 719
587671
545 541
827
0
100
200
300
400
500
600
700
800
900
1,000
2011 2012 2013 2014 2015 2016 2017 2018 2019 2020
Global Equity Issuance ($B)
Sources: Bloomberg, Refinitiv, DealogicNote: Long-term is defined as a security w ith maturity of 13 months or longer at issuance;global equity issuance includes non-convertible IPOs and follow -on equity deals, excludespreffered shares, rights issued, closed-end funds, business development companies, andspecial purpose acquisition companies.

Global Capital Markets
2021 Capital Markets Fact Book Page | 37
Global Long-Term Bond Issuance
Australia Canada China EU27 Hong Kong Japan SingaporeUnited
KingdomUnited States
Other Developed
MarketsEmerging Markets Total
2006 185.5 266.9 179.6 3,259.5 14.2 2,417.3 12.3 927.0 5,286.0 458.8 1,305.7 14,312.92007 165.1 316.1 788.0 3,409.2 13.2 2,592.0 28.5 1,047.7 5,449.4 415.8 1,462.4 15,687.42008 175.7 382.0 524.7 3,432.3 10.7 2,430.4 21.0 1,119.1 4,501.1 384.0 872.7 13,853.62009 274.7 439.8 524.5 4,352.1 25.1 3,232.2 26.9 1,181.4 6,165.5 450.6 1,233.7 17,906.62010 320.0 472.9 704.5 3,667.3 30.2 3,594.0 37.6 674.4 6,727.2 470.4 1,753.5 18,452.12011 335.6 554.5 900.8 3,698.3 32.4 4,045.9 33.2 731.4 5,657.9 523.5 1,725.1 18,238.62012 346.7 516.9 791.5 3,727.3 45.9 4,285.9 40.9 734.7 6,067.8 541.7 1,911.9 19,011.22013 311.6 576.2 975.9 3,602.9 38.3 3,747.3 43.6 645.2 5,055.4 536.0 1,732.9 17,265.12014 314.0 547.0 1,603.3 3,668.4 53.6 3,469.1 39.5 642.5 5,272.5 560.9 1,868.5 18,039.22015 240.8 502.4 2,436.2 2,947.0 44.9 3,219.0 31.9 486.7 7,803.2 559.8 1,778.5 20,050.42016 294.0 499.8 3,650.6 2,908.3 63.0 3,425.4 51.8 489.1 6,330.0 544.7 2,197.0 20,453.62017 299.3 589.7 2,790.8 2,969.5 64.2 3,230.5 36.0 474.1 5,641.4 547.3 2,024.7 18,667.32018 258.8 524.9 2,908.9 2,797.7 45.8 3,033.4 51.9 550.4 5,502.4 545.3 1,871.7 18,091.22019 219.1 538.8 3,782.1 2,960.1 88.8 3,125.0 50.2 416.3 8,616.0 574.1 2,437.4 22,807.82020 419.7 742.5 5,088.4 3,756.3 81.9 3,364.5 37.4 752.6 9,401.9 690.7 3,000.5 27,336.5
Average 277.4 498.0 1,843.3 3,410.4 43.5 3,280.8 36.2 724.8 6,231.8 520.2 1,811.7 18,678.2Y/Y % Change 91.6% 37.8% 34.5% 26.9% -7.7% 7.7% -25.5% 80.8% 9.1% 20.3% 23.1% 19.9%5-Year CAGR 11.7% 8.1% 15.9% 5.0% 12.8% 0.9% 3.2% 9.1% 3.8% 4.3% 11.0% 6.4%10-Year CAGR 2.7% 4.6% 21.9% 0.2% 10.5% -0.7% -0.1% 1.1% 3.4% 3.9% 5.5% 4.0%
$ Billions
Sources: Bloomberg, RefinitivNote: Long-term is defined as a security w ith maturity of 13 months or longer at issuance; includes corporate, municipal and sovereign issuance.

Global Capital Markets
2021 Capital Markets Fact Book Page | 38
Global Equity Issuance
Australia Canada China EU27 Hong Kong Japan SingaporeUnited
KingdomUnited States
Other Developed
MarketsEmerging Markets Total
2006 29.3 20.9 8.0 109.9 43.3 56.2 8.0 74.2 144.2 14.2 58.7 567.02007 20.9 28.4 3.9 109.8 46.7 19.4 10.2 81.0 153.1 19.3 119.3 611.92008 16.8 18.2 2.1 28.3 12.8 8.4 1.7 21.8 189.3 3.7 43.7 346.62009 22.3 32.0 30.2 34.0 50.4 58.7 4.2 28.8 241.4 16.2 56.8 575.02010 20.3 38.7 73.1 50.9 78.3 56.0 8.2 26.4 188.6 8.2 108.1 656.92011 10.9 28.6 42.1 56.1 44.7 17.9 10.2 25.9 174.1 4.6 59.2 474.32012 10.5 29.0 40.2 47.1 51.0 22.4 6.1 19.9 226.8 7.5 70.6 531.12013 21.3 25.7 29.7 95.2 41.2 42.8 9.2 41.8 251.2 15.7 74.9 648.72014 27.5 33.2 66.1 114.7 56.8 31.0 4.5 56.1 261.8 10.3 68.7 730.82015 20.2 27.6 111.0 122.2 70.0 35.3 1.3 54.9 214.7 9.7 51.9 718.72016 14.1 33.7 159.0 62.9 35.3 20.9 2.6 28.5 176.5 7.4 45.7 586.62017 13.1 26.8 114.7 95.6 31.5 44.9 4.4 38.0 191.5 16.5 93.9 670.92018 10.9 16.2 49.7 59.7 57.0 46.7 3.7 31.7 203.8 10.1 56.0 545.42019 17.8 13.2 48.0 49.8 51.5 20.0 5.3 32.3 191.7 12.0 99.0 540.82020 27.1 15.5 107.1 68.1 83.1 37.7 3.8 44.7 337.6 20.0 82.2 826.8
Average 18.9 25.8 59.0 73.6 50.2 34.6 5.6 40.4 209.8 11.7 72.6 602.1Y/Y % Change 51.7% 16.8% 123.3% 36.9% 61.2% 88.2% -28.4% 38.5% 76.1% 66.1% -17.0% 52.9%5-Year CAGR 6.0% -10.9% -0.7% -11.0% 3.5% 1.3% 23.3% -4.0% 9.5% 15.6% 9.6% 2.8%10-Year CAGR 2.9% -8.8% 3.9% 3.0% 0.6% -3.9% -7.3% 5.4% 6.0% 9.3% -2.7% 2.3%
$ Billions
Source: DealogicNote: Includes rank eligible, non-convertible IPOs and follow -on equity deals, excludes preffered shares, rights issued, closed-end funds, business development companies, and special purpose acquisition companies; by exchange nationality.

Global Capital Markets
2021 Capital Markets Fact Book Page | 39
International Security Offerings by All Issuers - Market Value
Straight Debt
Convertible Debt Total Debt
Common Stock
Preferred Stock Total Equity Total
2006 3,157.7 47.1 3,204.9 207.9 13.2 221.2 3,426.02007 2,980.2 90.0 3,070.2 386.3 21.7 407.9 3,478.12008 1,803.6 53.6 1,857.3 272.8 10.7 283.5 2,140.82009 2,566.4 55.6 2,621.9 395.8 13.7 409.5 3,031.42010 2,333.4 51.9 2,385.3 365.1 6.6 371.8 2,757.12011 2,262.9 36.4 2,299.3 235.7 10.5 246.3 2,545.62012 2,670.5 44.0 2,714.5 238.4 15.6 254.0 2,968.42013 2,709.0 54.4 2,763.4 308.4 8.3 316.7 3,080.12014 3,066.1 55.5 3,121.6 351.9 15.6 367.4 3,489.02015 2,538.3 38.4 2,576.7 394.7 14.3 409.1 2,985.82016 2,638.9 42.3 2,681.2 225.8 7.3 233.1 2,914.32017 3,171.4 35.6 3,206.9 345.6 24.1 369.6 3,576.62018 2,733.7 31.8 2,765.5 293.2 8.2 301.5 3,066.92019 3,022.1 70.4 3,092.5 286.5 6.2 292.7 3,385.22020 3,565.3 131.6 3,696.9 391.7 6.3 398.0 4,094.9
Average 2,748.0 55.9 2,803.9 313.3 12.2 325.5 3,129.4Y/Y % Change 18.0% 87.0% 19.5% 36.7% 2.3% 36.0% 21.0%5-Year CAGR 7.0% 27.9% 7.5% -0.2% -15.1% -0.5% 6.5%10-Year CAGR 4.3% 9.8% 4.5% 0.7% -0.5% 0.7% 4.0%
Source: RefinitivNote: Securities issued by an entity outside of its domestic market.
$ Billions

Global Capital Markets
2021 Capital Markets Fact Book Page | 40
International Security Offerings by All Issuers - Number of Issues
Straight Debt
Convertible Debt Total Debt
Common Stock
Preferred Stock Total Equity Total
2006 6,844 242 7,086 907 33 940 8,0262007 6,306 316 6,622 1,781 46 1,827 8,4492008 3,516 130 3,646 862 47 909 4,5552009 3,592 201 3,793 1,515 64 1,579 5,3722010 4,603 444 5,047 1,823 44 1,867 6,9142011 4,156 429 4,585 1,443 57 1,500 6,0852012 5,138 270 5,408 1,590 99 1,689 7,0972013 5,129 304 5,433 1,908 91 1,999 7,4322014 5,688 245 5,933 2,061 95 2,156 8,0892015 4,694 125 4,819 2,199 60 2,259 7,0782016 4,928 112 5,040 2,054 37 2,091 7,1312017 5,719 102 5,821 2,585 56 2,641 8,4622018 5,002 154 5,156 2,307 42 2,349 7,5052019 5,314 245 5,559 2,395 25 2,420 7,9792020 5,472 308 5,780 3,026 18 3,044 8,824
Average 5,073 242 5,315 1,897 54 1,951 7,267Y/Y % Change 3.0% 25.7% 4.0% 26.3% -28.0% 25.8% 10.6%5-Year CAGR 3.1% 19.8% 3.7% 6.6% -21.4% 6.1% 4.5%10-Year CAGR 1.7% -3.6% 1.4% 5.2% -8.6% 5.0% 2.5%
Source: RefinitivNote: Securities issued by an entity outside of its domestic market.
Number of Issues

Global Capital Markets
2021 Capital Markets Fact Book Page | 41
International Security Offerings by US Issuers - Market Value
Straight Debt
Convertible Debt Total Debt
Common Stock
Preferred Stock Total Equity Total
2006 342.2 0.1 342.4 6.6 4.6 11.3 353.62007 335.7 1.2 336.8 4.7 2.4 7.1 343.92008 190.1 0.0 190.2 20.0 2.1 22.2 212.32009 235.9 0.2 236.1 1.8 1.1 2.9 239.02010 316.2 0.0 316.2 1.9 0.0 1.9 318.12011 250.4 0.9 251.3 0.9 1.8 2.7 254.02012 421.6 4.0 425.7 2.2 1.8 4.0 429.72013 450.3 4.8 455.1 1.6 1.7 3.4 458.42014 586.2 4.1 590.3 1.7 0.1 1.9 592.12015 622.1 1.9 624.0 1.3 3.4 4.7 628.72016 605.7 0.5 606.2 1.2 0.1 1.3 607.52017 748.2 0.4 748.6 4.4 0.8 5.3 753.92018 558.9 1.8 560.8 1.8 3.4 5.3 566.02019 683.8 33.7 717.5 1.6 3.1 4.7 722.22020 835.8 74.7 910.4 1.9 2.7 4.6 915.0
Average 478.9 8.6 487.4 3.6 2.0 5.5 493.0Y/Y % Change 22.2% 121.5% 26.9% 22.0% -14.8% -2.6% 26.7%5-Year CAGR 6.1% 107.5% 7.8% 8.7% -4.8% -0.4% 7.8%10-Year CAGR 10.2% 127.0% 11.2% 0.0% 58.8% 9.0% 11.1%
Source: RefinitivNote: Securities issued by a U.S. entity outside of the U.S. market.
$ Billions

Global Capital Markets
2021 Capital Markets Fact Book Page | 42
International Security Offerings by US Issuers - Number of Issues
Straight Debt
Convertible Debt Total Debt
Common Stock
Preferred Stock Total Equity Total
2006 767 6 773 25 10 35 8082007 699 9 708 39 7 46 7542008 460 7 467 13 7 20 4872009 399 5 404 34 8 42 4462010 700 7 707 40 3 43 7502011 570 39 609 31 17 48 6572012 838 80 918 30 33 63 9812013 873 70 943 34 41 75 1,0182014 1,061 51 1,112 28 24 52 1,1642015 1,004 8 1,012 24 14 38 1,0502016 1,088 3 1,091 26 3 29 1,1202017 1,278 3 1,281 38 6 44 1,3252018 1,022 10 1,032 50 11 61 1,0932019 1,064 98 1,162 50 6 56 1,2182020 1,257 150 1,407 60 2 62 1,469
Average 872 36 908 35 13 48 956Y/Y % Change 18.1% 53.1% 21.1% 20.0% -66.7% 10.7% 20.6%5-Year CAGR 4.6% 79.7% 6.8% 20.1% -32.2% 10.3% 6.9%10-Year CAGR 6.0% 35.9% 7.1% 4.1% -4.0% 3.7% 7.0%
Source: RefinitivNote: Securities issued by a U.S. entity outside of the U.S. market.
Number of Issues

Global Capital Markets
2021 Capital Markets Fact Book Page | 43
Global Bond Market Outstanding and Global Equity Market Capitalization - Charts
US37%
EU2728%
UK7%
Japan18%
Other DM5%
EM5%
Global Bond Market Outstanding2010 - $82.3 Trillion
US38%
EU 2720%
UK6%
Japan12%
Other DM7%
EM17%
Global Bond Market Outstanding2020 - $123.5 Trillion
US30%
EU2713%
UK5%
Japan7%
Other DM20%
EM25%
Global Equity Market Cap 2010 - $58 Trillion
US38%
EU 2711%UK
4%
Japan6%
Other DM20%
EM21%
Global Equity Market Capitalization
2020 - $105.8 Trillion
Sources: Bank of International Settlements (BIS), World Federation of ExchangesNote: Market capitalization of listed domestic companies.

Global Capital Markets
2021 Capital Markets Fact Book Page | 44
Global Bond Market Outstanding - Value
Australia Canada China EU27 Hong Kong Japan SingaporeUnited
KingdomUnited States
Other Developed
MarketsEmerging Markets Total
2006 957.3 1,327.4 1,198.3 15,894.2 99.1 9,090.3 140.3 3,989.8 23,881.7 527.1 633.9 57,739.62007 1,251.4 1,542.9 1,704.5 19,312.8 104.3 9,852.1 166.3 4,706.8 26,145.9 602.2 808.9 66,198.12008 1,141.9 1,369.7 2,228.0 20,256.7 102.7 12,329.9 167.6 4,099.6 28,033.8 604.0 749.0 71,082.92009 1,523.7 1,671.6 2,577.9 24,101.1 151.3 12,268.5 185.0 5,280.9 29,132.6 775.9 840.7 78,509.22010 1,742.9 1,866.6 3,065.3 23,324.9 184.0 14,604.1 219.0 5,210.2 30,208.7 833.7 991.9 82,251.42011 1,872.6 1,963.4 3,528.4 23,463.5 211.7 15,809.1 240.9 5,587.2 31,021.5 839.0 1,001.7 85,539.12012 2,037.5 2,173.5 4,294.1 24,307.6 250.5 14,254.1 294.8 5,928.8 32,300.4 950.8 1,140.0 87,932.02013 1,879.5 2,241.9 4,960.8 24,999.2 303.9 11,909.2 331.4 5,851.0 33,284.5 960.2 1,100.9 87,822.52014 1,916.9 2,206.1 5,835.4 22,074.9 343.5 10,558.0 349.3 6,169.5 34,302.9 888.8 1,150.4 85,795.72015 1,819.1 2,767.5 7,752.5 19,871.1 372.4 10,638.7 322.3 5,891.5 35,317.4 859.9 1,199.2 86,811.72016 1,823.2 2,943.5 9,408.8 19,379.9 404.9 11,248.5 326.4 5,439.2 36,716.1 935.1 1,272.1 89,897.52017 2,003.9 3,267.4 11,757.1 22,129.5 473.7 11,932.1 412.2 6,078.4 37,903.4 1,033.3 1,497.8 98,488.72018 1,899.9 3,149.3 12,906.9 21,437.8 511.7 12,477.0 441.1 5,792.2 39,456.1 1,003.6 1,501.9 100,577.52019 1,957.4 3,369.5 14,725.9 21,788.2 531.9 12,828.8 492.9 6,325.2 41,226.0 1,117.9 1,601.4 105,964.92020 2,498.4 3,910.3 18,555.6 25,226.0 556.1 14,678.3 542.8 7,172.4 47,237.0 1,334.8 1,757.0 123,468.6
Average 1,755.0 2,384.7 6,966.6 21,837.8 306.8 12,298.6 308.8 5,568.2 33,744.5 884.4 1,149.8 87,205.3Y/Y % Change 27.6% 16.1% 26.0% 15.8% 4.6% 14.4% 10.1% 13.4% 14.6% 19.4% 9.7% 16.5%5-Year CAGR 6.6% 7.2% 19.1% 4.9% 8.3% 6.6% 11.0% 4.0% 6.0% 9.2% 7.9% 7.3%10-Year CAGR 3.7% 7.7% 19.7% 0.8% 11.7% 0.1% 9.5% 3.2% 4.6% 4.8% 5.9% 4.1%
Source: Bank of International Settlements (BIS)
$ Billions

Global Capital Markets
2021 Capital Markets Fact Book Page | 45
Global Bond Market Outstanding - Share of Total
Australia Canada China EU27 Hong Kong Japan SingaporeUnited
KingdomUnited States
Other Developed
MarketsEmerging Markets Total
2006 1.7% 2.3% 2.1% 27.5% 0.2% 15.7% 0.2% 6.9% 41.4% 0.9% 1.1% 100.0%2007 1.9% 2.3% 2.6% 29.2% 0.2% 14.9% 0.3% 7.1% 39.5% 0.9% 1.2% 100.0%2008 1.6% 1.9% 3.1% 28.5% 0.1% 17.3% 0.2% 5.8% 39.4% 0.8% 1.1% 100.0%2009 1.9% 2.1% 3.3% 30.7% 0.2% 15.6% 0.2% 6.7% 37.1% 1.0% 1.1% 100.0%2010 2.1% 2.3% 3.7% 28.4% 0.2% 17.8% 0.3% 6.3% 36.7% 1.0% 1.2% 100.0%2011 2.2% 2.3% 4.1% 27.4% 0.2% 18.5% 0.3% 6.5% 36.3% 1.0% 1.2% 100.0%2012 2.3% 2.5% 4.9% 27.6% 0.3% 16.2% 0.3% 6.7% 36.7% 1.1% 1.3% 100.0%2013 2.1% 2.6% 5.6% 28.5% 0.3% 13.6% 0.4% 6.7% 37.9% 1.1% 1.3% 100.0%2014 2.2% 2.6% 6.8% 25.7% 0.4% 12.3% 0.4% 7.2% 40.0% 1.0% 1.3% 100.0%2015 2.1% 3.2% 8.9% 22.9% 0.4% 12.3% 0.4% 6.8% 40.7% 1.0% 1.4% 100.0%2016 2.0% 3.3% 10.5% 21.6% 0.5% 12.5% 0.4% 6.1% 40.8% 1.0% 1.4% 100.0%2017 2.0% 3.3% 11.9% 22.5% 0.5% 12.1% 0.4% 6.2% 38.5% 1.0% 1.5% 100.0%2018 1.9% 3.1% 12.8% 21.3% 0.5% 12.4% 0.4% 5.8% 39.2% 1.0% 1.5% 100.0%2019 1.8% 3.2% 13.9% 20.6% 0.5% 12.1% 0.5% 6.0% 38.9% 1.1% 1.5% 100.0%2020 2.0% 3.2% 15.0% 20.4% 0.5% 11.9% 0.4% 5.8% 38.3% 1.1% 1.4% 100.0%
Average 2.0% 2.7% 7.3% 25.5% 0.3% 14.3% 0.3% 6.4% 38.8% 1.0% 1.3%Y/Y Change 0.18% -0.01% 1.1% -0.1% -0.1% -0.2% -0.03% -0.2% -0.6% 0.0% -0.1%
Source: Bank of International Settlements (BIS)
Percentages

Global Capital Markets
2021 Capital Markets Fact Book Page | 46
Global Equity Markets Capitalization - Market Value
Australia Canada China EU27 Hong Kong Japan SingaporeUnited
KingdomUnited States
Other Developed
Markets
Other Emerging Markets Total
2006 1,095.9 1,700.7 1,145.5 9,796.9 1,715.0 4,797.6 384.3 3,781.4 19,569.0 3,593.5 4,796.0 52,375.62007 1,298.3 2,186.6 4,478.9 11,755.1 2,654.4 4,543.1 539.2 3,846.5 19,922.3 4,167.0 8,173.2 63,564.42008 683.9 1,033.7 1,778.8 5,754.1 1,328.8 3,263.3 265.0 1,868.2 11,590.3 2,379.3 3,725.8 33,670.92009 1,261.9 1,677.4 3,573.2 7,717.4 2,305.1 3,444.4 481.2 2,796.4 15,077.3 3,811.9 8,251.2 50,397.52010 1,454.5 2,171.2 4,027.8 7,747.3 2,711.3 4,099.6 647.2 2,686.9 17,283.5 4,617.6 10,592.1 58,038.92011 1,198.2 1,912.9 3,412.1 6,443.8 2,258.0 3,540.8 598.3 2,932.2 15,640.7 3,908.2 8,970.4 50,815.62012 1,386.9 2,060.0 3,697.4 7,328.9 2,831.9 3,681.0 765.1 3,291.6 18,668.3 4,497.0 8,464.7 56,672.82013 1,366.0 2,113.8 3,949.1 9,248.5 3,100.8 4,781.5 744.4 3,946.9 24,034.9 5,346.2 8,286.4 66,918.42014 1,288.8 2,095.4 6,004.9 8,431.6 3,233.0 4,378.0 752.8 3,570.9 26,330.6 5,315.0 8,415.7 69,816.72015 1,187.2 1,593.5 8,188.0 7,580.0 3,184.9 9,716.8 640.0 3,878.8 25,067.5 5,203.7 7,253.0 73,493.32016 1,316.9 2,041.5 7,320.7 7,669.6 3,193.2 5,061.5 649.5 3,467.4 45,667.9 5,274.7 8,202.6 89,865.62017 1,508.6 2,367.1 8,711.3 9,787.6 4,350.5 6,222.8 787.3 4,455.4 32,120.7 6,436.3 10,945.7 87,693.22018 1,262.8 1,937.9 6,324.9 8,136.0 3,819.2 5,296.8 687.3 3,638.0 30,436.3 5,664.1 9,568.8 76,772.02019 1,487.6 2,409.1 8,569.5 9,733.6 4,899.2 6,191.1 697.3 4,182.9 33,890.8 8,709.3 8,774.9 89,545.42020 1,720.6 2,641.5 12,276.8 11,148.1 6,130.4 6,718.2 652.6 4,045.6 40,719.7 9,756.0 10,009.9 105,819.3
Average 1,301.2 1,996.1 5,563.9 8,551.9 3,181.1 5,049.1 619.4 3,492.6 25,068.0 5,245.3 8,295.3 68,364.0Y/Y % Change 15.7% 9.6% 43.3% 14.5% 25.1% 8.5% -6.4% -3.3% 20.1% 12.0% 14.1% 18.2%5-Year CAGR 7.7% 10.6% 8.4% 8.0% 14.0% -7.1% 0.4% 0.8% 10.2% 13.4% 6.7% 7.6%10-Year CAGR 1.7% 2.0% 11.8% 3.7% 8.5% 5.1% 0.1% 4.2% 8.9% 7.8% -0.6% 6.2%
Note: Market capitalization of listed domestic companies.
$ Billions
Source: World Federation of Exchanges

Global Capital Markets
2021 Capital Markets Fact Book Page | 47
Global Equity Markets Capitalization - Share of Total
Australia Canada China EU27 Hong Kong Japan SingaporeUnited
KingdomUnited States
Other Developed
Markets
Other Emerging Markets Total
2006 2.1% 3.2% 2.2% 18.7% 3.3% 9.2% 0.7% 7.2% 37.4% 6.9% 9.2% 100.0%2007 2.0% 3.4% 7.0% 18.5% 4.2% 7.1% 0.8% 6.1% 31.3% 6.6% 12.9% 100.0%2008 2.0% 3.1% 5.3% 17.1% 3.9% 9.7% 0.8% 5.5% 34.4% 7.1% 11.1% 100.0%2009 2.5% 3.3% 7.1% 15.3% 4.6% 6.8% 1.0% 5.5% 29.9% 7.6% 16.4% 100.0%2010 2.5% 3.7% 6.9% 13.3% 4.7% 7.1% 1.1% 4.6% 29.8% 8.0% 18.2% 100.0%2011 2.4% 3.8% 6.7% 12.7% 4.4% 7.0% 1.2% 5.8% 30.8% 7.7% 17.7% 100.0%2012 2.4% 3.6% 6.5% 12.9% 5.0% 6.5% 1.3% 5.8% 32.9% 7.9% 14.9% 100.0%2013 2.0% 3.2% 5.9% 13.8% 4.6% 7.1% 1.1% 5.9% 35.9% 8.0% 12.4% 100.0%2014 1.8% 3.0% 8.6% 12.1% 4.6% 6.3% 1.1% 5.1% 37.7% 7.6% 12.1% 100.0%2015 1.6% 2.2% 11.1% 10.3% 4.3% 13.2% 0.9% 5.3% 34.1% 7.1% 9.9% 100.0%2016 1.5% 2.3% 8.1% 8.5% 3.6% 5.6% 0.7% 3.9% 50.8% 5.9% 9.1% 100.0%2017 1.7% 2.7% 9.9% 11.2% 5.0% 7.1% 0.9% 5.1% 36.6% 7.3% 12.5% 100.0%2018 1.6% 2.5% 8.2% 10.6% 5.0% 6.9% 0.9% 4.7% 39.6% 7.4% 12.5% 100.0%2019 1.7% 2.7% 9.6% 10.9% 5.5% 6.9% 0.8% 4.7% 37.8% 9.7% 9.8% 100.0%2020 1.6% 2.5% 11.6% 10.5% 5.8% 6.3% 0.6% 3.8% 38.5% 9.2% 9.5% 100.0%
Average 2.0% 3.0% 7.7% 13.1% 4.6% 7.5% 0.9% 5.3% 35.8% 7.6% 12.5%Y/Y Change 0.0% -0.2% 2.0% -0.3% 0.3% -0.6% -0.2% -0.8% 0.6% -0.5% -0.3%
Source: World Federation of ExchangesNote: Market capitalization of listed domestic companies.
Percentages

Global Capital Markets
2021 Capital Markets Fact Book Page | 48
Global Derivatives Market Outstanding - Notional Principal
Exchange Traded
Over-the-Counter
(OTC) Total2006 62,951.6 418,132.4 481,083.92007 71,532.0 585,925.9 657,458.02008 52,963.0 598,141.0 651,103.92009 67,416.4 603,893.3 671,309.72010 62,309.9 601,042.8 663,352.72011 53,692.9 647,807.0 701,499.92012 49,033.2 635,681.0 684,714.12013 57,459.4 710,092.3 767,551.72014 57,594.2 627,786.0 685,380.22015 63,485.8 492,536.2 556,022.02016 67,244.9 482,421.1 549,665.92017 80,984.1 531,911.1 612,895.12018 94,849.7 544,383.3 639,233.02019 95,812.8 558,511.1 654,323.92020 65,949.7 582,058.4 648,008.2
Average 66,885.3 574,688.2 641,573.5Y/Y % Change -31.2% 4.2% -1.0%5-Year CAGR 0.8% 3.4% 3.1%10-Year CAGR 0.6% -0.3% -0.2%
Note: Includes interest rate, foreign exchange, equity linked, commodity contracts, credit derivatives, and credit default sw aps.
Source: Bank for International Settlements (BIS)
$ Billions

Global Capital Markets
2021 Capital Markets Fact Book Page | 49
Global Investment Banking Net Revenues by Product - Charts
0
10
20
30
40
50
60
70
80
90
100
2011 2012 2013 2014 2015 2016 2017 2018 2019 2020
Global Investment Banking Fees ($B)M&A DCM ECM Syndicated Lending
30 30 24 27 32 34 31 36 34 27
24 3229 27
26 29 29 25 3032
2421
24 26 25 19 22 1919 30
23 18 23 19 16 19 18 20 16 11
0%
10%
20%
30%
40%
50%
60%
70%
80%
90%
100%
2011 2012 2013 2014 2015 2016 2017 2018 2019 2020
Global Investment Banking Fees (% of Total)M&A DCM ECM Syndicated Lending
Source: Dealogic Investment Banking Revenue AnalyticsNote: Includes M&A, debt capital markets, equity capital markets, and syndicated lending net revenues.

Global Capital Markets
2021 Capital Markets Fact Book Page | 50
Global Investment Banking Net Revenues by Region
2016 2017 2018 2019 2020 AverageY/Y %
ChangeUnited States 36.3 41.0 39.5 39.6 49.6 41.2 25.4%United Kingdom 3.8 4.3 4.8 3.9 4.5 4.3 15.7%Europe (ex UK) 12.3 14.0 14.8 12.9 14.5 13.7 11.9%Japan 3.1 3.5 3.3 3.0 3.6 3.3 20.6%BRICs (Brazil, Russia, India, China) 9.9 10.0 8.2 9.4 12.3 10.0 31.0%Canada & Australia 5.2 5.4 5.8 4.9 5.2 5.3 5.6%Asia Pacific (ex Japan, China, Australia, India) 2.2 2.3 2.3 2.3 2.3 2.3 -4.1%Latin America (ex Brazil) 0.7 1.0 0.6 0.6 0.4 0.7 -31.1%Other 1.0 1.2 1.2 1.3 1.2 1.2 -11.1%Total 74.6 82.7 80.6 78.0 93.5 81.9 20.0%
$ Billions
Source: Dealogic Investment Banking Revenue AnalyticsNote: Includes M&A, debt capital markets, equity capital markets, and syndicated lending net revenues.

Global Capital Markets
2021 Capital Markets Fact Book Page | 51
Global Mergers and Acquisitions – Announced and Completed
Value ($ Billions) # of Deals
Value ($ Billions) # of Deals
2006 3,914.5 37,727 2006 3,591.8 37,6712007 4,613.4 43,698 2007 4,746.4 43,4922008 3,173.0 42,538 2008 3,568.7 43,3052009 2,299.5 37,644 2009 2,370.2 37,1732010 2,724.0 42,371 2010 2,491.1 41,9932011 2,768.9 45,567 2011 2,911.1 45,5442012 2,660.4 43,999 2012 2,558.2 43,9432013 2,788.5 38,433 2013 2,750.2 38,6262014 3,625.9 41,602 2014 3,055.1 41,2442015 4,548.7 40,636 2015 4,129.7 40,5312016 3,767.3 38,852 2016 3,905.1 39,2682017 3,564.6 40,820 2017 3,696.7 41,1202018 4,125.2 36,203 2018 4,317.7 36,2192019 3,981.2 37,032 2019 3,824.7 36,9992020 3,695.7 33,645 2020 3,453.6 33,038
Average 3,483.4 40,051 Average 3,424.7 40,011Y/Y % Change -7.2% -9.1% Y/Y % Change -9.7% -10.7%5-Year CAGR -4.1% -3.7% 5-Year CAGR -3.5% -4.0%10-Year CAGR 3.1% -2.3% 10-Year CAGR 3.3% -2.4%
Source: Dealogic
Announced Completed

Global Capital Markets
2021 Capital Markets Fact Book Page | 52
US Holdings of Foreign Securities
Stocks Bonds Total2006 4,329.0 1,400.7 5,729.72007 5,248.0 1,734.6 6,982.52008 2,748.4 1,341.9 4,090.32009 3,995.3 1,693.0 5,688.32010 4,900.2 1,903.1 6,803.32011 4,501.4 2,107.5 6,609.02012 5,321.9 2,366.7 7,688.62013 6,472.9 2,383.8 8,856.72014 6,770.6 2,592.3 9,362.92015 6,756.2 2,424.1 9,180.22016 7,146.3 2,531.1 9,677.42017 9,118.1 2,982.0 12,100.12018 7,899.6 3,037.7 10,937.32019 9,459.1 3,351.7 12,810.82020 10,560.1 3,589.1 14,149.2
Average 6,348.5 2,362.6 8,711.1Y/Y % Change 11.6% 7.1% 10.4%5-Year CAGR 9.3% 8.2% 9.0%10-Year CAGR 8.0% 6.5% 7.6%
Source: The Federal Reserve - Financial Accounts of the United StatesNote: Holding of foreign corporate equities, investment shares, and bonds by U.S residents; includes American Depository Receipts (ADR).
$ Billions

Global Capital Markets
2021 Capital Markets Fact Book Page | 53
US Gross Activity in Foreign Securities
Stocks Bonds Total2006 7,375.9 3,888.1 11,264.02007 10,522.2 6,062.7 16,584.92008 10,860.9 4,465.8 15,326.82009 6,396.3 3,991.9 10,388.22010 7,404.1 7,320.3 14,724.42011 8,000.5 7,054.9 15,055.42012 6,909.5 7,824.3 14,733.82013 7,850.7 8,609.6 16,460.32014 8,892.2 9,287.3 18,179.42015 9,694.7 11,501.0 21,195.72016 8,805.5 11,104.5 19,910.02017 9,798.2 17,387.2 27,185.32018 11,907.8 21,865.7 33,773.52019 11,082.2 25,856.9 36,939.02020 14,435.6 31,616.2 46,051.9
Average 9,329.1 11,855.8 21,184.8Y/Y % Change 30.3% 22.3% 24.7%5-Year CAGR 8.3% 22.4% 16.8%10-Year CAGR 6.9% 15.8% 12.1%
Source: U.S. Treasury, Treasury International Capital (TIC) SystemNote: Gross activity = purchases + sales.
$ Billions

Global Capital Markets
2021 Capital Markets Fact Book Page | 54
US Net Purchases of Foreign Securities
Stocks Bonds Total2006 106.3 149.7 256.02007 94.8 150.3 245.12008 -20.2 -42.5 -62.72009 59.6 123.9 183.52010 59.9 75.4 135.32011 69.8 88.8 158.62012 41.3 1.4 42.72013 174.0 76.4 250.42014 107.7 -94.0 13.82015 114.0 -251.3 -137.32016 55.8 -233.2 -177.42017 106.3 -217.8 -111.52018 -44.0 -291.7 -335.62019 -50.0 -113.6 -163.62020 -109.0 -178.0 -287.1
Average 51.1 -50.4 0.7Y/Y % Change -117.9% -56.7% -75.4%
Source: U.S. Treasury, Treasury International Capital (TIC) SystemNote: Net purchases = purchases - sales.
$ Billions

Global Capital Markets
2021 Capital Markets Fact Book Page | 55
US Gross Activity in Foreign Equities by Region/Country
Australia Canada China EU27 Hong Kong Japan SingaporeUnited
KingdomAll
Countries2006 154.6 318.3 13.5 661.8 423.4 784.0 92.1 2,416.0 7,375.92007 208.4 447.1 11.7 974.8 655.1 910.4 128.4 3,453.1 10,522.22008 230.7 613.3 11.6 1,092.0 648.9 784.7 150.2 3,520.8 10,860.92009 157.4 425.9 19.5 627.1 508.5 366.5 86.0 1,992.1 6,396.32010 153.7 490.8 22.5 673.2 612.4 374.2 89.6 2,289.6 7,404.12011 135.2 581.3 25.1 724.4 638.2 390.7 104.6 2,552.0 8,000.52012 106.2 487.1 17.1 657.1 545.3 304.7 99.7 2,274.4 6,909.52013 111.0 526.4 26.2 634.7 719.3 504.9 116.8 2,456.1 7,850.72014 97.7 750.8 28.0 751.6 707.1 361.6 137.8 2,760.2 8,892.22015 115.1 846.2 46.4 861.9 728.3 390.0 171.7 2,616.6 9,694.72016 110.3 679.5 30.5 1,013.1 614.7 417.3 180.3 2,510.4 8,805.52017 114.5 744.2 32.9 1,149.3 705.4 459.0 188.2 2,811.3 9,798.22018 127.0 878.5 51.8 1,369.8 886.4 565.4 249.1 3,768.8 11,907.82019 129.6 818.4 53.1 1,204.5 832.4 441.7 231.6 3,356.3 11,082.22020 159.3 1,080.0 84.7 1,667.3 1,179.8 474.7 325.7 4,449.8 14,435.6
Average 140.7 645.8 31.6 937.5 693.7 502.0 156.8 2,881.8 9,329.1Y/Y % Change 22.9% 32.0% 59.5% 38.4% 41.7% 7.5% 40.6% 32.6% 30.3%5-Year CAGR 6.7% 5.0% 12.8% 14.1% 10.1% 4.0% 13.7% 11.2% 8.3%10-Year CAGR 0.4% 8.2% 14.2% 9.5% 6.8% 2.4% 13.8% 6.9% 6.9%
Note: Gross activity = purchases + sales; China includes Mainland only.
$ Billions
Source: U.S. Treasury, Treasury International Capital (TIC) System

Global Capital Markets
2021 Capital Markets Fact Book Page | 56
US Net Purchases of Foreign Equities by Region/Country
Australia Canada China EU27 Hong Kong Japan SingaporeUnited
KingdomAll
Countries2006 6.0 7.6 5.2 6.8 21.2 2.1 5.5 59.7 106.32007 2.3 5.6 -0.6 1.4 -6.7 1.7 4.0 66.8 94.82008 0.8 2.2 0.3 -16.5 -12.1 -21.7 -5.6 1.7 -20.22009 5.9 7.2 -2.4 -11.7 9.5 2.5 -0.8 24.0 59.62010 0.2 2.8 -0.6 -6.9 26.0 13.0 -2.2 -3.8 59.92011 -0.3 1.4 5.4 12.1 0.2 -4.1 2.2 3.0 69.82012 0.1 0.8 -1.2 2.0 15.6 9.2 -4.6 13.1 41.32013 4.0 6.4 -4.0 30.3 6.7 32.9 -5.0 96.8 174.02014 7.9 9.9 0.2 6.3 15.3 1.2 5.8 47.8 107.72015 4.6 7.7 2.5 6.0 20.8 -2.4 4.5 40.9 114.02016 7.4 3.2 0.2 5.8 1.8 -14.2 0.0 23.3 55.82017 -1.2 -17.3 -0.4 -0.5 29.2 2.5 0.8 95.1 106.32018 -0.2 -35.6 -3.2 14.6 25.6 -10.0 -8.4 -2.5 -44.02019 -2.0 -28.9 -1.5 -16.9 29.9 -1.2 -1.2 16.9 -50.02020 -1.8 -39.6 -2.4 -32.5 -26.5 -16.4 2.8 31.3 -109.0
Average 2.2 -4.4 -0.2 0.0 10.4 -0.3 -0.2 34.3 51.1Y/Y % Change 10.8% -36.9% -53.4% -92.0% -188.4% -1284.1% 332.0% 85.5% -117.9%
$ Billions
Source: U.S. Treasury, Treasury International Capital (TIC) SystemNote: Net purchases = purchases - sales; China includes Mainland only.

Global Capital Markets
2021 Capital Markets Fact Book Page | 57
Foreign Holdings of US Securities
StocksCorporate
Bonds Treasury
Agency Debentures
and MBS Total2006 2,558.4 2,353.3 2,126.2 1,258.2 8,296.22007 2,954.0 2,775.0 2,376.4 1,576.8 9,682.32008 1,929.9 2,383.9 3,253.0 1,402.2 8,968.92009 2,657.4 2,483.5 3,670.6 1,150.0 9,961.52010 3,213.5 2,523.1 4,458.8 1,095.8 11,291.22011 3,397.2 2,491.0 5,004.4 1,078.2 11,970.82012 3,953.0 2,617.6 5,571.5 1,001.2 13,143.22013 5,205.4 2,732.9 5,792.6 883.8 14,614.72014 5,920.6 2,928.0 6,158.0 899.6 15,906.22015 5,500.9 3,083.3 6,146.2 916.5 15,647.02016 5,782.7 3,431.7 6,002.8 991.6 16,208.82017 7,019.4 3,881.7 6,211.3 1,012.2 18,124.62018 6,629.5 3,604.4 6,270.1 1,087.0 17,591.12019 8,199.0 3,964.0 6,690.8 1,182.1 20,035.92020 10,519.3 4,408.2 7,073.9 1,195.0 23,196.4
Average 5,029.3 3,044.1 5,120.4 1,115.4 14,309.3Y/Y % Change 28.3% 11.2% 5.7% 1.1% 15.8%5-Year CAGR 13.8% 7.4% 2.9% 5.5% 8.2%10-Year CAGR 12.6% 5.7% 4.7% 0.9% 7.5%
Source: The Federal Reserve - Financial Accounts of the United StatesNote: Corporate bonds include ABS and MBS securities.
$ Billions

Global Capital Markets
2021 Capital Markets Fact Book Page | 58
Foreign Gross Activity in US Securities
StocksCorporate
Bonds Treasuries Agencies Total2006 13,585.9 2,841.8 21,699.3 2,850.0 40,977.02007 21,082.7 3,429.2 30,021.6 3,864.7 58,398.12008 24,030.8 2,838.1 28,924.7 5,209.1 61,002.62009 13,155.0 2,414.1 22,628.9 2,086.3 40,284.32010 13,384.6 1,951.7 31,653.7 2,095.9 49,086.02011 15,413.4 2,032.3 35,439.6 2,167.2 55,052.42012 14,706.1 1,759.7 29,075.0 2,890.1 48,430.82013 15,435.8 1,856.7 35,386.7 2,671.9 55,351.12014 17,861.9 2,145.2 33,243.8 2,143.0 55,393.92015 22,233.5 2,232.8 32,490.6 2,616.6 59,573.52016 23,065.8 2,298.8 30,510.3 3,260.2 59,135.12017 26,592.2 2,967.9 29,511.7 3,475.6 62,547.52018 36,291.1 2,776.4 30,100.6 3,633.4 72,801.52019 37,228.8 3,481.1 36,646.7 4,850.6 82,207.12020 48,552.9 5,224.6 38,020.1 6,539.4 98,337.1
Average 22,841.4 2,683.4 31,023.6 3,356.9 59,905.2Y/Y % Change 30.4% 50.1% 3.7% 34.8% 19.6%5-Year CAGR 16.9% 18.5% 3.2% 20.1% 10.5%10-Year CAGR 13.8% 10.3% 1.8% 12.1% 7.2%
Source: U.S. Treasury, Treasury International Capital (TIC) SystemNote: Gross activity = purchases + sales.
$ Billions

Global Capital Markets
2021 Capital Markets Fact Book Page | 59
Foreign Net Purchases of US Securities
StocksCorporate
Bonds Treasuries Agencies Total2006 150.4 509.8 194.7 286.2 1,141.12007 195.6 392.1 199.0 218.6 1,005.32008 44.8 93.3 315.3 -37.7 415.72009 152.7 -39.7 538.3 -9.9 641.52010 109.8 -11.4 703.5 109.3 911.12011 24.7 -42.6 421.0 81.9 485.02012 107.8 -22.8 417.4 131.7 634.12013 -43.0 9.3 43.6 72.4 82.32014 -15.4 23.3 178.1 75.8 261.82015 -114.7 134.7 -15.0 158.2 163.22016 -6.3 125.0 -311.8 266.3 73.12017 119.4 132.3 25.0 136.4 413.12018 -129.8 56.9 8.8 230.5 166.32019 0.9 16.1 -131.4 299.9 185.42020 368.2 -145.3 -537.4 469.6 155.2
Average 64.3 82.1 136.6 165.9 449.0Y/Y % Change 42417.0% -1004.2% -309.0% 56.6% -16.3%
Source: U.S. Treasury, Treasury International Capital (TIC) SystemNote: Net purchases = purchases - sales.
$ Billions

Global Capital Markets
2021 Capital Markets Fact Book Page | 60
Foreign Gross Activity in US Equities by Region/Country
Australia Canada China EU27 Hong Kong Japan SingaporeUnited
KingdomAll
Countries2006 39.3 243.0 11.1 1,921.1 37.3 87.1 52.2 2,416.3 13,585.92007 61.0 411.1 17.4 3,804.3 118.4 103.5 63.3 3,640.4 21,082.72008 74.7 765.4 32.1 5,517.5 128.7 104.4 105.5 3,689.5 24,030.82009 45.5 619.1 34.5 2,713.7 63.9 127.5 78.7 1,749.6 13,155.02010 53.6 731.5 38.0 2,394.0 73.8 132.7 79.8 1,843.2 13,384.62011 64.5 974.4 34.0 2,543.0 89.5 166.1 91.8 2,593.0 15,413.42012 62.4 1,176.5 44.1 2,457.6 88.0 154.7 99.1 2,388.4 14,706.12013 82.8 793.6 49.0 2,018.2 160.1 179.9 132.2 3,101.2 15,435.82014 89.2 867.2 46.8 1,852.9 207.0 158.7 126.2 3,589.9 17,861.92015 80.3 833.9 50.4 1,834.3 183.8 133.3 147.2 5,360.1 22,233.52016 72.5 985.1 32.6 2,126.1 185.1 124.5 145.6 6,637.3 23,065.82017 85.9 1,173.2 45.5 2,031.4 234.6 155.7 211.8 8,295.3 26,592.22018 98.6 1,549.7 110.5 3,203.8 377.2 193.1 380.4 12,978.0 36,291.12019 104.0 1,516.8 106.5 3,943.5 362.4 193.4 417.2 11,677.0 37,228.82020 164.6 2,541.4 159.2 5,510.4 651.8 347.8 597.0 12,483.8 48,552.9
Average 78.6 1,012.1 54.1 2,924.8 197.4 157.5 181.9 5,496.2 22,841.4Y/Y % Change 58.3% 67.6% 49.5% 39.7% 79.9% 79.8% 43.1% 6.9% 30.4%5-Year CAGR 15.5% 25.0% 25.9% 24.6% 28.8% 21.1% 32.3% 18.4% 16.9%10-Year CAGR 11.9% 13.3% 15.4% 8.7% 24.3% 10.1% 22.3% 21.1% 13.8%
Note: Gross activity = purchases + sales; China includes Mainland only.
$ Billions
Source: U.S. Treasury, Treasury International Capital (TIC) System

Global Capital Markets
2021 Capital Markets Fact Book Page | 61
Foreign Net Purchases of US Equities by Region/Country
Australia Canada China EU27 Hong Kong Japan SingaporeUnited
KingdomAll
Countries2006 1.0 11.8 0.5 20.3 -0.5 -0.7 -4.5 75.8 150.42007 4.8 8.1 4.0 17.0 35.4 -5.0 -2.5 69.5 195.62008 0.1 7.2 -0.7 -32.7 27.4 23.0 7.1 30.9 44.82009 3.0 -1.6 4.0 15.7 6.3 13.8 12.0 33.7 152.72010 2.0 6.5 2.8 14.4 9.8 4.6 -4.4 27.8 109.82011 0.3 14.1 0.4 -35.0 6.5 3.4 -6.7 3.0 24.72012 1.0 14.7 -1.5 22.1 0.1 -8.1 -0.9 34.2 107.82013 -0.6 -3.2 2.8 11.7 -4.0 -26.4 -3.8 -0.3 -43.02014 0.9 10.2 -1.7 28.6 -6.6 -9.2 -11.0 -19.7 -15.42015 0.1 -12.2 -4.5 -25.3 -16.2 9.5 -5.5 -15.5 -114.72016 0.4 2.3 -3.3 -20.6 -12.3 9.1 -0.6 13.5 -6.32017 6.8 53.0 2.1 -2.6 -4.6 3.0 -7.3 33.5 119.42018 2.9 0.8 2.0 -4.8 -28.9 5.9 -2.9 -106.4 -129.82019 4.3 21.1 -3.5 17.7 7.0 0.0 16.6 -15.7 0.92020 -2.1 73.4 0.5 107.7 23.5 14.0 22.1 -20.2 368.2
Average 1.7 13.7 0.3 8.9 2.9 2.5 0.5 9.6 64.3Y/Y % Change -147.5% 247.8% 115.8% 506.7% 237.1% 233233.3% 33.6% -28.7% 42417.0%
Note: Net purchases = purchases - sales; China includes Mainland only.
$ Billions
Source: U.S. Treasury, Treasury International Capital (TIC) System

Global Capital Markets
2021 Capital Markets Fact Book Page | 62
Major Global Stock Market Indexes
CanadaS&P/TSX
Comp.FranceCAC 40
GermanyDAX
Hong KongHang Seng
JapanNikkei 225
U.K.FTSE 100
2006 12,908.39 5,541.76 6,596.92 19,964.72 17,225.83 6,220.802007 13,833.06 5,614.08 8,067.32 27,812.65 15,307.78 6,456.902008 8,987.70 3,217.97 4,810.20 14,387.48 8,859.56 4,434.172009 11,746.11 3,936.33 5,957.43 21,872.50 10,546.44 5,412.882010 13,443.22 3,804.78 6,914.19 23,035.45 10,228.92 5,899.942011 11,955.09 3,159.81 5,898.35 18,434.39 8,455.35 5,572.282012 12,433.53 3,641.07 7,612.39 22,656.92 10,395.18 5,897.812013 13,621.55 4,295.95 9,552.16 23,306.39 16,291.31 6,749.092014 14,632.44 4,272.75 9,805.55 23,605.04 17,450.77 6,566.092015 13,009.95 4,637.06 10,743.01 21,914.40 19,033.71 6,242.322016 15,287.59 4,862.31 11,481.06 22,000.56 19,114.37 7,142.832017 16,209.13 5,312.56 12,917.64 29,919.15 22,764.94 7,687.772018 14,322.86 4,730.69 10,558.96 25,845.70 20,014.77 6,728.132019 17,063.43 5,978.06 13,249.01 28,189.75 23,656.62 7,542.442020 17,433.36 5,551.41 13,718.78 27,231.13 27,444.17 6,460.52
Average 13,792.49 4,570.44 9,192.20 23,345.08 16,452.65 6,334.26Y/Y % Change 2.2% -7.1% 3.5% -3.4% 16.0% -14.3%5-Year CAGR 6.0% 3.7% 5.0% 4.4% 7.6% 0.7%10-Year CAGR 2.6% 3.9% 7.1% 1.7% 10.4% 0.9%
Source: Bloomberg
Local Currency, End of Year

Global Capital Markets
2021 Capital Markets Fact Book Page | 63
Foreign Exchange Rates
Canadian Dollar Euro
Japanese Yen
BritishPound
Nominal Advanced Foreign
Economies Dollar Index
2006 1.134 0.796 116.312 0.542 97.6832007 1.073 0.729 117.762 0.500 92.0712008 1.066 0.679 103.391 0.539 88.4522009 1.141 0.718 93.683 0.639 92.8232010 1.030 0.754 87.782 0.647 90.1342011 0.989 0.718 79.697 0.623 84.8522012 0.999 0.778 79.818 0.631 88.0232013 1.030 0.753 97.597 0.639 90.6492014 1.104 0.752 105.740 0.607 93.4352015 1.279 0.901 121.049 0.654 108.1492016 1.324 0.903 108.657 0.738 109.3602017 1.298 0.885 112.099 0.776 108.9472018 1.296 0.846 110.397 0.748 106.4862019 1.327 0.893 109.019 0.783 110.2582020 1.342 0.876 106.775 0.780 109.110
Average 1.162 0.799 103.318 0.656 98.029Y/Y % Change 1.1% -1.9% -2.1% -0.5% -1.0%5-Year CAGR 1.0% -0.6% -2.5% 3.6% 0.2%10-Year CAGR 2.7% 1.5% 2.0% 1.9% 1.9%
Source: The Federal Reserve
Foreign Currency Units Per U.S. Dollar, Average
Note: Major Currencies Index includes trade-w eighted (goods only) value of the dollar.

Global Capital Markets
2021 Capital Markets Fact Book Page | 64
American Depositary Receipts (ADRs)
Total Sponsored
ADR Programs
Total Unsponsored
ADR Programs
ADR Traded Share
Volume (Billions)
ADR Traded Dollar
Volume ($ Billions)
2006 1,984 N/A 53 1,5002007 2,084 N/A 76 3,0002008 2,157 N/A 118 3,7002009 2,110 1,060 135 2,7002010 2,217 1,116 147 3,5002011 2,289 1,229 175 3,8002012 2,287 1,391 157 2,7902013 2,230 1,532 143 2,5692014 2,152 1,600 159 3,3002015 1,976 1,626 160 3,1002016 1,876 1,516 152 2,9002017 1,652 1,613 136 3,3002018 1,579 1,461 162 4,2802019 1,449 1,497 162 3,5102020 1,442 1,449 250 5,881
Average 1,965.6 1,424.2 145.6 3,322.0Y/Y % Change -0.5% -3.2% 54.3% 67.6%5-Year CAGR -6.1% -2.3% 9.3% 13.7%10-Year CAGR -4.2% 2.6% 5.4% 5.3%
Source: Deutsche BankNote: Trading volume includes both sponsored and unsponsored ADRs global traded amounts.

US Investor Participation
2021 Capital Markets Fact Book Page | 65
US Investor Participation US Holdings of Equities – Market Value
Households Institutions Total Households Institutions2006 9,874.3 14,959.0 24,833.3 2006 39.8% 60.2%2007 9,757.7 16,441.7 26,199.5 2007 37.2% 62.8%2008 5,734.8 10,528.8 16,263.5 2008 35.3% 64.7%2009 7,209.6 13,439.4 20,649.0 2009 34.9% 65.1%2010 8,563.4 15,513.8 24,077.2 2010 35.6% 64.4%2011 8,123.7 15,209.9 23,333.6 2011 34.8% 65.2%2012 9,408.2 17,425.3 26,833.5 2012 35.1% 64.9%2013 12,183.4 22,262.4 34,445.8 2013 35.4% 64.6%2014 13,940.3 24,156.1 38,096.4 2014 36.6% 63.4%2015 13,765.2 23,445.9 37,211.1 2015 37.0% 63.0%2016 15,202.6 24,965.4 40,168.0 2016 37.8% 62.2%2017 17,974.1 29,945.7 47,919.8 2017 37.5% 62.5%2018 16,301.7 27,413.6 43,715.3 2018 37.3% 62.7%2019 20,860.6 33,764.3 54,624.9 2019 38.2% 61.8%2020 25,890.9 39,316.8 65,207.7 2020 39.7% 60.3%
Average 12,986.0 21,919.2 34,905.2 Average 0.4 0.6Y/Y % Change 24.1% 16.4% 19.4% Y/Y Change 1.5% -1.5%5-Year CAGR 13.5% 10.9% 11.9%10-Year CAGR 11.7% 9.7% 10.5%
Source: The Federal Reserve - Financial Accounts of the United States
% of Total$ Billions
Note: Household sector includes nonprofit organizations; includes only directly held equities.

US Investor Participation
2021 Capital Markets Fact Book Page | 66
US Family Holdings of Stock
2001 2004 2007 2010 2013 2016 2019 AverageFamilies with stock holdings, direct or indirect (% of all families)
53.0% 50.3% 53.2% 49.8% 48.8% 51.9% 52.6% 51.4%
Median value of stock held among families (thousands of dollars)
50.5 44.6 42.0 34.2 39.3 42.5 40.0 41.9
Stock held by families(% of total family financial assets)
56.7% 51.3% 53.6% 46.8% 51.3% 53.2% 54.6% 52.5%
Source: The Federal Reserve, 2019 Survey of Consumer FinancesNote: Includes both directly and indirectly held publicly traded stock (i.e. through mutual funds or retirement accounts); 2019 is the latest data available at the time of publication.

US Investor Participation
2021 Capital Markets Fact Book Page | 67
US Household Equity Ownership
$ Billions2006 16,235.32007 16,684.32008 9,746.22009 12,604.52010 14,848.32011 14,062.02012 16,207.82013 21,058.52014 23,361.02015 23,040.72016 24,947.62017 29,649.12018 26,740.52019 34,051.82020 40,883.2
Average 21,608.1Y/Y % Change 20.1%5-Year CAGR 12.2%10-Year CAGR 10.7%
Source: The Federal Reserve - Financial Accounts of the United StatesNote: Household sector includes nonprofit organizations; includes both directly and indirectly held equities (i.e. through mutual funds).
14.116.2
21.123.4 23.0
24.9
29.626.7
34.1
40.9
0
5
10
15
20
25
30
35
40
45
2011 2012 2013 2014 2015 2016 2017 2018 2019 2020
U.S. Household Equity Ownership ($T)

US Investor Participation
2021 Capital Markets Fact Book Page | 68
US Household Liquid Financial Assets - Market Value
Equities
Bank Deposits
& CDs
MutualFund
Shares
U.S. Treasury,
Agency, and GSE
SecuritiesMunicipal
Bonds
Money Market Funds
Corporate Bonds
TotalLiquid
Financial Assets
2006 9,874.3 5,711.4 4,010.3 338.9 1,760.7 1,465.9 884.2 24,045.82007 9,757.7 6,127.1 4,535.9 689.5 1,640.7 1,967.8 1,190.6 25,909.32008 5,734.8 6,643.6 2,917.7 1,384.5 1,525.2 2,285.0 1,359.7 21,850.52009 7,209.6 6,783.1 4,021.7 926.6 1,859.2 1,962.3 1,943.6 24,706.12010 8,563.4 6,920.2 4,701.7 1,259.9 1,915.3 1,657.5 2,061.5 27,079.52011 8,123.7 7,586.6 4,684.4 1,345.7 2,065.4 1,584.8 2,227.8 27,618.42012 9,408.2 8,045.1 5,549.7 1,417.6 2,026.2 1,589.9 2,260.7 30,297.32013 12,183.4 8,429.6 6,598.8 1,030.3 1,848.9 1,591.9 1,656.0 33,338.82014 13,940.3 8,981.9 7,065.1 1,018.6 1,948.1 1,568.0 1,765.4 36,287.32015 13,765.2 9,609.9 6,960.6 1,500.3 1,911.7 1,551.1 1,218.0 36,516.72016 15,202.6 10,195.7 7,308.6 1,481.2 1,887.9 1,558.5 1,037.0 38,671.62017 17,974.1 10,528.8 8,656.9 1,530.5 1,897.8 1,617.9 962.8 43,168.72018 16,301.7 10,870.0 8,005.0 2,241.0 1,868.0 1,799.0 970.5 42,055.22019 20,860.6 11,374.5 10,044.1 2,661.8 1,901.4 2,219.4 1,089.9 50,151.62020 25,890.9 13,694.6 11,223.4 1,968.3 1,920.5 2,595.1 1,228.1 58,520.9
Average 12,986.0 8,766.8 6,418.9 1,386.3 1,865.1 1,800.9 1,457.1 34,681.2Y/Y % Change 24.1% 20.4% 11.7% -26.1% 1.0% 16.9% 12.7% 16.7%5-Year CAGR 13.5% 7.3% 10.0% 5.6% 0.1% 10.8% 0.2% 9.9%10-Year CAGR 11.7% 7.1% 9.1% 4.6% 0.0% 4.6% -5.0% 8.0%
Note: Households include nonprofit organizations. Liquid f inancial assets exclude pension fund reserves, equity in non-corporate business, etc.Source: The Federal Reserve - Financial Accounts of the United States
$ Billions

US Investor Participation
2021 Capital Markets Fact Book Page | 69
US Household Liquid Financial Assets - Share of Total
Equities
Bank Deposits &
CDsMutual Fund
Shares
U.S. Treasury,
Agency, and GSE
SecuritiesMunicipal
Bonds
Money Market Funds
Corporate Bonds
Liquid Financial
Assets2006 41.1% 23.8% 16.7% 1.4% 7.3% 6.1% 3.7% 100%2007 37.7% 23.6% 17.5% 2.7% 6.3% 7.6% 4.6% 100%2008 26.2% 30.4% 13.4% 6.3% 7.0% 10.5% 6.2% 100%2009 29.2% 27.5% 16.3% 3.8% 7.5% 7.9% 7.9% 100%2010 31.6% 25.6% 17.4% 4.7% 7.1% 6.1% 7.6% 100%2011 29.4% 27.5% 17.0% 4.9% 7.5% 5.7% 8.1% 100%2012 31.1% 26.6% 18.3% 4.7% 6.7% 5.2% 7.5% 100%2013 36.5% 25.3% 19.8% 3.1% 5.5% 4.8% 5.0% 100%2014 38.4% 24.8% 19.5% 2.8% 5.4% 4.3% 4.9% 100%2015 37.7% 26.3% 19.1% 4.1% 5.2% 4.2% 3.3% 100%2016 39.3% 26.4% 18.9% 3.8% 4.9% 4.0% 2.7% 100%2017 41.6% 24.4% 20.1% 3.5% 4.4% 3.7% 2.2% 100%2018 38.8% 25.8% 19.0% 5.3% 4.4% 4.3% 2.3% 100%2019 41.6% 22.7% 20.0% 5.3% 3.8% 4.4% 2.2% 100%2020 44.2% 23.4% 19.2% 3.4% 3.3% 4.4% 2.1% 100%
Average 36.3% 25.6% 18.1% 4.0% 5.8% 5.6% 4.7%Y/Y Change 2.6% 0.7% -0.8% -1.9% -0.5% 0.0% -0.1%
Percentage
Note: Households include nonprofit organizations. Liquid f inancial assets exclude pension fund reserves, equity in non-corporate business, etc.Source: The Federal Reserve - Financial Accounts of the United States

US Investor Participation
2021 Capital Markets Fact Book Page | 70
US Holdings of Equities by Type of Holder - Market Value
2015 2016 2017 2018 2019 2020 AverageY/Y %
Change5-Year CAGR
Total US Holdings 37,211.1 40,168.0 47,919.8 43,715.3 54,624.9 65,207.7 48,141.1 19.4% 11.9%Households 13,765.2 15,202.6 17,974.1 16,301.7 20,860.6 25,890.9 18,332.5 24.1% 13.5%Institutions 23,445.8 24,965.4 29,945.7 27,413.6 33,764.3 39,316.8 29,808.6 16.4% 10.9%
Mutual Funds 8,625.3 9,069.9 10,819.6 9,657.5 11,934.5 13,391.1 10,583.0 12.2% 9.2%Foreign 5,500.9 5,782.7 7,019.4 6,629.5 8,199.0 10,519.3 7,275.1 28.3% 13.8%Exchange-Traded Funds 1,709.7 2,032.7 2,775.6 2,669.2 3,486.2 4,233.6 2,817.8 21.4% 19.9%Private Pension Funds 2,220.4 2,329.9 2,713.0 2,448.0 3,135.8 3,477.3 2,720.7 10.9% 9.4%State & Local Gov't Retirement Funds 2,250.0 2,321.5 2,706.8 2,478.6 2,553.9 2,773.8 2,514.1 8.6% 4.3%Nonfinancial corporate business 1,499.9 1,712.9 1,949.3 1,789.9 2,317.7 2,531.0 1,966.8 9.2% 11.0%Life Insurance Companies 545.9 554.8 622.9 538.0 644.6 729.8 606.0 13.2% 6.0%Property Casualty Companies 334.0 354.3 410.6 392.1 493.9 518.6 417.2 5.0% 9.2%Federal Gov't Retirement Funds 240.3 260.8 324.2 292.1 370.7 418.4 317.7 12.9% 11.7%Broker/Dealers 166.8 176.1 182.7 147.7 166.7 214.3 175.7 28.5% 5.1%State & Local Governments 121.5 130.5 151.5 137.7 173.2 201.4 152.6 16.3% 10.6%U.S. Chartered Depository Institutions 97.7 104.0 127.6 109.1 147.7 160.3 124.4 8.6% 10.4%Closed-End Funds 99.8 101.8 109.3 91.2 107.2 105.9 102.5 -1.2% 1.2%Federal Government 33.4 33.3 33.2 33.2 33.2 33.2 33.2 0.0% N/AOther 0.0 0.0 0.0 0.0 0.0 8.8 1.5 N/A N/AMonetary Authority 0.0 0.0 0.0 0.0 0.0 0.0 0.0 N/A N/A
Source: The Federal Reserve - Financial Accounts of the United StatesNote: Households include non-profit organizations. Other contains foreign banking off ices in the U.S. and funding corporations.
$ Billions

US Investor Participation
2021 Capital Markets Fact Book Page | 71
US Holdings of Equities by Type of Holder - Share of Total
2015 2016 2017 2018 2019 2020 Average Y/Y ChangeTotal U.S. Holdings 100% 100% 100% 100% 100% 100%
Households 37.0% 37.8% 37.5% 37.3% 38.2% 39.7% 37.9% 1.5%Institutions 63.0% 62.2% 62.5% 62.7% 61.8% 60.3% 62.1% -1.5%
Mutual Funds 23.2% 22.6% 22.6% 22.1% 21.8% 20.5% 22.1% -1.3%Foreign 14.8% 14.4% 14.6% 15.2% 15.0% 16.1% 15.0% 1.1%Exchange-Traded Funds 4.6% 5.1% 5.8% 6.1% 6.4% 6.5% 5.7% 0.1%Private Pension Funds 6.0% 5.8% 5.7% 5.6% 5.7% 5.3% 5.7% -0.4%State & Local Gov't Retirement Funds 6.0% 5.8% 5.6% 5.7% 4.7% 4.3% 5.3% -0.4%Nonfinancial corporate business 4.0% 4.3% 4.1% 4.1% 4.2% 3.9% 4.1% -0.4%Life Insurance Companies 1.5% 1.4% 1.3% 1.2% 1.2% 1.1% 1.3% -0.1%Property Casualty Companies 0.9% 0.9% 0.9% 0.9% 0.9% 0.8% 0.9% -0.1%Federal Gov't Retirement Funds 0.6% 0.6% 0.7% 0.7% 0.7% 0.6% 0.7% 0.0%Broker/Dealers 0.4% 0.4% 0.4% 0.3% 0.3% 0.3% 0.4% 0.0%State & Local Governments 0.3% 0.3% 0.3% 0.3% 0.3% 0.3% 0.3% 0.0%U.S. Chartered Depository Institutions 0.3% 0.3% 0.3% 0.2% 0.3% 0.2% 0.3% 0.0%Closed-End Funds 0.3% 0.3% 0.2% 0.2% 0.2% 0.2% 0.2% 0.0%Federal Government 0.1% 0.1% 0.1% 0.1% 0.1% 0.1% 0.1% 0.0%Other 0.0% 0.0% 0.0% 0.0% 0.0% 0.0% 0.0% 0.0%Monetary Authority 0.0% 0.0% 0.0% 0.0% 0.0% 0.0% 0.0% 0.0%
Source: The Federal Reserve - Financial Accounts of the United States
Percentage
Note: Households include non-profit organizations. Other contains foreign banking off ices in the U.S. and funding corporations.

US Investor Participation
2021 Capital Markets Fact Book Page | 72
US Net Acquisitions of Corporate Equities by Type of Holder
2015 2016 2017 2018 2019 2020 AverageY/Y %
ChangeTotal Net Issuance -28.5 -218.6 233.3 -247.7 -435.7 630.3 -11.1 -244.7%
Households -26.9 73.9 129.3 -182.3 -134.1 366.9 37.8 -373.7%Institutions 189.8 -106.2 -12.9 -176.3 -96.2 -448.4 -108.4 366.2%
Foreign -191.4 -186.3 116.9 110.9 -205.4 711.8 59.4 -446.5%Mutual Funds 58.1 -111.5 -133.4 -120.6 -219.4 -481.6 -168.1 119.5%Exchange-Traded Funds 173.5 188.4 347.3 210.4 165.9 254.3 223.3 53.3%Nonfinancial corporate business -42.1 66.9 -89.9 -40.7 10.2 -139.4 -39.2 -1467.9%Private Pension Funds -29.3 -113.5 -53.1 -80.0 -8.6 -47.6 -55.3 453.6%Federal Gov't Retirement Funds 0.0 -5.6 6.5 -21.6 -5.0 -24.1 -8.3 384.2%Property Casualty Companies -1.5 2.9 9.8 20.1 -1.8 -22.3 1.2 1143.0%Other 0.0 0.0 0.0 0.0 0.0 8.8 1.5 n/aBroker/Dealers -18.4 -5.4 -26.3 -19.9 -22.8 7.0 -14.3 -130.8%State & Local Gov't Retirement Funds 22.6 -93.5 -61.9 -82.3 -16.1 -6.4 -39.6 -59.9%State & Local Governments -3.4 -3.4 -3.4 -3.4 -3.4 -3.4 -3.4 0.0%U.S. Chartered Depository Institutions 2.0 -6.9 -2.0 2.5 0.8 3.2 -0.1 297.9%Closed-End Funds 1.3 0.1 -0.5 -0.4 2.6 1.9 0.8 -27.8%Life Insurance Companies 27.0 -24.5 -5.9 -44.4 1.3 1.2 -7.5 -8.2%Federal Government 0.0 -0.1 -0.1 4.0 0.0 0.0 0.6 n/aMonetary Authority 0.0 0.0 0.0 0.0 0.0 0.0 0.0 n/a
Source: The Federal Reserve - Financial Accounts of the United States
$ Billions
Note: Households include non-profit organizations. Other contains foreign banking off ices in the U.S. and funding corporations.
Savings & Investment
2021 Capital Markets Fact Book Page | 73
Savings & Investment US Retirement Assets
Private
Life Insurance
Companies
State & Local
GovernmentFederal
Government
Total Pension Assets
IRA Assets
Total Retirement
Assets2006 5,839.1 2,065.8 5,060.8 2,620.8 15,586.5 4,207.0 19,793.52007 6,191.4 2,173.2 5,374.1 2,728.1 16,466.8 4,748.0 21,214.82008 5,331.6 1,938.9 5,507.4 2,769.4 15,547.4 3,681.0 19,228.42009 5,988.2 2,075.3 5,788.7 2,911.3 16,763.5 4,488.0 21,251.52010 6,640.7 2,287.5 6,275.3 3,143.8 18,347.3 5,029.0 23,376.32011 6,774.1 2,286.7 6,443.5 3,243.6 18,747.8 5,153.0 23,900.82012 7,295.8 2,477.2 6,647.2 3,366.8 19,787.0 5,785.0 25,572.02013 8,457.1 2,753.0 7,602.9 3,524.9 22,337.9 6,819.0 29,156.92014 8,756.4 2,869.0 7,930.3 3,612.5 23,168.2 7,292.0 30,460.22015 8,686.0 2,908.5 8,195.1 3,709.3 23,498.9 7,477.0 30,975.92016 9,110.1 3,003.1 8,468.4 3,794.9 24,376.4 8,015.0 32,391.42017 10,056.7 3,221.6 8,790.1 3,907.2 25,975.6 9,439.0 35,414.62018 9,720.7 3,175.0 9,001.9 3,976.6 25,874.2 9,135.0 35,009.22019 10,915.8 3,485.9 9,327.7 4,134.6 27,864.0 10,850.0 38,714.02020 11,871.4 3,809.4 9,642.1 4,309.2 29,632.0 12,210.0 41,842.0
Average 8,109.0 2,702.0 7,337.0 3,450.2 21,598.2 6,955.2 28,553.4Y/Y % Change 8.8% 9.3% 3.4% 4.2% 6.3% 12.5% 8.1%5-Year CAGR 6.4% 5.5% 3.3% 3.0% 4.7% 10.3% 6.2%10-Year CAGR 6.0% 5.2% 4.4% 3.2% 4.9% 9.3% 6.0%
Note: Private include deferred benefit and deferred contribution plans; Includes claims of pension funds on sponsor (i.e., unfunded defined benefit pension entitlements); Life Insurance Companies are the annuity reserves held by life insurance companies.
$ Billions
Source: The Federal Reserve - Financial Accounts of the United States

Savings & Investment
2021 Capital Markets Fact Book Page | 74
US Private Pension Funds Assets
Defined Benefit
Defined Contribution Total
2006 2,402.0 3,437.1 5,839.12007 2,529.1 3,662.2 6,191.42008 2,608.2 2,723.3 5,331.62009 2,652.9 3,335.4 5,988.22010 2,872.2 3,768.4 6,640.72011 2,983.8 3,790.3 6,774.12012 3,055.4 4,240.4 7,295.82013 3,451.3 5,005.8 8,457.12014 3,463.6 5,292.9 8,756.42015 3,436.3 5,249.7 8,686.02016 3,469.5 5,640.6 9,110.12017 3,516.0 6,540.6 10,056.72018 3,520.6 6,200.1 9,720.72019 3,534.7 7,381.1 10,915.82020 3,534.3 8,337.1 11,871.4
Average 3,135.3 4,973.7 8,109.0Y/Y % Change 0.0% 13.0% 8.8%5-Year CAGR 0.6% 9.7% 6.4%10-Year CAGR 2.1% 8.3% 6.0%
Note: Includes claims of pension funds on sponsor (i.e., unfunded defined benefit pension entitlements).
$ Billions
Source: The Federal Reserve - Financial Accounts of the United States

Savings & Investment
2021 Capital Markets Fact Book Page | 75
US Private Pension Fund Assets Investment Mix
Equity BondsMutual Funds
Cash Items
Claims on Pension
Fund Sponsor
Other Assets
Total Assets
2006 1,976.3 643.4 2,003.5 237.9 -16.2 956.6 5,801.42007 2,041.0 690.3 2,174.1 255.3 -28.3 1,024.6 6,157.12008 1,275.0 673.1 1,480.2 244.1 687.7 936.2 5,296.32009 1,504.4 722.8 1,955.3 236.8 466.2 1,066.3 5,951.82010 1,778.1 829.1 2,220.2 226.1 437.5 1,113.2 6,604.12011 1,680.4 915.0 2,200.0 252.6 497.9 1,191.5 6,737.52012 1,890.7 1,049.5 2,481.5 225.2 377.9 1,234.4 7,259.22013 2,243.8 1,045.5 3,006.9 248.0 592.0 1,284.5 8,420.62014 2,284.3 1,166.5 3,190.2 256.6 504.1 1,318.2 8,719.92015 2,220.4 1,136.2 3,127.9 248.0 609.0 1,307.9 8,649.42016 2,329.9 1,192.5 3,352.8 248.4 582.3 1,367.4 9,073.42017 2,713.0 1,348.3 3,886.7 261.5 326.7 1,483.9 10,020.12018 2,448.0 1,378.5 3,594.6 245.2 590.0 1,427.8 9,684.12019 3,135.8 1,570.4 4,238.5 246.4 175.7 1,512.4 10,879.32020 3,477.3 1,792.1 4,603.7 246.5 147.1 1,568.1 11,834.9
Average 2,199.9 1,076.9 2,901.1 245.2 396.6 1,252.9 8,072.6Y/Y % Change 10.9% 14.1% 8.6% 0.0% -16.3% 3.7% 8.8%5-Year CAGR 9.4% 9.5% 8.0% -0.1% -24.7% 3.7% 6.5%10-Year CAGR 6.9% 8.0% 7.6% 0.9% -10.3% 3.5% 6.0%
Note: Bonds includes Treasuries, Agency & GSE-backed securities, and corporate & foreign bonds; Cash Items include checkable deposits and currency, time and savings deposits, money market mutual fund shares, and repo and revese repo agreements, and commercial paper; Total Assets include total liabilities of pension entitlements.
Source: The Federal Reserve - Financial Accounts of the United
$ Billions

Savings & Investment
2021 Capital Markets Fact Book Page | 76
US Defined Benefit Plan Asset Investment Mix
Equity BondsMutual Funds
Cash Items
Claims on Pension
Fund Sponsor
Other Assets
Total Assets
2006 1,150.7 500.1 313.2 127.2 -16.2 289.3 2,364.32007 1,209.3 536.3 332.6 136.0 -28.3 309.0 2,494.92008 726.1 480.8 258.5 102.2 687.7 317.6 2,572.92009 863.8 517.9 321.9 106.7 466.2 339.9 2,616.42010 1,010.7 577.8 348.1 102.8 437.5 358.9 2,835.72011 929.5 665.9 356.3 106.5 497.9 391.1 2,947.22012 1,048.0 746.6 359.3 94.2 377.9 392.9 3,018.82013 1,165.0 750.5 407.9 109.6 592.0 389.9 3,414.82014 1,137.9 835.5 425.6 118.3 504.1 405.6 3,427.02015 1,086.9 804.6 382.9 105.9 609.0 410.5 3,399.72016 1,099.1 829.5 385.1 102.5 582.3 434.4 3,432.92017 1,210.9 946.7 411.5 115.3 326.7 468.4 3,479.52018 1,055.5 972.1 344.9 96.8 590.0 424.7 3,484.02019 1,316.4 1,087.4 394.4 95.5 175.7 428.7 3,498.22020 1,268.4 1,202.6 364.0 92.0 147.1 423.6 3,497.7
Average 1,085.2 763.6 360.4 107.4 396.6 385.6 3,098.9Y/Y % Change -3.7% 10.6% -7.7% -3.7% -16.3% -1.2% 0.0%5-Year CAGR 3.1% 8.4% -1.0% -2.8% -24.7% 0.6% 0.6%10-Year CAGR 2.3% 7.6% 0.4% -1.1% -10.3% 1.7% 2.1%
Note: Bonds includes Treasuries, Agency & GSE-backed securities, and corporate & foreign bonds; Cash Items include checkable deposits and currency, time and savings deposits, money market mutual fund shares, and repo and revese repo agreements, and commercial paper; Total Assets include total liabilities of pension entitlements.
Source: The Federal Reserve - Financial Accounts of the United
$ Billions

Savings & Investment
2021 Capital Markets Fact Book Page | 77
US Defined Contribution Plan Asset Investment Mix
Equity BondsMutual Funds
Cash Items
Other Assets
Total Assets
2006 825.6 143.3 1,690.3 110.6 667.2 3,437.12007 831.7 154.0 1,841.5 119.3 715.6 3,662.22008 548.9 192.3 1,221.7 141.9 618.6 2,723.32009 640.6 205.0 1,633.4 130.1 726.3 3,335.42010 767.4 251.4 1,872.0 123.3 754.3 3,768.42011 750.9 249.2 1,843.7 146.1 800.4 3,790.32012 842.7 302.9 2,122.2 131.0 841.5 4,240.42013 1,078.8 295.0 2,598.9 138.4 894.6 5,005.82014 1,146.4 331.0 2,764.6 138.3 912.6 5,292.92015 1,133.5 331.7 2,745.0 142.1 897.4 5,249.72016 1,230.8 363.0 2,967.7 145.9 933.0 5,640.62017 1,502.1 401.6 3,475.2 146.2 1,015.5 6,540.62018 1,392.5 406.4 3,249.7 148.5 1,003.1 6,200.12019 1,819.3 483.0 3,844.1 150.9 1,083.7 7,381.12020 2,209 589 4,240 155 1,145 8,337
Average 1,114.7 313.3 2,540.7 137.8 867.2 4,973.7Y/Y % Change 21.4% 22.0% 10.3% 2.4% 5.6% 13.0%5-Year CAGR 14.3% 12.2% 9.1% 1.7% 5.0% 9.7%10-Year CAGR 11.2% 8.9% 8.5% 2.3% 4.3% 8.3%
$ Billions
Note: Bonds include Treasuries, agency & GSE-backed securities, and corporate and foreign bonds; cash items include checkable deposits and currency, time and savings deposits, money market mutual fund shares, repo and reverse repo agreements, and commercial paper.
Source: The Federal Reserve - Financial Accounts of the United States

Savings & Investment
2021 Capital Markets Fact Book Page | 78
US Individual Retirement Account (IRA) Assets
Mutual Funds
Bank and Thrift
Deposits
Life Insurance
CompaniesOther Assets
Total IRAAssets
2006 2,142 313 299 1,454 4,2072007 2,435 340 303 1,670 4,7482008 1,692 391 295 1,303 3,6812009 2,114 431 291 1,652 4,4882010 2,418 461 313 1,837 5,0292011 2,409 482 308 1,954 5,1532012 2,752 508 323 2,201 5,7852013 3,322 508 351 2,639 6,8192014 3,524 506 368 2,894 7,2922015 3,493 523 383 3,078 7,4772016 3,708 561 397 3,350 8,0152017 4,279 548 417 4,196 9,4392018 3,994 568 430 4,143 9,1352019 4,820 558 465 5,008 10,8502020 5,455 685 519 5,550 12,210
Average 3,237 492 364 2,862 6,955Y/Y % Change 13.2% 22.8% 11.6% 10.8% 12.5%5-Year CAGR 9.3% 5.5% 6.3% 12.5% 10.3%10-Year CAGR 8.5% 4.0% 5.2% 11.7% 9.3%
$ Billions
Source: Investment Company InstituteNote: Bank and thrif t deposits include Keogh deposits; 2019 and 2020 data are estimates.

Savings & Investment
2021 Capital Markets Fact Book Page | 79
US Individual Retirement Account (IRA) Assets
$ Billions2006 2,7732007 2,9752008 2,2032009 2,7182010 3,1192011 3,1122012 3,4952013 4,1482014 4,4062015 4,3772016 4,7412017 5,4862018 5,2072019 6,1502020 6,725
Average 4,109Y/Y % Change 9.3%5-Year CAGR 9.0%10-Year CAGR 8.0%
Source: Investment Company Institute
3.13.5
4.14.4 4.4
4.7
5.55.2
6.26.7
0
1
2
3
4
5
6
7
2011 2012 2013 2014 2015 2016 2017 2018 2019 2020
Total 401(K) Plan Assets ($T)

Savings & Investment
2021 Capital Markets Fact Book Page | 80
Household Saving Rates of Major Nations
U.S. Canada France Germany Japan U.K.2006 3.8% 2.6% 9.0% 10.6% 2.7% 3.1%2007 3.7% 2.2% 9.4% 10.7% 2.8% 4.4%2008 5.0% 3.3% 9.3% 10.9% 2.7% 3.3%2009 6.1% 4.5% 10.6% 10.4% 4.2% 6.4%2010 6.5% 4.3% 10.5% 10.3% 3.9% 6.9%2011 7.2% 4.2% 9.9% 10.0% 4.2% 4.5%2012 8.9% 4.7% 10.0% 9.7% 2.9% 3.9%2013 6.4% 4.7% 8.5% 9.3% 0.6% 3.1%2014 7.4% 3.5% 8.9% 9.8% 0.1% 3.6%2015 7.5% 4.1% 8.3% 10.1% 1.4% 4.9%2016 6.9% 1.6% 8.2% 10.2% 3.3% 2.2%2017 7.2% 1.9% 8.4% 10.6% 2.6% 0.0%2018 7.8% 0.7% 8.6% 10.9% 4.3% 0.3%2019 7.5% 1.2% 9.1% 10.9% 5.3% 0.7%2020 16.4% 14.3% 20.6% 16.2% 7.1% 19.4%
Average 7.2% 3.9% 10.0% 10.7% 3.2% 4.5%Y/Y Change 8.9% 13.0% 11.5% 5.4% 1.8% 18.7%
Percentage of Disposable Household Income
Source: OECD Database, OECD Economic OutlookNote: Net savings rate; actual data in black, forecast in grey.

Savings & Investment
2021 Capital Markets Fact Book Page | 81
US Economic Indicators
CPI (% Change)
Civilian Unemployment
Rate (%)
Personal Savings
Rate (% of Disposable
Income)Nominal GDP
($ Billions)
Real GDP (2012 $ Billions)
Real GDP (% Change)
2006 2.5% 4.6% 3.8% 13,814.6 15,338.3 2.9%2007 4.1% 4.6% 3.7% 14,451.9 15,626.0 1.9%2008 0.1% 5.8% 5.0% 14,712.8 15,604.7 -0.1%2009 2.7% 9.3% 6.1% 14,448.9 15,208.8 -2.5%2010 1.5% 9.6% 6.5% 14,992.1 15,598.8 2.6%2011 3.0% 9.0% 7.2% 15,542.6 15,840.7 1.6%2012 1.7% 8.1% 8.9% 16,197.0 16,197.0 2.2%2013 1.5% 7.4% 6.4% 16,784.9 16,495.4 1.8%2014 0.8% 6.2% 7.4% 17,527.3 16,912.0 2.5%2015 0.7% 5.3% 7.5% 18,238.3 17,432.2 3.1%2016 2.1% 4.9% 6.9% 18,745.1 17,730.5 1.7%2017 2.1% 4.4% 7.2% 19,543.0 18,144.1 2.3%2018 1.9% 3.9% 7.8% 20,611.9 18,687.8 3.0%2019 2.3% 3.7% 7.5% 21,433.2 19,091.7 2.2%2020 1.4% 8.1% 16.4% 20,936.6 18,426.1 -3.5%
Average 1.9% 6.3% 7.2% 17,198.7 16,822.3 1.4%Y/Y % Change -0.9% 4.4% 8.9% -2.3% -3.5% -5.7%5-Year CAGR 2.8% 1.1%10-Year CAGR 3.4% 1.7%
Sources: U.S. Bureau of Economic Analysis; U.S. Department of LaborNote: CPI and Unemployment Rate are not seasonally adjusted.

Savings & Investment
2021 Capital Markets Fact Book Page | 82
US Federal Receipts, Outlays, Deficit and Debt
GDP Receipts OutlaysSurplus/ (Deficit) Total Debt
Debt Held by Public
2006 13,638.4 2,406.9 2,655.1 -248.2 8,451.4 4,829.02007 14,290.8 2,568.0 2,728.7 -160.7 8,950.7 5,035.12008 14,743.3 2,524.0 2,982.5 -458.6 9,986.1 5,803.12009 14,431.8 2,105.0 3,517.7 -1,412.7 11,875.9 7,544.72010 14,838.8 2,162.7 3,457.1 -1,294.4 13,528.8 9,018.92011 15,403.7 2,303.5 3,603.1 -1,299.6 14,764.2 10,128.22012 16,056.4 2,450.0 3,537.0 -1,087.0 16,050.9 11,281.12013 16,603.8 2,775.1 3,454.6 -679.5 16,719.4 11,982.72014 17,335.6 3,021.5 3,506.1 -484.6 17,794.5 12,779.92015 18,099.6 3,249.9 3,688.4 -438.5 18,120.1 13,116.72016 18,554.8 3,268.0 3,852.6 -584.7 19,539.5 14,167.62017 19,287.6 3,316.2 3,981.6 -665.4 20,205.7 14,665.42018 20,335.5 3,329.9 4,109.0 -779.1 21,462.3 15,749.62019 21,215.7 3,464.2 4,448.3 -984.2 22,669.5 16,800.72020 22,210.9 3,420.0 6,551.9 -3,131.9 26,901.1 21,019.1
Average 17,136.4 2,824.3 3,738.3 -913.9 16,468.0 11,594.8Y/Y % Change 4.7% -1.3% 47.3% 218.2% 18.7% 25.1%5-Year CAGR 4.2% 1.0% 12.2% 48.2% 8.2% 9.9%10-Year CAGR 4.1% 4.7% 6.6% 9.2% 7.1% 8.8%
$ Billions
Source: Economic Report of the PresidentNote: Fiscal year data; 2020 data are estimates.

Securities Industry
2021 Capital Markets Fact Book Page | 83
Securities Industry FINRA-Registered Broker-Dealers Financial Results
Revenues ExpensesPre-Tax Net
IncomeNumber of Firms (#)
2006 436.8 403.7 33.1 5,0262007 474.2 473.4 0.8 5,0022008 290.5 324.7 -34.1 4,8962009 278.9 207.3 71.7 4,7172010 254.8 220.0 34.8 4,5772011 238.9 224.7 14.2 4,4552012 256.9 224.9 32.1 4,2892013 264.5 238.2 26.3 4,1462014 275.0 247.9 27.0 4,0682015 270.0 247.4 22.6 3,9432016 271.5 246.2 25.3 3,8352017 305.7 268.6 37.1 3,7262018 361.1 318.3 42.8 3,6072019 388.2 344.2 43.9 3,5172020 362.0 284.8 77.2 3,435
Average 315.3 285.0 30.3 4,215.9Y/Y % Change -6.7% -17.3% 75.7% -2.3%5-Year CAGR 6.0% 2.8% 27.9% -2.7%10-Year CAGR 3.6% 2.6% 8.3% -2.8%
Sources: FINRA
$ Billions
Note: Based on Financial and Operational Combined Uniform Single (FOCUS) Reports.

Securities Industry
2021 Capital Markets Fact Book Page | 84
FINRA-Registered Firms and Registered Representative - Charts
4,455 4,289 4,146 4,068 3,943 3,835 3,726 3,607 3,517 3,435
0
500
1,000
1,500
2,000
2,500
3,000
3,500
4,000
4,500
5,000
2011 2012 2013 2014 2015 2016 2017 2018 2019 2020
# of Broker-Dealers
627.1 627.5 627.5
636.2639.4
635.6
630.3 629.5
624.7
617.5
605
610
615
620
625
630
635
640
645
2011 2012 2013 2014 2015 2016 2017 2018 2019 2020
# of Registered Representatives (thousands)
Source: FINRANote: Financial & Operational Combined Uniform Single (FOCUS) reports for all FINRA registered broker-dealers doing business in the US; BD = broker-dealer; RR = registered representative; branches = branch off ices.

Securities Industry
2021 Capital Markets Fact Book Page | 85
NYSE Member Firms Aggregate Financial Results
Total Revenues
Pre-Tax Profits
Pre-Tax Profit
MarginPre-Tax
ROE 2006 331,335.7 20,893.6 6.3% 19.0%2007 352,048.4 -11,302.3 -3.2% -10.4%2008 178,068.0 -42,587.4 -23.9% -37.9%2009 185,267.3 58,575.8 31.6% 40.3%2010 159,766.6 25,092.1 15.7% 15.3%2011 147,282.7 7,746.7 5.3% 5.0%2012 161,456.0 23,878.0 14.8% 14.0%2013 162,359.0 16,719.0 10.3% 9.5%2014 164,628.0 15,965.0 9.7% 9.1%2015 161,886.0 14,288.0 8.8% 8.2%2016 166,653.0 17,295.0 10.4% 10.1%2017 189,702.0 24,526.0 12.9% 13.6%2018 228,091.0 27,308.0 12.0% 15.1%2019 250,379.0 28,086.0 11.2% 13.8%2020 219,324.0 50,894.0 23.2% 22.9%
Average 203,883.1 18,491.8 9.7% 9.8%Y/Y % Change -12.4% 81.2% 12.0% 9.1%5-Year CAGR 6.3% 28.9%10-Year CAGR 3.2% 7.3%
$ Millions Percentage
Sources: Intercontinental Exchange (ICE), SIFMA DataBank

Securities Industry
2021 Capital Markets Fact Book Page | 86
NYSE Member Firms Aggregate Total Capital and Equity Capital - Charts
268 280 282 286 283 281 292 306 317348
0
50
100
150
200
250
300
350
400
2011 2012 2013 2014 2015 2016 2017 2018 2019 2020
NYSE-Reporting Broker-Dealers Total Capital ($B)
155170 176 176 174 172
181 181
204223
0
50
100
150
200
250
2011 2012 2013 2014 2015 2016 2017 2018 2019 2020
NYSE-Reporting Broker-Dealers Equity Capital ($B)
Sources: Intercontinental Exchange (ICE), SIFMA DataBank

Securities Industry
2021 Capital Markets Fact Book Page | 87
US Securities Industry Employment
United States
New York State
New York City
2006 885.5 206.9 185.22007 909.4 214.6 191.82008 907.8 204.4 182.82009 854.2 187 165.32010 852.7 192.1 169.82011 862.7 192.8 171.62012 858.1 188.6 167.92013 872.6 189.2 168.22014 892.3 193.4 171.32015 923.6 198.3 176.52016 931.4 198.1 176.62017 944.9 201.4 179.02018 962.2 202.7 182.62019 967.3 203.6 183.32020 975.6 197.2 177.2
Average 906.7 198.0 176.6Y/Y % Change 0.9% -3.1% -3.3%5-Year CAGR 1.1% -0.1% 0.1%10-Year CAGR 1.4% 0.3% 0.4%
Thousands
Note: Data as of year-end, not seasonally adjusted, based on North American Industry Classif ication System (NAICS) code 523; nationw ide data is based on Securities, commodity contracts, investments, and funds and trusts industry w hile state and city data is based on Financial investments and related activities including f inancial vehicles industry.
Sources: U.S. Department of Labor, Bureau of Labor Statistics

Securities Industry
2021 Capital Markets Fact Book Page | 88
US Investment Banking Net Revenues by Product - Charts
0
5
10
15
20
25
30
35
40
45
50
2011 2012 2013 2014 2015 2016 2017 2018 2019 2020
U.S. Investment Banking Fees ($B)M&A DCM Syndicated Lending ECM
27 30 23 30 37 37 35 39 3728
2029
2423
25 24 25 19 2629
3424
31 2620 26 25 26 21
13
18 17 22 21 18 13 15 16 1629
0%
10%
20%
30%
40%
50%
60%
70%
80%
90%
100%
2011 2012 2013 2014 2015 2016 2017 2018 2019 2020
U.S. Investment Banking Fees (% of Total)M&A DCM Syndicated Lending ECM
Source: Dealogic Investment Banking Revenue AnalyticsNote: Includes M&A, debt capital markets, equity capital markets, and syndicated lending net revenues.

Securities Industry
2021 Capital Markets Fact Book Page | 89
FINRA-Registered Broker-Dealers by State - Map
Source: Discovery DataNote: Based on main off ice location. Totals differ from FINRA-reported data due to data source.

Securities Industry
2021 Capital Markets Fact Book Page | 90
FINRA-Registered Representatives by State - Map
Source: Discovery DataNote: Based on main off ice location. Totals differ from FINRA-reported data due to data source.

Securities Industry
2021 Capital Markets Fact Book Page | 91
SEC- and State-Registered Investment Advisors by State - Map
Source: Discovery DataNote: Based on main off ice location. Totals differ from FINRA-reported data due to data source.

Authors
2020 Capital Markets Fact Book Page | 92
Authors SIFMA Research Katie Kolchin, CFA, Director of Research Justyna Podziemska Ali Mostafa [email protected]