Embed Size (px)
Citation preview
Center for Economic Researchwww.CochiseEconomy.com
ECONOMIC OUTLOOK SIERRA VISTA 2016
C

COCHISE COLLEGE
PLATINUM SPONSOR
Castle & Cooke Arizona, Inc.
SILVER SPONSORS
GOLD SPONSORS

Table of Contents
1 REVIEW OF THE NATIONAL, STATE,AND LOCAL ECONOMYby Dr. Robert Carreira, Chief Economist, Center for Economic Research
3 APPLAUDING PARTNERSHIPS by Charles P. Potucek, Sierra Vista City Manager
4 CITY OF SIERRA VISTA
6 ECONOMIC DEVELOPMENT
12 EDUCATION
15 HEALTHCARE
16 POPULATION & DEMOGRAPHICS
18 EMPLOYMENT
22 COMMERCE
25 REAL ESTATE
29 BANKING & FINANCIAL SERVICES
30 MEXICO
32 FORT HUACHUCA
33 AGRICULTURE
35 TOURISM & QUALITY OF LIFE
38 RENEWABLE ENERGY & THE ENVIRONMENT
39 COMMUNITY RESOURCES
40 ABOUT THE CER
COV ERCITY OF SIERRA VISTA
CO CH I S E C O L L E G E P R I N T S E RV I C E SKEITH RINGEY, COORDINATOR
SierraD E S I G N & P U B L I S H I N G
BRONZE SPONSOR
MEDIA SPONSORS
www.sierrapub.com
S I E R R A V I S T A E C O N O M I C O U T L O O K • 2 0 1 6 1
In 2015, the national economy added 2.7 million jobs (down from 3 million in2014). The national unemployment rate in 2015 was 5.3 percent (down from 6.2percent in 2014). The seasonally adjusted monthly unemployment rate in January 2016was 4.9 percent (down from 5.7 percent in January 2015).
The nation’s Gross Domestic Product (the broadest measure of economic activityadding up the value of all goods and services produced in the economy) was up 2.4percent in 2015—the same level as in 2014 and the sixth consecutive year of growthfollowing the end of the recession in 2009.
Building permits for new single-family homes nationwide were up 14 percent in2015, the fourth consecutive year of growth following declines in five of six years.According to data from National Association of Realtors, existing single-family homesales by realtors nationwide were up 6.5 percent in 2015. The median home pricenationwide in 2015 was $222,400 (up 6.8 percent from 2014).
Arizona
Arizona gained 62,100 jobs in 2015 for job growth of 2.4 percent. Job creation was exclusively in theprivate sector, which grew by 2.9 percent. Government jobs statewide fell by 100 (less than one-tenth of apercent). In 2015, the statewide unemployment rate was 6.1 percent (down from 6.8 percent in 2014). Theseasonally adjusted monthly rate in December 2015 was 5.8 percent (down from 6.8 percent in December theyear prior). Arizona’s GDP grew 1.4 percent in 2014 (26th in the nation). (GDP data for Arizona for 2015 wasnot yet available at the time of this publication.)
Inflation-adjusted retail sales statewide were up 8.8 percent in 2015. Arizona’s restaurant and bar saleswere up 5.1 percent in 2015, while accommodation receipts (hotel, motel, RV park, and other temporarylodging stays of less than 30 days) were up 12.2 percent.
Building permits for new single-family homes statewide were up 31.2 percent in 2015 (on the heels ofan 8.4 percent decline in 2014). New home construction was up in three of four years from 2012 to 2015,following six consecutive years of decline. According to data from Arizona Regional Multiple ListingService, residential home sales by realtors in Arizona were up 10.3 percent in 2015 (following a 10.9 percentdrop in 2014). The year 2015 was the first year of growth following three consecutive years of decline. Themedian price statewide for a single-family home in January 2016 was $210,000 (up 7.9 percent fromJanuary 2015).
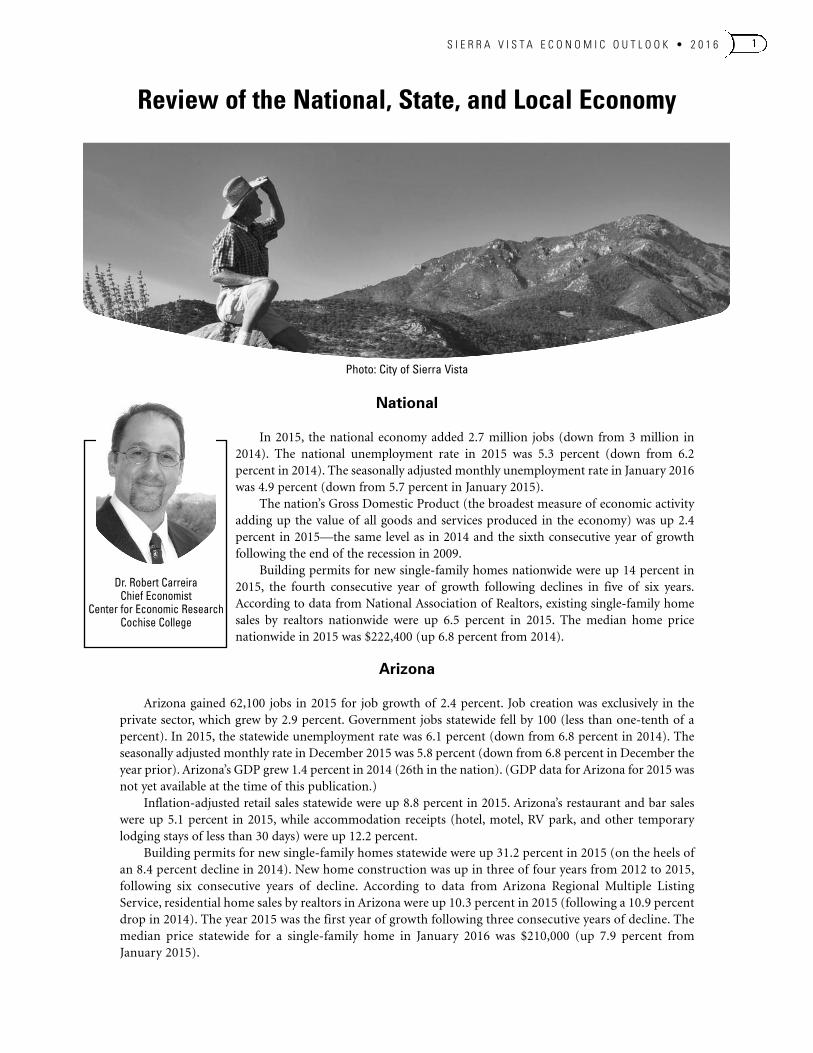
Review of the National, State, and Local Economy
Dr. Robert CarreiraChief Economist
Center for Economic ResearchCochise College
National
Photo: City of Sierra Vista
S I E R R A V I S T A E C O N O M I C O U T L O O K • 2 0 1 62
Cochise County
Cochise County lost 200 jobs in 2015 for annual job growth of -0.6 percent. All of the job losses were inthe government sector, which declined by 1.7 percent. The county’s private sector saw job numbers stabilizein 2015. The year 2015 was the seventh consecutive year of job losses in Cochise County.
Cochise County’s annual unemployment rate in 2015 was 7.4 percent (down from 8.4 percent in 2014).The seasonally adjusted monthly rate in December 2015 was 6.8 percent (down from 8.0 percent inDecember 2014). The decline in Cochise County’s unemployment rate has been due to population declinesand a shrinking labor force, not job growth.
Cochise County’s GDP grew by 0.1 and 2.7 percent, respectively, in 2008 and 2009—the years the stateand national economies were in the Great Recession. In 2010, the county saw GDP growth of 3.0 percent.Cochise County’s economy slipped into recession in 2011, with a drop in GDP of 1.2 percent. Thecountywide recession continued with GDP declines of 5.5, 4.8, and 2.8 percent in 2012, 2013, and 2014,respectively. (GDP data for Cochise County for 2015 was not available at the time of this publication.)
Retail sales countywide were up 2.4 percent in 2015. Cochise County’s restaurant and bar sales were up3.9 percent in 2015, while accommodation sales were up 8.2 percent.
New residential construction in Cochise County was up 12.6 percent in 2014—the first year of growthfollowing eight consecutive years of decline. There were 179 new home permits issued countywide in 2014(up from a record low of 159 in 2013, with records back to 1990). Countywide construction data for 2015were not yet available at the time of this publication; however, numbers from Sierra Vista, the largest share ofthe countywide market, suggest a considerable decline at the county level for 2015. In Sierra Vista, new homepermits fell by nearly half from 2014 to 2015.
There were 1,291 site-built homes sold by realtors in Cochise County in 2015 (up 12.8 percent from2014). Sales were up in five of seven years from 2009 through 2015, following three consecutive years ofdouble-digit declines. The median price in 2015 was $137,200 (up 3.9 percent from the year prior). Themedian price increase in 2015 follows seven consecutive years of price declines. In 2015, foreclosuresaccounted for 18.7 percent of sales (down from 24.8 percent in 2014 and the lowest level since 2009).
Sierra Vista
Sierra Vista’s annual unemployment rate in 2015 was 6.3 percent (down from 7.1 percent in 2014). InDecember 2015, the city’s seasonally adjusted monthly unemployment rate was 5.7 percent (down from 6.7percent in December 2014).
Retail sales in Sierra Vista were up 4.9 percent in 2015. Sierra Vista’s restaurant and bar sales were up 7.3percent in 2015, while the city’s accommodation sales were up 20.4 percent.
New residential construction in Sierra Vista was down 46.4 percent in 2015 (following an 80-percentincrease the year prior). There were 59 new home permits issued in Sierra Vista in 2015 (the lowest level since1981 and the second lowest on record, with records back to 1972).
There were 878 site-built homes sold by realtors in Sierra Vista in 2015 (up 12.7 percent from 2014). Themedian price was $148,500 (up 0.6 percent). In 2015, foreclosures accounted for 17.7 percent of Sierra Vistahome sales (down from 24.6 percent in 2014 and the lowest level since 2009).
Retail sales in Sierra Vistawere up 4.9% in 2015…restaurant and bar saleswere up 7.3%…while thecity’s accommodationsales were up 20.4%.
• Hiring a consultant to promote the visibility ofFort Huachuca with elected officials andPentagon decision makers
• Developing and implementing acomprehensive economic developmentstrategy that focuses on communityinvolvement
• Initiating business retention programsincluding business walks and businessrecognitions by city council and mayor’sbusiness visitations—all focusing onimproving communication between SierraVista’s businesses and those that providebusiness services
• Development of the Retire in Sierra VistaProgram (RSVP)—a citizen-initiated entityfocusing on increasing our younger-seniorpopulation through a visitation program
• Continued maturity of the Southeast ArizonaHospitality Association (SEAHA) to promotetourism in Sierra Vista, working closely withcity staff to develop a consistent marketingmessage and enhance services to visitors
• Finalization of the Sierra Vista brand, whichhas been embraced by, and incorporated into,our community
On behalf of the city council and city team members, I personally want to thank all of those who havedonated their time, opened their minds to new possibilities, and have shown a commitmentto making Sierra Vista a better community for our residents, visitors, and businesses.
While there will always be additional work to be done, we have had substantialachievements this year.
In April, the new Canyon Vista Medical Center was completed, significantlyimproving healthcare service to the region. The corporate parent, RegionalCareHospital Partners, has committed more than $100 million to improvehealthcare infrastructure for the region and the military. The new 100-bedfacility offers increased services, reducing the need to travel to Tucson forprimary and trauma care.
Through a generous donation by the Legacy Foundation of SoutheastArizona, the former 93,000-square-foot hospital has been donated to CochiseCollege for their new Downtown Center that will house the nursing school and theculinary arts programs along with business services such as the Small Business DevelopmentCenter, Center for Lifelong Learning, Center for Economic Research, and Arizona@Work, among others. The$14 million construction improvements are slated to be done in third quarter 2016.
In August 2015, the city completed a year-long branding effort with the launch of the new mark andstrapline: Extraordinary Skies, Uncommon Ground. The launch included a selfie contest incorporating thebrand, where more than 100 people submitted selfies on Facebook with about 4,000 votes placed to determinethe winner of the best photo. The brand has united the city allowing businesses and residents to embrace thestrapline while also allowing flexibility for them to change it to reflect their own marketing message.
S I E R R A V I S T A E C O N O M I C O U T L O O K • 2 0 1 6 3
This year, the city is applauding our partnerships: partnerships with ourcommunity members, local and regional organizations, and statewide entities.These partnerships have brought together a cohesiveness that has enabled us toachieve more together than we would have alone. Additionally, partnershipshave assisted in reducing duplication and have allowed the vision of our futurecommunity to become clarified. Some of the highlights include:
Applauding Partnerships
Charles P. PotucekCity Manager
City of Sierra Vista
“While therewill always be
additional work to bedone, we have had
substantialachievementsthis year.”
S I E R R A V I S T A E C O N O M I C O U T L O O K • 2 0 1 64
COST OF LIVING INDEX
The Cost of Living Index, published by Council for Community and Economic Research,compares costs of more than 250 participating areas in all 50 states. The average forall participating places nationwide equals 100 and each participant’s index is read asa percentage of the average for all places.
Sierra Vista, the largest city in Cochise County, is at an elevation of 4,623 feet located along State Routes90 and 92 approximately 75 miles southeast of Tucson, 190 miles southeast of Phoenix, 30 miles south ofInterstate 10, and 35 miles north of the Mexican border. The founding of the city arose from theestablishment of Fort Huachuca. Early ranchers, homesteaders, and business entrepreneurs settled and builtaround the army encampment in the late 1800s and Sierra Vista was eventually incorporated in 1956. In 1971,Fort Huachuca was annexed into the city. In addition to Fort Huachuca, the Sierra Vista area is home toseveral other government agencies including U.S. Forest Service, Bureau of Land Management, and Customsand Border Protection. Nearby cities include tourist destinations Tombstone and Bisbee.
City of Sierra Vista
COST OF LIVING
SIERRA VISTA- PRESCOTT-DOUGLAS BULLHEAD LAKE PRESCOTTMSA* TUCSON PHOENIX FLAGSTAFF CITY HAVASU VALLEY YUMA
2011 99.6 95.0 96.5 113.3 N/A 108.9 103.7 103.5
2012 102.5 95.5 96.8 111.6 91.9 104.3 98.6 105.2
2013 98.0 95.6 96.0 113.3 93.4 103.1 98.1 104.2
2014 97.3 97.0 96.2 117.9 93.8 100.4 97.9 101.3
2015 95.3 92.8 95.9 116.4 92.4 101.5 96.3 99.8
N/A = data not available. *The Sierra Vista-Douglas MSA is a statistical area designation for all of Cochise County. Source:Council for Community and Economic Research (C2ER), Cost of Living Index.
S I E R R A V I S T A E C O N O M I C O U T L O O K • 2 0 1 6 5
SIERRA VISTA TRANSACTION PRIVILEGE(SALES) TAX RATES
COUNTY CITY OFCATEGORY AND STATE SIERRA VISTA TOTAL
Retail 6.10% 1.95% 8.05%
Restaurant & Bar 6.10% 2.60% 8.70%
Transient Lodging/Hotel/Motel 6.05% 5.50% 11.55%
Utilities and Communications 6.10% 2.00% 8.10%
Rental of Real Property —— 1.00% 1.00%
Construction Contracting 6.10% 2.45% 8.55%
Note: Rates as of January 1, 2016. Includes selected categories only. Source:Arizona Department of Revenue and Cochise College Center for EconomicResearch.
SIERRA VISTA PROPERTY TAX RATESPER $100 ASSESSED VALUE (2015)
DISTRICT PRIMARY SECONDARY TOTAL
City of Sierra Vista 0.1136 —— 0.1136
Buena Elementary School District 2.4952 —— 2.4952
Buena High School District 2.0608 —— 2.0608
Cochise Joint Technical District —— 0.0500 0.0500
Cochise County General Government*2.6276 —— 2.6276
Library* —— 0.1451 0.1451
Flood Control* —— 0.2597 0.2597
Cochise College* 2.1756 —— 2.1756
Fire District Assistance Tax* —— 0.0997 0.0997
AZ School District Assistance Tax** 0.5054 —— 0.5054
TOTAL 9.9782 0.5545 10.5327
Note: Rates are established the third Monday in August. *Rate applies to allproperty in Cochise County. **Rate applies to all property in Arizona.Source: Cochise County Treasurer and Cochise College Center forEconomic Research.
SIERRA VISTA/DOUGLAS MSA AREA COST OF LIVING
MISC.COMPOSITE GROCERY TRANS HEALTH GOODS &
INDEX ITEMS HOUSING UTILITIES PORTATION CARE SERVICES
2011 99.6 95.6 99.6 92.0 108.8 98.0 100.9
2012 102.5 97.8 102.8 103.4 106.6 99.5 102.7
2013 98.0 91.3 95.4 99.2 101.1 97.4 101.4
2014 97.3 94.7 93.6 102.8 102.6 96.5 98.1
2015 95.3 94.3 93.7 103.8 99.3 94.7 93.2
Note: The Sierra Vista-Douglas MSA is a statistical area designation for all of Cochise County. Source: Councilfor Community and Economic Research (C2ER), Cost of Living Index.
Sierra Vista is the retail hub of Cochise County, serving a commercial market of more than 110,000people. Large retail chains include Wal-Mart, Target, Kmart, Sears, Hobby Lobby, Dillard’s, Marshall’s, Ross,Home Depot, Lowe’s, Staples, PetSmart, and Best Buy, serving customers from across Cochise County,neighboring Santa Cruz County, and across the U.S. border with Mexico. The city is home to The Mall atSierra Vista—a one-story enclosed regional shopping mall. In recent years, the city’s restaurant industry hasexpanded considerably and now includes such large chains as Applebee’s, Buffalo Wild Wings, Chili’s, IHOP,Olive Garden, Outback Steakhouse, Panda Express, and Texas Roadhouse. A boom in commercialconstruction from 2005 through 2011 added several new hotels, restaurants, large retailers including a newWal-Mart Supercenter, office complexes, and other businesses. In 2015, construction was completed on thenew Canyon Vista Medical Center, which replaced the city’s former Sierra Vista Regional Health Center. Since2011, the area’s economy has been challenged by cuts in federal spending associated with Fort Huachuca andthe winding down of wars in Afghanistan and Iraq. Economic developers have focused efforts towarddiversification of the economy to lessen reliance on the defense industry, to include commercial applicationof defense-related specialties such as unmanned aerial systems and cyber-security.
PROPERTY TAX ASSESSMENT RATIOS
Class 1: Mines, mining claim property, and standing timber; localtelecommunications, utilities, pipelines, and oil and gas producing; andcommercial and industrial real property not included in other classes (18percent of cash value)
Class 2: Agricultural real property, golf courses, and vacant land (15 percent ofcash value)
Class 3: Owner-occupied residential property (10 percent of cash value)Class 4: Leased or rented residential property (10 percent of cash value)Class 5: Railroads, private car companies, and airline flight property (21 percent
of cash value)Class 6: Noncommercial historic property, foreign trade zones, military reuse,
environmental technology, and environmental remediation property (5percent of cash value)
Class 7: Improvements to commercial historic property (1 percent of cash valuefor up to 10 years)
Class 8: Improvements to historic residential rental property (1 percent of cashvalue for up to 10 years)
Class 9: Possessor interests (1 percent of cash value for up to 10 years)
S I E R R A V I S T A E C O N O M I C O U T L O O K • 2 0 1 66
Local Organizations
CITY OF SIERRA VISTA ECONOMIC DEVELOPMENTIn 2015, the city hired its new economic development manager along with an additional staff
member to serve as the city’s ombudsman for the business community, emphasizing retention, assisting withdeveloping business partnerships, and streamlining permitting requirements. With the most recent budgetcycle, the city council adopted the Economic Development Strategy to guide economic development effortsfor two years. The city has developed new marketing collateral and a business website and expanded itsstatistical information and photo library. The Community Leadership Forum was established to help provideinput, share ideas, and address challenges. A Cybersecurity Market and Targeted Industry Analysis wascompleted in 2016, which will act as a work plan to create a cybersecurity industry cluster. For more information, visit www.SierraVistaAZ.gov and www.SierraVistaAZBusiness.com.
ARIZONA REGIONAL ECONOMIC DEVELOPMENT FOUNDATIONThe mission of AREDF, formerly Sierra Vista Economic Development Foundation, is to actively preserve
and increase the economic strength of the Southeastern Arizona region through actions focused on industryretention, recruitment, expansion, and business alliance development. AREDF promotes communitydevelopment through:• Exposure—serving as a spokesperson at conferences throughout Arizona concerning economic
operations and strategies; providing feedback to Arizona legislators on a variety of economic topics;and holding positions on influential state and national economic development councils and initiatives
• Local Business Development—providing affordable office space to startup and small business ownersin the development stage of business; facilitating resource referral, including personal counselingsessions on organizational issues, revenue reductions, and expansion plans; and low-interest fundingfor business facade and infrastructure improvements in the West End of Sierra Vista
• Industry Development—facilitating commercial site certification for land and buildings and leadingefforts in promoting and developing the aerospace industry, healthcare industry, internationalrelations, and Fort Huachuca missionsFor more information, visit www.AREDF.org.
Economic Development
S I E R R A V I S T A E C O N O M I C O U T L O O K • 2 0 1 6 7
SIERRA VISTA INDUSTRIAL DEVELOPMENT AUTHORITYSierra Vista IDA is empowered to issue industrial revenue bonds to provide funds for financing or
refinancing of the costs of acquisition, construction, improvement, rehabilitation, or equipping for qualifiedprojects. Its interests include promotion of economic and industrial development, inducement ofmanufacturing, and development of low-income housing. In 1985, IDA established the former Sierra VistaEconomic Development Foundation (currently Arizona Regional Economic Development Foundation) topromote industrial and commercial growth, and IDA became the principal nonprofit organization thatprovides financial assistance and leadership to stimulate development of qualified projects. In 2004, IDAestablished the Sierra Housing Resource Partner, Inc., a 501(c)(3) corporation set up to develop low-incomehousing. In 2014, SHRP developed Crossing Point Villas, a 60-unit Low Income Housing Tax Creditcommunity; and Crossing Point Homes, a 20-unit first-time homebuyer subdivision. Crossing Point Homesoffers moderately priced two-story, three- and four-bedroom homes with down payment assistance for thosewho qualify. For more information, visit www.SierraVistaIDA.com.
SIERRA VISTA AREA CHAMBER OF COMMERCEWith a membership of more than 560 local businesses, the Sierra Vista Area Chamber is the largest
business organization in Cochise County. Its mission is to promote business and provide leadership for theimprovement of the community. The chamber’s goal is to support the local business community and topartner with other area agencies to help create a strong local economy, in particular the long-term viabilityof Fort Huachuca. To this end, the chamber offers a variety of resources and marketing tools to help localbusinesses grow. Its main focus is on business retention and providing opportunities for area business ownersand managers to network and promote their goods and services. The nonprofit organization, which is a self-funded 501(c)(6), is also active in the legislative arena. It acts as a voice on behalf of the business communityand works to keep its members informed on local, state, and national issues. For more information, visit SierraVistaChamber.org.
SIERRA VISTA METROPOLITAN PLANNING ORGANIZATIONSVMPO, established in 2013, is the designated transportation planning organization for Sierra Vista and
the surrounding urbanized area of Cochise County. SVMPO plans and coordinates surface transportationactivities and improvements to maintain a comprehensive, cooperative, and continuing multiagencytransportation planning program for the Sierra Vista region. For more information, visit www.SVMPO.org.
COCHISE COLLEGE CENTER FOR ECONOMIC RESEARCHCER provides economic information, analysis, and forecasting to help leaders in the public, private, and
nonprofit sectors make better-informed decisions. For more information, see the ‘About the Center for Economic Research’ section of this publication or visit
www.CochiseEconomy.com.
COCHISE COLLEGE SMALL BUSINESS DEVELOPMENT CENTERSBDC is staffed with business counselors, analysts, and technology specialists who provide one-on-one
confidential assistance for small businesses at every stage of development. SBDC provides counseling andassistance in planning, marketing, accounting, start-up, licensing, strategic planning, governmentprocurement, technology, and sources of capital, with special initiatives in veterans’ assistance, cleantechnology, and international trade. SBDC partners with U.S. Small Business Administration and Associationof Small Business Development Centers to provide local access to nationwide resources. For more information, visit www.Cochise.edu/SBDC.
S I E R R A V I S T A E C O N O M I C O U T L O O K • 2 0 1 68
SOUTHEASTERN ARIZONA GOVERNMENTS ORGANIZATIONSEAGO is a council of governments serving local and tribal governments in the four-county region
(Cochise, Graham, Greenlee, and Santa Cruz counties) and is a designated Economic Development District(EDD) by U.S. Economic Development Administration. SEAGO’s EDD program assists distressed areas,planning regions, cities, and counties in economic development planning, policymaking, andimplementation. As an EDD, SEAGO has responsibility for developing the Regional ComprehensiveEconomic Development Strategy (CEDS)—a guide to economic development initiatives throughout theregion. The CEDS process, which includes input from member entities, enables SEAGO members to applyfor federal grant funding. For more information, visit www.SEAGO.org.
ARIZONA@WORK—SOUTHEASTERN ARIZONAArizona@Work—Southeastern Arizona serves the Cochise, Graham, and Greenlee County region as part
of the statewide workforce development network providing innovative workforce solutions at the local level.Arizona@Work assists employers with worker recruitment (including posting job announcements),development, and retention, as well as business closure. Assistance is also provided to job seekers, includingpre-employment preparation, training programs, and job-search resources. All business and job-seekerservices are provided at no cost through public and private partnerships. Veteran representatives are on staffand veterans receive priority service. Arizona@Work is a partner of the American Job Center network. For more information, visit ArizonaAtWork.com/SoutheasternAZ.
SOUTHEAST ARIZONA HOSPITALITY ASSOCIATIONSEAHA was developed in 2015 to address the unique challenges of local hoteliers. The association also
includes an ancillary group of dining establishments and retailers. SEAHA played a key role in the selectionof Sierra Vista as the location for the 2016 Arizona H.O.G. Rally—a motorcycle event that regularly draws upto 800 riders from across the state and region. For more information, visit www.Facebook.com/AzSEAHA.
Recent Activities
COCHISE COLLEGE DOWNTOWN CENTERIn 2015, Cochise College launched a $14 million renovation of the old Sierra Vista Regional Health
Center to transform it into the college’s new Downtown Center. The 92,000 square-foot facility was donatedto the college by the Legacy Foundation of Southeast Arizona upon completion of the new Canyon VistaMedical Center in the city. The new Downtown Center, expected to open in late 2016, will provide additionalfacilities for the college’s nursing education and culinary arts programs and will house the college’scommunity outreach departments including the Small Business Development Center, Center for LifelongLearning, and Center for Economic Research, along with space for external community organizationsincluding Arizona@Work—Southeastern Arizona, Disabled American Veterans, and Volunteer InterfaithCaregiver programs. For more information, visit www.Cochise.edu.
RETIRE SIERRA VISTA PROJECTIn 2015, a group of local business and community leaders launched the Retire Sierra Vista Project
(RSVP)—an effort to promote the area as a retirement destination and increase the area’s younger-seniorpopulation through a visitation program. The project includes a marketing campaign, welcome packets, awebsite, Facebook page, and other efforts. Major partners include City of Sierra Vista, Sierra Vista AreaChamber of Commerce, and Wick Communications. The efforts are financially supported through donationsfrom several private businesses and organizations. For more information, visit www.RetireSierraVista.com.
FORT HUACHUCA VISIBILITY PROMOTIONIn 2015, City of Sierra Vista, Fort Huachuca 50, and Cochise County partnered to hire a consultant to
assist in creating and implementing a plan to increase visibility of Fort Huachuca among elected andPentagon officials. The plan includes both visiting and hosting decision makers to increase theirunderstanding of the fort and its importance to national security.
S I E R R A V I S T A E C O N O M I C O U T L O O K • 2 0 1 6 9
SOUTHERN ARIZONA TRAINING & RESOURCE NETWORKCity of Sierra Vista, Cochise College Small Business Development Center, Cochise College Center for
Lifelong Learning, University of Arizona Continuing Education, Arizona@Work, Sierra Vista Area Chamberof Commerce, and Sierra Vista Hispanic Chamber of Commerce have partnered to develop Southern ArizonaTraining & Resource Network—a single web portal where interested business owners and employees can seeall course and event offerings of the various partner organizations. For more information, visit SATRN.CourseStorm.com.
BUSINESS WALKS In 2016, Sierra Vista Area Chamber of Commerce and City of Sierra Vista partnered to develop a
‘business walk’ program. The walks are designed to improve communication between business owners andthose providing business services, as well as identify challenges that may be solved by working together.Additionally, the walks are used to collect data to help develop future business initiatives and strategies.
PLANNING FOR THE FUTURESince 2007, Sierra Vista City Council has developed biannual strategic leadership plans. Entitled Our
Future Vistas, the document provides a vision for the future supported by focus areas, goals, and objectives—all built around supporting the city’s voter-approved general plan. The strategic plan guides budgetinvestments and staff-time allocated to programs, issues, and projects identified as priority items.
Commissioned by Sierra Vista City Council and published in 2013, the city’s Plan for Prosperity is ananalysis of the community’s economic development framework built on eight strategic objectives designed togrow and diversify Sierra Vista’s economy. Inclusive of both short- and long-term objectives, the planemphasizes citywide collaboration, elevation of existing assets, and building a firm foundation for futureindustries and jobs. Following the plan, the city council accepted an economic development strategy basedon the objectives outlined within Plan for Prosperity. The strategy will guide economic development effortsduring the 2015-2016 fiscal year.
In 2014, Sierra Vista voters ratified the city’s updated general plan, Vista 2030. The plan is a collection ofgoals and strategies that serve as the primary tool and blueprint for guiding the growth and development ofthe city over 10 years. It integrates ideas and desires of residents, businesses, and elected officials into astrategy for managing the city’s future, encompassing infrastructure, transportation, economic development,and quality of life. Comments provided by residents during the ‘Dream Your City’ visioning process, held in2013, were incorporated into all 17 elements of the general plan. For more information, visit www.SierraVistaAZ.gov.
WEST END DEVELOPMENTSierra Vista’s West End (west of Seventh Street to Buffalo Soldier Trail, and north of Golf Links Road to
State Highway 90) has been the focus of redevelopment efforts by the city in recent years due to its potentialto advance small business ownership and entrepreneurship. The area is the oldest district in the city andincludes most of the original area that made up Sierra Vista when it was first incorporated in 1956. City staffhas worked with residents, business owners, Fort Huachuca officials, West End commissioners, and othercommunity leaders to develop strategies to revitalize the area and promote private investment andredevelopment. The city offers several incentives to encourage redevelopment in the West End, to include anexpedited review process and flexibility regarding issues such as parking requirements, setbacks, and heightlimitations. The city also gives consideration to fee waivers for development in the West End. Commercialprojects that replace existing structures automatically qualify for a development fee waiver. Recently, the Cityof Sierra Vista (through the Sierra Vista Metropolitan Planning Organization) hired consultants to developplans to reduce street lanes in the West End and expand pedestrian walkways and bicycle lanes to make theWest End more community oriented.
ARIZONA-SONORA BORDER MAYORS COALITIONIn 2013, Arizona-Sonora Border Mayors Coalition was established, which includes all seven incorporated
cities and towns in Cochise County, along with several border cities and towns in northern Sonora. Thecoalition’s goal is to increase economic opportunities in the region by promoting cross-border tourism,border safety, border infrastructure, and employment.
S I E R R A V I S T A E C O N O M I C O U T L O O K • 2 0 1 610
Major Assets
SIERRA VISTA MUNICIPAL AIRPORTSierra Vista Municipal Airport is a civilian/military joint-use airport serving Southeastern Arizona and
Northern Mexico and sharing runways with Fort Huachuca’s Libby Army Airfield. The military owns andoperates land and facilities on the south side of the airport including the control tower, while the city owns75 acres on the north side including hangars and tie-down sites, which it leases out. Hangar access is available24-hours a day, seven days a week, through electrically operated security gates. Self-fueling services are alsoavailable. The airport has three runways: Runway 08-26 is 12,001 feet long by 150 feet wide and is constructedof reinforced concrete; Runway 12-30 is 5,365 feet long by 100 feet wide, constructed of asphaltic concrete;and Runway 03-21 is 4,300 feet long by 75 feet wide, also constructed of asphaltic concrete. Currently, thereis no commercial air service to Sierra Vista Municipal Airport. For more information, visit www.SierraVistaAZ.gov.
FOREIGN TRADE ZONECochise County has industrial property designated as a foreign-trade zone (FTZ-139). Companies
located in the FTZ can use special procedures that allow delayed or reduced duty payments on foreignmerchandise. Other benefits include:• no duties or quota charges on re-exports;• deferred customs duties and federal excise tax on imports;• in cases where manufacturing results in a finished product that has a lower duty rate than the rates on
foreign inputs (inverted tariff), the finished products may be entered at the duty rate that applies to itscondition as it leaves the zone (subject to public interest considerations);
• access to streamlined customs procedures such as weekly entry or direct delivery; and• exemption from state/local inventory taxes for foreign and domestic goods held for export.
Merchandise in a zone may be assembled, exhibited, cleaned, manipulated, manufactured, mixed,processed, relabeled, repackaged, repaired, salvaged, sampled, stored, tested, displayed, and destroyed. Retailtrade is prohibited in the zone. Before a firm may use the FTZ, it must obtain approval from U.S. Customsand Border Protection for activation of the space to be used, must meet CBP requirements for security andinventory control, and is responsible for all fees associated with activating and running the site. For more information, visit www.AREDF.org.
IncentivesFor more information on these and other Arizona economic development incentives, visit www.AzCommerce.com.
ADDITIONAL DEPRECIATIONAccelerates depreciation schedules for prospective acquisitions of commercial personal property
ANGEL INVESTMENTState income tax credit for capital investment in small businesses certified by Arizona Commerce
Authority
COMMERCIAL/INDUSTRIAL SOLARState income tax credit for installation of solar energy devices in business facilities
COMPUTER DATA CENTER PROGRAMTransaction privilege tax and use tax exemptions at state, county, and local levels on qualifying purchases
of computer data center equipment
HEALTHY FORESTIncentives for certified businesses primarily engaged in harvesting, processing, or transporting qualifying
forest products
S I E R R A V I S T A E C O N O M I C O U T L O O K • 2 0 1 6 11
JOB TRAININGReimbursable grants up to 75 percent of eligible training expenses for employers creating new jobs
LEASE EXCISERedevelopment tool to initiate development by reducing a project's operating costs by replacing real
property tax with an excise tax
PRIVATE ACTIVITY BONDSSecurities issued by or on behalf of a local government to provide debt financing for projects used for a
trade or business
QUALIFIED ENERGY CONSERVATION BONDSTax credit bonds originally authorized by Tax Extenders and Alternative Minimum Tax Relief Act of 2008
QUALIFIED FACILITYRefundable state income tax credit for eligible companies making capital investment to establish or
expand qualified facilities
QUALITY JOBSUp to $9,000 state income or premium tax credits spread over a three-year period for each net new
quality job
RENEWABLE ENERGY TAX INCENTIVEUp to 10 percent refundable state income tax credit and 75 percent reduction on real and personal
property taxes for companies engaged in solar, wind, geothermal, and other renewable energy industries
RESEARCH & DEVELOPMENTState income tax credit for increased research and development activities
SALES TAX EXEMPTIONS FOR MACHINERY AND EQUIPMENTSales tax exemption for various machinery or equipment
SMALL BUSINESS INNOVATION RESEARCH GRANTCompetitive grant for small businesses to explore technological potential and commercialization
SMALL BUSINESS TECHNOLOGY TRANSFER GRANTFunding opportunities to meet national scientific and technological challenges
WORK OPPORTUNITYFederal tax credit for hiring individuals from groups consistently faced with significant barriers to
employment
S I E R R A V I S T A E C O N O M I C O U T L O O K • 2 0 1 612
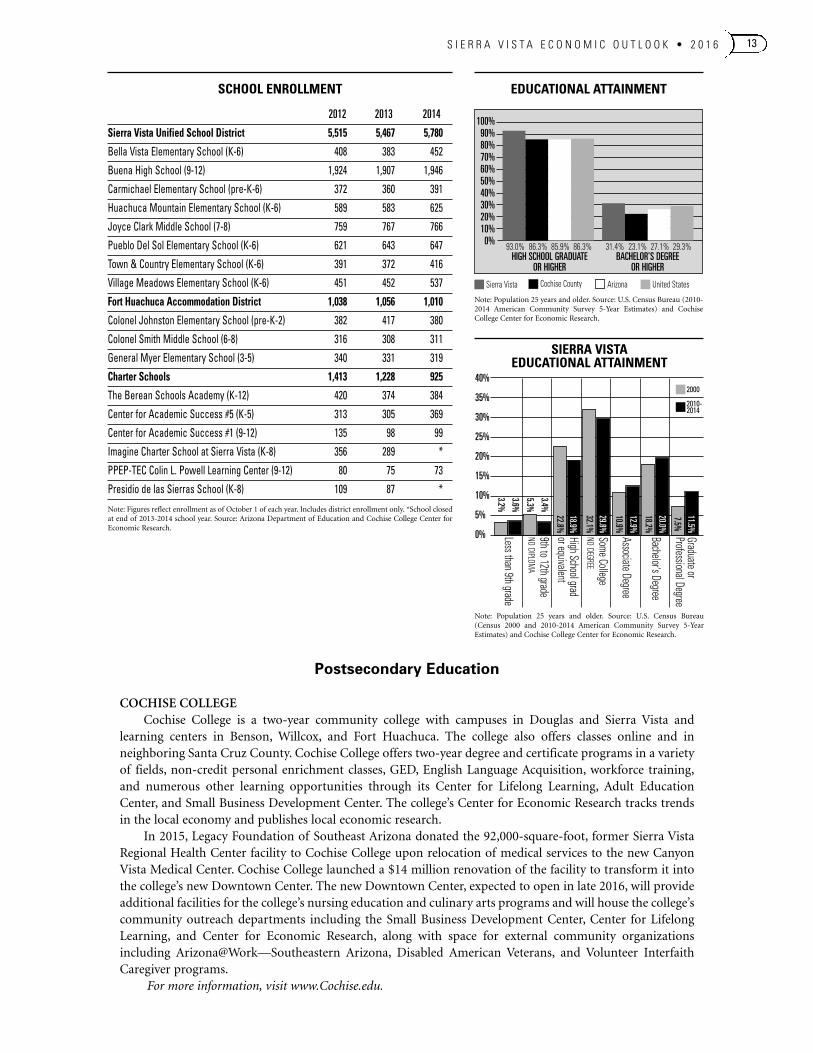
STUDENT AND TEACHER MEASURES (2014)
SIERRA VISTA UNIFIEDSCHOOL DISTRICT PEER ARIZONA
Attendance Rate 94% 94% 95%
Graduation Rate (2013) 81% 86% 75%
Poverty Rate (2013) 18% 15% 24%
Students per Teacher 19.5 16.1 18.6
Average Teacher Salary $44,903 $41,932 $46,026
Average Years Teacher Experience 12.3 10.2 10.9
Percentage of Teachers in First 3 Years 7% 21% 20%
Source: Arizona Office of the Auditor General.
Primary and Secondary Education
SIERRA VISTA UNIFIED SCHOOL DISTRICTSVUSD consists of one high school, one middle school, and six elementary schools. For more information, visit www.SVUSD68.org.
FORT HUACHUCA ACCOMMODATION SCHOOLSFHAS consists of one middle and two elementary schools located on Fort Huachuca. FHAS are Arizona
public schools under the jurisdiction of Arizona Department of Education; enrollment is not limited tomilitary personnel or those associated with the fort. For more information, visit www.FtHuachuca.K12.Az.US.
CHARTER SCHOOLSIn addition to SVUSD and FHAS, Sierra Vista is home to four charter schools: Center for Academic Success
#1 and Center for Academic Success #5 (www.CAS-Schools.com), The Berean Academy (Berean-Academy.com), and PPEP-TEC Colin L. Powell Learning Center (www.PPEPtechs.org). The former ImagineCharter School at Sierra Vista, as well as Presidio de las Sierras School, closed at the end of the 2014 school year.
Education
DISTRIBUTION OF PER PUPIL SPENDING
SIERRA VISTA UNIFIED UNITEDSCHOOL DISTRICT PEER ARIZONA STATES
Total $7,055 $7,573 $7,578 $10,667
Classroom Dollars $3,787 $3,914 $4,073 $6,495
Non-classroom Dollars $3,268 $3,659 $3,505 $4,172
Administration $834 $789 $757 $1,160
Plant Operations $918 $1,009 $923 $1,008
Food Service $330 $386 $405 $429
Transportation $355 $406 $373 $464
Student Support $493 $607 $600 $594
Instruction Support $338 $462 $447 $517
Note: Data for Sierra Vista Unified School District, peer districts, and Arizona are from 2014; national figuresare from 2012. Source: Arizona Office of the Auditor General.
S I E R R A V I S T A E C O N O M I C O U T L O O K • 2 0 1 6 13
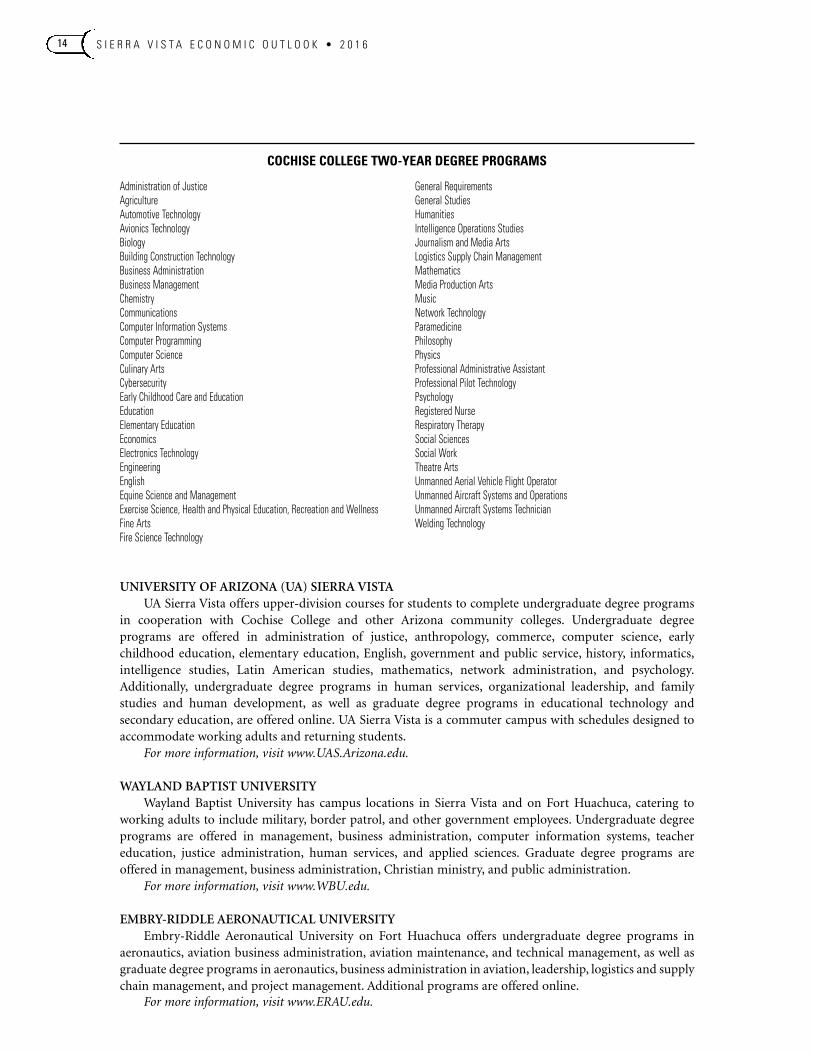
SCHOOL ENROLLMENT
2012 2013 2014
Sierra Vista Unified School District 5,515 5,467 5,780
Bella Vista Elementary School (K-6) 408 383 452
Buena High School (9-12) 1,924 1,907 1,946
Carmichael Elementary School (pre-K-6) 372 360 391
Huachuca Mountain Elementary School (K-6) 589 583 625
Joyce Clark Middle School (7-8) 759 767 766
Pueblo Del Sol Elementary School (K-6) 621 643 647
Town & Country Elementary School (K-6) 391 372 416
Village Meadows Elementary School (K-6) 451 452 537
Fort Huachuca Accommodation District 1,038 1,056 1,010
Colonel Johnston Elementary School (pre-K-2) 382 417 380
Colonel Smith Middle School (6-8) 316 308 311
General Myer Elementary School (3-5) 340 331 319
Charter Schools 1,413 1,228 925
The Berean Schools Academy (K-12) 420 374 384
Center for Academic Success #5 (K-5) 313 305 369
Center for Academic Success #1 (9-12) 135 98 99
Imagine Charter School at Sierra Vista (K-8) 356 289 *
PPEP-TEC Colin L. Powell Learning Center (9-12) 80 75 73
Presidio de las Sierras School (K-8) 109 87 *
Note: Figures reflect enrollment as of October 1 of each year. Includes district enrollment only. *School closedat end of 2013-2014 school year. Source: Arizona Department of Education and Cochise College Center forEconomic Research.
Postsecondary Education
COCHISE COLLEGECochise College is a two-year community college with campuses in Douglas and Sierra Vista and
learning centers in Benson, Willcox, and Fort Huachuca. The college also offers classes online and inneighboring Santa Cruz County. Cochise College offers two-year degree and certificate programs in a varietyof fields, non-credit personal enrichment classes, GED, English Language Acquisition, workforce training,and numerous other learning opportunities through its Center for Lifelong Learning, Adult EducationCenter, and Small Business Development Center. The college’s Center for Economic Research tracks trendsin the local economy and publishes local economic research.
In 2015, Legacy Foundation of Southeast Arizona donated the 92,000-square-foot, former Sierra VistaRegional Health Center facility to Cochise College upon relocation of medical services to the new CanyonVista Medical Center. Cochise College launched a $14 million renovation of the facility to transform it intothe college’s new Downtown Center. The new Downtown Center, expected to open in late 2016, will provideadditional facilities for the college’s nursing education and culinary arts programs and will house the college’scommunity outreach departments including the Small Business Development Center, Center for LifelongLearning, and Center for Economic Research, along with space for external community organizationsincluding Arizona@Work—Southeastern Arizona, Disabled American Veterans, and Volunteer InterfaithCaregiver programs.
For more information, visit www.Cochise.edu.
100%90%80%70%60%50%40%30%20%10%0%
HIGH SCHOOL GRADUATE OR HIGHER
93.0% 86.3% 85.9% 86.3% 31.4% 23.1% 27.1% 29.3%BACHELOR’S DEGREE
OR HIGHER
Sierra Vista Cochise County Arizona United States
Note: Population 25 years and older. Source: U.S. Census Bureau (2010-2014 American Community Survey 5-Year Estimates) and CochiseCollege Center for Economic Research.
EDUCATIONAL ATTAINMENT
Less than 9th grade
9th to 12th grade NO
DIPLOMA
High School grador equivalent
Some CollegeNO
DEGREE
Associate Degree
Bachelor's Degree
Graduate orProfessional Degree
3.2%
3.6%
5.3%
3.4%
22.8%18.9%
32.1%29.8%
10.9%
12.9%
18.2%
20.0%
7.5%
11.5%
2000
2010-2014
Note: Population 25 years and older. Source: U.S. Census Bureau(Census 2000 and 2010-2014 American Community Survey 5-YearEstimates) and Cochise College Center for Economic Research.
SIERRA VISTA EDUCATIONAL ATTAINMENT
40%
35%
30%
25%
20%
15%
10%
5%
0%
S I E R R A V I S T A E C O N O M I C O U T L O O K • 2 0 1 614
COCHISE COLLEGE TWO-YEAR DEGREE PROGRAMS
Administration of JusticeAgricultureAutomotive TechnologyAvionics TechnologyBiologyBuilding Construction TechnologyBusiness AdministrationBusiness ManagementChemistryCommunicationsComputer Information SystemsComputer ProgrammingComputer ScienceCulinary ArtsCybersecurityEarly Childhood Care and EducationEducationElementary EducationEconomicsElectronics TechnologyEngineeringEnglishEquine Science and ManagementExercise Science, Health and Physical Education, Recreation and WellnessFine ArtsFire Science Technology
General RequirementsGeneral StudiesHumanitiesIntelligence Operations StudiesJournalism and Media ArtsLogistics Supply Chain ManagementMathematicsMedia Production ArtsMusicNetwork TechnologyParamedicinePhilosophyPhysicsProfessional Administrative AssistantProfessional Pilot TechnologyPsychologyRegistered NurseRespiratory TherapySocial SciencesSocial WorkTheatre ArtsUnmanned Aerial Vehicle Flight OperatorUnmanned Aircraft Systems and OperationsUnmanned Aircraft Systems TechnicianWelding Technology
UNIVERSITY OF ARIZONA (UA) SIERRA VISTAUA Sierra Vista offers upper-division courses for students to complete undergraduate degree programs
in cooperation with Cochise College and other Arizona community colleges. Undergraduate degreeprograms are offered in administration of justice, anthropology, commerce, computer science, earlychildhood education, elementary education, English, government and public service, history, informatics,intelligence studies, Latin American studies, mathematics, network administration, and psychology.Additionally, undergraduate degree programs in human services, organizational leadership, and familystudies and human development, as well as graduate degree programs in educational technology andsecondary education, are offered online. UA Sierra Vista is a commuter campus with schedules designed toaccommodate working adults and returning students. For more information, visit www.UAS.Arizona.edu.
WAYLAND BAPTIST UNIVERSITYWayland Baptist University has campus locations in Sierra Vista and on Fort Huachuca, catering to
working adults to include military, border patrol, and other government employees. Undergraduate degreeprograms are offered in management, business administration, computer information systems, teachereducation, justice administration, human services, and applied sciences. Graduate degree programs areoffered in management, business administration, Christian ministry, and public administration. For more information, visit www.WBU.edu.
EMBRY-RIDDLE AERONAUTICAL UNIVERSITYEmbry-Riddle Aeronautical University on Fort Huachuca offers undergraduate degree programs in
aeronautics, aviation business administration, aviation maintenance, and technical management, as well asgraduate degree programs in aeronautics, business administration in aviation, leadership, logistics and supplychain management, and project management. Additional programs are offered online. For more information, visit www.ERAU.edu.
S I E R R A V I S T A E C O N O M I C O U T L O O K • 2 0 1 6 15
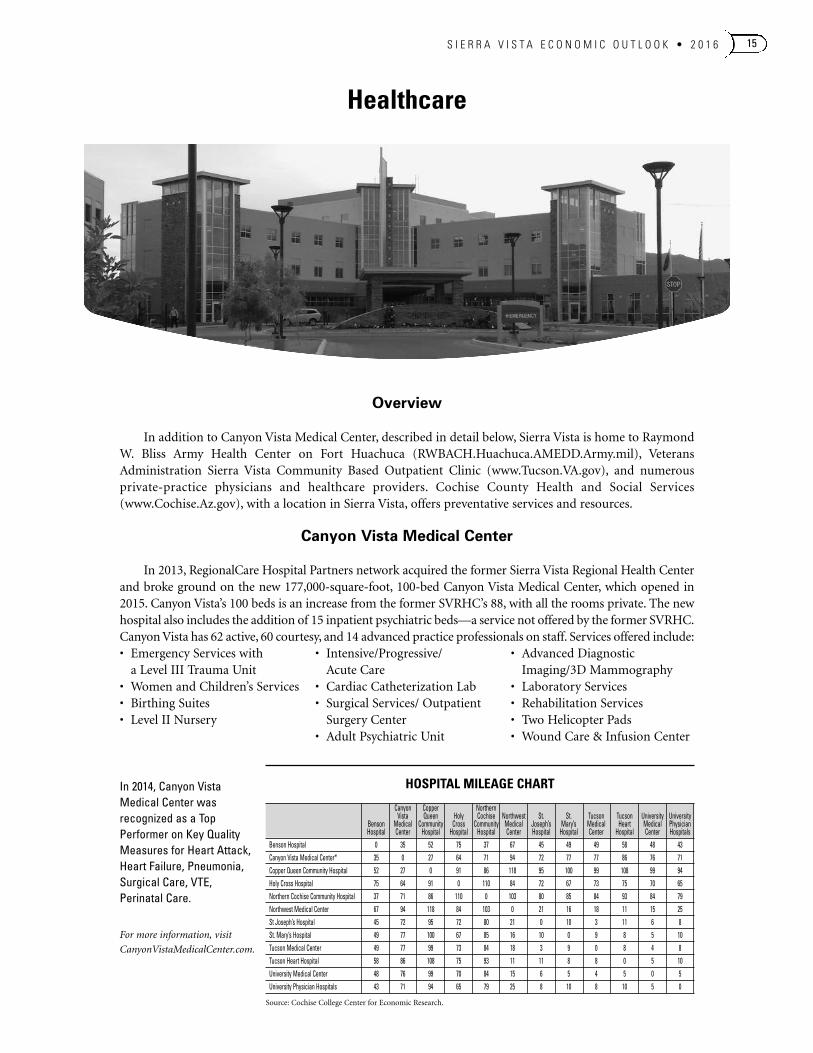
Overview
In addition to Canyon Vista Medical Center, described in detail below, Sierra Vista is home to RaymondW. Bliss Army Health Center on Fort Huachuca (RWBACH.Huachuca.AMEDD.Army.mil), VeteransAdministration Sierra Vista Community Based Outpatient Clinic (www.Tucson.VA.gov), and numerousprivate-practice physicians and healthcare providers. Cochise County Health and Social Services(www.Cochise.Az.gov), with a location in Sierra Vista, offers preventative services and resources.
Canyon Vista Medical Center
In 2013, RegionalCare Hospital Partners network acquired the former Sierra Vista Regional Health Centerand broke ground on the new 177,000-square-foot, 100-bed Canyon Vista Medical Center, which opened in2015. Canyon Vista’s 100 beds is an increase from the former SVRHC’s 88, with all the rooms private. The newhospital also includes the addition of 15 inpatient psychiatric beds—a service not offered by the former SVRHC.Canyon Vista has 62 active, 60 courtesy, and 14 advanced practice professionals on staff. Services offered include:
Healthcare
HOSPITAL MILEAGE CHART
Canyon Copper NorthernVista Queen Holy Cochise Northwest St. St. Tucson Tucson University University
Benson Medical Community Cross Community Medical Joseph’s Mary’s Medical Heart Medical PhysicianHospital Center Hospital Hospital Hospital Center Hospital Hospital Center Hospital Center Hospitals
Benson Hospital 0 35 52 75 37 67 45 49 49 58 48 43
Canyon Vista Medical Center* 35 0 27 64 71 94 72 77 77 86 76 71
Copper Queen Community Hospital 52 27 0 91 86 118 95 100 99 108 99 94
Holy Cross Hospital 75 64 91 0 110 84 72 67 73 75 70 65
Northern Cochise Community Hospital 37 71 86 110 0 103 80 85 84 93 84 79
Northwest Medical Center 67 94 118 84 103 0 21 16 18 11 15 25
St Joseph’s Hospital 45 72 95 72 80 21 0 10 3 11 6 8
St. Mary’s Hospital 49 77 100 67 85 16 10 0 9 8 5 10
Tucson Medical Center 49 77 99 73 84 18 3 9 0 8 4 8
Tucson Heart Hospital 58 86 108 75 93 11 11 8 8 0 5 10
University Medical Center 48 76 99 70 84 15 6 5 4 5 0 5
University Physician Hospitals 43 71 94 65 79 25 8 10 8 10 5 0
Source: Cochise College Center for Economic Research.
• Emergency Services with a Level III Trauma Unit
• Women and Children’s Services• Birthing Suites• Level II Nursery
• Intensive/Progressive/Acute Care
• Cardiac Catheterization Lab• Surgical Services/ OutpatientSurgery Center
• Adult Psychiatric Unit
• Advanced DiagnosticImaging/3D Mammography
• Laboratory Services• Rehabilitation Services• Two Helicopter Pads• Wound Care & Infusion Center
In 2014, Canyon VistaMedical Center wasrecognized as a TopPerformer on Key QualityMeasures for Heart Attack,Heart Failure, Pneumonia,Surgical Care, VTE,Perinatal Care.
For more information, visit
CanyonVistaMedicalCenter.com.
S I E R R A V I S T A E C O N O M I C O U T L O O K • 2 0 1 616
POPULATION
SIERRA VISTA COCHISE COUNTY ARIZONAPOPULATION GROWTH POPULATION GROWTH POPULATION GROWTH
1990 32,983 —— 97,624 —— 3,665,228 ——2000 37,775 14.5% 117,755 20.6% 5,130,632 40.0%2010 43,888 16.2% 131,346 11.5% 6,392,017 24.6%2011 45,098 2.8% 130,537 -0.6% 6,438,178 0.7%2012 45,794 1.5% 130,752 0.2% 6,498,569 0.9%2013 45,303 -1.1% 130,906 0.1% 6,581,054 1.3%2014 44,286 -2.2% 129,628 -1.0% 6,667,241 1.3%2015 44,183 -0.2% 129,112 -0.4% 6,758,251 1.4%
Note: Growth rates shown for 2000 and 2010 reflect preceding 10-year period; rates for 2011 forward areannual. Source: U.S. Census Bureau, Arizona Office of Employment and Population Statistics, and CochiseCollege Center for Economic Research.
The population of Sierra Vista as of July 2015 was 44,183; however, as the economic hub of CochiseCounty, the city’s daytime population is much higher. Sierra Vista’s retail market serves an estimatedpopulation of more than 110,000. The city’s population includes Fort Huachuca as a result of annexation ofthe fort in 1971. The resident population of Fort Huachuca (those residing on post) was 5,624 as of January2016, which includes 1,052 military personnel and 2,688 family members residing in on-post family housing,and also includes 1,884 unmarried or unaccompanied military personnel residing in troop billets (includingstudents assigned temporarily for training). As of the 2010-2014 American Community Survey, 27.4 percentof Sierra Vista’s population ages 18 and older are civilian veterans of the military (more than three times thenational level). This is largely due to the number of Department of the Army civilian positions at FortHuachuca, as well as defense contracting personnel, many of whom are former members of the military. Also,the large number of retirees in the area has increased the number of civilian veterans, since many retirees onceserved in the armed forces (though not necessarily in connection with Fort Huachuca).
Population & Demographics
Photo: City of Sierra Vista
S I E R R A V I S T A E C O N O M I C O U T L O O K • 2 0 1 6 17
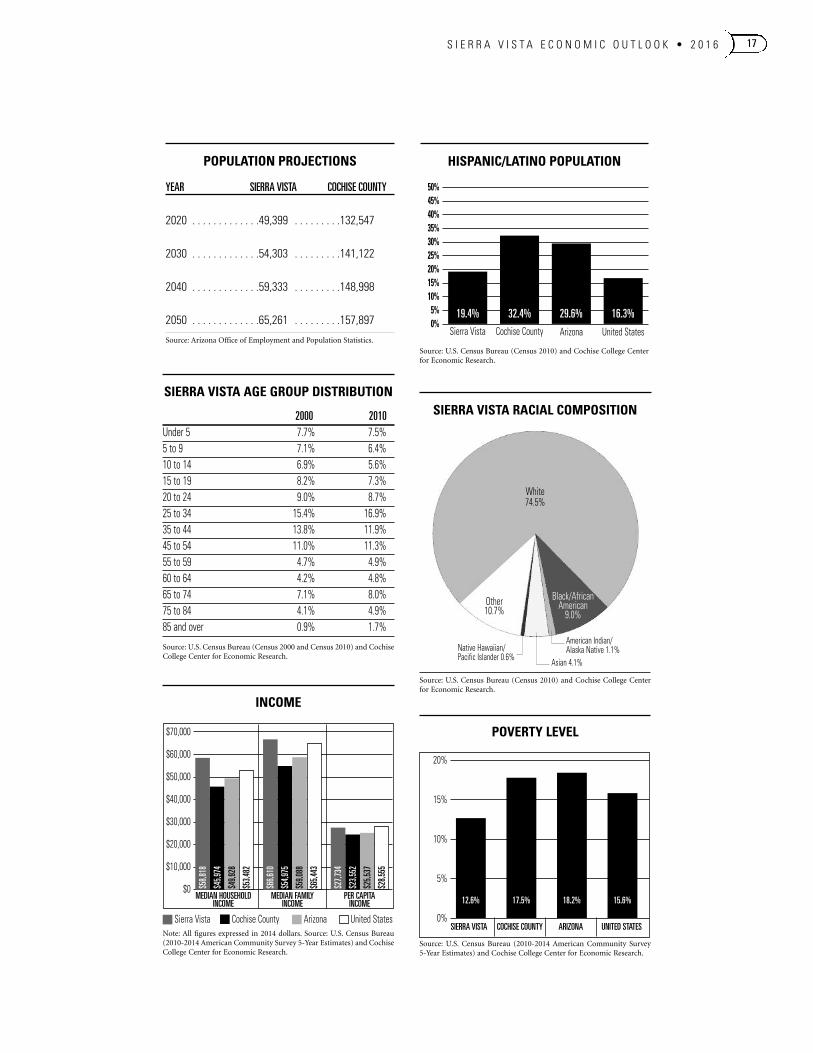
SIERRA VISTA AGE GROUP DISTRIBUTION
2000 2010Under 5 7.7% 7.5%5 to 9 7.1% 6.4%10 to 14 6.9% 5.6%15 to 19 8.2% 7.3%20 to 24 9.0% 8.7%25 to 34 15.4% 16.9%35 to 44 13.8% 11.9%45 to 54 11.0% 11.3%55 to 59 4.7% 4.9%60 to 64 4.2% 4.8%65 to 74 7.1% 8.0%75 to 84 4.1% 4.9%85 and over 0.9% 1.7%
Source: U.S. Census Bureau (Census 2000 and Census 2010) and CochiseCollege Center for Economic Research.
MEDIAN HOUSEHOLDINCOME
MEDIAN FAMILYINCOME
PER CAPITAINCOME
$58,8
18
$45,9
74
$49,9
28
$53,4
82
$66,6
10
$54,9
75
$59,0
88
$65,4
43
$27,7
34
$23,5
52
$25,5
37
$28,5
55
Sierra Vista Cochise County Arizona United States
INCOME
$70,000
$60,000
$50,000
$40,000
$30,000
$20,000
$10,000
$0
Note: All figures expressed in 2014 dollars. Source: U.S. Census Bureau(2010-2014 American Community Survey 5-Year Estimates) and CochiseCollege Center for Economic Research.
SIERRA VISTA COCHISE COUNTY ARIZONA UNITED STATES
12.6% 17.5% 18.2% 15.6%
POVERTY LEVEL
20%
15%
10%
5%
0%
Source: U.S. Census Bureau (2010-2014 American Community Survey 5-Year Estimates) and Cochise College Center for Economic Research.
50%45%40%35%30%25%20%15%10%5%0%
Sierra Vista Cochise County Arizona
19.4% 32.4% 29.6%
United States
16.3%
Source: U.S. Census Bureau (Census 2010) and Cochise College Centerfor Economic Research.
HISPANIC/LATINO POPULATION
Native Hawaiian/ Pacific Islander 0.6%
American Indian/Alaska Native 1.1%
Source: U.S. Census Bureau (Census 2010) and Cochise College Centerfor Economic Research.
Asian 4.1%
SIERRA VISTA RACIAL COMPOSITION
White74.5%
Black/AfricanAmerican
9.0%Other 10.7%
POPULATION PROJECTIONS
YEAR SIERRA VISTA COCHISE COUNTY
2020 . . . . . . . . . . . . .49,399 . . . . . . . . .132,547
2030 . . . . . . . . . . . . .54,303 . . . . . . . . .141,122
2040 . . . . . . . . . . . . .59,333 . . . . . . . . .148,998
2050 . . . . . . . . . . . . .65,261 . . . . . . . . .157,897
Source: Arizona Office of Employment and Population Statistics.
S I E R R A V I S T A E C O N O M I C O U T L O O K • 2 0 1 618
Employment Outlook
The largest threat to labor market improvement in Sierra Vista and Cochise County comes from defensebudget cuts impacting Fort Huachuca, which are the natural upshot of winding down wars in Iraq andAfghanistan. While the rest of the state and nation suffered through severe effects of the Great Recession,Cochise County was buffered from the worst of it due to increased defense spending on the fort and itsmissions. Those increases were principally tied to the wars. While continued defense cuts are likely to furtherhinder labor market improvement, growing threats from the Middle East may cause national policymakersto reconsider levels of military spending reductions, which could impact military intelligence, unmannedaerial systems, and cyber-security missions at Fort Huachuca. Depending on the nature and duration of U.S.involvement in the region, the fort may see drawdown efforts level off, or may even see an uptick in activitygiven the relevance of the fort’s missions to counterterrorism and related efforts.
Also on the positive side, the majority of defense related cuts impacting Fort Huachuca have likelyalready occurred. From 2009 through 2014, Fort Huachuca lost 2,350 fulltime equivalent jobs (permanentlyassigned active duty military, civil servants, non-appropriated fund workers, and average daily number ofstudents assigned for training; this number does not include defense contractors) and the fort saw a modestincrease in FTE jobs in 2015. The bulk of reductions from 2009 to 2014 came from the relocation of unitsfrom the fort and a drop in the number of intelligence students trained. The fort’s average daily student loaddeclined 25 percent from more than 3,200 in 2010 to 2,400 in 2015. Fort Huachuca adjusted to the war-related increases in students by hiring contractors to provide training. As student numbers have dropped,contracting jobs have been eliminated. The eight largest defense contractors in Cochise County lost nearly
Employment
UNEMPLOYMENT RATE (%)
COCHISE UNITEDSIERRA VISTA COUNTY ARIZONA STATES
2011 7.9 9.5 9.5 8.92012 7.7 9.0 8.3 8.12013 7.7 9.0 7.5 7.42014 7.1 8.4 6.8 6.22015 6.3 7.4 6.1 5.32015 (Dec)* 5.7 6.8 5.8 5.0
*Seasonally adjusted. Source: U.S. Bureau of Labor Statistics, ArizonaOffice of Employment and Population Statistics, and Cochise CollegeCenter for Economic Research.
SIERRA VISTA LABOR MARKET DATA
CIVILIANLABOR FORCE EMPLOYMENT UNEMPLOYMENT
2011 20,550 18,930 1,620
2012 20,178 18,618 1,560
2013 19,022 17,558 1,464
2014 18,900 17,560 1,340
2015 18,815 17,628 1,187
Source: Arizona Office of Employment and Population Statistics.
S I E R R A V I S T A E C O N O M I C O U T L O O K • 2 0 1 6 19
465 jobs from 2012 to 2013 alone. When factoring in defense contractors, the total number of Fort Huachuca-related jobs lost from 2009 through 2015 is likely in the range of 3,000 to 4,500, making significant furthercuts unlikely (including reductions related to the Army 2020 Force Structure Realignment).
One factor that will continue to help the local labor market is the new Canyon Vista Medical Center inSierra Vista, which opened in 2015. During construction, the new hospital gave a boost to employment in thelocal construction industry, as well as struggling area hospitality industries as specialized work crews werebrought in for the project. Since opening, the new hospital employs approximately 100 additional workerscompared to its predecessor (Sierra Vista Regional Health Center). In the longer run, the new hospital willserve as an economic development asset to lure new businesses and retirees to the area, which will assist inlabor market improvement.
The most significant opportunity for the short- and long-term economic growth of Cochise County isthe planned 28,000-home Villages at Vigneto retirement community in Benson, approximately 30 milesnorth of Sierra Vista. The development, if successful in achieving and maintaining an ambitious 2,000residential-unit annual absorption rate from 2020 to 2031 as anticipated by developer El Dorado Holdings,
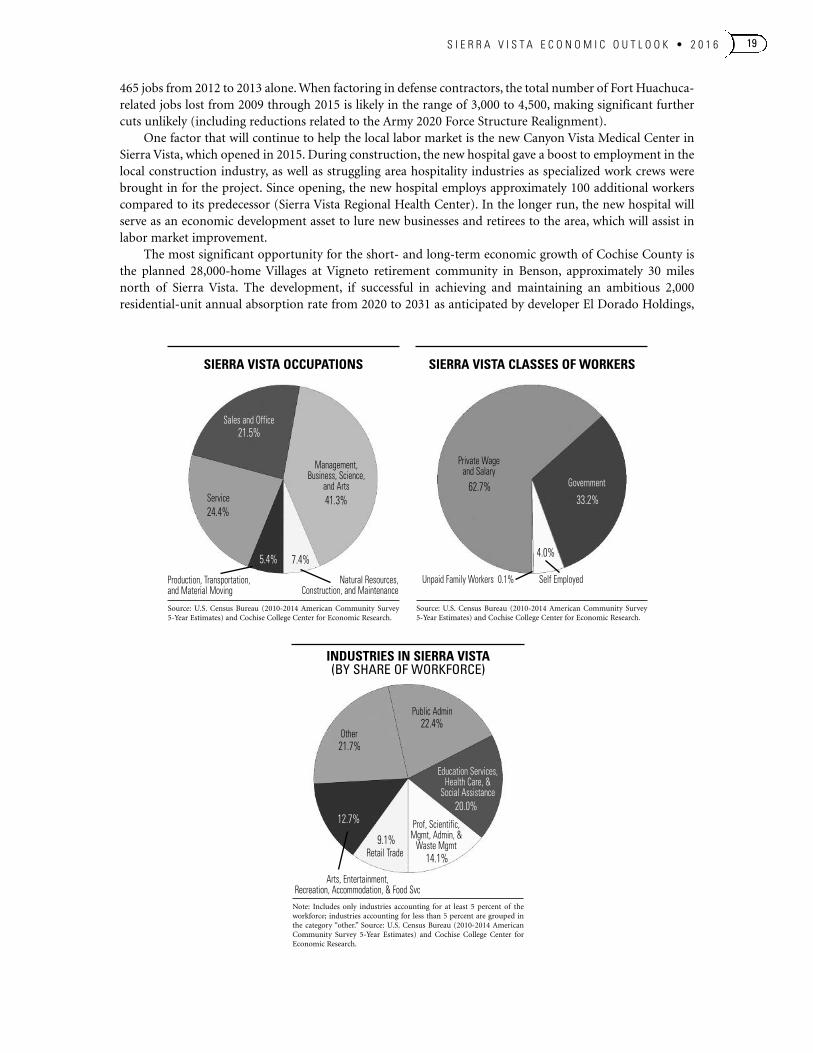
SIERRA VISTA CLASSES OF WORKERS
Source: U.S. Census Bureau (2010-2014 American Community Survey 5-Year Estimates) and Cochise College Center for Economic Research.
INDUSTRIES IN SIERRA VISTA(BY SHARE OF WORKFORCE)
Note: Includes only industries accounting for at least 5 percent of theworkforce; industries accounting for less than 5 percent are grouped inthe category “other.” Source: U.S. Census Bureau (2010-2014 AmericanCommunity Survey 5-Year Estimates) and Cochise College Center forEconomic Research.
Source: U.S. Census Bureau (2010-2014 American Community Survey 5-Year Estimates) and Cochise College Center for Economic Research.
SIERRA VISTA OCCUPATIONS
Education Services,Health Care, &
Social Assistance
Arts, Entertainment, Recreation, Accommodation, & Food Svc
Public Admin
Other
Prof, Scientific,Mgmt, Admin, &Waste Mgmt
Retail Trade
Production, Transportation,and Material Moving
Natural Resources,Construction, and Maintenance
Management,Business, Science,
and ArtsService
Sales and Office
41.3%
7.4%
21.5%
5.4%
24.4%
Self EmployedUnpaid Family Workers 0.1%
Government
33.2%
4.0%
Private Wageand Salary
62.7%
21.7%
22.4%
20.0%
14.1%
9.1%
12.7%
S I E R R A V I S T A E C O N O M I C O U T L O O K • 2 0 1 620
will spur economic activity, business development, and population growth, and potentially eliminate cyclicalunemployment, which has burdened the region since 2009. Even if developers fall far short of their target, theproject is likely to give a significant economic boost to the countywide economy in coming years. Sierra Vistacan expect to benefit from potential day visitors from the new development.
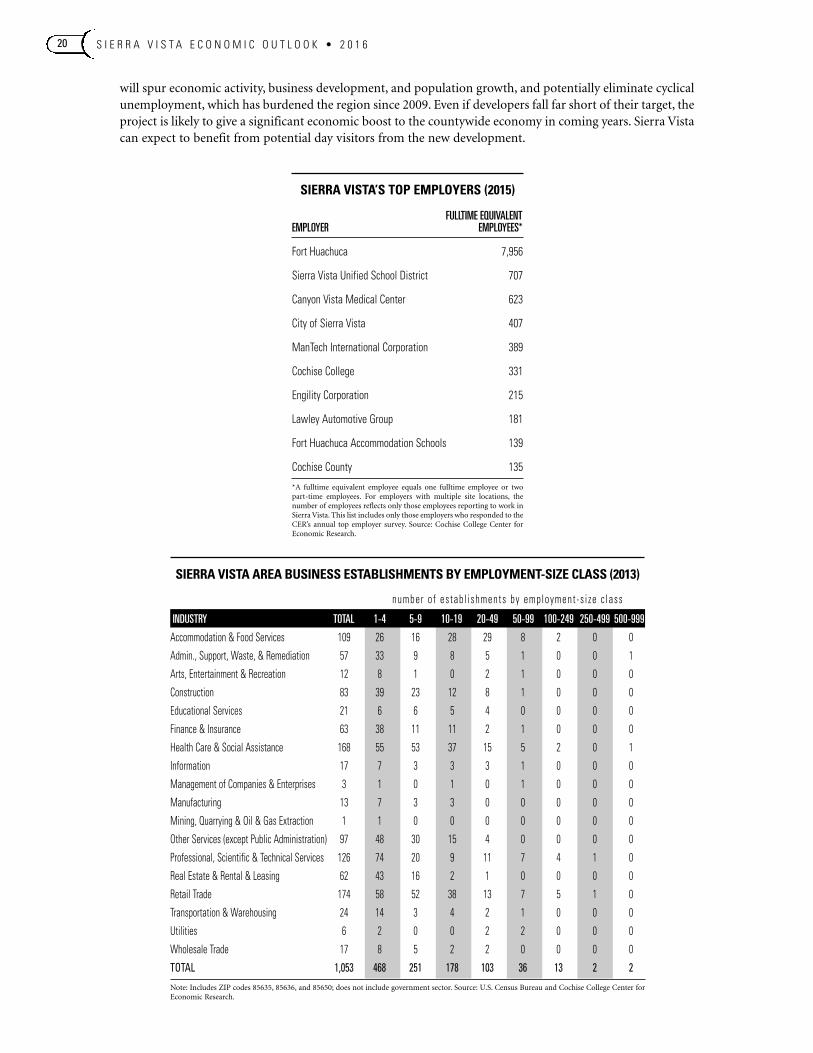
SIERRA VISTA AREA BUSINESS ESTABLISHMENTS BY EMPLOYMENT-SIZE CLASS (2013)
INDUSTRY TOTAL 1-4 5-9 10-19 20-49 50-99 100-249 250-499 500-999
Accommodation & Food Services 109 26 16 28 29 8 2 0 0
Admin., Support, Waste, & Remediation 57 33 9 8 5 1 0 0 1
Arts, Entertainment & Recreation 12 8 1 0 2 1 0 0 0
Construction 83 39 23 12 8 1 0 0 0
Educational Services 21 6 6 5 4 0 0 0 0
Finance & Insurance 63 38 11 11 2 1 0 0 0
Health Care & Social Assistance 168 55 53 37 15 5 2 0 1
Information 17 7 3 3 3 1 0 0 0
Management of Companies & Enterprises 3 1 0 1 0 1 0 0 0
Manufacturing 13 7 3 3 0 0 0 0 0
Mining, Quarrying & Oil & Gas Extraction 1 1 0 0 0 0 0 0 0
Other Services (except Public Administration) 97 48 30 15 4 0 0 0 0
Professional, Scientific & Technical Services 126 74 20 9 11 7 4 1 0
Real Estate & Rental & Leasing 62 43 16 2 1 0 0 0 0
Retail Trade 174 58 52 38 13 7 5 1 0
Transportation & Warehousing 24 14 3 4 2 1 0 0 0
Utilities 6 2 0 0 2 2 0 0 0
Wholesale Trade 17 8 5 2 2 0 0 0 0
TOTAL 1,053 468 251 178 103 36 13 2 2
Note: Includes ZIP codes 85635, 85636, and 85650; does not include government sector. Source: U.S. Census Bureau and Cochise College Center forEconomic Research.
number o f es tab l i shments by emp loyment -s i ze c lass
SIERRA VISTA’S TOP EMPLOYERS (2015)
FULLTIME EQUIVALENTEMPLOYER EMPLOYEES*
Fort Huachuca 7,956
Sierra Vista Unified School District 707
Canyon Vista Medical Center 623
City of Sierra Vista 407
ManTech International Corporation 389
Cochise College 331
Engility Corporation 215
Lawley Automotive Group 181
Fort Huachuca Accommodation Schools 139
Cochise County 135
*A fulltime equivalent employee equals one fulltime employee or twopart-time employees. For employers with multiple site locations, thenumber of employees reflects only those employees reporting to work inSierra Vista. This list includes only those employers who responded to theCER’s annual top employer survey. Source: Cochise College Center forEconomic Research.
S I E R R A V I S T A E C O N O M I C O U T L O O K • 2 0 1 6 21
Cochise County Arizona United States
Source: U.S. Bureau of Labor Statistics, Arizona Office of Employment andPopulation Statistics, and Cochise College Center for Economic Research.
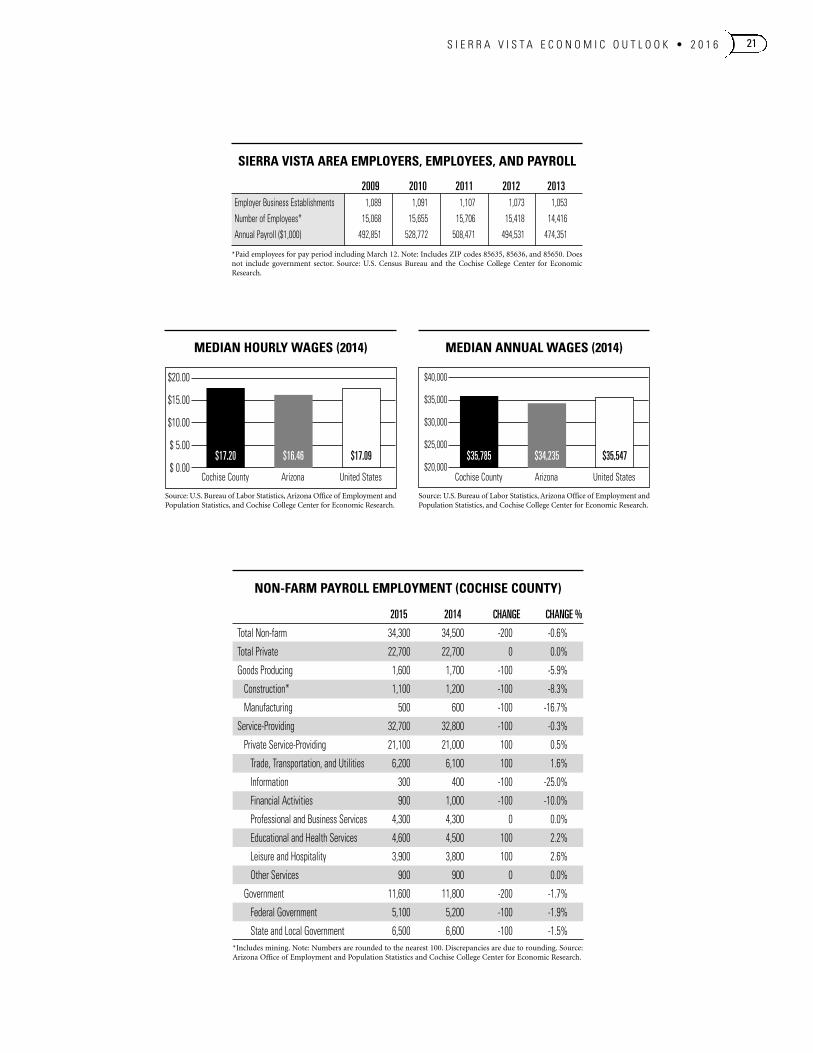
MEDIAN HOURLY WAGES (2014)
$20.00
$15.00
$10.00
$ 5.00
$ 0.00$17.20 $16.46 $17.09
$40,000
$35,000
$30,000
$25,000
$20,000
MEDIAN ANNUAL WAGES (2014)
NON-FARM PAYROLL EMPLOYMENT (COCHISE COUNTY)
2015 2014 CHANGE CHANGE %
Total Non-farm 34,300 34,500 -200 -0.6%
Total Private 22,700 22,700 0 0.0%
Goods Producing 1,600 1,700 -100 -5.9%
Construction* 1,100 1,200 -100 -8.3%
Manufacturing 500 600 -100 -16.7%
Service-Providing 32,700 32,800 -100 -0.3%
Private Service-Providing 21,100 21,000 100 0.5%
Trade, Transportation, and Utilities 6,200 6,100 100 1.6%
Information 300 400 -100 -25.0%
Financial Activities 900 1,000 -100 -10.0%
Professional and Business Services 4,300 4,300 0 0.0%
Educational and Health Services 4,600 4,500 100 2.2%
Leisure and Hospitality 3,900 3,800 100 2.6%
Other Services 900 900 0 0.0%
Government 11,600 11,800 -200 -1.7%
Federal Government 5,100 5,200 -100 -1.9%
State and Local Government 6,500 6,600 -100 -1.5%*Includes mining. Note: Numbers are rounded to the nearest 100. Discrepancies are due to rounding. Source:Arizona Office of Employment and Population Statistics and Cochise College Center for Economic Research.
SIERRA VISTA AREA EMPLOYERS, EMPLOYEES, AND PAYROLL
2009 2010 2011 2012 2013Employer Business Establishments 1,089 1,091 1,107 1,073 1,053
Number of Employees* 15,068 15,655 15,706 15,418 14,416
Annual Payroll ($1,000) 492,851 528,772 508,471 494,531 474,351
*Paid employees for pay period including March 12. Note: Includes ZIP codes 85635, 85636, and 85650. Doesnot include government sector. Source: U.S. Census Bureau and the Cochise College Center for EconomicResearch.
Cochise County Arizona United States
Source: U.S. Bureau of Labor Statistics, Arizona Office of Employment andPopulation Statistics, and Cochise College Center for Economic Research.
$35,785 $34,235 $35,547
S I E R R A V I S T A E C O N O M I C O U T L O O K • 2 0 1 622
Sales Outlook
Retail sales in Sierra Vista and countywide saw a strong rebound in 2015, which seems likely to continuethrough 2016 and beyond. Countywide, retail sales were up 2.4 percent in 2015 and in year-over-yearcomparisons were up in 12 of 15 months ended in December 2015 (following declines in eight of 10months). In Sierra Vista, retail sales for 2015 were up 4.9 percent and were up in 11 of 13 months in year-over-year comparisons (after falling in nine of 11 months). The healthy performance in 2015 and lookingforward is likely the result of a bottoming out of declines associated with Fort Huachuca and improvingconsumer sentiment as state and national economies improve. Lower gas prices have also helped, freeing uphousehold income.
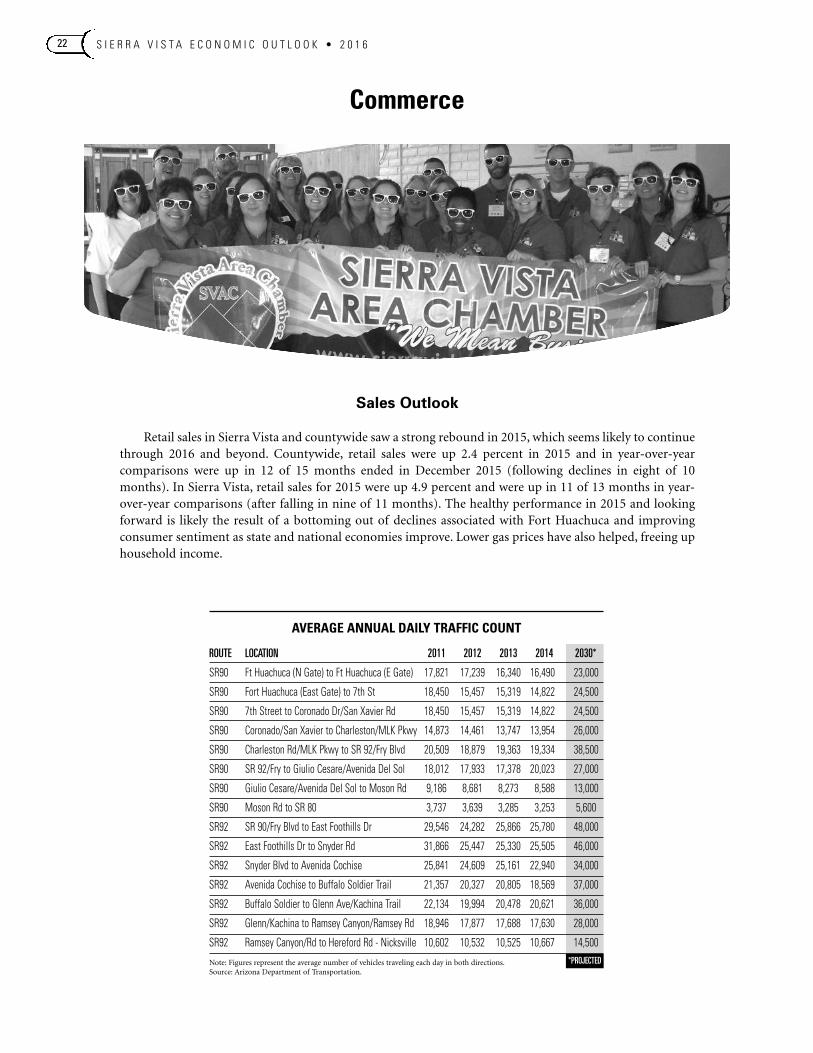
Commerce
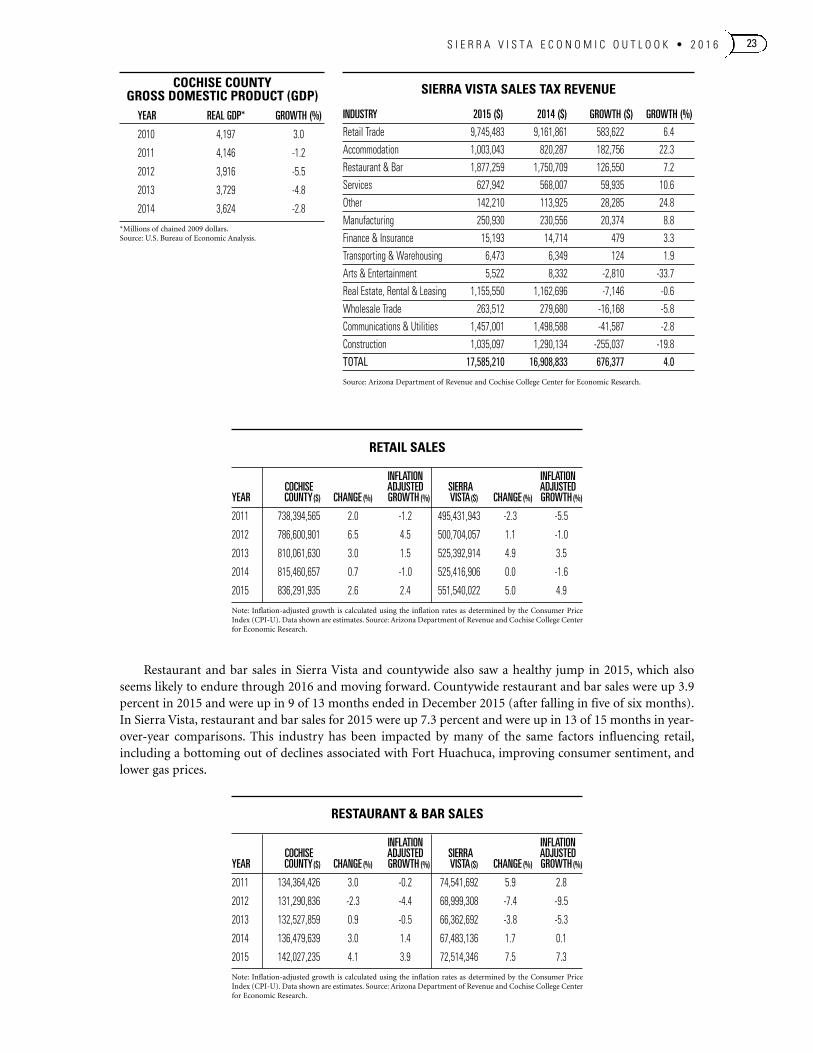
AVERAGE ANNUAL DAILY TRAFFIC COUNT
ROUTE LOCATION 2011 2012 2013 2014 2030*
SR90 Ft Huachuca (N Gate) to Ft Huachuca (E Gate) 17,821 17,239 16,340 16,490 23,000
SR90 Fort Huachuca (East Gate) to 7th St 18,450 15,457 15,319 14,822 24,500
SR90 7th Street to Coronado Dr/San Xavier Rd 18,450 15,457 15,319 14,822 24,500
SR90 Coronado/San Xavier to Charleston/MLK Pkwy 14,873 14,461 13,747 13,954 26,000
SR90 Charleston Rd/MLK Pkwy to SR 92/Fry Blvd 20,509 18,879 19,363 19,334 38,500
SR90 SR 92/Fry to Giulio Cesare/Avenida Del Sol 18,012 17,933 17,378 20,023 27,000
SR90 Giulio Cesare/Avenida Del Sol to Moson Rd 9,186 8,681 8,273 8,588 13,000
SR90 Moson Rd to SR 80 3,737 3,639 3,285 3,253 5,600
SR92 SR 90/Fry Blvd to East Foothills Dr 29,546 24,282 25,866 25,780 48,000
SR92 East Foothills Dr to Snyder Rd 31,866 25,447 25,330 25,505 46,000
SR92 Snyder Blvd to Avenida Cochise 25,841 24,609 25,161 22,940 34,000
SR92 Avenida Cochise to Buffalo Soldier Trail 21,357 20,327 20,805 18,569 37,000
SR92 Buffalo Soldier to Glenn Ave/Kachina Trail 22,134 19,994 20,478 20,621 36,000
SR92 Glenn/Kachina to Ramsey Canyon/Ramsey Rd 18,946 17,877 17,688 17,630 28,000
SR92 Ramsey Canyon/Rd to Hereford Rd - Nicksville 10,602 10,532 10,525 10,667 14,500
Note: Figures represent the average number of vehicles traveling each day in both directions.Source: Arizona Department of Transportation.
*PROJECTED
S I E R R A V I S T A E C O N O M I C O U T L O O K • 2 0 1 6 23
RETAIL SALES
INFLATION INFLATIONCOCHISE ADJUSTED SIERRA ADJUSTED
YEAR COUNTY($) CHANGE (%) GROWTH (%) VISTA($) CHANGE (%) GROWTH(%)
2011 738,394,565 2.0 -1.2 495,431,943 -2.3 -5.5
2012 786,600,901 6.5 4.5 500,704,057 1.1 -1.0
2013 810,061,630 3.0 1.5 525,392,914 4.9 3.5
2014 815,460,657 0.7 -1.0 525,416,906 0.0 -1.6
2015 836,291,935 2.6 2.4 551,540,022 5.0 4.9
Note: Inflation-adjusted growth is calculated using the inflation rates as determined by the Consumer PriceIndex (CPI-U). Data shown are estimates. Source: Arizona Department of Revenue and Cochise College Centerfor Economic Research.
RESTAURANT & BAR SALES
INFLATION INFLATIONCOCHISE ADJUSTED SIERRA ADJUSTED
YEAR COUNTY($) CHANGE (%) GROWTH (%) VISTA($) CHANGE (%) GROWTH(%)
2011 134,364,426 3.0 -0.2 74,541,692 5.9 2.8
2012 131,290,836 -2.3 -4.4 68,999,308 -7.4 -9.5
2013 132,527,859 0.9 -0.5 66,362,692 -3.8 -5.3
2014 136,479,639 3.0 1.4 67,483,136 1.7 0.1
2015 142,027,235 4.1 3.9 72,514,346 7.5 7.3
Note: Inflation-adjusted growth is calculated using the inflation rates as determined by the Consumer PriceIndex (CPI-U). Data shown are estimates. Source: Arizona Department of Revenue and Cochise College Centerfor Economic Research.
SIERRA VISTA SALES TAX REVENUE
INDUSTRY 2015 ($) 2014 ($) GROWTH ($) GROWTH (%)
Retail Trade 9,745,483 9,161,861 583,622 6.4
Accommodation 1,003,043 820,287 182,756 22.3
Restaurant & Bar 1,877,259 1,750,709 126,550 7.2
Services 627,942 568,007 59,935 10.6
Other 142,210 113,925 28,285 24.8
Manufacturing 250,930 230,556 20,374 8.8
Finance & Insurance 15,193 14,714 479 3.3
Transporting & Warehousing 6,473 6,349 124 1.9
Arts & Entertainment 5,522 8,332 -2,810 -33.7
Real Estate, Rental & Leasing 1,155,550 1,162,696 -7,146 -0.6
Wholesale Trade 263,512 279,680 -16,168 -5.8
Communications & Utilities 1,457,001 1,498,588 -41,587 -2.8
Construction 1,035,097 1,290,134 -255,037 -19.8
TOTAL 17,585,210 16,908,833 676,377 4.0
Source: Arizona Department of Revenue and Cochise College Center for Economic Research.
Restaurant and bar sales in Sierra Vista and countywide also saw a healthy jump in 2015, which alsoseems likely to endure through 2016 and moving forward. Countywide restaurant and bar sales were up 3.9percent in 2015 and were up in 9 of 13 months ended in December 2015 (after falling in five of six months).In Sierra Vista, restaurant and bar sales for 2015 were up 7.3 percent and were up in 13 of 15 months in year-over-year comparisons. This industry has been impacted by many of the same factors influencing retail,including a bottoming out of declines associated with Fort Huachuca, improving consumer sentiment, andlower gas prices.
COCHISE COUNTYGROSS DOMESTIC PRODUCT (GDP)
YEAR REAL GDP* GROWTH (%)
2010 4,197 3.0
2011 4,146 -1.2
2012 3,916 -5.5
2013 3,729 -4.8
2014 3,624 -2.8
*Millions of chained 2009 dollars. Source: U.S. Bureau of Economic Analysis.
S I E R R A V I S T A E C O N O M I C O U T L O O K • 2 0 1 624
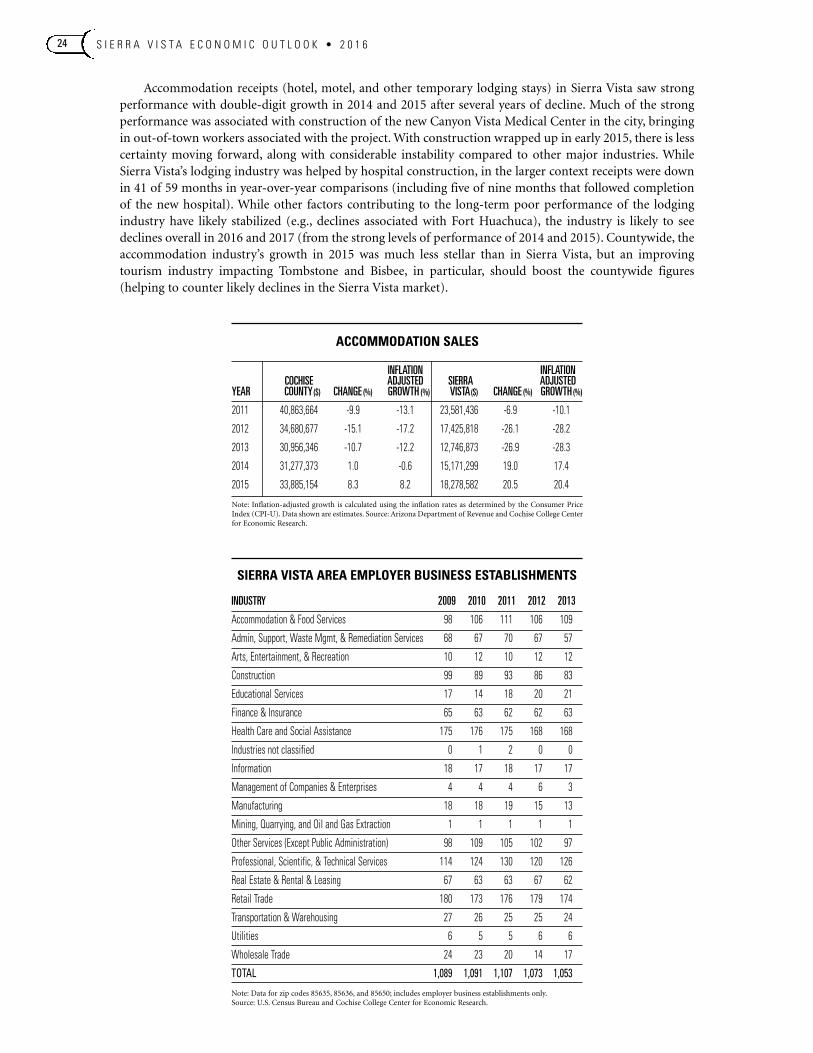
Accommodation receipts (hotel, motel, and other temporary lodging stays) in Sierra Vista saw strongperformance with double-digit growth in 2014 and 2015 after several years of decline. Much of the strongperformance was associated with construction of the new Canyon Vista Medical Center in the city, bringingin out-of-town workers associated with the project. With construction wrapped up in early 2015, there is lesscertainty moving forward, along with considerable instability compared to other major industries. WhileSierra Vista’s lodging industry was helped by hospital construction, in the larger context receipts were downin 41 of 59 months in year-over-year comparisons (including five of nine months that followed completionof the new hospital). While other factors contributing to the long-term poor performance of the lodgingindustry have likely stabilized (e.g., declines associated with Fort Huachuca), the industry is likely to seedeclines overall in 2016 and 2017 (from the strong levels of performance of 2014 and 2015). Countywide, theaccommodation industry’s growth in 2015 was much less stellar than in Sierra Vista, but an improvingtourism industry impacting Tombstone and Bisbee, in particular, should boost the countywide figures(helping to counter likely declines in the Sierra Vista market).
ACCOMMODATION SALES
INFLATION INFLATIONCOCHISE ADJUSTED SIERRA ADJUSTED
YEAR COUNTY($) CHANGE (%) GROWTH (%) VISTA($) CHANGE (%) GROWTH(%)
2011 40,863,664 -9.9 -13.1 23,581,436 -6.9 -10.1
2012 34,680,677 -15.1 -17.2 17,425,818 -26.1 -28.2
2013 30,956,346 -10.7 -12.2 12,746,873 -26.9 -28.3
2014 31,277,373 1.0 -0.6 15,171,299 19.0 17.4
2015 33,885,154 8.3 8.2 18,278,582 20.5 20.4
Note: Inflation-adjusted growth is calculated using the inflation rates as determined by the Consumer PriceIndex (CPI-U). Data shown are estimates. Source: Arizona Department of Revenue and Cochise College Centerfor Economic Research.
SIERRA VISTA AREA EMPLOYER BUSINESS ESTABLISHMENTS
INDUSTRY 2009 2010 2011 2012 2013
Accommodation & Food Services 98 106 111 106 109
Admin, Support, Waste Mgmt, & Remediation Services 68 67 70 67 57
Arts, Entertainment, & Recreation 10 12 10 12 12
Construction 99 89 93 86 83
Educational Services 17 14 18 20 21
Finance & Insurance 65 63 62 62 63
Health Care and Social Assistance 175 176 175 168 168
Industries not classified 0 1 2 0 0
Information 18 17 18 17 17
Management of Companies & Enterprises 4 4 4 6 3
Manufacturing 18 18 19 15 13
Mining, Quarrying, and Oil and Gas Extraction 1 1 1 1 1
Other Services (Except Public Administration) 98 109 105 102 97
Professional, Scientific, & Technical Services 114 124 130 120 126
Real Estate & Rental & Leasing 67 63 63 67 62
Retail Trade 180 173 176 179 174
Transportation & Warehousing 27 26 25 25 24
Utilities 6 5 5 6 6
Wholesale Trade 24 23 20 14 17
TOTAL 1,089 1,091 1,107 1,073 1,053
Note: Data for zip codes 85635, 85636, and 85650; includes employer business establishments only. Source: U.S. Census Bureau and Cochise College Center for Economic Research.
S I E R R A V I S T A E C O N O M I C O U T L O O K • 2 0 1 6 25
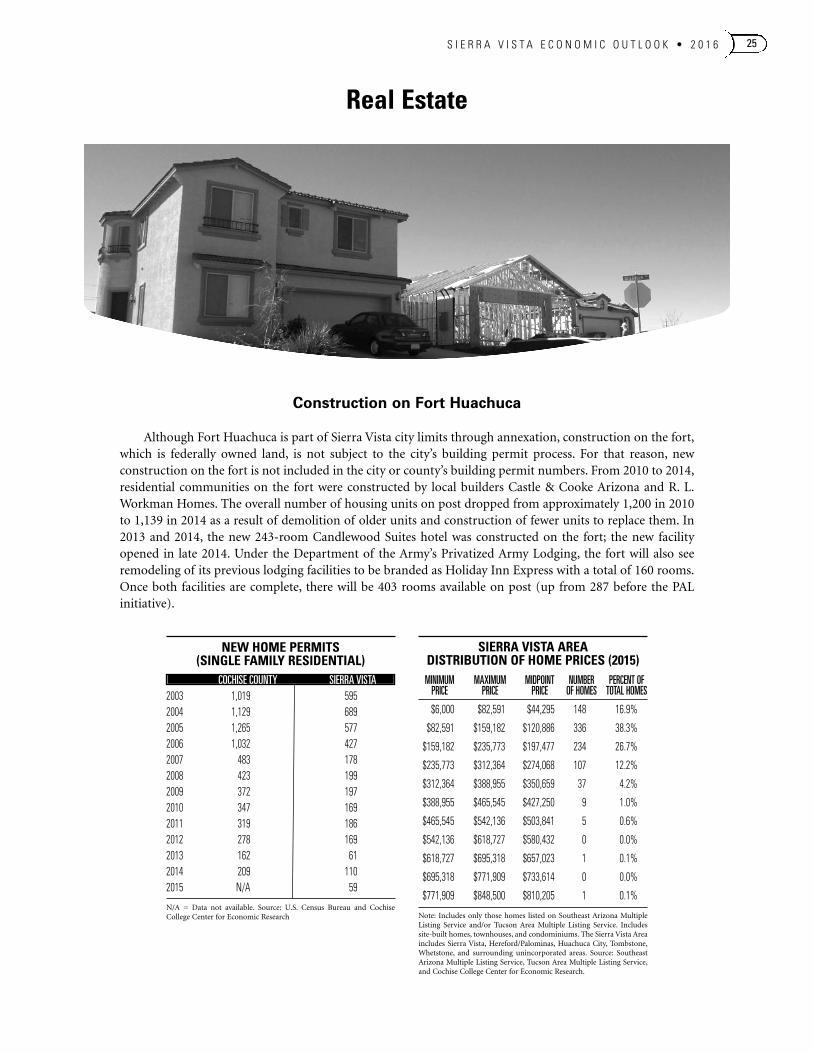
Construction on Fort Huachuca
Although Fort Huachuca is part of Sierra Vista city limits through annexation, construction on the fort,which is federally owned land, is not subject to the city’s building permit process. For that reason, newconstruction on the fort is not included in the city or county’s building permit numbers. From 2010 to 2014,residential communities on the fort were constructed by local builders Castle & Cooke Arizona and R. L.Workman Homes. The overall number of housing units on post dropped from approximately 1,200 in 2010to 1,139 in 2014 as a result of demolition of older units and construction of fewer units to replace them. In2013 and 2014, the new 243-room Candlewood Suites hotel was constructed on the fort; the new facilityopened in late 2014. Under the Department of the Army’s Privatized Army Lodging, the fort will also seeremodeling of its previous lodging facilities to be branded as Holiday Inn Express with a total of 160 rooms.Once both facilities are complete, there will be 403 rooms available on post (up from 287 before the PALinitiative).
Real Estate
NEW HOME PERMITS(SINGLE FAMILY RESIDENTIAL)
COCHISE COUNTY SIERRA VISTA2003 1,019 5952004 1,129 6892005 1,265 5772006 1,032 4272007 483 1782008 423 1992009 372 1972010 347 1692011 319 1862012 278 1692013 162 612014 209 1102015 N/A 59
N/A = Data not available. Source: U.S. Census Bureau and CochiseCollege Center for Economic Research
SIERRA VISTA AREADISTRIBUTION OF HOME PRICES (2015)MINIMUM MAXIMUM MIDPOINT NUMBER PERCENT OF
PRICE PRICE PRICE OF HOMES TOTAL HOMES
$6,000 $82,591 $44,295 148 16.9%
$82,591 $159,182 $120,886 336 38.3%
$159,182 $235,773 $197,477 234 26.7%
$235,773 $312,364 $274,068 107 12.2%
$312,364 $388,955 $350,659 37 4.2%
$388,955 $465,545 $427,250 9 1.0%
$465,545 $542,136 $503,841 5 0.6%
$542,136 $618,727 $580,432 0 0.0%
$618,727 $695,318 $657,023 1 0.1%
$695,318 $771,909 $733,614 0 0.0%
$771,909 $848,500 $810,205 1 0.1%
Note: Includes only those homes listed on Southeast Arizona MultipleListing Service and/or Tucson Area Multiple Listing Service. Includessite-built homes, townhouses, and condominiums. The Sierra Vista Areaincludes Sierra Vista, Hereford/Palominas, Huachuca City, Tombstone,Whetstone, and surrounding unincorporated areas. Source: SoutheastArizona Multiple Listing Service, Tucson Area Multiple Listing Service,and Cochise College Center for Economic Research.
S I E R R A V I S T A E C O N O M I C O U T L O O K • 2 0 1 626
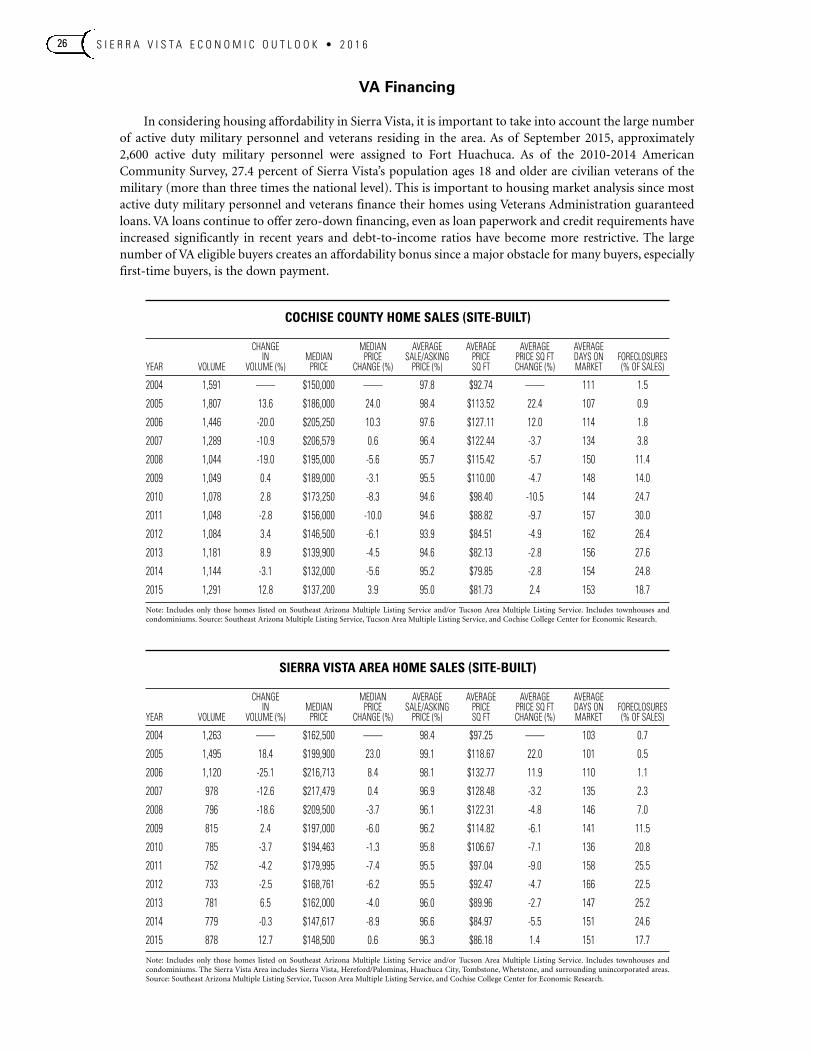
VA Financing
In considering housing affordability in Sierra Vista, it is important to take into account the large numberof active duty military personnel and veterans residing in the area. As of September 2015, approximately2,600 active duty military personnel were assigned to Fort Huachuca. As of the 2010-2014 AmericanCommunity Survey, 27.4 percent of Sierra Vista’s population ages 18 and older are civilian veterans of themilitary (more than three times the national level). This is important to housing market analysis since mostactive duty military personnel and veterans finance their homes using Veterans Administration guaranteedloans. VA loans continue to offer zero-down financing, even as loan paperwork and credit requirements haveincreased significantly in recent years and debt-to-income ratios have become more restrictive. The largenumber of VA eligible buyers creates an affordability bonus since a major obstacle for many buyers, especiallyfirst-time buyers, is the down payment.
COCHISE COUNTY HOME SALES (SITE-BUILT)
CHANGE MEDIAN AVERAGE AVERAGE AVERAGE AVERAGEIN MEDIAN PRICE SALE/ASKING PRICE PRICE SQ FT DAYS ON FORECLOSURES
YEAR VOLUME VOLUME (%) PRICE CHANGE (%) PRICE (%) SQ FT CHANGE (%) MARKET (% OF SALES)
2004 1,591 —— $150,000 —— 97.8 $92.74 —— 111 1.5
2005 1,807 13.6 $186,000 24.0 98.4 $113.52 22.4 107 0.9
2006 1,446 -20.0 $205,250 10.3 97.6 $127.11 12.0 114 1.8
2007 1,289 -10.9 $206,579 0.6 96.4 $122.44 -3.7 134 3.8
2008 1,044 -19.0 $195,000 -5.6 95.7 $115.42 -5.7 150 11.4
2009 1,049 0.4 $189,000 -3.1 95.5 $110.00 -4.7 148 14.0
2010 1,078 2.8 $173,250 -8.3 94.6 $98.40 -10.5 144 24.7
2011 1,048 -2.8 $156,000 -10.0 94.6 $88.82 -9.7 157 30.0
2012 1,084 3.4 $146,500 -6.1 93.9 $84.51 -4.9 162 26.4
2013 1,181 8.9 $139,900 -4.5 94.6 $82.13 -2.8 156 27.6
2014 1,144 -3.1 $132,000 -5.6 95.2 $79.85 -2.8 154 24.8
2015 1,291 12.8 $137,200 3.9 95.0 $81.73 2.4 153 18.7
Note: Includes only those homes listed on Southeast Arizona Multiple Listing Service and/or Tucson Area Multiple Listing Service. Includes townhouses andcondominiums. Source: Southeast Arizona Multiple Listing Service, Tucson Area Multiple Listing Service, and Cochise College Center for Economic Research.
SIERRA VISTA AREA HOME SALES (SITE-BUILT)
CHANGE MEDIAN AVERAGE AVERAGE AVERAGE AVERAGEIN MEDIAN PRICE SALE/ASKING PRICE PRICE SQ FT DAYS ON FORECLOSURES
YEAR VOLUME VOLUME (%) PRICE CHANGE (%) PRICE (%) SQ FT CHANGE (%) MARKET (% OF SALES)
2004 1,263 —— $162,500 —— 98.4 $97.25 —— 103 0.7
2005 1,495 18.4 $199,900 23.0 99.1 $118.67 22.0 101 0.5
2006 1,120 -25.1 $216,713 8.4 98.1 $132.77 11.9 110 1.1
2007 978 -12.6 $217,479 0.4 96.9 $128.48 -3.2 135 2.3
2008 796 -18.6 $209,500 -3.7 96.1 $122.31 -4.8 146 7.0
2009 815 2.4 $197,000 -6.0 96.2 $114.82 -6.1 141 11.5
2010 785 -3.7 $194,463 -1.3 95.8 $106.67 -7.1 136 20.8
2011 752 -4.2 $179,995 -7.4 95.5 $97.04 -9.0 158 25.5
2012 733 -2.5 $168,761 -6.2 95.5 $92.47 -4.7 166 22.5
2013 781 6.5 $162,000 -4.0 96.0 $89.96 -2.7 147 25.2
2014 779 -0.3 $147,617 -8.9 96.6 $84.97 -5.5 151 24.6
2015 878 12.7 $148,500 0.6 96.3 $86.18 1.4 151 17.7
Note: Includes only those homes listed on Southeast Arizona Multiple Listing Service and/or Tucson Area Multiple Listing Service. Includes townhouses andcondominiums. The Sierra Vista Area includes Sierra Vista, Hereford/Palominas, Huachuca City, Tombstone, Whetstone, and surrounding unincorporated areas.Source: Southeast Arizona Multiple Listing Service, Tucson Area Multiple Listing Service, and Cochise College Center for Economic Research.
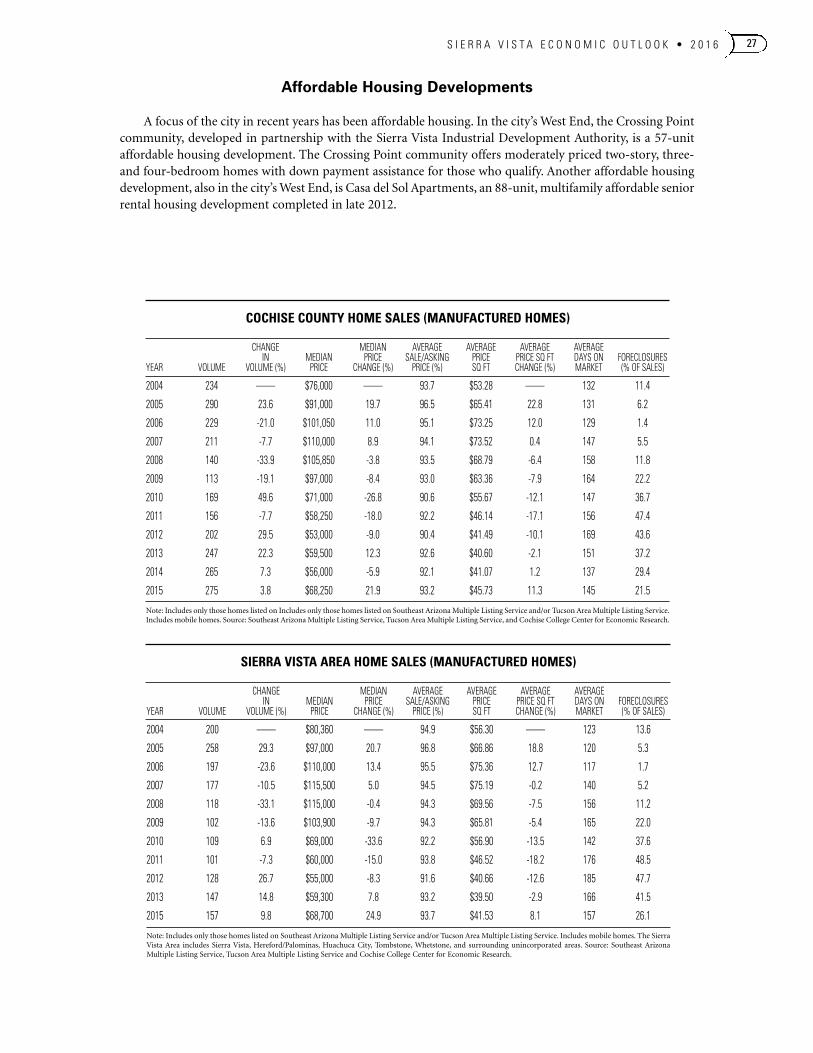
S I E R R A V I S T A E C O N O M I C O U T L O O K • 2 0 1 6 27
Affordable Housing Developments
A focus of the city in recent years has been affordable housing. In the city’s West End, the Crossing Pointcommunity, developed in partnership with the Sierra Vista Industrial Development Authority, is a 57-unitaffordable housing development. The Crossing Point community offers moderately priced two-story, three-and four-bedroom homes with down payment assistance for those who qualify. Another affordable housingdevelopment, also in the city’s West End, is Casa del Sol Apartments, an 88-unit, multifamily affordable seniorrental housing development completed in late 2012.
COCHISE COUNTY HOME SALES (MANUFACTURED HOMES)
CHANGE MEDIAN AVERAGE AVERAGE AVERAGE AVERAGEIN MEDIAN PRICE SALE/ASKING PRICE PRICE SQ FT DAYS ON FORECLOSURES
YEAR VOLUME VOLUME (%) PRICE CHANGE (%) PRICE (%) SQ FT CHANGE (%) MARKET (% OF SALES)
2004 234 —— $76,000 —— 93.7 $53.28 —— 132 11.4
2005 290 23.6 $91,000 19.7 96.5 $65.41 22.8 131 6.2
2006 229 -21.0 $101,050 11.0 95.1 $73.25 12.0 129 1.4
2007 211 -7.7 $110,000 8.9 94.1 $73.52 0.4 147 5.5
2008 140 -33.9 $105,850 -3.8 93.5 $68.79 -6.4 158 11.8
2009 113 -19.1 $97,000 -8.4 93.0 $63.36 -7.9 164 22.2
2010 169 49.6 $71,000 -26.8 90.6 $55.67 -12.1 147 36.7
2011 156 -7.7 $58,250 -18.0 92.2 $46.14 -17.1 156 47.4
2012 202 29.5 $53,000 -9.0 90.4 $41.49 -10.1 169 43.6
2013 247 22.3 $59,500 12.3 92.6 $40.60 -2.1 151 37.2
2014 265 7.3 $56,000 -5.9 92.1 $41.07 1.2 137 29.4
2015 275 3.8 $68,250 21.9 93.2 $45.73 11.3 145 21.5
Note: Includes only those homes listed on Includes only those homes listed on Southeast Arizona Multiple Listing Service and/or Tucson Area Multiple Listing Service.Includes mobile homes. Source: Southeast Arizona Multiple Listing Service, Tucson Area Multiple Listing Service, and Cochise College Center for Economic Research.
SIERRA VISTA AREA HOME SALES (MANUFACTURED HOMES)
CHANGE MEDIAN AVERAGE AVERAGE AVERAGE AVERAGEIN MEDIAN PRICE SALE/ASKING PRICE PRICE SQ FT DAYS ON FORECLOSURES
YEAR VOLUME VOLUME (%) PRICE CHANGE (%) PRICE (%) SQ FT CHANGE (%) MARKET (% OF SALES)
2004 200 —— $80,360 —— 94.9 $56.30 —— 123 13.6
2005 258 29.3 $97,000 20.7 96.8 $66.86 18.8 120 5.3
2006 197 -23.6 $110,000 13.4 95.5 $75.36 12.7 117 1.7
2007 177 -10.5 $115,500 5.0 94.5 $75.19 -0.2 140 5.2
2008 118 -33.1 $115,000 -0.4 94.3 $69.56 -7.5 156 11.2
2009 102 -13.6 $103,900 -9.7 94.3 $65.81 -5.4 165 22.0
2010 109 6.9 $69,000 -33.6 92.2 $56.90 -13.5 142 37.6
2011 101 -7.3 $60,000 -15.0 93.8 $46.52 -18.2 176 48.5
2012 128 26.7 $55,000 -8.3 91.6 $40.66 -12.6 185 47.7
2013 147 14.8 $59,300 7.8 93.2 $39.50 -2.9 166 41.5
2015 157 9.8 $68,700 24.9 93.7 $41.53 8.1 157 26.1
Note: Includes only those homes listed on Southeast Arizona Multiple Listing Service and/or Tucson Area Multiple Listing Service. Includes mobile homes. The SierraVista Area includes Sierra Vista, Hereford/Palominas, Huachuca City, Tombstone, Whetstone, and surrounding unincorporated areas. Source: Southeast ArizonaMultiple Listing Service, Tucson Area Multiple Listing Service and Cochise College Center for Economic Research.
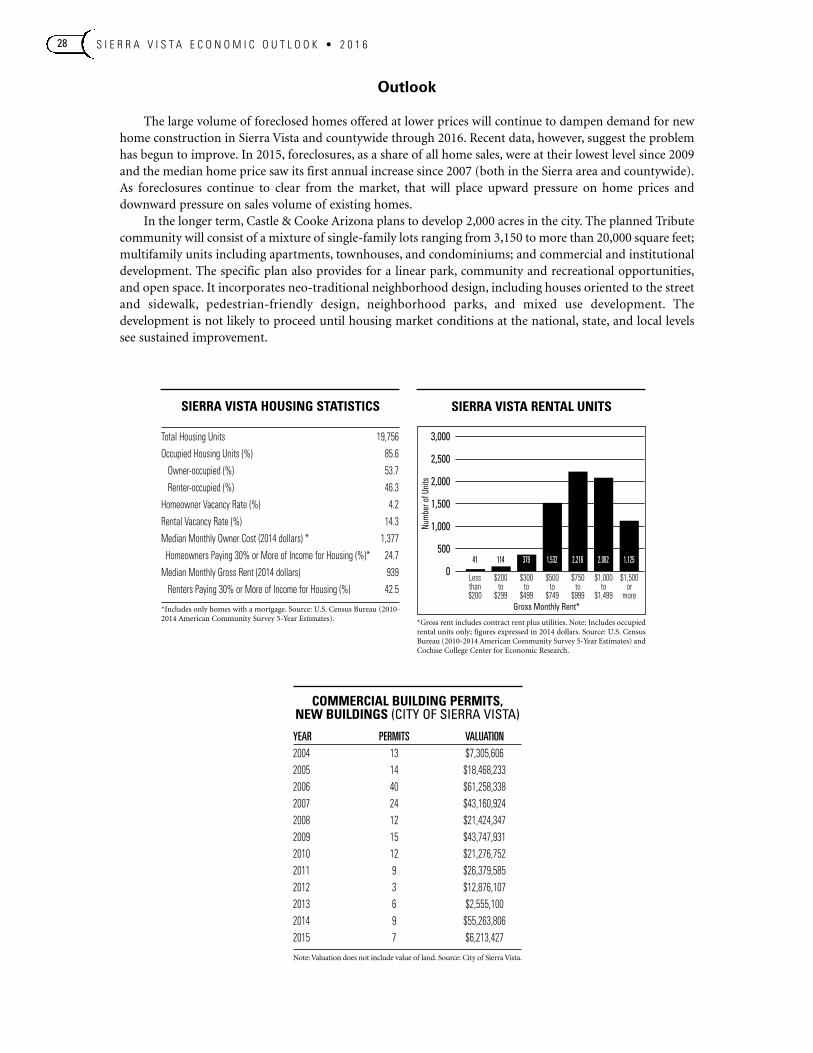
S I E R R A V I S T A E C O N O M I C O U T L O O K • 2 0 1 628
Outlook
The large volume of foreclosed homes offered at lower prices will continue to dampen demand for newhome construction in Sierra Vista and countywide through 2016. Recent data, however, suggest the problemhas begun to improve. In 2015, foreclosures, as a share of all home sales, were at their lowest level since 2009and the median home price saw its first annual increase since 2007 (both in the Sierra area and countywide).As foreclosures continue to clear from the market, that will place upward pressure on home prices anddownward pressure on sales volume of existing homes.
In the longer term, Castle & Cooke Arizona plans to develop 2,000 acres in the city. The planned Tributecommunity will consist of a mixture of single-family lots ranging from 3,150 to more than 20,000 square feet;multifamily units including apartments, townhouses, and condominiums; and commercial and institutionaldevelopment. The specific plan also provides for a linear park, community and recreational opportunities,and open space. It incorporates neo-traditional neighborhood design, including houses oriented to the streetand sidewalk, pedestrian-friendly design, neighborhood parks, and mixed use development. Thedevelopment is not likely to proceed until housing market conditions at the national, state, and local levelssee sustained improvement.
*Gross rent includes contract rent plus utilities. Note: Includes occupiedrental units only; figures expressed in 2014 dollars. Source: U.S. CensusBureau (2010-2014 American Community Survey 5-Year Estimates) andCochise College Center for Economic Research.
3,000
2,500
2,000
1,500
1,000
500
0Lessthan$200
$200to
$299
$300to
$499
$500to
$749
$750to
$999
$1,000to
$1,499
$1,500or
more
Numbe
r of U
nits
41 114 379 1,532 2,216 2,082 1,125
Gross Monthly Rent*
SIERRA VISTA HOUSING STATISTICS
Total Housing Units 19,756
Occupied Housing Units (%) 85.6
Owner-occupied (%) 53.7
Renter-occupied (%) 46.3
Homeowner Vacancy Rate (%) 4.2
Rental Vacancy Rate (%) 14.3
Median Monthly Owner Cost (2014 dollars) * 1,377
Homeowners Paying 30% or More of Income for Housing (%)* 24.7
Median Monthly Gross Rent (2014 dollars) 939
Renters Paying 30% or More of Income for Housing (%) 42.5
*Includes only homes with a mortgage. Source: U.S. Census Bureau (2010-2014 American Community Survey 5-Year Estimates).
COMMERCIAL BUILDING PERMITS, NEW BUILDINGS (CITY OF SIERRA VISTA)
YEAR PERMITS VALUATION2004 13 $7,305,6062005 14 $18,468,2332006 40 $61,258,3382007 24 $43,160,9242008 12 $21,424,3472009 15 $43,747,9312010 12 $21,276,7522011 9 $26,379,5852012 3 $12,876,1072013 6 $2,555,1002014 9 $55,263,8062015 7 $6,213,427
Note: Valuation does not include value of land. Source: City of Sierra Vista.
SIERRA VISTA RENTAL UNITS
S I E R R A V I S T A E C O N O M I C O U T L O O K • 2 0 1 6 29
Sierra Vista is served by five banks: Wells Fargo (www.WellsFargo.com), J.P. Morgan Chase(www.Chase.com), Bank of America (www.BankOfAmerica.com), National Bank of Arizona(www.NBArizona.com), and Compass Bank (www.BBVACompass.com). Additionally, Armed Forces Bank(www.AFBank.com) is located on Fort Huachuca. The area is also served by American Southwest Credit Union(www.ASCU.org), Navy Federal Credit Union (www.NavyFederal.org), and several financial services firmsincluding Guild Mortgage (GuildMortgage.com).
Banking & Financial Services
BANK DEPOSITS
SIERRA VISTA COCHISE COUNTYAMOUNT CHANGE AMOUNT CHANGE
YEAR ($000) (%) ($000) (%)
2011 569,146 3.2 1,034,039 1.9
2012 614,967 8.1 1,082,302 4.7
2013 668,778 8.8 1,118,042 3.3
2014 754,642 12.8 1,148,049 2.7
2015 770,680 2.1 1,133,687 -1.3
Note: Data reflect total deposits as of June 30 each year. Source: FederalDeposit Insurance Corporation and the Cochise College Center forEconomic Research.
Note: Data reflect total deposits in the 12 months ended June 30. Source:Federal Deposit Insurance Corporation and the Cochise College Centerfor Economic Research.
Bank of America 17.5%
SIERRA VISTA BANK DEPOSITS, MARKET SHARE (2015)
National Bankof Arizona14.2%
Wells Fargo34.4%
J.P. MorganChase Bank
26.4%
CompassBank7.5%
BANKRUPTCY FILINGS (PER 1,000 RESIDENTS)
YEAR COCHISE COUNTY ARIZONA UNITED STATES
2011 2.48 5.68 4.53
2012 1.79 4.39 3.89
2013 1.81 3.55 3.39
2014 1.70 2.98 2.94
2015 1.56 2.54 2.63
Note: Includes all chapters. Source: U.S. Bankruptcy Court, U.S. CensusBureau, Arizona Office of Employment and Population Statistics, andCochise College Center for Economic Research.
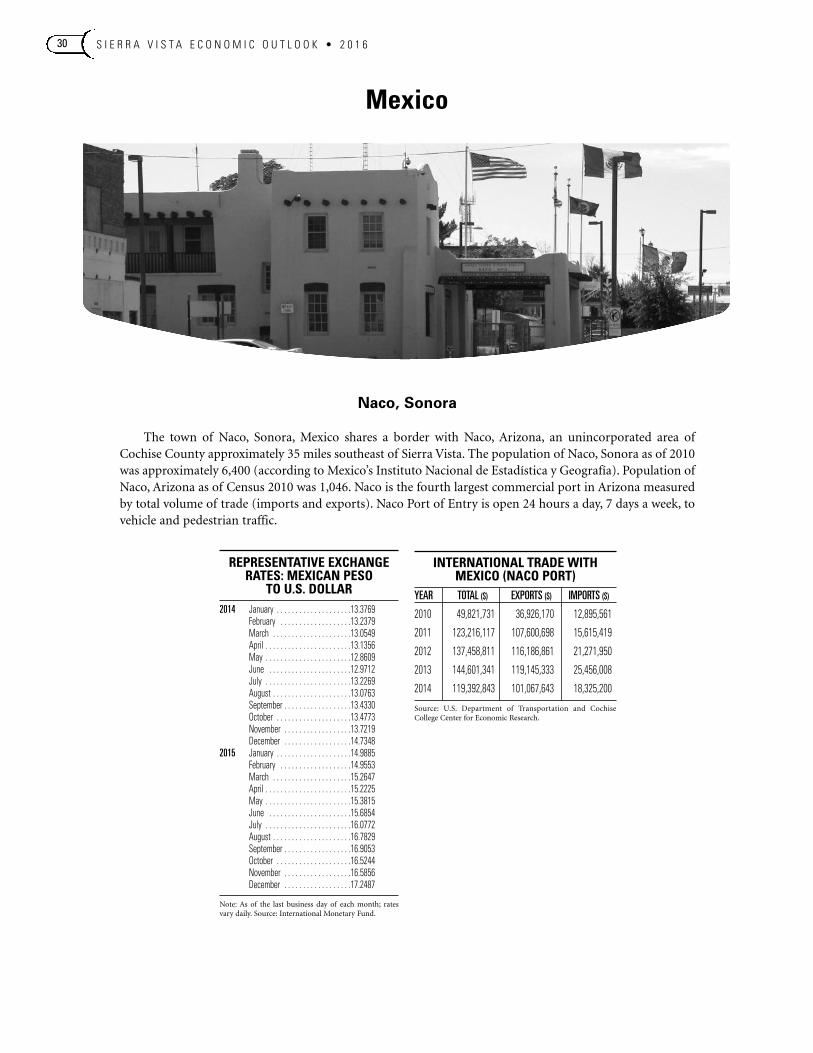
S I E R R A V I S T A E C O N O M I C O U T L O O K • 2 0 1 630
Naco, Sonora
The town of Naco, Sonora, Mexico shares a border with Naco, Arizona, an unincorporated area ofCochise County approximately 35 miles southeast of Sierra Vista. The population of Naco, Sonora as of 2010was approximately 6,400 (according to Mexico’s Instituto Nacional de Estadística y Geografía). Population ofNaco, Arizona as of Census 2010 was 1,046. Naco is the fourth largest commercial port in Arizona measuredby total volume of trade (imports and exports). Naco Port of Entry is open 24 hours a day, 7 days a week, tovehicle and pedestrian traffic.
Mexico
INTERNATIONAL TRADE WITHMEXICO (NACO PORT)
YEAR TOTAL ($) EXPORTS ($) IMPORTS ($)
2010 49,821,731 36,926,170 12,895,561
2011 123,216,117 107,600,698 15,615,419
2012 137,458,811 116,186,861 21,271,950
2013 144,601,341 119,145,333 25,456,008
2014 119,392,843 101,067,643 18,325,200
Source: U.S. Department of Transportation and CochiseCollege Center for Economic Research.
REPRESENTATIVE EXCHANGERATES: MEXICAN PESO
TO U.S. DOLLAR2014 January . . . . . . . . . . . . . . . . . . . .13.3769
February . . . . . . . . . . . . . . . . . . .13.2379March . . . . . . . . . . . . . . . . . . . . .13.0549April . . . . . . . . . . . . . . . . . . . . . . .13.1356May . . . . . . . . . . . . . . . . . . . . . . .12.8609June . . . . . . . . . . . . . . . . . . . . . .12.9712July . . . . . . . . . . . . . . . . . . . . . . .13.2269August . . . . . . . . . . . . . . . . . . . . .13.0763September . . . . . . . . . . . . . . . . . .13.4330October . . . . . . . . . . . . . . . . . . . .13.4773November . . . . . . . . . . . . . . . . . .13.7219December . . . . . . . . . . . . . . . . . .14.7348
2015 January . . . . . . . . . . . . . . . . . . . .14.9885February . . . . . . . . . . . . . . . . . . .14.9553March . . . . . . . . . . . . . . . . . . . . .15.2647April . . . . . . . . . . . . . . . . . . . . . . .15.2225May . . . . . . . . . . . . . . . . . . . . . . .15.3815June . . . . . . . . . . . . . . . . . . . . . .15.6854July . . . . . . . . . . . . . . . . . . . . . . .16.0772August . . . . . . . . . . . . . . . . . . . . .16.7829September . . . . . . . . . . . . . . . . . .16.9053October . . . . . . . . . . . . . . . . . . . .16.5244November . . . . . . . . . . . . . . . . . .16.5856December . . . . . . . . . . . . . . . . . .17.2487
Note: As of the last business day of each month; ratesvary daily. Source: International Monetary Fund.
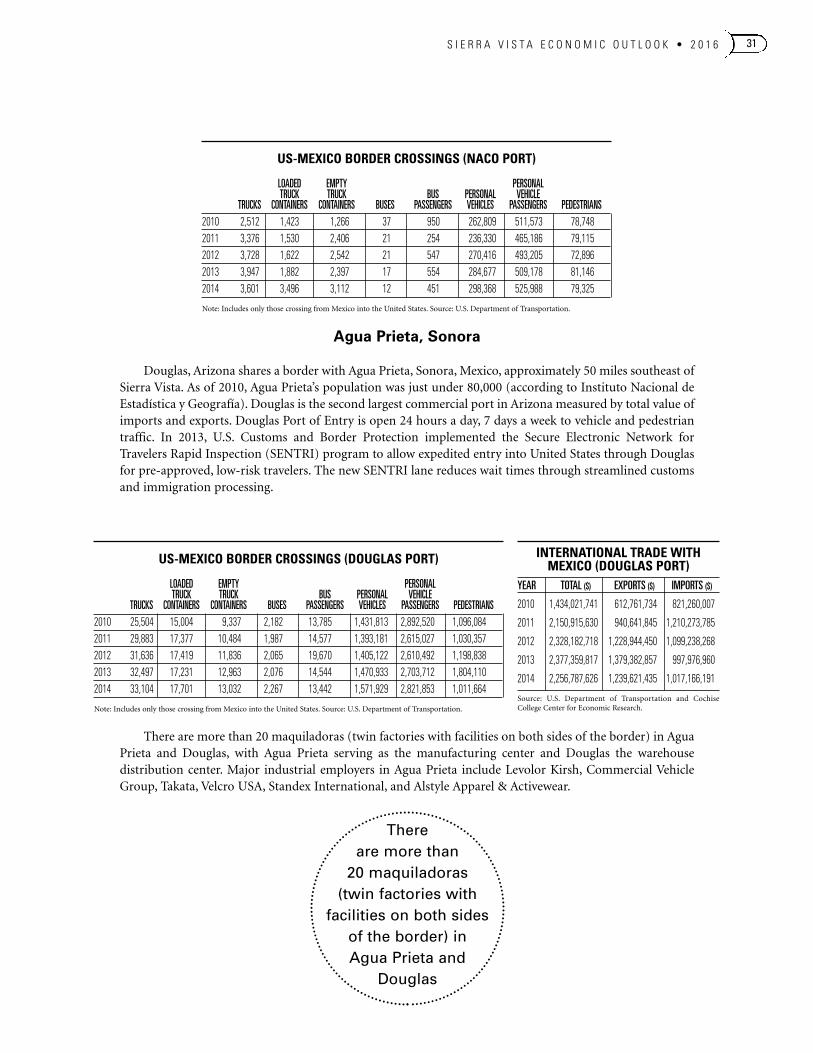
S I E R R A V I S T A E C O N O M I C O U T L O O K • 2 0 1 6 31
Thereare more than20 maquiladoras(twin factories withfacilities on both sidesof the border) inAgua Prieta and
Douglas
Agua Prieta, Sonora
Douglas, Arizona shares a border with Agua Prieta, Sonora, Mexico, approximately 50 miles southeast ofSierra Vista. As of 2010, Agua Prieta’s population was just under 80,000 (according to Instituto Nacional deEstadística y Geografía). Douglas is the second largest commercial port in Arizona measured by total value ofimports and exports. Douglas Port of Entry is open 24 hours a day, 7 days a week to vehicle and pedestriantraffic. In 2013, U.S. Customs and Border Protection implemented the Secure Electronic Network forTravelers Rapid Inspection (SENTRI) program to allow expedited entry into United States through Douglasfor pre-approved, low-risk travelers. The new SENTRI lane reduces wait times through streamlined customsand immigration processing.
INTERNATIONAL TRADE WITHMEXICO (DOUGLAS PORT)
YEAR TOTAL ($) EXPORTS ($) IMPORTS ($)
2010 1,434,021,741 612,761,734 821,260,007
2011 2,150,915,630 940,641,845 1,210,273,785
2012 2,328,182,718 1,228,944,450 1,099,238,268
2013 2,377,359,817 1,379,382,857 997,976,960
2014 2,256,787,626 1,239,621,435 1,017,166,191
Source: U.S. Department of Transportation and CochiseCollege Center for Economic Research.
US-MEXICO BORDER CROSSINGS (DOUGLAS PORT)
LOADED EMPTY PERSONALTRUCK TRUCK BUS PERSONAL VEHICLE
TRUCKS CONTAINERS CONTAINERS BUSES PASSENGERS VEHICLES PASSENGERS PEDESTRIANS2010 25,504 15,004 9,337 2,182 13,785 1,431,813 2,892,520 1,096,0842011 29,883 17,377 10,484 1,987 14,577 1,393,181 2,615,027 1,030,3572012 31,636 17,419 11,836 2,065 19,670 1,405,122 2,610,492 1,198,8382013 32,497 17,231 12,963 2,076 14,544 1,470,933 2,703,712 1,804,1102014 33,104 17,701 13,032 2,267 13,442 1,571,929 2,821,853 1,011,664
Note: Includes only those crossing from Mexico into the United States. Source: U.S. Department of Transportation.
US-MEXICO BORDER CROSSINGS (NACO PORT)
LOADED EMPTY PERSONALTRUCK TRUCK BUS PERSONAL VEHICLE
TRUCKS CONTAINERS CONTAINERS BUSES PASSENGERS VEHICLES PASSENGERS PEDESTRIANS2010 2,512 1,423 1,266 37 950 262,809 511,573 78,7482011 3,376 1,530 2,406 21 254 236,330 465,186 79,1152012 3,728 1,622 2,542 21 547 270,416 493,205 72,8962013 3,947 1,882 2,397 17 554 284,677 509,178 81,1462014 3,601 3,496 3,112 12 451 298,368 525,988 79,325
Note: Includes only those crossing from Mexico into the United States. Source: U.S. Department of Transportation.
There are more than 20 maquiladoras (twin factories with facilities on both sides of the border) in AguaPrieta and Douglas, with Agua Prieta serving as the manufacturing center and Douglas the warehousedistribution center. Major industrial employers in Agua Prieta include Levolor Kirsh, Commercial VehicleGroup, Takata, Velcro USA, Standex International, and Alstyle Apparel & Activewear.
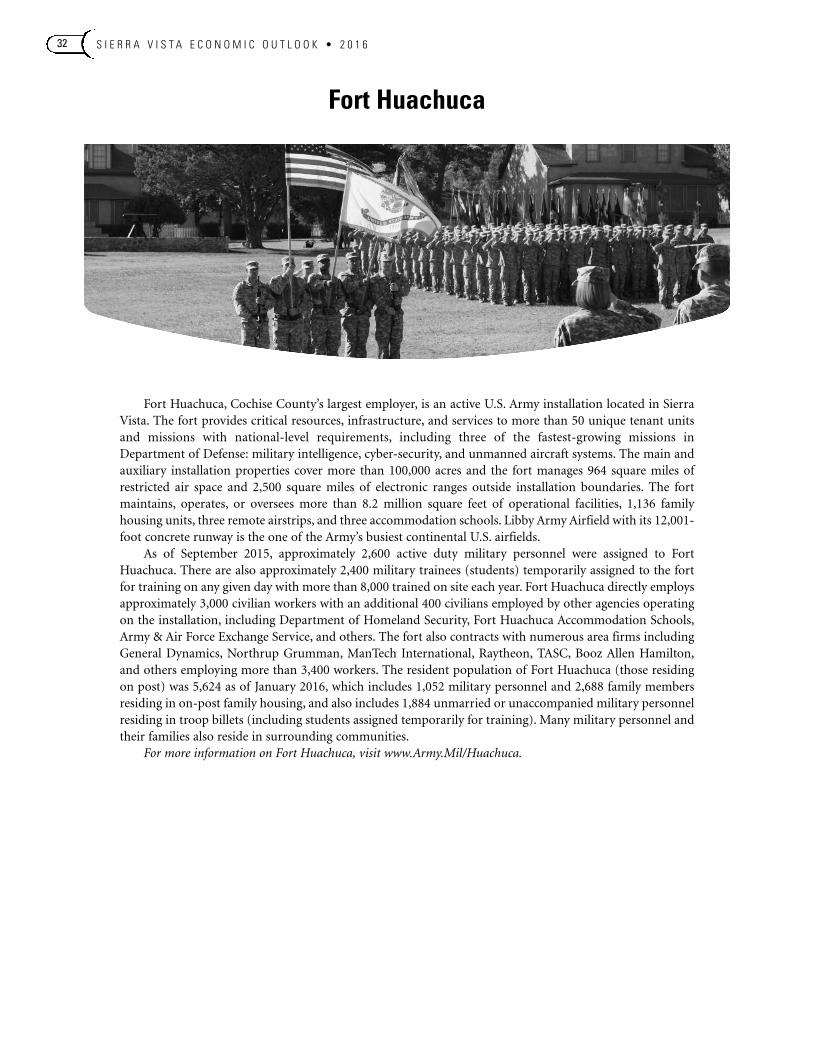
S I E R R A V I S T A E C O N O M I C O U T L O O K • 2 0 1 632
Fort Huachuca, Cochise County’s largest employer, is an active U.S. Army installation located in SierraVista. The fort provides critical resources, infrastructure, and services to more than 50 unique tenant unitsand missions with national-level requirements, including three of the fastest-growing missions inDepartment of Defense: military intelligence, cyber-security, and unmanned aircraft systems. The main andauxiliary installation properties cover more than 100,000 acres and the fort manages 964 square miles ofrestricted air space and 2,500 square miles of electronic ranges outside installation boundaries. The fortmaintains, operates, or oversees more than 8.2 million square feet of operational facilities, 1,136 familyhousing units, three remote airstrips, and three accommodation schools. Libby Army Airfield with its 12,001-foot concrete runway is the one of the Army’s busiest continental U.S. airfields.
As of September 2015, approximately 2,600 active duty military personnel were assigned to FortHuachuca. There are also approximately 2,400 military trainees (students) temporarily assigned to the fortfor training on any given day with more than 8,000 trained on site each year. Fort Huachuca directly employsapproximately 3,000 civilian workers with an additional 400 civilians employed by other agencies operatingon the installation, including Department of Homeland Security, Fort Huachuca Accommodation Schools,Army & Air Force Exchange Service, and others. The fort also contracts with numerous area firms includingGeneral Dynamics, Northrup Grumman, ManTech International, Raytheon, TASC, Booz Allen Hamilton,and others employing more than 3,400 workers. The resident population of Fort Huachuca (those residingon post) was 5,624 as of January 2016, which includes 1,052 military personnel and 2,688 family membersresiding in on-post family housing, and also includes 1,884 unmarried or unaccompanied military personnelresiding in troop billets (including students assigned temporarily for training). Many military personnel andtheir families also reside in surrounding communities. For more information on Fort Huachuca, visit www.Army.Mil/Huachuca.
Fort Huachuca
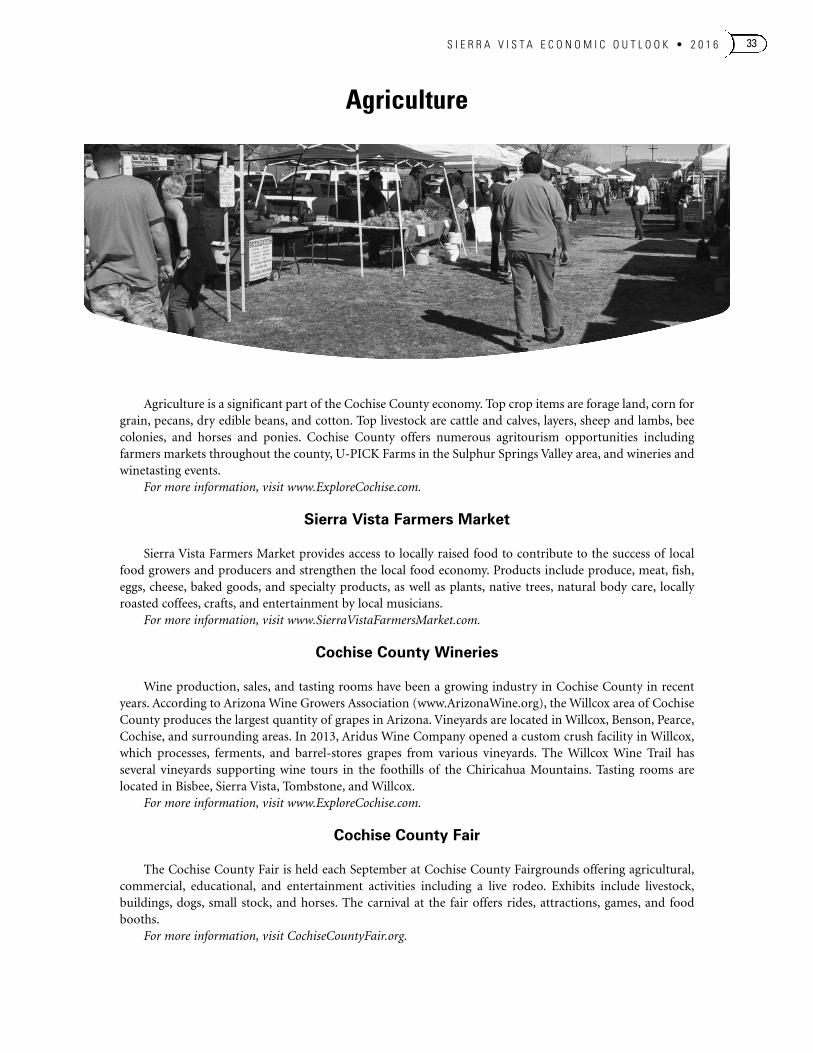
S I E R R A V I S T A E C O N O M I C O U T L O O K • 2 0 1 6 33
Agriculture is a significant part of the Cochise County economy. Top crop items are forage land, corn forgrain, pecans, dry edible beans, and cotton. Top livestock are cattle and calves, layers, sheep and lambs, beecolonies, and horses and ponies. Cochise County offers numerous agritourism opportunities includingfarmers markets throughout the county, U-PICK Farms in the Sulphur Springs Valley area, and wineries andwinetasting events. For more information, visit www.ExploreCochise.com.
Sierra Vista Farmers Market
Sierra Vista Farmers Market provides access to locally raised food to contribute to the success of localfood growers and producers and strengthen the local food economy. Products include produce, meat, fish,eggs, cheese, baked goods, and specialty products, as well as plants, native trees, natural body care, locallyroasted coffees, crafts, and entertainment by local musicians. For more information, visit www.SierraVistaFarmersMarket.com.
Cochise County Wineries
Wine production, sales, and tasting rooms have been a growing industry in Cochise County in recentyears. According to Arizona Wine Growers Association (www.ArizonaWine.org), the Willcox area of CochiseCounty produces the largest quantity of grapes in Arizona. Vineyards are located in Willcox, Benson, Pearce,Cochise, and surrounding areas. In 2013, Aridus Wine Company opened a custom crush facility in Willcox,which processes, ferments, and barrel-stores grapes from various vineyards. The Willcox Wine Trail hasseveral vineyards supporting wine tours in the foothills of the Chiricahua Mountains. Tasting rooms arelocated in Bisbee, Sierra Vista, Tombstone, and Willcox. For more information, visit www.ExploreCochise.com.
Cochise County Fair
The Cochise County Fair is held each September at Cochise County Fairgrounds offering agricultural,commercial, educational, and entertainment activities including a live rodeo. Exhibits include livestock,buildings, dogs, small stock, and horses. The carnival at the fair offers rides, attractions, games, and foodbooths. For more information, visit CochiseCountyFair.org.
Agriculture
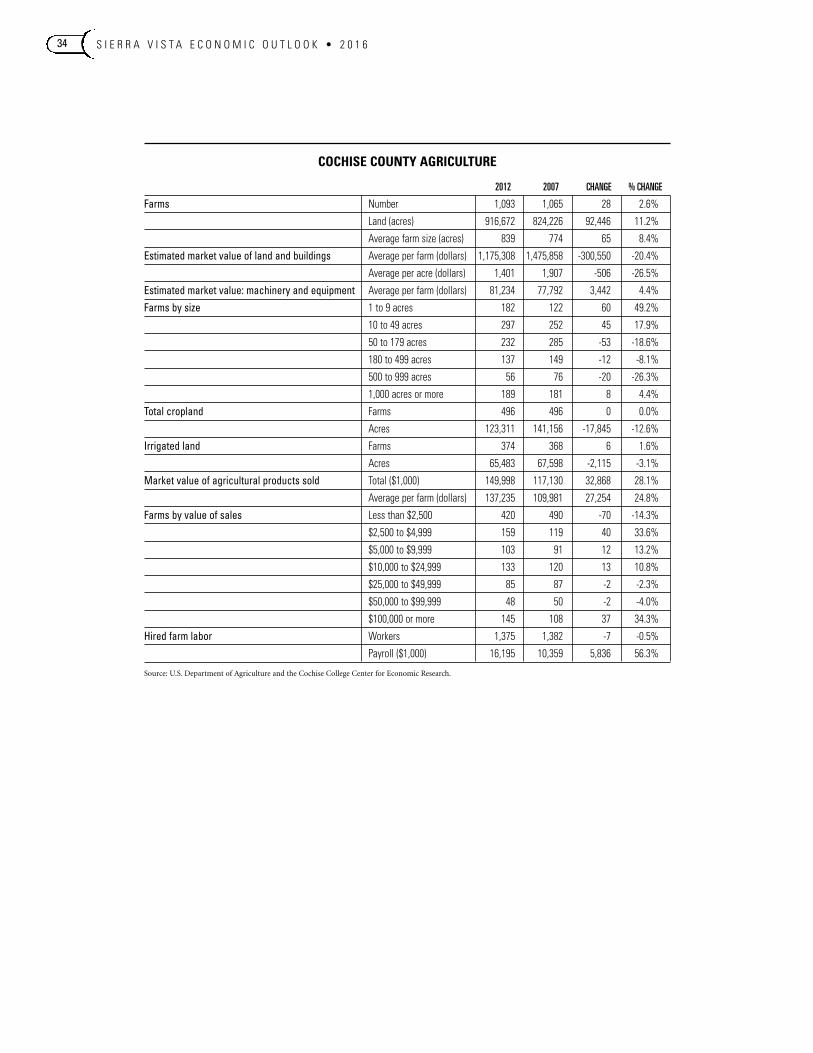
S I E R R A V I S T A E C O N O M I C O U T L O O K • 2 0 1 634
COCHISE COUNTY AGRICULTURE
2012 2007 CHANGE % CHANGE
Farms Number 1,093 1,065 28 2.6%
Land (acres) 916,672 824,226 92,446 11.2%
Average farm size (acres) 839 774 65 8.4%
Estimated market value of land and buildings Average per farm (dollars) 1,175,308 1,475,858 -300,550 -20.4%
Average per acre (dollars) 1,401 1,907 -506 -26.5%
Estimated market value: machinery and equipment Average per farm (dollars) 81,234 77,792 3,442 4.4%
Farms by size 1 to 9 acres 182 122 60 49.2%
10 to 49 acres 297 252 45 17.9%
50 to 179 acres 232 285 -53 -18.6%
180 to 499 acres 137 149 -12 -8.1%
500 to 999 acres 56 76 -20 -26.3%
1,000 acres or more 189 181 8 4.4%
Total cropland Farms 496 496 0 0.0%
Acres 123,311 141,156 -17,845 -12.6%
Irrigated land Farms 374 368 6 1.6%
Acres 65,483 67,598 -2,115 -3.1%
Market value of agricultural products sold Total ($1,000) 149,998 117,130 32,868 28.1%
Average per farm (dollars) 137,235 109,981 27,254 24.8%
Farms by value of sales Less than $2,500 420 490 -70 -14.3%
$2,500 to $4,999 159 119 40 33.6%
$5,000 to $9,999 103 91 12 13.2%
$10,000 to $24,999 133 120 13 10.8%
$25,000 to $49,999 85 87 -2 -2.3%
$50,000 to $99,999 48 50 -2 -4.0%
$100,000 or more 145 108 37 34.3%
Hired farm labor Workers 1,375 1,382 -7 -0.5%
Payroll ($1,000) 16,195 10,359 5,836 56.3%
Source: U.S. Department of Agriculture and the Cochise College Center for Economic Research.
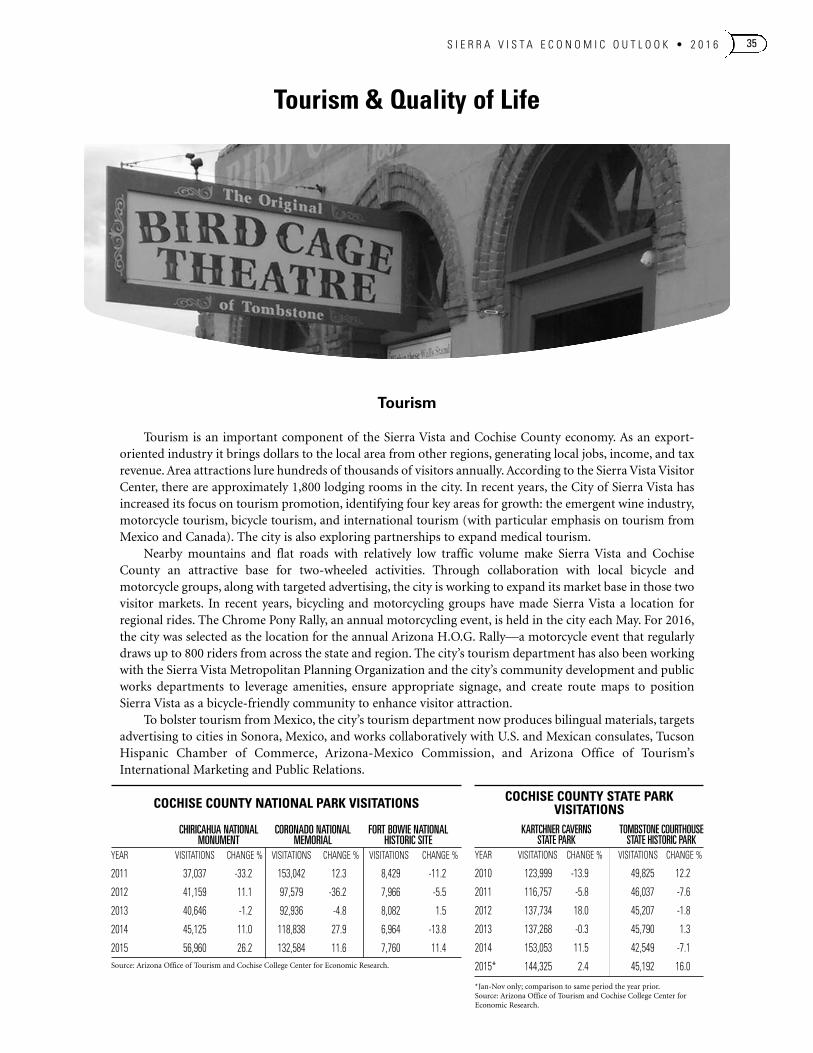
S I E R R A V I S T A E C O N O M I C O U T L O O K • 2 0 1 6 35
Tourism
Tourism is an important component of the Sierra Vista and Cochise County economy. As an export-oriented industry it brings dollars to the local area from other regions, generating local jobs, income, and taxrevenue. Area attractions lure hundreds of thousands of visitors annually. According to the Sierra Vista VisitorCenter, there are approximately 1,800 lodging rooms in the city. In recent years, the City of Sierra Vista hasincreased its focus on tourism promotion, identifying four key areas for growth: the emergent wine industry,motorcycle tourism, bicycle tourism, and international tourism (with particular emphasis on tourism fromMexico and Canada). The city is also exploring partnerships to expand medical tourism.
Nearby mountains and flat roads with relatively low traffic volume make Sierra Vista and CochiseCounty an attractive base for two-wheeled activities. Through collaboration with local bicycle andmotorcycle groups, along with targeted advertising, the city is working to expand its market base in those twovisitor markets. In recent years, bicycling and motorcycling groups have made Sierra Vista a location forregional rides. The Chrome Pony Rally, an annual motorcycling event, is held in the city each May. For 2016,the city was selected as the location for the annual Arizona H.O.G. Rally—a motorcycle event that regularlydraws up to 800 riders from across the state and region. The city’s tourism department has also been workingwith the Sierra Vista Metropolitan Planning Organization and the city’s community development and publicworks departments to leverage amenities, ensure appropriate signage, and create route maps to positionSierra Vista as a bicycle-friendly community to enhance visitor attraction.
To bolster tourism from Mexico, the city’s tourism department now produces bilingual materials, targetsadvertising to cities in Sonora, Mexico, and works collaboratively with U.S. and Mexican consulates, TucsonHispanic Chamber of Commerce, Arizona-Mexico Commission, and Arizona Office of Tourism’sInternational Marketing and Public Relations.
Tourism & Quality of Life
COCHISE COUNTY NATIONAL PARK VISITATIONS
CHIRICAHUA NATIONAL CORONADO NATIONAL FORT BOWIE NATIONALMONUMENT MEMORIAL HISTORIC SITE
YEAR VISITATIONS CHANGE % VISITATIONS CHANGE % VISITATIONS CHANGE %
2011 37,037 -33.2 153,042 12.3 8,429 -11.2
2012 41,159 11.1 97,579 -36.2 7,966 -5.5
2013 40,646 -1.2 92,936 -4.8 8,082 1.5
2014 45,125 11.0 118,838 27.9 6,964 -13.8
2015 56,960 26.2 132,584 11.6 7,760 11.4Source: Arizona Office of Tourism and Cochise College Center for Economic Research.
COCHISE COUNTY STATE PARKVISITATIONS
KARTCHNER CAVERNS TOMBSTONE COURTHOUSESTATE PARK STATE HISTORIC PARK
YEAR VISITATIONS CHANGE % VISITATIONS CHANGE %
2010 123,999 -13.9 49,825 12.2
2011 116,757 -5.8 46,037 -7.6
2012 137,734 18.0 45,207 -1.8
2013 137,268 -0.3 45,790 1.3
2014 153,053 11.5 42,549 -7.1
2015* 144,325 2.4 45,192 16.0
*Jan-Nov only; comparison to same period the year prior. Source: Arizona Office of Tourism and Cochise College Center forEconomic Research.
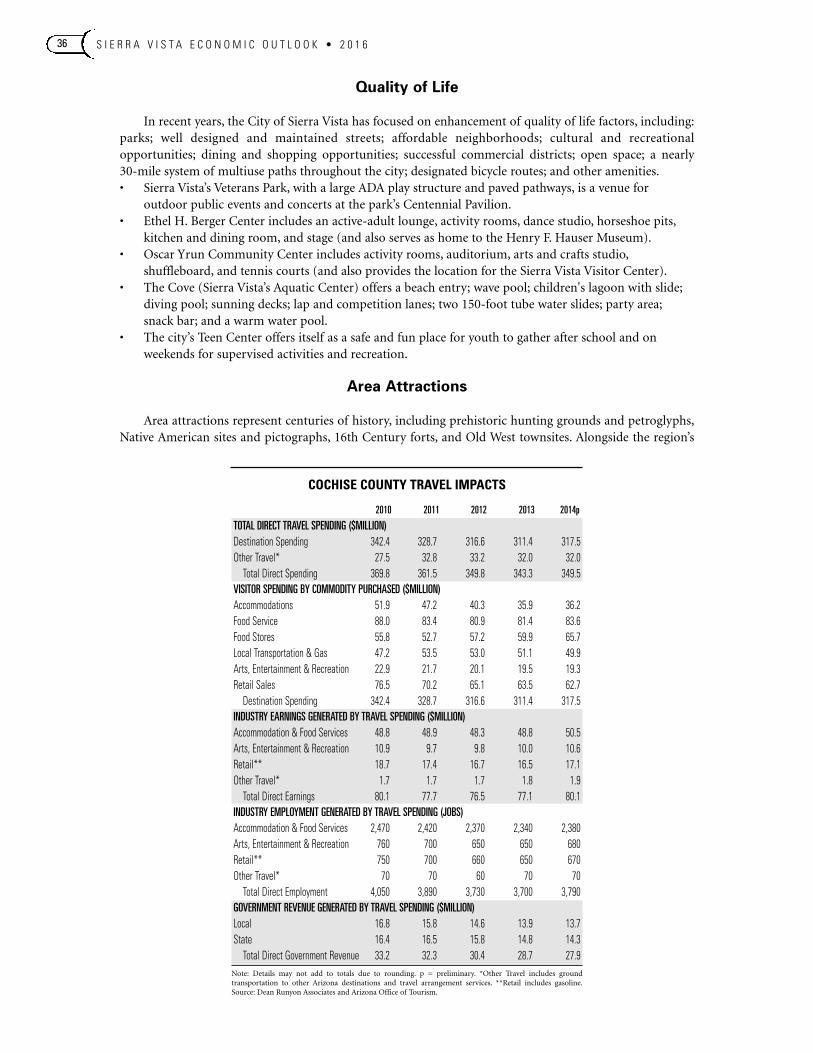
S I E R R A V I S T A E C O N O M I C O U T L O O K • 2 0 1 636
Quality of Life
In recent years, the City of Sierra Vista has focused on enhancement of quality of life factors, including:parks; well designed and maintained streets; affordable neighborhoods; cultural and recreationalopportunities; dining and shopping opportunities; successful commercial districts; open space; a nearly 30-mile system of multiuse paths throughout the city; designated bicycle routes; and other amenities. • Sierra Vista’s Veterans Park, with a large ADA play structure and paved pathways, is a venue for
outdoor public events and concerts at the park’s Centennial Pavilion. • Ethel H. Berger Center includes an active-adult lounge, activity rooms, dance studio, horseshoe pits,
kitchen and dining room, and stage (and also serves as home to the Henry F. Hauser Museum). • Oscar Yrun Community Center includes activity rooms, auditorium, arts and crafts studio,
shuffleboard, and tennis courts (and also provides the location for the Sierra Vista Visitor Center). • The Cove (Sierra Vista’s Aquatic Center) offers a beach entry; wave pool; children's lagoon with slide;
diving pool; sunning decks; lap and competition lanes; two 150-foot tube water slides; party area;snack bar; and a warm water pool.
• The city’s Teen Center offers itself as a safe and fun place for youth to gather after school and onweekends for supervised activities and recreation.
Area Attractions
Area attractions represent centuries of history, including prehistoric hunting grounds and petroglyphs,Native American sites and pictographs, 16th Century forts, and Old West townsites. Alongside the region’s
COCHISE COUNTY TRAVEL IMPACTS
2010 2011 2012 2013 2014p
TOTAL DIRECT TRAVEL SPENDING ($MILLION)Destination Spending 342.4 328.7 316.6 311.4 317.5Other Travel* 27.5 32.8 33.2 32.0 32.0
Total Direct Spending 369.8 361.5 349.8 343.3 349.5VISITOR SPENDING BY COMMODITY PURCHASED ($MILLION)Accommodations 51.9 47.2 40.3 35.9 36.2Food Service 88.0 83.4 80.9 81.4 83.6Food Stores 55.8 52.7 57.2 59.9 65.7Local Transportation & Gas 47.2 53.5 53.0 51.1 49.9Arts, Entertainment & Recreation 22.9 21.7 20.1 19.5 19.3Retail Sales 76.5 70.2 65.1 63.5 62.7
Destination Spending 342.4 328.7 316.6 311.4 317.5INDUSTRY EARNINGS GENERATED BY TRAVEL SPENDING ($MILLION)Accommodation & Food Services 48.8 48.9 48.3 48.8 50.5Arts, Entertainment & Recreation 10.9 9.7 9.8 10.0 10.6Retail** 18.7 17.4 16.7 16.5 17.1Other Travel* 1.7 1.7 1.7 1.8 1.9
Total Direct Earnings 80.1 77.7 76.5 77.1 80.1INDUSTRY EMPLOYMENT GENERATED BY TRAVEL SPENDING (JOBS)Accommodation & Food Services 2,470 2,420 2,370 2,340 2,380Arts, Entertainment & Recreation 760 700 650 650 680Retail** 750 700 660 650 670Other Travel* 70 70 60 70 70
Total Direct Employment 4,050 3,890 3,730 3,700 3,790GOVERNMENT REVENUE GENERATED BY TRAVEL SPENDING ($MILLION)Local 16.8 15.8 14.6 13.9 13.7State 16.4 16.5 15.8 14.8 14.3
Total Direct Government Revenue 33.2 32.3 30.4 28.7 27.9Note: Details may not add to totals due to rounding. p = preliminary. *Other Travel includes groundtransportation to other Arizona destinations and travel arrangement services. **Retail includes gasoline.Source: Dean Runyon Associates and Arizona Office of Tourism.
S I E R R A V I S T A E C O N O M I C O U T L O O K • 2 0 1 6 37
• American Museum of Natural History’sSouthwestern Research Station
• Amerind Foundation and Museum• Arizona Folklore Preserve• Arizona’s Sky Islands• Brown Canyon• Butterfield Trail• Chiricahua Mountains and Chiricahua
National Monument• Cities of Bisbee, Tombstone, and Douglas• Cities of Naco, Agua Prieta, and historic Arizpe
in Sonora, Mexico• Cochise Stronghold• Coronado National Forest and Coronado
National Monument• Dragoon Springs Butterfield Mail Station• Fort Bowie National Historic Site• Fort Huachuca (National Historic Landmark
District)• Fort Huachuca Historical Museum and Army
Intelligence Museum• Gammons Gulch Ghost Town Movie Set
• Geronimo Surrender Site• Ghost towns of Charleston, Gleeson, Fairbank,
and Dos Cabezas• Holy Trinity Monastery• John Slaughter Ranch• Kartchner Caverns State Park• Lehner Mammoth Kill Site and Murray
Springs Clovis Site• More than 20 Arizona wineries• Numerous public and private observatories• Our Lady of the Sierras Shrine• Ramsey Canyon Preserve• Rucker Canyon Archaeological District• San Bernardino Wildlife Refuge• San Pedro House • San Pedro Riparian National Conservation
Area• Sierra Vista Environmental Operations Park• Spooner’s Arboretum• Texas Canyon• Whitewater Draw Wildlife Area
history, Sierra Vista and Cochise County are well known for birding and wildlife viewing opportunities andare home to numerous attractions, including:
JANUARY • Sierra Vista Symphony WinterConcert
FEBRUARY • Cochise Cowboy Music & PoetryGathering
MARCH • Cochise Community CreativeWriting Celebration
• High Desert Gardening &Landscaping Conference
• Hummingbird Stitchers QuiltGuild Show
• Men Who Cook
APRIL • Cultural Diversity Fair• Festival of the Southwest• Sierra Vista Economic OutlookLuncheon
• Sierra Vista Symphony SpringConcert
MAY • Chrome Pony Motorcycle Rally• Southwest Wings Spring Fling• West End Fair
JULY • 4th of July Celebration
AUGUST • Southwest Wings Birding &Nature Festival
SEPTEMBER • Dine under the Stars• Oktoberfest
OCTOBER • Art in the Park• Cars in the Park• Huachuca Gem, Mineral &Jewelry Show
• Brown Canyon Ranch OpenHouse
• Sierra Vista Symphony FallConcert
NOVEMBER • Festival of Trees
DECEMBER • Christmas Light Parade• Community Tree LightingCeremony
• Festival of Trees• Fort Huachuca Historic HolidayHome Tour
• Santa Fly-In• Santas in the Park
Annual Events
For more information on Sierra Vista area attractions and events, visit www.VisitSierraVista.com.
S I E R R A V I S T A E C O N O M I C O U T L O O K • 2 0 1 638
Incentives
SSVEC, which provides electrical service to Sierra Vista and other areas of Cochise County, offers severalresidential and commercial incentives to promote use of alternative energy, including solar (photovoltaicsystems and solar water heating) and wind. For more information, visit www.SSVEC.org. Customers may also qualify for state and federal tax incentives
(for more information, visit www.DSIREUSA.org).
National Bank of Arizona Green Returns Program
National Bank of Arizona offers special financing opportunities for renewable energy and efficiencyprojects under its Green Returns Banking and Financing program. For more information, visit www.NBArizona.com.
Environmental Stewardship
To help protect resources such as Fort Huachuca and the San Pedro River, the city has developed severalwater conservation programs and actions. In 2013, the city was notified by U.S. Environmental ProtectionAgency that it was the first community in the nation to adopt the agency's WaterSense program for futureresidential development. WaterSense is a partnership program by EPA that seeks to protect the future of thenation's water supply by offering ways to use less water with water-efficient products, new homes, andservices. Water conservation codes for all new development now require developers to use a variety of water-saving devices in new construction, including waterless urinals in commercial buildings and recirculatingpumps or on-demand devices for hot water in new residential construction. City codes also require newcommercial developments to build on-site detention basins; eliminate turf in new commercial landscapes infavor of low-water-use plants; and limit turf in front yards of new homes to 200 square-feet.
The city also partners with The Cochise Water Project by providing funding to expand rebates forreplacing high-flow toilets, turf replacement, and other programs. The city received several grants for publicfacilities in 2015 to install a number of water harvesting tanks and replace lawn in front of city hall withartificial turf. In addition, the city is a joint funding partner with Fort Huachuca and Cochise County tosupport the ‘Water Wise’ program hosted by University of Arizona Cooperative Extension. Water Wiseprovides education and programs related to water conservation to residents and businesses.
The city’s wastewater treatment facility also incorporates technology that results in recharge of nearlyseven million gallons of water to the aquifer each year making it the largest water mitigation activity in theSierra Vista sub-watershed, according to city officials. The wastewater treatment facility and city’s compostprogram have also reduced costs for waste disposal and wastewater treatment. For more information, visit www.SierraVistaAZ.gov.
Renewable Energy & The Environment
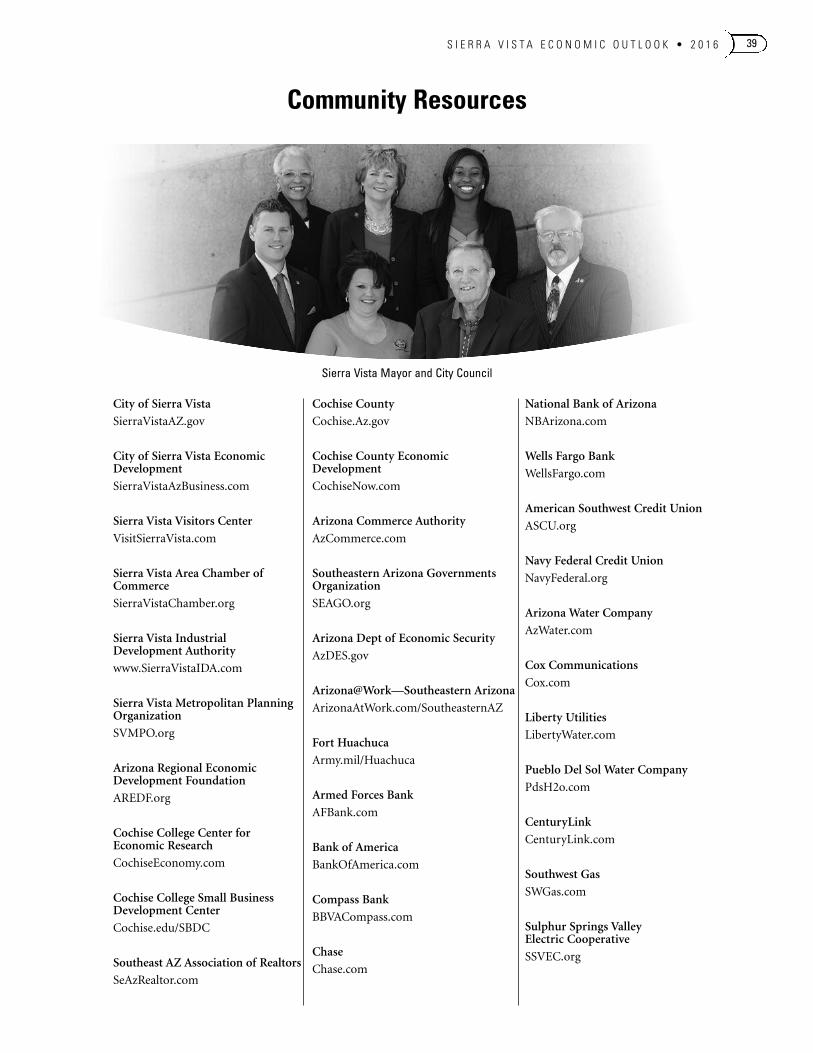
S I E R R A V I S T A E C O N O M I C O U T L O O K • 2 0 1 6 39
City of Sierra Vista
SierraVistaAZ.gov
City of Sierra Vista EconomicDevelopment
SierraVistaAzBusiness.com
Sierra Vista Visitors Center
VisitSierraVista.com
Sierra Vista Area Chamber ofCommerce
SierraVistaChamber.org
Sierra Vista Industrial Development Authority
www.SierraVistaIDA.com
Sierra Vista Metropolitan PlanningOrganization
SVMPO.org
Arizona Regional EconomicDevelopment Foundation
AREDF.org
Cochise College Center forEconomic Research
CochiseEconomy.com
Cochise College Small BusinessDevelopment Center
Cochise.edu/SBDC
Southeast AZ Association of Realtors
SeAzRealtor.com
Community Resources
Cochise County
Cochise.Az.gov
Cochise County EconomicDevelopment
CochiseNow.com
Arizona Commerce Authority
AzCommerce.com
Southeastern Arizona GovernmentsOrganization
SEAGO.org
Arizona Dept of Economic Security
AzDES.gov
Arizona@Work—Southeastern Arizona
ArizonaAtWork.com/SoutheasternAZ
Fort Huachuca
Army.mil/Huachuca
Armed Forces Bank
AFBank.com
Bank of America
BankOfAmerica.com
Compass Bank
BBVACompass.com
Chase
Chase.com
National Bank of Arizona
NBArizona.com
Wells Fargo Bank
WellsFargo.com
American Southwest Credit Union
ASCU.org
Navy Federal Credit Union
NavyFederal.org
Arizona Water Company
AzWater.com
Cox Communications
Cox.com
Liberty Utilities
LibertyWater.com
Pueblo Del Sol Water Company
PdsH2o.com
CenturyLink
CenturyLink.com
Southwest Gas
SWGas.com
Sulphur Springs Valley Electric Cooperative
SSVEC.org
Sierra Vista Mayor and City Council
S I E R R A V I S T A E C O N O M I C O U T L O O K • 2 0 1 640
Chief EconomistRobert Carreira, Ph.D.
Sierra Vista Economic Advisory CommitteeAngela Camara—Fort Huachuca Public Affairs
Larry Catten—Southeastern Arizona Governments Organization Rick Coffman—Castle & Cooke, Arizona
Frank Gonzalez—Lawley Automotive GroupJudy Hector—City of Sierra Vista
Angelica Hernandez—Arizona@Work-Southeast ArizonaMignonne Hollis—Arizona Regional Economic Development Foundation
Mary Jacobs—City of Sierra VistaSimone McFarland—City of Sierra Vista
Frank Moro—Sierra Vista Industrial Development Authority and First West Properties CorporationTom Reardon—First Things First
Mark Schmitt—Cochise College Small Business Development CenterMary Tieman—Sierra Vista Area Chamber of Commerce
Victoria Yarbrough—City of Sierra Vista
Cochise College Center for Economic Research (CER), founded in 1995, provides economicinformation, analysis, and forecasting to help leaders in the public, private, and nonprofit sectors makebetter-informed decisions. CER hosts economic outlook events each year in Sierra Vista, Douglas, Bisbee, andBenson, and publishes the annual Sierra Vista Economic Outlook, Douglas Economic Outlook, Bisbee EconomicOutlook, and Benson Economic Outlook (released in conjunction with the events). CER is a member ofAssociation for University Business and Economic Research (AUBER) and is a U.S. Census Bureau State DataCenter affiliate receiving and disseminating Census Bureau data to local governments and nongovernmentaldata users at no charge or on a cost-recovery/reimbursable basis. For more information, visit www.CochiseEconomy.com.
About the Center for Economic Research