Embed Size (px)
Citation preview
Sidoti Micro Cap Investor Conference January 10, 2011
2
The Private Securities Litigation Reform Act of 1995 provides a “safe harbor” for forward-looking statements. Certain information included in this presentation contains statements that are forward-looking, such as statements relating to results of operations and financial conditions and business development activities, as well as capital spending and financing sources. Such forward-looking information involves important risks and uncertainties that could significantly affect anticipated results in the future and, accordingly, such results may differ materially from those expressed in any forward-looking statements made by or on behalf of Mercer. For more information regarding these risks and uncertainties, review Mercer’s filings with the United States Securities and Exchange Commission.
Forward Looking Statements
3
Overview of the Company
4
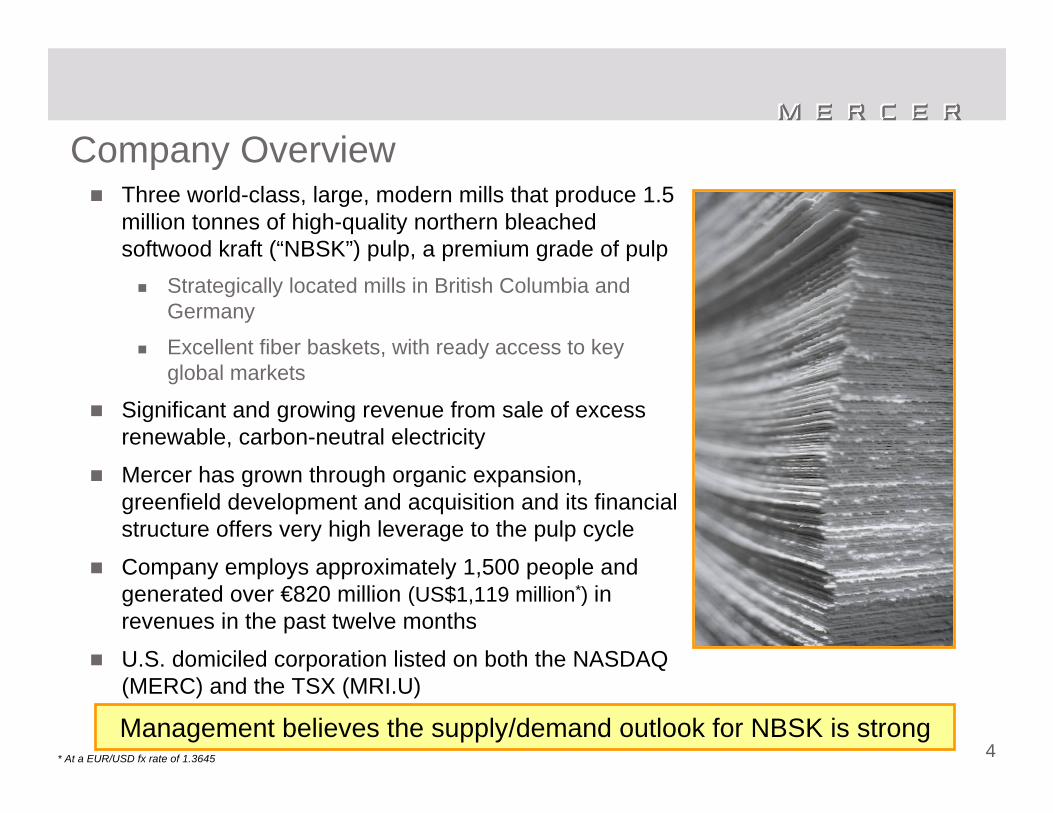
Company OverviewThree world-class, large, modern mills that produce 1.5 million tonnes of high-quality northern bleached softwood kraft (“NBSK”) pulp, a premium grade of pulp
Strategically located mills in British Columbia and Germany
Excellent fiber baskets, with ready access to key global markets
Significant and growing revenue from sale of excess renewable, carbon-neutral electricity
Mercer has grown through organic expansion, greenfield development and acquisition and its financial structure offers very high leverage to the pulp cycle
Company employs approximately 1,500 people and generated over €820 million (US$1,119 million*) in revenues in the past twelve months
U.S. domiciled corporation listed on both the NASDAQ (MERC) and the TSX (MRI.U)
Management believes the supply/demand outlook for NBSK is strong* At a EUR/USD fx rate of 1.3645
5
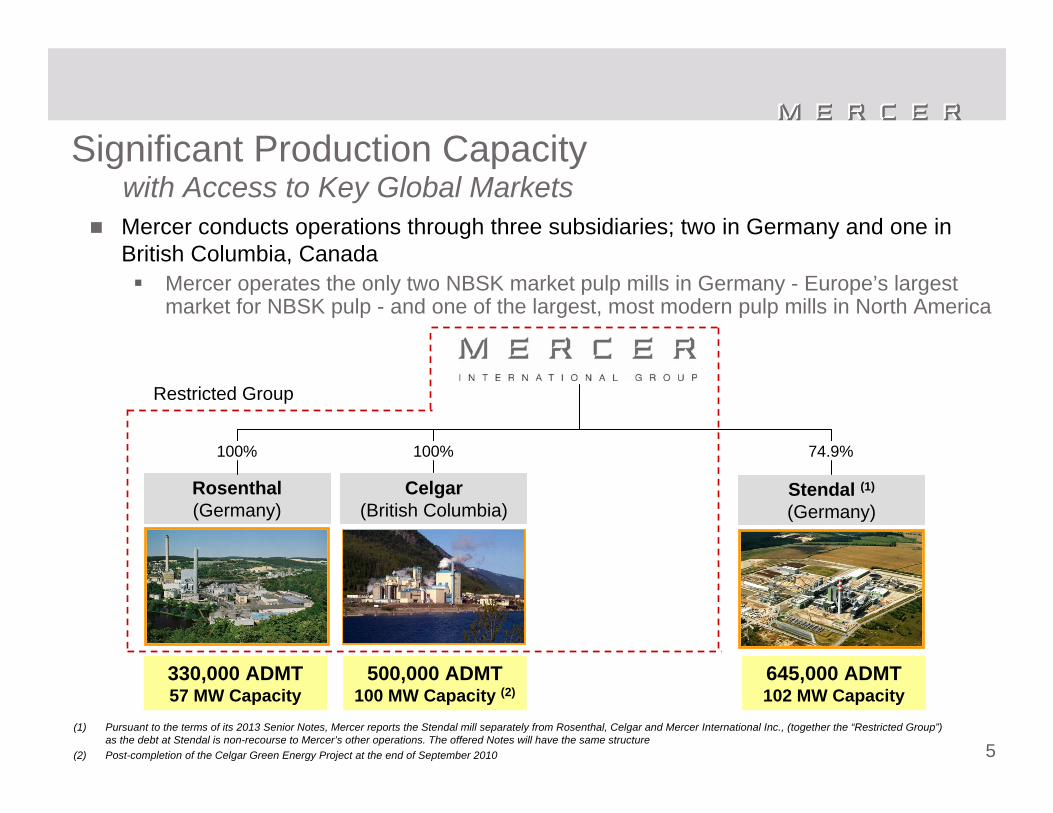
Mercer conducts operations through three subsidiaries; two in Germany and one in British Columbia, Canada
Mercer operates the only two NBSK market pulp mills in Germany - Europe’s largest market for NBSK pulp - and one of the largest, most modern pulp mills in North America
Significant Production Capacitywith Access to Key Global Markets
Rosenthal(Germany)
Celgar(British Columbia)
Stendal (1)
(Germany)
74.9%
Restricted Group
100% 100%
(1) Pursuant to the terms of its 2013 Senior Notes, Mercer reports the Stendal mill separately from Rosenthal, Celgar and Mercer International Inc., (together the “Restricted Group”) as the debt at Stendal is non-recourse to Mercer’s other operations. The offered Notes will have the same structure
(2) Post-completion of the Celgar Green Energy Project at the end of September 2010
500,000 ADMT100 MW Capacity (2)
330,000 ADMT57 MW Capacity
645,000 ADMT102 MW Capacity
6
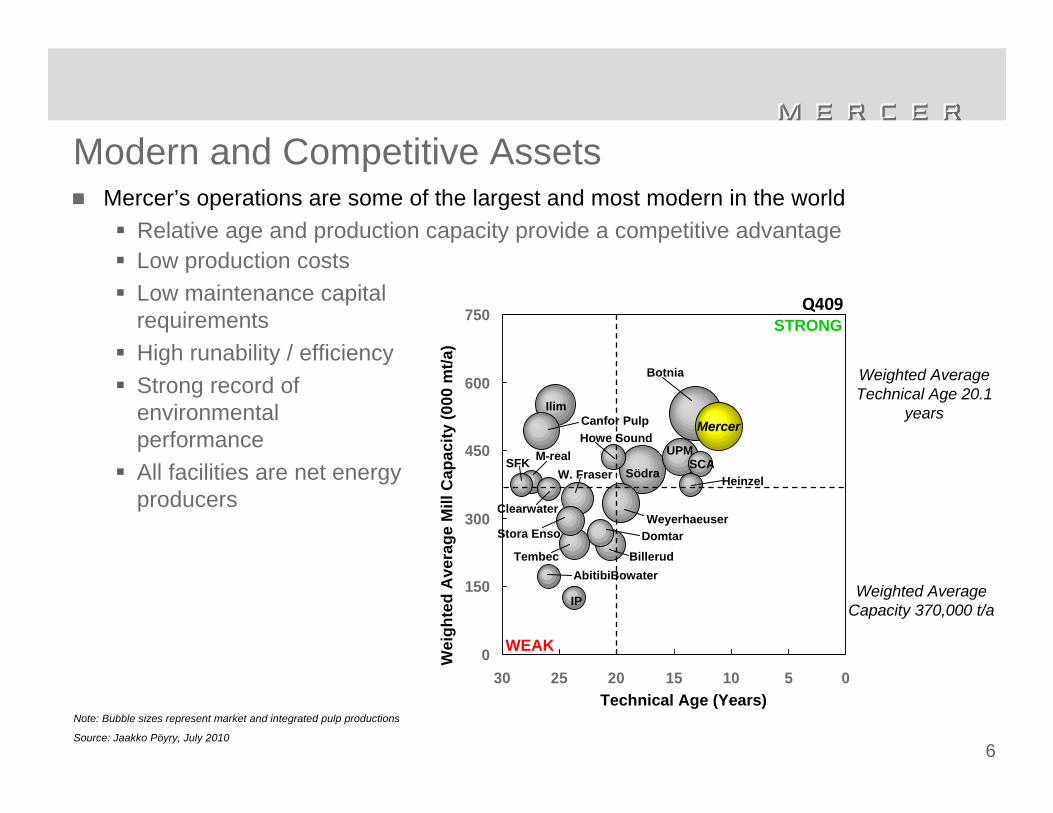
Modern and Competitive AssetsMercer’s operations are some of the largest and most modern in the world
Relative age and production capacity provide a competitive advantage
Note: Bubble sizes represent market and integrated pulp productions
Source: Jaakko Pöyry, July 2010
Low production costsLow maintenance capital requirementsHigh runability / efficiencyStrong record of environmental performanceAll facilities are net energy producers
0
150
300
450
600
750
051015202530Technical Age (Years)
Weighted Average Technical Age 20.1
years
Wei
ghte
d A
vera
ge M
ill C
apac
ity (0
00 m
t/a)
Weighted Average Capacity 370,000 t/a
Q409STRONG
Södra
Weyerhaeuser
Tembec
SCAW. Fraser
Ilim
Domtar
MercerMercerCanfor Pulp
Botnia
UPMHowe Sound
Heinzel
Billerud
IP
Stora Enso
Clearwater
AbitibiBowater
SFK M-real
WEAK
7
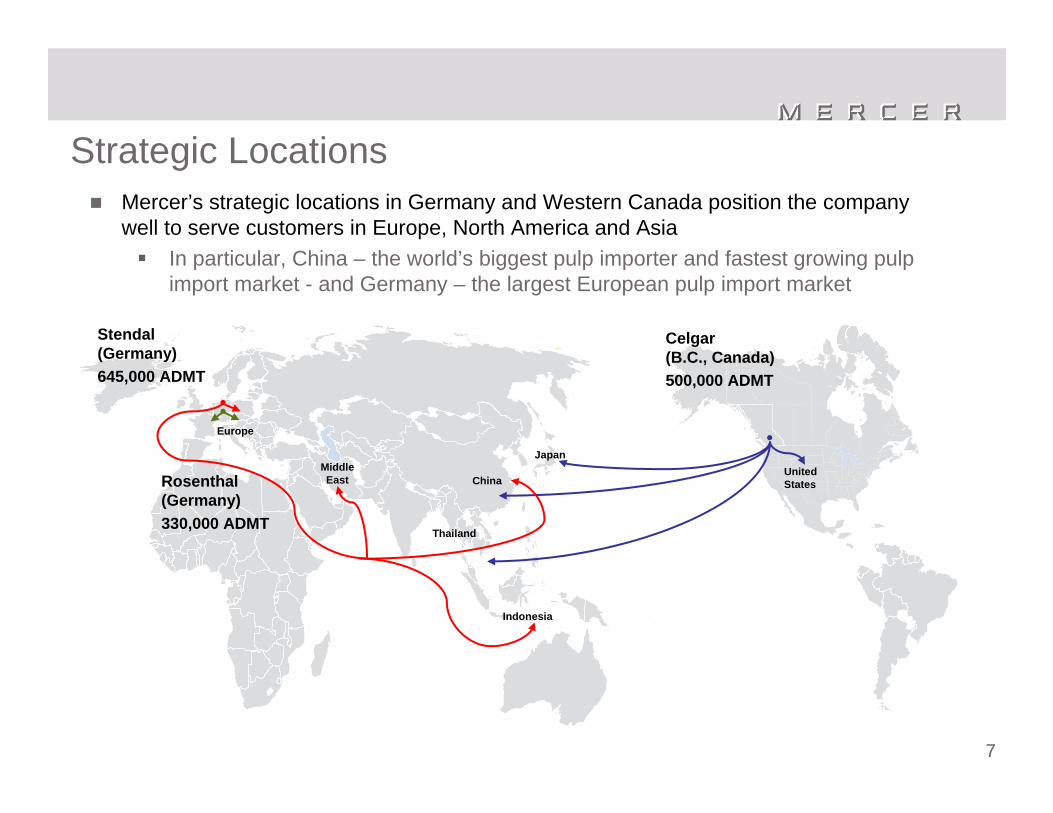
Strategic LocationsMercer’s strategic locations in Germany and Western Canada position the company well to serve customers in Europe, North America and Asia
In particular, China – the world’s biggest pulp importer and fastest growing pulp import market - and Germany – the largest European pulp import market
Celgar(B.C., Canada)500,000 ADMT
●
UnitedStates
Stendal(Germany)645,000 ADMT
Rosenthal(Germany)330,000 ADMT
●●
Indonesia
China
Thailand
MiddleEast
Europe
Japan
8
Electricity Generation
-300600900
1,2001,5001,800
2006 2007 2008 2009
Elec
trici
ty (
000s
MW
h)
Electricity Production Electricity Exports
Green Energy Revenue
€ 21 € 23€ 31
€ 43
€ 0
€ 10
€ 20
€ 30
€ 40
€ 50
2006 2007 2008 2009
Ener
gy R
even
ue (
mill
ions
)
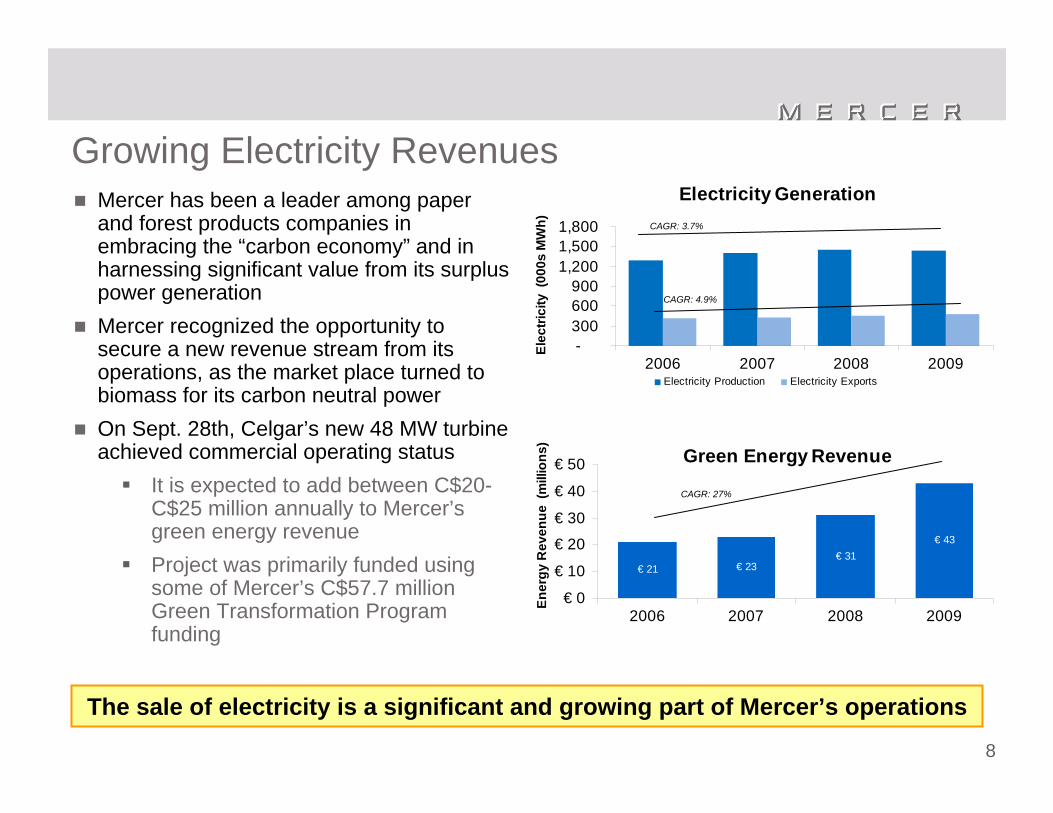
Growing Electricity RevenuesMercer has been a leader among paper and forest products companies in embracing the “carbon economy” and in harnessing significant value from its surplus power generationMercer recognized the opportunity to secure a new revenue stream from its operations, as the market place turned to biomass for its carbon neutral powerOn Sept. 28th, Celgar’s new 48 MW turbine achieved commercial operating status
It is expected to add between C$20-C$25 million annually to Mercer’s green energy revenueProject was primarily funded using some of Mercer’s C$57.7 million Green Transformation Program funding
CAGR: 27%
CAGR: 3.7%
CAGR: 4.9%
The sale of electricity is a significant and growing part of Mercer’s operations
9
NBSK Supply/Demand Fundamentals are Positive
Management believes that generally flat supply, overall growing demand and positive exposure to the effects of climate change create an excellent operating
environment for Mercer
Global demand for NBSK remains strong, as global production of tissue and specialty papers grows, emerging markets develop, and standards of living improve
• Chinese production of fine paper and pulp-based tissue are forecast to grow at double-digit rates over the next several years
• NBSK’s strength attributes are needed given the trend by tissue and paper producers towards faster production rates, increased recycled content, and lower basis weights
Global supply of softwood pulp is expected to remain relatively flat • New mills are overwhelmingly hardwood pulp and management believes any increases in
softwood supply should be more than offset by capacity closuresMercer benefits from favourable green energy rates and related government incentives
• Climate change is making the cost curve of pulp and paper steeper, significantly disadvantaging inefficient and environmentally unsound operations and benefitting world class operations, such as Mercer’s
10
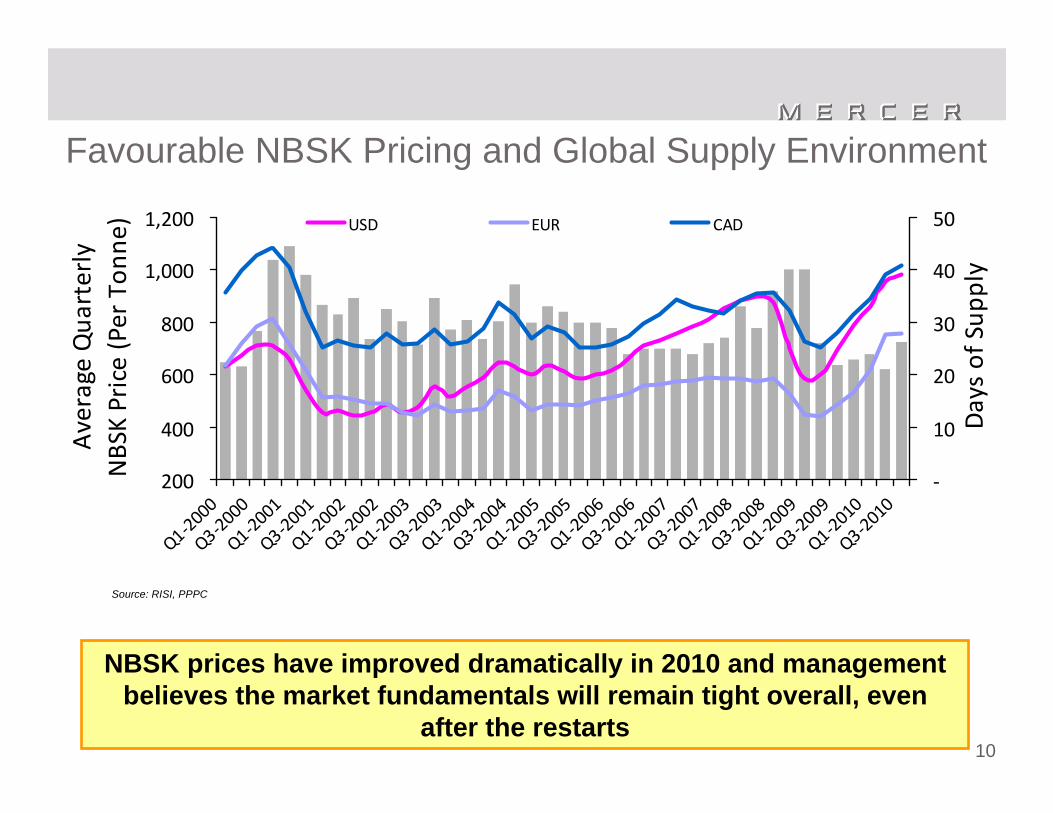
Favourable NBSK Pricing and Global Supply Environment
NBSK prices have improved dramatically in 2010 and management believes the market fundamentals will remain tight overall, even
after the restarts
Source: RISI, PPPC
200
400
600
800
1,000
1,200
Q1‐2000
Q3‐2000
Q1‐2001
Q3‐2001
Q1‐2002
Q3‐2002
Q1‐2003
Q3‐2003
Q1‐2004
Q3‐2004
Q1‐2005
Q3‐2005
Q1‐2006
Q3‐2006
Q1‐2007
Q3‐2007
Q1‐2008
Q3‐2008
Q1‐2009
Q3‐2009
Q1‐2010
Q3‐2010
Average Qua
rterly
NBSK Price (Per Ton
ne)
‐
10
20
30
40
50
Days of Sup
ply
USD EUR CAD

11
Overview of Operations
12
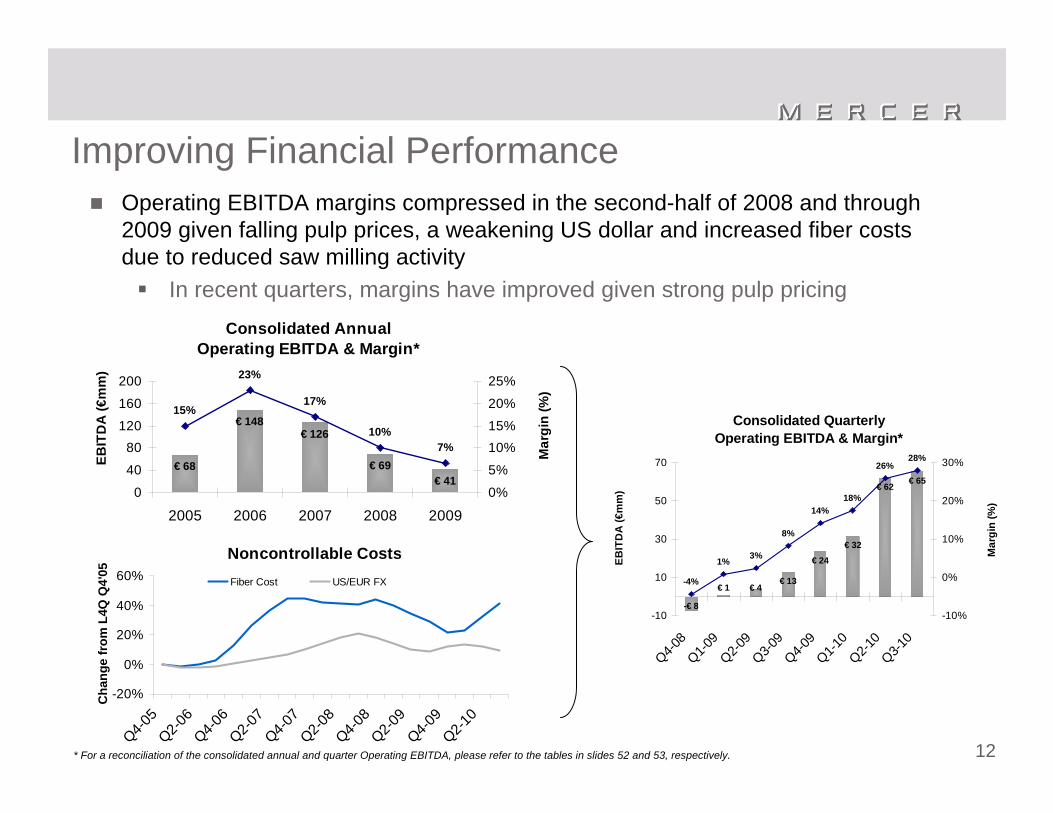
Operating EBITDA margins compressed in the second-half of 2008 and through 2009 given falling pulp prices, a weakening US dollar and increased fiber costs due to reduced saw milling activity
In recent quarters, margins have improved given strong pulp pricing
Improving Financial Performance
Consolidated Quarterly Operating EBITDA & Margin*
-€ 8
€ 1 € 4€ 13
€ 24
€ 32
€ 62 € 65
-4%
1% 3%
8%
14%18%
26%28%
-10
10
30
50
70
Q4-08
Q1-09
Q2-09
Q3-09
Q4-09
Q1-10
Q2-10
Q3-10
EBIT
DA
(€m
m)
-10%
0%
10%
20%
30%
Mar
gin
(%)
Consolidated Annual Operating EBITDA & Margin*
€ 68
€ 148€ 126
€ 69€ 41
15%
23%
17%
10%7%
0
40
80120
160
200
2005 2006 2007 2008 2009
EBIT
DA
(€m
m)
0%
5%
10%15%
20%
25%
Mar
gin
(%)
Noncontrollable Costs
-20%
0%
20%
40%
60%
Q4-05
Q2-06
Q4-06
Q2-07
Q4-07
Q2-08
Q4-08
Q2-09
Q4-09
Q2-10
Cha
nge
from
L4Q
Q4'
05
Fiber Cost US/EUR FX
* For a reconciliation of the consolidated annual and quarter Operating EBITDA, please refer to the tables in slides 52 and 53, respectively.
13
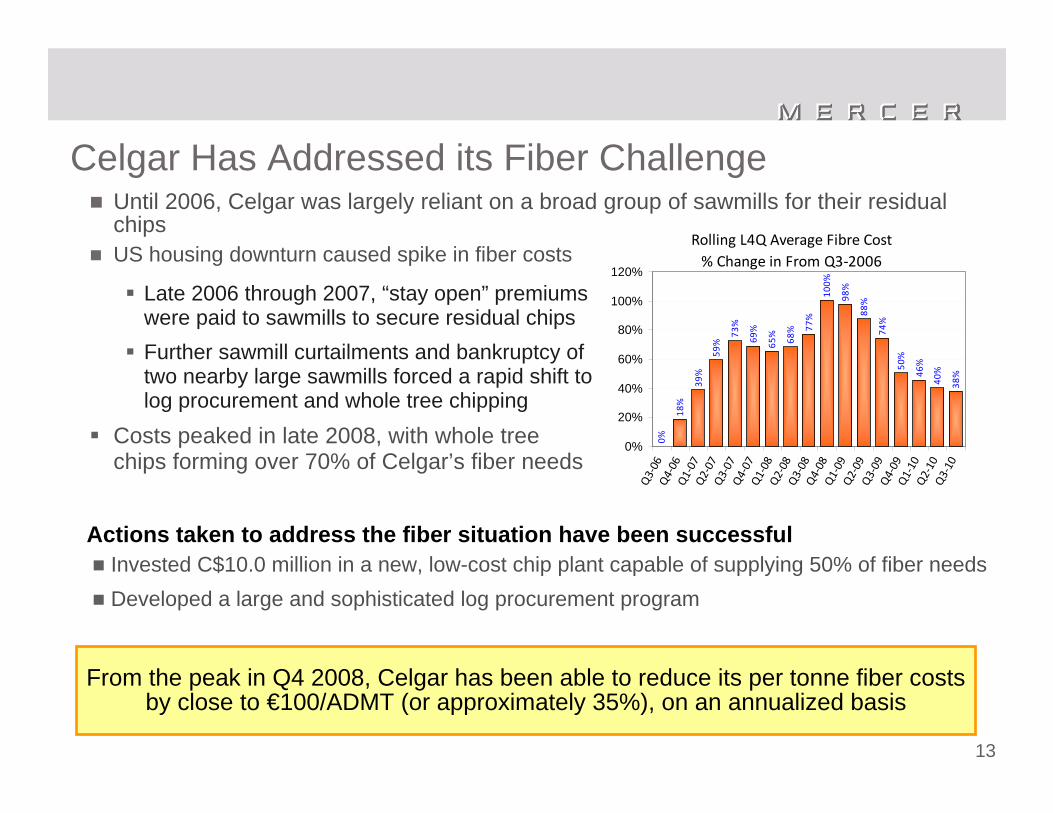
Until 2006, Celgar was largely reliant on a broad group of sawmills for their residual chips US housing downturn caused spike in fiber costs
From the peak in Q4 2008, Celgar has been able to reduce its per tonne fiber costs by close to €100/ADMT (or approximately 35%), on an annualized basis
Celgar Has Addressed its Fiber Challenge
Actions taken to address the fiber situation have been successfulInvested C$10.0 million in a new, low-cost chip plant capable of supplying 50% of fiber needs Developed a large and sophisticated log procurement program
Late 2006 through 2007, “stay open” premiums were paid to sawmills to secure residual chips Further sawmill curtailments and bankruptcy of two nearby large sawmills forced a rapid shift to log procurement and whole tree chipping
Costs peaked in late 2008, with whole tree chips forming over 70% of Celgar’s fiber needs
Rolling L4Q Average Fibre Cost % Change in From Q3‐2006
0%
18%
39%
59%
73%
69%
65%
68% 77
%
100%
98%
88%
74%
50%
46%
40%
38%
0%
20%
40%
60%
80%
100%
120%
Q3‐06
Q4‐06
Q1‐07
Q2‐07
Q3‐07
Q4‐07
Q1‐08
Q2‐08
Q3‐08
Q4‐08
Q1‐09
Q2‐09
Q3‐09
Q4‐09
Q1‐10
Q2‐10
Q3‐10
14
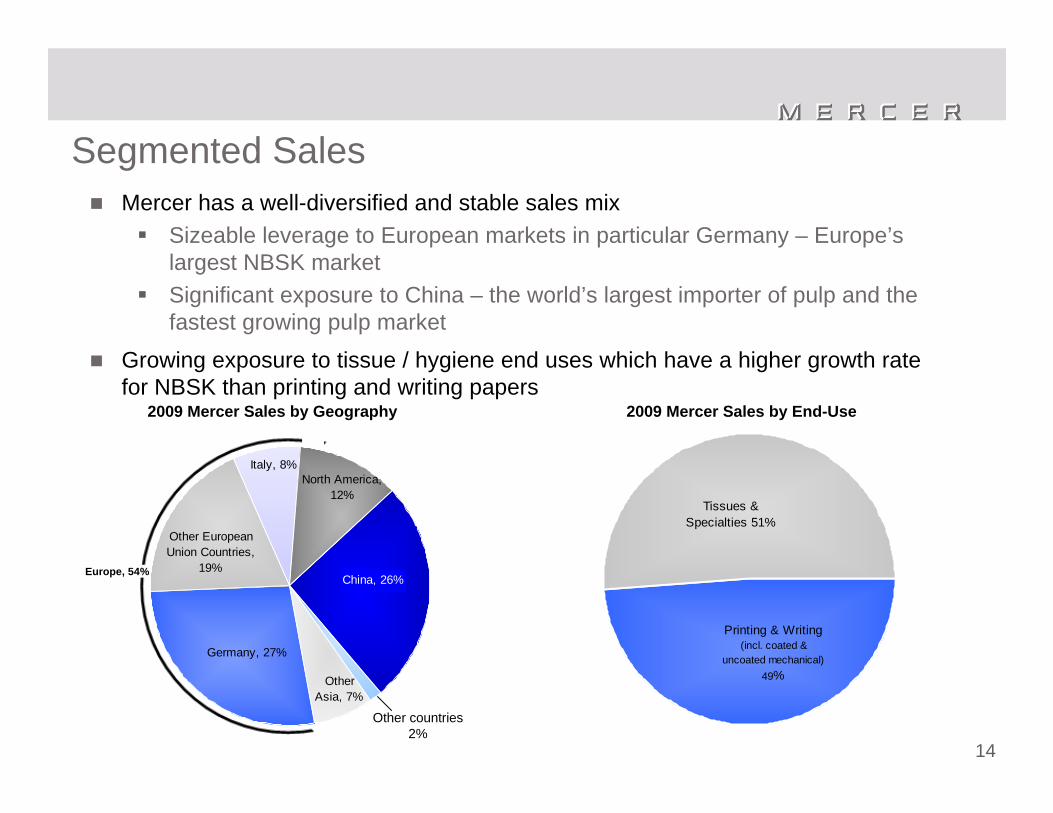
Mercer has a well-diversified and stable sales mixSizeable leverage to European markets in particular Germany – Europe’s largest NBSK marketSignificant exposure to China – the world’s largest importer of pulp and the fastest growing pulp market
Growing exposure to tissue / hygiene end uses which have a higher growth rate for NBSK than printing and writing papers
Segmented Sales
2009 Mercer Sales by End-Use2009 Mercer Sales by Geography
Other countries2%
Printing & Writing(incl. coated &
uncoated mechanical) 49%
Tissues & Specialties 51%
Europe, 54%
Germany, 27%
Other European Union Countries,
19%
Italy, 8%North America,
12%
China, 26%
Other Asia, 7%
15
Financial Review
16
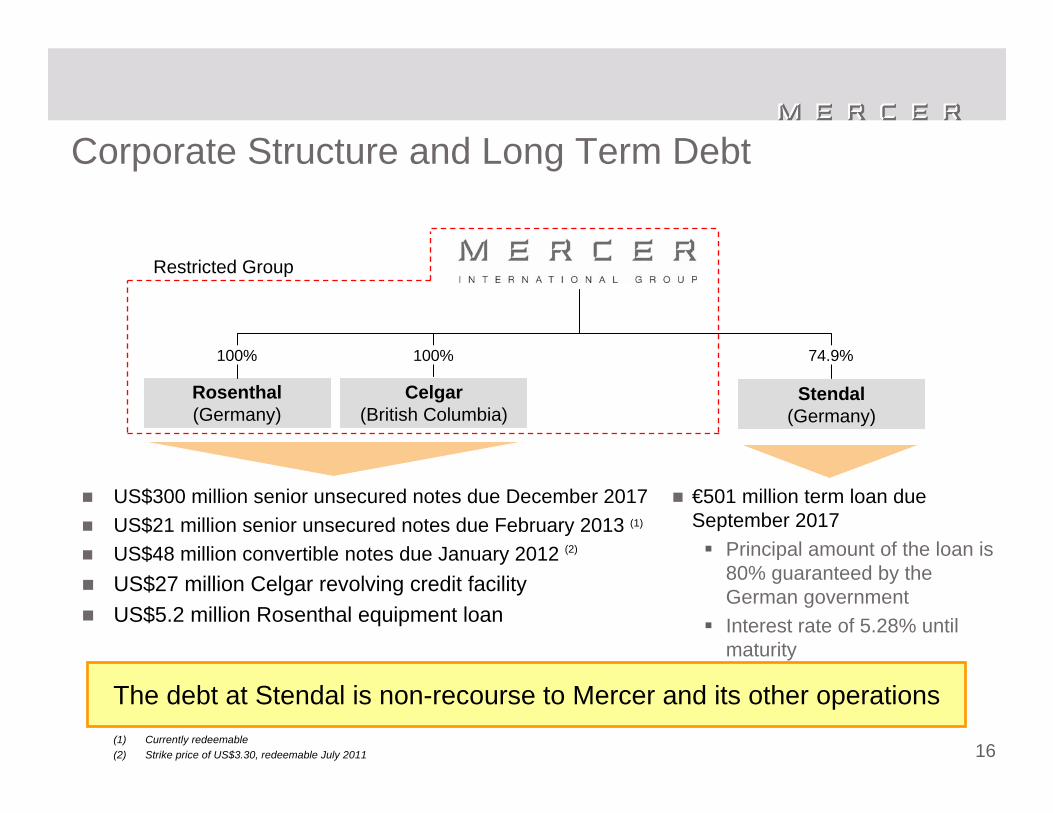
Corporate Structure and Long Term Debt
Rosenthal(Germany)
Celgar(British Columbia)
Stendal(Germany)
74.9%
US$300 million senior unsecured notes due December 2017US$21 million senior unsecured notes due February 2013 (1)
US$48 million convertible notes due January 2012 (2)
US$27 million Celgar revolving credit facilityUS$5.2 million Rosenthal equipment loan
€501 million term loan due September 2017
Principal amount of the loan is 80% guaranteed by the German governmentInterest rate of 5.28% until maturity
Restricted Group
100% 100%
The debt at Stendal is non-recourse to Mercer and its other operations (1) Currently redeemable(2) Strike price of US$3.30, redeemable July 2011
17
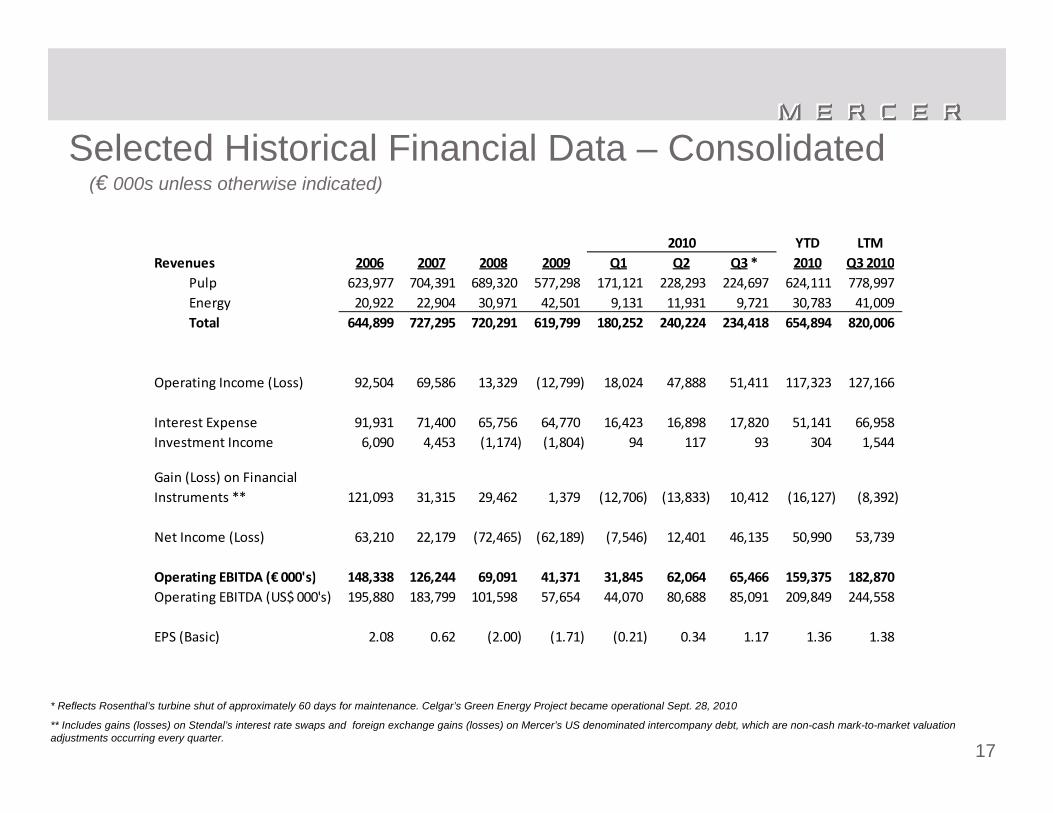
Selected Historical Financial Data – Consolidated(€ 000s unless otherwise indicated)
* Reflects Rosenthal’s turbine shut of approximately 60 days for maintenance. Celgar’s Green Energy Project became operational Sept. 28, 2010
** Includes gains (losses) on Stendal’s interest rate swaps and foreign exchange gains (losses) on Mercer’s US denominated intercompany debt, which are non-cash mark-to-market valuation adjustments occurring every quarter.
YTD LTMRevenues 2006 2007 2008 2009 Q1 Q2 Q3* 2010 Q3 2010
Pulp 623,977 704,391 689,320 577,298 171,121 228,293 224,697 624,111 778,997 Energy 20,922 22,904 30,971 42,501 9,131 11,931 9,721 30,783 41,009 Total 644,899 727,295 720,291 619,799 180,252 240,224 234,418 654,894 820,006
Operating Income (Loss) 92,504 69,586 13,329 (12,799) 18,024 47,888 51,411 117,323 127,166
Interest Expense 91,931 71,400 65,756 64,770 16,423 16,898 17,820 51,141 66,958 Investment Income 6,090 4,453 (1,174) (1,804) 94 117 93 304 1,544
121,093 31,315 29,462 1,379 (12,706) (13,833) 10,412 (16,127) (8,392)
Net Income (Loss) 63,210 22,179 (72,465) (62,189) (7,546) 12,401 46,135 50,990 53,739
Operating EBITDA (€ 000's)*** 148,338 126,244 69,091 41,371 31,845 62,064 65,466 159,375 182,870 Operating EBITDA (US$ 000's) 195,880 183,799 101,598 57,654 44,070 80,688 85,091 209,849 244,558
EPS (Basic) 2.08 0.62 (2.00) (1.71) (0.21) 0.34 1.17 1.36 1.38
Gain (Loss) on Financial Instruments **
2010
18
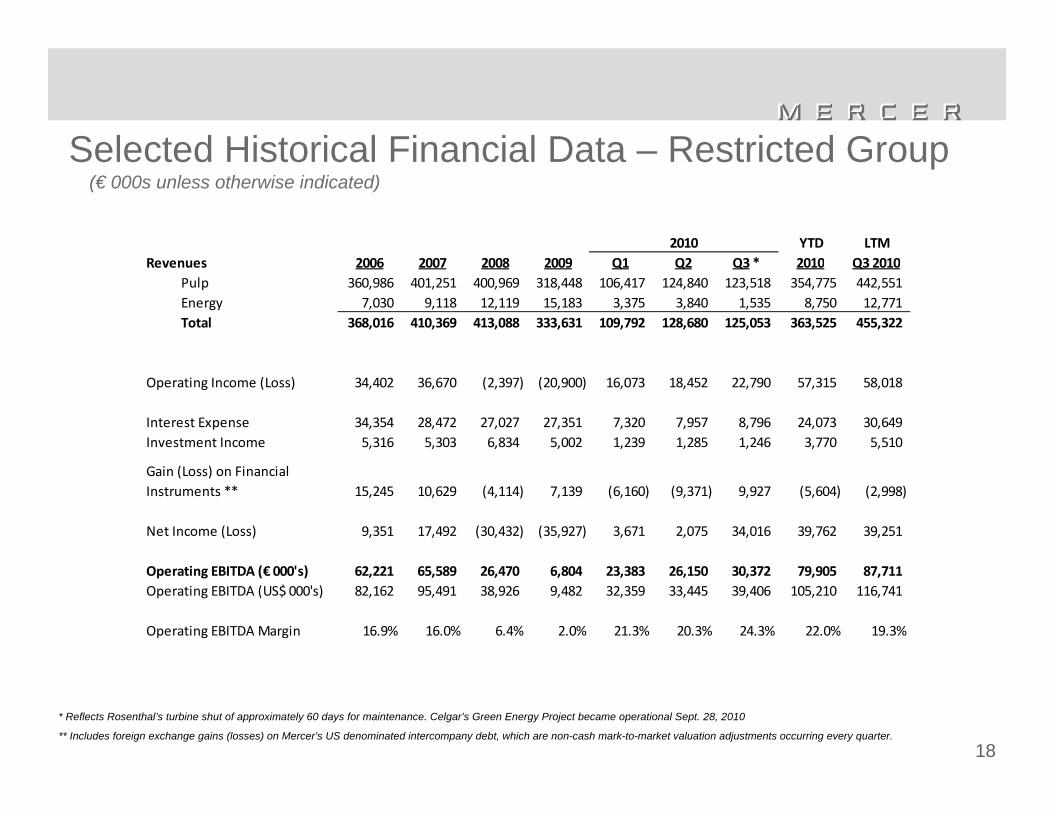
YTD LTMRevenues 2006 2007 2008 2009 Q1 Q2 Q3* 2010 Q3 2010
Pulp 360,986 401,251 400,969 318,448 106,417 124,840 123,518 354,775 442,551 Energy 7,030 9,118 12,119 15,183 3,375 3,840 1,535 8,750 12,771 Total 368,016 410,369 413,088 333,631 109,792 128,680 125,053 363,525 455,322
Operating Income (Loss) 34,402 36,670 (2,397) (20,900) 16,073 18,452 22,790 57,315 58,018
Interest Expense 34,354 28,472 27,027 27,351 7,320 7,957 8,796 24,073 30,649 Investment Income 5,316 5,303 6,834 5,002 1,239 1,285 1,246 3,770 5,510
15,245 10,629 (4,114) 7,139 (6,160) (9,371) 9,927 (5,604) (2,998)
Net Income (Loss) 9,351 17,492 (30,432) (35,927) 3,671 2,075 34,016 39,762 39,251
Operating EBITDA (€ 000's) *** 62,221 65,589 26,470 6,804 23,383 26,150 30,372 79,905 87,711 Operating EBITDA (US$ 000's) 82,162 95,491 38,926 9,482 32,359 33,445 39,406 105,210 116,741
Operating EBITDA Margin 16.9% 16.0% 6.4% 2.0% 21.3% 20.3% 24.3% 22.0% 19.3%
Gain (Loss) on Financial Instruments **
2010
Selected Historical Financial Data – Restricted Group(€ 000s unless otherwise indicated)
* Reflects Rosenthal’s turbine shut of approximately 60 days for maintenance. Celgar’s Green Energy Project became operational Sept. 28, 2010
** Includes foreign exchange gains (losses) on Mercer’s US denominated intercompany debt, which are non-cash mark-to-market valuation adjustments occurring every quarter.
19
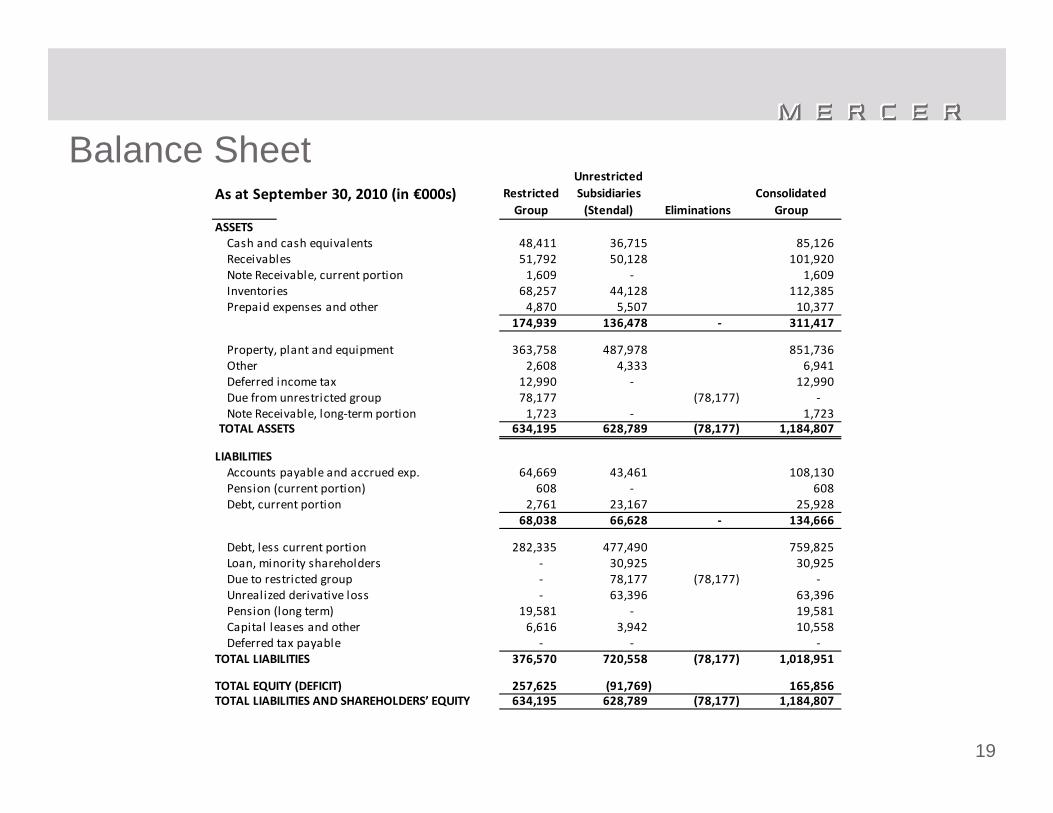
Balance SheetAs at September 30, 2010 (in €000s) Restricted
Group
Unrestricted Subsidiaries (Stendal) Eliminations
Consolidated Group
ASSETSCash and cash equivalents 48,411 36,715 85,126 Receivables 51,792 50,128 101,920 Note Receivable, current portion 1,609 ‐ 1,609 Inventories 68,257 44,128 112,385 Prepaid expenses and other 4,870 5,507 10,377
174,939 136,478 ‐ 311,417
Property, plant and equipment 363,758 487,978 851,736 Other 2,608 4,333 6,941 Deferred income tax 12,990 ‐ 12,990 Due from unrestricted group 78,177 (78,177) ‐ Note Receivable, long‐term portion 1,723 ‐ 1,723
TOTAL ASSETS 634,195 628,789 (78,177) 1,184,807
LIABILITIESAccounts payable and accrued exp. 64,669 43,461 108,130 Pension (current portion) 608 ‐ 608 Debt, current portion 2,761 23,167 25,928
68,038 66,628 ‐ 134,666
Debt, less current portion 282,335 477,490 759,825 Loan, minority shareholders ‐ 30,925 30,925 Due to restricted group ‐ 78,177 (78,177) ‐ Unrealized derivative loss ‐ 63,396 63,396 Pension (long term) 19,581 ‐ 19,581 Capital leases and other 6,616 3,942 10,558 Deferred tax payable ‐ ‐ ‐
TOTAL LIABILITIES 376,570 720,558 (78,177) 1,018,951
TOTAL EQUITY (DEFICIT) 257,625 (91,769) 165,856 TOTAL LIABILITIES AND SHAREHOLDERS’ EQUITY 634,195 628,789 (78,177) 1,184,807
20
Capital Structure“Restricted Group” structure was used to protect Mercer from the high leverage of the Stendal project
The Restricted Group - created at the time of issuing US$310 million Notes - is supported by the Celgar and Rosenthal operations (recently replaced by a US$300 million issue due December 2017)
Together, the mills provide approximately 830,000 tonnes of pulp production capacity Now that Celgar’s Green Energy Project is online, the Restricted Group is expected to generate approximately US$40 million in annual electricity revenues
Since energy production is a by-product of our pulp production, there are minimal incremental costs and our energy sales are highly profitable
Mercer’s operations have benefitted from the heavy involvement of governments in the form of non-repayable grants for the construction of its mills in Germany
Mercer has received €410 million in government grants for the construction of the Rosenthal, Stendal, and Celgar Green Energy Project
These grants reduce the cost basis of the assets purchased and are not reported in our incomeThe Stendal debt of €501 million is guaranteed to 80% by the German government and isnon-recourse to the rest of Mercer
Stendal’s debt is amortizing and has a sinking fund account to support debt amortization and interest payments during weaker periods
Stendal’s balance sheet is complicated by its deeply subordinated shareholder loans and a quarterly mark-to-market, non-cash valuation adjustment relating to its fixed interest rate swaps
21
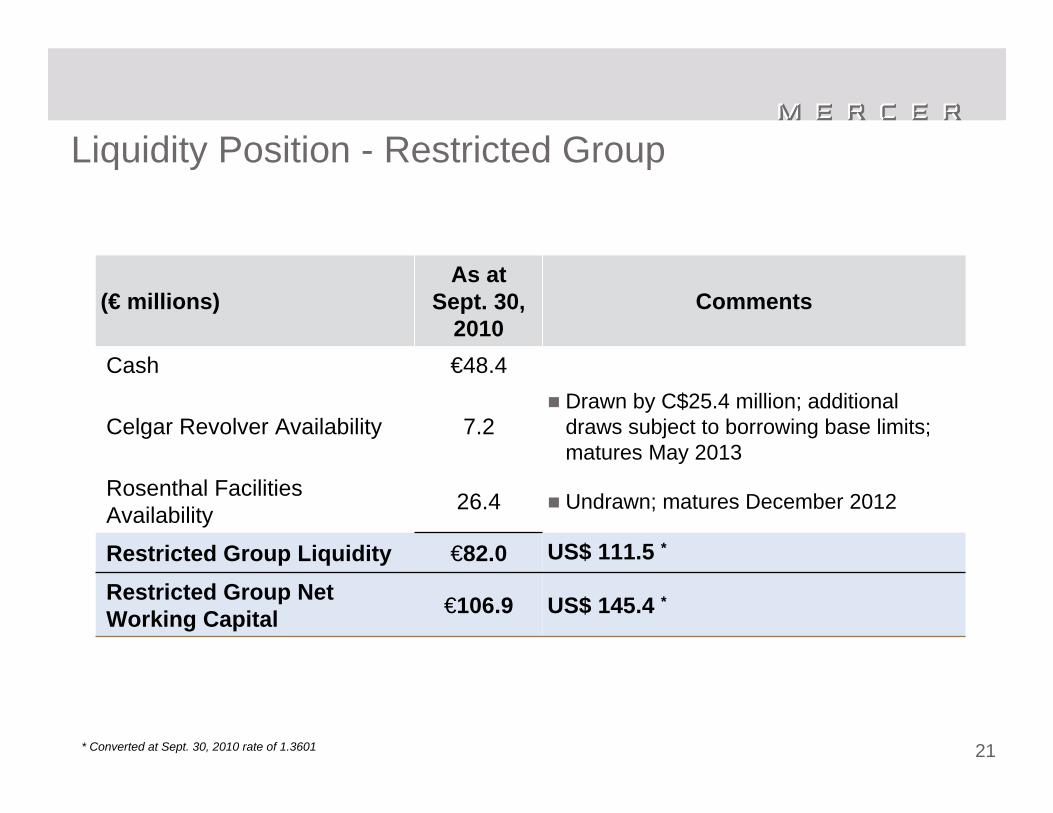
Liquidity Position - Restricted Group
US$ 111.5 *€82.0Restricted Group Liquidity
US$ 145.4 *€106.9Restricted Group Net Working Capital
(€ millions)As at
Sept. 30, 2010
Comments
Cash €48.4
Celgar Revolver Availability 7.2Drawn by C$25.4 million; additional draws subject to borrowing base limits; matures May 2013
Rosenthal Facilities Availability 26.4 Undrawn; matures December 2012
* Converted at Sept. 30, 2010 rate of 1.3601

22
Investment Highlights
23
It’s Been a Transitional Year for MercerThe financial crisis of 2009 has resulted in the closure of a significant volume of NBSK capacity
Celgar’s new wood room has reduced its fiber cost by close to €100 / Admtfrom the peak in Q4 2008
Celgar’s new turbine was commissioned in September 2010 and will add another C$20-25 million to the company’s existing electricity revenue base of €43 million
Mercer has extended the maturity of its convertible debentures to 2012 and its senior notes to 2017
24
Key Investment HighlightsOperates world-class, large, modern mills that produce high-quality NBSK pulp which is a premium grade of kraft pulp
Strategically located mills, with excellent fiber baskets, in close proximity to key global markets
Strong, long-term forecast supply/demand outlook for NBSK
Significant and growing revenue from sale of excess renewable, carbon-neutral electricity
Financial structure offers very high leverage to the pulp cycle
Experienced, shareholder-focused management team and board of directors
Improved liquidity performance
25
Appendix
26
Current Industry Environment
27
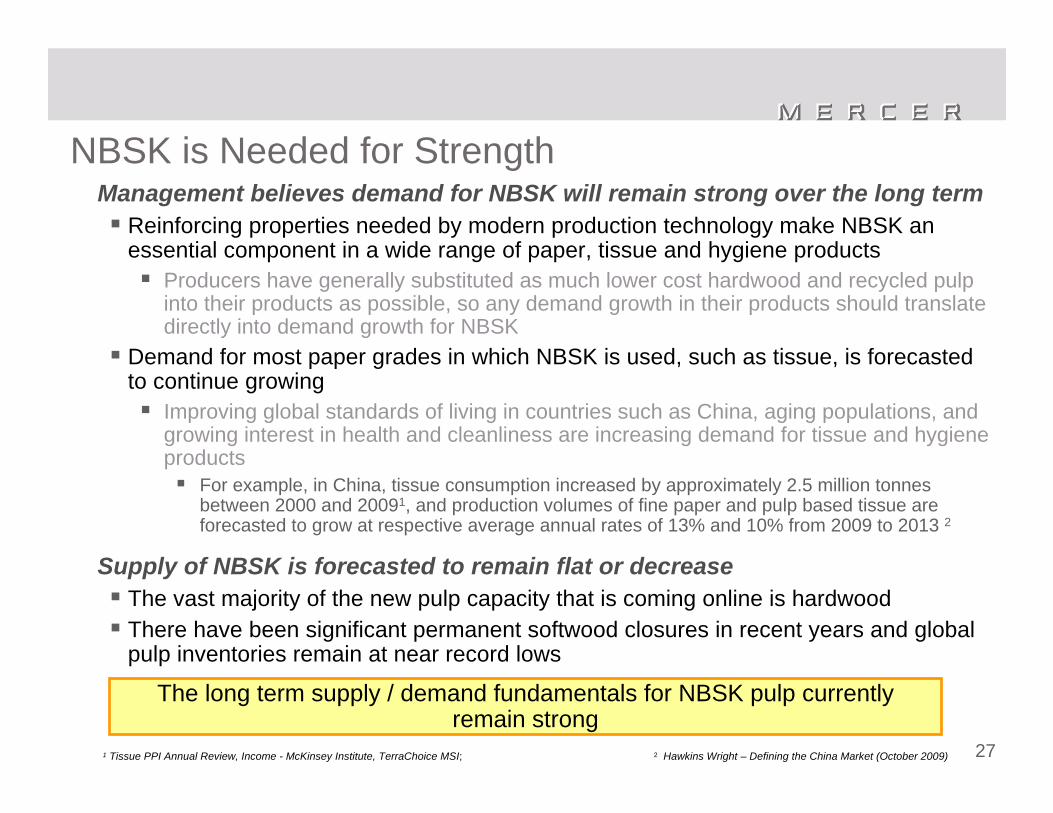
NBSK is Needed for StrengthManagement believes demand for NBSK will remain strong over the long term
Reinforcing properties needed by modern production technology make NBSK an essential component in a wide range of paper, tissue and hygiene products
Producers have generally substituted as much lower cost hardwood and recycled pulp into their products as possible, so any demand growth in their products should translate directly into demand growth for NBSK
Demand for most paper grades in which NBSK is used, such as tissue, is forecasted to continue growing
Improving global standards of living in countries such as China, aging populations, and growing interest in health and cleanliness are increasing demand for tissue and hygiene products
For example, in China, tissue consumption increased by approximately 2.5 million tonnesbetween 2000 and 20091, and production volumes of fine paper and pulp based tissue areforecasted to grow at respective average annual rates of 13% and 10% from 2009 to 2013 2
Supply of NBSK is forecasted to remain flat or decreaseThe vast majority of the new pulp capacity that is coming online is hardwoodThere have been significant permanent softwood closures in recent years and global pulp inventories remain at near record lows
The long term supply / demand fundamentals for NBSK pulp currently remain strong
1 Tissue PPI Annual Review, Income - McKinsey Institute, TerraChoice MSI; 2 Hawkins Wright – Defining the China Market (October 2009)
28
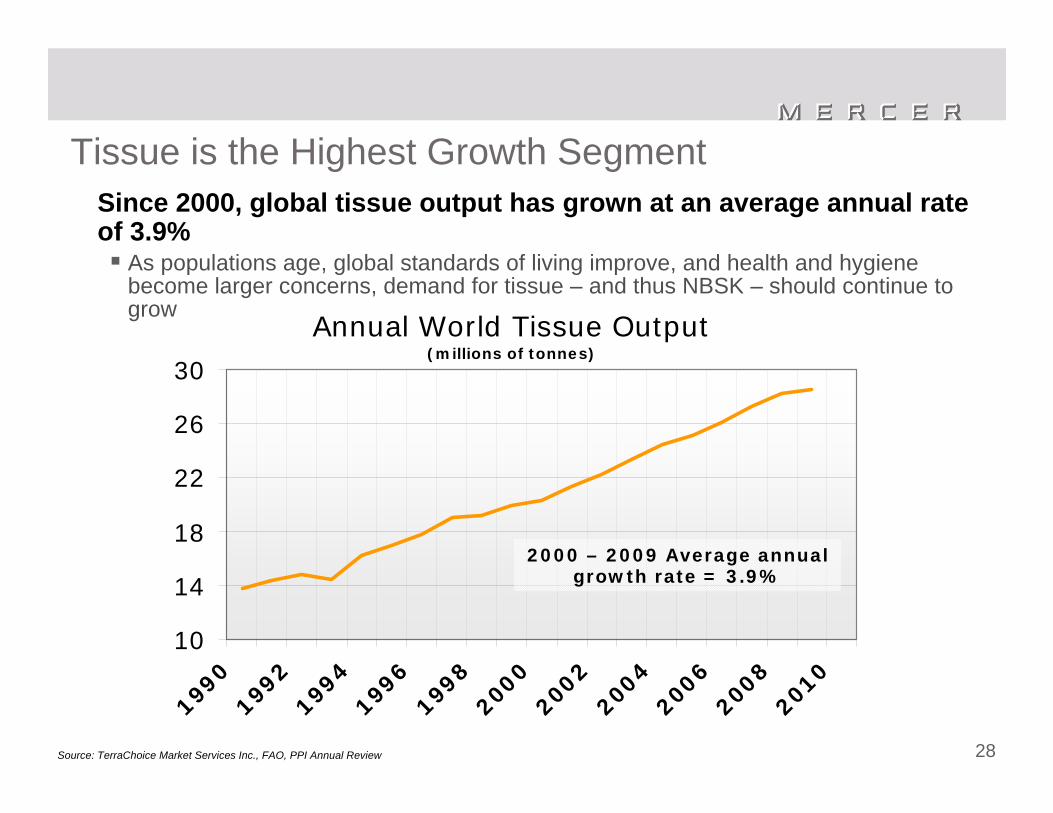
Annual World Tissue Output(millions of tonnes)
10
14
18
22
26
30
1990
1992
1994
1996
1998
2000
2002
2004
2006
2008
2010
Tissue is the Highest Growth SegmentSince 2000, global tissue output has grown at an average annual rate of 3.9%
As populations age, global standards of living improve, and health and hygiene become larger concerns, demand for tissue – and thus NBSK – should continue to grow
Source: TerraChoice Market Services Inc., FAO, PPI Annual Review
2000 – 2009 Average annual growth rate = 3.9%
29
0.6
2.6
4.6
6.6
8.6
10.6
12.6
14.6
19901994
19982002
20062010
20142018
2022
mill
ions
of to
nnes
0%
20%
40%
60%
80%
100%
% o
f popula
tion n
ot
poor
Consumption
Production
(%) of population
not poor (McKinsey)
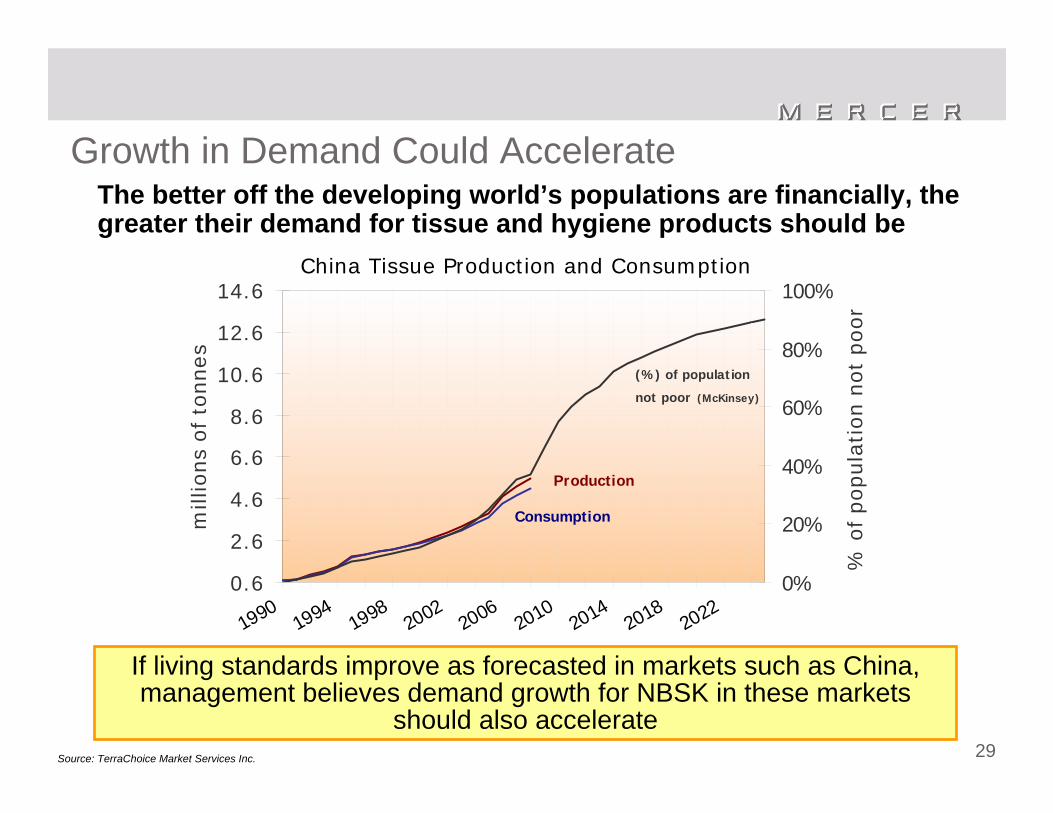
Growth in Demand Could AccelerateThe better off the developing world’s populations are financially, the greater their demand for tissue and hygiene products should be
Source: TerraChoice Market Services Inc.
If living standards improve as forecasted in markets such as China, management believes demand growth for NBSK in these markets
should also accelerate
China Tissue Production and Consumption
30
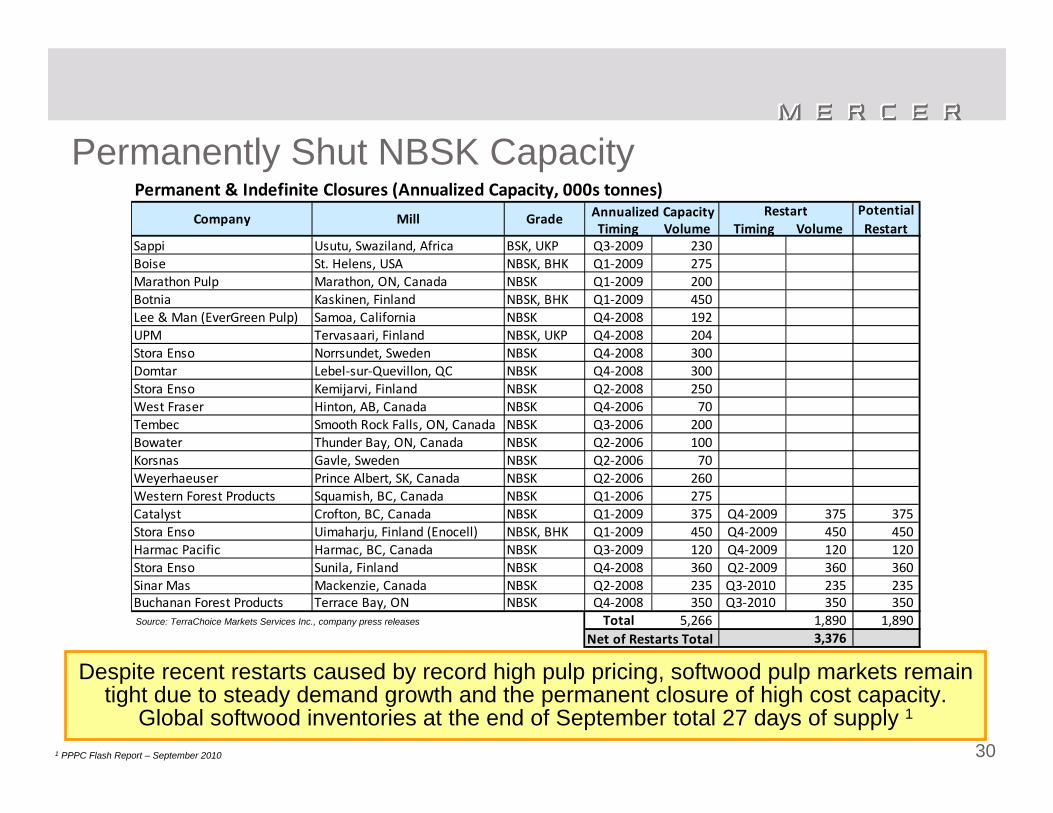
Permanent & Indefinite Closures (Annualized Capacity, 000s tonnes)
Timing Volume Timing VolumeSappi Usutu, Swaziland, Africa BSK, UKP Q3‐2009 230 Boise St. Helens, USA NBSK, BHK Q1‐2009 275 Marathon Pulp Marathon, ON, Canada NBSK Q1‐2009 200 Botnia Kaskinen, Finland NBSK, BHK Q1‐2009 450 Lee & Man (EverGreen Pulp) Samoa, California NBSK Q4‐2008 192 UPM Tervasaari, Finland NBSK, UKP Q4‐2008 204 Stora Enso Norrsundet, Sweden NBSK Q4‐2008 300 Domtar Lebel‐sur‐Quevillon, QC NBSK Q4‐2008 300 Stora Enso Kemijarvi, Finland NBSK Q2‐2008 250 West Fraser Hinton, AB, Canada NBSK Q4‐2006 70 Tembec Smooth Rock Falls, ON, Canada NBSK Q3‐2006 200 Bowater Thunder Bay, ON, Canada NBSK Q2‐2006 100 Korsnas Gavle, Sweden NBSK Q2‐2006 70 Weyerhaeuser Prince Albert, SK, Canada NBSK Q2‐2006 260 Western Forest Products Squamish, BC, Canada NBSK Q1‐2006 275 Catalyst Crofton, BC, Canada NBSK Q1‐2009 375 Q4‐2009 375 375 Stora Enso Uimaharju, Finland (Enocell) NBSK, BHK Q1‐2009 450 Q4‐2009 450 450 Harmac Pacific Harmac, BC, Canada NBSK Q3‐2009 120 Q4‐2009 120 120 Stora Enso Sunila, Finland NBSK Q4‐2008 360 Q2‐2009 360 360 Sinar Mas Mackenzie, Canada NBSK Q2‐2008 235 Q3‐2010 235 235 Buchanan Forest Products Terrace Bay, ON NBSK Q4‐2008 350 Q3‐2010 350 350
Total 5,266 1,890 1,890 Net of Restarts Total 3,376
MillCompanyPotential Restart
Annualized Capacity RestartGrade
1 PPPC Flash Report – September 2010
Permanently Shut NBSK Capacity
Despite recent restarts caused by record high pulp pricing, softwood pulp markets remain tight due to steady demand growth and the permanent closure of high cost capacity.
Global softwood inventories at the end of September total 27 days of supply 1
Source: TerraChoice Markets Services Inc., company press releases
31
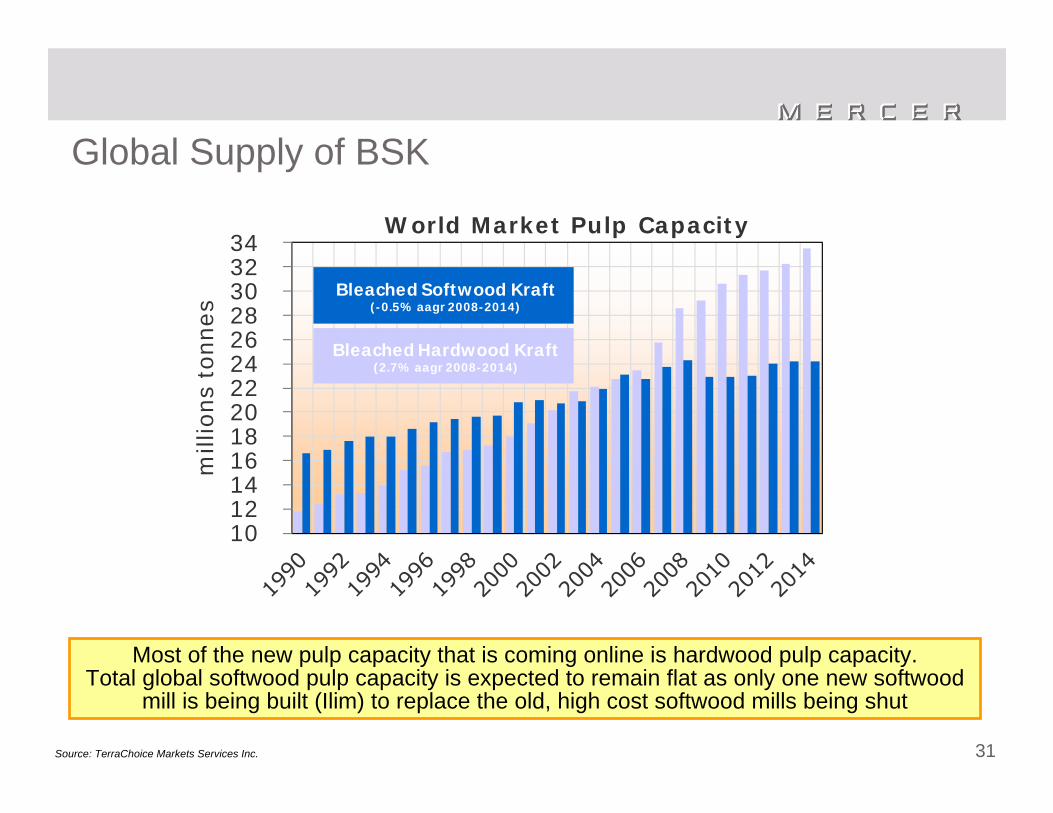
10 12 14 16 18 20 22 24 26 28 30 32 34
mill
ions
tonnes
Bleached Softwood Kraft(-0.5% aagr 2008-2014)
Bleached Hardwood Kraft(2.7% aagr 2008-2014)
World Market Pulp Capacity
Global Supply of BSK
Source: TerraChoice Markets Services Inc.
Most of the new pulp capacity that is coming online is hardwood pulp capacity. Total global softwood pulp capacity is expected to remain flat as only one new softwood
mill is being built (Ilim) to replace the old, high cost softwood mills being shut
32
Climate Change Presents Mercer with OpportunitiesClimate change has emerged as a very significant issue and Mercer is well positioned to benefit from the changes that are expected to result
Both Canadian and German governments provide support and incentives for green initiatives and energy production
• Our German operations receive superior energy rates for selling their generation under the green tariff structure of the German Renewable Energy Act (EEG)
• In 2009, Celgar was awarded C$57.7 million under the Canadian government’s Green Transformation Program
• Celgar signed a long term energy purchase agreement with the local utility, delivering 238,000 MWh of bioenergyannually to the grid at higher green rates
• Became operational on Sept. 28th, 2010
Mercer has already garnered significant benefits in the emerging carbon economy and we remain actively engaged with policy makers to maximize these benefits
going forward
Changes we see coming from climate change include:
Full utilization of forestsIncreased silviculture / thinningIncreased cogenerationTechnologies for bioproductsand the markets for these bioproducts will develop
33
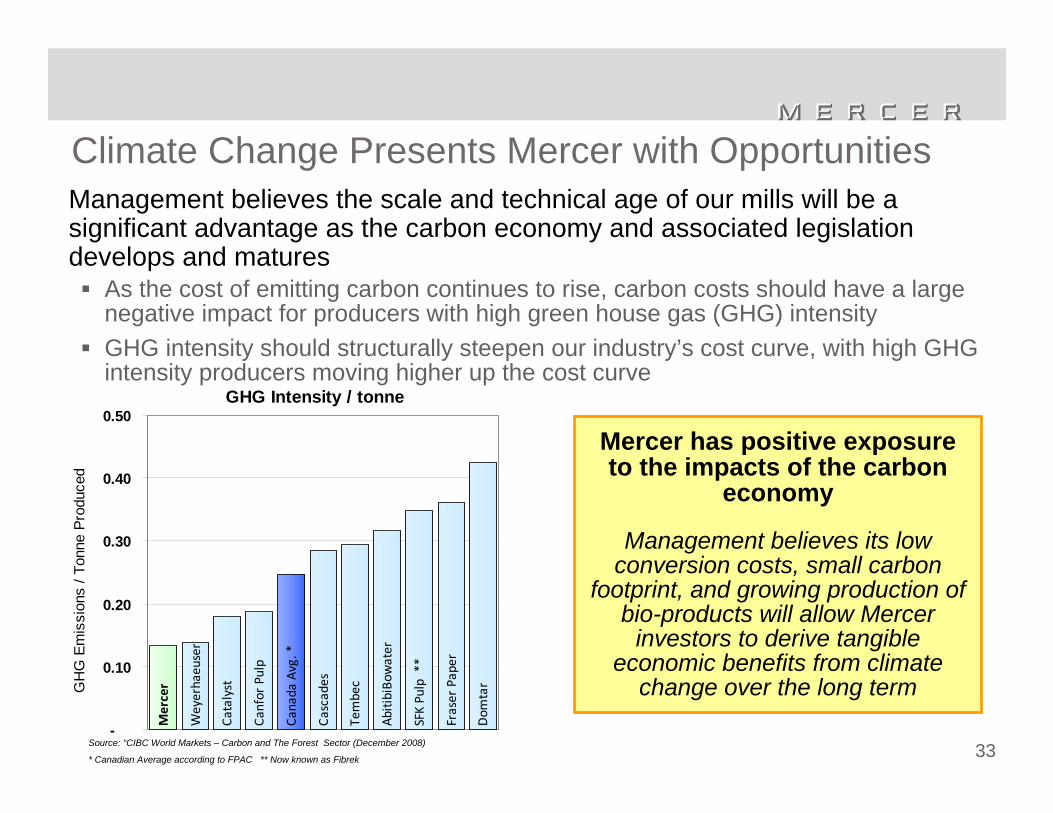
GHG Intensity / tonne
Weyerhaeuser
Catalyst
Canfor Pulp
Cascades
Tembec
SFK Pulp **
Fraser Paper
Dom
tar
Mercer
Canada
Avg. *
AbitibiBo
water
-
0.10
0.20
0.30
0.40
0.50
GH
G E
mis
sion
s / T
onne
Pro
duce
d
Management believes the scale and technical age of our mills will be a significant advantage as the carbon economy and associated legislation develops and matures
As the cost of emitting carbon continues to rise, carbon costs should have a large negative impact for producers with high green house gas (GHG) intensityGHG intensity should structurally steepen our industry’s cost curve, with high GHG intensity producers moving higher up the cost curve
Climate Change Presents Mercer with Opportunities
Source: “CIBC World Markets – Carbon and The Forest Sector (December 2008)
* Canadian Average according to FPAC ** Now known as Fibrek
Mercer has positive exposure to the impacts of the carbon
economy
Management believes its low conversion costs, small carbon
footprint, and growing production of bio-products will allow Mercer
investors to derive tangible economic benefits from climate
change over the long term
34
Operations
35
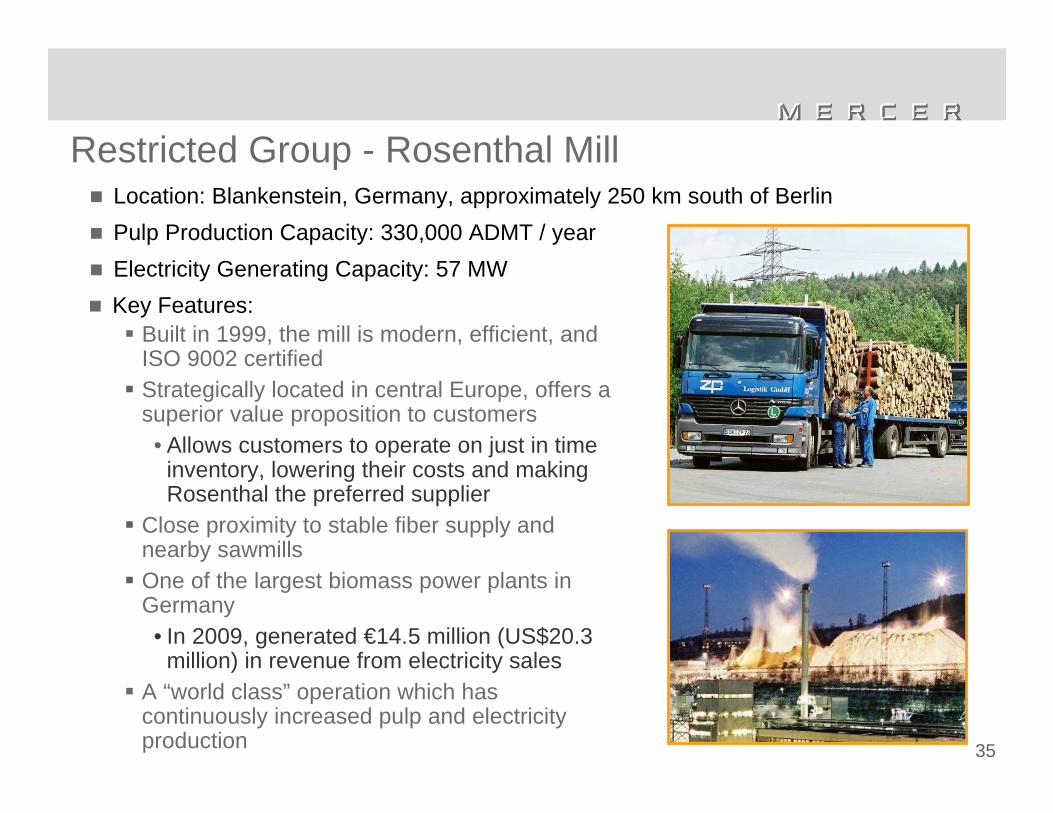
Restricted Group - Rosenthal MillLocation: Blankenstein, Germany, approximately 250 km south of BerlinPulp Production Capacity: 330,000 ADMT / yearElectricity Generating Capacity: 57 MWKey Features:
Built in 1999, the mill is modern, efficient, and ISO 9002 certifiedStrategically located in central Europe, offers a superior value proposition to customers• Allows customers to operate on just in time
inventory, lowering their costs and making Rosenthal the preferred supplier
Close proximity to stable fiber supply and nearby sawmillsOne of the largest biomass power plants in Germany • In 2009, generated €14.5 million (US$20.3
million) in revenue from electricity salesA “world class” operation which has continuously increased pulp and electricity production
36
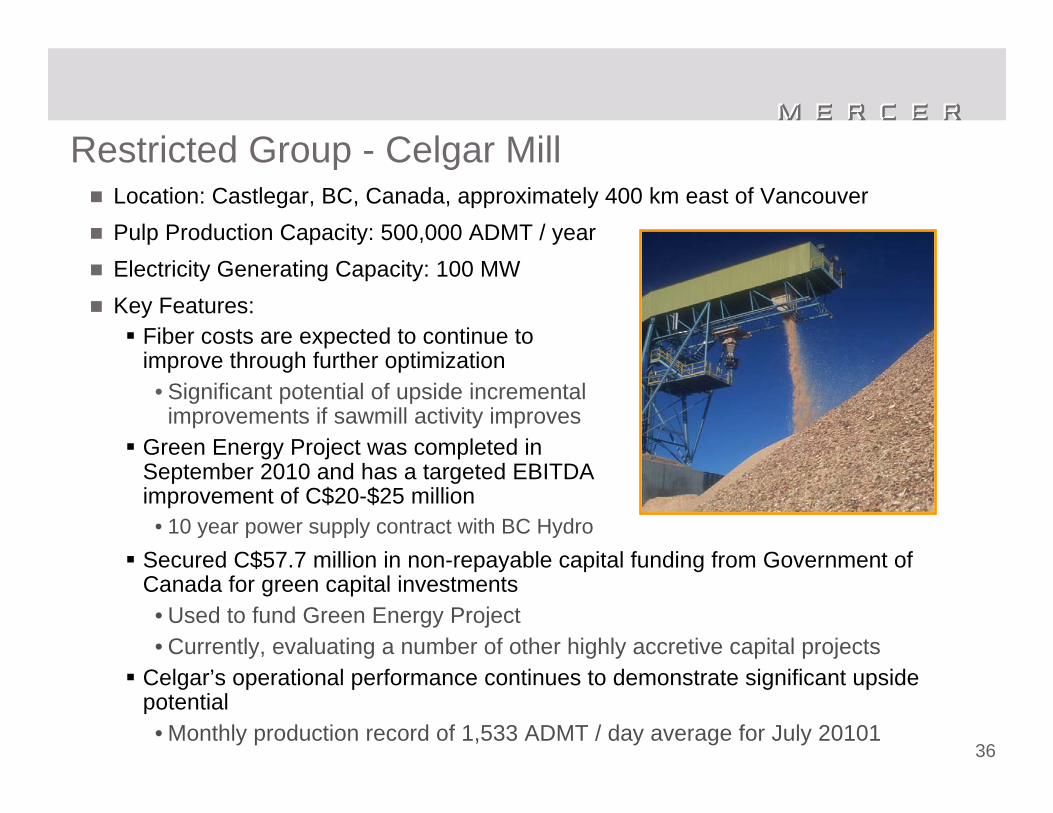
Restricted Group - Celgar MillLocation: Castlegar, BC, Canada, approximately 400 km east of VancouverPulp Production Capacity: 500,000 ADMT / yearElectricity Generating Capacity: 100 MWKey Features:
Fiber costs are expected to continue to improve through further optimization• Significant potential of upside incremental
improvements if sawmill activity improvesGreen Energy Project was completed in September 2010 and has a targeted EBITDA improvement of C$20-$25 million
• 10 year power supply contract with BC HydroSecured C$57.7 million in non-repayable capital funding from Government of Canada for green capital investments• Used to fund Green Energy Project• Currently, evaluating a number of other highly accretive capital projects
Celgar’s operational performance continues to demonstrate significant upside potential• Monthly production record of 1,533 ADMT / day average for July 20101
37
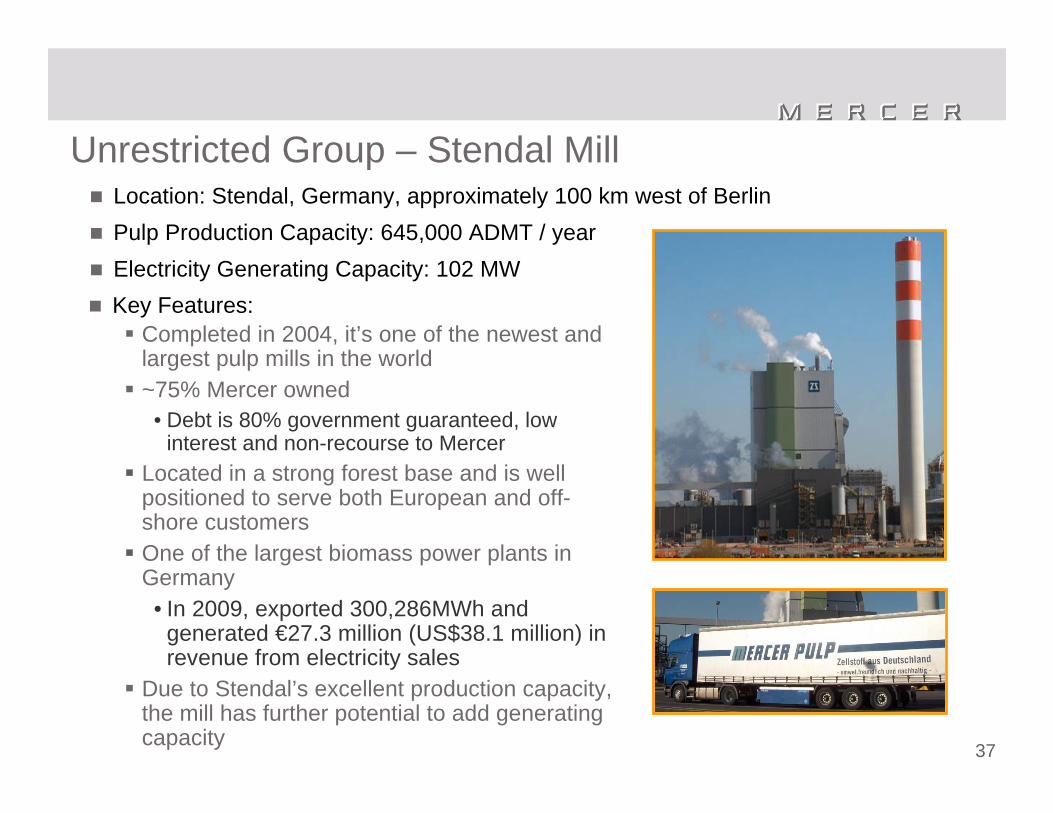
Unrestricted Group – Stendal MillLocation: Stendal, Germany, approximately 100 km west of BerlinPulp Production Capacity: 645,000 ADMT / yearElectricity Generating Capacity: 102 MWKey Features:
Completed in 2004, it’s one of the newest and largest pulp mills in the world~75% Mercer owned
• Debt is 80% government guaranteed, low interest and non-recourse to Mercer
Located in a strong forest base and is well positioned to serve both European and off-shore customersOne of the largest biomass power plants in Germany • In 2009, exported 300,286MWh and
generated €27.3 million (US$38.1 million) in revenue from electricity sales
Due to Stendal’s excellent production capacity, the mill has further potential to add generating capacity