Embed Size (px)
Citation preview

Ashmore SICAV Société d’Investissement à Capital Variable
Luxembourg
Unaudited Semi-Annual Report for the period ended 30 June 2013
2 rue Albert Borschette L – 1246 Luxembourg
Grand-Duchy of Luxembourg R.C. Luxembourg B 90 279

General Information The information represented in this report relates to the period from 1 January 2013 to 30 June 2013. It should not be taken as an indication of the future development of Ashmore SICAV (the “Company”). The Board of Directors may establish different portfolios of assets in one or more Sub-Funds of the Company at any time to meet, in its opinion, the needs of different Shareholders. For the period under review the Company comprised twenty-one Sub-Funds, namely Ashmore SICAV Emerging Markets Debt Fund, Ashmore SICAV Emerging Markets Sovereign Debt Fund, Ashmore SICAV Emerging Markets Sovereign Investment Grade Debt Fund, Ashmore SICAV Turkish Debt Fund, Ashmore SICAV Local Currency Fund, Ashmore SICAV Emerging Markets Local Currency Bond Fund, Ashmore SICAV Emerging Markets Local Markets Currency Fund, Ashmore SICAV Emerging Markets Investment Grade Local Currency Fund, Ashmore SICAV Emerging Markets Inflation Linked Bond Fund, Ashmore SICAV Emerging Markets Total Return Fund, Ashmore SICAV Emerging Markets Total Return Fund II, Ashmore SICAV Emerging Markets Investment Grade Total Return Fund, Ashmore SICAV Emerging Markets Corporate Debt Fund, Ashmore SICAV Emerging Markets Investment Grade Corporate Debt Fund, Ashmore SICAV Emerging Markets Local Currency Corporate Debt Fund, Ashmore SICAV Emerging Markets Asian Corporate Debt Fund, Ashmore SICAV Emerging Markets Global Equity Fund, Ashmore SICAV EM Equity Select Fund, Ashmore SICAV Emerging Markets Global Small-Cap Equity Fund, Ashmore SICAV Emerging Markets Frontier Equity Fund and Ashmore SICAV Brazil Equity Fund. The report does not constitute an offer or an invitation to purchase Shares of the Sub-Funds referred to herein. Subscriptions are only valid if made on the basis of the current Prospectus and Key Investor Information Document (KIID) supplemented by the latest audited annual report. Should the reference date of the audited annual report date back more than eight months, the subscriber must also be supplied with a semi annual report. The figures stated in this report are historical and not necessarily indicative of future performance.

Ashmore SICAV – Unaudited Semi-Annual Report for the period ended 30 June 2013
0
CONTENTS
Management and Administration…………………………………………………………………………… .... 1
Investment Manager’s Report ........................................................................................................................... .2
Consolidated Statement of Net Assets ............................................................................................................... 8
Consolidated Statement of Operations and Changes in Net Assets ................................................................. 13
Fund Statistics ................................................................................................................................................. 18
Schedule of Investments
Emerging Markets Debt Fund ......................................................................................................... 51
Emerging Markets Sovereign Debt Fund ........................................................................................ 64
Emerging Markets Sovereign Investment Grade Debt Fund ........................................................... 72
Turkish Debt Fund .......................................................................................................................... 76
Local Currency Fund ....................................................................................................................... 77
Emerging Markets Local Currency Bond Fund ............................................................................... 81
Emerging Markets Local Markets Currency Fund .......................................................................... 86
Emerging Markets Investment Grade Local Currency Fund ........................................................... 87
Emerging Markets Inflation Linked Bond Fund .............................................................................. 91
Emerging Markets Total Return Fund ........................................................................................... 93
Emerging Markets Total Return Fund II ..................................................................................... 108
Emerging Markets Investment Grade Total Return Fund ............................................................ 121
Emerging Markets Corporate Debt Fund ...................................................................................... 128
Emerging Markets Investment Grade Corporate Debt Fund ........................................................ 140
Emerging Markets Local Currency Corporate Debt Fund ............................................................ 144
Emerging Markets Asian Corporate Debt Fund ........................................................................... 148
Emerging Markets Global Equity Fund ......................................................................................... 151
EM Equity Select Fund ................................................................................................................. 155
Emerging Markets Global Small-Cap Equity Fund ....................................................................... 157
Emerging Markets Frontier Equity Fund ....................................................................................... 161
Brazil Equity Fund ........................................................................................................................ 164
Other Information on Investments ................................................................................................................. 165
Notes to the Consolidated Financial Statements ............................................................................................ 180
Supplementary Information on Fair Value Measurement .............................................................................. 222
4

Ashmore SICAV – Unaudited Semi-Annual Report for the period ended 30 June 2013
1
Management and Administration Registered Office 2, rue Albert Borschette L – 1246 Luxembourg Grand-Duchy of Luxembourg Chairman Michael Moody Executive of Ashmore Investment Management Limited Directors Steve David Managing Director of Northern Trust Management Company S.A. Claude Kremer Partner, law firm Arendt & Medernach Investment Manager and Principal Sales Agent Ashmore Investment Management Limited 61, Aldwych London WC2B 4AE United Kingdom Sub-Managers Ashmore Equities Investment Management Limited (US) L.L.C. 1001 19th Street North, 17th Floor Arlington, Virginia 22209 United States of America Ashmore Management Company Brasil Limited (as from 18 February 2013) Trafalgar Court, Les Banques, St. Peter Port Guernsey GY1 3QL, Channel Islands Ashmore Management Company Turkey Limited (as from 18 February 2013) Trafalgar Court, Les Banques, St. Peter Port, Guernsey GY1 3QL, Channel Islands Ashmore Brasil Gestora de Recursos Ltda. (as from 18 February 2013) Avenue Faria Lima, 2055 cj 32, City of São Paulo, State of São Paulo, 01452-001, Brazil Ashmore Portföy Yönetimi Anonim Şirketi (as from 18 February 2013) Tamburi Ali Efendi Sk. No: 13 Kat: 1 Etiler 34337, Istanbul Turkey Custodian and Principal Paying Agent Northern Trust Global Services Limited, Luxembourg Branch
2, rue Albert Borschette L – 1246 Luxembourg Grand-Duchy of Luxembourg Management Company Northern Trust Luxembourg Management Company S.A.
2, rue Albert Borschette L – 1246 Luxembourg Grand-Duchy of Luxembourg
Auditor KPMG Luxembourg S.à r.l. 9, Allée Scheffer L – 2520 Luxembourg Grand-Duchy of Luxembourg Legal Advisors Arendt & Medernach 14, rue Erasme L – 2082 Luxembourg Grand-Duchy of Luxembourg Listing Agent Banque et Caisse d’Epargne de l’Etat Luxembourg 1 Place de Metz L – 2954 Luxembourg Grand-Duchy of Luxembourg Financial Servicing Austria UniCredit Bank Austria AG (Paying & Information Agent) Schottengasse 6-8 1010 Wien Austria Germany Deutsche Bank AG (Paying & Information Agent) TSS post-IPO Services Taunusanlage 12 60325 Frankfurt am Main Germany Luxembourg Northern Trust Luxembourg Management Company S.A.
2, rue Albert Borschette L – 1246 Luxembourg Grand-Duchy of Luxembourg
Switzerland BNP Paribas Securities Services, Paris succursale de Zurich (Paying & Information Agent) Selnaustrasse 16 8002 Zurich Switzerland United Kingdom Ashmore Investment Management Limited 61, Aldwych London WC2B 4AE United Kingdom United States and Canada Northern Trust Securities, Inc. (Placing Agent) 50 S La Salle St., Ste. 12 Chicago, IL 60603-1006 United States of America

Ashmore SICAV – Unaudited Semi-Annual Report for the period ended 30 June 2013
2
Investment Manager’s Report
Sub-Fund Performance
Share Class Net Asset Value % Increase/(decrease) in the as at 30 June 2013 period NAV (gross of dividends)
Emerging Markets Debt Fund
Retail Class Shares (EUR) Income 143.98 (8.62%)
Retail Class Shares (US$) Income 93.87 (8.44%)
Retail Class Shares (GBP) Income 110.86 (8.25%)
Retail Class Shares (NOK) Income 104.74 (8.12%)
Retail Class Shares (AUD) Income 100.51 (2.23%)
Institutional Class Shares (EUR) Income 34.26 (8.36%)
Institutional Class Shares (US$) Income 106.86 (8.17%)
Institutional Class Shares (GBP) Income 106.15 (8.01%)
Institutional Class Shares (NOK) Income 108.14 (7.61%)
Institutional Class Shares (CHF) Income 100.75 (8.29%)
Institutional Class Shares (US$) Accumulation17 92.11 (7.89%)
Z Class Shares (US$) Income11 92.62 (7.38%)
Z Class Shares (GBP) Income6 92.54 (7.46%)
Emerging Markets Sovereign Debt Fund Retail Class Shares (GBP) Income 104.34 (9.24%)
Institutional Class Shares (US$) Income 105.33 (9.12%)
Institutional Class Shares (GBP) Income 95.69 (8.96%)
Institutional Class Shares II (JPY) Income19 9,139.20 (8.61%)
Emerging Markets Sovereign Investment Grade Debt Fund Institutional Class Shares (US$) Income 108.70 (10.00%)
Turkish Debt Fund
Institutional Class Shares (US$) Accumulation10 91.85 (11.98%)
Local Currency Fund Retail Class Shares (EUR) Income 99.01 (3.83%)
Retail Class Shares (US$) Income 109.95 (3.67%)
Retail Class Shares (GBP) Income 106.35 (3.62%)
Retail Class Shares (CHF) Income 98.49 (3.93%)
Institutional Class Shares (EUR) Income 96.23 (3.64%)
Institutional Class Shares (US$) Income 96.64 (3.41%)
Institutional Class Shares (GBP) Income 97.32 (3.36%)
Institutional Class Shares (CHF) Income 93.68 (3.58%)
Institutional Class Shares (US$) Accumulation17 96.53 (3.47%)
Z Class Shares (EUR) Accumulation14 96.13 (3.87%)
Z Class Shares (US$) Accumulation13 95.99 (4.01%)
Z Class Shares (GBP) Accumulation13 95.99 (4.01%)
Emerging Markets Local Currency Bond Fund Retail Class Shares (EUR) Income 94.95 (9.05%)
Retail Class Shares (US$) Income 92.51 (8.77%)
Retail Class Shares (GBP) Income 94.00 (8.55%)
1 launched on 14 January 2013 9 launched on 14 Febuary 2013 17 launched on 4 April 2013 25 launched on 4 June 2013 2 launched on 15 January 2013 10 launched on 18 Febuary 2013 18 launched on 5 April 2013 26 terminated on 4 June 2013 3 launched on 16 January 2013 11 launched on 19 Febuary 2013 19 launched on 11 April 2013 27 launched on 13 June 2013 4 launched on 30 January 2013 12 launched on 28 Febuary 2013 20 launched on 16 April 2013 28 launched on 20 June 2013 5 launched on 1 Febuary 2013 13 launched on 12 March 2013 21 launched on 26 April 2013 29 terminated on 26 June 2013 6 launched on 8 Febuary 2013 14 launched on 18 March 2013 22 launched on 7 May 2013 30 launched on 26 June 2013 7 launched on 12 Febuary 2013 15 launched on 25 March 2013 23 launched on 17 May 2013 8 launched on 13 Febuary 2013 16 launched on 2 April 2013 24 terminated on 24 May 2013

Ashmore SICAV – Unaudited Semi-Annual Report for the period ended 30 June 2013
3
Investment Manager’s Report (continued) Sub-Fund Performance (continued)
Share Class Net Asset Value % Increase/(decrease) in the as at 30 June 2013 period NAV (gross of dividends)
Emerging Markets Local Currency Bond Fund (continued) Institutional Class Shares (EUR) Income 100.06 (8.74%)
Institutional Class Shares (US$) Income 109.67 (8.51%)
Institutional Class Shares (GBP) Income 105.38 (8.43%)
Institutional Class Shares (US$) Accumulation7 90.30 (9.70%)
Z Class Shares (GBP) Income12 91.05 (8.95%)
Z Class Shares (US$) Accumulation12 90.95 (9.05%)
Emerging Markets Local Markets Currency Fund Retail Class Shares (GBP) Income 97.19 (2.82%)
Institutional Class Shares (US$) Income 101.59 (2.67%)
Emerging Markets Investment Grade Local Currency Fund Institutional Class Shares (EUR) Income 90.78 (9.23%)
Institutional Class Shares (US$) Income 90.04 (8.97%)
Emerging Markets Inflation Linked Bond Fund Retail Class Shares (US$) Income8 86.97 (13.03%)
Institutional Class Shares (US$) Income 95.02 (11.33%)
Institutional Class Shares (US$) Accumulation17 87.24 (12.76%)
Emerging Markets Total Return Fund
Retail Class Shares (US$) Income4 92.89 (7.11%)
Retail Class Shares (GBP) Income 102.33 (6.41%)
Institutional Class Shares (US$) Income 99.77 (6.26%)
Institutional Class Shares (GBP) Income 110.65 (6.09%)
Institutional Class Shares (US$) Accumulation23 92.54 (7.46%)
Institutional Class Shares (GBP) Accumulation15 94.15 (5.85%)
Emerging Markets Total Return Fund II
Institutional Class Shares (US$) Income 94.87 (5.80%)
Emerging Markets Investment Grade Total Return Fund Institutional Class Shares (EUR) Income 92.49 (7.91%)
Institutional Class Shares (US$) Income 93.50 (7.72%)
Emerging Markets Corporate Debt Fund Retail Class Shares (EUR) Income 96.15 (2.83%)
Retail Class Shares (US$) Income 96.28 (2.73%)
Retail Class Shares (GBP) Income 100.55 (2.48%)
Retail Class Shares (CHF) Income 96.98 (2.79%)
1 launched on 14 January 2013 9 launched on 14 Febuary 2013 17 launched on 4 April 2013 25 launched on 4 June 2013 2 launched on 15 January 2013 10 launched on 18 Febuary 2013 18 launched on 5 April 2013 26 terminated on 4 June 2013 3 launched on 16 January 2013 11 launched on 19 Febuary 2013 19 launched on 11 April 2013 27 launched on 13 June 2013 4 launched on 30 January 2013 12 launched on 28 Febuary 2013 20 launched on 16 April 2013 28 launched on 20 June 2013 5 launched on 1 Febuary 2013 13 launched on 12 March 2013 21 launched on 26 April 2013 29 terminated on 26 June 2013 6 launched on 8 Febuary 2013 14 launched on 18 March 2013 22 launched on 7 May 2013 30 launched on 26 June 2013 7 launched on 12 Febuary 2013 15 launched on 25 March 2013 23 launched on 17 May 2013 8 launched on 13 Febuary 2013 16 launched on 2 April 2013 24 terminated on 24 May 2013

Ashmore SICAV – Unaudited Semi-Annual Report for the period ended 30 June 2013
4
Investment Manager’s Report (continued) Sub-Fund Performance (continued)
Share Class Net Asset Value % Increase/(decrease) in the as at 30 June 2013 period NAV (gross of dividends)
Emerging Markets Corporate Debt Fund (continued)
Retail Class Shares (EUR) Accumulation1 95.44 (4.56%)
Retail Class Shares (US$) Accumulation1 95.51 (4.49%)
Retail Class Shares (CHF) Accumulation3 95.35 (4.65%)
Institutional Class Shares (EUR) Income 112.68 (2.55%)
Institutional Class Shares (US$) Income 110.57 (2.43%)
Institutional Class Shares (GBP) Income 96.64 (2.27%)
Institutional Class Shares (NOK) Income 93.82 (1.99%)
Institutional Class Shares (CHF) Income 96.67 (3.01%)
Institutional Class Shares (AUD) Income25 96.08 (3.92%)
Institutional Class Shares (EUR) Accumulation1 95.64 (4.36%)
Institutional Class Shares (US$) Accumulation2 95.76 (4.24%)
Institutional Class Shares (CHF) Accumulation1 95.70 (4.30%)
Institutional Class Shares (MXN) Accumulation22 942.74 (5.73%)
Institutional Class Shares (CAD) Accumulation22 93.97 (6.03%)
Institutional Class Shares II (JPY) Income16 9,443.68 (4.68%)
Z Class Shares (US$) Income28 100.52 0.52%
Z Class Shares (GBP) Income30 98.95 (1.05%)
Emerging Markets Investment Grade Corporate Debt Fund Institutional Class Shares (EUR) Income5 93.60 (6.40%)
Institutional Class Shares (US$) Income 114.36 (5.15%)
Z Class Shares (GBP) Income20 93.07 (6.93%)
Emerging Markets Local Currency Corporate Debt Fund
Retail Class Shares (EUR) Income 95.06 (5.65%)
Retail Class Shares (US$) Income9 92.72 (7.28%)
Retail Class Shares (GBP) Income 105.05 (5.16%)
Retail Class Shares (CHF) Income 94.36 (5.62%)
Institutional Class Shares (US$) Income 93.44 (5.11%)
Institutional Class Shares (EUR) Accumulation15 93.25 (6.75%)
Institutional Class Shares (US$) Accumulation18 93.29 (6.71%)
Institutional Class Shares (CHF) Accumulation14 92.91 (7.09%)
Emerging Markets Asian Corporate Debt Fund
Institutional Class Shares (US$) Income 97.23 (1.32%)
Emerging Markets Global Equity Fund Retail Class Shares (US$) Income 105.37 (11.59%)
Retail Class Shares (GBP) Income 87.50 (11.37%)
Institutional Class Shares (US$) Income 110.11 (11.36%)
Institutional Class Shares (CHF) Income 86.97 (11.40%)
EM Equity Select Fund Retail Class Shares (GBP) Accumulation 85.76 (8.83%)
Institutional Class Shares (US$) Accumulation 111.01 (8.80%)
1 launched on 14 January 2013 9 launched on 14 Febuary 2013 17 launched on 4 April 2013 25 launched on 4 June 2013 2 launched on 15 January 2013 10 launched on 18 Febuary 2013 18 launched on 5 April 2013 26 terminated on 4 June 2013 3 launched on 16 January 2013 11 launched on 19 Febuary 2013 19 launched on 11 April 2013 27 launched on 13 June 2013 4 launched on 30 January 2013 12 launched on 28 Febuary 2013 20 launched on 16 April 2013 28 launched on 20 June 2013 5 launched on 1 Febuary 2013 13 launched on 12 March 2013 21 launched on 26 April 2013 29 terminated on 26 June 2013 6 launched on 8 Febuary 2013 14 launched on 18 March 2013 22 launched on 7 May 2013 30 launched on 26 June 2013 7 launched on 12 Febuary 2013 15 launched on 25 March 2013 23 launched on 17 May 2013 8 launched on 13 Febuary 2013 16 launched on 2 April 2013 24 terminated on 24 May 2013

Ashmore SICAV – Unaudited Semi-Annual Report for the period ended 30 June 2013
5
Investment Manager’s Report (continued) Sub-Fund Performance (continued)
Share Class Net Asset Value % Increase/(decrease) in the as at 30 June 2013 period NAV (gross of dividends)
Emerging Markets Global Small-Cap Equity Fund
Retail Class Shares (EUR) Income 96.66 (3.69%)
Retail Class Shares (US$) Income 121.38 (3.53%)
Retail Class Shares (GBP) Income 98.33 (3.30%)
Retail Class Shares (CHF) Income 97.76 (3.63%)
Institutional Class Shares (US$) Income 123.51 (3.30%)
Emerging Markets Frontier Equity Fund Retail Class Shares (GBP) Income27 97.26 (2.74%)
Institutional Class Shares (US$) Income 138.66 23.52%
Brazil Equity Fund Institutional Class Shares (US$) Accumulation10 162.15 (23.09%)
Share Class Last official % Increase/(decrease) in the
Net Asset Value period NAV (gross of dividends)
Emerging Markets Local Currency Bond Fund
Institutional Class Shares (CHF) Income29 90.24 (9.19%)
Emerging Markets Investment Grade Local Currency Fund Retail Class Shares (US$) Income21,29 86.77 (13.23%)
Emerging Markets Global Equity Fund
Retail Class Shares (EUR) Income26 95.03 (4.53%)
Brazil Equity Fund Retail Class Shares (US$) Accumulation10,24 94.35 (55.25%)
1 launched on 14 January 2013 9 launched on 14 Febuary 2013 17 launched on 4 April 2013 25 launched on 4 June 2013 2 launched on 15 January 2013 10 launched on 18 Febuary 2013 18 launched on 5 April 2013 26 terminated on 4 June 2013 3 launched on 16 January 2013 11 launched on 19 Febuary 2013 19 launched on 11 April 2013 27 launched on 13 June 2013 4 launched on 30 January 2013 12 launched on 28 Febuary 2013 20 launched on 16 April 2013 28 launched on 20 June 2013 5 launched on 1 Febuary 2013 13 launched on 12 March 2013 21 launched on 26 April 2013 29 terminated on 26 June 2013 6 launched on 8 Febuary 2013 14 launched on 18 March 2013 22 launched on 7 May 2013 30 launched on 26 June 2013 7 launched on 12 Febuary 2013 15 launched on 25 March 2013 23 launched on 17 May 2013 8 launched on 13 Febuary 2013 16 launched on 2 April 2013 24 terminated on 24 May 2013

Ashmore SICAV – Unaudited Semi-Annual Report for the period ended 30 June 2013
6
Investment Manager’s Report (continued) Economic and Market Review Overview This reporting period was a volatile one for financial markets; investors experienced a significant dispersion in returns across countries, regions, and asset classes. In the early part of the period, there were clear signs of risk appetite as both US and Japanese equities performed well. The strong run in the S&P was supported by significant US Dollar strength on the back of some very promising data. Japan benefitted from stimulus measures initially enacted by the Government and subsequently by the Bank of Japan. At the start of the second quarter, US data became decidedly weaker as non-farm payrolls, manufacturing and PMI surveys all came in lower than expected. The Q1 US GDP release was far more positive with real GDP coming in at 2.5%, although this was subsequently revised downwards to 1.8%. Market volatility increased in May following comments by the US Federal Reserve that it might taper off its QE programme earlier than expected, subject to data releases. The sell-off in Emerging Markets (“EM”) assets became disorderly towards the end of the second quarter, after levered funds and non-EM managers began to unwind opportunistic EM positions. This situation was exacerbated by Bernanke’s testimony to the US Senate where he confirmed that tapering QE was very much on the cards. Europe continues to remind us that despite Draghi’s ‘put’, the region still has plenty of problems to deal with, the biggest of which is growth. Large peripheral countries continue to suffer from contracting economies, while the more stable core tries to address slowing growth. Austerity measures imposed by the authorities are leading to conflicts within coalition governments: Portugal has seen a number of high profile ministers resign while Italy struggled to form a government following elections in February. The risk of financial contagion temporarily increased following a clumsy rescue plan imposed on Cyprus by the Troika. This proposed that all bank depositors would fund the bailout. Although the plan was subsequently revised, the risk of both bank runs and capital controls in peripheral markets increased. EM economic growth remains buoyant. While EM stories have hit the headlines, most notably concerning Brazil, Turkey and Egypt, the overall picture in EM is positive. Protests, like the ones in Brazil and Turkey, force governments to act in the interests of the people and address popular concerns such as corruption, benefitting the economy in the long term. Recent growth data has been robust and inflation remains benign, confirming that on the whole, EM economies remain on track to meet their forecasts, and that the technical sell off in the markets was not justified. Overview by Investment Theme External Debt US dollar denominated sovereign and quasi-sovereign bonds continue to form a core part of EM fixed income investment. The first six months of 2013 were a challenging period for the asset class, largely resulting from a sell-off in US Treasuries which drove yields higher. Despite the widespread sell off, performance was idiosyncratic as different stories played out: The search for yield saw high yield EM credits outperform their investment grade counterparts and performance varied significantly by country with Egypt, Uruguay, Argentina and Brazil amongst the largest detractors over the period. Well publicised political turmoil in Egypt which led to economic instability was the main driver of performance in that country and damage was also done to Egypt’s lucrative tourism industry. Argentinian performance varied between the quarters: In Q1 the credit suffered from a risk of technical default emanating from the Appeal Court ruling in the country’s fight against bond ‘holdouts’ from the 2001 default. In Q2 bonds bounced back from their lows as the market continued to await the ruling of the Appeals Court. The macroeconomic situation in Brazil worsened as inflationary expectations increased, the currency weakened and consumer spending fell. Street protests against rising bus fares and the cost of hosting sporting events caused investors to become increasingly uncomfortable with the situation. However, the government response was constructive and the focus on clearing infrastructure bottlenecks is encouraging. There were few positive country performers over the period although some smaller markets such as Jamaica and Ecuador fared relatively well. Perhaps the real surprise was Pakistan whose bonds rallied fallowing the election victory of Nawaz Sharif who is regarded as business friendly and is likely to table much needed reforms of Pakistan’s economy. Local Currency Debt and Local Currencies The performance of local currency assets during the period, for both bonds and FX, can be split into two distinct halves: EM currencies ended the first quarter flat in the face of a strong USD, while EM bonds recorded a mild decline; in the second quarter, local currency assets were heavily impacted as non-dedicated investors and leveraged macro/hedge funds rushed for the exit. Within the fixed income space, EM local currency debt was the worst performing theme as local currency bond yields spiked. In the currency space, currencies with greater external account vulnerability and commodity exporters suffered the most. India was one the most significant detractors from performance. The collapse of the INR associated with the country’s dependency on capital inflows was exacerbated by worse than expected trade numbers resulting from high gold imports in anticipation of Government imposed import restrictions. Brazil was also a significant detractor from both local currency and fixed income performance: The country experienced a “perfect storm” of fiscal account deterioration and a rising current account deficit, largely due to weaker iron ore prices, falling exports, higher prices on refined oil imports and widespread street protests. Less liquid Peruvian and Colombian bonds also detracted from fixed income performance. Surprisingly, Romania and Hungary were the best performers in the bond space: Improving financial stability and tighter fiscal policy helped generate a positive external balance for the latter.

Ashmore SICAV – Unaudited Semi-Annual Report for the period ended 30 June 2013
7
Investment Manager’s Report (continued) Overview by Investment Theme (continued) Corporate Debt In the six months to 30 June 2013, EM corporate bonds outperformed both EM external debt and EM local currency instruments. Within the asset class, high yield outperformed investment grade in the face of the US Treasury sell-off. Market conditions were generally supportive over the period with strong flows into the asset class throughout the first quarter. This helped drive Q1 returns with issuers taking advantage of the strong liquidity: both high yield and investment grade names issued new bonds. Sentiment towards new issues changed in Q2 as market volatility increased and many new issues were postponed as investors began to cut back on duration. Despite the sell-off, fundamentals in the corporate debt space remain attractive: Default rates remain low and distressed situations are idiosyncratic by nature. This aside, company balance sheets are in good shape and many issuers have taken advantage of low interest rates to refinance their higher-coupon instruments. Equities EM equities ended the period in negative territory, largely as a result of a second quarter sell-off. This was particularly evident in the last six weeks of June when the asset class saw investors pull money out in anticipation of a tapering of the Fed’s QE program. There were very few, if any markets which escaped unscathed but Brazil and South Korea were probably amongst the hardest hit. In general, more liquid markets and names sold off the most as these were the stocks held by more opportunistic investors. Falling growth, rising inflation and social unrest resulting in popular protests detracted from performance in Brazil and depreciation in the Brazilian Real compounded this. We believe that the sell off was overdue and in fact, created selective buying opportunities. Indeed, the Investment Manager used the opportunity to build equities exposure in Brazil and add selective names in Mexico. Chinese and Korean equities sold off, in part due to currency weakness. Samsung Electronics for example, which accounts for over 20% of MSCI Korea, witnessed a 12% fall in its share price. Small-cap equities significantly outperformed large-caps as a result of investors seeking exposure to domestic driven EM growth. While on average, small-cap valuations look high relative to large cap, it is possible to find companies with superior earnings growth trading at compelling valuations. The Investment Manager took advantage of the sell-off in May and June and added to positions in equities. Outlook Despite some negative headlines surrounding the Emerging Markets, growth in most EM countries remains fairly robust. Where necessary, EM policy makers have responded to slowing growth by either cutting interest rates or implementing other fiscal and monetary measures. The important points to highlight are that EM Central Banks generally have the necessary ammunition to act decisively in the form of FX reserves and positive accounts, and EM governments have the necessary incentive to push through structural reforms due to the lack of welfare states in most EM countries. The challenge remains to rebalance their economies towards domestic demand.
We are optimistic that most EM economies will make the necessary adjustments as the global economic environment changes. China is already well ahead of the curve, stubbornly transitioning its economy away from export dependence despite upfront costs in the form of lower growth and political challenges. Following progress in 2012, India has recently resumed economic reforms and major fiscal adjustment despite the proximity of elections. Colombia has also embarked on significant reforms and Mexico is likely to follow suit in the second half of 2013. In Brazil, the government’s response to the recent dissent shown by the populace was relatively swift; the central bank responded to rising inflationary expectations by raising policy interest rates by 75bps (with further rate rises priced in at the time of writing); and the government responded to the weaker currency by removing IOF taxation on both derivative and fixed income investments by foreigners, in addition to providing domestic dollar lines. Ashmore Investment Management Limited

Ashmore SICAV – Unaudited Semi-Annual Report for the period ended 30 June 2013
8
Consolidated Statement of Net Assets As at 30 June 2013
Consolidated*
Emerging Markets Debt Fund
Emerging Markets Sovereign Debt
Fund
Emerging Markets Sovereign
Investment Grade Debt Fund Turkish Debt Fund
Note US$ US$ US$ US$ US$ Investments at market value 2 9,161,613,084 1,119,872,987 115,495,635 58,993,372 45,134,310 (Acquisition cost: ) 9,812,834,726 1,189,298,522 126,637,312 58,862,338 49,852,851
Bonds 8,081,777,534 1,114,945,988 115,313,068 58,993,372 45,134,310
Equities 157,697,281 833,222 - - -
Undertakings for collective investment 221,214,705 - - - -
Loan participations 77,013,570 3,732,112 182,567 - -
Fully funded total return swaps 314,683,861 - - - -
Certificates of deposit 99,974,032 - - - -
Commercial papers 184,751,680 - - - -
Warrants and rights 17,317,664 192,283 - - -
Written options 6,988,787 169,382 - - -
REITSs 193,970 - - - -
Cash at bank 11 1,080,660,564 68,924,261 7,600,559 3,379,366 661,720
Unrealised gain on financial derivative investments 10 101,098,423 7,489,843 56,266 123 82,606
Receivable on reverse repurchase agreements 12 57,678,403 - - - -
Other assets 9 329,518,931 66,063,683 3,398,630 919,983 1,160,636
Total assets 10,730,569,405 1,262,350,774 126,551,090 63,292,844 47,039,272
Unrealised (loss) on financial derivative investments 10 (221,862,914) (17,383,374) (2,642,368) - (47,277)
Payable on repurchase agreements 12 (162,164,572) (139,827,880) (1,977,468) - -
Other liabilities 9 (231,064,948) (76,890,290) (97,227) (96,908) (52,852)
Total liabilities (615,092,434) (234,101,544) (4,717,063) (96,908) (100,129)
Net assets 10,115,476,971 1,028,249,230 121,834,027 63,195,936 46,939,143
* Intragroup transactions are eliminated from consolidated figures. The accompanying notes form an integral part of these consolidated financial statements.

Ashmore SICAV – Unaudited Semi-Annual Report for the period ended 30 June 2013
9
Consolidated Statement of Net Assets (continued) As at 30 June 2013
Local Currency Fund
Emerging Markets Local Currency
Bond Fund
Emerging Markets Local Markets
Currency Fund
Emerging Markets Investment Grade
Local Currency Fund
Emerging Markets Inflation Linked
Bond Fund Note US$ US$ US$ US$ US$
Investments at market value 2 836,829,616 2,562,187,736 2,683,511 308,589,042 44,411,590
(Acquisition cost: ) 917,610,109 2,763,469,116 2,392,032 335,980,609 47,706,548
Bonds 358,794,646 2,286,159,791 1,365,209 286,686,231 44,336,214
Undertakings for collective investment 138,798,057 32,764,457 1,300,674 13,501,365 -
Fully funded total return swaps 52,538,447 239,432,019 - 7,928,462 -
Certificates of deposit 99,974,032 - - - -
Commercial papers 184,751,680 - - - -
Written options 1,972,754 3,831,469 17,628 472,984 75,376
Cash at bank 11 588,082,455 131,657,356 7,277,472 19,763,972 4,607,170
Unrealised gain on financial derivative investments 10 22,890,104 49,365,634 250,769 5,347,234 953,635
Receivable on reverse repurchase agreements 12 53,649,273 - 4,029,130 - -
Other assets 9 6,182,713 85,813,340 5,802 7,465,703 753,867
Total assets 1,507,634,161 2,829,024,066 14,246,684 341,165,951 50,726,262
Unrealised (loss) on financial derivative investments 10 (62,604,685) (69,441,987) (427,515) (6,961,373) (800,140)
Other liabilities 9 (52,331,249) (46,232,768) (18,527) (3,464,542) (56,267)
Total liabilities (114,935,934) (115,674,755) (446,042) (10,425,915) (856,407)
Net assets 1,392,698,227 2,713,349,311 13,800,642 330,740,036 49,869,855
The accompanying notes form an integral part of these consolidated financial statements.
Ashmore SICAV – Unaudited Semi-Annual Report for the period ended 30 June 2013
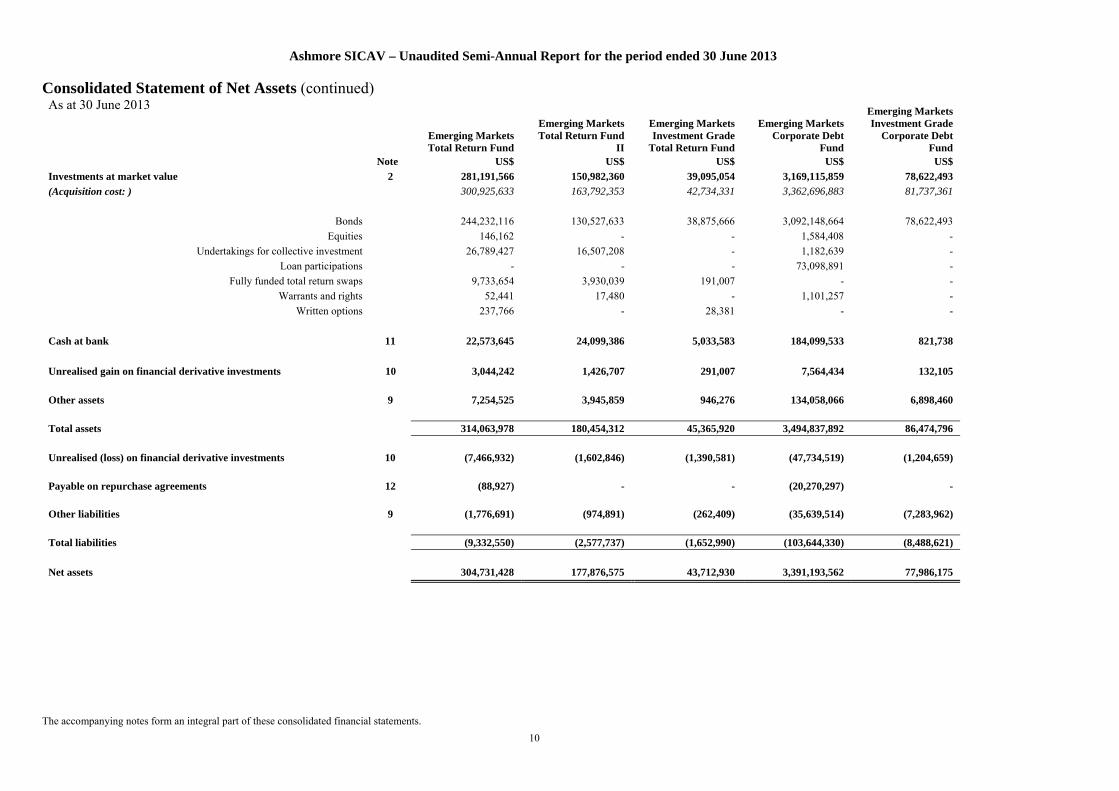
10
Consolidated Statement of Net Assets (continued) As at 30 June 2013
Emerging Markets Total Return Fund
Emerging Markets Total Return Fund
II
Emerging Markets Investment Grade
Total Return Fund
Emerging Markets Corporate Debt
Fund
Emerging Markets Investment Grade
Corporate Debt Fund
Note US$ US$ US$ US$ US$
Investments at market value 2 281,191,566 150,982,360 39,095,054 3,169,115,859 78,622,493
(Acquisition cost: ) 300,925,633 163,792,353 42,734,331 3,362,696,883 81,737,361
Bonds 244,232,116 130,527,633 38,875,666 3,092,148,664 78,622,493
Equities 146,162 - - 1,584,408 -
Undertakings for collective investment 26,789,427 16,507,208 - 1,182,639 -
Loan participations - - - 73,098,891 -
Fully funded total return swaps 9,733,654 3,930,039 191,007 - -
Warrants and rights 52,441 17,480 - 1,101,257 -
Written options 237,766 - 28,381 - -
Cash at bank 11 22,573,645 24,099,386 5,033,583 184,099,533 821,738
Unrealised gain on financial derivative investments 10 3,044,242 1,426,707 291,007 7,564,434 132,105
Other assets 9 7,254,525 3,945,859 946,276 134,058,066 6,898,460
Total assets 314,063,978 180,454,312 45,365,920 3,494,837,892 86,474,796
Unrealised (loss) on financial derivative investments 10 (7,466,932) (1,602,846) (1,390,581) (47,734,519) (1,204,659)
Payable on repurchase agreements 12 (88,927) - - (20,270,297) -
Other liabilities 9 (1,776,691) (974,891) (262,409) (35,639,514) (7,283,962)
Total liabilities (9,332,550) (2,577,737) (1,652,990) (103,644,330) (8,488,621)
Net assets 304,731,428 177,876,575 43,712,930 3,391,193,562 77,986,175
The accompanying notes form an integral part of these consolidated financial statements.
Ashmore SICAV – Unaudited Semi-Annual Report for the period ended 30 June 2013
11
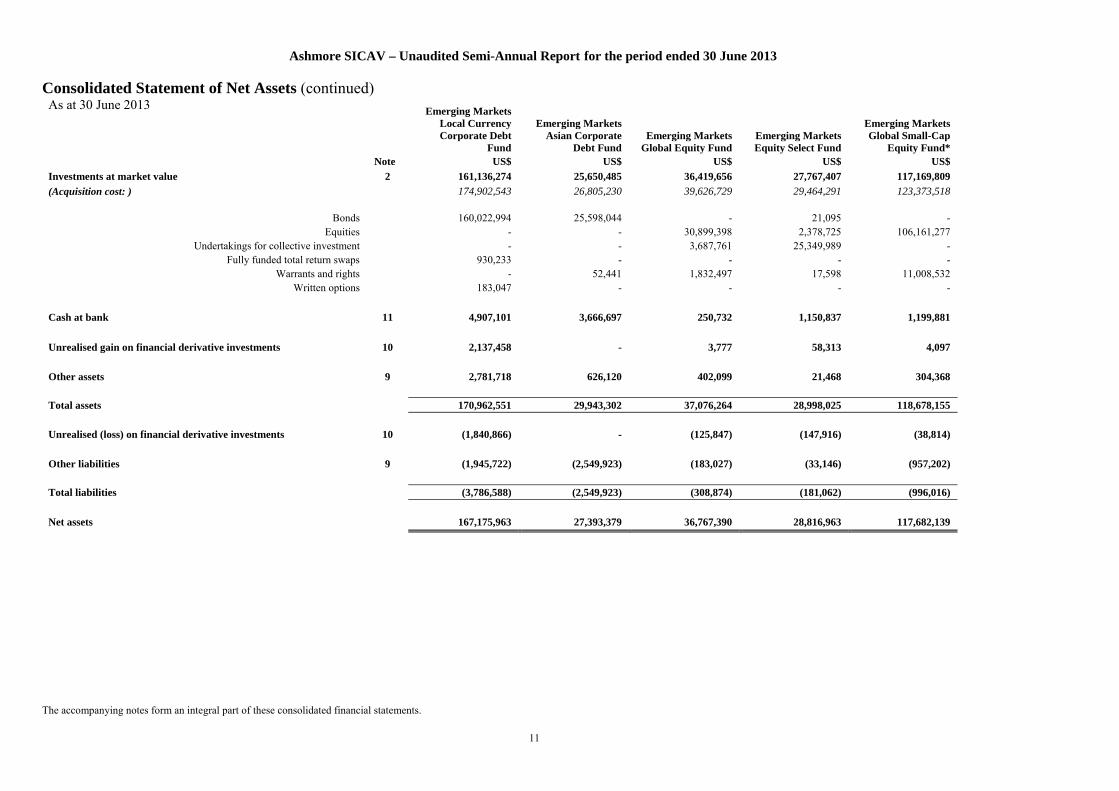
Consolidated Statement of Net Assets (continued) As at 30 June 2013
Emerging Markets Local Currency Corporate Debt
Fund
Emerging Markets Asian Corporate
Debt Fund Emerging Markets
Global Equity Fund Emerging Markets Equity Select Fund
Emerging Markets Global Small-Cap
Equity Fund* Note US$ US$ US$ US$ US$
Investments at market value 2 161,136,274 25,650,485 36,419,656 27,767,407 117,169,809
(Acquisition cost: ) 174,902,543 26,805,230 39,626,729 29,464,291 123,373,518
Bonds 160,022,994 25,598,044 - 21,095 - Equities - - 30,899,398 2,378,725 106,161,277
Undertakings for collective investment - - 3,687,761 25,349,989 - Fully funded total return swaps 930,233 - - - -
Warrants and rights - 52,441 1,832,497 17,598 11,008,532 Written options 183,047 - - - -
Cash at bank 11 4,907,101 3,666,697 250,732 1,150,837 1,199,881
Unrealised gain on financial derivative investments 10 2,137,458 - 3,777 58,313 4,097
Other assets 9 2,781,718 626,120 402,099 21,468 304,368 Total assets 170,962,551 29,943,302 37,076,264 28,998,025 118,678,155 Unrealised (loss) on financial derivative investments 10 (1,840,866) - (125,847) (147,916) (38,814)
Other liabilities 9 (1,945,722) (2,549,923) (183,027) (33,146) (957,202) Total liabilities (3,786,588) (2,549,923) (308,874) (181,062) (996,016)
Net assets 167,175,963 27,393,379 36,767,390 28,816,963 117,682,139
The accompanying notes form an integral part of these consolidated financial statements.

Ashmore SICAV – Unaudited Semi-Annual Report for the period ended 30 June 2013
12
Consolidated Statement of Net Assets (continued) As at 30 June 2013
Emerging Markets Frontier Equity
Fund Brazil Equity Fund Note US$ US$
Investments at market value 2 15,492,920 3,244,304
(Acquisition cost: ) 13,016,218 3,735,877
Equities 12,449,785 3,244,304
Warrants and rights 3,043,135 -
Cash at bank 11 475,970 427,130
Unrealised gain on financial derivative investments 10 69 -
Other assets 9 370,697 144,918
Total assets 16,339,656 3,816,352
Unrealised (loss) on financial derivative investments 10 (1,215) -
Other liabilities 9 (94,705) (123,126)
Total liabilities (95,920) (123,126)
Net assets 16,243,736 3,693,226
The accompanying notes form an integral part of these consolidated financial statements.

Ashmore SICAV – Unaudited Semi-Annual Report for the period ended 30 June 2013
13
Consolidated Statement of Operations and Changes in Net Assets For the period ended 30 June 2013
Consolidated*
Emerging Markets Debt Fund
Emerging Markets Sovereign Debt
Fund
Emerging Markets Sovereign
Investment Grade Debt Fund Turkish Debt Fund
Note US$ US$ US$ US$ US$ Net asset value at the beginning of the period 8,160,746,676 1,078,513,519 74,626,317 14,328,958 -
Income Net interest on investments 259,466,044 37,305,290 2,191,907 304,230 1,933,076
Net bank interest 528,064 2,622 1,088 - 2,380
Net dividends 2,374,927 467 - - 532
Other income 590,147 - - - -
Total income 262,959,182 37,308,379 2,192,995 304,230 1,935,988
Expenses Management fees 3 (48,228,989) (4,681,465) (333,136) (59,375) (282,424)
Custodian fees 4 (711,569) (50,355) (2,396) (1,164) (2,549)
Interest expense on repurchase agreements (308,891) (283,921) (228) - -
Management Company fees 5 (1,330,856) (140,786) (12,704) (2,347) (10,159)
Subscription tax 7 (560,599) (56,339) (3,623) (820) (3,292)
Transaction fees 8 (824,783) (72,256) (7,729) (1,980) (137)
Other operating expenses 6 (3,539,418) (408,836) (52,655) (16,288) (81,118)
Total expenses (55,505,105) (5,693,958) (412,471) (81,974) (379,679)
Net investment income/(loss) 207,454,077 31,614,421 1,780,524 222,256 1,556,309
Net realised gain/(loss) on investments 28,055,318 26,420,470 (294,128) 246,121 3,553,786
Net realised gain/(loss) on financial derivative investments (57,154,970) (11,788,354) 1,039,011 - (147,539)
Net realised gain/(loss) on foreign exchange 45,884,696 5,019,933 1,470,321 (16) 46,581
Net realised gains/(losses) for the period 16,785,044 19,652,049 2,215,204 246,105 3,452,828
Change in net unrealised gain/(loss) on investments (887,890,720) (161,017,875) (13,748,925) (1,190,918) (4,718,541)
Change in net unrealised gain/(loss) on financial derivative investments (141,343,944) (8,390,549) (2,575,397) 123 35,329
Change in net unrealised gain/(loss) on foreign exchange (602,887) (3,468) 9,560 (12,929) (63,276)
Change in net unrealised gains/(losses) for the period (1,029,837,551) (169,411,892) (16,314,762) (1,203,724) (4,746,488)
Results of operations (805,598,430) (118,145,422) (12,319,034) (735,363) 262,649
Proceeds from shares issued 5,002,669,707 463,047,260 81,239,242 64,020,483 137,845,174
Payments for shares redeemed (1,967,603,879) (349,017,283) (17,963,241) (14,785,063) (91,171,459)
Equalisation 39,095,242 (523,062) (599,426) 870,377 2,779
Distributions 15 (313,832,345) (45,625,782) (3,149,831) (503,456) -
Net asset value at the end of the period 10,115,476,971 1,028,249,230 121,834,027 63,195,936 46,939,143
* Intragroup transactions are eliminated from consolidated figures.
The accompanying notes form an integral part of these consolidated financial statements.

Ashmore SICAV – Unaudited Semi-Annual Report for the period ended 30 June 2013
14
Consolidated Statement of Operations and Changes in Net Assets (continued) For the period ended 30 June 2013
Local Currency Fund
Emerging Markets Local Currency
Bond Fund
Emerging Markets Local Markets
Currency Fund
Emerging Markets Investment Grade
Local Currency Fund
Emerging Markets Inflation Linked
Bond Fund Note US$ US$ US$ US$ US$
Net asset value at the beginning of the period 1,311,442,759 2,737,451,531 14,185,864 319,134,019 54,999,456
Income
Net interest on investments 19,643,569 75,607,537 86,158 8,436,861 977,379
Net bank interest 393,820 65,044 3,415 10,695 25,190
Net dividends 86,715 27,702 1,118 2,788 -
Other income 94,533 - 10,065 465,607 -
Total income 20,218,637 75,700,283 100,756 8,915,951 1,002,569
Expenses
Management fees 3 (7,601,957) (13,307,283) (56,302) (1,479,689) (238,510)
Custodian fees 4 (120,425) (299,118) (665) (26,151) (2,801)
Interest expense on repurchase agreements - (24,729) - - -
Management Company fees 5 (183,345) (429,914) (1,531) (48,975) (8,522)
Subscription tax 7 (108,358) (150,554) (596) (16,586) (3,160)
Transaction fees 8 (6,419) (11,576) (1,992) (3,614) (81)
Other operating expenses 6 (490,352) (967,741) (13,350) (111,106) (29,712)
Total expenses (8,510,856) (15,190,915) (74,436) (1,686,121) (282,786)
Net investment income/(loss) 11,707,781 60,509,368 26,320 7,229,830 719,783
Net realised gain/(loss) on investments (5,712,971) (5,612,435) (9,289) (3,294,712) 44,755 Net realised gain/(loss) on financial derivative investments (47,568,636) 8,768,287 89,194 3,708,412 741,232
Net realised gain/(loss) on foreign exchange 7,273,934 (871,098) (1,658) 112,610 15,123
Net realised gains/(losses) for the period (46,007,673) 2,284,754 78,247 526,310 801,110
Change in net unrealised gain/(loss) on investments (41,756,888) (315,572,600) (58,779) (36,655,867) (7,727,128)
Change in net unrealised gain/(loss) on financial derivative investments (51,808,140) (28,000,101) (437,090) (5,349,275) (182,858)
Change in net unrealised gain/(loss) on foreign exchange 1,145,066 (1,435,036) 299 (79,226) (23,525) Change in net unrealised gains/(losses) for the period (92,419,962) (345,007,737) (495,570) (42,084,368) (7,933,511)
Results of operations (126,719,854) (282,213,615) (391,003) (34,328,228) (6,412,618)
Proceeds from shares issued 547,859,348 760,491,404 12,537 58,928,228 20,715,309
Payments for shares redeemed (333,103,152) (427,957,821) (6,759) (211,180) (18,440,243)
Equalisation 1,006,108 5,000,880 3 2,517,715 (163,096)
Distributions 15 (7,786,982) (79,423,068) - (15,300,518) (828,953)
Net asset value at the end of the period 1,392,698,227 2,713,349,311 13,800,642 330,740,036 49,869,855
The accompanying notes form an integral part of these consolidated financial statements.

Ashmore SICAV – Unaudited Semi-Annual Report for the period ended 30 June 2013
15
Consolidated Statement of Operations and Changes in Net Assets (continued)For the period ended 30 June 2013
Emerging Markets Total Return Fund
Emerging Markets Total Return Fund
II
Emerging Markets Investment Grade
Total Return Fund
Emerging Markets Corporate Debt
Fund
Emerging Markets Investment Grade
Corporate Debt Fund
Note US$ US$ US$ US$ US$
Net asset value at the beginning of the period 356,973,067 130,769,560 39,797,640 1,643,520,271 47,212,289
Income
Net interest on investments 9,522,510 3,644,840 885,698 91,655,180 1,808,919 Net bank interest 4,416 9,691 332 5,206 198 Net dividends 10,869 7,208 - 31,325 - Other income 105 - - 19,837 -
Total income 9,537,900 3,661,739 886,030 91,711,548 1,809,117
Expenses
Management fees 3 (1,836,484) (905,390) (179,706) (14,426,371) (412,707)
Custodian fees 4 (30,941) (13,408) (8,802) (137,405) (4,262)
Interest expense on repurchase agreements - - (13) - -
Management Company fees 5 (52,035) (22,832) (6,275) (344,473) (11,166)
Subscription tax 7 (20,151) (10,375) (2,766) (159,889) (4,178)
Transaction fees 8 (14,462) (511) (126) (57,623) (2,579)
Other operating expenses 6 (131,550) (65,234) (28,090) (844,840) (31,538)
Total expenses (2,085,623) (1,017,750) (225,778) (15,970,601) (466,430)
Net investment income/(loss) 7,452,277 2,643,989 660,252 75,740,947 1,342,687
Net realised gain/(loss) on investments 2,917,754 (1,019,981) (613,173) 414,001 1,165,595 Net realised gain/(loss) on financial derivative investments (3,808,011) 889,653 4,361 (8,603,068) (668,248) Net realised gain/(loss) on foreign exchange 523,781 8,138 542,233 31,004,877 250,620
Net realised gains/(losses) for the period (366,476) (122,190) (66,579) 22,815,810 747,967
Change in net unrealised gain/(loss) on investments (32,434,429) (13,575,361) (3,887,195) (215,400,932) (7,583,977)
Change in net unrealised gain/(loss) on financial derivative investments (5,272,376) (455,648) (1,082,674) (36,569,477) (1,053,912)
Change in net unrealised gain/(loss) on foreign exchange 384,579 (24,324) (2,983) (342,598) (3,974)
Change in net unrealised gains/(losses) for the period (37,322,226) (14,055,333) (4,972,852) (252,313,007) (8,641,863)
Results of operations (30,236,425) (11,533,534) (4,379,179) (153,756,250) (6,551,209)
Proceeds from shares issued 64,230,215 58,609,230 8,361,426 2,573,025,332 46,203,157 Payments for shares redeemed (77,427,069) - - (557,891,098) (6,985,907) Equalisation (1,288,322) 476,337 75,403 31,210,980 (144,621) Distributions 15 (7,520,038) (445,018) (142,360) (144,915,673) (1,747,534)
Net asset value at the end of the period 304,731,428 177,876,575 43,712,930 3,391,193,562 77,986,175
The accompanying notes form an integral part of these consolidated financial statements.

Ashmore SICAV – Unaudited Semi-Annual Report for the period ended 30 June 2013
16
Consolidated Statement of Operations and Changes in Net Assets (continued) For the period ended 30 June 2013
Emerging Markets Local Currency Corporate Debt
Fund
Emerging Markets Asian Corporate
Debt Fund Emerging Markets
Global Equity Fund EM Equity Select
Fund
Emerging Markets Global Small-Cap
Equity Fund Note US$ US$ US$ US$ US$
Net asset value at the beginning of the period 128,864,519 20,208,620 44,984,667 30,533,602 106,194,116
Income
Net interest on investments 4,833,589 628,953 - 348 -
Net bank interest 2,698 98 - 1,162 -
Net dividends 7,520 - 438,112 97,281 1,107,601
Other income - - - - -
Total income 4,843,807 629,051 438,112 98,791 1,107,601 Expenses Management fees 3 (989,159) (113,164) (203,004) (142,476) (842,768)
Custodian fees 4 (10,345) (1,567) 8,878 917 (8,092)
Management Company fees 5 (21,935) (3,203) (6,288) (4,538) (16,699)
Subscription tax 7 (8,345) (1,286) (2,112) (304) (6,750)
Transaction fees 8 (6,474) - (94,885) (58,508) (369,181)
Other operating expenses 6 (86,723) (13,905) (30,401) (10,979) (73,523)
Total expenses (1,122,981) (133,125) (327,812) (215,888) (1,317,013) Net investment income/(loss) 3,720,826 495,926 110,300 (117,097) (209,412) Net realised gain/(loss) on investments (1,280,423) 99,358 1,281,677 905,983 6,096,196
Net realised gain/(loss) on financial derivative investments 882,326 (1,834) (108,511) (555,753) (28,660)
Net realised gain/(loss) on foreign exchange 546,572 538 14,744 (37,765) 10,428
Net realised gains/(losses) for the period 148,475 98,062 1,187,910 312,465 6,077,964 Change in net unrealised gain/(loss) on investments (14,515,766) (1,208,884) (6,254,137) (3,308,491) (11,007,584)
Change in net unrealised gain/(loss) on financial derivative investments 49,767 - (86,425) (136,839) (27,256)
Change in net unrealised gain/(loss) on foreign exchange (174,621) (346) 120,535 (50,174) (77,863)
Change in net unrealised gains/(losses) for the period (14,640,620) (1,209,230) (6,220,027) (3,495,504) (11,112,703) Results of operations (10,771,319) (615,242) (4,921,817) (3,300,136) (5,244,151) Proceeds from shares issued 64,684,034 8,308,212 11,295,233 20,000,000 47,228,496
Payments for shares redeemed (10,753,122) - (14,312,161) (18,416,503) (30,341,269)
Equalisation 671,421 33,772 (50,269) - (1,737)
Distributions 15 (5,519,570) (541,983) (228,263) - (153,316)
Net asset value at the end of the period 167,175,963 27,393,379 36,767,390 28,816,963 117,682,139
The accompanying notes form an integral part of these consolidated financial statements.

Ashmore SICAV – Unaudited Semi-Annual Report for the period ended 30 June 2013
17
Consolidated Statement of Operations and Changes in Net Assets (continued)
For the period ended 30 June 2013
Emerging Markets Frontier Equity
Fund Brazil Equity Fund Note US$ US$
Net asset value at the beginning of the period 11,226,200 -
Income Net bank interest - 9
Net dividends 513,411 42,278
Total income 513,411 42,287
Expenses Management fees 3 (107,760) (29,859)
Custodian fees 4 (701) (217)
Management Company fees 5 (2,208) (921)
Subscription tax 7 (813) (302)
Transaction fees 8 (109,045) (5,605)
Other operating expenses 6 (14,752) (36,725)
Total expenses (235,279) (73,629)
Net investment income/(loss) 278,132 (31,342)
Net realised gain/(loss) on investments 1,334,213 1,497,217
Net realised gain/(loss) on financial derivative investments 1,168 -
Net realised gain/(loss) on foreign exchange (36,210) (8,990)
Net realised gains/(losses) for the period 1,299,171 1,488,227
Change in net unrealised gain/(loss) on investments 1,312,487 (1,104,631)
Change in net unrealised gain/(loss) on financial derivative investments (1,146) -
Change in net unrealised gain/(loss) on foreign exchange 42,949 (11,532)
Change in net unrealised gains/(losses) for the period 1,354,290 (1,116,163)
Results of operations 2,931,593 340,722
Proceeds from shares issued 2,085,943 3,445,563
Payments for shares redeemed - (93,059)
Net asset value at the end of the period 16,243,736 3,693,226
The accompanying notes form an integral part of these consolidated financial statements.

Ashmore SICAV – Unaudited Semi-Annual Report for the period ended 30 June 2013
18
Fund Statistics As at 30 June 2013 Net Assets
Emerging Markets
Debt Fund Emerging Markets
Sovereign Debt Fund
Emerging Markets Sovereign Investment
Grade Debt Fund Turkish Debt Fund Local Currency Fund
Emerging Markets Local Currency Bond
Fund
Emerging Markets Local Markets
Currency Fund Net assests (US$) At 30 June 2013 1,028,249,230 121,834,027 63,195,936 46,939,143 1,392,698,227 2,713,349,311 13,800,642 At 31 December 2012 1,078,513,519 74,626,317 14,328,958 - 1,311,442,759 2,737,451,531 14,185,864 At 31 December 2011 1,039,143,043 106,094,320 9,994,951 - 488,548,920 1,224,098,446 12,996,559 At 31 December 2010 1,284,841,665 160,492,572 6,984,380 - 617,505,009 462,314,611 5,795,751 Retail Class Shares (EUR) Income
At 30 June 2013 143.98 - - - 99.01 94.95 - At 31 December 2012 168.23 - - - 103.65 106.83 - At 31 December 2011 160.44 - - - 93.14 91.43 - At 31 December 2010 161.01 - - - 98.62 - - Retail Class Shares (US$) Income
At 30 June 2013 93.87 - - - 109.95 92.51 - At 31 December 2012 109.13 - - - 114.69 105.49 - At 31 December 2011 94.03 - - - 102.71 91.65 - At 31 December 2010 94.07 - - - 108.83 - - Retail Class Shares (GBP) Income
At 30 June 2013 110.86 104.34 - - 106.35 94.00 97.19
At 31 December 2012 125.32 119.20 - - 110.46 105.38 100.01
At 31 December 2011 106.30 101.74 - - 98.76 91.68 - At 31 December 2010 109.85 - - - 104.40 - - Retail Class Shares (NOK) Income
At 30 June 2013 104.74 - - - - - - At 31 December 2012 120.13 - - - - - - At 31 December 2011 108.47 - - - - - - At 31 December 2010 105.56 - - - - - -
Retail Class Shares (CHF) Income
At 30 June 2013 - - - - 98.49 - - At 31 December 2012 - - - - 103.31 - - 1 launched on 14 January 2013 6 launched on 8 Febuary 2013 11 launched on 19 Febuary 2013 16 launched on 2 April 2013 21 launched on 26 April 2013 26 terminated on 4 June 2013 2 launched on 15 January 2013 7 launched on 12 Febuary 2013 12 launched on 28 Febuary 2013 17 launched on 4 April 2013 22 launched on 7 May 2013 27 launched on 13 June 2013 3 launched on 16 January 2013 8 launched on 13 Febuary 2013 13 launched on 12 March 2013 18 launched on 5 April 2013 23 launched on 17 May 2013 28 launched on 20 June 2013 4 launched on 30 January 2013 9 launched on 14 Febuary 2013 14 launched on 18 March 2013 19 launched on 11 April 2013 24 terminated on 24 May 2013 29 terminated on 26 June 2013 5 launched on 1 Febuary 2013 10 launched on 18 Febuary 2013 15 launched on 25 March 2013 20 launched on 16 April 2013 25 launched on 4 June 2013 30 launched on 26 June 2013

Ashmore SICAV – Unaudited Semi-Annual Report for the period ended 30 June 2013
19
Fund Statistics As at 30 June 2013
Net Assets (continued)
Emerging Markets
Debt Fund Emerging Markets
Sovereign Debt Fund
Emerging Markets Sovereign Investment
Grade Debt Fund Turkish Debt Fund Local Currency Fund
Emerging Markets Local Currency Bond
Fund
Emerging Markets Local Markets
Currency Fund Retail Class Shares (AUD) Income
At 30 June 2013 100.51 - - - - - - At 31 December 2012 103.38 - - - - - - Institutional Class Shares (EUR) Income
At 30 June 2013 - - - - - 100.06 - At 31 December 2012 - - - - - 114.22 - At 31 December 2011 120.34 - - - 95.63 98.60 - At 31 December 2010 174.60 - - - 102.74 101.47 - Institutional Class Shares (EUR) Income*
At 30 June 2013 34.26 - - - 96.23 - - At 31 December 2012 37.99 - - - 101.52 - -
At 31 December 2011 102.82 - - - 95.07 - - Institutional Class Shares (US$) Income
At 30 June 2013 - 105.33 108.70 - - 109.67 101.59
At 31 December 2012 - 122.40 125.18 - - 123.13 104.38
At 31 December 2011 175.42 112.46 111.26 - 80.62 108.13 96.78
At 31 December 2010 178.19 105.74 106.38 - 85.40 111.78 104.26 Institutional Class Shares (US$) Income*
At 30 June 2013 106.86 - - - 96.64 - - At 31 December 2012 121.57 - - - 100.27 - -
At 31 December 2011 100.94 - - - 94.17 - - Institutional Class Shares (GBP) Income
At 30 June 2013 - 95.69 - - - 105.38 - At 31 December 2012 - 110.37 - - - 118.73 - At 31 December 2011 - - - - 92.57 100.99 - At 31 December 2010 - - - - 98.23 - - As per the Company’s revised prospectus dated October 2012, all active Institutional II share classes were renamed to Institutional share classes.
1 launched on 14 January 2013 6 launched on 8 Febuary 2013 11 launched on 19 Febuary 2013 16 launched on 2 April 2013 21 launched on 26 April 2013 26 terminated on 4 June 2013 2 launched on 15 January 2013 7 launched on 12 Febuary 2013 12 launched on 28 Febuary 2013 17 launched on 4 April 2013 22 launched on 7 May 2013 27 launched on 13 June 2013 3 launched on 16 January 2013 8 launched on 13 Febuary 2013 13 launched on 12 March 2013 18 launched on 5 April 2013 23 launched on 17 May 2013 28 launched on 20 June 2013 4 launched on 30 January 2013 9 launched on 14 Febuary 2013 14 launched on 18 March 2013 19 launched on 11 April 2013 24 terminated on 24 May 2013 29 terminated on 26 June 2013 5 launched on 1 Febuary 2013 10 launched on 18 Febuary 2013 15 launched on 25 March 2013 20 launched on 16 April 2013 25 launched on 4 June 2013 30 launched on 26 June 2013

Ashmore SICAV – Unaudited Semi-Annual Report for the period ended 30 June 2013
20
Fund Statistics As at 30 June 2013
Net Assets (continued)
Emerging Markets
Debt Fund Emerging Markets
Sovereign Debt Fund
Emerging Markets Sovereign Investment
Grade Debt Fund Turkish Debt Fund Local Currency Fund
Emerging Markets Local Currency Bond
Fund
Emerging Markets Local Markets
Currency Fund Institutional Class Shares (GBP) Income*
At 30 June 2013 106.15 - - - 97.32 - - At 31 December 2012 124.12 - - - 101.21 - -
At 31 December 2011 101.01 - - - 90.09 - - Institutional Class Shares (NOK) Income
At 30 June 2013 - - - - - - - At 31 December 2012 - - - - - - - At 31 December 2011 - - - - - - - At 31 December 2010 100.28 - - - - - - Institutional Class Shares (NOK) Income*
At 30 June 2013 108.14 - - - - - - At 31 December 2012 124.03 - - - - - -
At 31 December 2011 103.78 - - - - - - Institutional Class Shares (CHF) Income
At 30 June 2013 - - - - - - - At 31 December 2012 - - - - - 104.40 -
At 31 December 2011 - - - - - 91.66 - Institutional Class Shares (CHF) Income*
At 30 June 2013 100.75 - - - 93.68 - - At 31 December 2012 114.92 - - - 98.33 - -
At 31 December 2011 - - - - 89.56 - -
Institutional Class Shares (US$) Accumulation
At 30 June 2013 92.1117 - - 91.8510 96.5317 90.307 - Institutional II Class Shares (JPY) Income
At 30 June 2013 - 9,139.2019 - - - - - As per the Company’s revised prospectus dated October 2012, all active Institutional II share classes were renamed to Institutional share classes.
1 launched on 14 January 2013 6 launched on 8 Febuary 2013 11 launched on 19 Febuary 2013 16 launched on 2 April 2013 21 launched on 26 April 2013 26 terminated on 4 June 2013 2 launched on 15 January 2013 7 launched on 12 Febuary 2013 12 launched on 28 Febuary 2013 17 launched on 4 April 2013 22 launched on 7 May 2013 27 launched on 13 June 2013 3 launched on 16 January 2013 8 launched on 13 Febuary 2013 13 launched on 12 March 2013 18 launched on 5 April 2013 23 launched on 17 May 2013 28 launched on 20 June 2013 4 launched on 30 January 2013 9 launched on 14 Febuary 2013 14 launched on 18 March 2013 19 launched on 11 April 2013 24 terminated on 24 May 2013 29 terminated on 26 June 2013 5 launched on 1 Febuary 2013 10 launched on 18 Febuary 2013 15 launched on 25 March 2013 20 launched on 16 April 2013 25 launched on 4 June 2013 30 launched on 26 June 2013

Ashmore SICAV – Unaudited Semi-Annual Report for the period ended 30 June 2013
21
Fund Statistics As at 30 June 2013
Net Assets (continued)
Emerging Markets
Debt Fund Emerging Markets
Sovereign Debt Fund
Emerging Markets Sovereign Investment
Grade Debt Fund Turkish Debt Fund Local Currency Fund
Emerging Markets Local Currency Bond
Fund
Emerging Markets Local Markets
Currency Fund Z Class Shares (US$) Income
At 30 June 2013 92.6211 - - - - - -
Z Class Shares (GBP) Income
At 30 June 2013 92.546 - - - - 91.0512 -
Z Class Shares (EUR) Accumulation
At 30 June 2013 - - - - 96.1314 - -
Z Class Shares (US$) Accumulation
At 30 June 2013 - - - - 95.9913 90.9512 -
Z Class Shares (GBP) Accumulation
At 30 June 2013 - - - - 95.9913 - -
Emerging Markets Investment Grade
Local Currency Fund
Emerging Markets Inflation Linked
Bond Fund Emerging Markets Total Return Fund
Emerging Markets Total Return Fund II
Emerging Markets Investment Grade
Total Return Fund Emerging Markets
Corporate Debt Fund
Emerging Markets Investment Grade
Corporate Debt Fund Net assests (US$)
At 30 June 2013 330,740,036 49,869,855 304,731,428 177,876,575 43,712,930 3,391,193,562 77,986,175 At 31 December 2012 319,134,019 54,999,456 356,973,067 130,769,560 39,797,640 1,643,520,271 47,212,289 At 31 December 2011 222,608,444 8,695,541 132,533,108 - - 916,360,353 13,564,582 At 31 December 2010 - - - - - 412,870,970 13,325,549 Retail Class Shares (EUR) Income
At 30 June 2013 - - - - - 96.15 -
At 31 December 2012 - - - - - 104.83 -
At 31 December 2011 - - - - - 93.17 - Retail Class Shares (US$) Income
At 30 June 2013 - 86.978 92.894 - - 96.28 -
At 31 December 2012 - - - - - 104.64 - At 31 December 2011 - - - - - 95.51 - At 31 December 2010 - - - - - 101.16 - 1 launched on 14 January 2013 6 launched on 8 Febuary 2013 11 launched on 19 Febuary 2013 16 launched on 2 April 2013 21 launched on 26 April 2013 26 terminated on 4 June 2013 2 launched on 15 January 2013 7 launched on 12 Febuary 2013 12 launched on 28 Febuary 2013 17 launched on 4 April 2013 22 launched on 7 May 2013 27 launched on 13 June 2013 3 launched on 16 January 2013 8 launched on 13 Febuary 2013 13 launched on 12 March 2013 18 launched on 5 April 2013 23 launched on 17 May 2013 28 launched on 20 June 2013 4 launched on 30 January 2013 9 launched on 14 Febuary 2013 14 launched on 18 March 2013 19 launched on 11 April 2013 24 terminated on 24 May 2013 29 terminated on 26 June 2013 5 launched on 1 Febuary 2013 10 launched on 18 Febuary 2013 15 launched on 25 March 2013 20 launched on 16 April 2013 25 launched on 4 June 2013 30 launched on 26 June 2013

Ashmore SICAV – Unaudited Semi-Annual Report for the period ended 30 June 2013
22
Fund Statistics As at 30 June 2013
Net Assets (continued)
Emerging Markets Investment Grade
Local Currency Fund
Emerging Markets Inflation Linked
Bond Fund Emerging Markets Total Return Fund
Emerging Markets Total Return Fund II
Emerging Markets Investment Grade
Total Return Fund Emerging Markets
Corporate Debt Fund
Emerging Markets Investment Grade
Corporate Debt Fund Retail Class Shares (GBP) Income
At 30 June 2013 - - 102.33 - - 100.55 -
At 31 December 2012 - - 110.43 - - 107.51 -
At 31 December 2011 - - - - - 90.52 - Retail Class Shares (CHF) Income
At 30 June 2013 - - - - - 96.98 -
At 31 December 2012 - - - - - 102.75 -
At 31 December 2011 - - - - - 92.89 -
Retail Class Shares (EUR) Accumulation
At 30 June 2013 - - - - - 95.441 -
Retail Class Shares (US$) Accumulation
At 30 June 2013 - - - - - 95.511 -
Retail Class Shares (CHF) Accumulation
At 30 June 2013 - - - - - 95.353 - Institutional Class Shares (EUR) Income
At 30 June 2013 90.78 - - - 92.49 112.68 93.605
At 31 December 2012 100.11 - - - 100.53 102.08 -
At 31 December 2011 - - - - - 100.46 -
At 31 December 2010 - - - - - 105.77 - Institutional Class Shares (US$) Income
At 30 June 2013 90.04 95.02 99.77 94.87 93.50 110.57 114.36
At 31 December 2012 103.19 108.90 109.03 100.95 102.43 122.14 125.50
At 31 December 2011 88.90 88.28 90.91 - - 103.90 107.89
At 31 December 2010 - - - - - 110.65 107.72
1 launched on 14 January 2013 6 launched on 8 Febuary 2013 11 launched on 19 Febuary 2013 16 launched on 2 April 2013 21 launched on 26 April 2013 26 terminated on 4 June 2013 2 launched on 15 January 2013 7 launched on 12 Febuary 2013 12 launched on 28 Febuary 2013 17 launched on 4 April 2013 22 launched on 7 May 2013 27 launched on 13 June 2013 3 launched on 16 January 2013 8 launched on 13 Febuary 2013 13 launched on 12 March 2013 18 launched on 5 April 2013 23 launched on 17 May 2013 28 launched on 20 June 2013 4 launched on 30 January 2013 9 launched on 14 Febuary 2013 14 launched on 18 March 2013 19 launched on 11 April 2013 24 terminated on 24 May 2013 29 terminated on 26 June 2013 5 launched on 1 Febuary 2013 10 launched on 18 Febuary 2013 15 launched on 25 March 2013 20 launched on 16 April 2013 25 launched on 4 June 2013 30 launched on 26 June 2013

Ashmore SICAV – Unaudited Semi-Annual Report for the period ended 30 June 2013
23
Fund Statistics As at 30 June 2013
Net Assets (continued)
Emerging Markets Investment Grade
Local Currency Fund
Emerging Markets Inflation Linked
Bond Fund Emerging Markets Total Return Fund
Emerging Markets Total Return Fund II
Emerging Markets Investment Grade
Total Return Fund Emerging Markets
Corporate Debt Fund
Emerging Markets Investment Grade
Corporate Debt Fund Institutional Class Shares (GBP) Income At 30 June 2013 - - 110.65 - - 96.64 -
At 31 December 2012 - - 120.35 - - 101.62 - At 31 December 2011 - - 100.32 - - - - Institutional Class Shares (NOK) Income At 30 June 2013 - - - - 93.82 - At 31 December 2012 - - - - - 113.91 - At 31 December 2011 - - - - - 97.09 - At 31 December 2010 - - - - - 101.01 - Institutional Class Shares (CHF) Income At 30 June 2013 - - - - - 96.67 - At 31 December 2012 - - - - - 102.07 - Institutional Class Shares (AUD) Income At 30 June 2013 - - - - - 96.0825 - Institutional Class Shares (EUR) Accumulation At 30 June 2013 - - - - - 95.641 - Institutional Class Shares (US$) Accumulation At 30 June 2013 - 87.2417 92.5423 - - 95.762 - Institutional Class Shares (GBP) Accumulation At 30 June 2013 - - 94.1515 - - - - Institutional Class Shares (CHF) Accumulation At 30 June 2013 - - - - - 95.701 - Institutional Class Shares (MXN) Accumulation At 30 June 2013 - - - - - 942.7422 - Institutional Class Shares (CAD) Accumulation At 30 June 2013 - - - - - 93.9722 -
1 launched on 14 January 2013 6 launched on 8 Febuary 2013 11 launched on 19 Febuary 2013 16 launched on 2 April 2013 21 launched on 26 April 2013 26 terminated on 4 June 2013 2 launched on 15 January 2013 7 launched on 12 Febuary 2013 12 launched on 28 Febuary 2013 17 launched on 4 April 2013 22 launched on 7 May 2013 27 launched on 13 June 2013 3 launched on 16 January 2013 8 launched on 13 Febuary 2013 13 launched on 12 March 2013 18 launched on 5 April 2013 23 launched on 17 May 2013 28 launched on 20 June 2013 4 launched on 30 January 2013 9 launched on 14 Febuary 2013 14 launched on 18 March 2013 19 launched on 11 April 2013 24 terminated on 24 May 2013 29 terminated on 26 June 2013 5 launched on 1 Febuary 2013 10 launched on 18 Febuary 2013 15 launched on 25 March 2013 20 launched on 16 April 2013 25 launched on 4 June 2013 30 launched on 26 June 2013

Ashmore SICAV – Unaudited Semi-Annual Report for the period ended 30 June 2013
24
Fund Statistics As at 30 June 2013
Net Assets (continued)
Emerging Markets Investment Grade
Local Currency Fund
Emerging Markets Inflation Linked
Bond Fund Emerging Markets Total Return Fund
Emerging Markets Total Return Fund II
Emerging Markets Investment Grade
Total Return Fund Emerging Markets
Corporate Debt Fund
Emerging Markets Investment Grade
Corporate Debt Fund
Institutional Class Shares II (JPY) Income
At 30 June 2013 - - - - - 9,443.6816 -
Z Class Shares (US$) Income
At 30 June 2013 - - - - - 100.5228 -
Z Class Shares (GBP) Income
At 30 June 2013 - - - - - 98.9530 93.0720
Emerging Markets Local Currency
Corporate Debt Fund
Emerging Markets Asian Corporate Debt
Fund Emerging Markets
Global Equity Fund EM Equity Select
Fund
Emerging Markets Global Small-Cap
Equity Fund Emerging Markets
Frontier Equity Fund Brazil Equity Fund Net assests (US$) At 30 June 2013 167,175,963 27,393,379 36,767,390 28,816,963 117,682,139 16,243,736 3,693,226 At 31 December 2012 128,864,519 20,208,620 44,984,667 30,533,602 106,194,116 11,226,200 - At 31 December 2011 60,518,364 - 21,011,479 47,069,970 16,386,333 - - At 31 December 2010 - - 103,537,460 - - - Retail Class Shares (EUR) Income
At 30 June 2013 95.06 - - - 96.66 - - At 31 December 2012 100.87 - 99.54 - 100.36 - - Retail Class Shares (US$) Income
At 30 June 2013 92.729 - 105.37 - 121.38 - - At 31 December 2012 - - 119.37 - 125.82 - -
At 31 December 2011 - - 103.12 - 102.67 - - Retail Class Shares (GBP) Income
At 30 June 2013 105.05 - 87.50 - 98.33 97.2627 - At 31 December 2012 112.69 - 98.78 - 101.69 - - At 31 December 2011 96.25 - - - - - - At 31 December 2010 - - - - - - -
1 launched on 14 January 2013 6 launched on 8 Febuary 2013 11 launched on 19 Febuary 2013 16 launched on 2 April 2013 21 launched on 26 April 2013 26 terminated on 4 June 2013 2 launched on 15 January 2013 7 launched on 12 Febuary 2013 12 launched on 28 Febuary 2013 17 launched on 4 April 2013 22 launched on 7 May 2013 27 launched on 13 June 2013 3 launched on 16 January 2013 8 launched on 13 Febuary 2013 13 launched on 12 March 2013 18 launched on 5 April 2013 23 launched on 17 May 2013 28 launched on 20 June 2013 4 launched on 30 January 2013 9 launched on 14 Febuary 2013 14 launched on 18 March 2013 19 launched on 11 April 2013 24 terminated on 24 May 2013 29 terminated on 26 June 2013 5 launched on 1 Febuary 2013 10 launched on 18 Febuary 2013 15 launched on 25 March 2013 20 launched on 16 April 2013 25 launched on 4 June 2013 30 launched on 26 June 2013

Ashmore SICAV – Unaudited Semi-Annual Report for the period ended 30 June 2013
25
Fund Statistics As at 30 June 2013
Net Assets (continued)
Emerging Markets Local Currency
Corporate Debt Fund
Emerging Markets Asian Corporate Debt
Fund Emerging Markets
Global Equity Fund EM Equity Select
Fund
Emerging Markets Global Small-Cap
Equity Fund Emerging Markets
Frontier Equity Fund Brazil Equity Fund Retail Class Shares (CHF) Income
At 30 June 2013 94.36 - - - 97.76 - - At 31 December 2012 100.09 - - - 101.44 - -
Retail Class Shares (US$) Accumulation
At 30 June 2013 - - - - - - -
Retail Class Shares (GBP) Accumulation
At 30 June 2013 - - - 85.76 - - -
At 31 December 2012 - - - 94.07 - - - At 31 December 2011 - - - 79.08 - - - At 31 December 2010 - - - 101.33 - - - Institutional Class Shares (US$) Income At 30 June 2013 93.44 97.23 110.11 - 123.51 138.66 - At 31 December 2012 102.67 101.04 125.08 - 127.91 112.26 - At 31 December 2011 87.75 - 107.48 - 103.86 - - Institutional Class Shares (CHF) Income
At 30 June 2013 - 86.97 - - - - At 31 December 2012 - - 98.98 - - - -
Institutional Class Shares (EUR) Accumulation
At 30 June 2013 93.2515 - - - - - -
Institutional Class Shares (US$) Accumulation
At 30 June 2013 93.2918 - - 111.01 - - 162.1510
At 31 December 2012 - - - 121.72 - - - At 31 December 2011 - - - 101.50 - - - At 31 December 2010 - - - 127.93 - - -
Institutional Class Shares (CHF) Accumulation
At 30 June 2013 92.9114 - - - - - - 1 launched on 14 January 2013 6 launched on 8 Febuary 2013 11 launched on 19 Febuary 2013 16 launched on 2 April 2013 21 launched on 26 April 2013 26 terminated on 4 June 2013 2 launched on 15 January 2013 7 launched on 12 Febuary 2013 12 launched on 28 Febuary 2013 17 launched on 4 April 2013 22 launched on 7 May 2013 27 launched on 13 June 2013 3 launched on 16 January 2013 8 launched on 13 Febuary 2013 13 launched on 12 March 2013 18 launched on 5 April 2013 23 launched on 17 May 2013 28 launched on 20 June 2013 4 launched on 30 January 2013 9 launched on 14 Febuary 2013 14 launched on 18 March 2013 19 launched on 11 April 2013 24 terminated on 24 May 2013 29 terminated on 26 June 2013 5 launched on 1 Febuary 2013 10 launched on 18 Febuary 2013 15 launched on 25 March 2013 20 launched on 16 April 2013 25 launched on 4 June 2013 30 launched on 26 June 2013

Ashmore SICAV – Unaudited Semi-Annual Report for the period ended 30 June 2013
26
Fund Statistics (continued) As at 30 June 2013 Share transactions (in number of shares)
Emerging Markets
Debt Fund Emerging Markets
Sovereign Debt Fund
Emerging Markets Sovereign Investment
Grade Debt Fund Turkish Debt Fund Local Currency Fund
Emerging Markets Local Currency Bond
Fund
Emerging Markets Local Markets
Currency Fund Retail Class Shares (EUR) Income
At 30 June 2013 64,449 - - - 501,745 2,495 -
Subscriptions 14,169 - - - 142,668 10,449 -
Redemptions (20,175) - - - (128,009) (26,648) -
At 31 December 2012 70,455 - - - 487,086 18,694 - Retail Class Shares (US$) Income
At 30 June 2013 194,730 - - - 521,672 7,265 -
Subscriptions 106,072 - - - 209,843 954 -
Redemptions (90,098) - - - (86,552) (673) -
At 31 December 2012 178,756 - - - 398,381 6,984 - Retail Class Shares (GBP) Income
At 30 June 2013 8,931 297 - - 69,423 3,625 1,076
Subscriptions 6,659 11 - - 18,289 1,023 79
Redemptions (7,003) - - - (10,713) (740) (45)
At 31 December 2012 9,275 286 - - 61,847 3,342 1,042 Retail Class Shares (NOK) Income
At 30 June 2013 166,108 - - - - - -
Subscriptions 72,570 - - - - - -
Redemptions (45,582) - - - - - -
At 31 December 2012 139,120 - - - - - - Retail Class Shares (CHF) Income
At 30 June 2013 - - - - 242,815 - -
Subscriptions - - - - 46,104 - -
Redemptions - - - - (33,031) - -
At 31 December 2012 - - - - 229,742 - -
1 launched on 14 January 2013 6 launched on 8 Febuary 2013 11 launched on 19 Febuary 2013 16 launched on 2 April 2013 21 launched on 26 April 2013 26 terminated on 4 June 2013 2 launched on 15 January 2013 7 launched on 12 Febuary 2013 12 launched on 28 Febuary 2013 17 launched on 4 April 2013 22 launched on 7 May 2013 27 launched on 13 June 2013 3 launched on 16 January 2013 8 launched on 13 Febuary 2013 13 launched on 12 March 2013 18 launched on 5 April 2013 23 launched on 17 May 2013 28 launched on 20 June 2013 4 launched on 30 January 2013 9 launched on 14 Febuary 2013 14 launched on 18 March 2013 19 launched on 11 April 2013 24 terminated on 24 May 2013 29 terminated on 26 June 2013 5 launched on 1 Febuary 2013 10 launched on 18 Febuary 2013 15 launched on 25 March 2013 20 launched on 16 April 2013 25 launched on 4 June 2013 30 launched on 26 June 2013

Ashmore SICAV – Unaudited Semi-Annual Report for the period ended 30 June 2013
27
Fund Statistics (continued) As at 30 June 2013 Share transactions (in number of shares) (continued)
Emerging Markets
Debt Fund Emerging Markets
Sovereign Debt Fund
Emerging Markets Sovereign Investment
Grade Debt Fund Turkish Debt Fund Local Currency Fund
Emerging Markets Local Currency Bond
Fund
Emerging Markets Local Markets
Currency Fund Retail Class Shares (AUD) Income
At 30 June 2013 5 - - - - - -
Subscriptions 5 - - - - - -
Redemptions (870) - - - - - -
At 31 December 2012 870 - - - - - - Institutional Class Shares (EUR) Income
At 30 June 2013 - - - - - 382,095 -
Subscriptions - - - - - 76,351 -
Redemptions - - - - - (4,320) -
At 31 December 2012 - - - - - 310,064 - Institutional Class Shares (EUR) Income*
At 30 June 2013 2,778,976 - - - 140,341 - -
Subscriptions 1,493,597 - - - 106,797 - -
Redemptions (389,199) - - - (110,867) - -
At 31 December 2012 1,674,578 - - - 144,411 - - Institutional Class Shares (US$) Income
At 30 June 2013 - 606,880 581,386 - - 18,552,863 134,285
Subscriptions - 194,891 603,133 - - 3,353,038 -
Redemptions - (159,356) (136,217) - - (2,870,197) -
At 31 December 2012 - 571,345 114,470 - - 18,070,022 134,285 Institutional Class Shares (US$) Income*
At 30 June 2013 4,475,796 - - - 1,781,572 - -
Subscriptions 1,718,528 - - - 2,083,067 - -
Redemptions (2,641,851) - - - (1,505,426) - -
At 31 December 2012 5,399,119 - - - 1,203,931 - -
As per the Company’s revised prospectus dated October 2012, all active Institutional II share classes (other than JPY Institutional II share classes launched in 2013) were renamed to Institutional share classes.
1 launched on 14 January 2013 6 launched on 8 Febuary 2013 11 launched on 19 Febuary 2013 16 launched on 2 April 2013 21 launched on 26 April 2013 26 terminated on 4 June 2013 2 launched on 15 January 2013 7 launched on 12 Febuary 2013 12 launched on 28 Febuary 2013 17 launched on 4 April 2013 22 launched on 7 May 2013 27 launched on 13 June 2013 3 launched on 16 January 2013 8 launched on 13 Febuary 2013 13 launched on 12 March 2013 18 launched on 5 April 2013 23 launched on 17 May 2013 28 launched on 20 June 2013 4 launched on 30 January 2013 9 launched on 14 Febuary 2013 14 launched on 18 March 2013 19 launched on 11 April 2013 24 terminated on 24 May 2013 29 terminated on 26 June 2013 5 launched on 1 Febuary 2013 10 launched on 18 Febuary 2013 15 launched on 25 March 2013 20 launched on 16 April 2013 25 launched on 4 June 2013 30 launched on 26 June 2013

Ashmore SICAV – Unaudited Semi-Annual Report for the period ended 30 June 2013
28
Fund Statistics (continued) As at 30 June 2013
Share transactions (in number of shares) (continued)
Emerging Markets
Debt Fund Emerging Markets
Sovereign Debt Fund
Emerging Markets Sovereign Investment
Grade Debt Fund Turkish Debt Fund Local Currency Fund
Emerging Markets Local Currency Bond
Fund
Emerging Markets Local Markets
Currency Fund Institutional Class Shares (GBP) Income At 30 June 2013 - 27,849 - - - 2,166,496 - Subscriptions - 2,006 - - - 171,626 -
Redemptions - - - - - (382,595) -
At 31 December 2012 - 25,843 - - - 2,377,465 - Institutional Class Shares (GBP) Income* At 30 June 2013 1,727,346 - - - 6,387,897 - - Subscriptions 375,178 - - - 1,111,984 - -
Redemptions (70,116) - - - (687,032) - -
At 31 December 2012 1,422,284 - - - 5,962,945 - - Institutional Class Shares (NOK) Income* At 30 June 2013 178,732 - - - - - - Subscriptions 41,372 - - - - - -
Redemptions (10,525) - - - - - -
At 31 December 2012 147,885 - - - - - - Institutional Class Shares (CHF) Income At 30 June 2013 - - - - - - - Subscriptions - - - - - 18,41929 -
Redemptions - - - - - (44,555) -
At 31 December 2012 - - - - - 26,136 - Institutional Class Shares (CHF) Income* At 30 June 2013 72,914 - - - 380,293 - - Subscriptions 13,064 - - - 193,768 - -
Redemptions (3,150) - - - (195,769) - - At 31 December 2012 63,000 - - - 382,294 - -
As per the Company’s revised prospectus dated October 2012, all active Institutional II share classes (other than JPY Institutional II share classes launched in 2013) were renamed to Institutional share classes.
1 launched on 14 January 2013 6 launched on 8 Febuary 2013 11 launched on 19 Febuary 2013 16 launched on 2 April 2013 21 launched on 26 April 2013 26 terminated on 4 June 2013 2 launched on 15 January 2013 7 launched on 12 Febuary 2013 12 launched on 28 Febuary 2013 17 launched on 4 April 2013 22 launched on 7 May 2013 27 launched on 13 June 2013 3 launched on 16 January 2013 8 launched on 13 Febuary 2013 13 launched on 12 March 2013 18 launched on 5 April 2013 23 launched on 17 May 2013 28 launched on 20 June 2013 4 launched on 30 January 2013 9 launched on 14 Febuary 2013 14 launched on 18 March 2013 19 launched on 11 April 2013 24 terminated on 24 May 2013 29 terminated on 26 June 2013 5 launched on 1 Febuary 2013 10 launched on 18 Febuary 2013 15 launched on 25 March 2013 20 launched on 16 April 2013 25 launched on 4 June 2013 30 launched on 26 June 2013

Ashmore SICAV – Unaudited Semi-Annual Report for the period ended 30 June 2013
29
Fund Statistics (continued) As at 30 June 2013
Share transactions (in number of shares) (continued)
Emerging Markets
Debt Fund Emerging Markets
Sovereign Debt Fund
Emerging Markets Sovereign Investment
Grade Debt Fund Turkish Debt Fund Local Currency Fund
Emerging Markets Local Currency Bond
Fund
Emerging Markets Local Markets
Currency Fund Institutional Class Shares (US$) Accumulation
At 30 June 2013 1,097,29217 - - 511,03410 605,80117 3,106,3987 -
Subscriptions 1,097,292 - - 898,619 728,913 3,277,353 -
Redemptions - - - (387,585) (123,112) (170,955) -
At 31 December 2012 - - - - - - - Institutional II Class Shares (JPY) Income
At 30 June 2013 - 585,00019 - - - - -
Subscriptions - 585,000 - - - - -
At 31 December 2012 - - - - - - -
Z Class Shares (US$) Income
At 30 June 2013 90011 - - - - - -
Subscriptions 900 - - - - - -
Redemptions - - - - - - -
At 31 December 2012 - - - - - - -
Z Class Shares (GBP) Income
At 30 June 2013 9,5016 - - - - 4,63412 -
Subscriptions 10,201 - - - - 4,634 -
Redemptions (700) - - - - - -
At 31 December 2012 - - - - - - -
Z Class Shares (EUR) Accumulation
At 30 June 2013 - - - - 2,28514 - -
Subscriptions - - - - 2,285 - -
At 31 December 2012 - - - - - - -
1 launched on 14 January 2013 6 launched on 8 Febuary 2013 11 launched on 19 Febuary 2013 16 launched on 2 April 2013 21 launched on 26 April 2013 26 terminated on 4 June 2013 2 launched on 15 January 2013 7 launched on 12 Febuary 2013 12 launched on 28 Febuary 2013 17 launched on 4 April 2013 22 launched on 7 May 2013 27 launched on 13 June 2013 3 launched on 16 January 2013 8 launched on 13 Febuary 2013 13 launched on 12 March 2013 18 launched on 5 April 2013 23 launched on 17 May 2013 28 launched on 20 June 2013 4 launched on 30 January 2013 9 launched on 14 Febuary 2013 14 launched on 18 March 2013 19 launched on 11 April 2013 24 terminated on 24 May 2013 29 terminated on 26 June 2013 5 launched on 1 Febuary 2013 10 launched on 18 Febuary 2013 15 launched on 25 March 2013 20 launched on 16 April 2013 25 launched on 4 June 2013 30 launched on 26 June 2013

Ashmore SICAV – Unaudited Semi-Annual Report for the period ended 30 June 2013
30
Fund Statistics (continued) As at 30 June 2013 Share transactions (in number of shares) (continued)
Emerging Markets Investment Grade
Local Currency Fund
Emerging Markets Inflation Linked
Bond Fund Emerging Markets Total Return Fund
Emerging Markets Total Return Fund II
Emerging Markets Investment Grade
Total Return Fund Emerging Markets
Corporate Debt Fund
Emerging Markets Investment Grade
Corporate Debt Fund Z Class Shares (US$) Accumulation
At 30 June 2013 - - - - 11,21513 42912 -
Subscriptions - - - - 11,712 429 -
Redemptions - - - - (497) - -
At 31 December 2012 - - - - - - -
Z Class Shares (GBP) Accumulation
At 30 June 2013 - - - - 28,55613 - -
Subscriptions - - - - 29,096 - -
Redemptions - - - - (540) - -
At 31 December 2012 - - - - - - -
Emerging Markets Investment Grade
Local Currency Fund
Emerging Markets Inflation Linked
Bond Fund Emerging Markets Total Return Fund
Emerging Markets Total Return Fund II
Emerging Markets Investment Grade
Total Return Fund Emerging Markets
Corporate Debt Fund
Emerging Markets Investment Grade
Corporate Debt Fund Retail Class Shares (EUR) Income
At 30 June 2013 - - - - - 113,364 -
Subscriptions - - - - - 108,386 -
Redemptions - - - - - (46,624) -
At 31 December 2012 - - - - - 51,602 - Retail Class Shares (US$) Income
At 30 June 2013 - 15,9138 20,5004 - - 1,005,346 -
Subscriptions 2,45021 15,913 20,500 - - 782,727 -
Redemptions (2,450)29 - - - - (301,788) -
At 31 December 2012 - - - - - 524,407 - Retail Class Shares (GBP) Income
At 30 June 2013 - - 2,026 - - 23,595 -
Subscriptions - - 998 - - 19,616 -
Redemptions - - (382) - - (2,922) -
At 31 December 2012 - - 1,410 - - 6,901 -
1 launched on 14 January 2013 6 launched on 8 Febuary 2013 11 launched on 19 Febuary 2013 16 launched on 2 April 2013 21 launched on 26 April 2013 26 terminated on 4 June 2013 2 launched on 15 January 2013 7 launched on 12 Febuary 2013 12 launched on 28 Febuary 2013 17 launched on 4 April 2013 22 launched on 7 May 2013 27 launched on 13 June 2013 3 launched on 16 January 2013 8 launched on 13 Febuary 2013 13 launched on 12 March 2013 18 launched on 5 April 2013 23 launched on 17 May 2013 28 launched on 20 June 2013 4 launched on 30 January 2013 9 launched on 14 Febuary 2013 14 launched on 18 March 2013 19 launched on 11 April 2013 24 terminated on 24 May 2013 29 terminated on 26 June 2013 5 launched on 1 Febuary 2013 10 launched on 18 Febuary 2013 15 launched on 25 March 2013 20 launched on 16 April 2013 25 launched on 4 June 2013 30 launched on 26 June 2013

Ashmore SICAV – Unaudited Semi-Annual Report for the period ended 30 June 2013
31
Fund Statistics (continued) As at 30 June 2013 Share transactions (in number of shares) (continued)
Emerging Markets Investment Grade
Local Currency Fund
Emerging Markets Inflation Linked
Bond Fund Emerging Markets Total Return Fund
Emerging Markets Total Return Fund II
Emerging Markets Investment Grade
Total Return Fund
Emerging Markets Corporate Debt Fund
Emerging Markets Investment Grade
Corporate Debt Fund
Retail Class Shares (CHF) Income
At 30 June 2013 - - - - - 25,400 -
Subscriptions - - - - - 4,190 -
Redemptions - - - - - (3,150) -
At 31 December 2012 - - - - - 24,360 -
Retail Class Shares (EUR) Accumulation
At 30 June 2013 - - - - - 28,1421 -
Subscriptions - - - - - 30,078 -
Redemptions - - - - - (1,936) -
At 31 December 2012 - - - - - - -
Retail Class Shares (US$) Accumulation
At 30 June 2013 - - - - - 198,0811 -
Subscriptions - - - - - 219,072 -
Redemptions - - - - - (20,991) -
At 31 December 2012 - - - - - - -
Retail Class Shares (CHF) Accumulation
At 30 June 2013 - - - - - 20,9023 -
Subscriptions - - - - - 20,902 -
At 31 December 2012 - - - - - - - Institutional Class Shares (EUR) Income
At 30 June 2013 33,000 - - - 249,945 7,675,538 309,7315
Subscriptions - - - - 24,945 7,135,324 309,731
Redemptions - - - - - (978,498) -
At 31 December 2012 33,000 - - - 225,000 1,518,712 -
1 launched on 14 January 2013 6 launched on 8 Febuary 2013 11 launched on 19 Febuary 2013 16 launched on 2 April 2013 21 launched on 26 April 2013 26 terminated on 4 June 2013 2 launched on 15 January 2013 7 launched on 12 Febuary 2013 12 launched on 28 Febuary 2013 17 launched on 4 April 2013 22 launched on 7 May 2013 27 launched on 13 June 2013 3 launched on 16 January 2013 8 launched on 13 Febuary 2013 13 launched on 12 March 2013 18 launched on 5 April 2013 23 launched on 17 May 2013 28 launched on 20 June 2013 4 launched on 30 January 2013 9 launched on 14 Febuary 2013 14 launched on 18 March 2013 19 launched on 11 April 2013 24 terminated on 24 May 2013 29 terminated on 26 June 2013 5 launched on 1 Febuary 2013 10 launched on 18 Febuary 2013 15 launched on 25 March 2013 20 launched on 16 April 2013 25 launched on 4 June 2013 30 launched on 26 June 2013

Ashmore SICAV – Unaudited Semi-Annual Report for the period ended 30 June 2013
32
Fund Statistics (continued) As at 30 June 2013 Share transactions (in number of shares) (continued)
Emerging Markets Investment Grade
Local Currency Fund
Emerging Markets Inflation Linked
Bond Fund Emerging Markets Total Return Fund
Emerging Markets Total Return Fund II
Emerging Markets Investment Grade
Total Return Fund
Emerging Markets Corporate Debt Fund
Emerging Markets Investment Grade
Corporate Debt Fund
Institutional Class Shares (US$) Income
At 30 June 2013 3,630,198 399,005 1,319,479 1,874,970 146,149 12,899,042 351,857 Subscriptions 579,829 61,099 178,321 579,640 48,759 4,807,506 33,853
Redemptions - (167,154) (729,099) - - (2,647,454) (58,193)
At 31 December 2012 3,050,369 505,060 1,870,257 1,295,330 97,390 10,738,990 376,197 Institutional Class Shares (GBP) Income
At 30 June 2013 - - 798,542 - - 15,306 - Subscriptions - - 18,003 18,004 - 13,823 -
Redemptions - - (580) - - (3,981) -
At 31 December 2012 - - 781,119 - - 5,464 - Institutional Class Shares (NOK) Income
At 30 June 2013 - - - - - 19,525 - Subscriptions - - - - - 4,554 -
Redemptions - - - - - (21,043) -
At 31 December 2012 - - - - - 36,014 - Institutional Class Shares (CHF) Income
At 30 June 2013 - - - - - 381,441 - Subscriptions - - - - - 351,309 -
Redemptions - - - - - (183,394) -
At 31 December 2012 - - - - - 213,526 -
Institutional Class Shares (AUD) Income
At 30 June 2013 - - - - - 726,24125 - Subscriptions - - - - - 726,241 -
At 31 December 2012 - - - - - - -
1 launched on 14 January 2013 6 launched on 8 Febuary 2013 11 launched on 19 Febuary 2013 16 launched on 2 April 2013 21 launched on 26 April 2013 26 terminated on 4 June 2013 2 launched on 15 January 2013 7 launched on 12 Febuary 2013 12 launched on 28 Febuary 2013 17 launched on 4 April 2013 22 launched on 7 May 2013 27 launched on 13 June 2013 3 launched on 16 January 2013 8 launched on 13 Febuary 2013 13 launched on 12 March 2013 18 launched on 5 April 2013 23 launched on 17 May 2013 28 launched on 20 June 2013 4 launched on 30 January 2013 9 launched on 14 Febuary 2013 14 launched on 18 March 2013 19 launched on 11 April 2013 24 terminated on 24 May 2013 29 terminated on 26 June 2013 5 launched on 1 Febuary 2013 10 launched on 18 Febuary 2013 15 launched on 25 March 2013 20 launched on 16 April 2013 25 launched on 4 June 2013 30 launched on 26 June 2013

Ashmore SICAV – Unaudited Semi-Annual Report for the period ended 30 June 2013
33
Fund Statistics (continued) As at 30 June 2013
Share transactions (in number of shares) (continued)
Emerging Markets Investment Grade
Local Currency Fund
Emerging Markets Inflation Linked
Bond Fund Emerging Markets Total Return Fund
Emerging Markets Total Return Fund II
Emerging Markets Investment Grade
Total Return Fund Emerging Markets
Corporate Debt Fund
Emerging Markets Investment Grade
Corporate Debt Fund Institutional Class Shares (EUR) Accumulation
At 30 June 2013 - - - - - 1,521,6321 - Subscriptions - - - - - 1,598,828 -
Redemptions - - - - - (77,196) - At 31 December 2012 - - - - - - -
Institutional Class Shares (US$) Accumulation
At 30 June 2013 - 121,17617 398,14323 - - 2,047,3322 - Subscriptions - 121,176 398,143 - - 2,262,520 -
Redemptions - - - - - (215,188) - At 31 December 2012 - - - - - - -
Institutional Class Shares (GBP) Accumulation
At 30 June 2013 - - 10015 - - - - Subscriptions - - 100 - - - -
Redemptions - - - - - - - At 31 December 2012 - - - - - - - Institutional Class Shares (CHF) Accumulation
At 30 June 2013 - - - - - 333,5931 - Subscriptions - - - - - 366,050 -
Redemptions - - - - - (32,457) - At 31 December 2012 - - - - - - - Institutional Class Shares (MXN) Accumulation
At 30 June 2013 - - - - - 1,747,84322 - Subscriptions - - - - - 1,747,853 -
Redemptions - - - - - (10) - At 31 December 2012 - - - - - - - Institutional Class Shares (CAD) Accumulation
At 30 June 2013 - - - - - 210,30722 -
Subscriptions - - - - - 210,307 -
Redemptions - - - - - - - At 31 December 2012 - - - - - - - 1 launched on 14 January 2013 6 launched on 8 Febuary 2013 11 launched on 19 Febuary 2013 16 launched on 2 April 2013 21 launched on 26 April 2013 26 terminated on 4 June 2013 2 launched on 15 January 2013 7 launched on 12 Febuary 2013 12 launched on 28 Febuary 2013 17 launched on 4 April 2013 22 launched on 7 May 2013 27 launched on 13 June 2013 3 launched on 16 January 2013 8 launched on 13 Febuary 2013 13 launched on 12 March 2013 18 launched on 5 April 2013 23 launched on 17 May 2013 28 launched on 20 June 2013 4 launched on 30 January 2013 9 launched on 14 Febuary 2013 14 launched on 18 March 2013 19 launched on 11 April 2013 24 terminated on 24 May 2013 29 terminated on 26 June 2013 5 launched on 1 Febuary 2013 10 launched on 18 Febuary 2013 15 launched on 25 March 2013 20 launched on 16 April 2013 25 launched on 4 June 2013 30 launched on 26 June 2013

Ashmore SICAV – Unaudited Semi-Annual Report for the period ended 30 June 2013
34
Fund Statistics (continued) As at 30 June 2013 Share transactions (in number of shares) (continued)
Emerging Markets Investment Grade
Local Currency Fund
Emerging Markets Inflation Linked
Bond Fund Emerging Markets Total Return Fund
Emerging Markets Total Return Fund II
Emerging Markets Investment Grade
Total Return Fund Emerging Markets
Corporate Debt Fund
Emerging Markets Investment Grade
Corporate Debt Fund Institutional Class Shares II (JPY) Income
At 30 June 2013 - - - - - 302,82016 - Subscriptions - - - - - 302,820 -
At 31 December 2012 - - - - - - -
Z Class Shares (US$) Income
At 30 June 2013 - - - - - 1,50028 - Subscriptions - - - - - 1,500 -
At 31 December 2012 - - - - - - -
Z Class Shares (GBP) Income
At 30 June 2013 - - - - - 3,77030 45520 Subscriptions - - - - - 3,770 455
At 31 December 2012 - - - - - - -
Emerging Markets Local Currency
Corporate Debt Fund
Emerging Markets Asian Corporate Debt
Fund Emerging Markets
Global Equity Fund EM Equity Select
Fund
Emerging Markets Global Small-Cap
Equity Fund Emerging Markets
Frontier Equity Fund Brazil Equity Fund Retail Class Shares (EUR) Income
At 30 June 2013 6,101 - - - 3,691 - - Subscriptions 5,398 - - - 982 - -
Redemptions (5,797) - (50)26 - (3,491) - -
At 31 December 2012 6,500 - 50 - 6,200 - - Retail Class Shares (US$) Income
At 30 June 2013 1,2009 - 1,410 - 18,803 - - Subscriptions 1,200 - 2 - 8,984 - -
Redemptions - - (439) - (848) - -
At 31 December 2012 - - 1,847 - 10,667 - -
1 launched on 14 January 2013 6 launched on 8 Febuary 2013 11 launched on 19 Febuary 2013 16 launched on 2 April 2013 21 launched on 26 April 2013 26 terminated on 4 June 2013 2 launched on 15 January 2013 7 launched on 12 Febuary 2013 12 launched on 28 Febuary 2013 17 launched on 4 April 2013 22 launched on 7 May 2013 27 launched on 13 June 2013 3 launched on 16 January 2013 8 launched on 13 Febuary 2013 13 launched on 12 March 2013 18 launched on 5 April 2013 23 launched on 17 May 2013 28 launched on 20 June 2013 4 launched on 30 January 2013 9 launched on 14 Febuary 2013 14 launched on 18 March 2013 19 launched on 11 April 2013 24 terminated on 24 May 2013 29 terminated on 26 June 2013 5 launched on 1 Febuary 2013 10 launched on 18 Febuary 2013 15 launched on 25 March 2013 20 launched on 16 April 2013 25 launched on 4 June 2013 30 launched on 26 June 2013

Ashmore SICAV – Unaudited Semi-Annual Report for the period ended 30 June 2013
35
Fund Statistics (continued) As at 30 June 2013 Share transactions (in number of shares) (continued)
Emerging Markets Local Currency
Corporate Debt Fund
Emerging Markets Asian Corporate Debt
Fund Emerging Markets
Global Equity Fund EM Equity Select
Fund
Emerging Markets Global Small-Cap
Equity Fund Emerging Markets
Frontier Equity Fund Brazil Equity Fund Retail Class Shares (GBP) Income
At 30 June 2013 2,404 - 405 - 1,681 38927 -
Subscriptions 1,750 - 643 - 1,253 389 -
Redemptions (659) - (440) - (147) - -
At 31 December 2012 1,313 - 202 - 575 - - Retail Class Shares (CHF) Income
At 30 June 2013 1,640 - - - 740 - -
Subscriptions 1,140 - - - 120 - -
Redemptions - - - - (80) - -
At 31 December 2012 500 - - - 700 - -
Retail Class Shares (US$) Accumulation
At 30 June 2013 - - - - - - -
Subscriptions - - - - - - 47910
Redemptions - - - - - - (479)24
At 31 December 2012 - - - - - - -
Retail Class Shares (GBP) Accumulation
At 30 June 2013 - - - 250 - - -
At 31 December 2012 - - - 250 - - - Institutional Class Shares (US$) Income
At 30 June 2013 1,502,562 281,749 292,894 - 927,909 116,737 -
Subscriptions 343,266 81,749 92,933 - 524,929 16,737 -
Redemptions (84,598) - (117,426) - (408,964) - -
At 31 December 2012 1,243,894 200,000 317,387 - 811,944 100,000 -
1 launched on 14 January 2013 6 launched on 8 Febuary 2013 11 launched on 19 Febuary 2013 16 launched on 2 April 2013 21 launched on 26 April 2013 26 terminated on 4 June 2013 2 launched on 15 January 2013 7 launched on 12 Febuary 2013 12 launched on 28 Febuary 2013 17 launched on 4 April 2013 22 launched on 7 May 2013 27 launched on 13 June 2013 3 launched on 16 January 2013 8 launched on 13 Febuary 2013 13 launched on 12 March 2013 18 launched on 5 April 2013 23 launched on 17 May 2013 28 launched on 20 June 2013 4 launched on 30 January 2013 9 launched on 14 Febuary 2013 14 launched on 18 March 2013 19 launched on 11 April 2013 24 terminated on 24 May 2013 29 terminated on 26 June 2013 5 launched on 1 Febuary 2013 10 launched on 18 Febuary 2013 15 launched on 25 March 2013 20 launched on 16 April 2013 25 launched on 4 June 2013 30 launched on 26 June 2013

Ashmore SICAV – Unaudited Semi-Annual Report for the period ended 30 June 2013
36
Fund Statistics (continued) As at 30 June 2013 Share transactions (in number of shares) (continued)
Emerging Markets Local Currency
Corporate Debt Fund
Emerging Markets Asian Corporate Debt
Fund Emerging Markets
Global Equity Fund EM Equity Select
Fund
Emerging Markets Global Small-Cap
Equity Fund Emerging Markets
Frontier Equity Fund Brazil Equity Fund Institutional Class Shares (CHF) Income
At 30 June 2013 - - 46,938 - - - -
Subscriptions - - 438 - - - -
At 31 December 2012 - - 46,500 - - - -
Institutional Class Shares (EUR) Accumulation
At 30 June 2013 48,36415 - - - - - -
Subscriptions 48,656 - - - - - -
Redemptions (292) - - - - - -
At 31 December 2012 - - - - - - -
Institutional Class Shares (US$) Accumulation
At 30 June 2013 47,39218 - - 259,306 - - 22,77610
Subscriptions 62,493 - - 159,426 - - 23,003
Redemptions (15,101) - - (150,650) - - (227)
At 31 December 2012 - - - 250,530 - - -
Institutional Class Shares (CHF) Accumulation
At 30 June 2013 153,53014 - - - - - -
Subscriptions 160,980 - - - - - -
Redemptions (7,450) - - - - - -
At 31 December 2012 - - - - - - -
1 launched on 14 January 2013 6 launched on 8 Febuary 2013 11 launched on 19 Febuary 2013 16 launched on 2 April 2013 21 launched on 26 April 2013 26 terminated on 4 June 2013 2 launched on 15 January 2013 7 launched on 12 Febuary 2013 12 launched on 28 Febuary 2013 17 launched on 4 April 2013 22 launched on 7 May 2013 27 launched on 13 June 2013 3 launched on 16 January 2013 8 launched on 13 Febuary 2013 13 launched on 12 March 2013 18 launched on 5 April 2013 23 launched on 17 May 2013 28 launched on 20 June 2013 4 launched on 30 January 2013 9 launched on 14 Febuary 2013 14 launched on 18 March 2013 19 launched on 11 April 2013 24 terminated on 24 May 2013 29 terminated on 26 June 2013 5 launched on 1 Febuary 2013 10 launched on 18 Febuary 2013 15 launched on 25 March 2013 20 launched on 16 April 2013 25 launched on 4 June 2013 30 launched on 26 June 2013

Ashmore SICAV – Unaudited Semi-Annual Report for the period ended 30 June 2013
37
Fund Statistics (continued) As at 30 June 2013 Annual Distributions Payment date 30 April 2013
Emerging Markets Debt
Fund
Emerging Markets
Sovereign Debt Fund
Emerging Markets
Sovereign Investment
Grade Debt Fund
Local Currency Fund
Emerging Markets Local
Currency Bond Fund
Emerging Markets
Investment Grade Local
Currency Fund
Emerging Markets Local
Currency Corporate Debt
Fund
Emerging Markets Inflation
Linked Bond Fund
Retail Class Shares (EUR) Income EUR10.76 - - EUR0.70 EUR2.48 - EUR0.12 -
Retail Class Shares (US$) Income US$6.67 - - US$0.56 US$4.18 - - -
Retail Class Shares (GBP) Income GBP4.53 GBP4.21 - GBP0.12 GBP2.66 - GBP1.97 -
Retail Class Shares (NOK) Income NOK6.22 - - - - - - -
Retail Class Shares (CHF) Income - - - CHF0.80 - - CHF0.11 -
Retail Class Shares (AUD) Income AUD0.59 - - - - - - -
Institutional Class Shares (EUR) Income EUR0.61 - - EUR1.67 EUR4.69 EUR0.10 - -
Institutional Class Shares (US$) Income US$5.26 US$6.46 US$4.39 US$0.22 US$3.34 US$4.40 US$4.29 US$1.82
Institutional Class Shares (GBP) Income - GBP5.24 - - GBP3.75 - - -
Institutional Class Shares (CHF) Income - - - - CHF4.52 - - -
Institutional Class Shares (GBP) Income GBP8.83 - - GBP0.51 - - - -
Institutional Class Shares (NOK) Income NOK7.09 - - - - - - -
Institutional Class Shares (CHF) Income CHF5.11 - - CHF1.18 - - - -
Emerging Markets Total
Return Fund
Emerging Markets Total
Return Fund II
Emerging Markets
Investment Grade Total
Return Fund
Emerging Markets
Corporate Debt Fund
Emerging Markets
Investment Grade
Corporate Debt Fund
Emerging Markets Asian
Corporate Debt Fund
Emerging Markets Global
Equity Fund
Emerging Markets Global
Small-Cap Equity Fund
Retail Class Shares (EUR) Income - - - EUR3.86 - - EUR0.35 -
Retail Class Shares (US$) Income - - - US$3.60 - - US$0.18 -
Retail Class Shares (GBP) Income GBP1.10 - - GBP2.24 - - GBP0.05 -
Retail Class Shares (CHF) Income - - - CHF0.93 - - - -
Institutional Class Shares (EUR) Income - - EUR0.10 EUR1.75 - - - -
Institutional Class Shares (US$) Income US$2.63 US$0.24 US$1.12 US$6.23 US$5.05 US$0.75 US$0.82 US$0.19
Institutional Class Shares (GBP) Income GBP2.56 - - GBP0.41 - - - -
Institutional Class Shares (NOK) Income - - - NOK16.17 - - - -
Institutional Class Shares (CHF) Income - - - CHF0.47 - - CHF0.78 -

Ashmore SICAV – Unaudited Semi-Annual Report for the period ended 30 June 2013
38
Fund Statistics (continued) As at 30 June 2013 Monthly Distributions
Emerging Markets Corporate Debt Fund Payment date 8 February 2013 8 March 2013 9 April 2013 10 May 2013 10 June 2013
Retail Class Shares (EUR) Income EUR0.46 EUR0.43 EUR0.45 EUR0.45 EUR0.37
Retail Class Shares (US$) Income US$0.48 US$0.43 US$0.45 US$0.46 US$0.38
Retail Class Shares (GBP) Income GBP0.49 GBP0.45 GBP0.46 GBP0.47 GBP0.40
Retail Class Shares (CHF) Income CHF0.45 CHF0.42 CHF0.44 CHF0.45 CHF0.36
Institutional Class Shares (EUR) Income EUR0.58 EUR0.56 EUR0.57 EUR0.61 EUR0.49
Institutional Class Shares (US$) Income US$0.61 US$0.55 US$0.58 US$0.60 US$0.49
Institutional Class Shares (GBP) Income GBP0.51 GBP0.48 GBP0.49 GBP0.49 GBP0.42
Institutional Class Shares (NOK) Income NOK0.56 NOK0.56 NOK0.54 NOK0.54 NOK0.41
Institutional Class Shares (CHF) Income CHF0.49 CHF0.48 CHF0.49 CHF0.50 CHF0.49
Institutional II Class Shares (JPY) Income* - - - JPY47.31 JPY45.86
*launched on 2 April 2013 Emerging Markets Asian Corporate Debt Fund Payment date 8 February 2013 8 March 2013 9 April 2013 10 May 2013 10 June 2013
Institutional Class Shares (US$) Income US$0.30 US$0.38 US$0.35 US$0.40 US$0.39

Ashmore SICAV – Unaudited Semi-Annual Report for the period ended 30 June 2013
39
Fund Statistics (continued) As at 30 June 2013 TERs*
Emerging Markets Debt Fund
Emerging Markets Sovereign Debt
Fund
Emerging Markets Sovereign
Investment Grade Debt Fund Turkish Debt Fund
Local Currency Fund
Emerging Markets Local Currency
Bond Fund
Emerging Markets Local Markets
Currency Fund
Total expense ratio (TER) %
Retail Class Shares (EUR) Income 1.68 - - - 1.67 1.70
Retail Class Shares (US$) Income 1.69 - - - 1.68 1.70
Retail Class Shares (GBP) Income 1.70 1.61 - - 1.69 1.70 1.92
Retail Class Shares (CHF) Income - - - - 1.67 - -
Retail Class Shares (NOK) Income 1.69 - - - - - -
Retail Class Shares (AUD) Income 1.70 - - - - - -
Institutional Class Shares (EUR) Income 1.11 - - - 1.13 1.11 -
Institutional Class Shares (US$) Income 1.11 1.01 1.13 - 1.16 1.11 1.33
Institutional Class Shares (GBP) Income 1.10 1.01 - - 1.14 1.11 -
Institutional Class Shares (NOK) Income 1.10 - - - - - -
Institutional Class Shares (CHF) Income 1.10 - - - 1.14 - -
Institutional Class Shares (US$) Accumulation 1.12 - - 1.14 1.17 1.13 -
Institutional Class Shares II (JPY) Income - 0.57 - - - - -
Z Class Shares (US$) Income 1.14 - - - - - -
Z Class Shares (GBP) Income 1.20 - - - - 1.22 -
Z Class Shares (EUR) Accumulation - - - - 1.21 - -
Z Class Shares (US$) Accumulation - - - - 1.35 1.16 -
Z Class Shares (GBP) Accumulation - - - - 1.21 - -
Emerging Markets Investment Grade
Local Currency Fund
Emerging Markets Inflation Linked
Bond Fund Emerging Markets Total Return Fund
Emerging Markets Total Return Fund
II
Emerging Markets Investment Grade
Total Return Fund
Emerging Markets Corporate Debt
Fund
Emerging Markets Investment Grade
Corporate Debt Fund
Total expense ratio (TER) %
Retail Class Shares (EUR) Income - - - - - 1.93 -
Retail Class Shares (US$) Income - 1.78 1.97 - - 1.93 -
Retail Class Shares (GBP) Income - - 1.96 - - 1.94 -
Retail Class Shares (CHF) Income - - - - - 1.95 -
*The TER is calculated based on the annual period from 30 June 2012 to 30 June 2013.

Ashmore SICAV – Unaudited Semi-Annual Report for the period ended 30 June 2013
40
Fund Statistics (continued) As at 30 June 2013 TERs*(continued)
Emerging Markets Investment Grade
Local Currency Fund
Emerging Markets Inflation Linked
Bond Fund Emerging Markets Total Return Fund
Emerging Markets Total Return Fund
II
Emerging Markets Investment Grade
Total Return Fund
Emerging Markets Corporate Debt
Fund
Emerging Markets Investment Grade
Corporate Debt Fund
Total expense ratio (TER) % Retail Class Shares (EUR) Accumulation - - - - - 1.97 -
Retail Class Shares (US$) Accumulation - - - - - 1.94 -
Retail Class Shares (CHF) Accumulation - - - - - 1.94 -
Institutional Class Shares (EUR) Income 1.09 - - 1.10 1.30 1.30
Institutional Class Shares (US$) Income 1.09 1.14 1.27 1.26 1.09 1.28 1.28
Institutional Class Shares (GBP) Income - - 1.27 - - 1.29 -
Institutional Class Shares (CHF) Income - - - - - 1.29 -
Institutional Class Shares (NOK) Income - - - - - 1.27 -
Institutional Class Shares (AUD) Income - - - - - 1.33 -
Institutional Class Shares (EUR) Accumulation - - - - - 1.31 -
Institutional Class Shares (US$) Accumulation - 1.14 1.32 - - 1.30 -
Institutional Class Shares (GBP) Accumulation - - 1.35 - - - -
Institutional Class Shares (CHF) Accumulation - - - - - 1.27 -
Institutional Class Shares (MXN) Accumulation - - - - - 1.32 -
Institutional Class Shares (CAD) Accumulation - - - - - 1.33 -
Institutional Class Shares II (JPY) Income - - - - - 0.54 -
Z Class Shares (US$) Income - - - - - 1.32 -
Z Class Shares (GBP) Income - - - - - 1.37 1.03
Emerging Markets Local Currency Corporate Debt
Fund
Emerging Markets Asian Corporate
Debt Fund Emerging Markets
Global Equity Fund
Emerging Markets Global Small-Cap
Equity Fund
Emerging Markets Frontier Equity
Fund Brazil Equity Fund Total expense ratio (TER) % Retail Class Shares (EUR) Income 2.22 - - 2.27 - -
Retail Class Shares (US$) Income 2.21 - 2.01 2.25 - -
Retail Class Shares (GBP) Income 2.20 - 2.00 2.27 2.34 -
Retail Class Shares (CHF) Income 2.23 - - 2.25 - -
Institutional Class Shares (US$) Income 1.57 1.24 1.47 1.76 1.83 -
Institutional Class Shares (CHF) Income - - 1.46 - - -
Institutional Class Shares (EUR) Accumulation 1.68 - - - - -
Institutional Class Shares (US$) Accumulation 1.58 - - - - 1.78
Institutional Class Shares (CHF) Accumulation 1.58 - - - - -
For Ashmore SICAV EM Equity Select Fund, a composite TER should be calculated based on TER of the target Funds. However, due to the lack of information regarding the target Funds, this TER can not be disclosed. *The TER is calculated based on the annual period from 30 June 2012 to 30 June 2013.

Ashmore SICAV – Unaudited Semi-Annual Report for the period ended 30 June 2013
41
Fund Statistics (continued) As at 30 June 2013 Portfolio turnover
Emerging Markets Debt Fund
Emerging Markets Sovereign Debt Fund
Emerging Markets Sovereign Investment
Grade Debt Fund Turkish Debt Fund Local Currency Fund
Emerging Markets Local Currency Bond
Fund
Emerging Markets Local Markets
Currency Fund
% % % % % % %
Portfolio turnover (PTR) 1.79 0.65 (0.07) (2.87) 2.41 31.44 41.20
Emerging Markets Investment Grade
Local Currency Fund
Emerging Markets Inflation Linked Bond
Fund Emerging Markets Total Return Fund
Emerging Markets Total Return Fund II
Emerging Markets Investment Grade
Total Return Fund Emerging Markets
Corporate Debt Fund
Emerging Markets Investment Grade
Corporate Debt Fund
% % % % % % %
Portfolio turnover (PTR) 2.25 (1.38) 1.51 1.02 (0.32) 0.50 1.04
Emerging Markets Local Currency
Corporate Debt Fund
Emerging Markets Asian Corporate Debt
Fund Emerging Markets
Global Equity Fund EM Equity Select Fund
Emerging Markets Global Small-Cap
Equity Fund Emerging Markets
Frontier Equity Fund Brazil Equity Fund
% % % % % % %
Portfolio turnover (PTR) 0.96 0.39 1.34 1.01 0.83 2.86 0.32

Ashmore SICAV – Unaudited Semi-Annual Report for the period ended 30 June 2013
42
Fund Statistics (continued) As at 30 June 2013 Fund performance
Emerging Markets Debt Fund
Emerging Markets Sovereign Debt Fund
Emerging Markets Sovereign Investment
Grade Debt Fund Turkish Debt Fund Local Currency Fund
Emerging Markets Local Currency Bond
Fund
Emerging Markets Local Markets
Currency Fund % % % % % % %
Gross of dividend distribution during the period
Retail Class Shares (EUR) Income
At 30 June 2013 (8.62) n/a n/a n/a (3.83) (9.05) n/a
At 31 December 2012 22.44 n/a n/a n/a 11.70 17.10 n/a
At 31 December 2011 2.75 n/a n/a n/a (5.28) (8.57) n/a
At 31 December 2010 9.43 n/a n/a n/a 5.83 n/a n/a
Retail Class Shares (US$) Income
At 30 June 2013 (8.44) n/a n/a n/a (3.67) (8.77) n/a
At 31 December 2012 22.91 n/a n/a n/a 12.28 17.82 n/a
At 31 December 2011 2.64 n/a n/a n/a (5.01) (8.35) n/a
At 31 December 2010 9.78 n/a n/a n/a 6.21 n/a n/a
Retail Class Shares (GBP) Income
At 30 June 2013 (8.25) (9.24) n/a n/a (3.62) (8.55) (2.82)
At 31 December 2012 22.89 17.73 n/a n/a 12.18 17.70 0.01
At 31 December 2011 2.76 1.74 n/a n/a (5.40) (8.32) n/a
At 31 December 2010 8.13 n/a n/a n/a 5.97 n/a n/a
Retail Class Shares (NOK) Income
At 30 June 2013 (8.12) n/a n/a n/a n/a n/a n/a
At 31 December 2012 24.41 n/a n/a n/a n/a n/a n/a
At 31 December 2011 4.34 n/a n/a n/a n/a n/a n/a
At 31 December 2010 5.56 n/a n/a n/a n/a n/a n/a
Retail Class Shares (CHF) Income
At 30 June 2013 n/a n/a n/a n/a (3.93) n/a n/a
At 31 December 2012 n/a n/a n/a n/a 3.31 n/a n/a
Retail Class Shares (AUD) Income
At 30 June 2013 (2.23) n/a n/a n/a n/a n/a n/a
At 31 December 2012 3.38 n/a n/a n/a n/a n/a n/a
1 launched on 14 January 2013 6 launched on 8 Febuary 2013 11 launched on 19 Febuary 2013 16 launched on 2 April 2013 21 launched on 26 April 2013 26 terminated on 4 June 2013 *terminated prior to *2 launched on 15 January 2013 7 launched on 12 Febuary 2013 12 launched on 28 Febuary 2013 17 launched on 4 April 2013 22 launched on 7 May 2013 27 launched on 13 June 2013 31 December 2012 3 launched on 16 January 2013 8 launched on 13 Febuary 2013 13 launched on 12 March 2013 18 launched on 5 April 2013 23 launched on 17 May 2013 28 launched on 20 June 2013 4 launched on 31 January 2013 9 launched on 14 Febuary 2013 14 launched on 18 March 2013 19 launched on 11 April 2013 24 terminated on 23 May 2013 29 terminated on 27 June 2013 5 launched on 1 Febuary 2013 10 launched on 18 Febuary 2013 15 launched on 25 March 2013 20 launched on 16 April 2013 25 launched on 3 June 2013 30 launched on 26 June 2013

Ashmore SICAV – Unaudited Semi-Annual Report for the period ended 30 June 2013
43
Fund Statistics (continued) As at 30 June 2013 Fund Performance (continued)
Emerging Markets Debt Fund
Emerging Markets Sovereign Debt Fund
Emerging Markets Sovereign Investment
Grade Debt Fund Turkish Debt Fund Local Currency Fund
Emerging Markets Local Currency Bond
Fund
Emerging Markets Local Markets
Currency Fund % % % % % % %
Gross of dividend distribution during the period
Institutional Class Shares (EUR) Income
At 30 June 2013 n/a n/a n/a n/a n/a (8.74) n/a
At 31 December 2012 13.62* n/a n/a n/a 7.07* 17.79 n/a
At 31 December 2011 2.55 n/a n/a n/a (5.53) (2.83) n/a
At 31 December 2010 9.99 n/a n/a n/a 5.98 1.47 n/a
Institutional Class Shares (EUR) Income*
At 30 June 2013 (8.36) n/a n/a n/a (3.64) n/a n/a
At 31 December 2012 23.06 n/a n/a n/a 12.25 n/a n/a
At 31 December 2011 2.82 n/a n/a n/a (4.93) n/a n/a
Institutional Class Shares (US$) Income
At 30 June 2013 n/a (9.12) (10.00) n/a n/a (8.51) (2.67)
At 31 December 2012 13.81* 18.38 16.47 n/a 5.60* 18.50 7.85
At 31 December 2011 2.58 7.33 7.74 n/a (5.39) (2.56) (7.17)
At 31 December 2010 9.99 5.74 6.38 n/a 6.50 11.78 4.26
Institutional Class Shares (US$) Income*
At 30 June 2013 (8.17) n/a n/a n/a (3.41) n/a n/a
At 31 December 2012 23.65 n/a n/a n/a 12.89 n/a n/a
At 31 December 2011 0.94 n/a n/a n/a (5.83) n/a n/a
Institutional Class Shares (GBP) Income
At 30 June 2013 n/a (8.96) n/a n/a n/a (8.43) n/a
At 31 December 2012 n/a 10.37 n/a n/a 7.38* 18.36 n/a
At 31 December 2011 n/a n/a n/a n/a (5.49) 0.99 n/a
At 31 December 2010 n/a n/a n/a n/a (1.77) n/a n/a
1 launched on 14 January 2013 6 launched on 8 Febuary 2013 11 launched on 19 Febuary 2013 16 launched on 2 April 2013 21 launched on 26 April 2013 26 terminated on 4 June 2013 *terminated prior to *2 launched on 15 January 2013 7 launched on 12 Febuary 2013 12 launched on 28 Febuary 2013 17 launched on 4 April 2013 22 launched on 7 May 2013 27 launched on 13 June 2013 31 December 2012 3 launched on 16 January 2013 8 launched on 13 Febuary 2013 13 launched on 12 March 2013 18 launched on 5 April 2013 23 launched on 17 May 2013 28 launched on 20 June 2013 4 launched on 31 January 2013 9 launched on 14 Febuary 2013 14 launched on 18 March 2013 19 launched on 11 April 2013 24 terminated on 23 May 2013 29 terminated on 27 June 2013 5 launched on 1 Febuary 2013 10 launched on 18 Febuary 2013 15 launched on 25 March 2013 20 launched on 16 April 2013 25 launched on 3 June 2013 30 launched on 26 June 2013

Ashmore SICAV – Unaudited Semi-Annual Report for the period ended 30 June 2013
44
Fund Statistics (continued) As at 30 June 2013 Fund Performance (continued)
Emerging Markets Debt Fund
Emerging Markets Sovereign Debt Fund
Emerging Markets Sovereign Investment
Grade Debt Fund Turkish Debt Fund Local Currency Fund
Emerging Markets Local Currency Bond
Fund
Emerging Markets Local Markets
Currency Fund % % % % % % %
Gross of dividend distribution during the period
Institutional Class Shares (GBP) Income*
At 30 June 2013 (8.01) n/a n/a n/a (3.36) n/a n/a
At 31 December 2012 23.65 n/a n/a n/a 12.68 n/a n/a
At 31 December 2011 1.01 n/a n/a n/a (9.91) n/a n/a
Institutional Class Shares (CHF) Income
At 30 June 2013 n/a n/a n/a n/a n/a (9.75) 29 n/a
At 31 December 2012 n/a n/a n/a n/a n/a 17.47 n/a
At 31 December 2011 n/a n/a n/a n/a n/a (8.34) n/a
Institutional Class Shares (NOK) Income*
At 30 June 2013 (7.61) n/a n/a n/a n/a n/a n/a
At 31 December 2012 25.13 n/a n/a n/a n/a n/a n/a
At 31 December 2011 3.78 n/a n/a n/a n/a n/a n/a
Institutional Class Shares (CHF) Income*
At 30 June 2013 (8.29) n/a n/a n/a (3.58) n/a n/a
At 31 December 2012 14.92 n/a n/a n/a 11.80 n/a n/a
At 31 December 2011 n/a n/a n/a n/a (10.44) n/a n/a
Institutional Class Shares (US$) Accumulation At 30 June 2013 (7.89) 17 n/a n/a (11.98) 10 (3.47) 17 (9.70) 7 n/a
Institutional II Class Shares (JPY) Income
At 30 June 2013 n/a (8.61) 19 n/a n/a n/a n/a n/a
Z (US$) Income At 30 June 2013 (7.38) 11 n/a n/a n/a n/a n/a n/a
1 launched on 14 January 2013 6 launched on 8 Febuary 2013 11 launched on 19 Febuary 2013 16 launched on 2 April 2013 21 launched on 26 April 2013 26 terminated on 4 June 2013 *terminated prior to *2 launched on 15 January 2013 7 launched on 12 Febuary 2013 12 launched on 28 Febuary 2013 17 launched on 4 April 2013 22 launched on 7 May 2013 27 launched on 13 June 2013 31 December 2012 3 launched on 16 January 2013 8 launched on 13 Febuary 2013 13 launched on 12 March 2013 18 launched on 5 April 2013 23 launched on 17 May 2013 28 launched on 20 June 2013 4 launched on 31 January 2013 9 launched on 14 Febuary 2013 14 launched on 18 March 2013 19 launched on 11 April 2013 24 terminated on 23 May 2013 29 terminated on 27 June 2013 5 launched on 1 Febuary 2013 10 launched on 18 Febuary 2013 15 launched on 25 March 2013 20 launched on 16 April 2013 25 launched on 3 June 2013 30 launched on 26 June 2013

Ashmore SICAV – Unaudited Semi-Annual Report for the period ended 30 June 2013
45
Fund Statistics (continued) As at 30 June 2013 Fund Performance (continued)
Emerging Markets Debt Fund
Emerging Markets Sovereign Debt Fund
Emerging Markets Sovereign Investment
Grade Debt Fund Turkish Debt Fund Local Currency Fund
Emerging Markets Local Currency Bond
Fund
Emerging Markets Local Markets
Currency Fund % % % % % % %
Gross of dividend distribution during the period
Z (GBP) Income
At 30 June 2013 (7.46) 6 n/a n/a n/a n/a (8.95) 12 n/a
Z (EUR) Accumulation
At 30 June 2013 n/a n/a n/a n/a (3.87) 14 n/a n/a
Z (US$) Accumulation
At 30 June 2013 n/a n/a n/a n/a (4.01) 13 (9.05) 12 n/a
Z (GBP) Accumulation
At 30 June 2013 n/a n/a n/a n/a (4.01) 13 n/a n/a
Emerging Markets Investment Grade
Local Currency Fund
Emerging Markets Inflation Linked
Bond Fund Emerging Markets Total Return Fund
Emerging Markets Total Return Fund II
Emerging Markets Investment Grade
Total Return Fund Emerging Markets
Corporate Debt Fund
Emerging Markets Investment Grade
Corporate Debt Fund % % % % % % %
Gross of dividend distribution during the period
Retail Class Shares (EUR) Income
At 30 June 2013 n/a n/a n/a n/a n/a (2.83) n/a
At 31 December 2012 n/a n/a n/a n/a n/a 21.71 n/a
At 31 December 2011 n/a n/a n/a n/a n/a (6.83) n/a
Retail Class Shares (US$) Income
At 30 June 2013 (13.23)21,29 (13.03) 8 (7.11) 4 n/a n/a (2.73) n/a
At 31 December 2012 n/a n/a n/a n/a n/a 21.99 n/a
At 31 December 2011 n/a n/a n/a n/a n/a (5.54) n/a
At 31 December 2010 n/a n/a n/a n/a n/a 1.16 n/a
1 launched on 14 January 2013 6 launched on 8 Febuary 2013 11 launched on 19 Febuary 2013 16 launched on 2 April 2013 21 launched on 26 April 2013 26 terminated on 4 June 2013 *terminated prior to *2 launched on 15 January 2013 7 launched on 12 Febuary 2013 12 launched on 28 Febuary 2013 17 launched on 4 April 2013 22 launched on 7 May 2013 27 launched on 13 June 2013 31 December 2012 3 launched on 16 January 2013 8 launched on 13 Febuary 2013 13 launched on 12 March 2013 18 launched on 5 April 2013 23 launched on 17 May 2013 28 launched on 20 June 2013 4 launched on 31 January 2013 9 launched on 14 Febuary 2013 14 launched on 18 March 2013 19 launched on 11 April 2013 24 terminated on 23 May 2013 29 terminated on 27 June 2013 5 launched on 1 Febuary 2013 10 launched on 18 Febuary 2013 15 launched on 25 March 2013 20 launched on 16 April 2013 25 launched on 3 June 2013 30 launched on 26 June 2013

Ashmore SICAV – Unaudited Semi-Annual Report for the period ended 30 June 2013
46
Fund Statistics (continued) As at 30 June 2013 Fund Performance (continued)
Emerging Markets Investment Grade
Local Currency Fund
Emerging Markets Inflation Linked
Bond Fund Emerging Markets Total Return Fund
Emerging Markets Total Return Fund II
Emerging Markets Investment Grade
Total Return Fund Emerging Markets
Corporate Debt Fund
Emerging Markets Investment Grade
Corporate Debt Fund % % % % % % %
Gross of dividend distribution during the period
Retail Class Shares (GBP) Income
At 30 June 2013 n/a n/a (6.41) n/a n/a (2.48) n/a
At 31 December 2012 n/a n/a 10.43 n/a n/a 22.12 n/a
At 31 December 2011 n/a n/a n/a n/a n/a (9.48) n/a
Retail Class Shares (CHF) Income
At 30 June 2013 n/a n/a n/a n/a n/a (2.79) n/a
At 31 December 2012 n/a n/a n/a n/a n/a 21.38 n/a
At 31 December 2011 n/a n/a n/a n/a n/a (7.11) n/a
Retail Class Shares (EUR) Accumulation
At 30 June 2013 n/a n/a n/a n/a n/a (4.56) 1 n/a
Retail Class Shares (US$) Accumulation
At 30 June 2013 n/a n/a n/a n/a n/a (4.49) 1 n/a
Retail Class Shares (CHF) Accumulation
At 30 June 2013 n/a n/a n/a n/a n/a (4.65) 3 n/a
Institutional Class Shares (EUR) Income
At 30 June 2013 (9.23) n/a n/a n/a (7.91) (2.55) (6.40) 5
At 31 December 2012 0.11 n/a 20.18* n/a 0.53 22.42 n/a
At 31 December 2011 n/a n/a n/a n/a n/a (4.69) n/a
At 31 December 2010 n/a n/a n/a n/a n/a 5.77 n/a
Institutional Class Shares (US$) Income
At 30 June 2013 (8.97) (11.33) (6.26) (5.80) (7.72) (2.43) (5.15)
At 31 December 2012 18.76 24.05 21.64 0.95 2.43 22.78 18.03
At 31 December 2011 (11.10) (11.72) (9.09) n/a n/a (4.93) 3.31
At 31 December 2010 n/a n/a n/a n/a n/a 10.65 7.72
1 launched on 14 January 2013 6 launched on 8 Febuary 2013 11 launched on 19 Febuary 2013 16 launched on 2 April 2013 21 launched on 26 April 2013 26 terminated on 4 June 2013 *terminated prior to *2 launched on 15 January 2013 7 launched on 12 Febuary 2013 12 launched on 28 Febuary 2013 17 launched on 4 April 2013 22 launched on 7 May 2013 27 launched on 13 June 2013 31 December 2012 3 launched on 16 January 2013 8 launched on 13 Febuary 2013 13 launched on 12 March 2013 18 launched on 5 April 2013 23 launched on 17 May 2013 28 launched on 20 June 2013 4 launched on 31 January 2013 9 launched on 14 Febuary 2013 14 launched on 18 March 2013 19 launched on 11 April 2013 24 terminated on 23 May 2013 29 terminated on 27 June 2013 5 launched on 1 Febuary 2013 10 launched on 18 Febuary 2013 15 launched on 25 March 2013 20 launched on 16 April 2013 25 launched on 3 June 2013 30 launched on 26 June 2013

Ashmore SICAV – Unaudited Semi-Annual Report for the period ended 30 June 2013
47
Fund Statistics (continued) As at 30 June 2013 Fund Performance (continued)
Emerging Markets Investment Grade
Local Currency Fund
Emerging Markets Inflation Linked
Bond Fund Emerging Markets Total Return Fund
Emerging Markets Total Return Fund II
Emerging Markets Investment Grade
Total Return Fund Emerging Markets
Corporate Debt Fund
Emerging Markets Investment Grade
Corporate Debt Fund % % % % % % %
Gross of dividend distribution during the period
Institutional Class Shares (GBP) Income
At 30 June 2013 n/a n/a (6.09) n/a n/a (2.27) n/a
At 31 December 2012 n/a n/a 21.55 n/a n/a 1.62 n/a
At 31 December 2011 n/a n/a 0.32 n/a n/a n/a n/a
Institutional Class Shares (NOK) Income
At 30 June 2013 n/a n/a n/a n/a n/a (1.99) n/a
At 31 December 2012 n/a n/a n/a n/a n/a 24.42 n/a
At 31 December 2011 n/a n/a n/a n/a n/a (3.33) n/a
At 31 December 2010 n/a n/a n/a n/a n/a 1.01 n/a
Institutional Class Shares (CHF) Income
At 30 June 2013 n/a n/a n/a n/a n/a (3.01) n/a
At 31 December 2012 n/a n/a n/a n/a n/a 2.07 n/a
Institutional Class Shares (AUD) Income
At 30 June 2013 n/a n/a n/a n/a n/a (3.92) 25 n/a Institutional Class Shares (EUR) Accumulation
At 30 June 2013 n/a n/a n/a n/a n/a (4.36) 1 n/a
Institutional Class Shares (US$) Accumulation
At 30 June 2013 n/a (12.76) 17 (7.46) 23 n/a n/a (4.24) 2 n/a
Institutional Class Shares (GBP) Accumulation
At 30 June 2013 n/a n/a (5.85) 15 n/a n/a n/a n/a Institutional Class Shares (CHF) Accumulation
At 30 June 2013 n/a n/a n/a n/a n/a (4.30) 1 n/a
1 launched on 14 January 2013 6 launched on 8 Febuary 2013 11 launched on 19 Febuary 2013 16 launched on 2 April 2013 21 launched on 26 April 2013 26 terminated on 4 June 2013 *terminated prior to *2 launched on 15 January 2013 7 launched on 12 Febuary 2013 12 launched on 28 Febuary 2013 17 launched on 4 April 2013 22 launched on 7 May 2013 27 launched on 13 June 2013 31 December 2012 3 launched on 16 January 2013 8 launched on 13 Febuary 2013 13 launched on 12 March 2013 18 launched on 5 April 2013 23 launched on 17 May 2013 28 launched on 20 June 2013 4 launched on 31 January 2013 9 launched on 14 Febuary 2013 14 launched on 18 March 2013 19 launched on 11 April 2013 24 terminated on 23 May 2013 29 terminated on 27 June 2013 5 launched on 1 Febuary 2013 10 launched on 18 Febuary 2013 15 launched on 25 March 2013 20 launched on 16 April 2013 25 launched on 3 June 2013 30 launched on 26 June 2013

Ashmore SICAV – Unaudited Semi-Annual Report for the period ended 30 June 2013
48
Fund Statistics (continued) As at 30 June 2013 Fund Performance (continued)
Emerging Markets Investment Grade
Local Currency Fund
Emerging Markets Inflation Linked
Bond Fund Emerging Markets Total Return Fund
Emerging Markets Total Return Fund II
Emerging Markets Investment Grade
Total Return Fund Emerging Markets
Corporate Debt Fund
Emerging Markets Investment Grade
Corporate Debt Fund % % % % % % %
Gross of dividend distribution during the period
Institutional Class Shares (MXN) Accumulation
At 30 June 2013 n/a n/a n/a n/a n/a (5.73) 22 n/a Institutional Class Shares (CAD) Accumulation
At 30 June 2013 n/a n/a n/a n/a n/a (6.03) 22 n/a
Institutional Class Shares II (JPY) Income
At 30 June 2013 n/a n/a n/a n/a n/a (4.68) 16 n/a
Z (US$) Income
At 30 June 2013 n/a n/a n/a n/a n/a 0.52 30 n/a
Z (GBP) Income
At 30 June 2013 n/a n/a n/a n/a n/a (1.05) 28 (6.93) 20
Emerging Markets Local Currency
Corporate Debt Fund
Emerging Markets Asian Corporate Debt
Fund Emerging Markets
Global Equity Fund EM Equity Select
Fund
Emerging Markets Global Small-Cap
Equity Fund Emerging Markets
Frontier Equity Fund Brazil Equity Fund % % % % % % %
Gross of dividend distribution during the period
Retail Class Shares (EUR) Income
At 30 June 2013 (5.65) n/a (4.17) 26 n/a (3.69) n/a n/a
At 31 December 2012 0.87 n/a (0.46) n/a 0.36 n/a n/a
Retail Class Shares (US$) Income
At 30 June 2013 (7.28) 9 n/a (11.59) n/a (3.53) n/a n/a
At 31 December 2012 n/a n/a 16.06 n/a 22.55 n/a n/a
At 31 December 2011 n/a n/a 3.12 n/a 2.67 n/a n/a
1 launched on 14 January 2013 6 launched on 8 Febuary 2013 11 launched on 19 Febuary 2013 16 launched on 2 April 2013 21 launched on 26 April 2013 26 terminated on 4 June 2013 *terminated prior to *2 launched on 15 January 2013 7 launched on 12 Febuary 2013 12 launched on 28 Febuary 2013 17 launched on 4 April 2013 22 launched on 7 May 2013 27 launched on 13 June 2013 31 December 2012 3 launched on 16 January 2013 8 launched on 13 Febuary 2013 13 launched on 12 March 2013 18 launched on 5 April 2013 23 launched on 17 May 2013 28 launched on 20 June 2013 4 launched on 31 January 2013 9 launched on 14 Febuary 2013 14 launched on 18 March 2013 19 launched on 11 April 2013 24 terminated on 23 May 2013 29 terminated on 27 June 2013 5 launched on 1 Febuary 2013 10 launched on 18 Febuary 2013 15 launched on 25 March 2013 20 launched on 16 April 2013 25 launched on 3 June 2013 30 launched on 26 June 2013

Ashmore SICAV – Unaudited Semi-Annual Report for the period ended 30 June 2013
49
Fund Statistics (continued) As at 30 June 2013 Fund Performance (continued)
Emerging Markets Local Currency
Corporate Debt Fund
Emerging Markets Asian Corporate Debt
Fund Emerging Markets
Global Equity Fund EM Equity Select
Fund
Emerging Markets Global Small-Cap
Equity Fund Emerging Markets
Frontier Equity Fund Brazil Equity Fund % % % % % % %
Gross of dividend distribution during the period
Retail Class Shares (GBP) Income
At 30 June 2013 (5.16) n/a (11.37) n/a (3.30) (2.74) 27 n/a
At 31 December 2012 17.58 n/a (1.22) n/a 1.69 n/a n/a
At 31 December 2011 (3.75) n/a n/a n/a n/a n/a n/a
Retail Class Shares (CHF) Income
At 30 June 2013 (5.62) n/a n/a n/a (3.63) n/a n/a
At 31 December 2012 0.09 n/a n/a n/a 1.44 n/a n/a
Retail Class Shares (US$) Accumulation
At 30 June 2013 n/a n/a n/a n/a n/a n/a (55.25) 10,24 Retail Class Shares (GBP) Accumulation
At 30 June 2013 n/a n/a n/a (8.83) n/a n/a n/a
At 31 December 2012 n/a n/a n/a 18.96 n/a n/a n/a
At 31 December 2011 n/a n/a n/a (21.96) n/a n/a n/a
Institutional Class Shares (US$) Income
At 30 June 2013 (5.11) (2.04) (11.36) n/a (3.30) 23.52 n/a
At 31 December 2012 18.41 1.04 16.68 n/a 23.16 12.26 n/a
At 31 December 2011 (12.25) n/a 7.48 n/a 3.86 n/a n/a
Institutional Class Shares (CHF) Income
At 30 June 2013 n/a n/a (11.40) n/a n/a n/a n/a
At 31 December 2012 n/a n/a (1.02) n/a n/a n/a n/a
Institutional Class Shares (EUR) Accumulation
At 30 June 2013 (6.75) 15 n/a n/a n/a n/a n/a n/a
1 launched on 14 January 2013 6 launched on 8 Febuary 2013 11 launched on 19 Febuary 2013 16 launched on 2 April 2013 21 launched on 26 April 2013 26 terminated on 4 June 2013 *terminated prior to *2 launched on 15 January 2013 7 launched on 12 Febuary 2013 12 launched on 28 Febuary 2013 17 launched on 4 April 2013 22 launched on 7 May 2013 27 launched on 13 June 2013 31 December 2012 3 launched on 16 January 2013 8 launched on 13 Febuary 2013 13 launched on 12 March 2013 18 launched on 5 April 2013 23 launched on 17 May 2013 28 launched on 20 June 2013 4 launched on 31 January 2013 9 launched on 14 Febuary 2013 14 launched on 18 March 2013 19 launched on 11 April 2013 24 terminated on 23 May 2013 29 terminated on 27 June 2013 5 launched on 1 Febuary 2013 10 launched on 18 Febuary 2013 15 launched on 25 March 2013 20 launched on 16 April 2013 25 launched on 3 June 2013 30 launched on 26 June 2013

Ashmore SICAV – Unaudited Semi-Annual Report for the period ended 30 June 2013
50
Fund Statistics (continued) As at 30 June 2013 Fund Performance (continued)
Emerging Markets Local Currency
Corporate Debt Fund
Emerging Markets Asian Corporate Debt
Fund Emerging Markets
Global Equity Fund EM Equity Select
Fund
Emerging Markets Global Small-Cap
Equity Fund Emerging Markets
Frontier Equity Fund Brazil Equity Fund % % % % % % %
Gross of dividend distribution during the period
Institutional Class Shares (US$) Accumulation
At 30 June 2013 (6.71) 18 n/a n/a (8.80) n/a n/a (23.09) 10
At 31 December 2012 n/a n/a n/a 19.92 n/a n/a n/a
At 31 December 2011 n/a n/a n/a (20.66) n/a n/a n/a
Institutional Class Shares (CHF) Accumulation
At 30 June 2013 (7.09) 14 n/a n/a n/a n/a n/a n/a
1 launched on 14 January 2013 6 launched on 8 Febuary 2013 11 launched on 19 Febuary 2013 16 launched on 2 April 2013 21 launched on 26 April 2013 26 terminated on 4 June 2013 *terminated prior to *2 launched on 15 January 2013 7 launched on 12 Febuary 2013 12 launched on 28 Febuary 2013 17 launched on 4 April 2013 22 launched on 7 May 2013 27 launched on 13 June 2013 31 December 2012 3 launched on 16 January 2013 8 launched on 13 Febuary 2013 13 launched on 12 March 2013 18 launched on 5 April 2013 23 launched on 17 May 2013 28 launched on 20 June 2013 4 launched on 31 January 2013 9 launched on 14 Febuary 2013 14 launched on 18 March 2013 19 launched on 11 April 2013 24 terminated on 23 May 2013 29 terminated on 27 June 2013 5 launched on 1 Febuary 2013 10 launched on 18 Febuary 2013 15 launched on 25 March 2013 20 launched on 16 April 2013 25 launched on 3 June 2013 30 launched on 26 June 2013
Past performance is no indication of current or future performance. Performance data does not take account of commissions and costs incurred on the issue and redemption of shares. Performance data for the non US$ share classes are in their respective currencies, and have been converted from the Sub-Funds’ reference currency, US$.

Ashmore SICAV – Unaudited Semi-Annual Report for the period ended 30 June 2013
51
Ashmore SICAV Emerging Markets Debt Fund Schedule of Investments As at 30 June 2013
Holdings
Currency Description of Investment Market Value
US$ Net Assets
%
Transferable securities admitted to an official stock exchange listing/dealt on another regulated market
Bonds
Argentina
10,843,000 US$ Argentina Boden Bonds 7% 03/10/2015 9,406,303 0.91
12,623,379 US$ Argentine Republic Government International Bond 8.28% Discount 31/12/2033 7,100,651 0.69
2,762,347 US$ Argentina Republic Government International Bond 8.28% 31/12/2033 1,512,385 0.15
1,533,000 US$ Argentine Republic Government International Bond 8.75% 02/06/2017 1,161,247 0.11
1,715,000 US$ Argentine Republic Government International Bond Step Cpn 31/12/2038 557,375 0.05
2,750,000 US$ WPE International Cooperatief UA 10.375% 30/09/2020 2,145,000 0.21
21,882,961 2.12
Azerbaijan
3,903,000 US$ State Oil of the Azerbaijan Republic 4.75% 13/03/2023 3,532,215 0.33
2,390,000 US$ State Oil of the Azerbaijan Republic 5.45% 09/02/2017 2,455,725 0.24
5,987,940 0.57
Belarus
6,405,000 US$ Republic of Belarus 8.75% 03/08/2015 6,421,013 0.62
6,399,000 US$ Republic of Belarus 8.95% 26/01/2018 6,383,003 0.62
12,804,016 1.24
Bolivia
2,000,000 US$ Bolivian Government International Bond 4.875% 29/10/2022 1,870,000 0.18
1,870,000 0.18
Brazil
979,000 US$ Banco Nacional de Desenvolvimento Economico e Social 5.5% 12/07/2020 1,010,817 0.10
3,705,000 US$ Banco Nacional de Desenvolvimento Economico e Social 6.5% 10/06/2019 4,038,450 0.39
971,000 BRL Brazil Notas do Tesouro Nacional Serie B 6% 15/08/2020 10,855,882 1.05
1,571,000 BRL Brazil Notas do Tesouro Nacional Serie F 10% 01/01/2021 7,094,314 0.69
3,250,000 US$ Brazilian Government International Bond 2.625% 05/01/2023 2,827,500 0.27
4,523,000 US$ Brazilian Government International Bond 8.25% 20/01/2034 5,992,975 0.58
1,760,000 US$ Brazilian Government International Bond 8.875% 15/04/2024 2,428,800 0.24
3,617,000 US$ Brazilian Government International Bond 10.125% 15/05/2027 5,606,350 0.54
1,650,000 US$ Fibria Overseas Finance 6.75% 03/03/2021 1,767,975 0.17
3,417,000 US$ JBS Finance II 8.25% 29/01/2018 3,468,255 0.34
1,200,000 US$ Marfrig Europe 9.875% 24/07/2017 1,206,000 0.12
3,800,000 US$ Marfrig Overseas 9.5% 04/05/2020 3,766,750 0.37
1,662,000 US$ Minerva Luxembourg 7.75% 31/01/2023 1,653,690 0.16
3,000,000 US$ Minerva Luxembourg 12.25% 10/02/2022 3,585,000 0.35
3,300,000 US$ OGX Austria 8.375% 01/04/2022 957,000 0.09
3,900,000 US$ OGX Austria 8.5% 01/06/2018 1,228,500 0.12
2,800,000 US$ OSX 3 Leasing 9.25% 20/03/2015 2,436,000 0.24
59,924,258 5.82
Chile
1,700,000 US$ Automotores Gildemeister 6.75% 15/01/2023 1,445,000 0.14
100,000 US$ Automotores Gildemeister 8.25% 24/05/2021 92,500 0.01
900,000 US$ Banco del Estado de Chile 3.875% 08/02/2022 872,833 0.08
1,630,000 US$ Banco del Estado de Chile 4.125% 07/10/2020 1,634,665 0.16 The accompanying notes form an integral part of these consolidated financial statements.

Ashmore SICAV – Unaudited Semi-Annual Report for the period ended 30 June 2013
52
Ashmore SICAV Emerging Markets Debt Fund Schedule of Investments (continued) As at 30 June 2013
Holdings
Currency Description of Investment Market Value US$ Net Assets
%
Transferable securities admitted to an official stock exchange listing/dealt on another regulated market (continued)
Bonds (continued)
Chile (continued)
1,090,000 US$ Chile Government International Bond 3.25% 14/09/2021 1,090,000 0.11
1,783,000 US$ Corp Nacional del Cobre de Chile 3.75% 04/11/2020 1,735,107 0.17
2,710,000 US$ Corp Nacional del Cobre de Chile 3.875% 03/11/2021 2,643,231 0.26
1,237,000 US$ Corp Nacional del Cobre de Chile 7.5% 15/01/2019 1,479,625 0.14
1,090,000 US$ Empresa Nacional del Petroleo 5.25% 10/08/2020 1,105,531 0.11
2,363,000 US$ Empresa Nacional del Petroleo 6.25% 08/07/2019 2,544,901 0.25
1,592,155 US$ Inversiones Alsacia 8% 18/08/2018 1,345,371 0.13
1,700,000 US$ SMU 7.75% 08/02/2020 1,538,500 0.15
17,527,264 1.71
Colombia
2,840,000 US$ Colombia Government International Bond 4.375% 12/07/2021 2,957,860 0.29
4,308,000 US$ Colombia Government International Bond 6.125% 18/01/2041 4,792,650 0.47
4,483,000 US$ Colombia Government International Bond 7.375% 18/03/2019 5,451,328 0.53
2,149,000 US$ Colombia Government International Bond 7.375% 18/09/2037 2,745,348 0.27
3,766,000 US$ Colombia Government International Bond 8.125% 21/05/2024 4,989,950 0.48
3,156,000 US$ Colombia Government International Bond 11.75% 25/02/2020 4,655,100 0.45
1,293,000 US$ Ecopetrol 7.625% 23/07/2019 1,528,973 0.15
27,121,209 2.64
Costa Rica
3,770,000 US$ Costa Rica Government International Bond 4.25% 26/01/2023 3,487,250 0.34
1,320,000 US$ Costa Rica Government International Bond 4.375% 30/04/2025 1,211,100 0.12
1,320,000 US$ Costa Rica Government International Bond 5.625% 30/04/2043 1,194,600 0.12
1,480,000 US$ Instituto Costarricense de Electricidad 6.375% 15/05/2043 1,341,250 0.13
7,234,200 0.71
Croatia
2,740,000 US$ Croatia Government International Bond 6.25% 27/04/2017 2,872,643 0.28
8,664,000 US$ Croatia Government International Bond 6.375% 24/03/2021 9,064,710 0.88
4,359,000 US$ Croatia Government International Bond 6.625% 14/07/2020 4,622,807 0.45
2,990,000 US$ Croatia Government International Bond 6.75% 05/11/2019 3,191,586 0.31
3,350,000 EUR Zagrebacki D.O.O. 5.5% 10/07/2017 3,543,255 0.34
23,295,001 2.26
Dominican Republic
3,845,000 US$ Dominican Republic International Bond 5.875% 18/04/2024 3,700,813 0.36
4,541,000 US$ Dominican Republic International Bond 7.5% 06/05/2021 4,892,928 0.48
8,593,741 0.84
Ecuador
1,980,000 US$ Ecuador Government International Bond 9.375% 15/12/2015 2,054,250 0.20
2,054,250 0.20
Egypt
2,615,000 US$ Egypt Government International Bond 5.75% 29/04/2020 2,053,298 0.20
734,000 US$ Egypt Government International Bond 6.875% 30/04/2040 521,287 0.05
2,225,000 US$ Nile Finance 5.25% 05/08/2015 1,980,250 0.19
4,554,835 0.44 The accompanying notes form an integral part of these consolidated financial statements.

Ashmore SICAV – Unaudited Semi-Annual Report for the period ended 30 June 2013
53
Ashmore SICAV Emerging Markets Debt Fund Schedule of Investments (continued) As at 30 June 2013
Holdings
Currency Description of Investment Market Value US$ Net Assets
%
Transferable securities admitted to an official stock exchange listing/dealt on another regulated market (continued)
Bonds (continued)
El Salvador
2,238,000 US$ El Salvador Government International Bond 5.875% 30/01/2025 2,176,455 0.21
880,000 US$ El Salvador Government International Bond 7.375% 01/12/2019 970,200 0.09
1,233,000 US$ El Salvador Government International Bond 7.625% 01/02/2041 1,199,093 0.12
2,456,000 US$ El Salvador Government International Bond 7.65% 15/06/2035 2,400,740 0.23
750,000 US$ El Salvador Government International Bond 8.25% 10/04/2032 781,875 0.08
850,000 US$ Telemovil Finance 8% 01/10/2017 898,875 0.09
8,427,238 0.82
Gabon
1,490,000 US$ Gabonese Republic 8.2% 12/12/2017 1,676,250 0.16
1,676,250 0.16
Georgia
2,240,000 US$ Georgia Government International Bond 6.875% 12/04/2021 2,396,800 0.23
1,960,000 US$ Georgian Railway 7.75% 11/07/2022 2,118,172 0.21
4,514,972 0.44
Ghana
2,010,000 US$ Republic of Ghana 8.5% 04/10/2017 2,120,550 0.21
2,120,550 0.21
Guatemala
2,970,000 US$ Guatemala Government Bond 4.875% 13/02/2028 2,687,850 0.26
2,687,850 0.26
Hong Kong
200,000 US$ Central China Real Estate 6.5% 04/06/2018 180,336 0.02
883,000 US$ Central China Real Estate 8% 28/01/2020 799,131 0.08
5,762,000 US$ CFG Investment SAC 9.75% 30/07/2019 5,156,990 0.50
2,200,000 US$ Hengdeli 6.25% 29/01/2018 2,140,794 0.21
2,257,000 US$ Industrial & Commercial Bank of China Asia 5.125% 30/11/2020 2,312,533 0.22
1,500,000 US$ Shimao Property 9.65% 03/08/2017 1,568,025 0.15
12,157,809 1.18
Hungary
2,216,000 US$ Hungary Government International Bond 5.375% 21/02/2023 2,132,900 0.21
4,408,000 US$ Hungary Government International Bond 6.25% 29/01/2020 4,606,360 0.45
4,914,000 US$ Hungary Government International Bond 6.375% 29/03/2021 5,110,560 0.50
4,292,000 US$ Hungary Government International Bond 7.625% 29/03/2041 4,480,848 0.44
16,330,668 1.60
India
1,200,000 US$ Bharti Airtel International Netherlands 5.125% 11/03/2023 1,090,560 0.11
1,190,000 US$ Export-Import Bank of India 4% 07/08/2017 1,185,002 0.12
2,370,000 US$ Export-Import Bank of India 4% 14/01/2023 2,107,641 0.20
1,850,000 US$ Suzlon Energy 0% 25/07/2014 1,202,500 0.12
2,000,000 US$ Suzlon Energy FRN 13/04/2016 990,000 0.10
3,200,000 US$ Vedanta Resources 8.25% 07/06/2021 3,224,000 0.31
9,799,703 0.96 The accompanying notes form an integral part of these consolidated financial statements.

Ashmore SICAV – Unaudited Semi-Annual Report for the period ended 30 June 2013
54
Ashmore SICAV Emerging Markets Debt Fund Schedule of Investments (continued) As at 30 June 2013
Holdings
Currency Description of Investment Market Value US$ Net Assets
%
Transferable securities admitted to an official stock exchange listing/dealt on another regulated market (continued)
Bonds (continued)
Indonesia
900,000 US$ Indo Energy Finance II 6.375% 24/01/2023 785,250 0.08
3,216,000 US$ Indonesia Government International Bond 4.875% 05/05/2021 3,296,400 0.32
2,771,000 US$ Indonesia Government International Bond 5.875% 13/03/2020 2,999,607 0.29
1,010,000 US$ Indonesia Government International Bond 6.625% 17/02/2037 1,100,900 0.11
5,522,000 US$ Indonesia Government International Bond 6.875% 17/01/2018 6,198,445 0.60
3,689,000 US$ Indonesia Government International Bond 7.75% 17/01/2038 4,555,915 0.44
4,561,000 US$ Indonesia Government International Bond 8.5% 12/10/2035 5,997,715 0.58
2,949,000 US$ Indonesia Government International Bond 11.625% 04/03/2019 4,010,640 0.39
2,234,000 US$ Majapahit 7.75% 17/10/2016 2,474,155 0.24
2,045,000 US$ Majapahit 7.75% 20/01/2020 2,239,275 0.22
1,788,000 US$ Majapahit 8% 07/08/2019 2,011,500 0.20
5,370,000 US$ Pertamina Persero 5.625% 20/05/2043 4,645,050 0.45
2,701,000 US$ Pertamina Persero 6% 03/05/2042 2,525,435 0.25
900,000 US$ Perusahaan Listrik Negara 5.25% 24/10/2042 747,000 0.07
1,810,000 US$ Perusahaan Listrik Negara 5.5% 22/11/2021 1,773,800 0.17
45,361,087 4.41
Israel
1,900,000 US$ Altice Financing 7.875% 15/12/2019 1,985,500 0.19
2,050,000 US$ Altice Finco 9.875% 15/12/2020 2,193,500 0.21
4,179,000 0.40
Ivory Coast
20,397,000 US$ Ivory Coast Government International Bond Step Cpn 31/12/2032 16,725,540 1.63
16,725,540 1.63
Jamaica
388,000 US$ Digicel 6% 15/04/2021 366,660 0.04
4,650,000 US$ Digicel 8.25% 30/09/2020 4,812,750 0.47
1,350,000 US$ Digicel 10.5% 15/04/2018 1,431,000 0.14
6,610,410 0.65
Kazakhstan
1,281,000 US$ ATF Bank 9% 11/05/2016 1,232,962 0.12
5,165,000 US$ Development Bank of Kazakhstan 4.125% 10/12/2022 4,596,850 0.45
1,750,000 US$ Halyk Savings Bank of Kazakhstan 7.25% 28/01/2021 1,793,750 0.17
2,180,000 US$ KazAgro National Management 4.625% 24/05/2023 2,005,600 0.20
3,680,000 US$ Kazakhstan Temir Zholy Finance 6.375% 06/10/2020 3,974,400 0.39
2,840,000 US$ Kazakhstan Temir Zholy Finance 6.95% 10/07/2042 2,886,292 0.28
1,870,000 US$ Kazatomprom Natsionalnaya Atomnaya Kompaniya AO 6.25% 20/05/2015 1,944,800 0.19
900,000 EUR Kazkommertsbank 6.875% 13/02/2017 1,117,221 0.11
1,300,000 US$ Kazkommertsbank 7.5% 29/11/2016 1,264,250 0.12
500,000 US$ Kazkommertsbank 8% 03/11/2015 497,005 0.05
800,000 US$ Kazkommertsbank 8.5% 11/05/2018 760,000 0.07
1,250,000 US$ KazkommertsbankVia CitiGlobal Markets FRN 07/04/2014 1,253,125 0.12
1,800,000 US$ KazMunayGas National 4.4% 30/04/2023 1,669,500 0.16 The accompanying notes form an integral part of these consolidated financial statements.

Ashmore SICAV – Unaudited Semi-Annual Report for the period ended 30 June 2013
55
Ashmore SICAV Emerging Markets Debt Fund
Schedule of Investments (continued) As at 30 June 2013
Holdings
Currency Description of Investment Market Value US$ Net Assets
%
Transferable securities admitted to an official stock exchange listing/dealt on another regulated market (continued)
Bonds (continued)
Kazakhstan (continued)
5,395,000 US$ KazMunayGas National 5.75% 30/04/2043 4,774,575 0.46
1,130,000 US$ KazMunayGas National 6.375% 09/04/2021 1,226,050 0.12
4,055,000 US$ KazMunayGas National 7% 05/05/2020 4,582,150 0.45
1,110,000 US$ KazMunayGas National 9.125% 02/07/2018 1,329,225 0.13
2,280,000 US$ Samruk-Energy 3.75% 20/12/2017 2,171,700 0.21
1,850,000 US$ Zhaikmunai 7.125% 13/11/2019 1,854,625 0.18
40,934,080 3.98
Latvia
4,832,000 US$ Republic of Latvia 2.75% 12/01/2020 4,469,600 0.43
4,469,600 0.43
Lebanon
1,033,000 US$ Lebanon Government International Bond 5.15% 12/11/2018 986,515 0.10
7,019,000 US$ Lebanon Government International Bond 6.1% 04/10/2022 6,527,670 0.63
3,610,000 US$ Lebanon Government International Bond 6.375% 09/03/2020 3,429,500 0.33
3,326,000 US$ Lebanon Government International Bond 6.6% 27/11/2026 3,093,180 0.30
1,226,000 US$ Lebanon Government International Bond 8.25% 12/04/2021 1,305,690 0.13
380,000 US$ Lebanon Government International Bond 8.5% 19/01/2016 405,650 0.04
15,748,205 1.53
Lithuania
1,818,000 US$ Lithuania Government International Bond 5.125% 14/09/2017 1,944,169 0.19
3,963,000 US$ Lithuania Government International Bond 6.125% 09/03/2021 4,418,745 0.43
6,315,000 US$ Lithuania Government International Bond 6.625% 01/02/2022 7,254,356 0.71
6,471,000 US$ Lithuania Government International Bond 7.375% 11/02/2020 7,684,313 0.75
21,301,583 2.08
Malaysia
1,710,000 US$ Axiata SPV1 Labuan 5.375% 28/04/2020 1,844,787 0.18
2,550,000 US$ Petronas Capital 5.25% 12/08/2019 2,784,230 0.27
990,000 US$ Petronas Capital 7.875% 22/05/2022 1,250,862 0.12
2,285,000 US$ Wakala Global Sukuk 4.646% 06/07/2021 2,396,752 0.23
8,276,631 0.80
Mexico
4,500,000 US$ Cemex Espana Luxembourg 9.25% 12/05/2020 4,747,500 0.46
200,000 US$ Cemex Espana Luxembourg 9.875% 30/04/2019 216,000 0.02
1,800,000 US$ Cemex Finance 9.375% 12/10/2022 1,962,000 0.19
2,150,000 US$ Comision Federal de Electricidad 4.875% 26/05/2021 2,198,375 0.21
2,650,000 US$ Comision Federal de Electricidad 5.75% 14/02/2042 2,451,250 0.24
700,000 US$ Corp GEO 8.875% 27/03/2022 308,000 0.03
1,716,000 US$ Corp GEO FRN 30/06/2020 755,040 0.07
1,944,000 US$ Desarrolladora Homex 9.75% 25/03/2020 660,960 0.06
1,400,000 US$ Grupo Papelero Scribede 8.875% 07/04/2020 1,344,000 0.13
850,000 US$ Grupo Senda Autotransportede 10.5% 03/10/2015 873,375 0.08
264,500,000 MXN Mexican Bonos 5% 15/06/2017 20,334,123 1.98
63,900,000 MXN Mexican Bonos 7.75% 29/05/2031 5,421,428 0.53
45,000,000 MXN Mexican Bonos 8.5% 31/05/2029 4,117,872 0.40
The accompanying notes form an integral part of these consolidated financial statements.

Ashmore SICAV – Unaudited Semi-Annual Report for the period ended 30 June 2013
56
Ashmore SICAV Emerging Markets Debt Fund Schedule of Investments (continued) As at 30 June 2013
Holdings
Currency Description of Investment Market Value US$ Net Assets
%
Transferable securities admitted to an official stock exchange listing/dealt on another regulated market (continued)
Bonds (continued)
Mexico (continued)
137,400,000 MXN Mexican Bonos 10% 20/11/2036 14,042,018 1.37
500,000 US$ Mexico Government International Bond 3.625% 15/03/2022 490,000 0.05
3,042,000 US$ Mexico Government International Bond 4.75% 08/03/2044 2,707,380 0.26
2,428,000 US$ Mexico Government International Bond 5.75% 12/10/2110 2,215,550 0.22
2,126,000 US$ Mexico Government International Bond 5.95% 19/03/2019 2,433,207 0.24
2,208,000 US$ Mexico Government International Bond 6.05% 11/01/2040 2,406,720 0.23
3,673,000 US$ Mexico Government International Bond 6.75% 27/09/2034 4,334,140 0.42
6,086,000 US$ NII Capital 7.625% 01/04/2021 4,731,865 0.46
100,000 US$ NII Capital 8.875% 15/12/2019 84,500 0.01
7,805,000 US$ Oceanografiade 11.25% 15/07/2015 6,497,663 0.63
1,460,000 US$ Pemex Project Funding Master Trust 5.75% 01/03/2018 1,598,700 0.16
1,105,000 US$ Petroleos Mexicanos 5.5% 27/06/2044 994,500 0.10
1,140,000 US$ Petroleos Mexicanos 6% 05/03/2020 1,254,000 0.12
3,205,000 US$ Petroleos Mexicanos 6.5% 02/06/2041 3,309,163 0.32
1,857,000 US$ Petroleos Mexicanos 8% 03/05/2019 2,246,970 0.22
5,036,000 US$ Urbi Desarrollos Urbanos 9.5% 21/01/2020 1,107,920 0.11
4,764,000 US$ Urbi Desarrollos Urbanos 9.75% 03/02/2022 1,048,080 0.10
218,000 US$ Urbi Desarrollos Urbanos FRN 19/04/2016 (Defaulted) 47,960 -
96,940,259 9.42
Mongolia
2,160,000 US$ Mongolia Government International Bond 5.125% 05/12/2022 1,900,800 0.18
4,000,000 US$ Mongolian Mining 8.875% 29/03/2017 3,400,000 0.33
5,300,800 0.51
Morocco
2,990,000 US$ Morocco Government International Bond 4.25% 11/12/2022 2,631,798 0.26
2,300,000 US$ Morocco Government International Bond 5.5% 11/12/2042 1,920,960 0.19
4,552,758 0.45
Nigeria
1,100,000 US$ Afren 10.25% 08/04/2019 1,229,250 0.12
4,200,000 US$ Afren 11.5% 01/02/2016 4,662,000 0.45
2,110,000 US$ Nigeria Government International Bond 6.75% 28/01/2021 2,204,950 0.21
2,326,291 US$ Sea Production FRN 14/02/2014 2,140,188 0.21
10,236,388 0.99
Pakistan
3,162,000 US$ Pakistan Government International Bond 6.875% 01/06/2017 2,940,660 0.29
2,492,000 US$ Pakistan Government International Bond 7.125% 31/03/2016 2,367,400 0.23
3,156,000 US$ Pakistan Mobile Communications 8.625% 13/11/2013 3,140,220 0.31
8,448,280 0.83
Panama
650,000 US$ Panama Government International Bond 4.3% 29/04/2053 521,625 0.05
4,037,000 US$ Panama Government International Bond 6.7% 26/01/2036 4,693,013 0.46
550,000 US$ Panama Government International Bond 7.125% 29/01/2026 672,375 0.07
1,497,000 US$ Panama Government International Bond 8.875% 30/09/2027 2,065,860 0.20
1,503,000 US$ Panama Government International Bond 9.375% 01/04/2029 2,179,350 0.21
10,132,223 0.99 The accompanying notes form an integral part of these consolidated financial statements.

Ashmore SICAV – Unaudited Semi-Annual Report for the period ended 30 June 2013
57
Ashmore SICAV Emerging Markets Debt Fund Schedule of Investments (continued) As at 30 June 2013
Holdings
Currency Description of Investment Market Value US$ Net Assets
%
Transferable securities admitted to an official stock exchange listing/dealt on another regulated market (continued)
Bonds (continued)
Paraguay
2,830,000 US$ Republic of Paraguay 4.625% 25/01/2023 2,730,950 0.27
2,300,000 US$ Telefonica Celular del Paraguay 6.75% 13/12/2022 2,386,250 0.23
5,117,200 0.50
People's Republic of China
186,000 US$ Agile Property 8.875% 28/04/2017 189,720 0.02
1,391,000 US$ Agile Property 9.875% 20/03/2017 1,457,072 0.14
5,448,000 US$ Amber Circle Funding 3.25% 04/12/2022 4,896,537 0.48
470,000 US$ China CITIC Bank International 6.875% 24/06/2020 496,403 0.05
950,000 US$ China Oriental 7% 17/11/2017 874,000 0.08
1,673,000 US$ China Oriental 8% 18/08/2015 1,647,905 0.16
2,320,000 US$ China Railway Resources Huitung 3.85% 05/02/2023 2,078,701 0.20
3,100,000 US$ China Shanshui Cement 10.5% 27/04/2017 3,239,500 0.32
1,950,000 US$ CNPC General Capital 3.4% 16/04/2023 1,790,611 0.17
2,360,000 US$ CNPC HK Overseas Capital 5.95% 28/04/2041 2,550,207 0.25
1,200,000 US$ Country Garden 7.5% 10/01/2023 1,098,000 0.11
176,000 US$ Country Garden 10.5% 11/08/2015 187,464 0.02
900,000 US$ Country Garden 11.125% 23/02/2018 976,500 0.09
195,000 US$ Country Garden 11.25% 22/04/2017 212,062 0.02
12,250,000 CNH Evergrande Real Estate 7.5% 19/01/2014 1,975,907 0.19
19,400,000 CNH Evergrande Real Estate 9.25% 19/01/2016 2,925,330 0.28
3,047,000 US$ Evergrande Real Estate 13% 27/01/2015 3,138,410 0.31
1,617,000 US$ Fosun International 7.5% 12/05/2016 1,633,170 0.16
2,130,000 US$ Franshion Development 6.75% 15/04/2021 2,076,750 0.20
1,700,000 US$ Gemdale International Investment 7.125% 16/11/2017 1,662,354 0.16
3,350,000 US$ Hidili Industry International Development 8.625% 04/11/2015 2,562,750 0.25
1,600,000 US$ Longfor Properties 9.5% 07/04/2016 1,716,000 0.17
3,910,000 US$ Sinochem Overseas Capital 4.5% 12/11/2020 3,854,892 0.37
1,110,000 US$ Sinochem Overseas Capital 6.3% 12/11/2040 1,100,306 0.11
1,740,000 US$ Sinopec Overseas Development 2012 4.875% 17/05/2042 1,612,545 0.16
3,800,000 US$ Sunac China 9.375% 05/04/2018 3,658,997 0.36
1,250,000 US$ Sunac China 12.5% 16/10/2017 1,331,583 0.13
1,750,000 US$ Yanlord Land 9.5% 04/05/2017 1,811,250 0.18
1,600,000 US$ Yanlord Land 10.625% 29/03/2018 1,676,000 0.16
54,430,926 5.30
Peru
903,000 US$ Peruvian Government International Bond 7.125% 30/03/2019 1,092,630 0.11
6,228,000 US$ Peruvian Government International Bond 7.35% 21/07/2025 7,971,840 0.78
4,234,000 US$ Peruvian Government International Bond 8.75% 21/11/2033 6,160,470 0.60
15,224,940 1.49
Philippines
2,360,000 US$ Development Bank of the Philippines 5.5% 25/03/2021 2,548,361 0.25
5,821,000 US$ Philippine Government International Bond 4% 15/01/2021 6,155,708 0.60
970,000 US$ Philippine Government International Bond 5.5% 30/03/2026 1,105,800 0.11 The accompanying notes form an integral part of these consolidated financial statements.

Ashmore SICAV – Unaudited Semi-Annual Report for the period ended 30 June 2013
58
Ashmore SICAV Emerging Markets Debt Fund Schedule of Investments (continued) As at 30 June 2013
Holdings
Currency Description of Investment Market Value US$ Net Assets
%
Transferable securities admitted to an official stock exchange listing/dealt on another regulated market (continued)
Bonds (continued)
Philippines (continued)
4,252,000 US$ Philippine Government International Bond 7.75% 14/01/2031 5,612,640 0.55
1,882,000 US$ Philippine Government International Bond 8.375% 17/06/2019 2,437,190 0.24
4,552,000 US$ Philippine Government International Bond 9.5% 02/02/2030 6,828,000 0.66
1,796,000 US$ Philippine Government International Bond 10.625% 16/03/2025 2,846,660 0.28
400,000 US$ Power Sector Assets & Liabilities Management 7.25% 27/05/2019 469,000 0.05
3,965,000 US$ Power Sector Assets & Liabilities Management 7.39% 02/12/2024 4,797,650 0.47
32,801,009 3.21
Poland
761,114 US$ CEDC FinanceInternational 10% 30/04/2018 545,110 0.05
1,768,033 US$ CEDC FinanceInternational Step Cpn 30/04/2018 1,563,648 0.15
2,200,000 US$ Eileme 2 11.625% 31/01/2020 2,486,000 0.24
2,800,000 EUR Eileme 2 11.75% 31/01/2020 4,130,924 0.40
7,008,000 US$ Poland Government International Bond 5% 23/03/2022 7,533,600 0.73
4,092,000 US$ Poland Government International Bond 6.375% 15/07/2019 4,772,541 0.46
4,382,000 US$ Poland Government International Bond 3% 17/03/2023 3,954,755 0.38
1,109,000 EUR Polish Television Step Cpn 15/05/2017 1,491,987 0.15
26,478,565 2.56
Qatar
213,000 US$ Qatar Government International Bond 5.75% 20/01/2042 228,975 0.02
1,355,000 US$ Qatar Government International Bond 6.4% 20/01/2040 1,588,737 0.15
1,000,000 US$ Qtel International Finance 3.875% 31/01/2028 875,000 0.09
1,300,000 US$ Qtel International Finance 4.5% 31/01/2043 1,124,760 0.11
4,769,000 US$ Qtel International Finance 7.875% 10/06/2019 5,853,948 0.57
9,671,420 0.94
Romania
8,386,000 US$ Romanian Government International Bond 4.375% 22/08/2023 7,966,868 0.77
10,408,000 US$ Romanian Government International Bond 6.75% 07/02/2022 11,603,359 1.13
19,570,227 1.90
Russian Federation
1,650,000 US$ Alfa BankVia Alfa Bond Issuance 7.5% 26/09/2019 1,683,000 0.16
1,700,000 US$ Brunswick Rail Finance 6.5% 01/11/2017 1,683,000 0.16
3,300,000 US$ Credit Bank of Moscow Via CBOM Finance 7.7% 01/02/2018 3,349,500 0.33
2,700,000 US$ Evraz 6.75% 27/04/2018 2,585,250 0.25
2,354,000 US$ Evraz 9.5% 24/04/2018 2,495,240 0.24
3,750,000 US$ Far East Capital 8% 02/05/2018 3,459,375 0.34
1,950,000 US$ Far East Capital 8.75% 02/05/2020 1,784,250 0.17
2,190,000 US$ Gazprom NeftVia GPN Capital 4.375% 19/09/2022 2,005,711 0.20
1,050,000 US$ GazpromVia Gaz Capital 4.95% 06/02/2028 903,000 0.09
2,180,000 US$ GazpromVia Gaz Capital 6.51% 07/03/2022 2,305,350 0.22
1,050,000 US$ GazpromVia Gaz Capital 8.625% 28/04/2034 1,244,250 0.12
750,000 US$ Metalloinvest Finance 6.5% 21/07/2016 772,500 0.08
4,464,000 US$ MTS International Funding 8.625% 22/06/2020 5,245,200 0.51
1,700,000 US$ PromsvyazbankVia PSB Finance 8.5% 25/04/2017 1,792,089 0.17
1,500,000 US$ PromsvyazbankVia PSB Finance 10.2% 06/11/2019 1,575,000 0.15
3,071,000 US$ Rosneft Oilvia Rosneft International Finance 4.199% 06/03/2022 2,845,281 0.28 The accompanying notes form an integral part of these consolidated financial statements.

Ashmore SICAV – Unaudited Semi-Annual Report for the period ended 30 June 2013
59
Ashmore SICAV Emerging Markets Debt Fund Schedule of Investments (continued) As at 30 June 2013
Holdings
Currency Description of Investment Market Value US$ Net Assets
%
Transferable securities admitted to an official stock exchange listing/dealt on another regulated market (continued)
Bonds (continued)
Russian Federation (continued)
518,360,000 RUB Russian Federal Bond - OFZ 6.8% 11/12/2019 15,474,376 1.50
1,100,000 US$ Russian Foreign Bond - Eurobond 5% 29/04/2020 1,177,000 0.11
1,200,000 US$ Russian Foreign Bond - Eurobond 5.625% 04/04/2042 1,245,000 0.12
14,667,531 US$ Russian Foreign Bond - Eurobond Step Cpn 31/03/2030 17,179,346 1.67
3,050,000 US$ Russian Standard Bank Via Russian Standard Finance 9.25% 11/07/2017 3,156,902 0.31
1,490,000 US$ Sberbank of Russia Via SB Capital 5.25% 23/05/2023 1,400,600 0.14
1,510,000 US$ Sberbank of Russia Via SB Capital 5.717% 16/06/2021 1,540,200 0.15
2,455,000 US$ Sberbank of Russia Via SB Capital 6.125% 07/02/2022 2,562,283 0.25
1,000,000 US$ SeverstalVia Steel Capital 5.9% 17/10/2022 912,500 0.09
700,000 US$ SeverstalVia Steel Capital 6.7% 25/10/2017 719,775 0.07
5,100,000 US$ TMKVia TMK Capital 7.75% 27/01/2018 5,100,000 0.49
2,066,000 US$ VEB-Leasing Via VEB Leasing Investment 5.125% 27/05/2016 2,146,057 0.21
1,000,000 US$ Vimpel Communications Via VIP Finance Ireland 7.748% 02/02/2021 1,066,250 0.10
5,600,000 US$ VimpelCom 7.504% 01/03/2022 5,796,000 0.56
1,839,000 US$ Vnesheconombank Via VEB Finance 5.45% 22/11/2017 1,912,560 0.19
3,961,000 US$ Vnesheconombank Via VEB Finance 6.8% 22/11/2025 4,218,465 0.41
7,484,000 US$ Vnesheconombank Via VEB Finance 6.902% 09/07/2020 8,213,690 0.80
885,000 US$ VTB BankVia VTB Capital 6% 12/04/2017 920,400 0.09
2,278,000 US$ VTB BankVia VTB Capital 6.875% 29/05/2018 2,414,680 0.23
112,884,080 10.96
Senegal
2,480,000 US$ Senegal Government International Bond 8.75% 13/05/2021 2,579,200 0.25
2,579,200 0.25
Serbia
3,157,000 US$ Republic of Serbia 4.875% 25/02/2020 2,872,870 0.28
4,134,000 US$ Republic of Serbia 7.25% 28/09/2021 4,258,020 0.41
7,130,890 0.69
Singapore
1,050,000 US$ MMI International 8% 01/03/2017 1,055,250 0.10
1,055,250 0.10
South Africa
1,700,000 EUR Edcon Pty 9.5% 01/03/2018 2,047,329 0.20
1,800,000 EUR Edcon Pty FRN 15/06/2015 2,047,264 0.20
400,000 US$ Sappi Papier 6.625% 15/04/2021 388,000 0.04
600,000 US$ Sappi Papier 7.75% 15/07/2017 633,000 0.06
800,000 US$ Sappi Papier 8.375% 15/06/2019 844,000 0.08
3,340,000 US$ South Africa Government International Bond 5.5% 09/03/2020 3,519,525 0.34
3,607,000 US$ South Africa Government International Bond 5.875% 30/05/2022 3,859,490 0.38
1,156,000 US$ South Africa Government International Bond 6.25% 08/03/2041 1,236,920 0.12
4,233,000 US$ South Africa Government International Bond 6.875% 27/05/2019 4,793,872 0.47
19,369,400 1.89
Sri Lanka
2,042,000 US$ Bank of Ceylon 6.875% 03/05/2017 2,062,420 0.20
1,110,000 US$ Sri Lanka Government International Bond 5.875% 25/07/2022 1,048,950 0.10
2,396,000 US$ Sri Lanka Government International Bond 6.25% 04/10/2020 2,372,040 0.23 The accompanying notes form an integral part of these consolidated financial statements.

Ashmore SICAV – Unaudited Semi-Annual Report for the period ended 30 June 2013
60
Ashmore SICAV Emerging Markets Debt Fund Schedule of Investments (continued) As at 30 June 2013
Holdings
Currency Description of Investment Market Value US$ Net Assets
%
Transferable securities admitted to an official stock exchange listing/dealt on another regulated market (continued)
Bonds (continued)
Sri Lanka (continued)
2,300,000 US$ Sri Lanka Government International Bond 6.25% 27/07/2021 2,265,500 0.22
820,000 US$ Sri Lanka Government International Bond 7.4% 22/01/2015 865,100 0.08
8,614,010 0.83
Turkey
4,127,000 US$ Turkey Government International Bond 3.25% 23/03/2023 3,600,807 0.35
2,730,000 US$ Turkey Government International Bond 4.875% 16/04/2043 2,347,800 0.23
1,320,000 US$ Turkey Government International Bond 5.625% 30/03/2021 1,409,100 0.14
3,786,000 US$ Turkey Government International Bond 6% 14/01/2041 3,776,535 0.37
1,500,000 US$ Turkey Government International Bond 6.25% 26/09/2022 1,661,250 0.16
7,156,000 US$ Turkey Government International Bond 6.75% 03/04/2018 8,032,610 0.78
2,128,000 US$ Turkey Government International Bond 6.75% 30/05/2040 2,351,440 0.23
3,391,000 US$ Turkey Government International Bond 6.875% 17/03/2036 3,780,965 0.37
2,173,000 US$ Turkey Government International Bond 7% 26/09/2016 2,426,372 0.24
1,750,000 US$ Turkey Government International Bond 7% 11/03/2019 2,003,750 0.19
645,000 US$ Turkey Government International Bond 7% 05/06/2020 744,975 0.07
1,280,000 US$ Turkey Government International Bond 7.25% 05/03/2038 1,491,200 0.15
5,233,000 US$ Turkey Government International Bond 7.375% 05/02/2025 6,201,105 0.60
2,321,000 US$ Turkey Government International Bond 7.5% 14/07/2017 2,663,347 0.26
970,000 US$ Turkey Government International Bond 7.5% 07/11/2019 1,144,600 0.11
1,440,000 US$ Turkey Government International Bond 8% 14/02/2034 1,792,800 0.17
900,000 US$ Turkey Government International Bond 11.875% 15/01/2030 1,507,500 0.15
46,936,156 4.57
Ukraine
3,700,000 US$ DTEK Finance 7.875% 04/04/2018 3,450,250 0.34
4,550,000 US$ Ferrexpo Finance 7.875% 07/04/2016 4,199,058 0.41
5,022,000 US$ Metinvest 8.75% 14/02/2018 4,670,460 0.45
1,900,000 US$ Metinvest 10.25% 20/05/2015 1,923,750 0.19
4,500,000 US$ MHP 8.25% 02/04/2020 3,967,425 0.39
3,600,000 US$ Mriya Agro 9.45% 19/04/2018 3,204,000 0.31
5,050,000 US$ NationalNaftogaz of Ukraine 9.5% 30/09/2014 5,037,375 0.49
3,710,000 US$ Oschadbank Via SSB #1 8.25% 10/03/2016 3,456,607 0.34
2,670,000 US$ Oschadbank Via SSB #1 8.875% 20/03/2018 2,397,633 0.23
1,550,000 US$ Privatbank CJSC Via UK SPV Credit Finance 9.375% 23/09/2015 1,441,500 0.14
2,452,000 US$ State Export-Import Bank of Ukrainevia Biz Finance 8.75% 22/01/2018 2,157,760 0.21
1,920,000 US$ Ukraine Government International Bond 6.25% 17/06/2016 1,780,800 0.17
2,600,000 US$ Ukraine Government International Bond 7.5% 17/04/2023 2,281,500 0.22
2,267,000 US$ Ukraine Government International Bond 7.75% 23/09/2020 2,068,637 0.20
8,525,000 US$ Ukraine Government International Bond 7.8% 28/11/2022 7,608,563 0.74
3,446,000 US$ Ukraine Government International Bond 7.95% 23/02/2021 3,170,320 0.31
11,377,000 US$ Ukraine Government International Bond 9.25% 24/07/2017 11,348,558 1.10
1,250,000 US$ Ukraine Railways via Shortline 9.5% 21/05/2018 1,128,125 0.11
1,800,000 US$ Ukrlandfarming 10.875% 26/03/2018 1,701,000 0.17
66,993,321 6.52 The accompanying notes form an integral part of these consolidated financial statements.

Ashmore SICAV – Unaudited Semi-Annual Report for the period ended 30 June 2013
61
Ashmore SICAV Emerging Markets Debt Fund Schedule of Investments (continued) As at 30 June 2013
Holdings
Currency Description of Investment Market Value US$ Net Assets
%
Transferable securities admitted to an official stock exchange listing/dealt on another regulated market (continued)
Bonds (continued)
United Arab Emirates
3,050,000 US$ Atlantic Finance Step Cpn 27/05/2014 3,240,625 0.32
1,267,080 US$ Dana Gas Sukuk 7% 31/10/2017 1,163,192 0.11
1,267,080 US$ Dana Gas Sukuk 9% 31/10/2017 1,214,838 0.12
2,330,000 US$ DEWA Sukuk 2013 3% 05/03/2018 2,271,750 0.22
2,045,711 US$ Dolphin Energy 5.888% 15/06/2019 2,229,825 0.22
6,280,000 US$ DP World 6.85% 02/07/2037 6,484,100 0.63
4,600,000 EUR Dubai Commercial Operations MTN 4.75% 30/01/2014 5,949,414 0.58
1,900,000 GBP Dubai Commercial Operations MTN 6% 01/02/2017 2,795,278 0.27
430,000 US$ Dubai DOF Sukuk 6.45% 02/05/2022 452,575 0.04
3,690,000 US$ Dubai Electricity & Water Authority 7.375% 21/10/2020 4,132,800 0.40
1,000,000 US$ Emaar Sukuk 6.4% 18/07/2019 1,025,000 0.10
2,141,000 US$ Emirate of Dubai Government International Bonds 5.25% 30/01/2043 1,809,145 0.18
3,461,000 US$ Emirate of Dubai Government International Bonds 7.75% 05/10/2020 3,997,455 0.39
1,970,000 US$ Emirates Airline 4.5% 06/02/2025 1,802,944 0.18
2,230,000 US$ Emirates Airline 5.125% 08/06/2016 2,291,325 0.22
3,260,000 US$ Jafz Sukuk 7% 19/06/2019 3,488,200 0.34
500,000 US$ Pyrus 7.5% 20/12/2015 629,000 0.06
44,977,466 4.38
Uruguay
3,316,585 US$ Uruguay Government International Bond 4.125% 20/11/2045 2,703,017 0.26
2,740,781 US$ Uruguay Government International Bond 7.625% 21/03/2036 3,460,236 0.34
4,426,263 US$ Uruguay Government International Bond 8% 18/11/2022 5,583,731 0.54
4,311,470 US$ Uruguay Government International Bond PIK 15/01/2033 5,475,567 0.53
17,222,551 1.67
Venezuela
2,500,000 US$ Petroleos de Venezuela 5.25% 12/04/2017 2,037,500 0.20
5,299,000 US$ Petroleos de Venezuela 5.375% 12/04/2027 3,205,895 0.31
1,906,000 US$ Petroleos de Venezuela 5.5% 12/04/2037 1,124,540 0.11
1,684,000 US$ Petroleos de Venezuela 12.75% 17/02/2022 1,692,420 0.16
2,194,000 US$ Venezuela Government International Bond 6% 09/12/2020 1,601,620 0.16
1,615,000 US$ Venezuela Government International Bond 7.65% 21/04/2025 1,203,175 0.12
3,111,000 US$ Venezuela Government International Bond 7.75% 13/10/2019 2,582,130 0.25
2,478,000 US$ Venezuela Government International Bond 8.25% 13/10/2024 1,920,450 0.19
2,627,000 US$ Venezuela Government International Bond 8.5% 08/10/2014 2,607,297 0.25
2,693,000 US$ Venezuela Government International Bond 9% 07/05/2023 2,241,922 0.22
400,000 US$ Venezuela Government International Bond 9.25% 15/09/2027 338,000 0.03
3,657,000 US$ Venezuela Government International Bond 9.25% 15/09/2027 - Eurotlx 3,090,165 0.30
2,970,000 US$ Venezuela Government International Bond 9.25% 07/05/2028 2,420,550 0.24
955,000 US$ Venezuela Government International Bond 10.75% 19/09/2013 957,387 0.09
10,163,000 US$ Venezuela Government International Bond 11.75% 21/10/2026 9,654,850 0.94
11,683,200 US$ Venezuela Government International Bond 11.95% 05/08/2031 11,157,456 1.09
3,273,000 US$ Venezuela Government International Bond 12.75% 23/08/2022 3,354,825 0.33
51,190,182 4.99 The accompanying notes form an integral part of these consolidated financial statements.

Ashmore SICAV – Unaudited Semi-Annual Report for the period ended 30 June 2013
62
Ashmore SICAV Emerging Markets Debt Fund Schedule of Investments (continued) As at 30 June 2013
Holdings
Currency Description of Investment Market Value US$ Net Assets
%
Transferable securities admitted to an official stock exchange listing/dealt on another regulated market (continued)
Bonds (continued)
Vietnam
3,868,000 US$ Vietnam Government International Bond 6.75% 29/01/2020 4,100,080 0.40
1,670,000 US$ Vietnam Government International Bond 6.875% 15/01/2016 1,761,850 0.17
1,000,000 US$ Vietnam Joint Stock Commercial Bank for Industry and Trade 8% 17/05/2017 1,015,000 0.10
6,876,930 0.67
Zambia
1,780,000 US$ Zambia Government International Bond 5.375% 20/09/2022 1,584,200 0.15
1,584,200 0.15
Total bonds 1,100,489,482 107.03
Equities
Hong Kong
2,655,631 US$ Emerald Plantation Holdings 690,464 0.07
690,464 0.07
Kazakhstan
144,200 US$ BTA Bank GDR 142,758 0.01
142,758 0.01
Total equities 833,222 0.08
Total transferable securities admitted to an official stock exchange listing / dealt on another regulated market 1,101,322,704 107.11
Other transferable securities and money market instruments
Bonds
Hong Kong
2,626,018 US$ Emerald Plantation 6% 30/01/2020 1,575,611 0.15
702,000 US$ Sino-Forest Corporation Claim 4.25% 15/12/2016 - -
4,761,000 US$ Sino-Forest Corporation Claim 4.25% 15/02/2016 144A - -
6,140,000 US$ Sino-Forest Corporation Claim 6.25% 21/10/2017 - -
614,000 US$ Sino-Forest Corporation Claim 6.25% 21/10/2017 144A - -
3,157,000 US$ Sino-Forest Corporation Claim 10.25% 28/07/2014 - -
396,000 US$ Sino-Forest Corporation Claim 10.25% 28/07/2014 144A - -
1,575,611 0.15
Iraq
7,883,000 US$ Republic of Iraq 5.8% 15/01/2028 6,542,890 0.64
6,542,890 0.64
Nigeria
4,300,000 US$ Sea Trucks 9% 26/03/2018 4,160,250 0.40
4,160,250 0.40
People's Republic of China
1,100,000 US$ Far East Energy Bermuda PIK 15/01/2016 1,100,000 0.11
1,100,000 0.11 The accompanying notes form an integral part of these consolidated financial statements.

Ashmore SICAV – Unaudited Semi-Annual Report for the period ended 30 June 2013
63
Ashmore SICAV Emerging Markets Debt Fund Schedule of Investments (continued) As at 30 June 2013
Holdings
Currency Description of Investment Market Value US$ Net Assets
%
Other transferable securities and money market instruments (continued)
Bonds (continued)
Russian Federation
2,905,000 US$ Ritekro FRN 01/11/2022 1,077,755 0.10
1,077,755 0.10
Total bonds 14,456,506 1.40
Loan participations
Georgia
1,019,974 US$ Ashmore Cayman SPC 2 Limited - TBC Bank Segregated Portfolio PPN/PIK 2,172,418 0.21
2,172,418 0.21
Russia
10,000,000 US$ Marta 1Yr Loan 24% 31/12/2009 * - -
175,926 US$ Snegiri Convertible Loan 30/09/2014 - -
- -
Singapore
1,559,694 US$ Rubicon Offshore International 30% PIK Loan Rolled Up 15/12/2013 1,559,694 0.15
1,559,694 0.15
Total loan participations 3,732,112 0.36
Equities
Russian Federation
29,050 US$ Ritekro Ltd - Ordinary Shares - - - -
Total equities - -
Warrants and rights
People's Republic of China
1,028,251 US$ Far East Energy 15/01/2018 192,283 0.02
192,283 0.02
Total warrants and rights 192,283 0.02
Total other transferable securities and money market instruments 18,380,901 1.78
Written options 7,000,000 EUR Currency PUT option EUR/USD 1.27 European 18/09/2013 (Bank of
America) 75,006 0.01
6,710,000 EUR Currency PUT option EUR/USD 1.31 European 12/07/2013 (Bank of America)
94,376 0.01
169,382 0.02
Total written options 169,382 0.02
Total investment portfolio 1,119,872,987 108.91
Cash at bank 68,924,261 6.70
Other assets and liabilities (160,548,018)
(15.61)
Total net assets 1,028,249,230 100.00
* Asset in default but not permanently impaired pending ongoing negotiation. The accompanying notes form an integral part of these consolidated financial statements.

Ashmore SICAV – Unaudited Semi-Annual Report for the period ended 30 June 2013
64
Ashmore SICAV Emerging Markets Sovereign Debt Fund Schedule of Investments As at 30 June 2013
Holdings
Currency Description of Investment Market Value
US$ Net Assets
%
Transferable securities admitted to an official stock exchange listing / dealt on another regulated market
Bonds
Argentina
1,550,000 US$ Argentina Boden Bonds 7% 03/10/2015 1,344,625 1.10
519,649 US$ Argentine Republic Government International Bond 8.28% 31/12/2033 284,508 0.23
1,403,053 US$ Argentine Republic Government International Bond 8.28% Discount 31/12/2033 789,217 0.65
424,000 US$ Argentine Republic Government International Bond 8.75% 02/06/2017 321,180 0.26
299,000 US$ Argentine Republic Government International Bond Step Cpn 31/12/2038 97,175 0.08
2,836,705 2.32
Azerbaijan
970,000 US$ State Oil Co of the Azerbaijan Republic 4.75% 13/03/2023 877,850 0.72
620,000 US$ State Oil Co of the Azerbaijan Republic 5.45% 09/02/2017 637,050 0.52
1,514,900 1.24
Belarus
1,040,000 US$ Republic of Belarus 8.75% 03/08/2015 1,042,600 0.86
910,000 US$ Republic of Belarus 8.95% 26/01/2018 907,725 0.75
1,950,325 1.61
Bolivia
860,000 US$ Bolivian Government International Bond 4.875% 29/10/2022 804,100 0.66
804,100 0.66
Brazil
360,000 US$ Banco Nacional de Desenvolvimento Economico e Social 5.5% 12/07/2020 371,700 0.31
635,000 US$ Banco Nacional de Desenvolvimento Economico e Social 6.5% 10/06/2019 692,150 0.57
400,000 US$ Brazilian Government International Bond 2.625% 05/01/2023 348,000 0.29
1,180,000 US$ Brazilian Government International Bond 4.875% 22/01/2021 1,259,650 1.03
285,000 US$ Brazilian Government International Bond 5.875% 15/01/2019 324,615 0.27
739,000 US$ Brazilian Government International Bond 8.25% 20/01/2034 979,175 0.80
263,000 US$ Brazilian Government International Bond 8.875% 15/04/2024 362,940 0.30
525,000 US$ Brazilian Government International Bond 10.125% 15/05/2027 813,750 0.67
5,151,980 4.24
Chile
250,000 US$ Banco del Estado de Chile 3.875% 08/02/2022 242,453 0.20
650,000 US$ Banco del Estado de Chile 4.125% 07/10/2020 651,860 0.54
250,000 US$ Chile Government International Bond 3.25% 14/09/2021 250,000 0.21
150,000 US$ Corp Nacional del Cobre de Chile 3.75% 04/11/2020 145,971 0.12
100,000 US$ Corp Nacional del Cobre de Chile 3.875% 03/11/2021 97,536 0.08
330,000 US$ Corp Nacional del Cobre de Chile 7.5% 15/01/2019 394,726 0.32
40,000 US$ Empresa Nacional del Petroleo 5.25% 10/08/2020 40,570 0.03
1,823,116 1.50
Colombia
680,000 US$ Colombia Government International Bond 4.375% 12/07/2021 708,220 0.58
1,352,000 US$ Colombia Government International Bond 6.125% 18/01/2041 1,504,100 1.24
815,000 US$ Colombia Government International Bond 7.375% 18/03/2019 991,040 0.81
670,000 US$ Colombia Government International Bond 7.375% 18/09/2037 855,925 0.70
240,000 US$ Colombia Government International Bond 8.125% 21/05/2024 318,000 0.26
202,000 US$ Colombia Government International Bond 11.75% 25/02/2020 297,950 0.24
4,675,235 3.83
The accompanying notes form an integral part of these consolidated financial statements.

Ashmore SICAV – Unaudited Semi-Annual Report for the period ended 30 June 2013
65
Ashmore SICAV Emerging Markets Sovereign Debt Fund Schedule of Investments (continued) As at 30 June 2013
Holdings
Currency Description of Investment Market Value
US$ Net Assets
%
Transferable securities admitted to an official stock exchange listing / dealt on another regulated market (continued)
Bonds (continued)
Costa Rica
740,000 US$ Costa Rica Government International Bond 4.25% 26/01/2023 684,500 0.56
200,000 US$ Costa Rica Government International Bond 4.375% 30/04/2025 183,500 0.15
200,000 US$ Costa Rica Government International Bond 5.625% 30/04/2043 181,000 0.15
200,000 US$ Instituto Costarricense de Electricidad 6.375% 15/05/2043 181,250 0.15
1,230,250 1.01
Croatia
350,000 US$ Croatia Government International Bond 6.25% 27/04/2017 366,944 0.30
690,000 US$ Croatia Government International Bond 6.375% 24/03/2021 721,913 0.59
1,340,000 US$ Croatia Government International Bond 6.625% 14/07/2020 1,421,097 1.17
520,000 US$ Croatia Government International Bond 6.75% 05/11/2019 555,058 0.46
3,065,012 2.52
Dominican Republic
610,000 US$ Dominican Republic International Bond 5.875% 18/04/2024 587,125 0.48
710,000 US$ Dominican Republic International Bond 7.5% 06/05/2021 765,025 0.63
1,352,150 1.11
Ecuador
200,000 US$ Ecuador Government International Bond 9.375% 15/12/2015 207,500 0.17
207,500 0.17
Egypt
230,000 US$ Egypt Government International Bond 5.75% 29/04/2020 180,596 0.15
360,000 US$ Egypt Government International Bond 6.875% 30/04/2040 255,672 0.21
436,268 0.36
El Salvador
295,000 US$ El Salvador Government International Bond 5.875% 30/01/2025 286,888 0.24
300,000 US$ El Salvador Government International Bond 7.375% 01/12/2019 330,750 0.27
340,000 US$ El Salvador Government International Bond 7.625% 01/02/2041 330,650 0.27
60,000 US$ El Salvador Government International Bond 7.65% 15/06/2035 58,650 0.05
253,000 US$ El Salvador Government International Bond 8.25% 10/04/2032 263,753 0.22
1,270,691 1.05
Gabon
200,000 US$ Gabonese Republic 8.2% 12/12/2017 225,000 0.18
225,000 0.18
Georgia
60,000 US$ Georgia Government International Bond 6.875% 12/04/2021 64,200 0.05
510,000 US$ Georgian Railway JSC 7.75% 11/07/2022 551,157 0.45
615,357 0.50
Ghana
510,000 US$ Republic of Ghana 8.5% 04/10/2017 538,050 0.44
538,050 0.44
Guatemala
740,000 US$ Guatemala Government Bond 4.875% 13/02/2028 669,700 0.55
669,700 0.55 The accompanying notes form an integral part of these consolidated financial statements.

Ashmore SICAV – Unaudited Semi-Annual Report for the period ended 30 June 2013
66
Ashmore SICAV Emerging Markets Sovereign Debt Fund
Schedule of Investments (continued) As at 30 June 2013
Holdings
Currency Description of Investment Market Value
US$ Net Assets
%
Transferable securities admitted to an official stock exchange listing / dealt on another regulated market (continued)
Bonds (continued)
Hungary
430,000 US$ Hungary Government International Bond 5.375% 21/02/2023 413,875 0.34
542,000 US$ Hungary Government International Bond 6.25% 29/01/2020 566,390 0.46
726,000 US$ Hungary Government International Bond 6.375% 29/03/2021 755,040 0.62
818,000 US$ Hungary Government International Bond 7.625% 29/03/2041 853,992 0.70
2,589,297 2.12
India
202,000 US$ Export-Import Bank of India 4% 14/01/2023 179,639 0.15
179,639 0.15
Indonesia
50,000 US$ Indonesia Government International Bond 4.875% 05/05/2021 51,250 0.04
225,000 US$ Indonesia Government International Bond 5.875% 13/03/2020 243,563 0.20
370,000 US$ Indonesia Government International Bond 6.625% 17/02/2037 403,300 0.33
345,000 US$ Indonesia Government International Bond 6.875% 17/01/2018 387,263 0.32
456,000 US$ Indonesia Government International Bond 7.75% 17/01/2038 563,160 0.46
365,000 US$ Indonesia Government International Bond 8.5% 12/10/2035 479,975 0.39
100,000 US$ Indonesia Government International Bond 10.375% 04/05/2014 106,550 0.09
660,000 US$ Indonesia Government International Bond 11.625% 04/03/2019 897,600 0.74
320,000 US$ Majapahit Holding BV 7.75% 17/10/2016 354,400 0.29
180,000 US$ Majapahit Holding BV 7.75% 20/01/2020 197,100 0.17
330,000 US$ Majapahit Holding BV 8% 07/08/2019 371,250 0.31
780,000 US$ Pertamina Persero PT 5.625% 20/05/2043 674,700 0.55
1,370,000 US$ Pertamina Persero PT 6% 03/05/2042 1,280,950 1.05
35,000 US$ Perusahaan Listrik Negara PT 5.25% 24/10/2042 29,050 0.02
1,060,000 US$ Perusahaan Listrik Negara PT 5.5% 22/11/2021 1,038,800 0.85
7,078,911 5.81
Ivory Coast
2,805,000 US$ Ivory Coast Government International Bond Step Coupon 31/12/2032 2,300,100 1.89
2,300,100 1.89
Kazakhstan
810,000 US$ Development Bank of Kazakhstan JSC 4.125% 10/12/2022 720,900 0.59
600,000 US$ Kazakhstan Temir Zholy Finance BV 6.375% 06/10/2020 648,000 0.53
376,000 US$ Kazakhstan Temir Zholy Finance BV 6.95% 10/07/2042 382,129 0.31
380,000 US$ Kazatomprom Natsionalnaya Atomnaya Kompaniya AO 6.25% 20/05/2015 395,200 0.33
440,000 US$ KazMunayGas National Co JSC 4.4% 30/04/2023 408,100 0.33
500,000 US$ KazMunayGas National Co JSC 5.75% 30/04/2043 442,500 0.36
260,000 US$ KazMunayGas National Co JSC 7% 05/05/2020 293,800 0.24
440,000 US$ KazMunayGas National Co JSC 9.125% 02/07/2018 526,900 0.43
436,000 US$ KazMunayGas National Co JSC 11.75% 23/01/2015 493,770 0.41
4,311,299 3.53 The accompanying notes form an integral part of these consolidated financial statements.
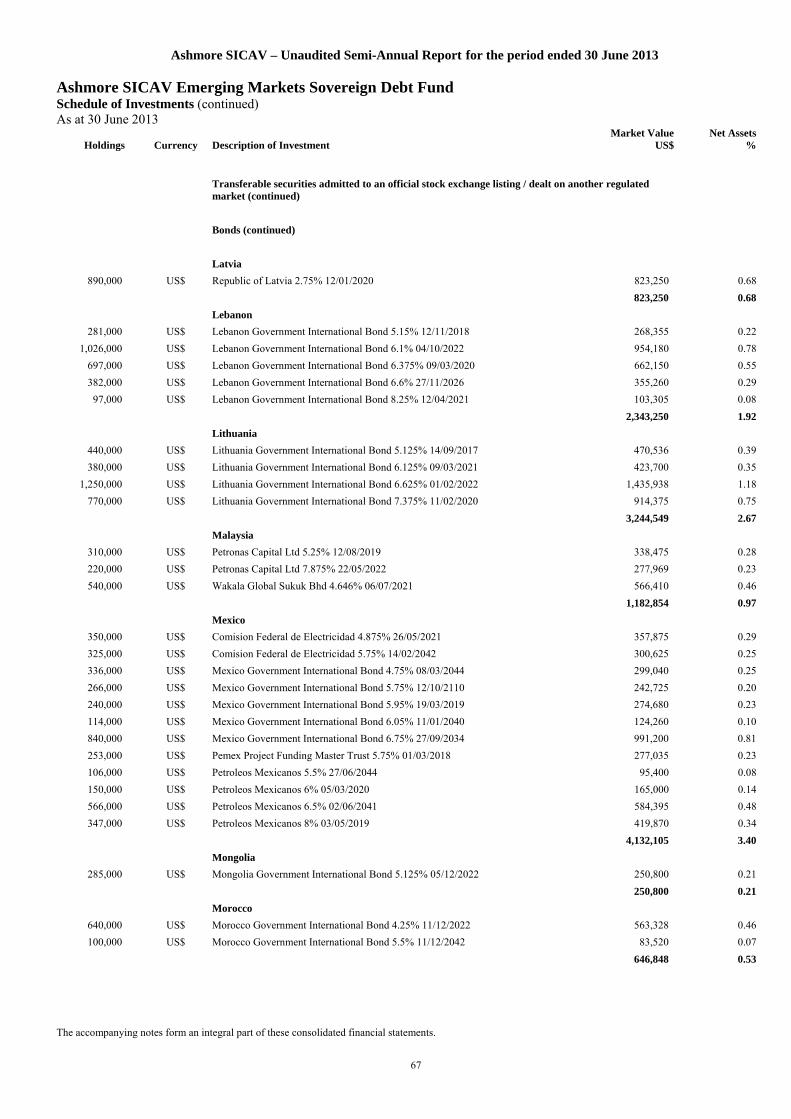
Ashmore SICAV – Unaudited Semi-Annual Report for the period ended 30 June 2013
67
Ashmore SICAV Emerging Markets Sovereign Debt Fund Schedule of Investments (continued) As at 30 June 2013
Holdings
Currency Description of Investment Market Value
US$ Net Assets
%
Transferable securities admitted to an official stock exchange listing / dealt on another regulated market (continued)
Bonds (continued)
Latvia
890,000 US$ Republic of Latvia 2.75% 12/01/2020 823,250 0.68
823,250 0.68
Lebanon
281,000 US$ Lebanon Government International Bond 5.15% 12/11/2018 268,355 0.22
1,026,000 US$ Lebanon Government International Bond 6.1% 04/10/2022 954,180 0.78
697,000 US$ Lebanon Government International Bond 6.375% 09/03/2020 662,150 0.55
382,000 US$ Lebanon Government International Bond 6.6% 27/11/2026 355,260 0.29
97,000 US$ Lebanon Government International Bond 8.25% 12/04/2021 103,305 0.08
2,343,250 1.92
Lithuania
440,000 US$ Lithuania Government International Bond 5.125% 14/09/2017 470,536 0.39
380,000 US$ Lithuania Government International Bond 6.125% 09/03/2021 423,700 0.35
1,250,000 US$ Lithuania Government International Bond 6.625% 01/02/2022 1,435,938 1.18
770,000 US$ Lithuania Government International Bond 7.375% 11/02/2020 914,375 0.75
3,244,549 2.67
Malaysia
310,000 US$ Petronas Capital Ltd 5.25% 12/08/2019 338,475 0.28
220,000 US$ Petronas Capital Ltd 7.875% 22/05/2022 277,969 0.23
540,000 US$ Wakala Global Sukuk Bhd 4.646% 06/07/2021 566,410 0.46
1,182,854 0.97
Mexico
350,000 US$ Comision Federal de Electricidad 4.875% 26/05/2021 357,875 0.29
325,000 US$ Comision Federal de Electricidad 5.75% 14/02/2042 300,625 0.25
336,000 US$ Mexico Government International Bond 4.75% 08/03/2044 299,040 0.25
266,000 US$ Mexico Government International Bond 5.75% 12/10/2110 242,725 0.20
240,000 US$ Mexico Government International Bond 5.95% 19/03/2019 274,680 0.23
114,000 US$ Mexico Government International Bond 6.05% 11/01/2040 124,260 0.10
840,000 US$ Mexico Government International Bond 6.75% 27/09/2034 991,200 0.81
253,000 US$ Pemex Project Funding Master Trust 5.75% 01/03/2018 277,035 0.23
106,000 US$ Petroleos Mexicanos 5.5% 27/06/2044 95,400 0.08
150,000 US$ Petroleos Mexicanos 6% 05/03/2020 165,000 0.14
566,000 US$ Petroleos Mexicanos 6.5% 02/06/2041 584,395 0.48
347,000 US$ Petroleos Mexicanos 8% 03/05/2019 419,870 0.34
4,132,105 3.40
Mongolia
285,000 US$ Mongolia Government International Bond 5.125% 05/12/2022 250,800 0.21
250,800 0.21
Morocco
640,000 US$ Morocco Government International Bond 4.25% 11/12/2022 563,328 0.46
100,000 US$ Morocco Government International Bond 5.5% 11/12/2042 83,520 0.07
646,848 0.53 The accompanying notes form an integral part of these consolidated financial statements.

Ashmore SICAV – Unaudited Semi-Annual Report for the period ended 30 June 2013
68
Ashmore SICAV Emerging Markets Sovereign Debt Fund Schedule of Investments (continued) As at 30 June 2013
Holdings
Currency Description of Investment Market Value
US$ Net Assets
%
Transferable securities admitted to an official stock exchange listing / dealt on another regulated market (continued)
Bonds (continued)
Nigeria
300,000 US$ Nigeria Government International Bond 6.75% 28/01/2021 313,500 0.26
313,500 0.26
Pakistan
340,000 US$ Pakistan Government International Bond 7.125% 31/03/2016 323,000 0.27
323,000 0.27
Panama
90,000 US$ Panama Government International Bond 4.3% 29/04/2053 72,225 0.06
285,000 US$ Panama Government International Bond 6.7% 26/01/2036 331,313 0.27
290,000 US$ Panama Government International Bond 7.125% 29/01/2026 354,525 0.29
280,000 US$ Panama Government International Bond 8.875% 30/09/2027 386,400 0.32
325,000 US$ Panama Government International Bond 9.375% 01/04/2029 471,250 0.39
1,615,713 1.33
Paraguay
340,000 US$ Republic of Paraguay 4.625% 25/01/2023 328,100 0.27
328,100 0.27
People's Republic of China
1,505,000 US$ Sinochem Overseas Capital Co Ltd 4.5% 12/11/2020 1,483,788 1.22
605,000 US$ Sinochem Overseas Capital Co Ltd 6.3% 12/11/2040 599,716 0.49
2,083,504 1.71
Peru
226,000 US$ Peruvian Government International Bond 7.125% 30/03/2019 273,460 0.22
725,000 US$ Peruvian Government International Bond 7.35% 21/07/2025 928,000 0.76
583,000 US$ Peruvian Government International Bond 8.75% 21/11/2033 848,265 0.70
2,049,725 1.68
Philippines
450,000 US$ Philippine Government International Bond 4% 15/01/2021 475,875 0.39
580,000 US$ Philippine Government International Bond 5.5% 30/03/2026 661,200 0.54
588,000 US$ Philippine Government International Bond 7.75% 14/01/2031 776,160 0.64
490,000 US$ Philippine Government International Bond 8.375% 17/06/2019 634,550 0.52
480,000 US$ Philippine Government International Bond 9.5% 02/02/2030 720,000 0.59
264,000 US$ Philippine Government International Bond 10.625% 16/03/2025 418,440 0.34
200,000 US$ Power Sector Assets & Liabilities Management Corp 7.25% 27/05/2019 234,500 0.19
430,000 US$ Power Sector Assets & Liabilities Management Corp 7.39% 02/12/2024 520,300 0.43
4,441,025 3.64
Poland
580,000 US$ Poland Government International Bond 3% 17/03/2023 523,450 0.43
1,060,000 US$ Poland Government International Bond 5% 23/03/2022 1,139,500 0.94
797,000 US$ Poland Government International Bond 6.375% 15/07/2019 929,549 0.76
2,592,499 2.13
Qatar
300,000 US$ Qatar Government International Bond 5.75% 20/01/2042 322,500 0.26
400,000 US$ Qatar Government International Bond 6.4% 20/01/2040 469,000 0.38
791,500 0.64 The accompanying notes form an integral part of these consolidated financial statements.

Ashmore SICAV – Unaudited Semi-Annual Report for the period ended 30 June 2013
69
Ashmore SICAV Emerging Markets Sovereign Debt Fund Schedule of Investments (continued) As at 30 June 2013
Holdings Currency Description of Investment Market Value
US$ Net Assets
%
Transferable securities admitted to an official stock exchange listing / dealt on another regulated market (continued)
Bonds (continued)
Romania
1,210,000 US$ Romanian Government International Bond 4.375% 22/08/2023 1,149,524 0.94
1,494,000 US$ Romanian Government International Bond 6.75% 07/02/2022 1,665,586 1.37
2,815,110 2.31
Russian Federation
240,000 US$ Russian Agricultural Bank OJSC Via RSHB Capital SA 7.75% 29/05/2018 268,800 0.22
300,000 US$ Russian Foreign Bond - Eurobond 5% 29/04/2020 321,000 0.26
600,000 US$ Russian Foreign Bond - Eurobond 5.625% 04/04/2042 622,500 0.51
215,000 US$ Russian Foreign Bond - Eurobond 12.75% 24/06/2028 371,950 0.31
2,250,218 US$ Russian Foreign Bond - Eurobond Step Cpn 31/03/2030 2,635,568 2.16
540,000 US$ Vnesheconombank Via VEB Finance PLC 5.45% 22/11/2017 561,600 0.46
240,000 US$ Vnesheconombank Via VEB Finance PLC 6.8% 22/11/2025 255,600 0.21
1,710,000 US$ Vnesheconombank Via VEB Finance PLC 6.902% 09/07/2020 1,876,725 1.54
6,913,743 5.67
Senegal
600,000 US$ Senegal Government International Bond 8.75% 13/05/2021 624,000 0.51
624,000 0.51
Serbia
750,000 US$ Republic of Serbia 4.875% 25/02/2020 682,500 0.56
460,000 US$ Republic of Serbia 7.25% 28/09/2021 473,800 0.39
1,156,300 0.95
South Africa
728,000 US$ South Africa Government International Bond 5.5% 09/03/2020 767,130 0.63
290,000 US$ South Africa Government International Bond 5.875% 30/05/2022 310,300 0.25
620,000 US$ South Africa Government International Bond 6.25% 08/03/2041 663,400 0.54
280,000 US$ South Africa Government International Bond 6.875% 27/05/2019 317,100 0.26
2,057,930 1.68
Sri Lanka
360,000 US$ Bank of Ceylon 6.875% 03/05/2017 363,600 0.30
400,000 US$ Sri Lanka Government International Bond 5.875% 25/07/2022 378,000 0.31
210,000 US$ Sri Lanka Government International Bond 6.25% 04/10/2020 207,900 0.17
410,000 US$ Sri Lanka Government International Bond 6.25% 27/07/2021 403,850 0.33
1,353,350 1.11
Turkey
300,000 US$ Turkey Government International Bond 3.25% 23/03/2023 261,750 0.22
560,000 US$ Turkey Government International Bond 5.625% 30/03/2021 597,800 0.49
1,210,000 US$ Turkey Government International Bond 6% 14/01/2041 1,206,975 0.99
1,140,000 US$ Turkey Government International Bond 6.75% 03/04/2018 1,279,650 1.05
340,000 US$ Turkey Government International Bond 6.75% 30/05/2040 375,700 0.31
425,000 US$ Turkey Government International Bond 6.875% 17/03/2036 473,875 0.39
517,000 US$ Turkey Government International Bond 7% 26/09/2016 577,282 0.47
300,000 US$ Turkey Government International Bond 7% 11/03/2019 343,500 0.28
157,000 US$ Turkey Government International Bond 7.25% 05/03/2038 182,905 0.15
The accompanying notes form an integral part of these consolidated financial statements.
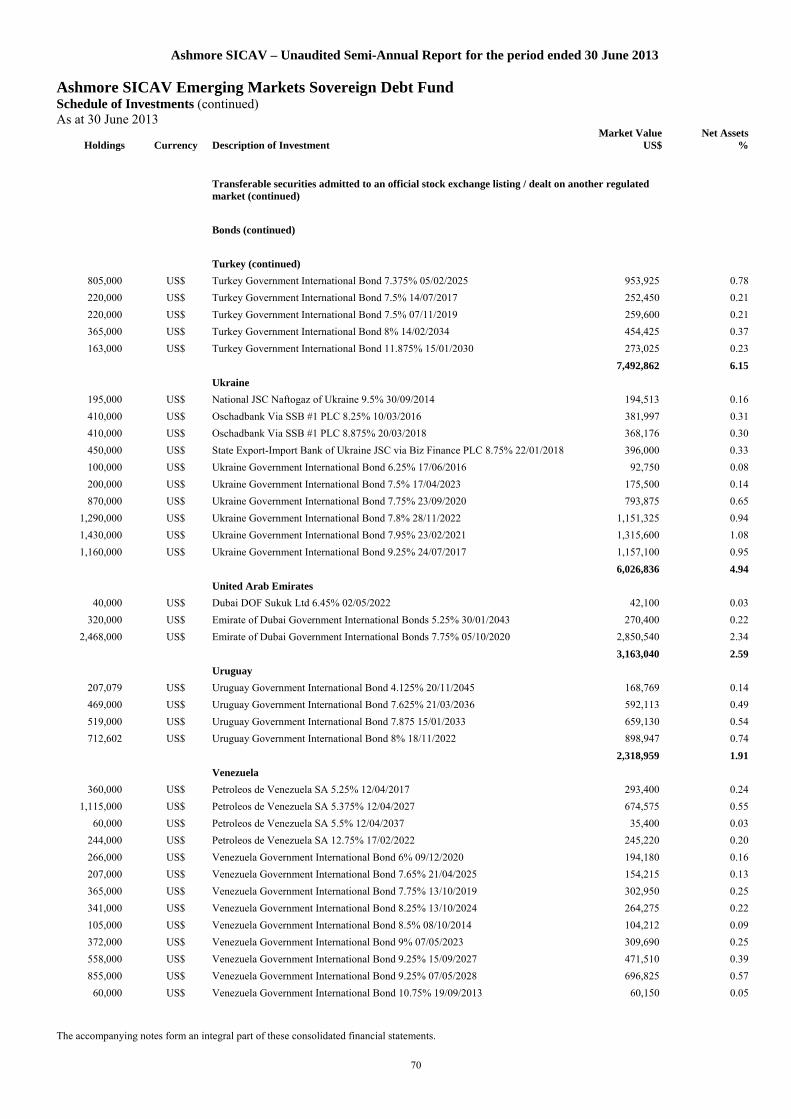
Ashmore SICAV – Unaudited Semi-Annual Report for the period ended 30 June 2013
70
Ashmore SICAV Emerging Markets Sovereign Debt Fund Schedule of Investments (continued) As at 30 June 2013
Holdings
Currency Description of Investment Market Value
US$ Net Assets
%
Transferable securities admitted to an official stock exchange listing / dealt on another regulated market (continued)
Bonds (continued)
Turkey (continued)
805,000 US$ Turkey Government International Bond 7.375% 05/02/2025 953,925 0.78
220,000 US$ Turkey Government International Bond 7.5% 14/07/2017 252,450 0.21
220,000 US$ Turkey Government International Bond 7.5% 07/11/2019 259,600 0.21
365,000 US$ Turkey Government International Bond 8% 14/02/2034 454,425 0.37
163,000 US$ Turkey Government International Bond 11.875% 15/01/2030 273,025 0.23
7,492,862 6.15
Ukraine
195,000 US$ National JSC Naftogaz of Ukraine 9.5% 30/09/2014 194,513 0.16
410,000 US$ Oschadbank Via SSB #1 PLC 8.25% 10/03/2016 381,997 0.31
410,000 US$ Oschadbank Via SSB #1 PLC 8.875% 20/03/2018 368,176 0.30
450,000 US$ State Export-Import Bank of Ukraine JSC via Biz Finance PLC 8.75% 22/01/2018 396,000 0.33
100,000 US$ Ukraine Government International Bond 6.25% 17/06/2016 92,750 0.08
200,000 US$ Ukraine Government International Bond 7.5% 17/04/2023 175,500 0.14
870,000 US$ Ukraine Government International Bond 7.75% 23/09/2020 793,875 0.65
1,290,000 US$ Ukraine Government International Bond 7.8% 28/11/2022 1,151,325 0.94
1,430,000 US$ Ukraine Government International Bond 7.95% 23/02/2021 1,315,600 1.08
1,160,000 US$ Ukraine Government International Bond 9.25% 24/07/2017 1,157,100 0.95
6,026,836 4.94
United Arab Emirates
40,000 US$ Dubai DOF Sukuk Ltd 6.45% 02/05/2022 42,100 0.03
320,000 US$ Emirate of Dubai Government International Bonds 5.25% 30/01/2043 270,400 0.22
2,468,000 US$ Emirate of Dubai Government International Bonds 7.75% 05/10/2020 2,850,540 2.34
3,163,040 2.59
Uruguay
207,079 US$ Uruguay Government International Bond 4.125% 20/11/2045 168,769 0.14
469,000 US$ Uruguay Government International Bond 7.625% 21/03/2036 592,113 0.49
519,000 US$ Uruguay Government International Bond 7.875 15/01/2033 659,130 0.54
712,602 US$ Uruguay Government International Bond 8% 18/11/2022 898,947 0.74
2,318,959 1.91
Venezuela
360,000 US$ Petroleos de Venezuela SA 5.25% 12/04/2017 293,400 0.24
1,115,000 US$ Petroleos de Venezuela SA 5.375% 12/04/2027 674,575 0.55
60,000 US$ Petroleos de Venezuela SA 5.5% 12/04/2037 35,400 0.03
244,000 US$ Petroleos de Venezuela SA 12.75% 17/02/2022 245,220 0.20
266,000 US$ Venezuela Government International Bond 6% 09/12/2020 194,180 0.16
207,000 US$ Venezuela Government International Bond 7.65% 21/04/2025 154,215 0.13
365,000 US$ Venezuela Government International Bond 7.75% 13/10/2019 302,950 0.25
341,000 US$ Venezuela Government International Bond 8.25% 13/10/2024 264,275 0.22
105,000 US$ Venezuela Government International Bond 8.5% 08/10/2014 104,212 0.09
372,000 US$ Venezuela Government International Bond 9% 07/05/2023 309,690 0.25
558,000 US$ Venezuela Government International Bond 9.25% 15/09/2027 471,510 0.39
855,000 US$ Venezuela Government International Bond 9.25% 07/05/2028 696,825 0.57
60,000 US$ Venezuela Government International Bond 10.75% 19/09/2013 60,150 0.05
The accompanying notes form an integral part of these consolidated financial statements.

Ashmore SICAV – Unaudited Semi-Annual Report for the period ended 30 June 2013
71
Ashmore SICAV Emerging Markets Sovereign Debt Fund Schedule of Investments (continued) As at 30 June 2013
Holdings
Currency Description of Investment Market Value
US$ Net Assets
%
Transferable securities admitted to an official stock exchange listing / dealt on another regulated market (continued)
Bonds (continued)
Venezuela (continued)
1,442,000 US$ Venezuela Government International Bond 11.75% 21/10/2026 1,369,900 1.13
1,529,800 US$ Venezuela Government International Bond 11.95% 05/08/2031 1,460,959 1.20
680,000 US$ Venezuela Government International Bond 12.75% 23/08/2022 697,000 0.57
7,334,461 6.03
Vietnam
566,000 US$ Vietnam Government International Bond 6.75% 29/01/2020 599,960 0.49
330,000 US$ Vietnam Government International Bond 6.875% 15/01/2016 348,150 0.29
948,110 0.78
Zambia
250,000 US$ Zambia Government International Bond 5.375% 20/09/2022 222,500 0.18
222,500 0.18
Total bonds 114,415,008 93.91
Total transferable securities admitted to an official stock exchange listing / dealt on another regulated market 114,415,008 93.91
Other transferable securities and money market instruments
Bonds
Iraq
1,082,000 US$ Republic of Iraq 5.8% 15/01/2028 898,060 0.74
898,060 0.74
Total bonds 898,060 0.74
Total other transferable securities and money market instruments 898,060 0.74
Loan participations
United Arab Emirates
294,464 US$ Dubai World Tlb 1% + 1.5% PIK 23/03/2019 182,567 0.15
182,567 0.15
Total loan participations 182,567 0.15
Total other transferable securities and money market instruments 1,080,627 0.89
Total investment portfolio 115,495,635 94.80
Cash at bank 7,600,559 6.24
Other assets and liabilities (1,262,167) (1.04)
Total net assets 121,834,027 100.00
The accompanying notes form an integral part of these consolidated financial statements.

Ashmore SICAV – Unaudited Semi-Annual Report for the period ended 30 June 2013
72
Ashmore SICAV Emerging Markets Sovereign Investment Grade Debt Fund Schedule of Investments As at 30 June 2013
Holdings
Currency Description of Investment Market Value
US$ Net Assets
%
Transferable securities admitted to an official stock exchange listing / dealt on another regulated market
Bonds
Brazil
740,000 US$ Banco Nacional de Desenvolvimento Economico e Social 5.5% 12/07/2020 764,050 1.21
500,000 US$ Banco Nacional de Desenvolvimento Economico e Social 6.5% 10/06/2019 545,000 0.86
450,000 US$ Brazilian Government International Bond 5.875% 15/01/2019 512,550 0.81
380,000 US$ Brazilian Government International Bond 8.875% 15/04/2024 524,400 0.83
500,000 US$ Brazilian Government International Bond 10.125% 15/05/2027 775,000 1.23
3,121,000 4.94
Chile
200,000 US$ Banco del Estado de Chile 3.875% 08/02/2022 193,963 0.30
150,000 US$ Banco del Estado de Chile 4.125% 07/10/2020 150,429 0.24
290,000 US$ Chile Government International Bond 3.25% 14/09/2021 290,000 0.46
490,000 US$ Corp Nacional del Cobre de Chile 7.5% 15/01/2019 586,109 0.93
655,000 US$ Empresa Nacional del Petroleo 4.75% 06/12/2021 639,072 1.01
1,859,573 2.94
Colombia
500,000 US$ Colombia Government International Bond 4.375% 12/07/2021 520,750 0.82
563,000 US$ Colombia Government International Bond 6.125% 18/01/2041 626,338 0.99
500,000 US$ Colombia Government International Bond 7.375% 18/09/2037 638,750 1.01
649,000 US$ Colombia Government International Bond 8.125% 21/05/2024 859,925 1.36
225,000 US$ Colombia Government International Bond 11.75% 25/02/2020 331,875 0.53
2,977,638 4.71
Costa Rica
1,650,000 US$ Costa Rica Government International Bond 4.25% 26/01/2023 1,526,250 2.42
550,000 US$ Costa Rica Government International Bond 4.375% 30/04/2025 504,625 0.80
550,000 US$ Costa Rica Government International Bond 5.625% 30/04/2043 497,750 0.79
1,000,000 US$ Instituto Costarricense de Electricidad 6.375% 15/05/2043 906,250 1.43
3,434,875 5.44
India
1,088,000 US$ Export-Import Bank of India 4% 14/01/2023 967,558 1.53
967,558 1.53
Indonesia
463,000 US$ Indonesia Government International Bond 4.875% 05/05/2021 474,575 0.75
250,000 US$ Indonesia Government International Bond 7.75% 17/01/2038 308,750 0.49
475,000 US$ Indonesia Government International Bond 8.5% 12/10/2035 624,625 0.99
275,000 US$ Indonesia Government International Bond 11.625% 04/03/2019 374,000 0.59
850,000 US$ Majapahit Holding BV 7.75% 20/01/2020 930,750 1.47
1,700,000 US$ Pertamina Persero PT 4.875% 03/05/2022 1,627,750 2.58
600,000 US$ Pertamina Persero PT 6% 03/05/2042 561,000 0.89
300,000 US$ Perusahaan Listrik Negara PT 5.5% 22/11/2021 294,000 0.47
5,195,450 8.23 The accompanying notes form an integral part of these consolidated financial statements.

Ashmore SICAV – Unaudited Semi-Annual Report for the period ended 30 June 2013
73
Ashmore SICAV Emerging Markets Sovereign Investment Grade Debt Fund Schedule of Investments (continued) As at 30 June 2013
Holdings
Currency Description of Investment Market Value
US$ Net Assets
%
Transferable securities admitted to an official stock exchange listing / dealt on another regulated market (continued)
Bonds (continued)
Kazakhstan
750,000 US$ Kazakhstan Temir Zholy Finance BV 6.375% 06/10/2020 810,000 1.28
1,100,000 US$ Kazakhstan Temir Zholy Finance BV 6.95% 10/07/2042 1,117,930 1.77
362,000 US$ KazMunayGas National Co JSC 4.4% 30/04/2023 335,755 0.53
700,000 US$ KazMunayGas National Co JSC 5.75% 30/04/2043 619,500 0.98
1,675,000 US$ KazMunayGas National Co JSC 7% 05/05/2020 1,892,750 3.00
1,000,000 US$ KazMunayGas National Co JSC 9.125% 02/07/2018 1,197,500 1.89
5,973,435 9.45
Latvia
1,350,000 US$ Republic of Latvia 2.75% 12/01/2020 1,248,750 1.98
800,000 US$ Republic of Latvia 5.25% 16/06/2021 842,000 1.33
2,090,750 3.31
Lithuania
500,000 US$ Lithuania Government International Bond 5.125% 14/09/2017 534,700 0.85
900,000 US$ Lithuania Government International Bond 6.125% 09/03/2021 1,003,500 1.59
2,200,000 US$ Lithuania Government International Bond 7.375% 11/02/2020 2,612,500 4.13
4,150,700 6.57
Malaysia
125,000 US$ Petronas Capital Ltd 5.25% 12/08/2019 136,482 0.21
570,000 US$ Petronas Capital Ltd 7.875% 22/05/2022 720,193 1.14
6,000 US$ Wakala Global Sukuk Bhd 4.646% 06/07/2021 6,293 0.01
862,968 1.36
Mexico
312,000 US$ Comision Federal de Electricidad 4.875% 26/05/2021 319,020 0.50
250,000 US$ Comision Federal de Electricidad 5.75% 14/02/2042 231,250 0.37
288,000 US$ Mexico Government International Bond 4.75% 08/03/2044 256,320 0.41
342,000 US$ Mexico Government International Bond 5.625% 15/01/2017 380,133 0.60
262,000 US$ Mexico Government International Bond 5.75% 12/10/2110 239,075 0.38
424,000 US$ Mexico Government International Bond 5.95% 19/03/2019 485,268 0.77
124,000 US$ Mexico Government International Bond 6.05% 11/01/2040 135,160 0.21
76,000 US$ Pemex Project Funding Master Trust 5.75% 01/03/2018 83,220 0.13
424,000 US$ Petroleos Mexicanos 3.5% 30/01/2023 391,140 0.62
313,000 US$ Petroleos Mexicanos 4.875% 24/01/2022 319,260 0.50
265,000 US$ Petroleos Mexicanos 5.5% 21/01/2021 282,225 0.45
200,000 US$ Petroleos Mexicanos 5.5% 27/06/2044 180,000 0.28
150,000 US$ Petroleos Mexicanos 6.5% 02/06/2041 154,875 0.24
1,110,000 US$ Petroleos Mexicanos 8% 03/05/2019 1,343,100 2.13
4,800,046 7.59
Morocco
1,100,000 US$ Morocco Government International Bond 4.25% 11/12/2022 968,220 1.53
1,000,000 US$ Morocco Government International Bond 5.5% 11/12/2042 835,200 1.32
1,803,420 2.85
The accompanying notes form an integral part of these consolidated financial statements.

Ashmore SICAV – Unaudited Semi-Annual Report for the period ended 30 June 2013
74
Ashmore SICAV Emerging Markets Sovereign Investment Grade Debt Fund Schedule of Investments (continued) As at 30 June 2013
Holdings
Currency Description of Investment Market Value
US$ Net Assets
%
Transferable securities admitted to an official stock exchange listing / dealt on another regulated market (continued)
Bonds (continued)
Namibia
230,000 US$ Namibia International Bonds 5.5% 03/11/2021 232,300 0.37
232,300 0.37
Panama
350,000 US$ Panama Government International Bond 4.3% 29/04/2053 280,875 0.44
151,000 US$ Panama Government International Bond 6.7% 26/01/2036 175,537 0.28
437,000 US$ Panama Government International Bond 8.875% 30/09/2027 603,060 0.95
527,000 US$ Panama Government International Bond 9.375% 01/04/2029 764,150 1.21
1,823,622 2.88
People's Republic of China
525,000 US$ Sinochem Overseas Capital Co Ltd 4.5% 12/11/2020 517,601 0.82
1,177,000 US$ Sinochem Overseas Capital Co Ltd 6.3% 12/11/2040 1,166,721 1.85
235,000 US$ Sinopec Group Overseas Development 2012 Ltd 4.875% 17/05/2042 217,786 0.34
1,902,108 3.01
Peru
275,000 US$ Peruvian Government International Bond 7.125% 30/03/2019 332,750 0.53
250,000 US$ Peruvian Government International Bond 7.35% 21/07/2025 320,000 0.51
888,000 US$ Peruvian Government International Bond 8.75% 21/11/2033 1,292,040 2.04
1,944,790 3.08
Philippines
526,000 US$ Philippine Government International Bond 6.375% 23/10/2034 631,200 1.00
631,200 1.00
Poland
350,000 US$ Poland Government International Bond 3% 17/03/2023 315,875 0.50
950,000 US$ Poland Government International Bond 5% 23/03/2022 1,021,250 1.62
1,021,250 1.62
Romania
850,000 US$ Romanian Government International Bond 4.375% 22/08/2023 807,517 1.28
2,500,000 US$ Romanian Government International Bond 6.75% 07/02/2022 2,787,125 4.41
3,594,642 5.69
Russian Federation
600,000 US$ Russian Foreign Bond - Eurobond 5.625% 04/04/2042 622,500 0.98
240,000 US$ Russian Foreign Bond - Eurobond 12.75% 24/06/2028 415,200 0.66
1,404,325 US$ Russian Foreign Bond - Eurobond Step Cpn 03/31/2030 1,644,816 2.60
490,000 US$ Vnesheconombank Via VEB Finance PLC 6.8% 22/11/2025 521,850 0.83
2,475,000 US$ Vnesheconombank Via VEB Finance PLC 6.902% 09/07/2020 2,716,313 4.30
5,920,679 9.37
South Africa
450,000 US$ South Africa Government International Bond 5.875% 30/05/2022 481,500 0.76
800,000 US$ South Africa Government International Bond 6.875% 27/05/2019 906,000 1.43
1,387,500 2.19
The accompanying notes form an integral part of these consolidated financial statements.

Ashmore SICAV – Unaudited Semi-Annual Report for the period ended 30 June 2013
75
Ashmore SICAV Emerging Markets Sovereign Investment Grade Debt Fund Schedule of Investments (continued) As at 30 June 2013
Holdings
Currency Description of Investment Market Value
US$ Net Assets
%
Transferable securities admitted to an official stock exchange listing / dealt on another regulated market (continued)
Bonds (continued)
Turkey
375,000 US$ Turkey Government International Bond 3.25% 23/03/2023 327,188 0.52
1,000,000 US$ Turkey Government International Bond 4.875% 16/04/2043 860,000 1.36
1,187,188 1.88
Uruguay
712,000 US$ Uruguay Government International Bond 4.125% 20/11/2045 580,280 0.92
962,000 US$ Uruguay Government International Bond 7.625% 21/03/2036 1,214,525 1.92
1,794,805 2.84
Total bonds 58,993,372 93.35
Total transferable securities admitted to an official stock exchange listing / dealt on another regulated market 58,993,372 93.35
Total investment portfolio 58,993,372 93.35
Cash at bank 3,379,366 5.35
Other assets and liabilities 823,198 1.30
Total net assets 63,195,936 100.00
The accompanying notes form an integral part of these consolidated financial statements.

Ashmore SICAV – Unaudited Semi-Annual Report for the period ended 30 June 2013
76
Ashmore SICAV Turkish Debt Fund Schedule of Investments As at 30 June 2013
Holdings
Currency Description of Investment Market Value
US$ Net Assets
%
Transferable securities admitted to an official stock exchange listing/dealt on another regulated market
Bonds
Turkey
580,000 TRY AK Finansal Kiralama FRN 21/02/2014 300,604 0.64
1,250,000 TRY Akfen FRN 24/12/2013 656,275 1.40
2,000,000 TRY Boyner Buyuk Magazacilik FRN 31/12/2015 1,051,483 2.24
2,000,000 TRY Creditwest Faktoring Hizmetleri A.S. FRN 24/11/2014 1,037,601 2.21
1,500,000 TRY Lider Faktoring Hizmetleri A.S. FRN 08/11/2013 782,866 1.67
4,000,000 TRY Ronesans FRN 18/12/2015 2,085,568 4.44
9,000,000 TRY Turkey Government Bond 6.3% 14/02/2018 4,343,808 9.25
6,500,000 TRY Turkey Government Bond 6.5% 07/01/2015 3,311,565 7.06
6,000,000 TRY Turkey Government Bond 7.1% 08/03/2023 2,860,919 6.09
7,000,000 TRY Turkey Government Bond 7.5% 24/09/2014 3,620,721 7.71
4,500,000 TRY Turkey Government Bond 8.5% 14/09/2022 2,355,594 5.02
11,800,000 TRY Turkey Government Bond 9% 08/03/2017 6,314,494 13.45
9,900,000 TRY Turkey Government Bond 9.5% 12/01/2022 5,438,856 11.59
4,200,000 TRY Turkey Government Bond 10% 17/06/2015 2,266,034 4.83
10,000,000 TRY Turkey Government Bond 10.5% 15/01/2020 5,763,300 12.28
5,500,000 TRY Turkey Government Bond 11% 06/08/2014 2,944,622 6.27
45,134,310 96.15
Total bonds 45,134,310 96.15
Total transferable securities admitted to an official stock exchange listing / dealt on another regulated market 45,134,310 96.15
Total investment portfolio 45,134,310 96.15
Cash at bank 661,720 1.41
Other assets and liabilities 1,143,113 2.44
Total net assets 46,939,143 100.00
The accompanying notes form an integral part of these consolidated financial statements.

Ashmore SICAV – Unaudited Semi-Annual Report for the period ended 30 June 2013
77
Ashmore SICAV Local Currency Fund Schedule of Investments As at 30 June 2013
Holdings
Currency Description of Investment Market Value
US$ Net Assets
%
Transferable securities admitted to an official stock exchange listing / dealt on another regulated market
Bonds
Brazil
254,000 BRL Brazil Letras do Tesouro Nacional 0% 01/01/2015 994,538 0.07
2,821,000 BRL Brazil Notas do Tesouro Nacional Serie B 6% 15/08/2016 30,980,762 2.22
5,496,000 BRL Brazil Notas do Tesouro Nacional Serie B 6% 15/08/2020 61,445,855 4.41
1,830,000 BRL Brazil Notas do Tesouro Nacional Serie F 10% 01/01/2023 8,167,419 0.59
2,330,000 BRL RBS-Zero Hora Editora Jornalistica SA 11.25% 15/06/2017 1,010,062 0.07
102,598,636 7.36
Colombia
2,995,000,000 COP Emgesa SA ESP 8.75% 25/01/2021 1,705,890 0.12
1,705,890 0.12
Ghana
4,790,000 GHS Ghana Government Bond 21% 26/10/2015 2,366,870 0.17
2,366,870 0.17
Mexico
1,005,000,000 MXN Mexican Bonos 8% 19/12/2013 78,571,521 5.64
78,571,521 5.64
People's Republic of China
32,500,000 CNH Evergrande Real Estate Group Ltd 9.25% 19/01/2016 4,900,682 0.35
4,900,682 0.35
Philippines
105,000,000 PHP Petron Corp 7% 10/11/2017 2,462,785 0.18
25,000,000 PHP Philippine Government International Bond 6.25% 14/01/2036 615,197 0.04
3,077,982 0.22
Poland
58,220,000 PLN Poland Government Bond 3% 24/08/2016 23,241,113 1.67
23,241,113 1.67
Romania
2,920,000 RON Romania Government Bond 5.6% 28/11/2018 853,242 0.06
10,730,000 RON Romania Government Bond 5.8% 26/10/2015 3,157,789 0.23
40,690,000 RON Romania Government Bond 5.85% 28/07/2014 11,947,526 0.86
6,690,000 RON Romania Government Bond 5.9% 26/07/2017 1,954,859 0.14
17,913,416 1.29
Russian Federation
9,510,000 RUB Russian Federal Bond - OFZ 6.9% 03/08/2016 292,589 0.02
279,458,000 RUB Russian Federal Bond - OFZ 7.4% 19/04/2017 8,666,024 0.62
304,396,000 RUB Russian Federal Bond - OFZ 7.4% 14/06/2017 9,443,991 0.68
18,402,604 1.32
Thailand
48,000,000 THB Thailand Government Bond 1.2% 14/07/2021 1,568,128 0.11
67,000,000 THB Thailand Government Bond 1.25% 12/03/2028 2,097,109 0.15
3,665,237 0.26 The accompanying notes form an integral part of these consolidated financial statements.
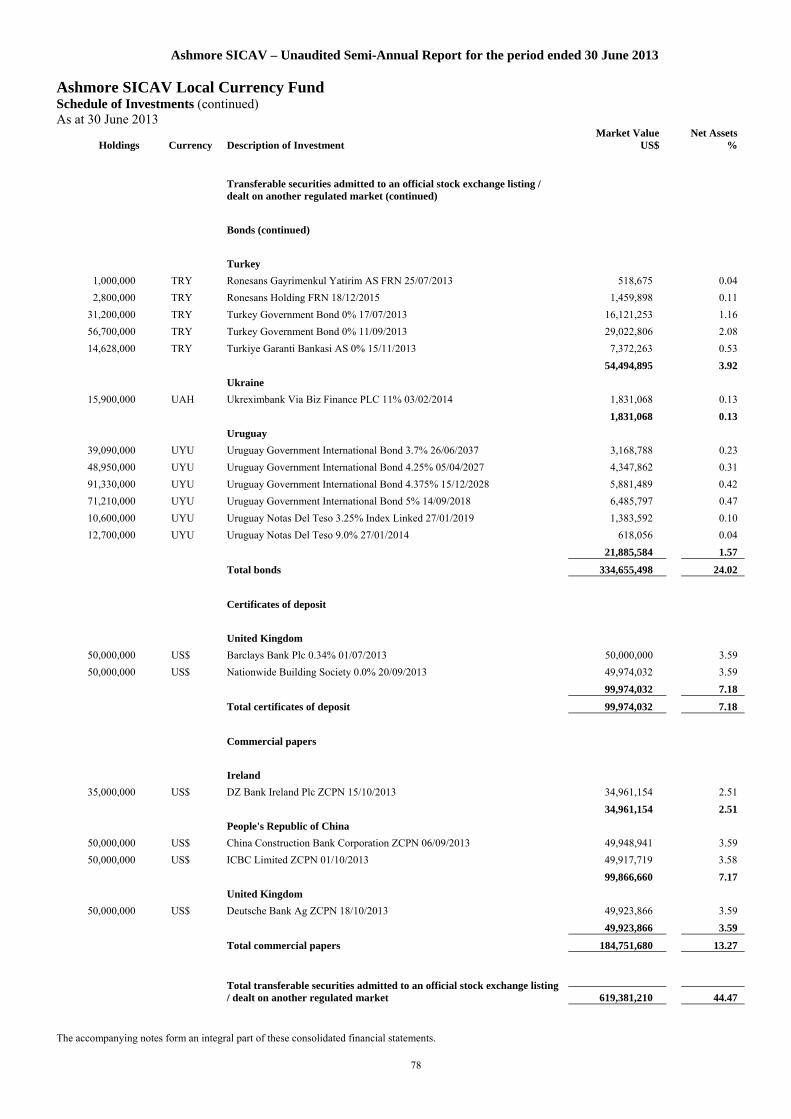
Ashmore SICAV – Unaudited Semi-Annual Report for the period ended 30 June 2013
78
Ashmore SICAV Local Currency Fund Schedule of Investments (continued) As at 30 June 2013
Holdings
Currency Description of Investment Market Value
US$ Net Assets
%
Transferable securities admitted to an official stock exchange listing / dealt on another regulated market (continued)
Bonds (continued)
Turkey
1,000,000 TRY Ronesans Gayrimenkul Yatirim AS FRN 25/07/2013 518,675 0.04
2,800,000 TRY Ronesans Holding FRN 18/12/2015 1,459,898 0.11
31,200,000 TRY Turkey Government Bond 0% 17/07/2013 16,121,253 1.16
56,700,000 TRY Turkey Government Bond 0% 11/09/2013 29,022,806 2.08
14,628,000 TRY Turkiye Garanti Bankasi AS 0% 15/11/2013 7,372,263 0.53
54,494,895 3.92
Ukraine
15,900,000 UAH Ukreximbank Via Biz Finance PLC 11% 03/02/2014 1,831,068 0.13
1,831,068 0.13
Uruguay
39,090,000 UYU Uruguay Government International Bond 3.7% 26/06/2037 3,168,788 0.23
48,950,000 UYU Uruguay Government International Bond 4.25% 05/04/2027 4,347,862 0.31
91,330,000 UYU Uruguay Government International Bond 4.375% 15/12/2028 5,881,489 0.42
71,210,000 UYU Uruguay Government International Bond 5% 14/09/2018 6,485,797 0.47
10,600,000 UYU Uruguay Notas Del Teso 3.25% Index Linked 27/01/2019 1,383,592 0.10
12,700,000 UYU Uruguay Notas Del Teso 9.0% 27/01/2014 618,056 0.04
21,885,584 1.57
Total bonds 334,655,498 24.02
Certificates of deposit
United Kingdom
50,000,000 US$ Barclays Bank Plc 0.34% 01/07/2013 50,000,000 3.59
50,000,000 US$ Nationwide Building Society 0.0% 20/09/2013 49,974,032 3.59
99,974,032 7.18
Total certificates of deposit 99,974,032 7.18
Commercial papers
Ireland
35,000,000 US$ DZ Bank Ireland Plc ZCPN 15/10/2013 34,961,154 2.51
34,961,154 2.51
People's Republic of China
50,000,000 US$ China Construction Bank Corporation ZCPN 06/09/2013 49,948,941 3.59
50,000,000 US$ ICBC Limited ZCPN 01/10/2013 49,917,719 3.58
99,866,660 7.17
United Kingdom
50,000,000 US$ Deutsche Bank Ag ZCPN 18/10/2013 49,923,866 3.59
49,923,866 3.59
Total commercial papers 184,751,680 13.27
Total transferable securities admitted to an official stock exchange listing / dealt on another regulated market 619,381,210 44.47
The accompanying notes form an integral part of these consolidated financial statements.

Ashmore SICAV – Unaudited Semi-Annual Report for the period ended 30 June 2013
79
Ashmore SICAV Local Currency Fund Schedule of Investments (continued) As at 30 June 2013
Holdings
Currency Description of Investment Market Value
US$ Net Assets
%
Other transferable securities and money market instruments
Bonds
Nigeria
400,000,000 NGN Nigeria T-Bill 0.00% 07/11/2013 2,345,758 0.17
320,000,000 NGN Nigeria T-Bill 0.00% 20/03/2014 1,781,766 0.13
740,000,000 NGN Nigeria T-Bill 0.00% 24/04/2014 4,085,366 0.29
840,000,000 NGN Nigeria T-Bill 0.00% 10/04/2014 4,645,454 0.33
12,858,344 0.92
Romania
39,750,000 RON Romania Treasury Bills 0% 08/01/2014 11,280,804 0.81
11,280,804 0.81
Total bonds 24,139,148 1.73
Total other transferable securities and money market instruments 24,139,148 1.73
Fully-funded total return swaps
Colombia
7,671,000,000 COP Colombian TES 8% 28/10/2015 4,205,595 0.30
4,205,595 0.30
India
80,610,000 INR India Government Bond 7.49% 16/04/2017 1,346,188 0.10
174,720,000 INR India Government Bond 7.83% 11/04/2018 2,950,276 0.21
965,000,000 INR India Government Bond 8.07% 03/07/2017 16,464,597 1.18
291,000,000 INR Rural Electrification Corp Ltd 9.35% 19/10/2016 4,848,670 0.35
25,609,731 1.84
Republic of South Korea
1,943,700,000 KRW Inflation Linked Korea Treasury Bond 2.75% 10/06/2020 2,059,655 0.15
21,347,800,000 KRW Korea Treasury Bond 5% 10/06/2020 20,663,466 1.48
22,723,121 1.63
Total fully-funded total return swaps 52,538,447 3.77
Undertakings for collective investments
Luxembourg
138,798,057 US$ Ashmore SICAV 2 Global Liquidity US$ Fund 138,798,057 9.97
138,798,057 9.97
Total undertakings for collective investments 138,798,057 9.97
The accompanying notes form an integral part of these consolidated financial statements.

Ashmore SICAV – Unaudited Semi-Annual Report for the period ended 30 June 2013
80
Ashmore SICAV Local Currency Fund Schedule of Investments (continued) As at 30 June 2013
Holdings
Currency Description of Investment Market Value
US$ Net Assets
%
Written options
46,400,000 EUR Currency PUT option EUR/USD 1.26 European 08/11/2013 (Bank of America)
640,736 0.05
52,300,000 EUR Currency PUT option EUR/USD 1.27 European 11/09/2013 (HSBC) 516,172 0.04
10,000,000 EUR Currency PUT option EUR/USD 1.27 European 11/09/2013 (HSBC) 98,694 0.01
46,400,000 EUR Currency PUT option EUR/USD 1.28 European 04/10/2013 (Bank of America)
717,152 0.05
1,972,754 0.15
Total written options 1,972,754 0.15
Total investment portfolio 836,829,616 60.09
Cash at bank, including time deposits (note 11) 588,082,455 42.22
Other assets and liabilities (32,213,844) (2.31)
Total net assets 1,392,698,227 100.00
The accompanying notes form an integral part of these consolidated financial statements.

Ashmore SICAV – Unaudited Semi-Annual Report for the period ended 30 June 2013
81
Ashmore SICAV Emerging Markets Local Currency Bond Fund Schedule of Investments As at 30 June 2013
Holdings
Currency Description of Investment Market Value
US$ Net Assets
%
Transferable securities admitted to an official stock exchange listing / dealt on another regulated market
Bonds
Brazil
20,764,000 BRL Brazil Letras do Tesouro Nacional 0% 01/01/2017 64,932,456 2.39
6,952,000 BRL Brazil Notas do Tesouro Nacional Serie B 6% 15/08/2020 77,724,087 2.86
13,522,000 BRL Brazil Notas do Tesouro Nacional Serie F 10% 01/01/2021 61,062,580 2.25
10,960,000 BRL Brazil Notas do Tesouro Nacional Serie F 10% 01/01/2023 48,915,253 1.80
78,280,000 BRL Brazilian Government International Bond 8.5% 05/01/2024 32,601,163 1.20
2,050,000 BRL Brazilian Government International Bond 10.25% 10/01/2028 951,201 0.04
286,186,740 10.54
Chile
760,000,000 CLP Bonos de la Tesoreria de la Republica en pesos 6% 01/01/2020 1,558,470 0.06
3,514,500,000 CLP Chile Government International Bond 5.5% 05/08/2020 6,998,505 0.26
8,556,975 0.32
Colombia
11,747,000,000 COP Colombia Government International Bond 4.375% 21/03/2023 5,352,678 0.20
29,747,000,000 COP Colombia Government International Bond 7.75% 14/04/2021 17,308,326 0.64
9,746,000,000 COP Colombia Government International Bond 9.85% 28/06/2027 6,629,551 0.24
20,711,000,000 COP Colombia Government International Bond 12% 22/10/2015 12,316,678 0.45
27,505,000,000 COP Colombian TES 7.5% 26/08/2026 14,301,888 0.53
55,909,121 2.06
Ghana
11,460,000 GHS Ghana Government Bond 21% 26/10/2015 5,662,701 0.21
5,662,701 0.21
Hungary
5,259,200,000 HUF Hungary Government Bond 5.5% 22/12/2016 23,565,158 0.87
11,104,300,000 HUF Hungary Government Bond 6.75% 24/11/2017 51,631,040 1.90
5,317,100,000 HUF Hungary Government Bond 7% 24/06/2022 24,916,916 0.92
7,741,500,000 HUF Hungary Government Bond 7.75% 24/08/2015 36,294,845 1.34
136,407,959 5.03
Indonesia
35,000,000,000 IDR Indonesia Treasury Bond 5.25% 15/05/2018 3,347,456 0.12
148,900,000,000 IDR Indonesia Treasury Bond 6.125% 15/05/2028 12,991,656 0.48
21,100,000,000 IDR Indonesia Treasury Bond 6.625% 15/05/2033 1,869,411 0.07
18,208,523 0.67
Mexico
483,300,000 MXN Mexican Bonos 7.5% 03/06/2027 41,555,114 1.53
253,800,000 MXN Mexican Bonos 7.75% 05/29/2031 21,532,994 0.79
90,600,000 MXN Mexican Bonos 7.75% 11/13/2042 7,491,022 0.28
455,890,000 MXN Mexican Bonos 8.5% 05/31/2029 41,717,705 1.54
285,500,000 MXN Mexican Bonos 8.5% 11/18/2038 25,529,969 0.94
244,000,000 MXN Mexican Bonos 10% 11/20/2036 24,936,334 0.92
28,190,000 MXN Mexican Udibonos 4% 11/15/2040 11,795,549 0.43
174,558,687 6.43 The accompanying notes form an integral part of these consolidated financial statements.

Ashmore SICAV – Unaudited Semi-Annual Report for the period ended 30 June 2013
82
Ashmore SICAV Emerging Markets Local Currency Bond Fund Schedule of Investments (continued) As at 30 June 2013
Holdings
Currency Description of Investment Market Value
US$ Net Assets
%
Transferable securities admitted to an official stock exchange listing / dealt on another regulated market (continued)
Bonds (continued)
Nigeria
2,980,000,000 NGN Nigeria Government Bond 16% 29/06/2019 19,676,837 0.73
2,148,000,000 NGN Nigeria Government Bond 16.39% 27/01/2022 14,760,710 0.54
34,437,547 1.27
Philippines
303,000,000 PHP Philippine Government International Bond 3.9% 26/11/2022 6,770,086 0.25
102,000,000 PHP Philippine Government International Bond 4.95% 15/01/2021 2,380,331 0.09
453,000,000 PHP Philippine Government International Bond 6.25% 14/01/2036 11,147,365 0.41
20,297,782 0.75
Poland
21,700,000 PLN Poland Government Bond 2.75% 25/08/2023 7,721,046 0.28
116,080,000 PLN Poland Government Bond 3% 24/08/2016 46,338,516 1.71
146,518,000 PLN Poland Government Bond 4% 25/10/2023 42,708,303 1.57
188,386,000 PLN Poland Government Bond 4.75% 25/10/2016 58,907,559 2.17
168,633,000 PLN Poland Government Bond 5.25% 25/10/2017 53,821,735 1.98
109,000,000 PLN Poland Government Bond 5.75% 25/10/2021 36,171,372 1.32
159,684,000 PLN Poland Government Bond 5.75% 23/09/2022 52,894,861 1.95
298,563,392 10.98
Romania
5,490,000 RON Romania Government Bond 5.6% 28/11/2018 1,604,211 0.06
12,600,000 RON Romania Government Bond 5.75% 29/04/2020 3,675,637 0.14
44,640,000 RON Romania Government Bond 5.8% 26/10/2015 13,137,343 0.48
27,300,000 RON Romania Government Bond 5.85% 28/07/2014 8,015,912 0.30
8,400,000 RON Romania Government Bond 5.85% 26/04/2023 2,483,397 0.09
29,290,000 RON Romania Government Bond 5.9% 26/07/2017 8,558,716 0.32
37,475,216 1.39
Russian Federation
1,459,840,000 RUB Russian Federal Bond - OFZ 6.9% 03/08/2016 44,914,049 1.66
124,200,000 RUB Russian Federal Bond - OFZ 7% 25/01/2023 3,652,951 0.13
232,410,000 RUB Russian Federal Bond - OFZ 7.05% 19/01/2028 6,530,956 0.24
2,634,431,000 RUB Russian Federal Bond - OFZ 7.4% 19/04/2017 81,694,004 3.01
2,166,795,000 RUB Russian Federal Bond - OFZ 7.4% 14/06/2017 67,225,561 2.48
351,297,000 RUB Russian Federal Bond - OFZ 7.5% 15/03/2018 11,035,742 0.41
2,064,672,000 RUB Russian Federal Bond - OFZ 7.5% 27/02/2019 63,837,032 2.35
1,233,710,000 RUB Russian Federal Bond - OFZ 7.6% 14/04/2021 38,258,539 1.41
383,014,000 RUB Russian Federal Bond - OFZ 7.6% 20/07/2022 11,754,801 0.43
651,018,000 RUB Russian Federal Bond - OFZ 8.15% 03/02/2027 20,366,623 0.75
349,270,258 12.87
Singapore
19,700,000 SGD Singapore Government Bond 2.75% 01/07/2023 15,845,755 0.58
15,845,755 0.58 The accompanying notes form an integral part of these consolidated financial statements.
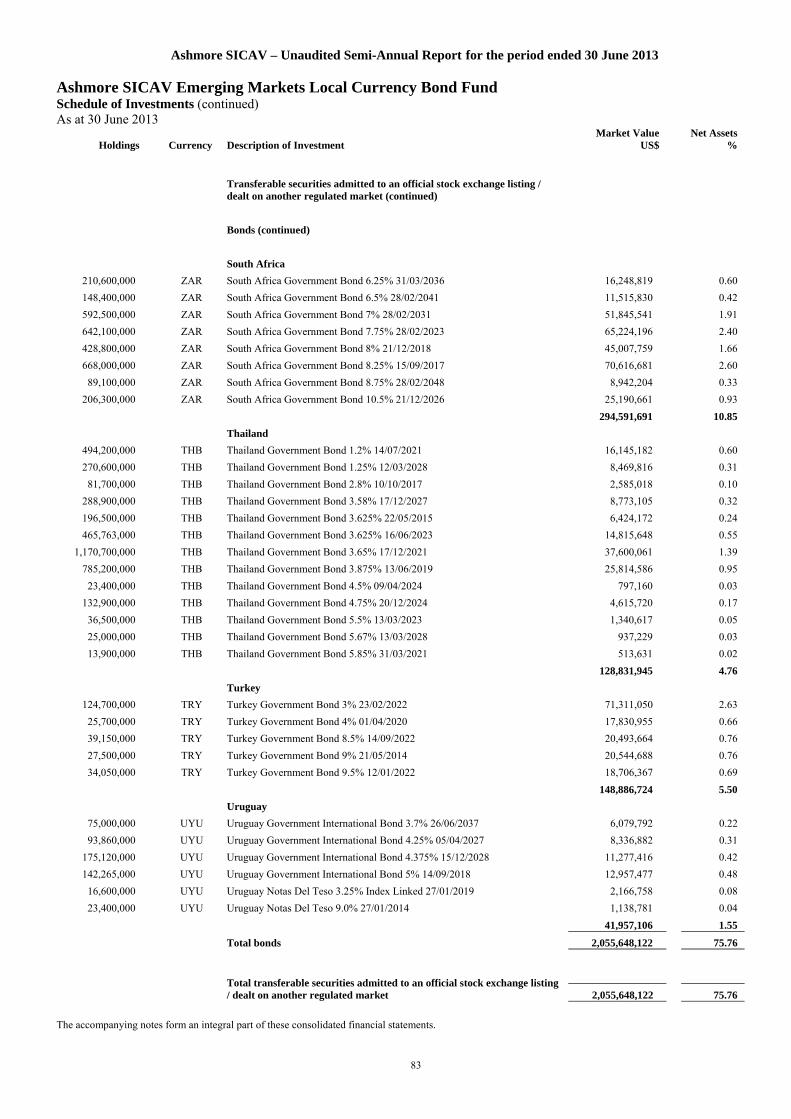
Ashmore SICAV – Unaudited Semi-Annual Report for the period ended 30 June 2013
83
Ashmore SICAV Emerging Markets Local Currency Bond Fund Schedule of Investments (continued) As at 30 June 2013
Holdings
Currency Description of Investment Market Value
US$ Net Assets
%
Transferable securities admitted to an official stock exchange listing / dealt on another regulated market (continued)
Bonds (continued)
South Africa
210,600,000 ZAR South Africa Government Bond 6.25% 31/03/2036 16,248,819 0.60
148,400,000 ZAR South Africa Government Bond 6.5% 28/02/2041 11,515,830 0.42
592,500,000 ZAR South Africa Government Bond 7% 28/02/2031 51,845,541 1.91
642,100,000 ZAR South Africa Government Bond 7.75% 28/02/2023 65,224,196 2.40
428,800,000 ZAR South Africa Government Bond 8% 21/12/2018 45,007,759 1.66
668,000,000 ZAR South Africa Government Bond 8.25% 15/09/2017 70,616,681 2.60
89,100,000 ZAR South Africa Government Bond 8.75% 28/02/2048 8,942,204 0.33
206,300,000 ZAR South Africa Government Bond 10.5% 21/12/2026 25,190,661 0.93
294,591,691 10.85
Thailand
494,200,000 THB Thailand Government Bond 1.2% 14/07/2021 16,145,182 0.60
270,600,000 THB Thailand Government Bond 1.25% 12/03/2028 8,469,816 0.31
81,700,000 THB Thailand Government Bond 2.8% 10/10/2017 2,585,018 0.10
288,900,000 THB Thailand Government Bond 3.58% 17/12/2027 8,773,105 0.32
196,500,000 THB Thailand Government Bond 3.625% 22/05/2015 6,424,172 0.24
465,763,000 THB Thailand Government Bond 3.625% 16/06/2023 14,815,648 0.55
1,170,700,000 THB Thailand Government Bond 3.65% 17/12/2021 37,600,061 1.39
785,200,000 THB Thailand Government Bond 3.875% 13/06/2019 25,814,586 0.95
23,400,000 THB Thailand Government Bond 4.5% 09/04/2024 797,160 0.03
132,900,000 THB Thailand Government Bond 4.75% 20/12/2024 4,615,720 0.17
36,500,000 THB Thailand Government Bond 5.5% 13/03/2023 1,340,617 0.05
25,000,000 THB Thailand Government Bond 5.67% 13/03/2028 937,229 0.03
13,900,000 THB Thailand Government Bond 5.85% 31/03/2021 513,631 0.02
128,831,945 4.76
Turkey
124,700,000 TRY Turkey Government Bond 3% 23/02/2022 71,311,050 2.63
25,700,000 TRY Turkey Government Bond 4% 01/04/2020 17,830,955 0.66
39,150,000 TRY Turkey Government Bond 8.5% 14/09/2022 20,493,664 0.76
27,500,000 TRY Turkey Government Bond 9% 21/05/2014 20,544,688 0.76
34,050,000 TRY Turkey Government Bond 9.5% 12/01/2022 18,706,367 0.69
148,886,724 5.50
Uruguay
75,000,000 UYU Uruguay Government International Bond 3.7% 26/06/2037 6,079,792 0.22
93,860,000 UYU Uruguay Government International Bond 4.25% 05/04/2027 8,336,882 0.31
175,120,000 UYU Uruguay Government International Bond 4.375% 15/12/2028 11,277,416 0.42
142,265,000 UYU Uruguay Government International Bond 5% 14/09/2018 12,957,477 0.48
16,600,000 UYU Uruguay Notas Del Teso 3.25% Index Linked 27/01/2019 2,166,758 0.08
23,400,000 UYU Uruguay Notas Del Teso 9.0% 27/01/2014 1,138,781 0.04
41,957,106 1.55
Total bonds 2,055,648,122 75.76
Total transferable securities admitted to an official stock exchange listing / dealt on another regulated market 2,055,648,122 75.76
The accompanying notes form an integral part of these consolidated financial statements.

Ashmore SICAV – Unaudited Semi-Annual Report for the period ended 30 June 2013
84
Ashmore SICAV Emerging Markets Local Currency Bond Fund Schedule of Investments (continued) As at 30 June 2013
Holdings
Currency Description of Investment Market Value
US$ Net Assets
%
Other transferable securities and money market instruments
Bonds
Malaysia
38,800,000 MYR Malaysia Government Bond 3.314% 31/10/2017 12,237,308 0.45
14,320,000 MYR Malaysia Government Bond 3.418% 15/08/2022 4,451,360 0.16
20,580,000 MYR Malaysia Government Bond 3.48% 15/03/2023 6,415,261 0.24
73,630,000 MYR Malaysia Government Bond 3.492% 31/03/2020 23,206,396 0.86
8,110,000 MYR Malaysia Government Bond 3.502% 31/05/2027 2,491,216 0.09
45,200,000 MYR Malaysia Government Bond 3.58% 28/09/2018 14,322,871 0.53
79,160,000 MYR Malaysia Government Bond 4.012% 15/09/2017 25,560,374 0.94
69,300,000 MYR Malaysia Government Bond 4.16% 15/07/2021 22,639,506 0.83
35,900,000 MYR Malaysia Government Bond 4.262% 15/09/2016 11,654,768 0.43
92,080,000 MYR Malaysia Government Bond 4.378% 29/11/2019 30,481,934 1.12
13,800,000 MYR Malaysia Government Bond 4.392% 15/04/2026 4,617,953 0.17
15,550,000 MYR Malaysia Government Bond 4.498% 15/04/2030 5,341,955 0.20
4,000,000 MYR Malaysia Government Bond 5.248% 15/09/2028 1,472,500 0.05
164,893,402 6.07
Nigeria
180,400,000 NGN Nigeria T-Bill 0.00% 08/08/2013 1,095,475 0.04
1,820,000,000 NGN Nigeria T-Bill 0.00% 10/04/2014 10,065,150 0.37
1,305,000,000 NGN Nigeria T-Bill 0.00% 26/09/2013 7,785,036 0.29
550,000,000 NGN Nigeria T-Bill 0.00% 20/02/2014 3,122,577 0.11
1,270,000,000 NGN Nigeria T-Bill 0.00% 20/03/2014 7,071,383 0.26
650,000,000 NGN Nigeria T-Bill 0.00% 24/04/2014 3,588,498 0.13
32,728,119 1.20
Peru
14,580,000 PEN Peruvian Government International Bond 6.95% 12/08/2031 5,449,419 0.20
29,195,000 PEN Peruvian Government International Bond 7.84% 12/08/2020 12,077,831 0.45
14,017,000 PEN Peruvian Government International Bond 8.2% 12/08/2026 6,153,977 0.23
21,970,000 PEN Peruvian Government International Bond 8.6% 12/08/2017 9,208,921 0.34
32,890,148 1.22
Total bonds 230,511,669 8.49
Total other transferable securities and money market instruments 230,511,669 8.49
Fully-funded total return swaps
Colombia
3,037,000,000 COP Colombian TES 8% 28/10/2015 1,665,023 0.06
1,416,000,000 COP Colombian TES 11% 24/07/2020 897,881 0.03
858,000,000 COP Colombian TES 11.25% 24/10/2018 553,740 0.02
677,000,000 COP Colombian TES 13.5% 12/09/2014 388,760 0.01
3,505,404 0.12
India
1,774,000,000 INR India Government Bond 8.07% 03/07/2017 30,267,560 1.12
113,800,000 INR India Government Bond 7.49% 16/04/2017 1,900,461 0.07 The accompanying notes form an integral part of these consolidated financial statements.

Ashmore SICAV – Unaudited Semi-Annual Report for the period ended 30 June 2013
85
Ashmore SICAV Emerging Markets Local Currency Bond Fund Schedule of Investments (continued) As at 30 June 2013
Holdings
Currency Description of Investment Market Value
US$ Net Assets
%
Fully-funded total return swaps (continued)
India (continued)
346,480,000 INR India Government Bond 7.83% 11/04/2018 5,850,571 0.22
115,000,000 INR India Government Bond 8.12% 10/12/2020 1,981,023 0.07
39,999,615 1.48
Indonesia
72,460,000,000 IDR Indonesia Treasury Bond 6.625% 05/15/2033 6,419,788 0.24
178,100,000,000 IDR Indonesia Treasury Bond 7% 15/05/2027 16,871,588 0.62
125,900,000,000 IDR Indonesia Treasury Bond 8.25% 15/06/2032 13,195,437 0.49
155,800,000,000 IDR Indonesia Treasury Bond 8.375% 15/09/2026 16,641,465 0.61
4,100,000,000 IDR Indonesia Treasury Bond 8.375% 09/15/2026 437,933 0.02
45,369,000,000 IDR Indonesia Treasury Bond 9.5% 15/06/2015 4,818,599 0.18
230,950,000,000 IDR Indonesia Treasury Bond 9.5% 15/07/2031 26,908,642 0.99
221,246,000,000 IDR Indonesia Treasury Bond 10.5% 15/08/2030 27,859,631 1.03
69,281,000,000 IDR Indonesia Treasury Bond 11% 15/11/2020 8,555,216 0.32
26,000,000,000 IDR Indonesia Treasury Bond 11% 15/09/2025 3,329,640 0.12
239,509,000,000 IDR Indonesia Treasury Bond 11.5% 15/09/2019 29,569,311 1.09
18,000,000,000 IDR Indonesia Treasury Bond 12.8% 15/06/2021 2,429,898 0.09
157,037,148 5.80
Republic of South Korea
2,071,100,000 KRW Inflation Linked Korea Treasury Bond 2.75% 10/06/2020 2,194,655 0.08
37,910,470,000 KRW Korea Treasury Bond 5% 10/06/2020 36,695,197 1.35
38,889,852 1.43
Total fully-funded total return swaps 239,432,019 8.83
Undertakings for collective investment schemes
Luxembourg
356,717 US$ Ashmore SICAV Turkish Debt Fund 32,764,457 1.21
32,764,457 1.21
Total undertakings for collective investment schemes 32,764,457 1.21
Written options 91,500,000 EUR Currency PUT option EUR/USD 1.26 European 08/11/2013 (Bank of
America) 1,263,520 0.05
116,900,000 EUR Currency PUT option EUR/USD 1.27 European 11/09/2013 (HSBC) 1,153,737 0.04
91,500,000 EUR Currency PUT option EUR/USD 1.28 European 04/10/2013 (Bank of America)
1,414,212 0.05
3,831,469 0.14
Total written options 3,831,469 0.14
Total investment portfolio 2,562,187,736 94.43
Cash at bank 131,657,356 4.85
Other assets and liabilities 19,504,219 0.72
Total net assets 2,713,349,311 100.00
The accompanying notes form an integral part of these consolidated financial statements.
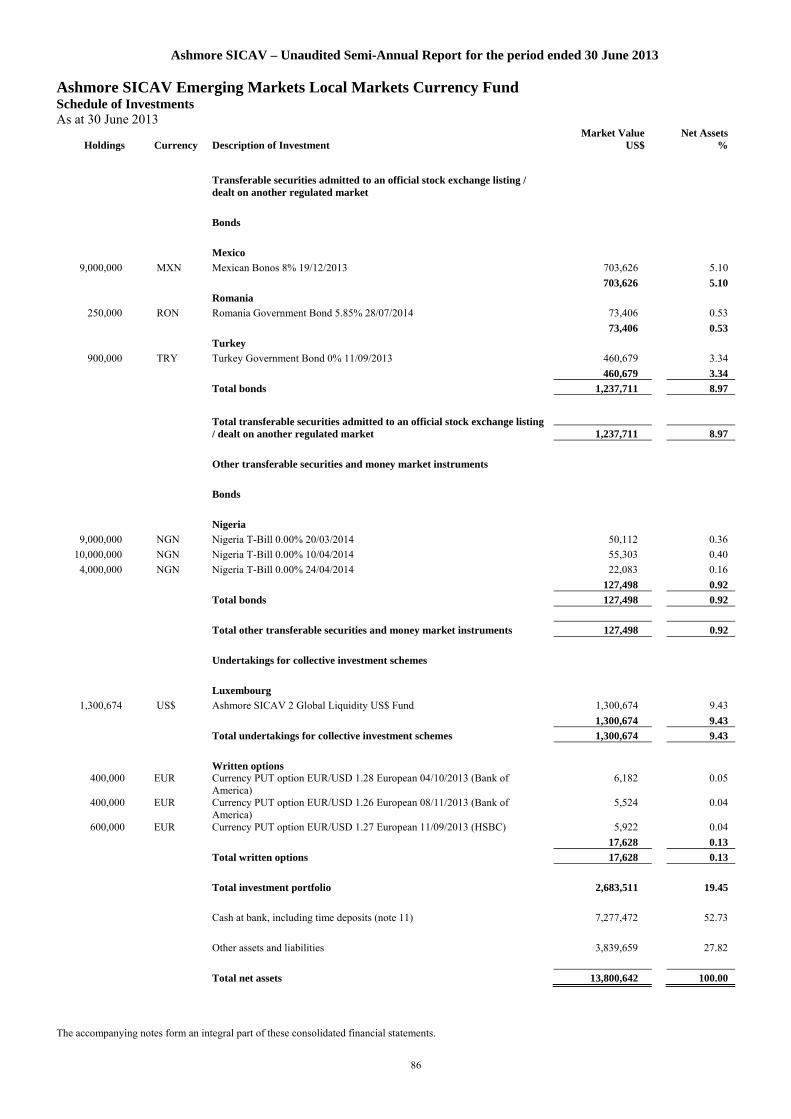
Ashmore SICAV – Unaudited Semi-Annual Report for the period ended 30 June 2013
86
Ashmore SICAV Emerging Markets Local Markets Currency Fund Schedule of Investments As at 30 June 2013
Holdings
Currency Description of Investment Market Value
US$ Net Assets
%
Transferable securities admitted to an official stock exchange listing / dealt on another regulated market
Bonds
Mexico
9,000,000 MXN Mexican Bonos 8% 19/12/2013 703,626 5.10
703,626 5.10
Romania
250,000 RON Romania Government Bond 5.85% 28/07/2014 73,406 0.53
73,406 0.53
Turkey
900,000 TRY Turkey Government Bond 0% 11/09/2013 460,679 3.34
460,679 3.34
Total bonds 1,237,711 8.97
Total transferable securities admitted to an official stock exchange listing / dealt on another regulated market 1,237,711 8.97
Other transferable securities and money market instruments
Bonds
Nigeria
9,000,000 NGN Nigeria T-Bill 0.00% 20/03/2014 50,112 0.36
10,000,000 NGN Nigeria T-Bill 0.00% 10/04/2014 55,303 0.40
4,000,000 NGN Nigeria T-Bill 0.00% 24/04/2014 22,083 0.16
127,498 0.92
Total bonds 127,498 0.92
Total other transferable securities and money market instruments 127,498 0.92
Undertakings for collective investment schemes
Luxembourg
1,300,674 US$ Ashmore SICAV 2 Global Liquidity US$ Fund 1,300,674 9.43
1,300,674 9.43
Total undertakings for collective investment schemes 1,300,674 9.43
Written options 400,000 EUR Currency PUT option EUR/USD 1.28 European 04/10/2013 (Bank of
America) 6,182 0.05
400,000 EUR Currency PUT option EUR/USD 1.26 European 08/11/2013 (Bank of America)
5,524 0.04
600,000 EUR Currency PUT option EUR/USD 1.27 European 11/09/2013 (HSBC) 5,922 0.04
17,628 0.13
Total written options 17,628 0.13
Total investment portfolio 2,683,511 19.45
Cash at bank, including time deposits (note 11) 7,277,472 52.73
Other assets and liabilities 3,839,659 27.82
Total net assets 13,800,642 100.00
The accompanying notes form an integral part of these consolidated financial statements.

Ashmore SICAV – Unaudited Semi-Annual Report for the period ended 30 June 2013
87
Ashmore SICAV Emerging Markets Investment Grade Local Currency Fund Schedule of Investments As at 30 June 2013
Holdings
Currency Description of Investment Market Value
US$ Net Assets
%
Transferable securities admitted to an official stock exchange listing / dealt on another regulated market
Bonds
Brazil
3,591,000 BRL Brazil Letras do Tesouro Nacional 0% 01/01/2017 11,229,650 3.40
820,000 BRL Brazil Notas do Tesouro Nacional Serie B 6% 15/08/2020 9,167,686 2.77
2,494,000 BRL Brazil Notas do Tesouro Nacional Serie F 10% 01/01/2021 11,262,393 3.40
1,879,000 BRL Brazil Notas do Tesouro Nacional Serie F 10% 01/01/2023 8,386,110 2.54
10,090,000 BRL Brazilian Government International Bond 8.5% 05/01/2024 4,202,168 1.27
44,248,007 13.38
Chile
100,000,000 CLP Bonos de la Tesoreria de la Republica en pesos 6% 01/01/2020 205,062 0.06
431,000,000 CLP Chile Government International Bond 5.5% 05/08/2020 858,260 0.26
1,063,322 0.32
Colombia
1,523,000,000 COP Colombia Government International Bond 4.375% 21/03/2023 693,975 0.21
3,139,000,000 COP Colombia Government International Bond 7.75% 14/04/2021 1,826,431 0.55
3,411,000,000 COP Colombia Government International Bond 9.85% 28/06/2027 2,320,275 0.70
7,021,000,000 COP Colombia Government International Bond 12% 22/10/2015 4,175,337 1.26
2,402,000,000 COP Colombian TES 7.5% 26/08/2026 1,248,978 0.38
10,264,996 3.10
Mexico
82,300,000 MXN Mexican Bonos 6.5% 10/06/2021 6,661,916 2.01
73,800,000 MXN Mexican Bonos 7.5% 03/06/2027 6,345,474 1.92
33,160,000 MXN Mexican Bonos 7.75% 29/05/2031 2,813,373 0.85
21,300,000 MXN Mexican Bonos 7.75% 13/11/2042 1,761,134 0.53
59,770,000 MXN Mexican Bonos 8.5% 31/05/2029 5,469,449 1.65
49,100,000 MXN Mexican Bonos 8.5% 18/11/2038 4,390,618 1.33
51,100,000 MXN Mexican Bonos 10% 20/11/2036 5,222,322 1.58
3,550,000 MXN Mexican Udibonos 4% 15/11/2040 1,485,428 0.45
34,149,714 10.32
Philippines
50,000,000 PHP Philippine Government International Bond 4.95% 15/01/2021 1,166,829 0.35
25,000,000 PHP Philippine Government International Bond 6.25% 14/01/2036 615,197 0.19
1,782,026 0.54
Poland
9,340,000 PLN Poland Government Bond 0% 25/01/2014 2,759,651 0.83
6,580,000 PLN Poland Government Bond 0% 25/07/2014 1,917,698 0.58
3,740,000 PLN Poland Government Bond 2.75% 25/08/2023 1,330,724 0.40
19,070,000 PLN Poland Government Bond 3% 24/08/2016 7,612,642 2.30
18,809,000 PLN Poland Government Bond 4% 25/10/2023 5,482,606 1.66
5,720,000 PLN Poland Government Bond 5.25% 25/10/2017 1,825,623 0.55
16,710,000 PLN Poland Government Bond 5.75% 25/10/2021 5,545,171 1.68
18,435,000 PLN Poland Government Bond 5.75% 23/09/2022 6,106,540 1.85
32,580,655 9.85 The accompanying notes form an integral part of these consolidated financial statements.
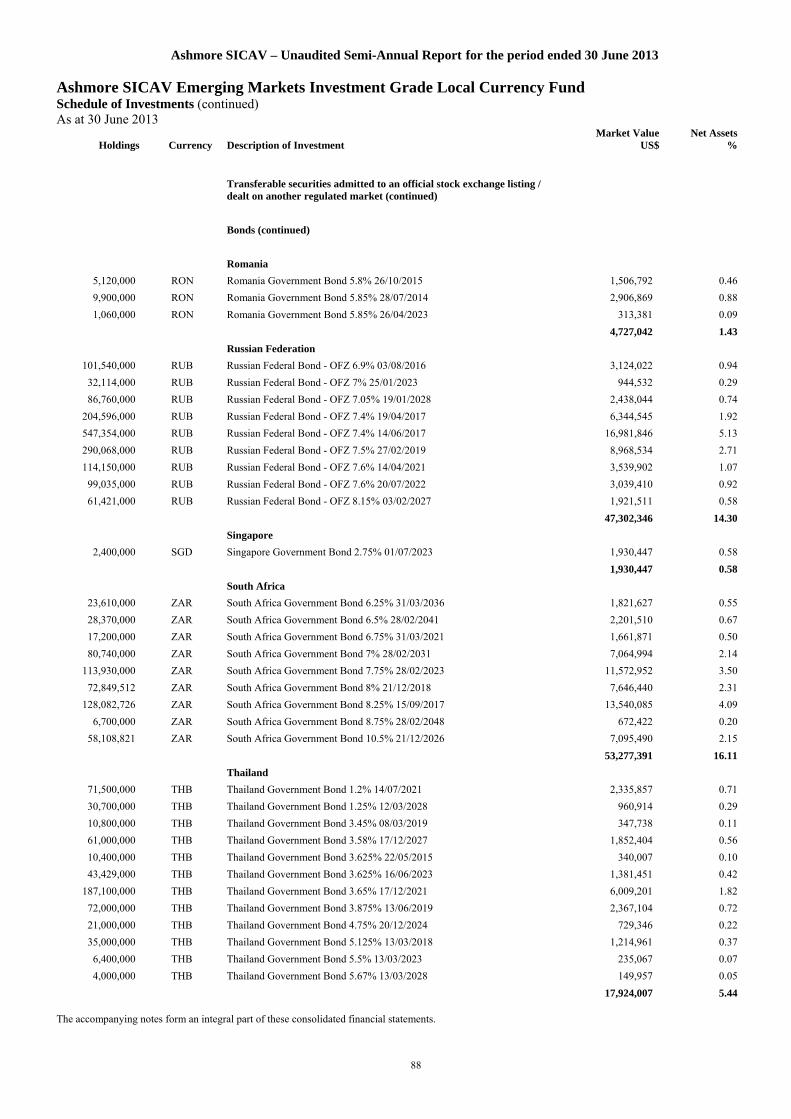
Ashmore SICAV – Unaudited Semi-Annual Report for the period ended 30 June 2013
88
Ashmore SICAV Emerging Markets Investment Grade Local Currency Fund Schedule of Investments (continued) As at 30 June 2013
Holdings
Currency Description of Investment Market Value
US$ Net Assets
%
Transferable securities admitted to an official stock exchange listing / dealt on another regulated market (continued)
Bonds (continued)
Romania
5,120,000 RON Romania Government Bond 5.8% 26/10/2015 1,506,792 0.46
9,900,000 RON Romania Government Bond 5.85% 28/07/2014 2,906,869 0.88
1,060,000 RON Romania Government Bond 5.85% 26/04/2023 313,381 0.09
4,727,042 1.43
Russian Federation
101,540,000 RUB Russian Federal Bond - OFZ 6.9% 03/08/2016 3,124,022 0.94
32,114,000 RUB Russian Federal Bond - OFZ 7% 25/01/2023 944,532 0.29
86,760,000 RUB Russian Federal Bond - OFZ 7.05% 19/01/2028 2,438,044 0.74
204,596,000 RUB Russian Federal Bond - OFZ 7.4% 19/04/2017 6,344,545 1.92
547,354,000 RUB Russian Federal Bond - OFZ 7.4% 14/06/2017 16,981,846 5.13
290,068,000 RUB Russian Federal Bond - OFZ 7.5% 27/02/2019 8,968,534 2.71
114,150,000 RUB Russian Federal Bond - OFZ 7.6% 14/04/2021 3,539,902 1.07
99,035,000 RUB Russian Federal Bond - OFZ 7.6% 20/07/2022 3,039,410 0.92
61,421,000 RUB Russian Federal Bond - OFZ 8.15% 03/02/2027 1,921,511 0.58
47,302,346 14.30
Singapore
2,400,000 SGD Singapore Government Bond 2.75% 01/07/2023 1,930,447 0.58
1,930,447 0.58
South Africa
23,610,000 ZAR South Africa Government Bond 6.25% 31/03/2036 1,821,627 0.55
28,370,000 ZAR South Africa Government Bond 6.5% 28/02/2041 2,201,510 0.67
17,200,000 ZAR South Africa Government Bond 6.75% 31/03/2021 1,661,871 0.50
80,740,000 ZAR South Africa Government Bond 7% 28/02/2031 7,064,994 2.14
113,930,000 ZAR South Africa Government Bond 7.75% 28/02/2023 11,572,952 3.50
72,849,512 ZAR South Africa Government Bond 8% 21/12/2018 7,646,440 2.31
128,082,726 ZAR South Africa Government Bond 8.25% 15/09/2017 13,540,085 4.09
6,700,000 ZAR South Africa Government Bond 8.75% 28/02/2048 672,422 0.20
58,108,821 ZAR South Africa Government Bond 10.5% 21/12/2026 7,095,490 2.15
53,277,391 16.11
Thailand
71,500,000 THB Thailand Government Bond 1.2% 14/07/2021 2,335,857 0.71
30,700,000 THB Thailand Government Bond 1.25% 12/03/2028 960,914 0.29
10,800,000 THB Thailand Government Bond 3.45% 08/03/2019 347,738 0.11
61,000,000 THB Thailand Government Bond 3.58% 17/12/2027 1,852,404 0.56
10,400,000 THB Thailand Government Bond 3.625% 22/05/2015 340,007 0.10
43,429,000 THB Thailand Government Bond 3.625% 16/06/2023 1,381,451 0.42
187,100,000 THB Thailand Government Bond 3.65% 17/12/2021 6,009,201 1.82
72,000,000 THB Thailand Government Bond 3.875% 13/06/2019 2,367,104 0.72
21,000,000 THB Thailand Government Bond 4.75% 20/12/2024 729,346 0.22
35,000,000 THB Thailand Government Bond 5.125% 13/03/2018 1,214,961 0.37
6,400,000 THB Thailand Government Bond 5.5% 13/03/2023 235,067 0.07
4,000,000 THB Thailand Government Bond 5.67% 13/03/2028 149,957 0.05
17,924,007 5.44 The accompanying notes form an integral part of these consolidated financial statements.

Ashmore SICAV – Unaudited Semi-Annual Report for the period ended 30 June 2013
89
Ashmore SICAV Emerging Markets Investment Grade Local Currency Fund Schedule of Investments (continued) As at 30 June 2013
Holdings
Currency Description of Investment Market Value
US$ Net Assets
%
Transferable securities admitted to an official stock exchange listing / dealt on another regulated market (continued)
Bonds (continued)
Uruguay
9,200,000 UYU Uruguay Government International Bond 3.25% Index Linked 27/01/2019 1,200,854 0.36
9,310,000 UYU Uruguay Government International Bond 3.7% 26/06/2037 754,705 0.23
11,720,000 UYU Uruguay Government International Bond 4.25% 05/04/2027 1,041,000 0.31
21,800,000 UYU Uruguay Government International Bond 4.375% 15/12/2028 1,403,881 0.42
8,870,000 UYU Uruguay Government International Bond 5% 14/09/2018 807,878 0.24
5,208,318 1.56
Total bonds 254,458,271 76.93
Transferable securities admitted to an official stock exchange listing / dealt on another regulated market (continued) 254,458,271 76.93
Other transferable securities and money market instruments
Bonds
Malaysia
5,300,000 MYR Malaysia Government Bond 3.314% 31/10/2017 1,671,591 0.51
330,000 MYR Malaysia Government Bond 3.418% 15/08/2022 102,580 0.03
2,660,000 MYR Malaysia Government Bond 3.48% 15/03/2023 829,183 0.25
9,300,000 MYR Malaysia Government Bond 3.492% 31/03/2020 2,931,135 0.89
200,000 MYR Malaysia Government Bond 3.502% 31/05/2027 61,436 0.02
8,400,000 MYR Malaysia Government Bond 3.58% 28/09/2018 2,661,772 0.80
7,100,000 MYR Malaysia Government Bond 4.012% 15/09/2017 2,292,555 0.69
5,400,000 MYR Malaysia Government Bond 4.16% 15/07/2021 1,764,117 0.53
7,100,000 MYR Malaysia Government Bond 4.262% 15/09/2016 2,304,982 0.70
16,400,000 MYR Malaysia Government Bond 4.378% 29/11/2019 5,429,015 1.64
14,600,000 MYR Malaysia Government Bond 4.392% 15/04/2026 4,885,660 1.48
3,400,000 MYR Malaysia Government Bond 4.498% 15/04/2030 1,168,016 0.35
200,000 MYR Malaysia Government Bond 5.248% 15/09/2028 73,625 0.02
26,175,667 7.91
Peru
4,030,000 PEN Peruvian Government International Bond 6.95% 12/08/2031 1,506,252 0.46
4,920,000 PEN Peruvian Government International Bond 7.84% 12/08/2020 2,035,380 0.62
3,179,000 PEN Peruvian Government International Bond 8.2% 12/08/2026 1,395,698 0.42
2,660,000 PEN Peruvian Government International Bond 8.6% 12/08/2017 1,114,963 0.34
6,052,293 1.84
Total bonds 32,227,960 9.75
Total other transferable securities and money market instruments 32,227,960 9.75 The accompanying notes form an integral part of these consolidated financial statements.

Ashmore SICAV – Unaudited Semi-Annual Report for the period ended 30 June 2013
90
Ashmore SICAV Emerging Markets Investment Grade Local Currency Fund Schedule of Investments (continued) As at 30 June 2013
Holdings
Currency Description of Investment Market Value
US$ Net Assets
%
Fully-funded total return swaps
Colombia
2,914,000,000 COP Colombian TES 8% 28/10/2015 1,597,589 0.48
1,597,589 0.48
India
58,000,000 INR India Government Bond 7.83% 11/04/2018 979,373 0.30
266,000,000 INR India Government Bond 8.07% 03/07/2017 4,538,428 1.37
5,517,801 1.67
Republic of South Korea
840,000,000 KRW Korea Treasury Bond 5% 10/06/2020 813,072 0.24
813,072 0.24
Total fully-funded total return swaps 7,928,462 2.39
Undertakings for collective investments
Luxembourg
13,501,365 US$ Ashmore SICAV 2 Global Liquidity US$ Fund 13,501,365 4.08
13,501,365 4.08
Total undertakings for collective investments 13,501,365 4.08
Written options 10,800,000 EUR Currency PUT option EUR/USD 1.26 European 08/11/2013 (Bank of
America) 149,137 0.05
4,000,000 EUR Currency PUT option EUR/USD 1.27 European 11/09/2013 (HSBC) 39,478 0.01 11,900,000 EUR Currency PUT option EUR/USD 1.27 European 11/09/2013 (HSBC) 117,446 0.04
10,800,000 EUR Currency PUT option EUR/USD 1.28 European 04/10/2013 (Bank of America)
166,923 0.05
472,984 0.15
Total written options 472,984 0.15
Total investment portfolio 308,589,042 93.30
Cash at bank 19,763,972 5.98
Other assets and liabilities 2,387,022 0.72
Total net assets 330,740,036 100.00
The accompanying notes form an integral part of these consolidated financial statements.

Ashmore SICAV – Unaudited Semi-Annual Report for the period ended 30 June 2013
91
Ashmore SICAV Emerging Markets Inflation Linked Bond Fund Schedule of Investments As at 30 June 2013
Holdings
Currency Description of Investment Market Value
US$ Net Assets
%
Transferable securities admitted to an official stock exchange listing / dealt on another regulated market
Bonds
Brazil
2,030,000 BRL Banco Votorantim SA 6.25% 16/05/2016 1,002,916 2.01
17,000 BRL Brazil Notas do Tesouro Nacional Serie B 6% 15/08/2016 186,697 0.37
95,000 BRL Brazil Notas do Tesouro Nacional Serie B 6% 15/05/2017 1,032,674 2.07
266,000 BRL Brazil Notas do Tesouro Nacional Serie B 6% 15/08/2020 2,973,908 5.96
83,000 BRL Brazil Notas do Tesouro Nacional Serie B 6% 15/08/2024 938,840 1.88
38,000 BRL Brazil Notas do Tesouro Nacional Serie B 6% 15/08/2030 432,723 0.87
72,000 BRL Brazil Notas do Tesouro Nacional Serie B 6% 15/05/2035 814,909 1.64
103,000 BRL Brazil Notas do Tesouro Nacional Serie B 6% 15/08/2040 1,183,653 2.37
213,000 BRL Brazil Notas do Tesouro Nacional Serie B 6% 15/05/2045 2,422,704 4.86
134,000 BRL Brazil Notas do Tesouro Nacional Serie B 6% 15/08/2050 1,547,343 3.10
12,536,367 25.13
Chile
5,000 CLP Bonos del Banco Central de Chile en UF 3% 01/02/2016 230,291 0.46
5,000 CLP Bonos del Banco Central de Chile en UF 3% 01/02/2021 236,072 0.47
7,000 CLP Bonos del Banco Central de Chile en UF 3% 01/02/2031 336,698 0.68
803,061 1.61
Israel
6,020,000 ILS Israel Government Bond - CPI Linked 3% 31/10/2019 2,091,087 4.19
2,300,000 ILS Israel Government Bond - CPI Linked 3.5% 30/04/2018 850,097 1.70
2,941,184 5.89
Mexico
7,182,000 MXN Mexican Udibonos 4% 15/11/2040 3,005,166 6.03
1,495,000 MXN Mexican Udibonos 4.5% 04/12/2025 706,989 1.42
8,050,000 MXN Mexican Udibonos 4.5% 22/11/2035 3,595,554 7.21
7,307,709 14.66
Poland
2,800,000 PLN Poland Government Bond 2.75% 25/08/2023 996,264 2.00
2,830,000 PLN Poland Government Bond 3% 24/08/2016 1,129,721 2.27
2,125,985 4.27
South Africa
6,300,000 ZAR South Africa Government Bond - CPI Linked 2.5% 31/01/2017 813,997 1.63
6,000,000 ZAR South Africa Government Bond - CPI Linked 2.6% 31/03/2028 908,897 1.82
4,870,000 ZAR South Africa Government Bond - CPI Linked 2.75% 31/01/2022 629,101 1.26
9,470,000 ZAR South Africa Government Bond - CPI Linked 3.45% 07/12/2033 1,899,629 3.81
7,415,000 ZAR South Africa Government Bond - CPI Linked 5.5% 07/12/2023 2,030,395 4.07
6,282,019 12.59
Thailand
14,200,000 THB Thailand Government Bond 1.2% 14/07/2021 463,904 0.93
12,500,000 THB Thailand Government Bond 1.25% 12/03/2028 391,252 0.78
855,156 1.71 The accompanying notes form an integral part of these consolidated financial statements.

Ashmore SICAV – Unaudited Semi-Annual Report for the period ended 30 June 2013
92
Ashmore SICAV Emerging Markets Inflation Linked Bond Fund Schedule of Investments (continued) As at 30 June 2013
Holdings Currency Description of Investment Market Value
US$ Net Assets
%
Transferable securities admitted to an official stock exchange listing / dealt on another regulated market (continued)
Bonds (continued)
Turkey
4,560,000 TRY Turkey Government Bond 3% 06/01/2021 2,867,797 5.75
1,410,000 TRY Turkey Government Bond 3% 23/02/2022 806,324 1.62
3,895,000 TRY Turkey Government Bond 4% 01/04/2020 2,702,396 5.42
3,010,000 TRY Turkey Government Bond 4.5% 11/02/2015 2,082,874 4.18
8,459,391 16.97
Uruguay
10,610,000 UYU Uruguay Government International Bond 3.7% 26/06/2037 860,088 1.72
23,840,000 UYU Uruguay Government International Bond 4.375% 15/12/2028 1,535,254 3.08
2,395,342 4.80
Total bonds 43,706,214 87.63
Total transferable securities admitted to an official stock exchange listing / dealt on another regulated market 43,706,214 87.63
Other transferable securities and money market instruments
Bonds
Brazil
900,000 BRL Cia Energetica de Sao Paulo 9.75% 15/01/2015 630,000 1.26
630,000 1.26
Total bonds 630,000 1.26
Total other transferable securities and money market instruments
630,000 1.26
Written options 1,800,000 EUR Currency PUT option EUR/USD 1.26 European 08/11/2013 (Bank of
America) 24,856 0.05
2,300,000 EUR Currency PUT option EUR/USD 1.27 European 11/09/2013(HSBC) 22,700 0.05
1,800,000 EUR Currency PUT option EUR/USD 1.28 European 04/10/2013 (Bank of America)
27,820 0.06
75,376 0.16
Total written options 75,376 0.16
Total investment portfolio 44,411,590 89.05
Cash at bank 4,607,170 9.24
Other assets and liabilities 851,095 1.71
Total net assets 49,869,855 100.00
The accompanying notes form an integral part of these consolidated financial statements.

Ashmore SICAV – Unaudited Semi-Annual Report for the period ended 30 June 2013
93
Ashmore SICAV Emerging Markets Total Return Fund Schedule of Investments As at 30 June 2013
Holdings
Currency Description of Investment Market Value
US$ Net Asset
%
Transferable securities admitted to an official stock exchange listing / dealt on another regulated market
Bonds
Argentina
914,000 US$ Argentina Boden Bonds 7% 03/10/2015 792,895 0.26
1,297,756 US$ Argentine Republic Government International Bond 8.28% 31/12/2033 725,967 0.24
238,000 US$ Argentine Republic Government International Bond 8.75% 02/06/2017 180,285 0.06
213,000 US$ Argentine Republic Government International Bond Step Cpn 31/12/2038 69,225 0.02
3,235,000 US$ WPE International Cooperatief UA 10.375% 30/09/2020 2,523,300 0.83
4,291,672 1.41
Azerbaijan
550,000 US$ State Oil Co of the Azerbaijan Republic 4.75% 13/03/2023 497,750 0.16
365,000 US$ State Oil Co of the Azerbaijan Republic 5.45% 09/02/2017 375,038 0.12
872,788 0.28
Belarus
610,000 US$ Republic of Belarus 8.75% 03/08/2015 611,525 0.20
640,000 US$ Republic of Belarus 8.95% 26/01/2018 638,400 0.21
1,249,925 0.41
Bolivia
350,000 US$ Bolivian Government International Bond 4.875% 29/10/2022 327,250 0.11
327,250 0.11
Brazil
270,000 US$ Banco Nacional de Desenvolvimento Economico e Social 5.5% 12/07/2020 278,775 0.09
380,000 US$ Banco Nacional de Desenvolvimento Economico e Social 6.5% 10/06/2019 414,200 0.14
500,000 BRL Banco Santander Brasil SA/Cayman Islands 8% 18/03/2016 208,234 0.07
3,000,000 BRL Banco Votorantim SA 6.25% 16/05/2016 1,487,749 0.49
700,000 BRL Brazil Letras do Tesouro Nacional 0% 01/01/2017 2,189,016 0.72
265,000 BRL Brazil Notas do Tesouro Nacional Serie B 6% 15/08/2020 2,962,728 0.97
365,000 BRL Brazil Notas do Tesouro Nacional Serie F 10% 01/01/2021 1,648,265 0.54
150,000 BRL Brazil Notas do Tesouro Nacional Serie F 10% 01/01/2023 669,461 0.22
250,000 US$ Brazilian Government International Bond 2.625% 05/01/2023 217,500 0.07
785,000 US$ Brazilian Government International Bond 4.875% 22/01/2021 837,988 0.27
200,000 US$ Brazilian Government International Bond 5.875% 15/01/2019 227,800 0.07
388,000 US$ Brazilian Government International Bond 8.25% 20/01/2034 514,100 0.17
2,370,000 BRL Brazilian Government International Bond 8.5% 05/01/2024 987,031 0.32
237,000 US$ Brazilian Government International Bond 8.875% 15/04/2024 327,060 0.11
290,000 US$ Brazilian Government International Bond 10.125% 15/05/2027 449,500 0.15
900,000 BRL Cosan Luxembourg SA 9.5% 14/03/2018 387,553 0.13
700,000 US$ Fibria Overseas Finance Ltd 6.75% 03/03/2021 750,050 0.25
1,350,000 US$ JBS Finance II Ltd 8.25% 29/01/2018 1,370,250 0.45
1,563,000 US$ Marfrig Holding Europe BV 8.375% 09/05/2018 1,469,220 0.48
300,000 US$ Marfrig Overseas Ltd 9.5% 04/05/2020 297,375 0.10
950,000 US$ Minerva Luxembourg SA 12.25% 10/02/2022 1,135,250 0.37
700,000 US$ Minerva Luxembourg SA 7.75% 31/01/2023 696,500 0.23
1,700,000 US$ OGX Austria GmbH 8.5% 01/06/2018 535,500 0.18
500,000 BRL Oi SA 9.75% 15/09/2016 209,366 0.07
800,000 US$ OSX 3 Leasing BV 9.25% 20/03/2015 696,000 0.23
20,966,471 6.89 The accompanying notes form an integral part of these consolidated financial statements.

Ashmore SICAV – Unaudited Semi-Annual Report for the period ended 30 June 2013
94
Ashmore SICAV Emerging Markets Total Return Fund Schedule of Investments (continued) As at 30 June 2013
Holdings
Currency Description of Investment Market Value
US$ Net Assets
%
Transferable securities admitted to an official stock exchange listing / dealt on another regulated market (continued)
Bonds (continued)
Chile
700,000 US$ Automotores Gildemeister SA 6.75% 15/01/2023 595,000 0.20
170,000 US$ Banco del Estado de Chile 3.875% 08/02/2022 164,868 0.05
215,000 US$ Banco del Estado de Chile 4.125% 07/10/2020 215,615 0.07
175,000,000 CLP Banco Santander Chile 6.5% 22/09/2020 340,699 0.11
30,000,000 CLP Bonos de la Tesoreria de la Republica en pesos 6% 01/01/2020 61,519 0.02
90,000,000 CLP Chile Government International Bond 5.5% 05/08/2020 179,219 0.06
190,000 US$ Corp Nacional del Cobre de Chile 3.75% 04/11/2020 184,896 0.06
200,000 US$ Corp Nacional del Cobre de Chile 3.875% 03/11/2021 195,072 0.06
100,000 US$ Corp Nacional del Cobre de Chile 7.5% 15/01/2019 119,614 0.04
130,000 US$ Empresa Nacional del Petroleo 5.25% 10/08/2020 131,852 0.04
100,000 US$ Empresa Nacional del Petroleo 6.25% 08/07/2019 107,698 0.04
567,069 US$ Inversiones Alsacia SA 8% 18/08/2018 479,173 0.16
700,000 US$ SMU SA 7.75% 08/02/2020 633,500 0.21
3,408,725 1.12
Colombia
400,000 US$ Colombia Government International Bond 4.375% 12/07/2021 416,600 0.14
978,000 US$ Colombia Government International Bond 6.125% 18/01/2041 1,088,025 0.36
560,000 US$ Colombia Government International Bond 7.375% 18/03/2019 680,960 0.22
390,000 US$ Colombia Government International Bond 7.375% 18/09/2037 498,225 0.16
610,000,000 COP Colombia Government International Bond 7.75% 14/04/2021 354,929 0.12
28,000 US$ Colombia Government International Bond 8.125% 21/05/2024 37,100 0.01
145,000 US$ Colombia Government International Bond 11.75% 25/02/2020 213,875 0.07
633,000,000 COP Colombian TES 7.5% 26/08/2026 329,144 0.11
453,000,000 COP Emgesa SA ESP 8.75% 25/01/2021 258,019 0.08
828,000,000 COP Empresa de Telecomunicaciones de Bogota 7% 17/01/2023 405,157 0.13
764,000,000 COP Empresas Publicas de Medellin ESP 8.375% 01/02/2021 423,291 0.14
4,705,325 1.54
Costa Rica
380,000 US$ Costa Rica Government International Bond 4.25% 26/01/2023 351,500 0.12
130,000 US$ Costa Rica Government International Bond 4.375% 30/04/2025 119,275 0.04
130,000 US$ Costa Rica Government International Bond 5.625% 30/04/2043 117,650 0.04
200,000 US$ Instituto Costarricense de Electricidad 6.375% 15/05/2043 181,250 0.06
769,675 0.26
Croatia
200,000 US$ Croatia Government International Bond 6.25% 27/04/2017 209,682 0.07
770,000 US$ Croatia Government International Bond 6.375% 24/03/2021 805,613 0.26
570,000 US$ Croatia Government International Bond 6.625% 14/07/2020 604,496 0.20
278,000 US$ Croatia Government International Bond 6.75% 05/11/2019 296,743 0.10
1,916,534 0.63 The accompanying notes form an integral part of these consolidated financial statements.

Ashmore SICAV – Unaudited Semi-Annual Report for the period ended 30 June 2013
95
Ashmore SICAV Emerging Markets Total Return Fund Schedule of Investments (continued) As at 30 June 2013
Holdings
Currency Description of Investment Market Value
US$ Net Assets
%
Transferable securities admitted to an official stock exchange listing / dealt on another regulated market (continued)
Bonds (continued)
Dominican Republic
350,000 US$ Dominican Republic International Bond 5.875% 18/04/2024 336,875 0.11
460,000 US$ Dominican Republic International Bond 7.5% 06/05/2021 495,650 0.16
832,525 0.27
Ecuador
151,000 US$ Ecuador Government International Bond 9.375% 15/12/2015 156,663 0.05
156,663 0.05
Egypt
205,000 US$ Egypt Government International Bond 6.875% 30/04/2040 145,591 0.05
100,000 US$ Nile Finance Ltd 5.25% 05/08/2015 89,000 0.03
234,591 0.08
El Salvador
310,000 US$ El Salvador Government International Bond 5.875% 30/01/2025 301,475 0.10
200,000 US$ El Salvador Government International Bond 7.375% 01/12/2019 220,500 0.07
190,000 US$ El Salvador Government International Bond 7.625% 01/02/2041 184,775 0.06
48,000 US$ El Salvador Government International Bond 7.65% 15/06/2035 46,920 0.02
46,000 US$ El Salvador Government International Bond 8.25% 10/04/2032 47,955 0.02
960,000 US$ Telemovil Finance Co Ltd 8% 01/10/2017 1,015,200 0.33
1,816,825 0.60
Gabon
150,000 US$ Gabonese Republic 8.2% 12/12/2017 168,750 0.06
168,750 0.06
Georgia
200,000 US$ Georgia Government International Bond 6.875% 12/04/2021 214,000 0.07
200,000 US$ Georgian Railway JSC 7.75% 11/07/2022 216,140 0.07
430,140 0.14
Ghana
670,000 GHS Ghana Government Bond 21% 26/10/2015 331,065 0.11
300,000 US$ Republic of Ghana 8.5% 04/10/2017 316,500 0.10
647,565 0.21
Guatemala
400,000 US$ Guatemala Government Bond 4.875% 13/02/2028 362,000 0.12
362,000 0.12
Hong Kong
500,000 US$ Central China Real Estate Ltd 6.5% 04/06/2018 450,840 0.15
2,150,000 US$ CFG Investment SAC 9.75% 30/07/2019 1,924,250 0.63
1,200,000 US$ Hengdeli Holdings Ltd 6.25% 29/01/2018 1,167,706 0.38
1,000,000 CNH RKI Finance 2011 Ltd 6% 25/02/2014 161,210 0.05
650,000 US$ Shimao Property Holdings Ltd 9.65% 03/08/2017 679,477 0.22
4,383,483 1.43 The accompanying notes form an integral part of these consolidated financial statements.

Ashmore SICAV – Unaudited Semi-Annual Report for the period ended 30 June 2013
96
Ashmore SICAV Emerging Markets Total Return Fund Schedule of Investments (continued) As at 30 June 2013
Holdings
Currency Description of Investment Market Value
US$ Net Assets
%
Transferable securities admitted to an official stock exchange listing / dealt on another regulated market (continued)
Bonds (continued)
Hungary
365,000,000 HUF Hungary Government Bond 5.5% 12/02/2016 1,635,683 0.54
35,000,000 HUF Hungary Government Bond 6.5% 24/06/2019 162,149 0.05
311,130,000 HUF Hungary Government Bond 6.75% 24/11/2017 1,446,644 0.47
152,370,000 HUF Hungary Government Bond 7% 24/06/2022 714,034 0.23
186,000 US$ Hungary Government International Bond 5.375% 21/02/2023 179,025 0.06
335,000 US$ Hungary Government International Bond 6.25% 29/01/2020 350,075 0.11
462,000 US$ Hungary Government International Bond 6.375% 29/03/2021 480,480 0.16
582,000 US$ Hungary Government International Bond 7.625% 29/03/2041 607,608 0.20
5,575,698 1.82
India
400,000 US$ Bharti Airtel International Netherlands BV 5.125% 11/03/2023 363,520 0.12
200,000 US$ Export-Import Bank of India 4% 14/01/2023 177,860 0.06
1,150,000 US$ Vedanta Resources PLC 8.25% 07/06/2021 1,158,625 0.38
100,000 US$ Vedanta Resources PLC 9.5% 18/07/2018 109,250 0.04
1,809,255 0.60
Indonesia
300,000 US$ Indo Energy Finance II BV 6.375% 24/01/2023 261,750 0.09
310,000 US$ Indonesia Government International Bond 4.875% 05/05/2021 317,750 0.10
200,000 US$ Indonesia Government International Bond 5.875% 13/03/2020 216,500 0.07
250,000 US$ Indonesia Government International Bond 6.625% 17/02/2037 272,500 0.09
250,000 US$ Indonesia Government International Bond 6.875% 17/01/2018 280,625 0.09
300,000 US$ Indonesia Government International Bond 7.75% 17/01/2038 370,500 0.12
214,000 US$ Indonesia Government International Bond 8.5% 12/10/2035 281,410 0.09
200,000 US$ Indonesia Government International Bond 11.625% 04/03/2019 272,000 0.09
4,300,000,000 IDR Indonesia Treasury Bond 6.125% 15/05/2028 375,179 0.12
500,000,000 IDR Indonesia Treasury Bond 6.625% 15/05/2033 44,299 0.01
210,000 US$ Majapahit Holding BV 7.75% 17/10/2016 232,575 0.08
200,000 US$ Majapahit Holding BV 7.75% 20/01/2020 219,000 0.07
275,000 US$ Majapahit Holding BV 8% 07/08/2019 309,375 0.10
440,000 US$ Pertamina Persero PT 5.625% 20/05/2043 380,600 0.12
835,000 US$ Pertamina Persero PT 6% 03/05/2042 780,725 0.26
80,000 US$ Perusahaan Listrik Negara PT 5.25% 24/10/2042 66,400 0.02
410,000 US$ Perusahaan Listrik Negara PT 5.5% 22/11/2021 401,800 0.13
5,082,988 1.65
Israel
1,400,000 US$ Altice Finco SA 9.875% 15/12/2020 1,498,000 0.49
1,250,000 ILS Plaza Centers NV 5.4% 01/07/2015 280,193 0.09
1,778,193 0.58
Ivory Coast
1,783,000 US$ Ivory Coast Government International Bond Step Cpn 31/12/2032 1,462,060 0.48
1,462,060 0.48
Jamaica
2,600,000 US$ Digicel Group Ltd 8.25% 30/09/2020 2,691,000 0.88
2,691,000 0.88 The accompanying notes form an integral part of these consolidated financial statements.

Ashmore SICAV – Unaudited Semi-Annual Report for the period ended 30 June 2013
97
Ashmore SICAV Emerging Markets Total Return Fund Schedule of Investments (continued) As at 30 June 2013
Holdings
Currency Description of Investment Market Value
US$ Net Assets
%
Transferable securities admitted to an official stock exchange listing / dealt on another regulated market (continued)
Bonds (continued)
Kazakhstan
500,000 US$ ATF Bank JSC 9% 11/05/2016 481,250 0.16
550,000 US$ Development Bank of Kazakhstan JSC 4.125% 10/12/2022 489,500 0.16
500,000 US$ Halyk Savings Bank of Kazakhstan JSC 7.25% 28/01/2021 512,500 0.17
460,000 US$ Kazakhstan Temir Zholy Finance BV 6.375% 06/10/2020 496,800 0.16
330,000 US$ Kazakhstan Temir Zholy Finance BV 6.95% 10/07/2042 335,379 0.11
250,000 US$ Kazatomprom Natsionalnaya Atomnaya Kompaniya AO 6.25% 20/05/2015 260,000 0.09
2,050,000 US$ Kazkommertsbank JSC 8.5% 11/05/2018 1,947,500 0.64
200,000 US$ KazMunayGas National Co JSC 4.4% 30/04/2023 185,500 0.06
490,000 US$ KazMunayGas National Co JSC 5.75% 30/04/2043 433,650 0.14
170,000 US$ KazMunayGas National Co JSC 7% 05/05/2020 192,100 0.06
127,000 US$ KazMunayGas National Co JSC 9.125% 02/07/2018 152,082 0.05
200,000 US$ KazMunayGas National Co JSC 11.75% 23/01/2015 226,500 0.07
800,000 US$ Zhaikmunai LP 7.125% 13/11/2019 802,000 0.26
6,514,761 2.13
Latvia
500,000 US$ Republic of Latvia 2.75% 12/01/2020 462,500 0.15
462,500 0.15
Lebanon
222,000 US$ Lebanon Government International Bond 5.15% 12/11/2018 212,010 0.07
609,000 US$ Lebanon Government International Bond 6.1% 04/10/2022 566,370 0.19
444,000 US$ Lebanon Government International Bond 6.375% 09/03/2020 421,800 0.14
215,000 US$ Lebanon Government International Bond 6.6% 27/11/2026 199,950 0.07
81,000 US$ Lebanon Government International Bond 8.25% 12/04/2021 86,265 0.03
1,486,395 0.50
Lithuania
300,000 US$ Lithuania Government International Bond 5.125% 14/09/2017 320,820 0.11
140,000 US$ Lithuania Government International Bond 6.125% 09/03/2021 156,100 0.05
723,000 US$ Lithuania Government International Bond 6.625% 01/02/2022 830,546 0.27
560,000 US$ Lithuania Government International Bond 7.375% 11/02/2020 665,000 0.22
1,972,466 0.65
Malaysia
241,000 US$ Petronas Capital Ltd 5.25% 12/08/2019 263,137 0.09
200,000 US$ Petronas Capital Ltd 7.875% 22/05/2022 252,699 0.08
250,000 US$ Wakala Global Sukuk Bhd 4.646% 06/07/2021 262,227 0.09
778,063 0.26
Mexico
5,770,000 MXN America Movil SAB de CV 6.45% 05/12/2022 428,989 0.14
2,354,000 US$ Cemex Espana Luxembourg 9.25% 12/05/2020 2,483,470 0.81
200,000 US$ Comision Federal de Electricidad 4.875% 26/05/2021 204,500 0.07
200,000 US$ Comision Federal de Electricidad 5.75% 14/02/2042 185,000 0.06
800,000 US$ Corp GEO SAB de CV 8.875% 27/03/2022 352,000 0.12
800,000 US$ Desarrolladora Homex SAB de CV 9.75% 25/03/2020 272,000 0.09
2,900,000 MXN Grupo Televisa SAB 7.25% 14/05/2043 188,822 0.06
The accompanying notes form an integral part of these consolidated financial statements.

Ashmore SICAV – Unaudited Semi-Annual Report for the period ended 30 June 2013
98
Ashmore SICAV Emerging Markets Total Return Fund Schedule of Investments (continued) As at 30 June 2013
Holdings
Currency Description of Investment Market Value
US$ Net Assets
%
Transferable securities admitted to an official stock exchange listing / dealt on another regulated market (continued)
Bonds (continued)
Mexico (continued)
9,000,000 MXN Mexican Bonos 7.5% 03/06/2027 773,838 0.25
8,370,000 MXN Mexican Bonos 7.75% 29/05/2031 710,131 0.23
3,700,000 MXN Mexican Bonos 8.5% 18/11/2038 330,861 0.11
14,030,000 MXN Mexican Bonos 8.5% 31/05/2029 1,283,861 0.42
7,960,000 MXN Mexican Bonos 10% 20/11/2036 813,497 0.27
1,120,000 MXN Mexican Udibonos 4% 15/11/2040 468,642 0.15
170,000 US$ Mexico Government International Bond 4.75% 08/03/2044 151,300 0.05
144,000 US$ Mexico Government International Bond 5.75% 12/10/2110 131,400 0.04
162,000 US$ Mexico Government International Bond 5.95% 19/03/2019 185,409 0.06
60,000 US$ Mexico Government International Bond 6.05% 11/01/2040 65,400 0.02
474,000 US$ Mexico Government International Bond 6.75% 27/09/2034 559,320 0.18
1,700,000 US$ NII Capital Corp 7.625% 01/04/2021 1,321,750 0.43
400,000 US$ NII Capital Corp 10% 15/08/2016 388,000 0.13
194,000 US$ Pemex Project Funding Master Trust 5.75% 01/03/2018 212,430 0.07
82,000 US$ Petroleos Mexicanos 5.5% 27/06/2044 73,800 0.02
140,000 US$ Petroleos Mexicanos 6% 05/03/2020 154,000 0.05
348,000 US$ Petroleos Mexicanos 6.5% 02/06/2041 359,310 0.12
3,220,000 MXN Petroleos Mexicanos 7.65% 24/11/2021 261,514 0.09
239,000 US$ Petroleos Mexicanos 8% 03/05/2019 289,190 0.09
1,100,000 US$ Urbi Desarrollos Urbanos SAB de CV 9.5% 21/01/2020 242,000 0.08
2,450,000 US$ Urbi Desarrollos Urbanos SAB de CV 9.75% 03/02/2022 539,000 0.18
100,000 US$ Urbi Desarrollos Urbanos SAB de CV FRN 19/04/2016 (Defaulted) 22,000 0.01
13,451,434 4.40
Mongolia
230,000 US$ Mongolia Government International Bond 5.125% 05/12/2022 202,400 0.07
1,200,000 US$ Mongolian Mining Corp 8.875% 29/03/2017 1,020,000 0.33
1,222,400 0.40
Morocco
200,000 US$ Morocco Government International Bond 4.25% 11/12/2022 176,040 0.06
300,000 US$ Morocco Government International Bond 5.5% 11/12/2042 250,560 0.08
426,600 0.14
Nigeria
1,000,000 US$ Afren PLC 10.25% 08/04/2019 1,117,500 0.37
1,100,000 US$ Afren PLC 11.5% 01/02/2016 1,221,000 0.40
50,000,000 NGN Nigeria Government Bond 16% 29/06/2019 330,148 0.11
134,400,000 NGN Nigeria Government Bond 16.39% 27/01/2022 923,575 0.30
200,000 US$ Nigeria Government International Bond 6.75% 28/01/2021 209,000 0.07
3,801,223 1.25
Pakistan
100,000 US$ Pakistan Government International Bond 6.875% 01/06/2017 93,000 0.03
130,000 US$ Pakistan Government International Bond 7.125% 31/03/2016 123,500 0.04
216,500 0.07 The accompanying notes form an integral part of these consolidated financial statements.

Ashmore SICAV – Unaudited Semi-Annual Report for the period ended 30 June 2013
99
Ashmore SICAV Emerging Markets Total Return Fund Schedule of Investments (continued) As at 30 June 2013
Holdings
Currency Description of Investment Market Value
US$ Net Assets
%
Transferable securities admitted to an official stock exchange listing / dealt on another regulated market (continued)
Bonds (continued)
Panama
60,000 US$ Panama Government International Bond 4.3% 29/04/2053 48,150 0.02
234,000 US$ Panama Government International Bond 6.7% 26/01/2036 272,025 0.09
200,000 US$ Panama Government International Bond 7.125% 29/01/2026 244,500 0.08
109,000 US$ Panama Government International Bond 8.875% 30/09/2027 150,420 0.05
201,000 US$ Panama Government International Bond 9.375% 01/04/2029 291,450 0.10
1,006,545 0.34
Paraguay
200,000 US$ Republic of Paraguay 4.625% 25/01/2023 193,000 0.06
200,000 US$ Telefonica Celular del Paraguay SA 6.75% 13/12/2022 207,500 0.07
400,500 0.13
People's Republic of China
564,000 US$ Agile Property Holdings Ltd 9.875% 20/03/2017 590,790 0.19
950,000 US$ China Oriental Group Co Ltd 7% 17/11/2017 874,000 0.29
3,000,000 CNH China SCE Property Holdings Ltd 10.5% 14/01/2016 481,779 0.16
2,000,000 CNH China Shanshui Cement Group Ltd 6.5% 22/07/2014 320,783 0.11
1,300,000 US$ China Shanshui Cement Group Ltd 10.5% 27/04/2017 1,358,500 0.45
300,000 US$ Country Garden Holdings Co Ltd 7.5% 10/01/2023 274,500 0.09
574,000 US$ Country Garden Holdings Co Ltd 11.125% 23/02/2018 622,790 0.20
2,990,000 CNH Evergrande Real Estate Group Ltd 9.25% 19/01/2016 450,863 0.15
1,253,000 US$ Evergrande Real Estate Group Ltd 13% 27/01/2015 1,290,590 0.42
700,000 US$ Fosun International Ltd 7.5% 12/05/2016 707,000 0.23
2,750,000 CNY Gemdale International Holding Ltd 9.15% 26/07/2015 453,977 0.15
700,000 US$ Gemdale International Investment Ltd 7.125% 16/11/2017 684,498 0.22
1,200,000 US$ Hidili Industry International Development Ltd 8.625% 04/11/2015 918,000 0.30
700,000 US$ Longfor Properties Co Ltd 9.5% 07/04/2016 750,750 0.25
1,000,000 CNH Powerlong Real Estate Holdings Ltd 11.5% 17/03/2014 161,814 0.05
972,000 US$ Sinochem Overseas Capital Co Ltd 4.5% 12/11/2020 958,301 0.31
385,000 US$ Sinochem Overseas Capital Co Ltd 6.3% 12/11/2040 381,638 0.13
1,900,000 US$ Sunac China Holdings Ltd 9.375% 05/04/2018 1,829,499 0.60
650,000 US$ Yanlord Land Group Ltd 9.5% 04/05/2017 672,750 0.22
700,000 US$ Yanlord Land Group Ltd 10.625% 29/03/2018 733,250 0.24
14,516,072 4.76
Peru
100,000 US$ Peruvian Government International Bond 7.125% 30/03/2019 121,000 0.04
460,000 US$ Peruvian Government International Bond 7.35% 21/07/2025 588,800 0.19
387,000 US$ Peruvian Government International Bond 8.75% 21/11/2033 563,085 0.18
1,272,885 0.41
Philippines
12,000,000 PHP Petron Corp 7% 10/11/2017 281,461 0.09
10,000,000 PHP Philippine Government International Bond 3.9% 26/11/2022 223,435 0.07
355,000 US$ Philippine Government International Bond 4% 15/01/2021 375,413 0.12
370,000 US$ Philippine Government International Bond 5.5% 30/03/2026 421,800 0.14
15,000,000 PHP Philippine Government International Bond 6.25% 14/01/2036 369,118 0.12
The accompanying notes form an integral part of these consolidated financial statements.

Ashmore SICAV – Unaudited Semi-Annual Report for the period ended 30 June 2013
100
Ashmore SICAV Emerging Markets Total Return Fund Schedule of Investments (continued) As at 30 June 2013
Holdings
Currency Description of Investment Market Value
US$ Net Assets
%
Transferable securities admitted to an official stock exchange listing / dealt on another regulated market (continued)
Bonds (continued)
Philippines (continued)
360,000 US$ Philippine Government International Bond 7.75% 14/01/2031 475,200 0.16
220,000 US$ Philippine Government International Bond 8.375% 17/06/2019 284,900 0.09
261,000 US$ Philippine Government International Bond 9.5% 02/02/2030 391,500 0.13
128,000 US$ Philippine Government International Bond 10.625% 16/03/2025 202,880 0.07
200,000 US$ Power Sector Assets & Liabilities Management Corp 7.25% 27/05/2019 234,500 0.08
365,000 US$ Power Sector Assets & Liabilities Management Corp 7.39% 02/12/2024 441,650 0.14
3,701,857 1.21
Poland
379,173 US$ CEDC Finance Corp International Inc 10% 30/04/2018 271,564 0.09
880,801 US$ CEDC Finance Corp International Inc Step Cpn 30/04/2018 778,980 0.26
1,200,000 US$ Eileme 2 AB 11.625% 31/01/2020 1,356,000 0.44
1,000,000 EUR Eileme 2 AB 11.75% 31/01/2020 1,475,330 0.49
750,000 PLN Poland Government Bond 2.75% 25/08/2023 266,856 0.09
4,330,000 PLN Poland Government Bond 3% 24/08/2016 1,728,513 0.57
2,709,000 PLN Poland Government Bond 4% 25/10/2023 789,642 0.26
9,348,000 PLN Poland Government Bond 4.75% 25/10/2016 2,923,083 0.96
5,173,000 PLN Poland Government Bond 5.25% 25/10/2017 1,651,040 0.54
7,753,000 PLN Poland Government Bond 5.75% 25/10/2021 2,572,813 0.85
1,110,000 PLN Poland Government Bond 5.75% 23/09/2022 367,684 0.12
417,000 US$ Poland Government International Bond 3% 17/03/2023 376,342 0.12
596,000 US$ Poland Government International Bond 5% 23/03/2022 640,700 0.21
523,000 US$ Poland Government International Bond 6.375% 15/07/2019 609,980 0.20
15,808,527 5.20
Qatar
200,000 US$ Qatar Government International Bond 5.75% 20/01/2042 215,000 0.07
335,000 US$ Qatar Government International Bond 6.4% 20/01/2040 392,788 0.13
607,788 0.20
Romania
350,000 RON Romania Government Bond 5.6% 28/11/2018 102,272 0.03
460,000 RON Romania Government Bond 5.75% 29/04/2020 134,190 0.05
1,370,000 RON Romania Government Bond 5.85% 28/07/2014 402,264 0.13
310,000 RON Romania Government Bond 5.85% 26/04/2023 91,649 0.03
1,460,000 RON Romania Government Bond 5.9% 26/07/2017 426,621 0.14
826,000 US$ Romanian Government International Bond 4.375% 22/08/2023 784,717 0.26
866,000 US$ Romanian Government International Bond 6.75% 07/02/2022 965,461 0.32
2,907,174 0.96
Russian Federation
500,000 US$ Alfa Bank OJSC Via Alfa Bond Issuance PLC 7.5% 26/09/2019 510,000 0.17
850,000 US$ Brunswick Rail Finance Ltd 6.5% 01/11/2017 841,500 0.28
1,300,000 US$ Credit Bank of Moscow Via CBOM Finance PLC 7.7% 01/02/2018 1,319,500 0.43
2,200,000 US$ Evraz Group SA 6.75% 27/04/2018 2,106,500 0.69
1,350,000 US$ Far East Capital Ltd SA 8% 02/05/2018 1,245,375 0.41
750,000 US$ Far East Capital Ltd SA 8.75% 02/05/2020 686,250 0.23 The accompanying notes form an integral part of these consolidated financial statements.

Ashmore SICAV – Unaudited Semi-Annual Report for the period ended 30 June 2013
101
Ashmore SICAV Emerging Markets Total Return Fund Schedule of Investments (continued) As at 30 June 2013
Holdings
Currency Description of Investment Market Value
US$ Net Assets
%
Transferable securities admitted to an official stock exchange listing / dealt on another regulated market (continued)
Bonds (continued)
Russian Federation (continued)
300,000 US$ Metalloinvest Finance Ltd 6.5% 21/07/2016 309,000 0.10
9,000,000 RUB Mobile Telesystems OJSC FRN 03/11/2020 276,075 0.09
1,700,000 US$ MTS International Funding Ltd 8.625% 22/06/2020 1,997,500 0.66
200,000 US$ Promsvyazbank OJSC Via PSB Finance SA 8.5% 25/04/2017 210,834 0.07
1,250,000 US$ Promsvyazbank OJSC Via PSB Finance SA 10.2% 06/11/2019 1,312,500 0.43
300,000 US$ Russian Agricultural Bank OJSC Via RSHB Capital SA 7.75% 29/05/2018 336,000 0.11
29,850,000 RUB Russian Federal Bond - OFZ 6.8% 11/12/2019 891,099 0.29
41,430,000 RUB Russian Federal Bond - OFZ 6.9% 03/08/2016 1,274,653 0.42
7,311,000 RUB Russian Federal Bond - OFZ 7% 25/01/2023 215,030 0.07
11,889,000 RUB Russian Federal Bond - OFZ 7.05% 19/01/2028 334,093 0.11
116,888,000 RUB Russian Federal Bond - OFZ 7.4% 19/04/2017 3,624,710 1.19
62,902,000 RUB Russian Federal Bond - OFZ 7.4% 14/06/2017 1,951,556 0.64
18,728,000 RUB Russian Federal Bond - OFZ 7.5% 15/03/2018 588,327 0.19
11,633,000 RUB Russian Federal Bond - OFZ 7.5% 27/02/2019 359,678 0.12
14,440,000 RUB Russian Federal Bond - OFZ 7.6% 14/04/2021 447,798 0.15
22,547,000 RUB Russian Federal Bond - OFZ 7.6% 20/07/2022 691,973 0.23
16,446,000 RUB Russian Federal Bond - OFZ 8.15% 03/02/2027 514,501 0.17
200,000 US$ Russian Foreign Bond - Eurobond 5% 29/04/2020 214,000 0.07
600,000 US$ Russian Foreign Bond - Eurobond 5.625% 04/04/2042 622,500 0.20
77,000 US$ Russian Foreign Bond - Eurobond 12.75% 24/06/2028 133,210 0.04
1,341,745 US$ Russian Foreign Bond - Eurobond Step Cpn 31/03/2030 1,571,519 0.52
1,150,000 US$ Russian Standard Bank Via Russian Standard Finance SA 9.25% 11/07/2017 1,190,307 0.39
700,000 US$ Severstal OAO Via Steel Capital SA 5.9% 17/10/2022 638,750 0.21
13,500,000 RUB Sibmetinvest OOO FRN 10/10/2019 433,852 0.14
15,000,000 RUB SUEK Finance FRN 26/06/2020 456,790 0.15
2,100,000 US$ TMK OAO Via TMK Capital SA 7.75% 27/01/2018 2,100,000 0.69 2,422,000 US$ Vimpel Communications Via VIP Finance Ireland Ltd OJSC 7.748% 02/02/202 2,582,457 0.85
14,500,000 RUB VimpelCom Holdings BV 9% 13/02/2018 435,108 0.14
196,000 US$ Vnesheconombank Via VEB Finance PLC 5.45% 22/11/2017 203,840 0.07
220,000 US$ Vnesheconombank Via VEB Finance PLC 6.8% 22/11/2025 234,300 0.08
971,000 US$ Vnesheconombank Via VEB Finance PLC 6.902% 09/07/2020 1,065,672 0.35
33,926,757 11.15
Senegal
400,000 US$ Senegal Government International Bond 8.75% 13/05/2021 416,000 0.14
416,000 0.14
Serbia
432,000 US$ Republic of Serbia 4.875% 25/02/2020 393,120 0.13
330,000 US$ Republic of Serbia 7.25% 28/09/2021 339,900 0.11
733,020 0.24
Singapore
750,000 US$ MMI International Ltd 8% 01/03/2017 753,750 0.25
750,000 SGD Olam International Ltd 6% 25/10/2022 513,345 0.17
600,000 SGD Singapore Government Bond 2.75% 01/07/2023 482,612 0.16
1,749,707 0.58 The accompanying notes form an integral part of these consolidated financial statements.

Ashmore SICAV – Unaudited Semi-Annual Report for the period ended 30 June 2013
102
Ashmore SICAV Emerging Markets Total Return Fund Schedule of Investments (continued) As at 30 June 2013
Holdings
Currency Description of Investment Market Value
US$ Net Assets
%
Transferable securities admitted to an official stock exchange listing / dealt on another regulated market (continued)
Bonds (continued)
South Africa
1,350,000 EUR Edcon Pty Ltd 9.5% 01/03/2018 1,505,995 0.49
600,000 US$ Sappi Papier Holding GmbH 8.375% 15/06/2019 633,000 0.21
4,660,000 ZAR South Africa Government Bond 6.25% 31/03/2036 359,542 0.12
4,400,000 ZAR South Africa Government Bond 6.5% 28/02/2041 341,440 0.11
17,820,000 ZAR South Africa Government Bond 7% 28/02/2031 1,559,304 0.51
19,100,000 ZAR South Africa Government Bond 7.75% 28/02/2023 1,940,168 0.64
12,800,000 ZAR South Africa Government Bond 8% 21/12/2018 1,343,515 0.44
20,100,000 ZAR South Africa Government Bond 8.25% 15/09/2017 2,124,843 0.70
2,700,000 ZAR South Africa Government Bond 8.75% 28/02/2048 270,976 0.09
9,400,000 ZAR South Africa Government Bond 10.5% 21/12/2026 1,147,805 0.38
447,000 US$ South Africa Government International Bond 5.5% 09/03/2020 471,026 0.15
180,000 US$ South Africa Government International Bond 5.875% 30/05/2022 192,600 0.06
195,000 US$ South Africa Government International Bond 6.25% 08/03/2041 208,650 0.07
285,000 US$ South Africa Government International Bond 6.875% 27/05/2019 322,763 0.11
12,421,627 4.08
Sri Lanka
280,000 US$ Bank of Ceylon 6.875% 03/05/2017 282,800 0.09
200,000 US$ Sri Lanka Government International Bond 5.875% 25/07/2022 189,000 0.06
163,000 US$ Sri Lanka Government International Bond 6.25% 04/10/2020 161,370 0.05
200,000 US$ Sri Lanka Government International Bond 6.25% 27/07/2021 197,000 0.06
50,000 US$ Sri Lanka Government International Bond 7.4% 22/01/2015 52,750 0.02
882,920 0.28
Thailand
20,200,000 THB Thailand Government Bond 1.2% 14/07/2021 659,920 0.22
11,100,000 THB Thailand Government Bond 1.25% 12/03/2028 347,431 0.12
13,000,000 THB Thailand Government Bond 3.58% 17/12/2027 394,775 0.13
20,700,000 THB Thailand Government Bond 3.625% 16/06/2023 658,455 0.22
33,600,000 THB Thailand Government Bond 3.65% 17/12/2021 1,079,151 0.35
17,000,000 THB Thailand Government Bond 3.875% 13/06/2019 558,900 0.18
3,698,632 1.22
Turkey
290,000 TRY Ronesans Holding FRN 18/12/2015 151,204 0.05
3,700,000 TRY Turkey Government Bond 3% 23/02/2022 2,115,885 0.69
900,000 TRY Turkey Government Bond 4% 01/04/2020 624,430 0.20
800,000 TRY Turkey Government Bond 7.1% 08/03/2023 381,456 0.13
1,130,000 TRY Turkey Government Bond 8.5% 14/09/2022 591,516 0.19
1,400,000 TRY Turkey Government Bond 9% 21/05/2014 1,045,911 0.34
970,000 TRY Turkey Government Bond 9.5% 12/01/2022 532,898 0.18
400,000 US$ Turkey Government International Bond 3.25% 23/03/2023 349,000 0.11
250,000 US$ Turkey Government International Bond 4.875% 16/04/2043 215,000 0.07
260,000 US$ Turkey Government International Bond 5.625% 30/03/2021 277,550 0.09
600,000 US$ Turkey Government International Bond 6% 14/01/2041 598,500 0.20
488,000 US$ Turkey Government International Bond 6.75% 03/04/2018 547,780 0.18
252,000 US$ Turkey Government International Bond 6.75% 30/05/2040 278,460 0.09
The accompanying notes form an integral part of these consolidated financial statements.
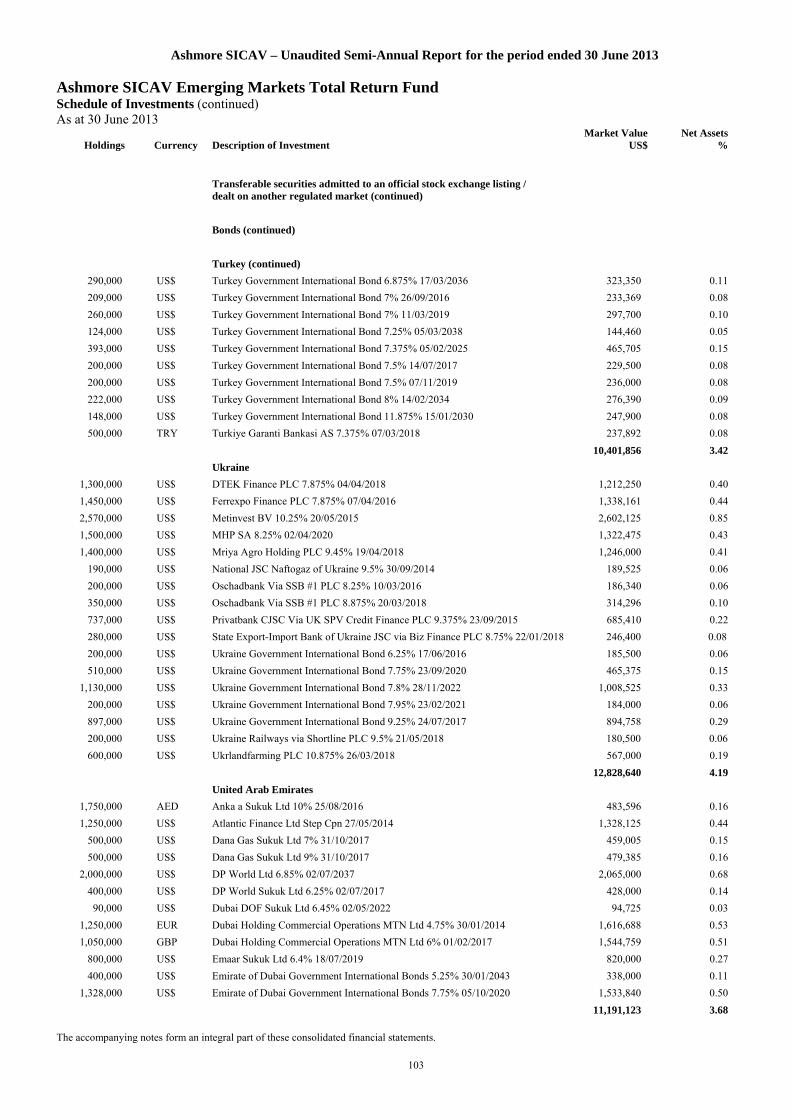
Ashmore SICAV – Unaudited Semi-Annual Report for the period ended 30 June 2013
103
Ashmore SICAV Emerging Markets Total Return Fund Schedule of Investments (continued) As at 30 June 2013
Holdings
Currency Description of Investment Market Value
US$ Net Assets
%
Transferable securities admitted to an official stock exchange listing / dealt on another regulated market (continued)
Bonds (continued)
Turkey (continued)
290,000 US$ Turkey Government International Bond 6.875% 17/03/2036 323,350 0.11
209,000 US$ Turkey Government International Bond 7% 26/09/2016 233,369 0.08
260,000 US$ Turkey Government International Bond 7% 11/03/2019 297,700 0.10
124,000 US$ Turkey Government International Bond 7.25% 05/03/2038 144,460 0.05
393,000 US$ Turkey Government International Bond 7.375% 05/02/2025 465,705 0.15
200,000 US$ Turkey Government International Bond 7.5% 14/07/2017 229,500 0.08
200,000 US$ Turkey Government International Bond 7.5% 07/11/2019 236,000 0.08
222,000 US$ Turkey Government International Bond 8% 14/02/2034 276,390 0.09
148,000 US$ Turkey Government International Bond 11.875% 15/01/2030 247,900 0.08
500,000 TRY Turkiye Garanti Bankasi AS 7.375% 07/03/2018 237,892 0.08
10,401,856 3.42
Ukraine
1,300,000 US$ DTEK Finance PLC 7.875% 04/04/2018 1,212,250 0.40
1,450,000 US$ Ferrexpo Finance PLC 7.875% 07/04/2016 1,338,161 0.44
2,570,000 US$ Metinvest BV 10.25% 20/05/2015 2,602,125 0.85
1,500,000 US$ MHP SA 8.25% 02/04/2020 1,322,475 0.43
1,400,000 US$ Mriya Agro Holding PLC 9.45% 19/04/2018 1,246,000 0.41
190,000 US$ National JSC Naftogaz of Ukraine 9.5% 30/09/2014 189,525 0.06
200,000 US$ Oschadbank Via SSB #1 PLC 8.25% 10/03/2016 186,340 0.06
350,000 US$ Oschadbank Via SSB #1 PLC 8.875% 20/03/2018 314,296 0.10
737,000 US$ Privatbank CJSC Via UK SPV Credit Finance PLC 9.375% 23/09/2015 685,410 0.22
280,000 US$ State Export-Import Bank of Ukraine JSC via Biz Finance PLC 8.75% 22/01/2018 246,400 0.08
200,000 US$ Ukraine Government International Bond 6.25% 17/06/2016 185,500 0.06
510,000 US$ Ukraine Government International Bond 7.75% 23/09/2020 465,375 0.15
1,130,000 US$ Ukraine Government International Bond 7.8% 28/11/2022 1,008,525 0.33
200,000 US$ Ukraine Government International Bond 7.95% 23/02/2021 184,000 0.06
897,000 US$ Ukraine Government International Bond 9.25% 24/07/2017 894,758 0.29
200,000 US$ Ukraine Railways via Shortline PLC 9.5% 21/05/2018 180,500 0.06
600,000 US$ Ukrlandfarming PLC 10.875% 26/03/2018 567,000 0.19
12,828,640 4.19
United Arab Emirates
1,750,000 AED Anka a Sukuk Ltd 10% 25/08/2016 483,596 0.16
1,250,000 US$ Atlantic Finance Ltd Step Cpn 27/05/2014 1,328,125 0.44
500,000 US$ Dana Gas Sukuk Ltd 7% 31/10/2017 459,005 0.15
500,000 US$ Dana Gas Sukuk Ltd 9% 31/10/2017 479,385 0.16
2,000,000 US$ DP World Ltd 6.85% 02/07/2037 2,065,000 0.68
400,000 US$ DP World Sukuk Ltd 6.25% 02/07/2017 428,000 0.14
90,000 US$ Dubai DOF Sukuk Ltd 6.45% 02/05/2022 94,725 0.03
1,250,000 EUR Dubai Holding Commercial Operations MTN Ltd 4.75% 30/01/2014 1,616,688 0.53
1,050,000 GBP Dubai Holding Commercial Operations MTN Ltd 6% 01/02/2017 1,544,759 0.51
800,000 US$ Emaar Sukuk Ltd 6.4% 18/07/2019 820,000 0.27
400,000 US$ Emirate of Dubai Government International Bonds 5.25% 30/01/2043 338,000 0.11
1,328,000 US$ Emirate of Dubai Government International Bonds 7.75% 05/10/2020 1,533,840 0.50
11,191,123 3.68 The accompanying notes form an integral part of these consolidated financial statements.

Ashmore SICAV – Unaudited Semi-Annual Report for the period ended 30 June 2013
104
Ashmore SICAV Emerging Markets Total Return Fund Schedule of Investments (continued) As at 30 June 2013
Holdings
Currency Description of Investment Market Value
US$ Net Assets
%
Transferable securities admitted to an official stock exchange listing / dealt on another regulated market (continued)
Bonds (continued)
Uruguay
1,000,000 UYU Uruguay Notas Del Teso 3.25% Index Linked 27/01/2019 130,528 0.04
2,830,000 UYU Uruguay Government International Bond 3.7% 26/06/2037 229,411 0.08
241,218 US$ Uruguay Government International Bond 4.125% 20/11/2045 196,593 0.06
3,570,000 UYU Uruguay Government International Bond 4.25% 05/04/2027 317,096 0.10
5,520,000 UYU Uruguay Government International Bond 4.375% 15/12/2028 355,478 0.12
5,200,000 UYU Uruguay Government International Bond 5% 14/09/2018 473,615 0.16
274,000 US$ Uruguay Government International Bond 7.625% 21/03/2036 345,925 0.11
317,469 US$ Uruguay Government International Bond 8% 18/11/2022 400,487 0.13
408,000 US$ Uruguay Government International Bond PIK 15/01/2033 518,160 0.17
2,967,293 0.97
Venezuela
216,000 US$ Petroleos de Venezuela SA 5.25% 12/04/2017 176,040 0.06
656,000 US$ Petroleos de Venezuela SA 5.375% 12/04/2027 396,880 0.13
183,000 US$ Petroleos de Venezuela SA 5.5% 12/04/2037 107,970 0.04
135,000 US$ Petroleos de Venezuela SA 12.75% 17/02/2022 135,675 0.04
163,000 US$ Venezuela Government International Bond 6% 09/12/2020 118,990 0.04
170,000 US$ Venezuela Government International Bond 7.65% 21/04/2025 126,650 0.04
244,000 US$ Venezuela Government International Bond 7.75% 13/10/2019 202,520 0.07
215,000 US$ Venezuela Government International Bond 8.25% 13/10/2024 166,625 0.05
124,000 US$ Venezuela Government International Bond 8.5% 08/10/2014 123,070 0.04
269,000 US$ Venezuela Government International Bond 9% 07/05/2023 223,943 0.07
331,000 US$ Venezuela Government International Bond 9.25% 15/09/2027 279,695 0.09
348,000 US$ Venezuela Government International Bond 9.25% 07/05/2028 283,620 0.09
950,000 US$ Venezuela Government International Bond 11.75% 21/10/2026 902,500 0.30
1,015,100 US$ Venezuela Government International Bond 11.95% 05/08/2031 969,421 0.32
397,000 US$ Venezuela Government International Bond 12.75% 23/08/2022 406,925 0.13
4,620,524 1.51
Vietnam
371,000 US$ Vietnam Government International Bond 6.75% 29/01/2020 393,260 0.13
200,000 US$ Vietnam Government International Bond 6.875% 15/01/2016 211,000 0.07
604,260 0.20
Zambia
150,000 US$ Zambia Government International Bond 5.375% 20/09/2022 133,500 0.04
133,500 0.04
Total bonds 233,069,650 76.48
Equities
Hong Kong
379,957 US$ Emerald Plantation Holdings 98,789 0.03
98,789 0.03 The accompanying notes form an integral part of these consolidated financial statements.

Ashmore SICAV – Unaudited Semi-Annual Report for the period ended 30 June 2013
105
Ashmore SICAV Emerging Markets Total Return Fund Schedule of Investments (continued) As at 30 June 2013
Holdings
Currency Description of Investment Market Value
US$ Net Assets
%
Transferable securities admitted to an official stock exchange listing / dealt on another regulated market (continued)
Equities (continued)
Kazakhstan
47,852 US$ BTA Bank GDR 47,373 0.02
47,373 0.02
Total equities 146,162 0.05
Total transferable securities admitted to an official stock exchange listing / dealt on another regulated market 233,215,812 76.53
Other transferable securities and money market instruments
Bonds
Brazil
500,000 BRL Cia Energetica de Sao Paulo 9.75% 15/01/2015 350,000 0.11
350,000 0.11
Hong Kong
377,176 US$ Emerald Plantation 6.00% 30/01/2020 226,306 0.07
557,000 US$ Sino-Forest Corporation Claim 4.25% 15/02/2016 144A - -
100,000 US$ Sino-Forest Corporation Claim 5% 01/08/2013 - -
116,000 US$ Sino-Forest Corporation Claim 5% 01/08/2013 144A - -
1,162,000 US$ Sino-Forest Corporation Claim 6.25% 21/10/2017 - -
122,000 US$ Sino-Forest Corporation Claim 6.25% 21/10/2017 144A - -
184,000 US$ Sino-Forest Corporation Claim 10.25% 28/07/2014 - -
22,000 US$ Sino-Forest Corporation Claim 10.25% 28/07/2014 144A - -
226,306 0.07
Iraq
680,000 US$ Republic of Iraq 5.8% 15/01/2028 564,400 0.19
564,400 0.19
Malaysia
800,000 MYR Malaysia Government Bond 3.314% 31/10/2017 252,316 0.08
400,000 MYR Malaysia Government Bond 3.48% 15/03/2023 124,689 0.04
4,200,000 MYR Malaysia Government Bond 3.492% 31/03/2020 1,323,738 0.43
900,000 MYR Malaysia Government Bond 3.502% 31/05/2027 276,461 0.09
600,000 MYR Malaysia Government Bond 3.58% 28/09/2018 190,127 0.06
3,500,000 MYR Malaysia Government Bond 4.012% 15/09/2017 1,130,133 0.37
1,600,000 MYR Malaysia Government Bond 4.16% 15/07/2021 522,701 0.17
1,200,000 MYR Malaysia Government Bond 4.262% 15/09/2016 389,574 0.13
3,200,000 MYR Malaysia Government Bond 4.378% 29/11/2019 1,059,320 0.35
5,269,059 1.72
Nigeria
120,000,000 NGN Nigeria T-Bill 0.00% 20/03/2014 668,162 0.23
1,400,000 US$ Sea Trucks Group 9% 26/03/2018 1,354,500 0.44
2,022,662 0.67 The accompanying notes form an integral part of these consolidated financial statements.

Ashmore SICAV – Unaudited Semi-Annual Report for the period ended 30 June 2013
106
Ashmore SICAV Emerging Markets Total Return Fund Schedule of Investments (continued) As at 30 June 2013
Holdings
Currency Description of Investment Market Value
US$ Net Assets
%
Other transferable securities and money market instruments (continued)
Bonds (continued)
People's Republic of China
300,000 US$ Far East Energy Bermuda Ltd PIK 15/01/2016 300,000 0.10
1,750,000 CNH Lafarge Shui on Cement Ltd 9% 14/11/2014 291,986 0.10
591,986 0.10
Peru
400,000 PEN Peruvian Government International Bond 6.95% 12/08/2031 149,504 0.05
1,490,000 PEN Peruvian Government International Bond 7.84% 12/08/2020 616,406 0.20
400,000 PEN Peruvian Government International Bond 8.2% 12/08/2026 175,615 0.06
600,000 PEN Peruvian Government International Bond 8.6% 12/08/2017 251,495 0.08
1,193,020 0.39
Romania
3,330,000 RON Romania Treasury Bills 0% 08/01/2014 945,033 0.31
945,033 0.31
Total bonds 11,162,466 3.66
Warrants and rights
People's Republic of China
280,432 US$ Far East Energy 15/01/2018 52,441 0.02
52,441 0.02
Total warrants and rights 52,441 0.02
Total other transferable securities and money market instruments 11,214,907 3.68
Fully-funded total return swaps
Colombia
908,000,000 COP Colombian TES 8% 28/10/2015 497,807 0.16
497,807 0.16
India
4,100,000 INR India Government Bond 7.83% 11/04/2018 69,232 0.02
60,300,000 INR India Government Bond 8.07% 03/07/2017 1,028,824 0.34
35,000,000 INR India Government Bond 8.12% 10/12/2020 602,920 0.20
24,000,000 INR Rural Electrification Corp Ltd 9.35% 19/10/2016 399,890 0.13
2,100,866 0.69
Indonesia
3,300,000,000 IDR Indonesia Treasury Bond 7% 15/05/2027 312,612 0.10
3,900,000,000 IDR Indonesia Treasury Bond 8.375% 15/09/2026 416,571 0.14
5,200,000,000 IDR Indonesia Treasury Bond 9.5% 15/07/2031 605,867 0.20
15,600,000,000 IDR Indonesia Treasury Bond 10.5% 15/08/2030 1,964,376 0.64
9,800,000,000 IDR Indonesia Treasury Bond 11% 15/09/2025 1,255,018 0.41
4,554,444 1.49
Republic of South Korea
2,666,000,000 KRW Korea Treasury Bond 5% 10/06/2020 2,580,537 0.85
2,580,537 0.85
Total fully-funded total return swaps 9,733,654 3.19 The accompanying notes form an integral part of these consolidated financial statements.

Ashmore SICAV – Unaudited Semi-Annual Report for the period ended 30 June 2013
107
Ashmore SICAV Emerging Markets Total Return Fund Schedule of Investments (continued) As at 30 June 2013
Holdings
Currency Description of Investment Market Value
US$ Net Assets
%
Undertakings for collective investment schemes
Luxembourg
13,911 US$ Ashmore SICAV Turkish Debt Fund 1,277,723 0.42
25,511,704 US$ Ashmore SICAV 2 Global Liquidity US$ Fund 25,511,704 8.37
26,789,427 8.79
Total undertakings for collective investment schemes 26,789,427 8.79
Written options
6,000,000 EUR Currency PUT option EUR/USD 1.26 European 08/11/2013 (Bank of America)
82,854 0.03
6,300,000 EUR Currency PUT option EUR/USD 1.27 European 11/09/2013 (HSBC) 62,177 0.02
6,000,000 EUR Currency PUT option EUR/USD 1.28 European 04/10/2013 (Bank of America)
92,735 0.03
237,766 0.08
Total written options 237,766 0.08
Total investment portfolio 281,191,566 92.27
Cash at bank 22,573,645 7.41
Other assets and liabilities 966,217 0.32
Total net assets 304,731,428 100.00
The accompanying notes form an integral part of these consolidated financial statements.

Ashmore SICAV – Unaudited Semi-Annual Report for the period ended 30 June 2013
108
Ashmore SICAV Emerging Markets Total Return Fund II Schedule of Investments As at 30 June 2013
Holdings
Currency Description of Investment Market Value
US$ Net Assets
%
Transferable securities admitted to an official stock exchange listing / dealt on another regulated market
Bonds
Argentina
914,000 US$ Argentina Boden Bonds 7% 03/10/2015 792,895 0.26
1,297,756 US$ Argentine Republic Government International Bond 8.28% 31/12/2033 725,967 0.24
238,000 US$ Argentine Republic Government International Bond 8.75% 02/06/2017 180,285 0.06
213,000 US$ Argentine Republic Government International Bond Step Cpn 31/12/2038 69,225 0.02
3,235,000 US$ WPE International Cooperatief UA 10.375% 30/09/2020 2,523,300 0.83
4,291,672 1.41
Azerbaijan
550,000 US$ State Oil Co of the Azerbaijan Republic 4.75% 13/03/2023 497,750 0.16
365,000 US$ State Oil Co of the Azerbaijan Republic 5.45% 09/02/2017 375,038 0.12
872,788 0.28
Belarus
610,000 US$ Republic of Belarus 8.75% 03/08/2015 611,525 0.20
640,000 US$ Republic of Belarus 8.95% 26/01/2018 638,400 0.21
1,249,925 0.41
Bolivia
350,000 US$ Bolivian Government International Bond 4.875% 29/10/2022 327,250 0.11
327,250 0.11
Brazil
270,000 US$ Banco Nacional de Desenvolvimento Economico e Social 5.5% 12/07/2020 278,775 0.09
380,000 US$ Banco Nacional de Desenvolvimento Economico e Social 6.5% 10/06/2019 414,200 0.14
500,000 BRL Banco Santander Brasil SA/Cayman Islands 8% 18/03/2016 208,234 0.07
3,000,000 BRL Banco Votorantim SA 6.25% 16/05/2016 1,487,749 0.49
700,000 BRL Brazil Letras do Tesouro Nacional 0% 01/01/2017 2,189,016 0.72
265,000 BRL Brazil Notas do Tesouro Nacional Serie B 6% 15/08/2020 2,962,728 0.97
365,000 BRL Brazil Notas do Tesouro Nacional Serie F 10% 01/01/2021 1,648,265 0.54
150,000 BRL Brazil Notas do Tesouro Nacional Serie F 10% 01/01/2023 669,461 0.22
250,000 US$ Brazilian Government International Bond 2.625% 05/01/2023 217,500 0.07
785,000 US$ Brazilian Government International Bond 4.875% 22/01/2021 837,988 0.27
200,000 US$ Brazilian Government International Bond 5.875% 15/01/2019 227,800 0.07
388,000 US$ Brazilian Government International Bond 8.25% 20/01/2034 514,100 0.17
2,370,000 BRL Brazilian Government International Bond 8.5% 05/01/2024 987,031 0.32
237,000 US$ Brazilian Government International Bond 8.875% 15/04/2024 327,060 0.11
290,000 US$ Brazilian Government International Bond 10.125% 15/05/2027 449,500 0.15
900,000 BRL Cosan Luxembourg SA 9.5% 14/03/2018 387,553 0.13
700,000 US$ Fibria Overseas Finance Ltd 6.75% 03/03/2021 750,050 0.25
1,350,000 US$ JBS Finance II Ltd 8.25% 29/01/2018 1,370,250 0.45
1,563,000 US$ Marfrig Holding Europe BV 8.375% 09/05/2018 1,469,220 0.48
300,000 US$ Marfrig Overseas Ltd 9.5% 04/05/2020 297,375 0.10
950,000 US$ Minerva Luxembourg SA 12.25% 10/02/2022 1,135,250 0.37
700,000 US$ Minerva Luxembourg SA 7.75% 31/01/2023 696,500 0.23
1,700,000 US$ OGX Austria GmbH 8.5% 01/06/2018 535,500 0.18
500,000 BRL Oi SA 9.75% 15/09/2016 209,366 0.07
800,000 US$ OSX 3 Leasing BV 9.25% 20/03/2015 696,000 0.23
20,966,471 6.89 The accompanying notes form an integral part of these consolidated financial statements.
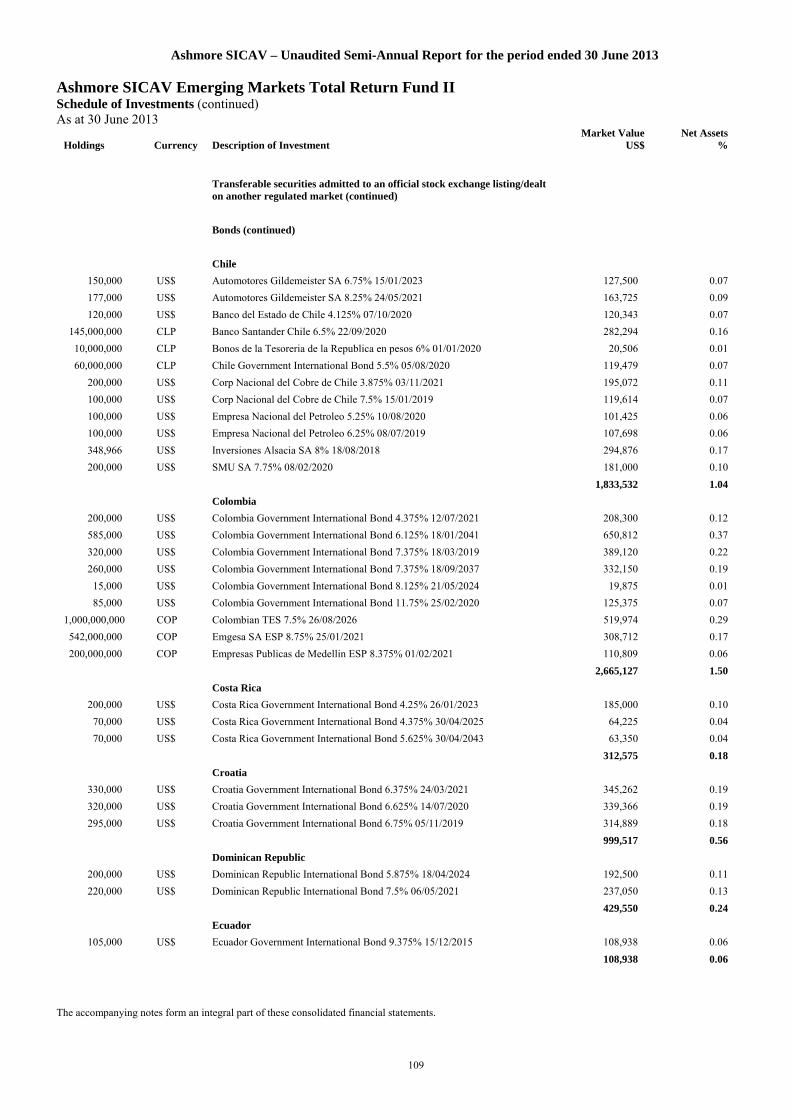
Ashmore SICAV – Unaudited Semi-Annual Report for the period ended 30 June 2013
109
Ashmore SICAV Emerging Markets Total Return Fund II Schedule of Investments (continued) As at 30 June 2013
Holdings Currency Description of Investment
Market Value US$
Net Assets %
Transferable securities admitted to an official stock exchange listing/dealt on another regulated market (continued)
Bonds (continued)
Chile
150,000 US$ Automotores Gildemeister SA 6.75% 15/01/2023 127,500 0.07
177,000 US$ Automotores Gildemeister SA 8.25% 24/05/2021 163,725 0.09
120,000 US$ Banco del Estado de Chile 4.125% 07/10/2020 120,343 0.07
145,000,000 CLP Banco Santander Chile 6.5% 22/09/2020 282,294 0.16
10,000,000 CLP Bonos de la Tesoreria de la Republica en pesos 6% 01/01/2020 20,506 0.01
60,000,000 CLP Chile Government International Bond 5.5% 05/08/2020 119,479 0.07
200,000 US$ Corp Nacional del Cobre de Chile 3.875% 03/11/2021 195,072 0.11
100,000 US$ Corp Nacional del Cobre de Chile 7.5% 15/01/2019 119,614 0.07
100,000 US$ Empresa Nacional del Petroleo 5.25% 10/08/2020 101,425 0.06
100,000 US$ Empresa Nacional del Petroleo 6.25% 08/07/2019 107,698 0.06
348,966 US$ Inversiones Alsacia SA 8% 18/08/2018 294,876 0.17
200,000 US$ SMU SA 7.75% 08/02/2020 181,000 0.10
1,833,532 1.04
Colombia
200,000 US$ Colombia Government International Bond 4.375% 12/07/2021 208,300 0.12
585,000 US$ Colombia Government International Bond 6.125% 18/01/2041 650,812 0.37
320,000 US$ Colombia Government International Bond 7.375% 18/03/2019 389,120 0.22
260,000 US$ Colombia Government International Bond 7.375% 18/09/2037 332,150 0.19
15,000 US$ Colombia Government International Bond 8.125% 21/05/2024 19,875 0.01
85,000 US$ Colombia Government International Bond 11.75% 25/02/2020 125,375 0.07
1,000,000,000 COP Colombian TES 7.5% 26/08/2026 519,974 0.29
542,000,000 COP Emgesa SA ESP 8.75% 25/01/2021 308,712 0.17
200,000,000 COP Empresas Publicas de Medellin ESP 8.375% 01/02/2021 110,809 0.06
2,665,127 1.50
Costa Rica
200,000 US$ Costa Rica Government International Bond 4.25% 26/01/2023 185,000 0.10
70,000 US$ Costa Rica Government International Bond 4.375% 30/04/2025 64,225 0.04
70,000 US$ Costa Rica Government International Bond 5.625% 30/04/2043 63,350 0.04
312,575 0.18
Croatia
330,000 US$ Croatia Government International Bond 6.375% 24/03/2021 345,262 0.19
320,000 US$ Croatia Government International Bond 6.625% 14/07/2020 339,366 0.19
295,000 US$ Croatia Government International Bond 6.75% 05/11/2019 314,889 0.18
999,517 0.56
Dominican Republic
200,000 US$ Dominican Republic International Bond 5.875% 18/04/2024 192,500 0.11
220,000 US$ Dominican Republic International Bond 7.5% 06/05/2021 237,050 0.13
429,550 0.24
Ecuador
105,000 US$ Ecuador Government International Bond 9.375% 15/12/2015 108,938 0.06
108,938 0.06 The accompanying notes form an integral part of these consolidated financial statements.

Ashmore SICAV – Unaudited Semi-Annual Report for the period ended 30 June 2013
110
Ashmore SICAV Emerging Markets Total Return Fund II Schedule of Investments (continued) As at 30 June 2013
Holdings Currency Description of Investment
Market Value US$
Net Assets %
Transferable securities admitted to an official stock exchange listing/dealt on another regulated market (continued)
Bonds (continued)
Egypt
100,000 US$ Egypt Government International Bond 5.75% 29/04/2020 78,520 0.04
100,000 US$ Egypt Government International Bond 6.875% 30/04/2040 71,020 0.04
149,540 0.08
El Salvador
160,000 US$ El Salvador Government International Bond 5.875% 30/01/2025 155,600 0.09
100,000 US$ El Salvador Government International Bond 7.375% 01/12/2019 110,250 0.06
90,000 US$ El Salvador Government International Bond 7.625% 01/02/2041 87,525 0.05
37,000 US$ El Salvador Government International Bond 7.65% 15/06/2035 36,168 0.02
65,000 US$ El Salvador Government International Bond 8.25% 10/04/2032 67,763 0.04
200,000 US$ Telemovil Finance Co Ltd 8% 01/10/2017 211,500 0.12
668,806 0.38
Gabon
100,000 US$ Gabonese Republic 8.2% 12/12/2017 112,500 0.06
112,500 0.06
Georgia
230,000 US$ Georgia Government International Bond 6.875% 12/04/2021 246,100 0.14
246,100 0.14
Ghana
200,000 GHS Ghana Government Bond 21% 26/10/2015 98,825 0.06
220,000 US$ Republic of Ghana 8.5% 04/10/2017 232,100 0.13
330,925 0.19
Guatemala
100,000 US$ Guatemala Government Bond 4.875% 13/02/2028 90,500 0.05
90,500 0.05
Hong Kong
200,000 US$ Central China Real Estate Ltd 6.5% 04/06/2018 180,336 0.10
1,000,000 US$ CFG Investment SAC 9.75% 30/07/2019 895,000 0.50
600,000 US$ Evergrande Real Estate Group Ltd 13% 27/01/2015 618,000 0.35
200,000 US$ Fosun International Ltd 7.5% 12/05/2016 202,000 0.11
500,000 US$ Hengdeli Holdings Ltd 6.25% 29/01/2018 486,544 0.27
200,000 US$ Gemdale International Investment Ltd 7.125% 16/11/2017 195,571 0.11
200,000 US$ Shimao Property Holdings Ltd 9.65% 03/08/2017 209,070 0.12
200,000 US$ Shimao Property Holdings Ltd 11% 08/03/2018 213,486 0.12
3,000,007 1.68
Hungary
177,160,000 HUF Hungary Government Bond 5.5% 12/02/2016 793,911 0.45
45,000,000 HUF Hungary Government Bond 6.5% 24/06/2019 208,477 0.12
156,280,000 HUF Hungary Government Bond 6.75% 24/11/2017 726,646 0.41
106,680,000 HUF Hungary Government Bond 7% 24/06/2022 499,922 0.28
110,000 US$ Hungary Government International Bond 5.375% 21/02/2023 105,875 0.06
214,000 US$ Hungary Government International Bond 6.25% 29/01/2020 223,630 0.13
274,000 US$ Hungary Government International Bond 6.375% 29/03/2021 284,960 0.16
316,000 US$ Hungary Government International Bond 7.625% 29/03/2041 329,904 0.19
3,173,325 1.80 The accompanying notes form an integral part of these consolidated financial statements.

Ashmore SICAV – Unaudited Semi-Annual Report for the period ended 30 June 2013
111
Ashmore SICAV Emerging Markets Total Return Fund II Schedule of Investments (continued) As at 30 June 2013
Holdings Currency Description of Investment
Market Value US$
Net Assets %
Transferable securities admitted to an official stock exchange listing/dealt on another regulated market (continued)
Bonds (continued)
India
200,000 US$ Bharti Airtel International Netherlands BV 5.125% 11/03/2023 181,760 0.10
77,000 US$ Export-Import Bank of India 4% 14/01/2023 68,476 0.04
600,000 US$ Vedanta Resources PLC 8.25% 07/06/2021 604,500 0.34
854,736 0.48
Indonesia
200,000 US$ Indo Energy Finance II BV 6.375% 24/01/2023 174,500 0.10
182,000 US$ Indonesia Government International Bond 4.875% 05/05/2021 186,550 0.10
154,000 US$ Indonesia Government International Bond 5.875% 13/03/2020 166,705 0.09
200,000 US$ Indonesia Government International Bond 6.625% 17/02/2037 218,000 0.12
180,000 US$ Indonesia Government International Bond 6.875% 17/01/2018 202,050 0.11
120,000 US$ Indonesia Government International Bond 7.75% 17/01/2038 148,200 0.08
97,000 US$ Indonesia Government International Bond 8.5% 12/10/2035 127,555 0.07
100,000 US$ Indonesia Government International Bond 11.625% 04/03/2019 136,000 0.08
250,000 US$ Pertamina Persero PT 5.625% 20/05/2043 216,250 0.12
555,000 US$ Pertamina Persero PT 6% 03/05/2042 518,925 0.29
200,000 US$ Perusahaan Listrik Negara PT 5.5% 22/11/2021 196,000 0.11
160,000 US$ Majapahit Holding BV 7.75% 17/10/2016 177,200 0.10
100,000 US$ Majapahit Holding BV 7.75% 20/01/2020 109,500 0.06
120,000 US$ Majapahit Holding BV 8% 07/08/2019 135,000 0.08
2,712,435 1.51
Israel
200,000 US$ Altice Financing SA 7.875% 15/12/2019 209,000 0.12
700,000 EUR Altice Financing SA 8% 15/12/2019 946,291 0.53
200,000 US$ Altice Finco SA 9.875% 15/12/2020 214,000 0.12
1,369,291 0.77
Ivory Coast
1,065,000 US$ Ivory Coast Government International Bond Step Cpn 31/12/2032 873,300 0.49
873,300 0.49
Jamaica
500,000 US$ Digicel 8.25% 30/09/2020 517,500 0.29
600,000 US$ Digicel 6% 15/04/2021 567,000 0.32
1,084,500 0.61
Kazakhstan
200,000 US$ ATF Bank JSC 9% 11/05/2016 192,500 0.11
200,000 US$ Development Bank of Kazakhstan JSC 4.125% 10/12/2022 178,000 0.10
500,000 US$ Halyk Savings Bank of Kazakhstan JSC 7.25% 28/01/2021 512,500 0.29
140,000 US$ Kazatomprom Natsionalnaya Atomnaya Kompaniya AO 6.25% 20/05/2015 145,600 0.08
1,500,000 US$ Kazkommertsbank JSC 8.5% 11/05/2018 1,425,000 0.80
200,000 US$ Kazakhstan Temir Zholy Finance BV 6.375% 06/10/2020 216,000 0.12
200,000 US$ Kazakhstan Temir Zholy Finance BV 6.95% 10/07/2042 203,260 0.11
90,000 US$ KazMunayGas National Co JSC 4.4% 30/04/2023 83,475 0.05
280,000 US$ KazMunayGas National Co JSC 5.75% 30/04/2043 247,800 0.14
195,000 US$ KazMunayGas National Co JSC 7% 05/05/2020 220,350 0.12
The accompanying notes form an integral part of these consolidated financial statements.

Ashmore SICAV – Unaudited Semi-Annual Report for the period ended 30 June 2013
112
Ashmore SICAV Emerging Markets Total Return Fund II Schedule of Investments (continued) As at 30 June 2013
Holdings Currency Description of Investment
Market Value US$
Net Assets %
Transferable securities admitted to an official stock exchange listing/dealt on another regulated market (continued)
Bonds (continued)
Kazakhstan (continued)
100,000 US$ KazMunayGas National Co JSC 9.125% 02/07/2018 119,750 0.07
120,000 US$ KazMunayGas National Co JSC 11.75% 23/01/2015 135,900 0.08
400,000 US$ Zhaikmunai LP 7.125% 13/11/2019 401,000 0.23
4,081,135 2.30
Latvia
350,000 US$ Republic of Latvia 2.75% 12/01/2020 323,750 0.18
323,750 0.18
Lebanon
120,000 US$ Lebanon Government International Bond 5.15% 12/11/2018 114,600 0.06
362,000 US$ Lebanon Government International Bond 6.1% 04/10/2022 336,660 0.19
240,000 US$ Lebanon Government International Bond 6.375% 09/03/2020 228,000 0.13
130,000 US$ Lebanon Government International Bond 6.6% 27/11/2026 120,900 0.07
55,000 US$ Lebanon Government International Bond 8.25% 12/04/2021 58,575 0.03
858,735 0.48
Lithuania
120,000 US$ Lithuania Government International Bond 5.125% 14/09/2017 128,328 0.07
250,000 US$ Lithuania Government International Bond 6.125% 09/03/2021 278,750 0.16
390,000 US$ Lithuania Government International Bond 6.625% 01/02/2022 448,013 0.25
240,000 US$ Lithuania Government International Bond 7.375% 11/02/2020 285,000 0.16
1,140,091 0.64
Malaysia
100,000 US$ Petronas Capital Ltd 5.25% 12/08/2019 109,186 0.06
20,000 US$ Petronas Capital Ltd 7.875% 22/05/2022 25,270 0.01
250,000 US$ Wakala Global Sukuk Bhd 4.646% 06/07/2021 262,227 0.15
396,683 0.22
Mexico
700,000 US$ Cemex Espana Luxembourg 9.25% 12/05/2020 738,500 0.42
500,000 US$ Cemex SAB de CV 5.875% 25/03/2019 485,000 0.27
240,000 US$ Comision Federal de Electricidad 4.875% 26/05/2021 245,400 0.14
400,000 US$ Corp GEO SAB de CV 8.875% 27/03/2022 176,000 0.10
400,000 US$ Desarrolladora Homex SAB de CV 9.75% 25/03/2020 136,000 0.08
2,000,000 MXN Grupo Televisa SAB 7.25% 14/05/2043 130,222 0.07
8,370,000 MXN Mexican Bonos 7.5% 03/06/2027 719,670 0.40
4,270,000 MXN Mexican Bonos 7.75% 29/05/2031 362,277 0.20
7,690,000 MXN Mexican Bonos 8.5% 31/05/2029 703,699 0.40
750,000 MXN Mexican Bonos 8.5% 18/11/2038 67,066 0.04
38,500,000 MXN Mexican Bonos 9.5% 18/12/2014 3,176,177 1.79
3,120,000 MXN Mexican Bonos 10% 20/11/2036 318,858 0.18
640,000 MXN Mexican Udibonos 4% 15/11/2040 267,795 0.15
124,000 US$ Mexico Government International Bond 4.75% 08/03/2044 110,360 0.06
80,000 US$ Mexico Government International Bond 5.75% 12/10/2110 73,000 0.04
96,000 US$ Mexico Government International Bond 5.95% 19/03/2019 109,872 0.06
2,000 US$ Mexico Government International Bond 6.05% 11/01/2040 2,180 -
261,000 US$ Mexico Government International Bond 6.75% 27/09/2034 307,980 0.17
The accompanying notes form an integral part of these consolidated financial statements.

Ashmore SICAV – Unaudited Semi-Annual Report for the period ended 30 June 2013
113
Ashmore SICAV Emerging Markets Total Return Fund II Schedule of Investments (continued) As at 30 June 2013
Holdings Currency Description of Investment
Market Value US$
Net Assets %
Transferable securities admitted to an official stock exchange listing/dealt on another regulated market (continued)
Bonds (continued)
Mexico (continued)
1,200,000 US$ NII Capital Corp 7.625% 01/04/2021 933,000 0.52
100,000 US$ Pemex Project Funding Master Trust 5.75% 01/03/2018 109,500 0.06
40,000 US$ Petroleos Mexicanos 5.5% 27/06/2044 36,000 0.02
90,000 US$ Petroleos Mexicanos 6% 05/03/2020 99,000 0.06
197,000 US$ Petroleos Mexicanos 6.5% 02/06/2041 203,403 0.11
140,000 US$ Petroleos Mexicanos 8% 03/05/2019 169,400 0.10
600,000 US$ Urbi Desarrollos Urbanos SAB de CV 9.5% 21/01/2020 132,000 0.07
1,600,000 US$ Urbi Desarrollos Urbanos SAB de CV 9.75% 03/02/2022 352,000 0.20
10,164,359 5.71
Mongolia
100,000 US$ Mongolia Government International Bond 5.125% 05/12/2022 88,000 0.05
200,000 US$ Mongolian Mining Corp 8.875% 29/03/2017 170,000 0.10
258,000 0.15
Morocco
300,000 US$ Morocco Government International Bond 4.25% 11/12/2022 264,060 0.15
100,000 US$ Morocco Government International Bond 5.5% 11/12/2042 83,520 0.05
347,580 0.20
Nigeria
600,000 US$ Afren PLC 10.25% 08/04/2019 670,500 0.38
300,000 US$ Afren PLC 11.5% 01/02/2016 333,000 0.19
30,000,000 NGN Nigeria Government Bond 16% 29/06/2019 198,089 0.11
73,000,000 NGN Nigeria Government Bond 16.39% 27/01/2022 501,644 0.28
100,000 US$ Nigeria Government International Bond 6.75% 28/01/2021 104,500 0.06
1,807,733 1.02
Pakistan
105,000 US$ Pakistan Government International Bond 6.875% 01/06/2017 97,650 0.05
100,000 US$ Pakistan Government International Bond 7.125% 31/03/2016 95,000 0.05
192,650 0.10
Panama
40,000 US$ Panama Government International Bond 4.3% 29/04/2053 32,100 0.02
145,000 US$ Panama Government International Bond 6.7% 26/01/2036 168,563 0.09
220,000 US$ Panama Government International Bond 7.125% 29/01/2026 268,950 0.15
50,000 US$ Panama Government International Bond 8.875% 30/09/2027 69,000 0.04
60,000 US$ Panama Government International Bond 9.375% 01/04/2029 87,000 0.05
625,613 0.35
Paraguay
200,000 US$ Telefonica Celular del Paraguay SA 6.75% 13/12/2022 207,500 0.12
207,500 0.12
People's Republic of China
300,000 US$ Agile Property Holdings Ltd 9.875% 20/03/2017 314,250 0.18
400,000 US$ China Oriental Group Co Ltd 7% 17/11/2017 368,000 0.21
600,000 US$ China Shanshui Cement Group Ltd 10.5% 27/04/2017 627,000 0.35
200,000 US$ Country Garden Holdings Co Ltd 7.5% 10/01/2023 183,000 0.10
200,000 US$ Country Garden Holdings Co Ltd 11.125% 23/02/2018 217,000 0.12 The accompanying notes form an integral part of these consolidated financial statements.

Ashmore SICAV – Unaudited Semi-Annual Report for the period ended 30 June 2013
114
Ashmore SICAV Emerging Markets Total Return Fund II Schedule of Investments (continued) As at 30 June 2013
Holdings Currency Description of Investment
Market Value US$
Net Assets %
Transferable securities admitted to an official stock exchange listing/dealt on another regulated market (continued)
Bonds (continued)
People's Republic of China (continued)
700,000 US$ Hidili Industry International Development Ltd 8.625% 04/11/2015 535,500 0.30
200,000 US$ Longfor Properties Co Ltd 9.5% 07/04/2016 214,500 0.12
595,000 US$ Sinochem Overseas Capital Co Ltd 4.5% 12/11/2020 586,614 0.33
190,000 US$ Sinochem Overseas Capital Co Ltd 6.3% 12/11/2040 188,341 0.11
800,000 US$ Sunac China Holdings Ltd 9.375% 05/04/2018 770,315 0.43
500,000 US$ Yanlord Land Group Ltd 9.5% 04/05/2017 517,500 0.29
200,000 US$ Yanlord Land Group Ltd 10.625% 29/03/2018 209,500 0.12
4,731,520 2.66
Peru
55,000 US$ Peruvian Government International Bond 7.125% 30/03/2019 66,550 0.04
270,000 US$ Peruvian Government International Bond 7.35% 21/07/2025 345,600 0.19
232,000 US$ Peruvian Government International Bond 8.75% 21/11/2033 337,560 0.19
749,710 0.42
Philippines
170,000 US$ Philippine Government International Bond 4% 15/01/2021 179,775 0.10
130,000 US$ Philippine Government International Bond 5.5% 30/03/2026 148,200 0.08
9,000,000 PHP Philippine Government International Bond 6.25% 14/01/2036 221,471 0.12
180,000 US$ Philippine Government International Bond 7.75% 14/01/2031 237,600 0.13
100,000 US$ Philippine Government International Bond 8.375% 17/06/2019 129,500 0.07
210,000 US$ Philippine Government International Bond 9.5% 02/02/2030 315,000 0.18
75,000 US$ Philippine Government International Bond 10.625% 16/03/2025 118,875 0.07
130,000 US$ Power Sector Assets & Liabilities Management Corp 7.25% 27/05/2019 152,425 0.09
200,000 US$ Power Sector Assets & Liabilities Management Corp 7.39% 02/12/2024 242,000 0.14
1,744,846 0.98
Poland
213,255 US$ CEDC Finance Corp International Inc 10% 30/04/2018 152,733 0.09
495,382 US$ CEDC Finance Corp International Inc Step Cpn 30/04/2018 438,116 0.25
500,000 EUR Eileme 2 AB 11.75% 31/01/2020 737,665 0.41
364,000 PLN Poland Government Bond 2.75% 25/08/2023 129,514 0.07
2,101,000 PLN Poland Government Bond 3% 24/08/2016 838,708 0.47
3,049,000 PLN Poland Government Bond 4% 25/10/2023 888,748 0.50
4,688,000 PLN Poland Government Bond 4.75% 25/10/2016 1,465,919 0.82
2,511,000 PLN Poland Government Bond 5.25% 25/10/2017 801,423 0.45
1,900,000 PLN Poland Government Bond 5.5% 25/10/2019 619,902 0.35
1,503,000 PLN Poland Government Bond 5.75% 25/10/2021 498,767 0.28
1,164,000 PLN Poland Government Bond 5.75% 23/09/2022 385,572 0.22
240,000 US$ Poland Government International Bond 3% 17/03/2023 216,600 0.12
335,000 US$ Poland Government International Bond 5% 23/03/2022 360,125 0.20
309,000 US$ Poland Government International Bond 6.375% 15/07/2019 360,390 0.20
7,894,182 4.43 The accompanying notes form an integral part of these consolidated financial statements.

Ashmore SICAV – Unaudited Semi-Annual Report for the period ended 30 June 2013
115
Ashmore SICAV Emerging Markets Total Return Fund II Schedule of Investments (continued) As at 30 June 2013
Holdings Currency Description of Investment
Market Value US$
Net Assets %
Transferable securities admitted to an official stock exchange listing/dealt on another regulated market (continued)
Bonds (continued)
Qatar
155,000 US$ Qatar Government International Bond 6.4% 20/01/2040 181,738 0.10
181,738 0.10
Romania
110,000 RON Romania Government Bond 5.6% 28/11/2018 32,143 0.02
260,000 RON Romania Government Bond 5.75% 29/04/2020 75,846 0.04
180,000 RON Romania Government Bond 5.85% 26/04/2023 53,216 0.03
1,800,000 RON Romania Government Bond 5.9% 26/07/2017 525,971 0.30
496,000 US$ Romanian Government International Bond 4.375% 22/08/2023 471,210 0.26
484,000 US$ Romanian Government International Bond 6.75% 07/02/2022 539,587 0.30
1,697,973 0.95
Russian Federation
200,000 US$ Alfa Bank OJSC Via Alfa Bond Issuance PLC 7.5% 26/09/2019 204,000 0.11
300,000 US$ Brunswick Rail Finance Ltd 6.5% 01/11/2017 297,000 0.17
500,000 US$ Credit Bank of Moscow Via CBOM Finance PLC 7.7% 01/02/2018 507,500 0.29
679,000 US$ Evraz Group SA 6.75% 27/04/2018 650,143 0.37
200,000 US$ Evraz Group SA 9.5% 24/04/2018 212,000 0.12
650,000 US$ Far East Capital Ltd SA 8% 02/05/2018 599,625 0.34
350,000 US$ Far East Capital Ltd SA 8.75% 02/05/2020 320,250 0.18
200,000 US$ Metalloinvest Finance Ltd 6.5% 21/07/2016 206,000 0.12
400,000 US$ Promsvyazbank OJSC Via PSB Finance SA 10.2% 06/11/2019 420,000 0.24
200,000 US$ Promsvyazbank OJSC Via PSB Finance SA 8.5% 25/04/2017 210,834 0.12
100,000 US$ Russian Agricultural Bank OJSC Via RSHB Capital SA 7.75% 29/05/2018 112,000 0.06
12,770,000 RUB Russian Federal Bond - OFZ 6.8% 11/12/2019 381,217 0.21
3,181,000 RUB Russian Federal Bond - OFZ 7% 25/01/2023 93,559 0.05
6,878,000 RUB Russian Federal Bond - OFZ 7.05% 19/01/2028 193,279 0.11
52,077,000 RUB Russian Federal Bond - OFZ 7.4% 14/06/2017 1,615,707 0.91
56,375,000 RUB Russian Federal Bond - OFZ 7.4% 19/04/2017 1,748,195 0.98
8,809,000 RUB Russian Federal Bond - OFZ 7.5% 15/03/2018 276,728 0.16
15,130,000 RUB Russian Federal Bond - OFZ 7.5% 27/02/2019 467,800 0.26
33,050,000 RUB Russian Federal Bond - OFZ 7.6% 14/04/2021 1,024,912 0.58
9,810,000 RUB Russian Federal Bond - OFZ 7.6% 20/07/2022 301,071 0.17
9,317,000 RUB Russian Federal Bond - OFZ 8.15% 03/02/2027 291,476 0.16
100,000 US$ Russian Foreign Bond - Eurobond 5% 29/04/2020 107,000 0.06
200,000 US$ Russian Foreign Bond - Eurobond 5.625% 04/04/2042 207,500 0.12
65,000 US$ Russian Foreign Bond - Eurobond 12.75% 24/06/2028 112,450 0.06
920,075 US$ Russian Foreign Bond - Eurobond Step Cpn 31/03/2030 1,077,638 0.61
200,000 US$ Russian Standard Bank Via Russian Standard Finance SA 9.25% 11/07/2017 207,010 0.12
800,000 US$ Severstal OAO Via Steel Capital SA 5.9% 17/10/2022 730,000 0.41
700,000 US$ TMK OAO Via TMK Capital SA 7.75% 27/01/2018 700,000 0.39 2,300,000 US$ Vimpel Communications Via VIP Finance Ireland Ltd OJSC 7.748% 02/02/2021 2,452,375 1.38
120,000 US$ Vnesheconombank Via VEB Finance PLC 5.45% 22/11/2017 124,800 0.07
145,000 US$ Vnesheconombank Via VEB Finance PLC 6.8% 22/11/2025 154,425 0.09
580,000 US$ Vnesheconombank Via VEB Finance PLC 6.902% 09/07/2020 636,550 0.36
16,643,044 9.38
The accompanying notes form an integral part of these consolidated financial statements.

Ashmore SICAV – Unaudited Semi-Annual Report for the period ended 30 June 2013
116
Ashmore SICAV Emerging Markets Total Return Fund II Schedule of Investments (continued) As at 30 June 2013
Holdings Currency Description of Investment
Market Value US$
Net Assets %
Transferable securities admitted to an official stock exchange listing/dealt on another regulated market (continued)
Bonds (continued)
Senegal
200,000 US$ Senegal Government International Bond 8.75% 13/05/2021 208,000 0.12
208,000 0.12
Serbia
300,000 US$ Republic of Serbia 4.875% 25/02/2020 273,000 0.15
100,000 US$ Republic of Serbia 7.25% 28/09/2021 103,000 0.06
376,000 0.21
Singapore
200,000 US$ MMI International Ltd 8% 01/03/2017 201,000 0.11
400,000 SGD Singapore Government Bond 2.75% 01/07/2023 321,741 0.18
522,741 0.29
South Africa
1,300,000 EUR Edcon Pty Ltd 9.5% 01/03/2018 1,565,604 0.88
2,760,000 ZAR South Africa Government Bond 6.25% 31/03/2036 212,947 0.12
2,590,000 ZAR South Africa Government Bond 6.5% 28/02/2041 200,984 0.11
10,440,000 ZAR South Africa Government Bond 7% 28/02/2031 913,532 0.51
11,110,000 ZAR South Africa Government Bond 7.75% 28/02/2023 1,128,548 0.63
7,230,000 ZAR South Africa Government Bond 8% 21/12/2018 758,876 0.43
11,790,000 ZAR South Africa Government Bond 8.25% 15/09/2017 1,246,363 0.70
1,500,000 ZAR South Africa Government Bond 8.75% 28/02/2048 150,542 0.08
5,080,000 ZAR South Africa Government Bond 10.5% 21/12/2026 620,303 0.35
130,000 US$ South Africa Government International Bond 5.5% 09/03/2020 136,988 0.08
120,000 US$ South Africa Government International Bond 5.875% 30/05/2022 128,400 0.07
230,000 US$ South Africa Government International Bond 6.25% 08/03/2041 246,100 0.14
215,000 US$ South Africa Government International Bond 6.875% 27/05/2019 243,488 0.14
7,552,675 4.24
Sri Lanka
210,000 US$ Sri Lanka Government International Bond 5.875% 25/07/2022 198,450 0.11
295,000 US$ Sri Lanka Government International Bond 6.25% 04/10/2020 292,050 0.16
490,500 0.27
Thailand
9,000,000 THB Thailand Government Bond 1.2% 14/07/2021 294,024 0.17
3,700,000 THB Thailand Government Bond 1.25% 12/03/2028 115,810 0.07
9,500,000 THB Thailand Government Bond 3.58% 17/12/2027 288,489 0.16
54,500,000 THB Thailand Government Bond 3.625% 22/05/2015 1,781,768 1.00
4,200,000 THB Thailand Government Bond 3.625% 16/06/2023 133,600 0.08
17,100,000 THB Thailand Government Bond 3.65% 17/12/2021 549,211 0.31
8,000,000 THB Thailand Government Bond 3.875% 13/06/2019 263,012 0.15
3,425,914 1.94
Turkey
130,000 TRY Ronesans Holding FRN 18/12/2015 67,781 0.04
2,380,000 TRY Turkey Government Bond 3% 23/02/2022 1,361,029 0.77
300,000 TRY Turkey Government Bond 4% 01/04/2020 208,143 0.12
500,000 TRY Turkey Government Bond 7.1% 08/03/2023 238,410 0.13
640,000 TRY Turkey Government Bond 8.5% 14/09/2022 335,018 0.19
The accompanying notes form an integral part of these consolidated financial statements.

Ashmore SICAV – Unaudited Semi-Annual Report for the period ended 30 June 2013
117
Ashmore SICAV Emerging Markets Total Return Fund II Schedule of Investments (continued) As at 30 June 2013
Holdings Currency Description of Investment
Market Value US$
Net Assets %
Transferable securities admitted to an official stock exchange listing/dealt on another regulated market (continued)
Bonds (continued)
Turkey (continued)
810,000 TRY Turkey Government Bond 9% 21/05/2014 605,134 0.34
590,000 TRY Turkey Government Bond 9.5% 12/01/2022 324,134 0.18
100,000 US$ Turkey Government International Bond 3.25% 23/03/2023 87,250 0.05
200,000 US$ Turkey Government International Bond 4.875% 16/04/2043 172,000 0.10
240,000 US$ Turkey Government International Bond 5.625% 30/03/2021 256,200 0.14
350,000 US$ Turkey Government International Bond 6% 14/01/2041 349,125 0.20
275,000 US$ Turkey Government International Bond 6.75% 03/04/2018 308,688 0.17
144,000 US$ Turkey Government International Bond 6.75% 30/05/2040 159,120 0.09
180,000 US$ Turkey Government International Bond 6.875% 17/03/2036 200,700 0.11
80,000 US$ Turkey Government International Bond 7% 26/09/2016 89,328 0.05
140,000 US$ Turkey Government International Bond 7% 11/03/2019 160,300 0.09
105,000 US$ Turkey Government International Bond 7.25% 05/03/2038 122,325 0.07
232,000 US$ Turkey Government International Bond 7.375% 05/02/2025 274,920 0.15
100,000 US$ Turkey Government International Bond 7.5% 14/07/2017 114,750 0.06
100,000 US$ Turkey Government International Bond 7.5% 07/11/2019 118,000 0.07
130,000 US$ Turkey Government International Bond 8% 14/02/2034 161,850 0.09
87,000 US$ Turkey Government International Bond 11.875% 15/01/2030 145,725 0.08
5,859,930 3.29
Ukraine
130,000 US$ National JSC Naftogaz of Ukraine 9.5% 30/09/2014 129,675 0.07
400,000 US$ Metinvest BV 10.25% 20/05/2015 405,000 0.23
250,000 US$ MHP SA 10.25% 29/04/2015 257,503 0.14
200,000 US$ MHP SA 8.25% 02/04/2020 176,330 0.10
600,000 US$ Mriya Agro Holding PLC 9.45% 19/04/2018 534,000 0.30
305,000 US$ Ukraine Government International Bond 7.75% 23/09/2020 278,312 0.16
790,000 US$ Ukraine Government International Bond 7.8% 28/11/2022 705,075 0.40
50,000 US$ Ukraine Government International Bond 7.95% 23/02/2021 46,000 0.03
500,000 US$ Ukraine Government International Bond 9.25% 24/07/2017 498,750 0.28
200,000 US$ Ukrlandfarming PLC 10.875% 26/03/2018 189,000 0.11
500,000 US$ DTEK Finance 7.875% 04/04/2018 466,250 0.26
500,000 US$ Ferrexpo Finance PLC 7.875% 07/04/2016 461,435 0.26
100,000 US$ Privatbank CJSC Via UK SPV Credit Finance PLC 9.375% 23/09/2015 93,000 0.05
200,000 US$ State Export-Import Bank of Ukraine JSC via Biz Finance PLC 8.75% 22/01/2018 176,000 0.10
100,000 US$ Oschadbank Via SSB #1 PLC 8.25% 10/03/2016 93,170 0.05
200,000 US$ Oschadbank Via SSB #1 PLC 8.875% 20/03/2018 179,598 0.10
4,689,098 2.64
United Arab Emirates
600,000 US$ Atlantic Finance Ltd FRN 27/05/2014 637,500 0.36
250,000 US$ Dana Gas Sukuk Ltd 7% 31/10/2017 229,502 0.13
250,000 US$ Dana Gas Sukuk Ltd 9% 31/10/2017 239,693 0.13
700,000 US$ DP World Ltd 6.85% 02/07/2037 722,750 0.41
The accompanying notes form an integral part of these consolidated financial statements.

Ashmore SICAV – Unaudited Semi-Annual Report for the period ended 30 June 2013
118
Ashmore SICAV Emerging Markets Total Return Fund II Schedule of Investments (continued) As at 30 June 2013
Holdings Currency Description of Investment
Market Value US$
Net Assets %
Transferable securities admitted to an official stock exchange listing/dealt on another regulated market (continued)
Bonds (continued)
United Arab Emirates (continued)
1,000,000 EUR Dubai Holding Commercial Operations MTN Ltd 4.75% 30/01/2014 1,293,351 0.73
500,000 GBP Dubai Holding Commercial Operations MTN Ltd 6% 01/02/2017 735,599 0.41
500,000 US$ Emaar Sukuk Ltd 6.4% 18/07/2019 512,500 0.29
50,000 US$ Emirate of Dubai Government International Bonds 5.25% 30/01/2043 42,250 0.02
920,000 US$ Emirate of Dubai Government International Bonds 7.75% 05/10/2020 1,062,600 0.60
5,475,745 3.08
Uruguay
1,490,000 UYU Uruguay Government International Bond 3.7% 26/06/2037 120,785 0.07
2,090,000 UYU Uruguay Government International Bond 4.25% 05/04/2027 185,639 0.10
3,160,000 UYU Uruguay Government International Bond 4.375% 15/12/2028 203,498 0.11
3,780,000 UYU Uruguay Government International Bond 5% 14/09/2018 344,282 0.19
194,000 US$ Uruguay Government International Bond 7.625% 21/03/2036 244,925 0.14
226,000 US$ Uruguay Government International Bond 8% 18/11/2022 285,099 0.16
260,000 US$ Uruguay Government International Bond PIK 15/01/2033 330,200 0.19
1,714,428 0.96
Venezuela
135,000 US$ Petroleos de Venezuela SA 5.25% 12/04/2017 110,025 0.06
354,000 US$ Petroleos de Venezuela SA 5.375% 12/04/2027 214,170 0.12
10,000 US$ Petroleos de Venezuela SA 5.5% 12/04/2037 5,900 -
100,000 US$ Petroleos de Venezuela SA 12.75% 17/02/2022 100,500 0.06
85,000 US$ Venezuela Government International Bond 6% 09/12/2020 62,050 0.03
105,000 US$ Venezuela Government International Bond 7.65% 21/04/2025 78,225 0.04
145,000 US$ Venezuela Government International Bond 7.75% 13/10/2019 120,350 0.07
120,000 US$ Venezuela Government International Bond 8.25% 13/10/2024 93,000 0.05
45,000 US$ Venezuela Government International Bond 8.5% 08/10/2014 44,663 0.03
143,000 US$ Venezuela Government International Bond 9% 07/05/2023 119,047 0.07
198,000 US$ Venezuela Government International Bond 9.25% 15/09/2027 167,310 0.09
197,000 US$ Venezuela Government International Bond 9.25% 07/05/2028 160,555 0.09
556,000 US$ Venezuela Government International Bond 11.75% 21/10/2026 528,200 0.30
625,800 US$ Venezuela Government International Bond 11.95% 05/08/2031 597,639 0.34
235,000 US$ Venezuela Government International Bond 12.75% 23/08/2022 240,875 0.14
2,642,509 1.49
Vietnam
160,000 US$ Vietnam Government International Bond 6.75% 29/01/2020 169,600 0.10
210,000 US$ Vietnam Government International Bond 6.875% 15/01/2016 221,550 0.12
391,150 0.22
Total bonds 124,486,909 69.99
Total transferable securities admitted to an official stock exchange listing / dealt on another regulated market 124,486,909 69.99
The accompanying notes form an integral part of these consolidated financial statements.

Ashmore SICAV – Unaudited Semi-Annual Report for the period ended 30 June 2013
119
Ashmore SICAV Emerging Markets Total Return Fund II Schedule of Investments (continued) As at 30 June 2013
Holdings Currency Description of Investment
Market Value US$
Net Assets %
Other transferable securities and money market instruments
Bonds
Iraq
460,000 US$ Republic of Iraq 5.8% 15/01/2028 381,800 0.21
381,800 0.21
Malaysia
400,000 MYR Malaysia Government Bond 3.48% 15/03/2023 124,689 0.07
100,000 MYR Malaysia Government Bond 3.492% 31/03/2020 31,518 0.02
2,000,000 MYR Malaysia Government Bond 3.58% 28/09/2018 633,755 0.36
1,060,000 MYR Malaysia Government Bond 4.012% 15/09/2017 342,269 0.19
880,000 MYR Malaysia Government Bond 4.16% 15/07/2021 287,486 0.16
1,600,000 MYR Malaysia Government Bond 4.262% 15/09/2016 519,433 0.29
3,350,000 MYR Malaysia Government Bond 4.378% 29/11/2019 1,108,976 0.62
400,000 MYR Malaysia Government Bond 4.392% 15/04/2026 133,854 0.08
3,181,980 1.79
Peru
170,000 PEN Peruvian Government International Bond 6.95% 12/08/2031 63,539 0.04
1,140,000 PEN Peruvian Government International Bond 7.84% 12/08/2020 471,613 0.27
170,000 PEN Peruvian Government International Bond 8.2% 12/08/2026 74,636 0.04
260,000 PEN Peruvian Government International Bond 8.6% 12/08/2017 108,981 0.06
718,769 0.41
People's Republic of China
100,000 US$ Far East Energy Bermuda Ltd PIK 15/01/2016 100,000 0.06
100,000 0.06
Nigeria
143,000,000 NGN Nigeria T-Bill 0.00% 07/11/2013 838,608 0.47
20,000,000 NGN Nigeria T-Bill 0.00% 20/03/2014 111,360 0.06
600,000 US$ Sea Trucks Group 9% 26/03/2018 580,500 0.33
1,530,468 0.86
Romania
450,000 RON Romania Treasury Bills 0% 08/01/2014 127,707 0.07
127,707 0.07
Total bonds 6,040,724 3.40
Warrants and rights
People's Republic of China
93,477 US$ Far East Energy 15/01/2018 17,480 0.01
17,480 0.01
Total warrants and rights 17,480 0.01
Total other transferable securities and money market instruments 6,058,204 3.41
The accompanying notes form an integral part of these consolidated financial statements.

Ashmore SICAV – Unaudited Semi-Annual Report for the period ended 30 June 2013
120
Ashmore SICAV Emerging Markets Total Return Fund II Schedule of Investments (continued) As at 30 June 2013
Holdings Currency Description of Investment
Market Value US$
Net Assets %
Fully-funded total return swaps
Colombia
679,000,000 COP Colombian TES 8% 28/10/2015 372,259 0.21
372,259 0.21
India
36,000,000 INR India Government Bond 8.07% 03/07/2017 614,223 0.35
614,223 0.35
Indonesia
600,000,000 IDR Indonesia Treasury Bond 6.625% 15/05/2033 53,159 0.03
1,200,000,000 IDR Indonesia Treasury Bond 8.25% 15/06/2032 125,771 0.07
800,000,000 IDR Indonesia Treasury Bond 7% 15/05/2027 75,785 0.04
1,700,000,000 IDR Indonesia Treasury Bond 8.375% 15/09/2026 181,582 0.10
3,000,000,000 IDR Indonesia Treasury Bond 9.5% 15/07/2031 349,538 0.20
10,500,000,000 IDR Indonesia Treasury Bond 10.5% 15/08/2030 1,322,176 0.74
4,100,000,000 IDR Indonesia Treasury Bond 11% 15/09/2025 525,059 0.29
2,300,000,000 IDR Indonesia Treasury Bond 12.8% 15/06/2021 310,487 0.17
2,943,557 1.64
Total fully-funded total return swaps 3,930,039 2.20
Undertakings for collective investment schemes
Luxembourg
16,507,208 US$ Ashmore SICAV 2 Global Liquidity US$ Fund 16,507,208 9.28
16,507,208 9.28
Total undertakings for collective investment schemes 16,507,208 9.28
Total investment portfolio 150,982,360 84.88
Cash at bank, including time deposits (note 11) 24,099,386 13.55
Other assets and liabilities 2,794,829 1.57
Total net assets 177,876,575 100.00
The accompanying notes form an integral part of these consolidated financial statements.

Ashmore SICAV – Unaudited Semi-Annual Report for the period ended 30 June 2013
121
Ashmore SICAV Emerging Markets Investment Grade Total Return Fund Schedule of Investments As at 30 June 2013
Holdings
Currency Description of Investment Market Value
US$ Net Assets
%
Transferable securities admitted to an official stock exchange listing / dealt on another regulated market
Bonds
Brazil
200,000 US$ Banco do Brasil SA 3.875% 10/10/2022 175,260 0.40
240,000 US$ Banco Nacional de Desenvolvimento Economico e Social 5.5% 12/07/2020 247,800 0.57
100,000 US$ Banco Nacional de Desenvolvimento Economico e Social 6.5% 10/06/2019 109,000 0.25
139,000 BRL Brazil Letras do Tesouro Nacional 0% 01/01/2017 434,676 0.99
13,000 BRL Brazil Notas do Tesouro Nacional Serie B 6% 15/08/2020 145,341 0.33
82,000 BRL Brazil Notas do Tesouro Nacional Serie F 10% 01/01/2021 370,295 0.85
91,000 BRL Brazil Notas do Tesouro Nacional Serie F 10% 01/01/2023 406,139 0.93
100,000 US$ Brazilian Government International Bond 5.875% 15/01/2019 113,900 0.26
45,000 US$ Brazilian Government International Bond 8.875% 15/04/2024 62,100 0.14
60,000 US$ Brazilian Government International Bond 10.125% 15/05/2027 93,000 0.21
280,000 BRL Brazilian Government International Bond 10.25% 10/01/2028 129,920 0.30
200,000 US$ BRF SA 5.875% 06/06/2022 205,260 0.47
200,000 US$ Itau Unibanco Holding SA/Cayman Island 6.2% 21/12/2021 202,500 0.46
230,000 US$ Odebrecht Finance Ltd 4.375% 25/04/2025 205,850 0.47
883,200 US$ Schahin II Finance Co SPV Ltd 5.875% 25/09/2022 874,368 2.00
800,000 US$ Telemar Norte Leste SA 5.5% 23/10/2020 744,000 1.70
400,000 US$ Vale Overseas Ltd 4.375% 11/01/2022 379,934 0.87
4,899,343 11.20
Chile
200,000 US$ Banco de Credito e Inversiones 4% 11/02/2023 188,556 0.43
25,000 US$ Banco del Estado de Chile 3.875% 08/02/2022 24,245 0.06
193,000,000 CLP Banco Santander Chile 6.5% 22/09/2020 375,742 0.86
200,000 US$ Cencosud SA 5.5% 20/01/2021 205,228 0.47
135,000 US$ Chile Government International Bond 3.25% 14/09/2021 135,000 0.31
55,000 US$ Corp Nacional del Cobre de Chile 7.5% 15/01/2019 65,788 0.15
120,000 US$ Empresa Nacional del Petroleo 4.75% 06/12/2021 117,082 0.27
200,000 US$ Inversiones CMPC SA 4.375% 15/05/2023 191,425 0.44
200,000 US$ Telefonica Chile SA 3.875% 12/10/2022 182,640 0.42
1,485,706 3.41
Colombia
200,000 US$ Banco de Bogota SA 5.375% 19/02/2023 195,000 0.45
500,000 US$ Bancolombia SA 5.125% 11/09/2022 476,250 1.09
142,000,000 COP Colombia Government International Bond 4.375% 21/03/2023 64,704 0.15
128,000 US$ Colombia Government International Bond 6.125% 18/01/2041 142,400 0.32
115,000 US$ Colombia Government International Bond 7.375% 18/09/2037 146,912 0.34
8,000,000 COP Colombia Government International Bond 7.75% 14/04/2021 4,655 0.01
95,000 US$ Colombia Government International Bond 8.125% 21/05/2024 125,875 0.29
205,000,000 COP Colombia Government International Bond 9.85% 28/06/2027 139,448 0.32
115,000 US$ Colombia Government International Bond 11.75% 25/02/2020 169,625 0.39
50,000,000 COP Colombian TES 7.5% 26/08/2026 25,999 0.06
200,000 US$ Gruposura Finance 5.7% 18/05/2021 206,000 0.47
1,696,868 3.89
The accompanying notes form an integral part of these consolidated financial statements.

Ashmore SICAV – Unaudited Semi-Annual Report for the period ended 30 June 2013
122
Ashmore SICAV Emerging Markets Investment Grade Total Return Fund Schedule of Investments (continued) As at 30 June 2013
Holdings
Currency Description of Investment Market Value
US$ Net Assets
%
Transferable securities admitted to an official stock exchange listing / dealt on another regulated market (continued)
Bonds (continued)
Costa Rica
320,000 US$ Costa Rica Government International Bond 4.25% 26/01/2023 296,000 0.68
100,000 US$ Costa Rica Government International Bond 4.375% 30/04/2025 91,750 0.21
100,000 US$ Costa Rica Government International Bond 5.625% 30/04/2043 90,500 0.21
200,000 US$ Instituto Costarricense de Electricidad 6.375% 15/05/2043 181,250 0.41
659,500 1.51
Czech Republic
100,000 EUR EP Energy AS 5.875% 01/11/2019 137,784 0.32
137,784 0.32
Hong Kong
200,000 US$ Hutchison Whampoa International 11 Ltd 4.625% 13/01/2022 204,193 0.47
500,000 US$ Noble Group Ltd 6.75% 29/01/2020 507,500 1.16
400,000 US$ PCCW-HKT Capital No 5 Ltd 3.75% 08/03/2023 354,501 0.81
1,066,194 2.44
India
100,000 US$ Bank of Baroda/London FRN 25/05/2022 97,581 0.22
205,000 US$ Export-Import Bank of India 4% 14/01/2023 182,307 0.42
100,000 US$ ICICI Bank Ltd 5.75% 16/11/2020 101,926 0.23
381,814 0.87
Indonesia
50,000 US$ Indonesia Government International Bond 4.875% 05/05/2021 51,250 0.12
41,000 US$ Indonesia Government International Bond 7.75% 17/01/2038 50,635 0.12
50,000 US$ Indonesia Government International Bond 8.5% 12/10/2035 65,750 0.15
100,000 US$ Indonesia Government International Bond 11.625% 04/03/2019 136,000 0.31
210,000 US$ Majapahit Holding BV 7.75% 20/01/2020 229,950 0.53
380,000 US$ Pertamina Persero PT 4.875% 03/05/2022 363,850 0.83
200,000 US$ Pertamina Persero PT 6% 03/05/2042 187,000 0.43
1,084,435 2.49
Israel
200,000 US$ Israel Electric Corp Ltd 6.875% 21/06/2023 201,802 0.46
200,000 US$ Israel Electric Corp Ltd 7.25% 15/01/2019 213,000 0.49
414,802 0.95
Kazakhstan
205,000 US$ Kazakhstan Temir Zholy Finance BV 6.375% 06/10/2020 221,400 0.51
175,000 US$ Kazakhstan Temir Zholy Finance BV 6.95% 10/07/2042 177,853 0.41
63,000 US$ KazMunayGas National Co JSC 4.4% 30/04/2023 58,433 0.13
130,000 US$ KazMunayGas National Co JSC 5.75% 30/04/2043 115,050 0.26
370,000 US$ KazMunayGas National Co JSC 7% 05/05/2020 418,100 0.96
170,000 US$ KazMunayGas National Co JSC 9.125% 02/07/2018 203,575 0.47
1,194,411 2.74
Kuwait
200,000 US$ Kuwait Projects Co 9.375% 15/07/2020 232,000 0.53
232,000 0.53
The accompanying notes form an integral part of these consolidated financial statements.

Ashmore SICAV – Unaudited Semi-Annual Report for the period ended 30 June 2013
123
Ashmore SICAV Emerging Markets Investment Grade Total Return Fund Schedule of Investments (continued) As at 30 June 2013
Holdings
Currency Description of Investment Market Value
US$ Net Assets
%
Transferable securities admitted to an official stock exchange listing / dealt on another regulated market (continued)
Bonds (continued)
Latvia
280,000 US$ Republic of Latvia 2.75% 12/01/2020 259,000 0.59
140,000 US$ Republic of Latvia 5.25% 16/06/2021 147,350 0.34
406,350 0.93
Lithuania
100,000 US$ Lithuania Government International Bond 5.125% 14/09/2017 106,940 0.24
160,000 US$ Lithuania Government International Bond 6.125% 09/03/2021 178,400 0.41
485,000 US$ Lithuania Government International Bond 7.375% 11/02/2020 575,938 1.32
861,278 1.97
Malaysia
135,000 US$ Petronas Capital Ltd 7.875% 22/05/2022 170,572 0.39
170,572 0.39
Mexico
400,000 US$ Alpek SA de CV 4.5% 20/11/2022 385,000 0.88
200,000 US$ America Movil SAB de CV 3.125% 16/07/2022 184,279 0.42
200,000 US$ BBVA Bancomer SA 6.5% 10/03/2021 210,000 0.48
350,000 US$ BBVA Bancomer SA 6.75% 30/09/2022 378,000 0.86
52,000 US$ Comision Federal de Electricidad 4.875% 26/05/2021 53,170 0.12
30,000 US$ Comision Federal de Electricidad 5.75% 14/02/2042 27,750 0.06
200,000 US$ Grupo Televisa SAB 8.5% 11/03/2032 251,055 0.57
30,000 MXN Mexican Bonos 6.5% 10/06/2021 2,428 0.01
1,310,000 MXN Mexican Bonos 7.5% 03/06/2027 112,636 0.26
300,000 MXN Mexican Bonos 7.75% 13/11/2042 24,805 0.06
1,360,000 MXN Mexican Bonos 7.75% 29/05/2031 115,386 0.26
1,610,000 MXN Mexican Bonos 8.5% 18/11/2038 143,969 0.33
2,360,000 MXN Mexican Bonos 8.5% 31/05/2029 215,960 0.49
1,530,000 MXN Mexican Bonos 10% 20/11/2036 156,363 0.36
140,000 MXN Mexican Udibonos 4% 15/11/2040 58,580 0.13
200,000 US$ Mexichem SAB de CV 4.875% 19/09/2022 201,000 0.46
600,000 US$ Mexichem SAB de CV 6.75% 19/09/2042 588,000 1.35
54,000 US$ Mexico Government International Bond 4.75% 08/03/2044 48,060 0.11
70,000 US$ Mexico Government International Bond 5.625% 15/01/2017 77,805 0.18
60,000 US$ Mexico Government International Bond 5.75% 12/10/2110 54,750 0.13
76,000 US$ Mexico Government International Bond 5.95% 19/03/2019 86,982 0.20
20,000 US$ Mexico Government International Bond 6.05% 11/01/2040 21,800 0.05
30,000 US$ Pemex Project Funding Master Trust 5.75% 01/03/2018 32,850 0.08
78,000 US$ Petroleos Mexicanos 3.5% 30/01/2023 71,955 0.16
61,000 US$ Petroleos Mexicanos 4.875% 24/01/2022 62,220 0.14
49,000 US$ Petroleos Mexicanos 5.5% 21/01/2021 52,185 0.12
40,000 US$ Petroleos Mexicanos 5.5% 27/06/2044 36,000 0.08
30,000 US$ Petroleos Mexicanos 6.5% 02/06/2041 30,975 0.07
5,000,000 MXN Petroleos Mexicanos 7.65% 24/11/2021 406,077 0.93
235,000 US$ Petroleos Mexicanos 8% 03/05/2019 284,350 0.65
4,374,390 10.00
The accompanying notes form an integral part of these consolidated financial statements.

Ashmore SICAV – Unaudited Semi-Annual Report for the period ended 30 June 2013
124
Ashmore SICAV Emerging Markets Investment Grade Total Return Fund Schedule of Investments (continued) As at 30 June 2013
Holdings
Currency Description of Investment Market Value
US$ Net Assets
%
Transferable securities admitted to an official stock exchange listing / dealt on another regulated market (continued)
Bonds (continued)
Morocco
190,000 US$ Morocco Government International Bond 4.25% 11/12/2022 167,238 0.38
210,000 US$ Morocco Government International Bond 5.5% 11/12/2042 175,392 0.40
342,630 0.78
Namibia
15,000 US$ Namibia International Bonds 5.5% 03/11/2021 15,150 0.03
15,150 0.03
Panama
60,000 US$ Panama Government International Bond 4.3% 29/04/2053 48,150 0.11
30,000 US$ Panama Government International Bond 6.7% 26/01/2036 34,875 0.08
100,000 US$ Panama Government International Bond 8.875% 30/09/2027 138,000 0.32
100,000 US$ Panama Government International Bond 9.375% 01/04/2029 145,000 0.33
366,025 0.84
People's Republic of China
500,000 US$ Bestgain Real Estate Ltd 2.625% 13/03/2018 473,654 1.08
200,000 US$ ENN Energy Holdings Ltd 6% 13/05/2021 211,149 0.48
100,000 US$ Sinochem Overseas Capital Co Ltd 4.5% 12/11/2020 98,591 0.23
210,000 US$ Sinochem Overseas Capital Co Ltd 6.3% 12/11/2040 208,166 0.48
30,000 US$ Sinopec Group Overseas Development 2012 Ltd 4.875% 17/05/2042 27,803 0.06
1,019,363 2.33
Peru
200,000 US$ Alicorp SAA 3.875% 20/03/2023 185,000 0.42
300,000 US$ Banco Internacional del Peru SAA 5.75% 07/10/2020 306,000 0.70
200,000 US$ BBVA Banco Continental SA 3.25% 08/04/2018 194,500 0.44
55,000 US$ Peruvian Government International Bond 7.125% 30/03/2019 66,550 0.15
30,000 US$ Peruvian Government International Bond 7.35% 21/07/2025 38,400 0.09
185,000 US$ Peruvian Government International Bond 8.75% 21/11/2033 269,175 0.62
200,000 US$ Transportadora de Gas del Peru SA 4.25% 30/04/2028 177,000 0.40
100,000 US$ Volcan Cia Minera SAA 5.375% 02/02/2022 98,500 0.23
1,335,125 3.05
Philippines
100,000 US$ Philippine Government International Bond 6.375% 23/10/2034 120,000 0.27
120,000 0.27
Poland
200,000 EUR Koleje Mazowieckie Finance AB 6.75% 09/03/2016 270,369 0.62
200,000 US$ PKO Finance AB 4.63% 26/09/2022 194,320 0.44
340,000 PLN Poland Government Bond 3% 24/08/2016 135,726 0.31
60,000 US$ Poland Government Bond 3% 17/03/2023 54,150 0.12
668,000 PLN Poland Government Bond 4% 25/10/2023 194,714 0.45
1,472,000 PLN Poland Government Bond 5.25% 25/10/2017 469,811 1.07
400,000 PLN Poland Government Bond 5.5% 25/10/2019 130,506 0.30
332,000 PLN Poland Government Bond 5.75% 25/10/2021 110,173 0.25
1,605,000 PLN Poland Government Bond 5.75% 23/09/2022 531,652 1.22
100,000 PLN Poland Government Bond 5.75% 25/04/2029 34,334 0.08
205,000 US$ Poland Government International Bond 5% 23/03/2022 220,375 0.50
2,346,130 5.36
The accompanying notes form an integral part of these consolidated financial statements.

Ashmore SICAV – Unaudited Semi-Annual Report for the period ended 30 June 2013
125
Ashmore SICAV Emerging Markets Investment Grade Total Return Fund Schedule of Investments (continued) As at 30 June 2013
Holdings
Currency Description of Investment Market Value
US$ Net Assets
%
Transferable securities admitted to an official stock exchange listing / dealt on another regulated market (continued)
Bonds (continued)
Qatar
100,000 US$ CBQ Finance Ltd 7.5% 18/11/2019 116,466 0.27
284,642 US$ Nakilat Inc 6.267% 31/12/2033 298,874 0.68
415,340 0.95
Republic of South Korea
100,000 US$ Shinhan Bank FRN 20/09/2036 110,312 0.25
400,000 US$ Woori Bank Co Ltd 5.875% 13/04/2021 426,582 0.98
536,894 1.23
Romania
30,000 RON Romania Government Bond 5.6% 28/11/2018 8,766 0.02
60,000 RON Romania Government Bond 5.75% 29/04/2020 17,503 0.04
300,000 RON Romania Government Bond 5.8% 26/10/2015 88,289 0.20
310,000 RON Romania Government Bond 5.85% 28/07/2014 91,023 0.21
40,000 RON Romania Government Bond 5.85% 26/04/2023 11,826 0.03
160,000 RON Romania Government Bond 5.9% 26/07/2017 46,753 0.11
180,000 US$ Romanian Government International Bond 4.375% 22/08/2023 171,004 0.39
480,000 US$ Romanian Government International Bond 6.75% 07/02/2022 535,128 1.22
970,292 2.22
Russian Federation
200,000 US$ Lukoil International Finance BV 6.125% 09/11/2020 210,500 0.48
100,000 US$ Lukoil International Finance BV 6.656% 07/06/2022 108,750 0.25
600,000 US$ Novatek OAO via Novatek Finance Ltd 4.422% 13/12/2022 550,500 1.26
1,160,000 RUB Russian Federal Bond - OFZ 6.8% 11/12/2019 34,629 0.08
21,870,000 RUB Russian Federal Bond - OFZ 6.9% 03/08/2016 672,862 1.54
2,710,000 RUB Russian Federal Bond - OFZ 7.05% 19/01/2028 76,154 0.17
5,773,000 RUB Russian Federal Bond - OFZ 7.4% 19/04/2017 179,021 0.41
1,437,000 RUB Russian Federal Bond - OFZ 7.4% 14/06/2017 44,583 0.10
6,660,000 RUB Russian Federal Bond - OFZ 7.5% 15/03/2018 209,219 0.48
14,825,000 RUB Russian Federal Bond - OFZ 7.5% 27/02/2019 458,370 1.05
7,900,000 RUB Russian Federal Bond - OFZ 7.6% 14/04/2021 244,987 0.56
4,232,000 RUB Russian Federal Bond - OFZ 8.15% 03/02/2027 132,395 0.30
75,000 US$ Russian Foreign Bond - Eurobond 12.75% 24/06/2028 129,750 0.30
298,000 US$ Russian Foreign Bond - Eurobond Step Cpn 31/03/2030 349,033 0.80
200,000 US$ Uralkali OJSC via Uralkali Finance Ltd 3.723% 30/04/2018 192,250 0.44
90,000 US$ Vnesheconombank Via VEB Finance PLC 6.8% 22/11/2025 95,850 0.22
550,000 US$ Vnesheconombank Via VEB Finance PLC 6.902% 09/07/2020 603,625 1.38
4,292,478 9.82
Singapore
100,000 SGD Singapore Government Bond 2.75% 01/07/2023 80,435 0.18
80,435 0.18
South Africa
400,000 US$ African Bank Ltd 8.125% 24/02/2017 394,620 0.90
830,000 ZAR South Africa Government Bond 6.25% 31/03/2036 64,039 0.15
1,200,000 ZAR South Africa Government Bond 6.5% 28/02/2041 93,120 0.21
700,000 ZAR South Africa Government Bond 6.75% 31/03/2021 67,634 0.15
2,910,000 ZAR South Africa Government Bond 7% 28/02/2031 254,634 0.58
The accompanying notes form an integral part of these consolidated financial statements.

Ashmore SICAV – Unaudited Semi-Annual Report for the period ended 30 June 2013
126
Ashmore SICAV Emerging Markets Investment Grade Total Return Fund Schedule of Investments (continued) As at 30 June 2013
Holdings
Currency Description of Investment Market Value
US$ Net Assets
%
Transferable securities admitted to an official stock exchange listing / dealt on another regulated market (continued)
Bonds (continued)
South Africa (continued)
4,100,000 ZAR South Africa Government Bond 7.75% 28/02/2023 416,476 0.95
2,400,000 ZAR South Africa Government Bond 8% 21/12/2018 251,909 0.58
4,600,000 ZAR South Africa Government Bond 8.25% 15/09/2017 486,283 1.11
100,000 ZAR South Africa Government Bond 8.75% 28/02/2048 10,036 0.02
2,350,000 ZAR South Africa Government Bond 10.5% 21/12/2026 286,951 0.66
135,000 US$ South Africa Government International Bond 5.875% 30/05/2022 144,450 0.33
100,000 US$ South Africa Government International Bond 6.875% 27/05/2019 113,250 0.26
400,000 US$ Standard Bank PLC 8.125% 02/12/2019 431,000 0.99
3,014,402 6.89
Taiwan
100,000 US$ Cathay United Bank Co Ltd FRN 05/10/2020 101,000 0.23
101,000 0.23
Thailand
1,300,000 THB Thailand Government Bond 1.2% 14/07/2021 42,470 0.10
1,200,000 THB Thailand Government Bond 1.25% 12/03/2028 37,560 0.08
3,550,000 THB Thailand Government Bond 3.58% 17/12/2027 107,804 0.25
1,600,000 THB Thailand Government Bond 3.625% 16/06/2023 50,895 0.12
8,300,000 THB Thailand Government Bond 3.65% 17/12/2021 266,576 0.61
3,000,000 THB Thailand Government Bond 3.875% 13/06/2019 98,629 0.23
603,934 1.39
Turkey
200,000 US$ Akbank TAS 5% 24/10/2022 186,500 0.43
200,000 US$ KOC Holding AS 3.5% 24/04/2020 173,000 0.40
200,000 US$ Yapi ve Kredi Bankasi AS 4% 22/01/2020 178,500 0.41
60,000 US$ Turkey Government International Bond 3.25% 23/03/2023 52,350 0.12
200,000 US$ Turkey Government International Bond 4.875% 16/04/2043 172,000 0.39
200,000 US$ Turkiye Halk Bankasi AS 3.875% 05/02/2020 180,000 0.41
200,000 US$ Turkiye Is Bankasi 3.75% 10/10/2018 188,000 0.43
1,130,350 2.59
United Arab Emirates
300,000 US$ Abu Dhabi National Energy Co 3.625% 12/01/2023 277,500 0.63
800,000 US$ DP World Ltd 6.85% 02/07/2037 826,000 1.89
200,000 US$ MAF Global Securities Ltd 5.25% 05/07/2019 204,000 0.47
1,307,500 2.99
Uruguay
300,000 UYU Uruguay Government International Bond 3.7% 26/06/2037 24,319 0.06
110,000 US$ Uruguay Government International Bond 4.125% 20/11/2045 89,650 0.20
540,000 UYU Uruguay Government International Bond 4.25% 05/04/2027 47,964 0.11
900,000 UYU Uruguay Government International Bond 4.375% 15/12/2028 57,958 0.13
840,000 UYU Uruguay Government International Bond 5% 14/09/2018 76,507 0.18
200,000 US$ Uruguay Government International Bond 7.625% 21/03/2036 252,500 0.58
548,898 1.26
Total bonds 37,611,393 86.05
Total transferable securities admitted to an official stock exchange listing / dealt on another regulated market 37,611,393 86.05
The accompanying notes form an integral part of these consolidated financial statements.

Ashmore SICAV – Unaudited Semi-Annual Report for the period ended 30 June 2013
127
Ashmore SICAV Emerging Markets Investment Grade Total Return Fund Schedule of Investments (continued) As at 30 June 2013
Holdings
Currency Description of Investment Market Value
US$ Net Assets
%
Other transferable securities and money market instruments
Bonds
Malaysia
500,000 MYR Malaysia Government Bond 3.314% 31/10/2017 157,697 0.36
100,000 MYR Malaysia Government Bond 3.48% 15/03/2023 31,172 0.07
740,000 MYR Malaysia Government Bond 3.492% 31/03/2020 233,230 0.53
400,000 MYR Malaysia Government Bond 3.58% 28/09/2018 126,751 0.29
500,000 MYR Malaysia Government Bond 4.012% 15/09/2017 161,447 0.37
300,000 MYR Malaysia Government Bond 4.16% 15/07/2021 98,007 0.22
650,000 MYR Malaysia Government Bond 4.262% 15/09/2016 211,019 0.48
340,000 MYR Malaysia Government Bond 4.392% 15/04/2026 113,776 0.26
1,133,099 2.58
Peru
210,000 PEN Peruvian Government International Bond 6.95% 12/08/2031 78,490 0.18
120,000 PEN Peruvian Government International Bond 8.2% 12/08/2026 52,684 0.12
131,174 0.30
Total bonds 1,264,273 2.88
Total other transferable securities and money market instruments 1,264,273 2.88
Fully-funded total return swaps
Colombia
143,000,000 COP Colombian TES 8% 28/10/2015 78,399 0.18
78,399 0.18
India
6,600,000 INR India Government Bond 8.07% 03/07/2017 112,608 0.26
112,608 0.26
Total fully-funded total return swaps 191,007 0.44
Written options 700,000 EUR Currency PUT option EUR/USD 1.26 European 08/11/2013 (Bank of
America) 9,666 0.02
800,000 EUR Currency PUT option EUR/USD 1.27 European 11/09/2013 (HSBC) 7,896 0.02 700,000 EUR Currency PUT option EUR/USD 1.28 European 04/10/2013 (Bank of
America) 10,819 0.02
28,381 0.06
Total written options 28,381 0.06
Total investment portfolio 39,095,054 89.43
Cash at bank 5,033,583 11.52
Other assets and liabilities (415,707) (0.95)
Total net assets 43,712,930 100.00
The accompanying notes form an integral part of these consolidated financial statements.

Ashmore SICAV – Unaudited Semi-Annual Report for the period ended 30 June 2013
128
Ashmore SICAV Emerging Markets Corporate Debt Fund Schedule of Investments As at 30 June 2013
Holdings
Currency Description of Investment Market Value
US$ Net Assets
%
Transferable securities admitted to an official stock exchange listing / dealt on another regulated market
Bonds
Argentina
1,010,000 US$ Transportadora de Gas del Sur SA 7.875% 14/05/2017 881,124 0.03
13,379,000 US$ WPE International Cooperatief UA 10.375% 30/09/2020 10,435,620 0.31
11,316,744 0.34
Barbados
20,500,000 US$ Columbus International Inc 11.5% 20/11/2014 22,088,750 0.65
22,088,750 0.65
Brazil
5,170,000 US$ Banco do Brasil SA 3.875% 10/10/2022 4,530,471 0.13
4,300,000 US$ Banco do Brasil SA FRN (Perpetual) 4,622,500 0.14
6,030,000 US$ Banco Santander Brasil SA 4.625% 13/02/2017 6,120,450 0.18
8,000,000 BRL Banco Santander Brasil SA 8% 18/03/2016 3,331,749 0.10
8,645,000 BRL Banco Votorantim SA 6.25% 16/05/2016 4,256,589 0.13
5,200,000 US$ Braskem Finance Ltd 5.75% 15/04/2021 5,070,000 0.15
10,710,000 US$ BRF SA 5.875% 06/06/2022 10,991,673 0.32
26,800,000 BRL Cosan Luxembourg SA 9.5% 14/03/2018 11,540,481 0.34
1,650,000 US$ Gerdau Holdings Inc 7% 20/01/2020 1,740,750 0.05
4,870,000 US$ Globo Comunicacao e Participacoes SA 4.875% 11/04/2022 4,930,875 0.15
5,670,000 US$ Itau Unibanco Holding SA 5.65% 19/03/2022 5,499,900 0.16
2,200,000 US$ Itau Unibanco Holding SA 6.2% 21/12/2021 2,227,500 0.07
27,957,000 US$ Marfrig Holding Europe BV 9.875% 24/07/2017 28,096,785 0.83
11,000,000 US$ Marfrig Overseas Ltd 9.5% 04/05/2020 10,903,750 0.32
17,500,000 US$ Minerva Luxembourg SA 7.75% 31/01/2023 17,412,500 0.51
2,400,000 US$ Minerva Luxembourg SA 12.25% 10/02/2022 2,868,000 0.08
4,215,000 US$ Mirabela Nickel Ltd 8.75% 15/04/2018 3,329,850 0.10
11,750,000 US$ Odebrecht Finance Ltd 4.375% 25/04/2025 10,516,250 0.31
4,370,000 US$ OGX Austria GmbH 8.375% 01/04/2022 1,267,300 0.04
37,700,000 US$ OGX Austria GmbH 8.5% 01/06/2018 11,875,500 0.35
13,162,954 US$ OSX 3 Leasing BV 9.25% 20/03/2015 11,451,770 0.34
1,000,000 US$ Oi SA 5.75% 10/02/2022 931,250 0.03
8,400,000 US$ Petrobras Global Finance BV 4.375% 20/05/2023 7,705,673 0.23
22,150,000 BRL RBS-Zero Hora Editora Jornalistica SA 11.25% 15/06/2017 9,791,637 0.29
5,191,253 US$ Schahin II Finance Co SPV Ltd 5.875% 25/09/2022 5,139,341 0.15
5,421,000 US$ Telemar Norte Leste SA 5.5% 23/10/2020 5,041,530 0.15
5,790,000 US$ Vale Overseas Ltd 4.375% 11/01/2022 5,499,545 0.16
196,693,619 5.81
Chile
1,600,000 US$ Automotores Gildemeister SA 6.75% 15/01/2023 1,360,000 0.04
7,190,000 US$ Automotores Gildemeister SA 8.25% 24/05/2021 6,650,750 0.20
3,610,000 US$ Banco de Credito e Inversiones 4% 11/02/2023 3,403,439 0.10
1,872,500,000 CLP Banco Santander Chile 6.5% 22/09/2020 3,645,480 0.11
6,600,000 US$ Cencosud SA 4.875% 20/01/2023 6,469,927 0.19
1,700,000 US$ Cencosud SA 5.5% 20/01/2021 1,744,440 0.05 The accompanying notes form an integral part of these consolidated financial statements.

Ashmore SICAV – Unaudited Semi-Annual Report for the period ended 30 June 2013
129
Ashmore SICAV Emerging Markets Corporate Debt Fund Schedule of Investments (continued) As at 30 June 2013
Holdings
Currency Description of Investment Market Value
US$ Net Assets
%
Transferable securities admitted to an official stock exchange listing / dealt on another regulated market (continued)
Bonds (continued)
Chile (contnued)
6,600,000 US$ Cencosud SA 4.875% 20/01/2023 6,469,927 0.19
1,700,000 US$ Cencosud SA 5.5% 20/01/2021 1,744,440 0.05
2,655,000 US$ E.CL SA 5.625% 15/01/2021 2,756,657 0.08
21,330,518 US$ Inversiones Alsacia SA 8% 18/08/2018 18,024,287 0.53
2,300,000 US$ Inversiones CMPC SA 4.375% 15/05/2023 2,201,388 0.06
3,900,000 US$ SACI Falabella 3.75% 30/04/2023 3,568,500 0.11
16,200,000 US$ SMU SA 7.75% 08/02/2020 14,661,000 0.43
2,500,000 US$ Sociedad Quimica y Minera de Chile SA 3.625% 03/04/2023 2,323,468 0.07
6,200,000 US$ Telefonica Chile SA 3.875% 12/10/2022 5,661,840 0.17
72,471,176 2.14
Colombia
3,800,000 US$ Banco Davivienda SA 2.95% 29/01/2018 3,591,000 0.11
4,000,000 US$ Banco de Bogota SA 5.375% 19/02/2023 3,900,000 0.12
13,500,000 US$ Bancolombia SA 5.125% 11/09/2022 12,858,750 0.38
4,900,000 US$ Empresa de Energia de Bogota SA 6.125% 10/11/2021 5,071,500 0.15
11,100,000,000 COP Empresa de Telecomunicaciones de Bogota 7% 17/01/2023 5,431,456 0.16
6,510,000 US$ Grupo Aval Ltd 4.75% 26/09/2022 6,119,400 0.18
4,000,000 US$ Gruposura Finance 5.7% 18/05/2021 4,120,000 0.12
41,092,106 1.22
Croatia
1,200,000 EUR Zagrebacki Holding D.O.O. 5.5% 10/07/2017 1,269,226 0.04
1,269,226 0.04
Czech Republic
4,020,000 EUR EP Energy AS 5.875% 01/11/2019 5,538,921 0.16
16,473,000 EUR New World Resources NV 7.875% 01/05/2018 12,686,865 0.37
13,100,000 EUR New World Resources NV 7.875% 15/01/2021 4,853,024 0.14
23,078,810 0.67
Greece
4,500,000 EUR Frigoglass Finance BV 8.25% 15/05/2018 6,024,805 0.18
6,024,805 0.18
Hong Kong
8,350,000 US$ CFG Investment SAC 9.75% 30/07/2019 7,473,250 0.22
17,620,000 US$ CIFI Holdings Group Co Ltd 12.25% 15/04/2018 17,791,266 0.52
11,684,000 US$ Hengdeli Holdings Ltd 6.25% 29/01/2018 11,369,560 0.34
7,400,000 US$ Hutchison Whampoa International 11 Ltd 4.625% 13/01/2022 7,555,126 0.22
17,440,000 US$ Noble Group Ltd 6.75% 29/01/2020 17,701,600 0.52
12,700,000 US$ Nord Anglia Education Inc PIK 15/02/2018 12,319,000 0.36
15,600,000 US$ Nord Anglia Education UK Holdings PLC 10.25% 01/04/2017 16,692,000 0.49
9,700,000 US$ Pacnet Ltd 9.25% 09/11/2015 9,700,000 0.29
6,600,000 US$ PCCW-HKT Capital No 5 Ltd 3.75% 08/03/2023 5,849,263 0.17
16,900,000 US$ Shimao Property Holdings Ltd 6.625% 14/01/2020 14,868,181 0.44
6,200,000 US$ Shimao Property Holdings Ltd 9.65% 03/08/2017 6,481,170 0.19
4,700,000 US$ Shimao Property Holdings Ltd 11% 08/03/2018 5,016,912 0.15
132,817,328 3.91 The accompanying notes form an integral part of these consolidated financial statements.

Ashmore SICAV – Unaudited Semi-Annual Report for the period ended 30 June 2013
130
Ashmore SICAV Emerging Markets Corporate Debt Fund Schedule of Investments (continued) As at 30 June 2013
Holdings
Currency Description of Investment Market Value
US$ Net Assets
%
Transferable securities admitted to an official stock exchange listing / dealt on another regulated market (continued)
Bonds (continued)
India
6,687,000 US$ Bank of Baroda FRN 25/05/2022 6,525,215 0.19
1,800,000 US$ Bartronics India Ltd 0% 04/02/2013 (Defaulted) 324,000 0.01
9,420,000 US$ Bharat Petroleum Corp Ltd 4.625% 25/10/2022 8,695,951 0.26
6,100,000 US$ Bharti Airtel International Netherlands BV 5.125% 11/03/2023 5,543,680 0.16
2,200,000 US$ Geodesic Ltd 0% 18/01/2013 (Defaulted) 440,000 0.01
8,050,000 US$ ICICI Bank Ltd 5.75% 16/11/2020 8,205,019 0.24
12,150,000 US$ Reliance Holdings USA Inc 5.4% 14/02/2022 12,343,051 0.36
1,350,000 US$ Suzlon Energy Ltd 0% 11/10/2012 (Defaulted) 958,500 0.03
1,800,000 US$ Suzlon Energy Ltd 0% 25/07/2014 1,170,000 0.03
14,000,000 US$ Suzlon Energy Ltd FRN 13/04/2016 6,930,000 0.20
10,400,000 US$ Vedanta Resources PLC 6% 31/01/2019 9,880,000 0.29
11,000,000 US$ Vedanta Resources PLC 7.125% 31/05/2023 10,395,000 0.31
25,400,000 US$ Vedanta Resources PLC 8.25% 07/06/2021 25,590,500 0.75
97,000,916 2.84
Indonesia
4,000,000 US$ Bumi Investment Pte Ltd 10.75% 06/10/2017 2,880,000 0.08
5,800,000 US$ Indo Energy Finance II BV 6.375% 24/01/2023 5,060,500 0.15
5,190,000 US$ Indosat Palapa Co BV 7.375% 29/07/2020 5,553,300 0.16
13,493,800 0.39
Israel
11,300,000 US$ Altice Financing SA 7.875% 15/12/2019 11,808,500 0.35
11,400,000 EUR Altice Financing SA 8% 15/12/2019 15,411,022 0.45
19,750,000 US$ Altice Finco SA 9.875% 15/12/2020 21,132,500 0.62
2,000,000 US$ Israel Electric Corp Ltd 6.875% 21/06/2023 2,018,020 0.06
10,320,000 US$ Israel Electric Corp Ltd 7.25% 15/01/2019 10,990,800 0.32
61,360,842 1.80
Jamaica
76,050,000 US$ Digicel Group Ltd 8.25% 30/09/2020 78,711,750 2.32
30,580,000 US$ Digicel Group Ltd 10.5% 15/04/2018 32,414,800 0.96
30,300,000 US$ Digicel Ltd 6% 15/04/2021 28,633,500 0.84
19,060,000 US$ Digicel Ltd 7% 15/02/2020 19,250,600 0.57
159,010,650 4.69
Kazakhstan
5,520,000 US$ ATF Bank JSC 9% 11/05/2016 5,313,000 0.16
3,450,000 US$ Development Bank of Kazakhstan JSC 4.125% 10/12/2022 3,070,500 0.09
1,000,000 US$ Development Bank of Kazakhstan JSC 6% 23/03/2026 972,500 0.03
5,805,000 US$ Development Bank of Kazakhstan JSC 6.5% 03/06/2020 6,095,250 0.18
4,100,000 US$ KazAgro National Management Holding JSC 4.625% 24/05/2023 3,772,000 0.11
11,600,000 EUR Kazkommertsbank JSC 6.875% 13/02/2017 14,399,739 0.42
19,450,000 US$ Kazkommertsbank JSC 7.5% 29/11/2016 18,915,125 0.56
2,150,000 US$ Kazkommertsbank JSC 7.875% 07/04/2014 2,150,000 0.06
12,050,000 US$ Kazkommertsbank JSC 8% 03/11/2015 11,977,821 0.35
The accompanying notes form an integral part of these consolidated financial statements.

Ashmore SICAV – Unaudited Semi-Annual Report for the period ended 30 June 2013
131
Ashmore SICAV Emerging Markets Corporate Debt Fund Schedule of Investments (continued) As at 30 June 2013
Holdings
Currency Description of Investment Market Value
US$ Net Assets
%
Transferable securities admitted to an official stock exchange listing / dealt on another regulated market (continued)
Bonds (continued)
Kazakhstan (continued)
17,950,000 US$ Kazkommertsbank JSC 8.5% 11/05/2018 17,052,500 0.50
2,500,000 US$ Kazkommertsbank JSC Via Citigroup Global Markets FRN 07/04/2014 2,506,250 0.07
7,500,000 US$ KazMunayGas National Co JSC 5.75% 30/04/2043 6,637,500 0.20
800,000 US$ Tristan Oil Ltd 0% 01/01/2016 432,000 0.01
23,500,000 US$ Zhaikmunai LP 7.125% 13/11/2019 23,558,750 0.69
116,852,935 3.43
Kuwait
8,690,000 US$ Kuwait Projects Co 9.375% 15/07/2020 10,080,400 0.30
10,080,400 0.30
Lithuania
9,370,000 EUR Bite Finance International BV FRN 15/02/2018 12,179,595 0.36
12,179,595 0.36
Malaysia
4,900,000 US$ IOI Investment L Bhd 4.375% 27/06/2022 4,573,483 0.13
6,490,000 US$ Malayan Banking Bhd FRN 20/09/2022 6,278,024 0.19
10,851,507 0.32
Mexico
8,540,000 US$ Alpek SA de CV 4.5% 20/11/2022 8,219,750 0.24
700,000 US$ America Movil SAB de CV 3.125% 16/07/2022 644,977 0.02
1,600,000 US$ America Movil SAB de CV 6.125% 30/03/2040 1,730,300 0.05
1,750,000 US$ America Movil SAB de CV 6.375% 01/03/2035 1,945,365 0.06
119,100,000 MXN America Movil SAB de CV 6.45% 05/12/2022 8,854,866 0.26
1,200,000 US$ BBVA Bancomer SA 4.5% 10/03/2016 1,245,000 0.04
7,200,000 US$ BBVA Bancomer SA 6.5% 10/03/2021 7,560,000 0.22
12,900,000 US$ BBVA Bancomer SA 6.75% 30/09/2022 13,932,000 0.41
54,468,000 US$ Cemex Espana Luxembourg 9.25% 12/05/2020 57,463,740 1.69
14,900,000 US$ Cemex Espana Luxembourg 9.875% 30/04/2019 16,092,000 0.47
34,100,000 US$ Cemex Finance LLC 9.375% 12/10/2022 37,169,000 1.10
2,500,000 US$ Cemex SAB de CV 5.875% 25/03/2019 2,425,000 0.07
32,100,000 US$ Cemex SAB de CV 9% 11/01/2018 33,705,000 0.99
6,800,000 US$ Cemex SAB de CV 9.5% 15/06/2018 7,344,000 0.22
3,450,000 US$ Comision Federal de Electricidad 5.75% 14/02/2042 3,191,250 0.09
4,305,000 US$ Corp GEO SAB de CV FRN 30/06/2020 1,894,200 0.06
6,100,000 US$ Desarrolladora Homex SAB de CV 9.75% 25/03/2020 2,074,000 0.06
4,250,000 US$ Desarrolladora Homex SAB de CV FRN 11/12/2019 (Defaulted) 1,445,000 0.04
15,250,000 US$ Empresas ICA SAB de CV 8.375% 24/07/2017 13,420,000 0.40
8,180,000 US$ Fomento Economico Mexicano SAB de CV 2.875% 10/05/2023 7,406,352 0.22
13,511,000 US$ Grupo Papelero Scribe SA de CV 8.875% 07/04/2020 12,970,560 0.38
9,350,000 US$ Grupo Senda Autotransporte SA de CV 10.5% 03/10/2015 9,607,125 0.28
2,500,000 US$ Grupo Televisa SAB 6.625% 18/03/2025 2,922,393 0.09
950,000 US$ Grupo Televisa SAB 6.625% 15/01/2040 1,047,610 0.03
16,950,000 US$ Mexichem SAB de CV 4.875% 19/09/2022 17,034,750 0.50
7,360,000 US$ Mexichem SAB de CV 6.75% 19/09/2042 7,212,800 0.21 The accompanying notes form an integral part of these consolidated financial statements.

Ashmore SICAV – Unaudited Semi-Annual Report for the period ended 30 June 2013
132
Ashmore SICAV Emerging Markets Corporate Debt Fund Schedule of Investments (continued) As at 30 June 2013
Holdings
Currency Description of Investment Market Value
US$ Net Assets %
Transferable securities admitted to an official stock exchange listing / dealt on another regulated market (continued)
Bonds (continued)
Mexico (continued)
16,400,000 US$ NII Capital Corp 7.625% 01/04/2021 12,751,000 0.38
4,300,000 US$ NII Capital Corp 8.875% 15/12/2019 3,633,500 0.11
11,388,000 US$ Oceanografia SA de CV 11.25% 15/07/2015 9,480,511 0.28
127,600,000 MXN Petroleos Mexicanos 7.65% 24/11/2021 10,363,089 0.31
15,113,000 US$ Urbi Desarrollos Urbanos SAB de CV 9.5% 21/01/2020 3,324,860 0.10
17,860,000 US$ Urbi Desarrollos Urbanos SAB de CV 9.75% 03/02/2022 3,929,200 0.12
910,000 US$ Urbi Desarrollos Urbanos SAB de CV FRN 19/04/2016 (Defaulted) 200,200 0.01
322,239,398 9.51
Mongolia
34,020,000 US$ Mongolian Mining Corp 8.875% 29/03/2017 28,917,000 0.85
4,325,000 US$ Trade & Development Bank of Mongolia LLC 8.5% 25/10/2013 4,323,517 0.13
7,800,000 US$ Trade & Development Bank of Mongolia LLC 8.5% 20/09/2015 7,590,219 0.22
40,830,736 1.20
Nigeria
10,240,000 US$ Afren PLC 10.25% 08/04/2019 11,443,200 0.34
9,515,000 US$ Afren PLC 11.5% 01/02/2016 10,561,650 0.31
22,004,850 0.65
Pakistan
3,875,000 US$ Pakistan Mobile Communications Ltd 8.625% 13/11/2013 3,855,625 0.11
3,855,625 0.11
Panama
7,000,000 US$ Sable International Finance Ltd 8.75% 01/02/2020 7,700,000 0.23
7,700,000 0.23
Paraguay
3,950,000 US$ Banco Bilbao Vizcaya Argentaria Paraguay SA 9.75% 11/02/2016 4,167,250 0.12
12,300,000 US$ Telefonica Celular del Paraguay SA 6.75% 13/12/2022 12,761,250 0.38
16,928,500 0.50
People's Republic of China
47,000,000 CNH 21Vianet Group Inc 7.875% 22/03/2016 7,310,839 0.22
5,010,000 US$ Agile Property Holdings Ltd 9.875% 20/03/2017 5,247,975 0.15
1,850,000 US$ Agile Property Holdings Ltd 10% 14/11/2016 1,965,625 0.06
2,500,000 US$ Baidu Inc 3.5% 28/11/2022 2,233,795 0.07
9,250,000 US$ Bestgain Real Estate Ltd 2.625% 13/03/2018 8,762,599 0.26
15,000,000 CNY Chaowei Power Holdings Ltd 7.25% 24/09/2017 2,309,535 0.07
3,750,000 US$ China Automation Group Ltd 7.75% 20/04/2016 3,529,050 0.10
4,050,000 US$ China CITIC Bank International Ltd 6.875% 24/06/2020 4,277,513 0.13
4,510,000 US$ China Forestry Holdings Co Ltd 10.25% 17/11/2015 1,849,100 0.06
11,700,000 US$ China Liansu Group Holdings Ltd 7.875% 13/05/2016 11,612,250 0.34
6,950,000 US$ China Oriental Group Co Ltd 8% 18/08/2015 6,845,750 0.20
2,450,000 US$ China Overseas Finance Cayman II Ltd 5.5% 10/11/2020 2,542,007 0.08
4,500,000 US$ China Railway Resources Huitung Ltd 3.85% 05/02/2023 4,031,964 0.12
6,433,000 US$ China SCE Property Holdings Ltd 11.5% 14/11/2017 6,432,022 0.19 The accompanying notes form an integral part of these consolidated financial statements.

Ashmore SICAV – Unaudited Semi-Annual Report for the period ended 30 June 2013
133
Ashmore SICAV Emerging Markets Corporate Debt Fund Schedule of Investments (continued) As at 30 June 2013
Holdings
Currency Description of Investment Market Value
US$ Net Assets
%
Transferable securities admitted to an official stock exchange listing / dealt on another regulated market (continued)
Bonds (continued)
People's Republic of China (continued)
1,400,000 US$ COSL Finance BVI Ltd 3.25% 06/09/2022 1,252,157 0.04
17,200,000 US$ Country Garden Holdings Co Ltd 7.5% 10/01/2023 15,738,000 0.46
3,200,000 US$ Country Garden Holdings Co Ltd 10.5% 11/08/2015 3,408,438 0.10
12,862,000 US$ Country Garden Holdings Co Ltd 11.125% 23/02/2018 13,955,270 0.41
7,370,000 US$ ENN Energy Holdings Ltd 6% 13/05/2021 7,780,848 0.23
64,300,000 CNH Evergrande Real Estate Group Ltd 9.25% 19/01/2016 9,695,811 0.29
20,590,000 US$ Evergrande Real Estate Group Ltd 13% 27/01/2015 21,207,700 0.63
10,050,000 US$ Fosun International Ltd 7.5% 12/05/2016 10,150,500 0.30
7,600,000 US$ Franshion Development Ltd 6.75% 15/04/2021 7,410,000 0.22
10,200,000 US$ Fufeng Group Ltd 7.625% 13/04/2016 9,588,000 0.28
15,750,000 US$ Gemdale International Investment Ltd 7.125% 16/11/2017 15,401,216 0.45
8,450,000 US$ Hidili Industry International Development Ltd 8.625% 04/11/2015 6,464,250 0.19
18,400,000 US$ Hyva Global BV 8.625% 24/03/2016 17,296,000 0.51
3,550,000 US$ KWG Property Holding Ltd 12.5% 18/08/2017 3,792,387 0.11
8,900,000 US$ KWG Property Holding Ltd 13.25% 22/03/2017 9,668,649 0.29
8,800,000 US$ Lonking Holdings Ltd 8.5% 03/06/2016 8,624,000 0.25
700,000 US$ Natixis FRN 13/05/2016 694,750 0.02
8,700,000 US$ Powerlong Real Estate Holdings Ltd 11.25% 25/01/2018 8,045,664 0.24
2,200,000 US$ Powerlong Real Estate Holdings Ltd 13.75% 16/09/2015 2,299,000 0.07
13,720,000 US$ Sunac China Holdings Ltd 9.375% 05/04/2018 13,210,906 0.39
18,300,000 US$ Sunac China Holdings Ltd 12.5% 16/10/2017 19,494,368 0.57
8,100,000 US$ Texhong Textile Group Ltd 6.5% 18/01/2019 7,551,905 0.22
29,550,000 US$ West China Cement Ltd 7.5% 25/01/2016 28,220,250 0.83
11,509,000 US$ Yanlord Land Group Ltd 9.5% 04/05/2017 11,911,815 0.35
23,198,000 US$ Yanlord Land Group Ltd 10.625% 29/03/2018 24,299,906 0.72
11,600,000 US$ Yingde Gases Investment Ltd 8.125% 22/04/2018 11,252,000 0.33
8,900,000 US$ Yuzhou Properties Co 11.75% 25/10/2017 9,229,790 0.27
366,593,604 10.82
Peru
13,490,000 US$ Ajecorp BV 6.5% 14/05/2022 13,732,820 0.40
7,330,000 US$ Alicorp SAA 3.875% 20/03/2023 6,780,250 0.20 2,600,000 US$ Banco Continental SA via Continental Senior Trustees II Cayman Ltd 5.75%
18/01/2017 2,749,500 0.08
1,900,000 US$ Banco de Credito del Peru 4.25% 01/04/2023 1,752,750 0.05
1,933,000 US$ Banco Internacional del Peru SAA 5.75% 07/10/2020 1,971,660 0.06
2,680,000 US$ BBVA Banco Continental SA 5% 26/08/2022 2,613,000 0.08
12,030,000 US$ Corp Azucarera del Peru SA 6.375% 02/08/2022 11,972,256 0.35
4,180,000 US$ Southern Copper Corp 3.5% 08/11/2022 3,751,483 0.11
4,675,000 US$ Southern Copper Corp 6.75% 16/04/2040 4,596,497 0.14
800,000 US$ Southern Copper Corp 7.5% 27/07/2035 855,163 0.03
6,200,000 US$ Transportadora de Gas del Peru SA 4.25% 30/04/2028 5,487,000 0.16
56,262,379 1.66 The accompanying notes form an integral part of these consolidated financial statements.

Ashmore SICAV – Unaudited Semi-Annual Report for the period ended 30 June 2013
134
Ashmore SICAV Emerging Markets Corporate Debt Fund Schedule of Investments (continued) As at 30 June 2013
Holdings
Currency Description of Investment Market Value
US$ Net Assets
%
Transferable securities admitted to an official stock exchange listing / dealt on another regulated market (continued)
Bonds (continued)
Philippines
8,800,000 US$ JGSH Philippines Ltd 4.375% 23/01/2023 8,250,000 0.24
639,000,000 PHP Petron Corp 7% 10/11/2017 14,987,804 0.44
23,237,804 0.68
Poland
9,507,308 US$ CEDC Finance Corp International Inc 10% 30/04/2018 6,809,134 0.20
22,085,016 US$ CEDC Finance Corp International Inc Step Cpn 30/04/2018 19,531,988 0.58
12,753,075 US$ Eileme 1 AB PIK 15/08/2020 14,028,383 0.41
10,000,000 US$ Eileme 2 AB 11.625% 31/01/2020 11,300,000 0.33
27,750,000 EUR Eileme 2 AB 11.75% 31/01/2020 40,940,403 1.21
1,675,000 EUR Koleje Mazowieckie Finance AB 6.75% 09/03/2016 2,264,339 0.07
8,150,000 US$ PKO Finance AB 4.63% 26/09/2022 7,918,540 0.23
20,100,000 EUR Polish Television Holding BV Step Cpn 15/05/2017 27,041,431 0.80
129,834,218 3.83
Qatar
5,000,000 US$ CBQ Finance Ltd 7.5% 18/11/2019 5,823,325 0.17
2,870,138 US$ Nakilat Inc 6.267% 31/12/2033 3,013,645 0.09
4,400,000 US$ Qtel International Finance Ltd 5% 19/10/2025 4,466,000 0.13
4,950,000 US$ Ras Laffan Liquefied Natural Gas Co Ltd III 5.838% 30/09/2027 5,568,750 0.16
18,871,720 0.55
Republic of South Korea
13,220,000 US$ Korea Hydro & Nuclear Power Co Ltd 4.75% 13/07/2021 13,549,495 0.40
8,410,000 US$ Shinhan Bank 1.875% 30/07/2018 7,856,874 0.23
2,800,000 US$ Shinhan Bank 4.125% 04/10/2016 2,966,222 0.09
4,750,000 US$ Woori Bank Co Ltd 5.875% 13/04/2021 5,065,661 0.15
29,438,252 0.87
Russian Federation
21,120,000 US$ Alfa Bank OJSC Via Alfa Bond Issuance PLC 7.5% 26/09/2019 21,542,400 0.64
5,730,000 US$ Alfa Bank OJSC Via Alfa Bond Issuance PLC 7.75% 28/04/2021 5,901,900 0.17
28,650,000 US$ Brunswick Rail Finance Ltd 6.5% 01/11/2017 28,363,500 0.84
12,500,000 US$ Credit Bank of Moscow Via CBOM Finance PLC 7.7% 01/02/2018 12,687,500 0.37
8,700,000 US$ Evraz Group SA 6.5% 22/04/2020 7,830,000 0.23
9,900,000 US$ Far East Capital Ltd SA 8% 02/05/2018 9,132,750 0.27
8,800,000 US$ Far East Capital Ltd SA 8.75% 02/05/2020 8,052,000 0.24
8,420,000 US$ Gazprom Neft OAO Via GPN Capital SA 4.375% 19/09/2022 7,711,457 0.23
6,000,000 US$ Lukoil International Finance BV 4.563% 24/04/2023 5,580,000 0.16
1,300,000 US$ Lukoil International Finance BV 6.125% 09/11/2020 1,368,250 0.04
1,400,000 US$ Lukoil International Finance BV 6.656% 07/06/2022 1,522,500 0.04
17,400,000 US$ Metalloinvest Finance Ltd 5.625% 17/04/2020 15,921,000 0.47
5,800,000 US$ Novatek OAO via Novatek Finance Ltd 4.422% 13/12/2022 5,321,500 0.16
6,090,000 US$ Phosagro OAO via Phosagro Bond Funding Ltd 4.204% 13/02/2018 5,998,650 0.18
2,000,000 US$ Promsvyazbank OJSC Via PSB Finance SA 8.5% 25/04/2017 2,108,340 0.06
22,500,000 US$ Promsvyazbank OJSC Via PSB Finance SA 10.2% 06/11/2019 23,625,000 0.70
3,050,000 US$ Promsvyazbank OJSC Via PSB Finance SA 11.25% 08/07/2016 3,342,495 0.10
2,300,000 US$ Rosneft Oil Co via Rosneft International Finance Ltd 4.199% 06/03/2022 2,130,950 0.06 The accompanying notes form an integral part of these consolidated financial statements.

Ashmore SICAV – Unaudited Semi-Annual Report for the period ended 30 June 2013
135
Ashmore SICAV Emerging Markets Corporate Debt Fund Schedule of Investments (continued) As at 30 June 2013
Holdings
Currency Description of Investment Market Value
US$ Net Assets
%
Transferable securities admitted to an official stock exchange listing / dealt on another regulated market (continued)
Bonds (continued)
Russian Federation (continued)
13,250,000 US$ Russian Standard Bank Via Russian Standard Finance SA 9.25% 11/07/2017 13,714,413 0.41
29,000,000 US$ Russian Standard Bank Via Russian Standard Finance SA 10.75% 10/04/2018 30,450,000 0.90
13,660,000 US$ Sberbank of Russia Via SB Capital SA 5.125% 29/10/2022 12,806,250 0.38
18,400,000 US$ Tinkoff Credit Systems Via TCS Finance Ltd 10.75% 18/09/2015 19,440,520 0.57
24,360,000 US$ Tinkoff Credit Systems Via TCS Finance Ltd 11.5% 21/04/2014 25,745,110 0.76
13,500,000 US$ Tinkoff Credit Systems Via TCS Finance Ltd 14% 06/06/2018 14,985,000 0.44
1,500,000 US$ TMK OAO Via TMK Capital SA 6.75% 03/04/2020 1,391,250 0.04
2,500,000 US$ TMK OAO Via TMK Capital SA 7.75% 27/01/2018 2,500,000 0.07
6,500,000 US$ TNK-BP Finance SA 7.25% 02/02/2020 7,280,000 0.22
1,100,000 US$ TNK-BP Finance SA 7.875% 13/03/2018 1,251,250 0.04
3,900,000 US$ Uralkali OJSC via Uralkali Finance Ltd 3.723% 30/04/2018 3,748,875 0.11
33,700,000 US$ Vimpel Communications Via VIP Finance Ireland Ltd OJSC 7.748% 02/02/2021 35,932,625 1.06
265,000,000 RUB VimpelCom Holdings BV 9% 13/02/2018 7,951,978 0.23
2,600,000 US$ Vnesheconombank Via VEB Finance PLC 5.45% 22/11/2017 2,704,000 0.08
7,535,000 US$ Vnesheconombank Via VEB Finance PLC 6.8% 22/11/2025 8,024,775 0.24
8,270,000 US$ VTB Bank OJSC Via VTB Capital SA 6.551% 13/10/2020 8,559,450 0.25
9,000,000 US$ VTB Bank OJSC Via VTB Capital SA 6.95% 17/10/2022 9,135,000 0.27
373,760,688 11.03
Saudi Arabia
10,160,000 US$ Saudi Electricity Global Sukuk Co 4.211% 03/04/2022 10,160,000 0.30
10,160,000 0.30
Seychelles
5,400,000 US$ RDS Ultra-Deepwater Ltd 11.875% 15/03/2017 5,832,000 0.17
5,832,000 0.17
Singapore
6,800,000 US$ MMI International Ltd 8% 01/03/2017 6,834,000 0.20
8,824,925 US$ Rubicon Offshore Holdings Ltd PIK 16/04/2014 8,163,056 0.24
5,033,753 US$ Sea Production Ltd FRN 14/02/2014 4,631,053 0.14
19,628,109 0.58
South Africa
4,550,000 US$ African Bank Ltd 8.125% 24/02/2017 4,488,803 0.13
28,633,000 EUR Edcon Holdings Pty Ltd FRN 15/06/2015 32,566,281 0.96
23,700,000 EUR Edcon Pty Ltd 9.5% 01/03/2018 28,597,676 0.84
7,805,000 EUR Foodcorp Pty Ltd 8.75% 01/03/2018 10,780,427 0.32
4,300,000 US$ Sappi Papier Holding GmbH 6.625% 15/04/2021 4,171,000 0.12
5,200,000 US$ Sappi Papier Holding GmbH 7.75% 15/07/2017 5,486,000 0.16
1,700,000 US$ Sappi Papier Holding GmbH 8.375% 15/06/2019 1,793,500 0.05
11,805,000 US$ Standard Bank PLC 8.125% 02/12/2019 12,719,888 0.38
100,603,575 2.96
The accompanying notes form an integral part of these consolidated financial statements.

Ashmore SICAV – Unaudited Semi-Annual Report for the period ended 30 June 2013
136
Ashmore SICAV Emerging Markets Corporate Debt Fund Schedule of Investments (continued) As 30 June 2013
Holdings
Currency Description of Investment Market Value
US$ Net Assets
%
Transferable securities admitted to an official stock exchange listing / dealt on another regulated market (continued)
Bonds (continued)
Taiwan
100,000 US$ Cathay United Bank Co Ltd FRN 05/10/2020 101,000 -
576,000 US$ Chinatrust Commercial Bank Hong Kong FRN 29/03/2049 567,360 0.02
668,360 0.02
Thailand
7,550,000 US$ PTT Global Chemical PCL 4.25% 19/09/2022 7,233,413 0.21
7,233,413 0.21
Turkey
4,000,000 US$ Akbank TAS 5% 24/10/2022 3,730,000 0.11
3,800,000 US$ Anadolu Efes Biracilik Ve Malt Sanayii AS 3.375% 01/11/2022 3,268,000 0.10
3,530,000 US$ KOC Holding AS 3.5% 24/04/2020 3,053,450 0.09
3,600,000 US$ Tupras Turkiye Petrol Rafinerileri AS 4.125% 02/05/2018 3,420,000 0.10
2,400,000 US$ Turkiye Garanti Bankasi AS 5.25% 13/09/2022 2,247,000 0.07
1,100,000 US$ Turkiye Garanti Bankasi AS 6.25% 20/04/2021 1,138,500 0.03
17,000,000 TRY Turkiye Garanti Bankasi AS 7.375% 07/03/2018 8,088,312 0.24
4,400,000 US$ Turkiye Halk Bankasi AS 3.875% 05/02/2020 3,960,000 0.12
3,400,000 US$ Turkiye Is Bankasi 3.75% 10/10/2018 3,196,000 0.10
17,500,000 US$ Turkiye Sise ve Cam Fabrikalari AS 4.25% 09/05/2020 15,925,000 0.47
10,500,000 US$ Yuksel Insaat AS 9.5% 10/11/2015 6,242,250 0.18
54,268,512 1.61
Ukraine
6,625,000 US$ Avangardco Investments Public Ltd 10% 29/10/2015 6,625,000 0.20
4,405,000 US$ Commercial Bank Privatbank JSC Via Standard Bank FRN 09/02/2016 3,568,887 0.11
6,500,000 US$ DTEK Finance 7.875% 04/04/2018 6,061,250 0.18
900,000 US$ DTEK Finance BV 9.5% 28/04/2015 905,625 0.03
9,000,000 US$ DTEK Finance PLC 7.875% 04/04/2018 8,392,500 0.25
19,200,000 US$ Ferrexpo Finance PLC 7.875% 07/04/2016 17,719,104 0.52
16,550,000 US$ Metinvest BV 8.75% 14/02/2018 15,391,500 0.45
4,100,000 US$ Metinvest BV 10.25% 20/05/2015 4,151,250 0.12
24,400,000 US$ MHP SA 8.25% 02/04/2020 21,512,260 0.64
3,750,000 US$ MHP SA 10.25% 29/04/2015 3,862,538 0.11
16,400,000 US$ Mriya Agro Holding PLC 9.45% 19/04/2018 14,596,000 0.43
10,300,000 US$ NTRP Via Interpipe Ltd 10.25% 02/08/2017 8,858,000 0.26
3,900,000 US$ Privatbank CJSC Via UK SPV Credit Finance PLC 9.375% 23/09/2015 3,627,000 0.11
28,700,000 US$ Ukrlandfarming PLC 10.875% 26/03/2018 27,121,500 0.80
142,392,414 4.21
United Arab Emirates
5,000,000 US$ Abu Dhabi National Energy Co 3.625% 12/01/2023 4,625,000 0.14
149,100,000 AED Anka a Sukuk Ltd 10% 25/08/2016 41,202,423 1.21
8,325,000 US$ Baghlan Group FZCO Via Aquarius Investments 14.75% 27/06/2015 8,075,250 0.24
17,981,440 US$ Dana Gas Sukuk Ltd 7% 31/10/2017 16,507,142 0.49
18,981,440 US$ Dana Gas Sukuk Ltd 9% 31/10/2017 18,198,835 0.54
16,300,000 US$ DP World Ltd 6.85% 02/07/2037 16,829,750 0.50
7,100,000 US$ DP World Sukuk Ltd 6.25% 02/07/2017 7,597,000 0.22
The accompanying notes form an integral part of these consolidated financial statements.

Ashmore SICAV – Unaudited Semi-Annual Report for the period ended 30 June 2013
137
Ashmore SICAV Emerging Markets Corporate Debt Fund Schedule of Investments (continued) As at 30 June 2013
Holdings
Currency Description of Investment Market Value
US$ Net Assets
%
Transferable securities admitted to an official stock exchange listing / dealt on another regulated market (continued)
Bonds (continued)
United Arab Emirates (continued)
70,700,000 EUR Dubai Holding Commercial Operations MTN Ltd 4.75% 30/01/2014 91,439,902 2.70
27,050,000 GBP Dubai Holding Commercial Operations MTN Ltd 6% 01/02/2017 39,795,931 1.17
15,600,000 US$ Jafz Sukuk Ltd 7% 19/06/2019 16,692,000 0.49
13,720,000 US$ MAF Global Securities Ltd 5.25% 05/07/2019 13,994,400 0.41
12,200,000 US$ Pyrus Ltd 7.5% 20/12/2015 15,347,600 0.45
290,305,233 8.56
Total bonds 3,030,332,599 89.35
Total transferable securities admitted to an official stock exchange listing / dealt on another regulated market 3,030,332,599 89.35
Other transferable securities and money market instruments
Bonds
Brazil
18,030,000 BRL Cia Energetica de Sao Paulo 9.75% 15/01/2015 12,621,000 0.37
12,621,000 0.37
Hong Kong
4,985,609 US$ Emerald Plantation 6% 30/01/2020 2,991,365 0.09
1,248,000 US$ Sino-Forest Corporation Claim 4.25% 15/12/2016 - -
8,568,000 US$ Sino-Forest Corporation Claim 4.25% 15/02/2016 144A - -
800,000 US$ Sino-Forest Corporation Claim 5% 01/08/2013 - -
2,043,000 US$ Sino-Forest Corporation Claim 5% 01/08/2013 144A - -
9,348,000 US$ Sino-Forest Corporation Claim 6.25% 21/10/2017 - -
2,048,000 US$ Sino-Forest Corporation Claim 6.25% 21/10/2017 144A - -
5,175,000 US$ Sino-Forest Corporation Claim 10.25% 28/07/2014 - -
748,000 US$ Sino-Forest Corporation Claim 10.25% 28/07/2014 144A - -
2,991,365 0.09
Indonesia
4,500,000 US$ Enercoal Resources Bumii Bond 9.25% 05/08/2014 3,240,000 0.10
3,240,000 0.10
Kazakhstan
7,600,000 US$ Septinvest BV 10% 31/03/2015 7,068,000 0.21
7,068,000 0.21
Nigeria
17,700,000 US$ Sea Trucks Group 9% 26/03/2018 17,124,750 0.50
9,200,000 US$ Seven Energy 10% Convertible Bond 31/12/14 9,347,200 0.28
26,471,950 0.78
People's Republic of China
6,300,000 US$ Far East Energy Bermuda Ltd PIK 15/01/2016 6,300,000 0.19
6,300,000 0.19 The accompanying notes form an integral part of these consolidated financial statements.

Ashmore SICAV – Unaudited Semi-Annual Report for the period ended 30 June 2013
138
Ashmore SICAV Emerging Markets Corporate Debt Fund Schedule of Investments (continued) As at 30 June 2013
Holdings
Currency Description of Investment Market Value
US$ Net Assets
%
Other transferable securities and money market instruments
Bonds (continued)
Turkey
3,500,000 US$ Yapi ve Kredi Bankasi AS 4% 22/01/2020 3,123,750 0.09
3,123,750 0.09
Total bonds 61,816,065 1.83
Equities
Hong Kong
5,034,511 US$ Emerald Plantation Holdings 1,308,973 0.04
1,308,973 0.04
Kazakhstan
278,217 US$ BTA Bank JSC GDR 275,435 0.01
275,435 0.01
Total equities 1,584,408 0.05
Warrants and rights
People's Republic of China
5,889,076 US$ Far East Energy Corporation Wts 01.04.18 1,101,257 0.03
1,101,257 0.03
Total warrants and rights 1,101,257 0.03
Loan participations
Brazil
7,100,000 US$ Doux Frangosul 11.50% 30/06/2014 2,130,000 0.06
2,130,000 0.06
Israel
ECI
7,178,147 US$ TIFL15% PIK Loan 01/01/2014 Tranche 1 3,269,107 0.10
5,489,219 US$ TIFL15% PIK Loan 01/01/2014 Tranche 2 5,489,219 0.16
5,106,250 US$ TIFL15% PIK Loan 01/01/2014 Tranche 3 5,106,250 0.15
2,902,500 US$ TIFL15% PIK Loan 01/04/2015 Tranche 4 2,902,500 0.09
8,815,000 US$ TIFL15% PIK Loan 01/04/2015 Tranche 5 8,815,000 0.26
5,966,250 US$ TIFL15% PIK Loan 01/04/2015 Tranche 6 5,966,250 0.18
2,250,000 US$ TIFL25% PIK Loan 01/04/2015 Tranche 7 2,250,000 0.07
33,798,326 1.01
Singapore
5,209,788 US$ Rubicon Offshore International Holding 30% PIK Loan Rolled Up 5,209,788 0.15
5,209,788 0.15
United Arab Emirates
9,896,419 US$ Dubai World 1% 23/03/2016 6,927,493 0.20
16,173,507 US$ Dubai World Tlb 1% + 1.5% PIK 23/03/2019 10,027,570 0.30
18,757,143 US$ Nakheel PJSC FRN Loan 30/09/2015 15,005,714 0.44
31,960,777 0.94
Total loan participations 73,098,891 2.16
Total other transferable securities and money market instruments 137,600,621 4.07 The accompanying notes form an integral part of these consolidated financial statements.

Ashmore SICAV – Unaudited Semi-Annual Report for the period ended 30 June 2013
139
Ashmore SICAV Emerging Markets Corporate Debt Fund Schedule of Investments (continued) As at 30 June 2013
Holdings
Currency Description of Investment Market Value
US$ Net Assets
%
Undertakings for collective investments
Luxembourg
1,182,639 US$ Ashmore SICAV 2 Global Liquidity US$ Fund 1,182,639 0.03
1,182,639 0.03
Total undertakings for collective investments 1,182,639 0.03
Total investment portfolio 3,169,115,859 93.45
Cash at bank 184,099,533 5.43
Other assets and liabilities 37,978,170 1.12
Total net assets 3,391,193,562 100.00
The accompanying notes form an integral part of these consolidated financial statements.

Ashmore SICAV – Unaudited Semi-Annual Report for the period ended 30 June 2013
140
Ashmore SICAV Emerging Markets Investment Grade Corporate Debt Fund Schedule of Investments As at 30 June 2013
Holdings
Currency Description of Investment Market Value
US$ Net Assets
%
Transferable securities admitted to an official stock exchange listing / dealt on another regulated market
Bonds
Brazil
400,000 US$ Banco do Brasil SA 3.875% 10/10/2022 350,520 0.45
700,000 US$ Banco do Brasil SA 5.875% 19/01/2023 675,500 0.87
600,000 US$ Banco Santander Brasil SA 4.625% 13/02/2017 609,000 0.78
1,400,000 BRL Banco Santander Brasil SA 8% 18/03/2016 583,056 0.75
600,000 US$ Braskem Finance Ltd 5.75% 15/04/2021 585,000 0.75
1,250,000 US$ BRF SA 5.875% 06/06/2022 1,282,875 1.65
100,000 US$ Gerdau Holdings Inc 7% 20/01/2020 105,500 0.14
550,000 US$ Globo Comunicacao e Participacoes SA 4.875% 11/04/2022 556,875 0.71
500,000 US$ Itau Unibanco Holding SA 5.65% 19/03/2022 485,000 0.62
400,000 US$ Itau Unibanco Holding SA 6.2% 21/12/2021 405,000 0.52
1,200,000 US$ Odebrecht Finance Ltd 5.125% 26/06/2022 1,176,000 1.51
250,000 US$ Oi SA 5.75% 10/02/2022 232,813 0.30
588,800 US$ Schahin II Finance Co SPV Ltd 5.875% 25/09/2022 582,912 0.75
429,000 US$ Telemar Norte Leste SA 5.5% 23/10/2020 398,970 0.51
700,000 US$ Vale Overseas Ltd 4.375% 11/01/2022 664,885 0.85
8,693,906 11.16
Chile
400,000 US$ Banco de Credito e Inversiones 4% 11/02/2023 377,112 0.48
300,000,000 CLP Banco Santander Chile 6.5% 22/09/2020 584,056 0.75
600,000 US$ Cencosud SA 4.875% 20/01/2023 588,175 0.75
400,000 US$ Cencosud SA 5.5% 20/01/2021 410,456 0.53
300,000 US$ E.CL SA 5.625% 15/01/2021 311,487 0.40
300,000 US$ Inversiones CMPC SA 4.375% 15/05/2023 287,138 0.37
500,000 US$ SACI Falabella 3.75% 30/04/2023 457,500 0.59
250,000 US$ Sociedad Quimica y Minera de Chile SA 3.625% 03/04/2023 232,347 0.30
750,000 US$ Telefonica Chile SA 3.875% 12/10/2022 684,900 0.88
3,933,171 5.05
Colombia
450,000 US$ Banco Davivienda SA 2.95% 29/01/2018 425,250 0.55
500,000 US$ Banco de Bogota SA 5.375% 19/02/2023 487,500 0.63
600,000 US$ Bancolombia SA 4.25% 12/01/2016 613,902 0.79
400,000 US$ Bancolombia SA 5.125% 11/09/2022 381,000 0.49
600,000 US$ Empresa de Energia de Bogota SA 6.125% 10/11/2021 621,000 0.80
770,000,000 COP Empresa de Telecomunicaciones de Bogota 7% 17/01/2023 376,777 0.48
750,000 US$ Grupo Aval Ltd 4.75% 26/09/2022 705,000 0.90
500,000 US$ Gruposura Finance 5.7% 18/05/2021 515,000 0.66
4,125,429 5.30
Czech Republic
450,000 EUR EP Energy AS 5.875% 01/11/2019 620,028 0.80
620,028 0.80 The accompanying notes form an integral part of these consolidated financial statements.

Ashmore SICAV – Unaudited Semi-Annual Report for the period ended 30 June 2013
141
Ashmore SICAV Emerging Markets Investment Grade Corporate Debt Fund Schedule of Investments (continued) As at 30 June 2013
Holdings
Currency Description of Investment Market Value
US$ Net Assets
%
Transferable securities admitted to an official stock exchange listing / dealt on another regulated market (continued)
Bonds (continued)
Hong Kong
900,000 US$ Hutchison Whampoa International 11 Ltd 4.625% 13/01/2022 918,867 1.18
2,000,000 US$ Noble Group Ltd 6.75% 29/01/2020 2,030,000 2.60
800,000 US$ PCCW-HKT Capital No 5 Ltd 3.75% 08/03/2023 709,002 0.91
3,657,869 4.69
India
800,000 US$ Bank of Baroda FRN 25/05/2022 780,645 1.00
200,000 US$ Bharat Petroleum Corp Ltd 4.625% 25/10/2022 184,627 0.24
700,000 US$ Bharti Airtel International Netherlands BV 5.125% 11/03/2023 636,160 0.82
850,000 US$ ICICI Bank Ltd 5.75% 16/11/2020 866,368 1.11
1,400,000 US$ Reliance Holdings USA Inc 5.4% 14/02/2022 1,422,245 1.82
3,890,045 4.99
Indonesia
600,000 US$ Indosat Palapa Co BV 7.375% 29/07/2020 642,000 0.82
642,000 0.82
Israel
300,000 US$ Israel Electric Corp Ltd 6.875% 21/06/2023 302,703 0.39
1,200,000 US$ Israel Electric Corp Ltd 7.25% 15/01/2019 1,278,000 1.64
1,580,703 2.03
Kazakhstan
500,000 US$ Development Bank of Kazakhstan JSC 4.125% 10/12/2022 445,000 0.57
675,000 US$ Development Bank of Kazakhstan JSC 6.5% 03/06/2020 708,750 0.91
500,000 US$ KazAgro National Management Holding JSC 4.625% 24/05/2023 460,000 0.59
400,000 US$ KazMunayGas National Co JSC 5.75% 30/04/2043 354,000 0.45
1,967,750 2.52
Kuwait
1,000,000 US$ Kuwait Projects Co 9.375% 15/07/2020 1,160,000 1.49
1,160,000 1.49
Malaysia
600,000 US$ IOI Investment L Bhd 4.375% 27/06/2022 560,018 0.72
750,000 US$ Malayan Banking Bhd FRN 20/09/2022 725,504 0.93
1,285,522 1.65
Mexico
1,000,000 US$ Alpek SA de CV 4.5% 20/11/2022 962,500 1.23
300,000 US$ America Movil SAB de CV 5% 30/03/2020 321,987 0.41
13,000,000 MXN America Movil SAB de CV 6.45% 05/12/2022 966,526 1.24
1,300,000 US$ BBVA Bancomer SA 4.5% 10/03/2016 1,348,750 1.73
1,050,000 US$ BBVA Bancomer SA 6.5% 10/03/2021 1,102,500 1.41
150,000 US$ BBVA Bancomer SA 6.75% 30/09/2022 162,000 0.21
450,000 US$ Comision Federal de Electricidad 5.75% 14/02/2042 416,250 0.53
1,000,000 US$ Fomento Economico Mexicano SAB de CV 2.875% 10/05/2023 905,422 1.16
300,000 US$ Grupo Televisa SAB 6.625% 18/03/2025 350,687 0.45
2,900,000 US$ Mexichem SAB de CV 4.875% 19/09/2022 2,914,500 3.74
11,800,000 MXN Petroleos Mexicanos 7.65% 24/11/2021 958,342 1.23
10,409,464 13.34 The accompanying notes form an integral part of these consolidated financial statements.

Ashmore SICAV – Unaudited Semi-Annual Report for the period ended 30 June 2013
142
Ashmore SICAV Emerging Markets Investment Grade Corporate Debt Fund Schedule of Investments (continued) As at 30 June 2013
Holdings
Currency Description of Investment Market Value
US$ Net Assets
%
Transferable securities admitted to an official stock exchange listing / dealt on another regulated market (continued)
Bonds (continued)
People's Republic of China
300,000 US$ Baidu Inc 3.5% 28/11/2022 268,055 0.34
1,000,000 US$ Bestgain Real Estate Ltd 2.625% 13/03/2018 947,308 1.21
500,000 US$ China CITIC Bank International Ltd 6.875% 24/06/2020 528,088 0.68
130,000 US$ China Overseas Finance Cayman II Ltd 5.5% 10/11/2020 134,882 0.17
550,000 US$ China Railway Resources Huitung Ltd 3.85% 05/02/2023 492,796 0.63
200,000 US$ COSL Finance BVI Ltd 3.25% 06/09/2022 178,880 0.23
800,000 US$ ENN Energy Holdings Ltd 6% 13/05/2021 844,597 1.08
900,000 US$ Franshion Development Ltd 6.75% 15/04/2021 877,500 1.12
4,272,106 5.46
Peru
800,000 US$ Alicorp SAA 3.875% 20/03/2023 740,000 0.95 500,000 US$ Banco Continental SA via Continental Senior Trustees II Cayman Ltd 5.75%
18/01/2017 528,750 0.68
150,000 US$ Banco de Credito del Peru 4.25% 01/04/2023 138,375 0.18
250,000 US$ Banco Internacional del Peru SAA 5.75% 07/10/2020 255,000 0.33
300,000 US$ BBVA Banco Continental SA 5% 26/08/2022 292,500 0.37
1,050,000 US$ Southern Copper Corp 3.5% 08/11/2022 942,358 1.21
800,000 US$ Transportadora de Gas del Peru SA 4.25% 30/04/2028 708,000 0.91
3,604,983 4.63
Poland
225,000 EUR Koleje Mazowieckie Finance AB 6.75% 09/03/2016 304,165 0.39
1,000,000 US$ PKO Finance AB 4.63% 26/09/2022 971,600 1.25
1,275,765 1.64
Qatar
625,000 US$ CBQ Finance Ltd 7.5% 18/11/2019 727,916 0.93
284,642 US$ Nakilat Inc 6.267% 31/12/2033 298,874 0.38
550,000 US$ Qtel International Finance Ltd 5% 19/10/2025 558,250 0.72
1,585,040 2.03
Republic of South Korea
1,450,000 US$ Korea Hydro & Nuclear Power Co Ltd 4.75% 13/07/2021 1,486,140 1.91
600,000 US$ Shinhan Bank 1.875% 30/07/2018 560,538 0.72
600,000 US$ Shinhan Bank 4.125% 04/10/2016 635,619 0.81
600,000 US$ Woori Bank Co Ltd 5.875% 13/04/2021 639,873 0.82
3,322,170 4.26
Russian Federation
1,000,000 US$ Gazprom Neft OAO Via GPN Capital SA 4.375% 19/09/2022 915,850 1.17
400,000 US$ Lukoil International Finance BV 6.125% 09/11/2020 421,000 0.54
500,000 US$ Novatek OAO via Novatek Finance Ltd 4.422% 13/12/2022 458,750 0.59
700,000 US$ Phosagro OAO via Phosagro Bond Funding Ltd 4.204% 13/02/2018 689,500 0.88
200,000 US$ Rosneft Oil Co via Rosneft International Finance Ltd 4.199% 06/03/2022 185,300 0.24
1,375,000 US$ Sberbank of Russia Via SB Capital SA 5.499% 07/07/2015 1,453,540 1.86
500,000 US$ Uralkali OJSC via Uralkali Finance Ltd 3.723% 30/04/2018 480,625 0.62
1,100,000 US$ VEB-Leasing Via VEB Leasing Investment Ltd 5.125% 27/05/2016 1,142,625 1.47
1,150,000 US$ Vnesheconombank Via VEB Finance PLC 6.8% 22/11/2025 1,224,750 1.57 The accompanying notes form an integral part of these consolidated financial statements.

Ashmore SICAV – Unaudited Semi-Annual Report for the period ended 30 June 2013
143
Ashmore SICAV Emerging Markets Investment Grade Corporate Debt Fund Schedule of Investments (continued) As at 30 June 2013
Holdings
Currency Description of Investment Market Value
US$ Net Assets
%
Transferable securities admitted to an official stock exchange listing / dealt on another regulated market (continued)
Bonds (continued)
Russian Federation (continued)
1,125,000 US$ VTB Bank OJSC Via VTB Capital SA 6.465% 04/03/2015 1,186,502 1.52
1,200,000 US$ VTB Bank OJSC Via VTB Capital SA 6.551% 13/10/2020 1,242,000 1.59
800,000 US$ VTB Bank OJSC Via VTB Capital SA 6.95% 17/10/2022 812,000 1.04
10,212,442 13.09
Saudi Arabia
875,000 US$ Saudi Electricity Global Sukuk Co 2.665% 03/04/2017 884,153 1.13
884,153 1.13
South Africa
300,000 US$ African Bank Ltd 8.125% 24/02/2017 295,965 0.38
1,400,000 US$ Standard Bank PLC 8.125% 02/12/2019 1,508,500 1.93
1,804,465 2.31
Taiwan
200,000 US$ Cathay United Bank Co Ltd FRN 05/10/2020 202,000 0.26
68,000 US$ Chinatrust Commercial Bank Hong Kong FRN (Perpetual) 66,980 0.09
268,980 0.35
Turkey
400,000 US$ Yapi ve Kredi Bankasi AS 4% 22/01/2020 357,000 0.46
357,000 0.46
Thailand
800,000 US$ PTT Global Chemical PCL 4.25% 19/09/2022 766,454 0.98
766,454 0.98
Turkey
450,000 US$ Akbank TAS 5% 24/10/2022 419,625 0.54
450,000 US$ Anadolu Efes Biracilik Ve Malt Sanayii AS 3.375% 01/11/2022 387,000 0.50
400,000 US$ KOC Holding AS 3.5% 24/04/2020 346,000 0.44
450,000 US$ Tupras Turkiye Petrol Rafinerileri AS 4.125% 02/05/2018 427,500 0.55
300,000 US$ Turkiye Garanti Bankasi AS 5.25% 13/09/2022 280,875 0.36
200,000 US$ Turkiye Garanti Bankasi AS 6.25% 20/04/2021 207,000 0.26
700,000 TRY Turkiye Garanti Bankasi AS 7.375% 07/03/2018 333,048 0.43
500,000 US$ Turkiye Halk Bankasi AS 3.875% 05/02/2020 450,000 0.58
400,000 US$ Turkiye Is Bankasi 3.75% 10/10/2018 376,000 0.48
3,227,048 4.14
United Arab Emirates
600,000 US$ Abu Dhabi National Energy Co 3.625% 12/01/2023 555,000 0.71
2,700,000 US$ DP World Sukuk Ltd 6.25% 02/07/2017 2,889,000 3.70
1,600,000 US$ MAF Global Securities Ltd 5.25% 05/07/2019 1,632,000 2.09
5,076,000 6.50
Total bonds 78,622,493 100.82
Total transferable securities admitted to an official stock exchange listing / dealt on another regulated market 78,622,493 100.82
Total investment portfolio 78,622,493 100.82
Cash at bank 821,738 1.05
Other assets and liabilities (1,458,056) (1.87)
Total net assets 77,986,175 100.00
The accompanying notes form an integral part of these consolidated financial statements.

Ashmore SICAV – Unaudited Semi-Annual Report for the period ended 30 June 2013
144
Ashmore SICAV Emerging Markets Local Currency Corporate Debt Fund Schedule of Investments As at 30 June 2013
Holdings
Currency Description of Investment Market Value
US$ Net Assets
%
Transferable securities admitted to an official stock exchange listing / dealt on another regulated market
Bonds
Brazil
8,200,000 BRL Banco Santander Brasil SA 8% 18/03/2016 3,414,363 2.04
7,994,000 BRL Banco Votorantim SA 6.25% 16/05/2016 3,950,883 2.36
10,950,000 BRL Cosan Luxembourg SA 9.5% 14/03/2018 4,715,234 2.82
600,000 US$ JBS Finance II Ltd 8.25% 29/01/2018 609,000 0.36
1,100,000 US$ Minerva Luxembourg SA 7.75% 31/01/2023 1,094,500 0.65
6,750,000 BRL Oi SA 9.75% 15/09/2016 2,826,441 1.69
1,250,000 US$ OSX 3 Leasing BV 9.25% 20/03/2015 1,087,500 0.65
3,538,000 BRL RBS-Zero Hora Editora Jornalistica SA 11.25% 15/06/2017 1,569,562 0.94
19,267,483 11.51
Chile
2,212,500,000 CLP Banco Santander Chile 6.5% 22/09/2020 4,307,410 2.58
4,307,410 2.58
Colombia
5,662,000,000 COP Emgesa SA ESP 8.75% 25/01/2021 3,224,958 1.93
5,750,000,000 COP Empresa de Telecomunicaciones de Bogota 7% 17/01/2023 2,813,592 1.68
2,166,000,000 COP Empresas Publicas de Medellin ESP 8.375% 01/02/2021 1,200,062 0.72
7,238,612 4.33
Hong Kong
5,000,000 SGD Bank of East Asia Ltd FRN 13/09/2022 4,001,467 2.39
2,250,000 SGD Standard Chartered Bank Hong Kong Ltd FRN 27/10/2021 1,796,502 1.07
5,797,969 3.46
India
500,000 US$ Geodesic Ltd 0% 18/01/2013 (Defaulted) 100,000 0.06
500,000 US$ Vedanta Resources PLC 7.125% 31/05/2023 472,500 0.28
4,835,000 US$ Vedanta Resources PLC 8.25% 07/06/2021 4,871,263 2.91
5,443,763 3.25
Indonesia
1,900,000 US$ Indo Energy Finance II BV 6.375% 24/01/2023 1,657,750 0.99
1,800,000 US$ TBG Global Pte Ltd 4.625% 03/04/2018 1,719,000 1.03
3,376,750 2.02
Israel
7,383,000 ILS Elbit Imaging Ltd 5% 01/04/2020 658,930 0.39
4,027,000 ILS Plaza Centers NV 5.4% 01/07/2015 902,669 0.54
1,561,599 0.93
Malaysia
9,000,000 CNH Axiata SPV2 Bhd 3.75% 18/09/2014 1,445,188 0.86
1,445,188 0.86
Mexico
74,550,000 MXN America Movil SAB de CV 6.45% 05/12/2022 5,542,655 3.32
72,000,000 MXN America Movil SAB de CV 8.46% 18/12/2036 5,477,121 3.28
1,200,000 US$ Cemex Espana Luxembourg 9.25% 12/05/2020 1,266,000 0.76
900,000 US$ Corp GEO SAB de CV FRN 30/06/2020 396,000 0.24
1,100,000 US$ Desarrolladora Homex SAB de CV FRN 11/12/2019 (Defaulted) 374,000 0.22 The accompanying notes form an integral part of these consolidated financial statements.

Ashmore SICAV – Unaudited Semi-Annual Report for the period ended 30 June 2013
145
Ashmore SICAV Emerging Markets Local Currency Corporate Debt Fund Schedule of Investments (continued) As at 30 June 2013
Holdings
Currency Description of Investment Market Value
US$ Net Assets
%
Transferable securities admitted to an official stock exchange listing / dealt on another regulated market (continued)
Bonds (continued)
Mexico (continued)
68,500,000 MXN Grupo Televisa SAB 7.25% 14/05/2043 4,460,098 2.67
27,700,000 MXN Grupo Televisa SAB 8.49% 11/05/2037 2,128,327 1.27
27,380,000 MXN Petroleos Mexicanos 7.65% 24/11/2021 2,223,678 1.33
21,867,879 13.09
People's Republic of China
14,300,000 CNH 21Vianet Group Inc 7.875% 22/03/2016 2,224,362 1.33
6,000,000 CNY Chaowei Power Holdings Ltd 7.25% 24/09/2017 923,814 0.55
23,400,000 CNH China SCE Property Holdings Ltd 10.5% 14/01/2016 3,757,877 2.25
11,030,000 CNH China Shanshui Cement Group Ltd 6.5% 22/07/2014 1,769,120 1.06
28,200,000 CNH Evergrande Real Estate Group Ltd 7.5% 19/01/2014 4,548,619 2.72
24,610,000 CNH Evergrande Real Estate Group Ltd 9.25% 19/01/2016 3,710,947 2.22
8,560,000 CNY Gemdale International Holding Ltd 9.15% 26/07/2015 1,413,107 0.85
16,550,000 CNH Powerlong Real Estate Holdings Ltd 11.5% 17/03/2014 2,678,014 1.60
10,310,000 CNH RKI Finance 2011 Ltd 6% 25/02/2014 1,662,073 0.99
22,687,933 13.57
Philippines
217,000,000 PHP Petron Corp 7% 10/11/2017 5,089,755 3.04
5,089,755 3.04
Russian Federation
89,300,000 RUB Alfa Bank OJSC Via Alfa Bond Issuance PLC 8.625% 26/04/2016 2,690,615 1.61
45,050,000 RUB EuroChem Mineral & Chemical Co OJSC FRN 14/11/2018 1,374,363 0.82
2,100,000 US$ Far East Capital Ltd SA 8% 02/05/2018 1,937,250 1.16
2,500,000 US$ Far East Capital Ltd SA 8.75% 02/05/2020 2,287,500 1.37
37,610,000 RUB Iks 5 Finans FRN 02/06/2016 1,107,288 0.66
62,251,000 RUB Mobile Telesystems OJSC FRN 03/11/2020 1,909,552 1.14
64,766,000 RUB Sibmetinvest OOO FRN 10/10/2019 2,081,398 1.25
40,935,000 RUB SUEK Finance FRN 26/06/2020 1,246,580 0.75
99,100,000 RUB VimpelCom Holdings BV 9% 13/02/2018 2,973,740 1.78
90,382,000 RUB VimpelCom-Invest 8.3% 13/10/2015 2,755,687 1.65
20,363,973 12.19
Singapore
2,500,000 SGD Mapletree Treasury Services Ltd FRN (Perpetual) 1,942,263 1.16
2,250,000 SGD Neptune Orient Lines Ltd/Singapore 4.4% 22/06/2021 1,685,651 1.01
4,750,000 SGD NTUC Income Insurance Cooperative Ltd FRN 23/08/2027 3,774,716 2.26
4,250,000 SGD Olam International Ltd 6% 25/10/2022 2,908,953 1.74
10,311,583 6.17
South Africa
3,900,000 EUR Edcon Holdings Pty Ltd FRN 15/06/2015 4,435,738 2.65
15,000,000 ZAR Sappi Southern Africa Pty Ltd 8.06% 16/04/2020 1,434,135 0.86
7,000,000 ZAR Sappi Southern Africa Pty Ltd 9.63% 28/06/2016 732,387 0.44
16,000,000 ZAR Transnet SOC Ltd 9.5% 19/08/2025 1,684,717 1.01
8,286,977 4.96 The accompanying notes form an integral part of these consolidated financial statements.

Ashmore SICAV – Unaudited Semi-Annual Report for the period ended 30 June 2013
146
Ashmore SICAV Emerging Markets Local Currency Corporate Debt Fund Schedule of Investments (continued) As at 30 June 2013
Holdings
Currency Description of Investment Market Value
US$ Net Assets
%
Transferable securities admitted to an official stock exchange listing / dealt on another regulated market (continued)
Bonds (continued)
Turkey
3,400,000 TRY Akbank TAS 7.5% 05/02/2018 1,618,016 0.97
2,200,000 TRY Ronesans Gayrimenkul Yatirim AS FRN 25/07/2013 1,141,084 0.68
2,200,000 TRY Ronesans Holding FRN 18/12/2015 1,147,063 0.69
1,580,000 TRY Turkiye Garanti Bankasi AS 0% 15/11/2013 796,293 0.48
7,700,000 TRY Turkiye Garanti Bankasi AS 7.375% 07/03/2018 3,663,531 2.19
2,250,000 US$ Yuksel Insaat AS 9.5% 10/11/2015 1,337,625 0.80
9,703,612 5.81
Ukraine
7,700,000 UAH Ukreximbank Via Biz Finance PLC 11% 03/02/2014 886,744 0.53
886,744 0.53
United Arab Emirates
14,450,000 AED Anka a Sukuk Ltd 10% 25/08/2016 3,993,126 2.39
3,993,126 2.39
Total bonds 151,630,356 90.69
Total transferable securities admitted to an official stock exchange listing / dealt on another regulated market 151,630,356 90.69
Other transferable securities and money market instruments
Bonds
Brazil
3,428,000 BRL Cia Energetica de Sao Paulo 9.75% 15/01/2015 2,399,600 1.44
2,399,600 1.44
Israel
499,629 ILS Delek Real Estate Zcpn 27/02/2019 45,705 0.03
3,607,225 ILS Delek Real Estate Zcpn 31/12/2049 659,969 0.40
705,674 0.43
Malaysia
4,196,530 MYR Binariang GSM SDN BHD 5.55% 27/12/2013 1,340,633 0.80
4,301,303 MYR Binariang GSM SDN BHD 5.65% 26/12/2014 1,395,606 0.83
2,736,239 1.63
People's Republic of China
15,290,000 CNH Lafarge Shui on Cement Ltd 9% 14/11/2014 2,551,125 1.53
2,551,125 1.53
Total bonds 8,392,638 5.03
Total other transferable securities and money market instruments 8,392,638 5.03 The accompanying notes form an integral part of these consolidated financial statements.

Ashmore SICAV – Unaudited Semi-Annual Report for the period ended 30 June 2013
147
Ashmore SICAV Emerging Markets Local Currency Corporate Debt Fund Schedule of Investments (continued) As at 30 June 2013
Holdings
Currency Description of Investment Market Value
US$ Net Assets
%
Fully-funded total return swaps
Indonesia
9,000,000,000 IDR Adira Dinamika Multi Finance PT 9.25% 29/10/2014 930,233 0.56
930,233 0.56
Total fully-funded total return swaps 930,233 0.56
Written options 4,400,000 EUR Currency PUT option EUR/USD 1.26 European 08/11/2013 (Bank of
America) 60,759 0.04
5,500,000 EUR Currency PUT option EUR/USD 1.27 European 11/09/2013 (HSBC) 54,282 0.03 4,400,000 EUR Currency PUT option EUR/USD 1.28 European 04/10/2013 (Bank of
America) 68,006 0.04
183,047 0.11
Total written options 183,047 0.11
Total investment portfolio 161,136,274 96.39
Cash at bank 4,907,101 2.93
Other assets and liabilities 1,132,588 0.68
Total net assets 167,175,963 100.00
The accompanying notes form an integral part of these consolidated financial statements.
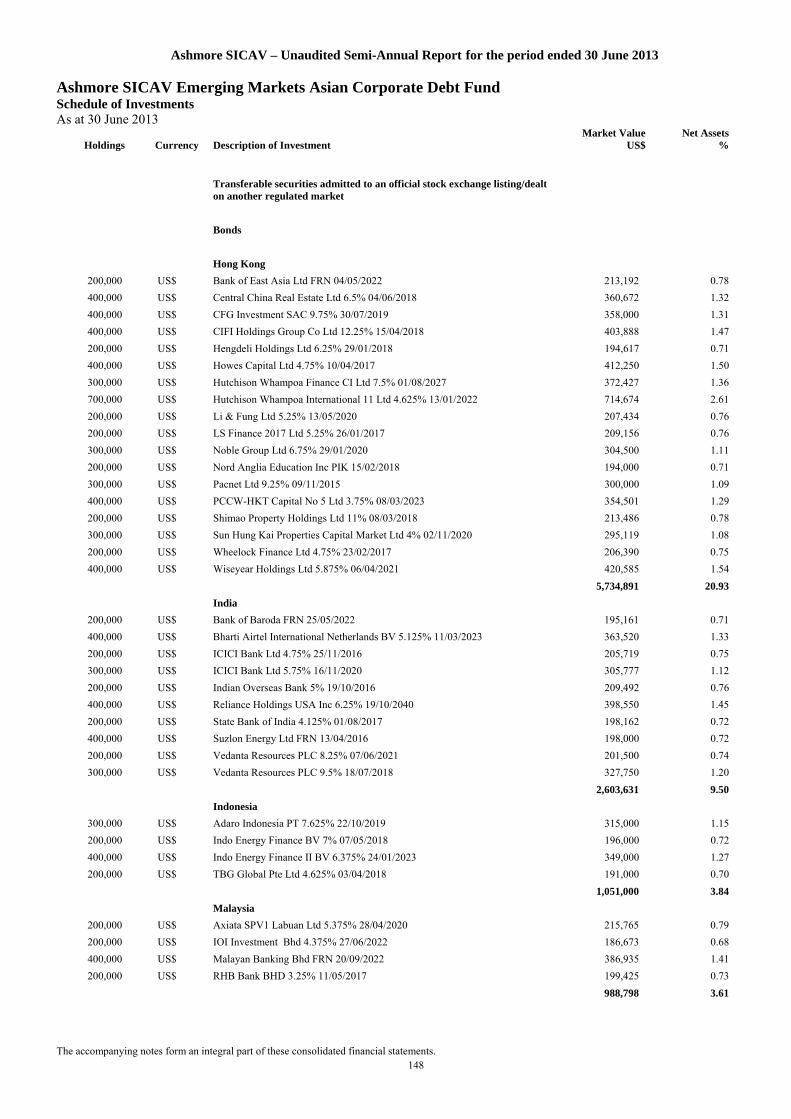
Ashmore SICAV – Unaudited Semi-Annual Report for the period ended 30 June 2013
148
Ashmore SICAV Emerging Markets Asian Corporate Debt Fund Schedule of Investments As at 30 June 2013
Holdings
Currency Description of Investment Market Value
US$ Net Assets
%
Transferable securities admitted to an official stock exchange listing/dealt on another regulated market
Bonds
Hong Kong
200,000 US$ Bank of East Asia Ltd FRN 04/05/2022 213,192 0.78
400,000 US$ Central China Real Estate Ltd 6.5% 04/06/2018 360,672 1.32
400,000 US$ CFG Investment SAC 9.75% 30/07/2019 358,000 1.31
400,000 US$ CIFI Holdings Group Co Ltd 12.25% 15/04/2018 403,888 1.47
200,000 US$ Hengdeli Holdings Ltd 6.25% 29/01/2018 194,617 0.71
400,000 US$ Howes Capital Ltd 4.75% 10/04/2017 412,250 1.50
300,000 US$ Hutchison Whampoa Finance CI Ltd 7.5% 01/08/2027 372,427 1.36
700,000 US$ Hutchison Whampoa International 11 Ltd 4.625% 13/01/2022 714,674 2.61
200,000 US$ Li & Fung Ltd 5.25% 13/05/2020 207,434 0.76
200,000 US$ LS Finance 2017 Ltd 5.25% 26/01/2017 209,156 0.76
300,000 US$ Noble Group Ltd 6.75% 29/01/2020 304,500 1.11
200,000 US$ Nord Anglia Education Inc PIK 15/02/2018 194,000 0.71
300,000 US$ Pacnet Ltd 9.25% 09/11/2015 300,000 1.09
400,000 US$ PCCW-HKT Capital No 5 Ltd 3.75% 08/03/2023 354,501 1.29
200,000 US$ Shimao Property Holdings Ltd 11% 08/03/2018 213,486 0.78
300,000 US$ Sun Hung Kai Properties Capital Market Ltd 4% 02/11/2020 295,119 1.08
200,000 US$ Wheelock Finance Ltd 4.75% 23/02/2017 206,390 0.75
400,000 US$ Wiseyear Holdings Ltd 5.875% 06/04/2021 420,585 1.54
5,734,891 20.93
India
200,000 US$ Bank of Baroda FRN 25/05/2022 195,161 0.71
400,000 US$ Bharti Airtel International Netherlands BV 5.125% 11/03/2023 363,520 1.33
200,000 US$ ICICI Bank Ltd 4.75% 25/11/2016 205,719 0.75
300,000 US$ ICICI Bank Ltd 5.75% 16/11/2020 305,777 1.12
200,000 US$ Indian Overseas Bank 5% 19/10/2016 209,492 0.76
400,000 US$ Reliance Holdings USA Inc 6.25% 19/10/2040 398,550 1.45
200,000 US$ State Bank of India 4.125% 01/08/2017 198,162 0.72
400,000 US$ Suzlon Energy Ltd FRN 13/04/2016 198,000 0.72
200,000 US$ Vedanta Resources PLC 8.25% 07/06/2021 201,500 0.74
300,000 US$ Vedanta Resources PLC 9.5% 18/07/2018 327,750 1.20
2,603,631 9.50
Indonesia
300,000 US$ Adaro Indonesia PT 7.625% 22/10/2019 315,000 1.15
200,000 US$ Indo Energy Finance BV 7% 07/05/2018 196,000 0.72
400,000 US$ Indo Energy Finance II BV 6.375% 24/01/2023 349,000 1.27
200,000 US$ TBG Global Pte Ltd 4.625% 03/04/2018 191,000 0.70
1,051,000 3.84
Malaysia
200,000 US$ Axiata SPV1 Labuan Ltd 5.375% 28/04/2020 215,765 0.79
200,000 US$ IOI Investment Bhd 4.375% 27/06/2022 186,673 0.68
400,000 US$ Malayan Banking Bhd FRN 20/09/2022 386,935 1.41
200,000 US$ RHB Bank BHD 3.25% 11/05/2017 199,425 0.73
988,798 3.61 The accompanying notes form an integral part of these consolidated financial statements.

Ashmore SICAV – Unaudited Semi-Annual Report for the period ended 30 June 2013
149
Ashmore SICAV Emerging Markets Asian Corporate Debt Fund Schedule of Investments (continued) As at 30 June 2013
Holdings
Currency Description of Investment Market Value
US$ Net Assets
%
Transferable securities admitted to an official stock exchange listing/dealt on another regulated market (continued)
Bonds (continued)
Mongolia
500,000 US$ Mongolian Mining Corp 8.875% 29/03/2017 425,000 1.55
200,000 US$ Trade & Development Bank of Mongolia LLC 8.5% 20/09/2015 194,621 0.71
619,621 2.26
Pakistan
200,000 US$ Pakistan Mobile Communications Ltd 8.625% 13/11/2013 199,000 0.73
199,000 0.73
People's Republic of China
3,000,000 CNH 21Vianet Group Inc 7.875% 22/03/2016 466,649 1.70
2,000,000 CNY Chaowei Power Holdings Ltd 7.25% 24/09/2017 307,938 1.12
200,000 US$ China Automation Group Ltd 7.75% 20/04/2016 188,216 0.69
400,000 US$ China Liansu Group Holdings Ltd 7.875% 13/05/2016 397,000 1.45
400,000 US$ China SCE Property Holdings Ltd 11.5% 14/11/2017 399,939 1.46
200,000 US$ China Shanshui Cement Group Ltd 8.5% 25/05/2016 199,508 0.73
200,000 US$ Country Garden Holdings Co Ltd 11.25% 22/04/2017 217,500 0.79
200,000 US$ Evergrande Real Estate Group Ltd 13% 27/01/2015 206,000 0.75
200,000 US$ Fosun International Ltd 7.5% 12/05/2016 202,000 0.74
200,000 US$ Fufeng Group Ltd 7.625% 13/04/2016 188,000 0.69
200,000 US$ Gemdale International Investment Ltd 7.125% 16/11/2017 195,571 0.71
200,000 US$ Hidili Industry International Development Ltd 8.625% 04/11/2015 153,000 0.56
400,000 US$ Hyva Global BV 8.625% 24/03/2016 376,000 1.37
300,000 US$ KWG Property Holding Ltd 12.5% 18/08/2017 320,484 1.17
200,000 US$ Lonking Holdings Ltd 8.5% 03/06/2016 196,000 0.72
200,000 US$ Powerlong Real Estate Holdings Ltd 11.25% 25/01/2018 184,958 0.67
400,000 US$ Sound Global Ltd 11.875% 10/08/2017 418,931 1.53
400,000 US$ Sunac China Holdings Ltd 9.375% 05/04/2018 385,157 1.41
200,000 US$ Texhong Textile Group Ltd 6.5% 18/01/2019 186,467 0.68
400,000 US$ West China Cement Ltd 7.5% 25/01/2016 382,000 1.39
200,000 US$ Yanlord Land Group Ltd 10.625% 29/03/2018 209,500 0.76
400,000 US$ Yingde Gases Investment Ltd 8.125% 22/04/2018 388,000 1.42
300,000 US$ Yuzhou Properties Co 13.5% 15/12/2015 322,500 1.18
6,491,318 23.69
Philippines
300,000 US$ FPMH Finance Ltd 7.375% 24/07/2017 324,000 1.18
400,000 US$ JGSH Philippines Ltd 4.375% 23/01/2023 375,000 1.37
8,000,000 PHP Petron Corp 7% 10/11/2017 187,641 0.68
300,000 US$ SM Investments Corp 5.5% 13/10/2017 308,670 1.13
1,195,311 4.36
Republic of South Korea
300,000 US$ GS Caltex Corp 5.5% 24/04/2017 325,631 1.19
200,000 US$ Hyundai Capital America 3.75% 06/04/2016 207,516 0.76
200,000 US$ Korea Exchange Bank 3.125% 26/06/2017 198,218 0.72
400,000 US$ Korea Hydro & Nuclear Power Co Ltd 4.75% 13/07/2021 409,970 1.50
200,000 US$ Lotte Shopping Co Ltd 3.375% 09/05/2017 200,442 0.73
200,000 US$ Shinhan Bank FRN 20/09/2036 220,625 0.81
200,000 US$ SK Telecom Co Ltd 2.125% 01/05/2018 190,340 0.69 The accompanying notes form an integral part of these consolidated financial statements.

Ashmore SICAV – Unaudited Semi-Annual Report for the period ended 30 June 2013
150
Ashmore SICAV Emerging Markets Asian Corporate Debt Fund Schedule of Investments (continued) As at 30 June 2013
Holdings
Currency Description of Investment Market Value
US$ Net Assets
%
Transferable securities admitted to an official stock exchange listing/dealt on another regulated market (continued)
Bonds (continued)
Republic of South Korea (continued)
400,000 US$ Woori Bank Co Ltd 5.875% 13/04/2021 426,582 1.56
2,179,324 7.96
Singapore
400,000 US$ BW Group Ltd 6.625% 28/06/2017 400,000 1.46
300,000 US$ DBS Bank Ltd FRN 21/09/2022 300,365 1.10
250,000 US$ MMI International Ltd 8% 01/03/2017 251,250 0.92
500,000 US$ Olam International Ltd 6% 15/10/2016 472,125 1.72
600,000 US$ Oversea-Chinese Banking Corp Ltd FRN 18/11/2019 615,906 2.25
340,808 US$ Rubicon Offshore Holdings Ltd PIK 16/04/2014 315,247 1.15
600,000 US$ UOB Cayman I Ltd FRN 29/12/2049 615,810 2.25
2,970,703 10.85
Taiwan
200,000 US$ Cathay United Bank Co Ltd FRN 05/10/2020 202,000 0.74
202,000 0.74
Thailand
200,000 US$ Bangkok Bank PCL 4.8% 18/10/2020 206,719 0.75
200,000 US$ Bangkok Bank PCL 9.025% 15/03/2029 256,500 0.94
400,000 US$ PTT Global Chemical PCL 4.25% 19/09/2022 383,228 1.40
846,447 3.09
Total bonds 25,082,044 91.56
Total transferable securities admitted to an official stock exchange listing / dealt on another regulated market 25,082,044 91.56
Other transferable securities and money market instruments
Bonds
Indonesia
300,000 US$ Enercoal Resources Bumii 9.25% 05/08/2014 216,000 0.79
216,000 0.79
People's Republic of China
300,000 US$ Far East Energy Bermuda Ltd PIK 15/01/2016 300,000 1.10
300,000 1.10
Total bonds 516,000 1.89
Warrants and rights
People's Republic of China
280,432 US$ Far East Energy 15/01/2018 52,441 0.19
52,441 0.19
Total warrants and rights 52,441 0.19
Total other transferable securities and money market instruments 568,441 2.08
Total investment portfolio 25,650,485 93.64
Cash at bank 3,666,697 13.38
Other assets and liabilities (1,923,803) (7.02)
Total net assets 27,393,379 100.00
The accompanying notes form an integral part of these consolidated financial statements.

Ashmore SICAV – Unaudited Semi-Annual Report for the period ended 30 June 2013
151
Ashmore SICAV Emerging Markets Global Equity Fund Schedule of Investments As at 30 June 2013
Holdings
Currency Description of Investment Market Value
US$ Net Assets
%
Transferable securities admitted to an official stock exchange listing / dealt on another regulated market
Equities
Brazil
40,800 BRL ALL - America Latina Logistica 174,721 0.48
16,600 BRL Banco ABC Brasil Pref 101,521 0.28
8,500 US$ Braskem ADR 126,480 0.34
19,837 US$ Cia Energetica de Minas Gerais ADR 177,938 0.48
50,700 BRL Direcional Engenharia 308,692 0.84
25,300 BRL Estacio Participacoes 183,246 0.50
26,600 BRL Even Construtora e Incorporadora 94,886 0.26
29,826 US$ Itau Unibanco Pref ADR 385,352 1.05
37,000 BRL Petroleo Brasileiro 248,057 0.67
108,743 US$ Petroleo Brasileiro ADR 1,459,331 3.97
51,700 BRL Usinas Siderurgicas de Minas Gerais Pref Class A 173,890 0.47
31,800 BRL Vale SA 418,904 1.14
31,261 US$ Vale SA 411,082 1.12
4,264,100 11.60
Czech Republic
5,054 CZK CEZ Class A 121,146 0.33
121,146 0.33
Hong Kong
175,368 HKD Chow Tai Fook Jewellery 183,138 0.50
183,138 0.50
India
7,852 US$ ICICI Bank ADR 300,339 0.82
6,673 US$ Infosys ADR 274,861 0.75
9,692 US$ Reliance Industries GDR 279,033 0.76
2,537 US$ State Bank of India GDR 169,725 0.46
1,023,958 2.79
Indonesia
306,000 IDR Erajaya Swasembada 94,035 0.26
277,000 IDR Indomobil Sukses Internasional 147,919 0.40
282,000 IDR Perusahaan Gas Negara Persero 163,375 0.44
425,500 IDR Timah Persero 44,158 0.12
449,487 1.22
Malaysia
108,900 MYR CIMB 285,391 0.78
439,700 MYR DRB-Hicom 374,361 1.02
146,100 MYR Gamuda 219,185 0.60
23,100 MYR Kuala Lumpur Kepong 158,801 0.43
120,700 MYR SP Setia 127,978 0.35
95,200 MYR Tenaga Nasional 249,789 0.68
342,078 MYR UEM Sunrise 337,801 0.92
1,753,306 4.78 The accompanying notes form an integral part of these consolidated financial statements.

Ashmore SICAV – Unaudited Semi-Annual Report for the period ended 30 June 2013
152
Ashmore SICAV Emerging Markets Global Equity Fund Schedule of Investments (continued) As at 30 June 2013
Holdings
Currency Description of Investment Market Value
US$ Net Assets
%
Transferable securities admitted to an official stock exchange listing / dealt on another regulated market (continued)
Equities (continued)
Mexico
59,400 MXN Alpekde Class C 125,541 0.34
34,470 US$ Cemex ADR 364,693 0.99
9,300 US$ Empresas ICA ADR 70,029 0.19
33,100 MXN Grupo Financiero Banorte 194,953 0.53
16,292 US$ Ternium ADR 368,688 1.00
1,123,904 3.05
People's Republic of China
49,000 HKD AAC Technologies Class I 276,702 0.75
264,000 HKD Anton Oilfield Services Group 190,605 0.52
3,756 US$ Baidu ADR 355,055 0.96
522,000 HKD Beijing Enterprises Water 187,093 0.51
134,000 HKD Belle International 184,164 0.50
1,204,000 HKD China Dongxiang Group Class C 194,035 0.53
365,500 HKD China Merchants Bank 610,710 1.66
81,800 HKD China Pacific Insurance 261,018 0.71
103,000 HKD China Shenhua Energy 262,933 0.72
113,500 HKD CITIC Securities 201,645 0.55
273,000 HKD CNOOC 463,192 1.26
18,996 US$ Hollysys Automation Technologies 235,740 0.64
411,000 HKD Honghua 141,480 0.38
1,280,000 HKD Industrial & Commercial Bank of China 806,978 2.19
444,491 HKD Parkson Retail 183,382 0.50
89,500 HKD Ping An Insurance Groupof China 602,332 1.64
102,200 HKD Shanghai Pharmaceuticals 191,583 0.52
75,500 HKD Shimao Property 149,903 0.41
93,500 HKD Sinopec Engineering Class C 125,850 0.34
4,700 US$ Sohu.com 289,614 0.79
41,800 HKD Weichai Power 123,411 0.33
205,600 HKD Xinjiang Goldwind Science & Technology 140,489 0.38
68,000 HKD ZTE 109,588 0.30
6,287,502 17.09
Republic of South Korea
7,610 KRW Grand Korea Leisure 235,886 0.64
14,030 KRW Hana Financial 408,474 1.11
13,360 KRW Hyundai Development Co-Engineering & Construction 292,457 0.80
1,765 KRW Hyundai Mobis 421,912 1.15
9,020 KRW Hyundai Motor Class C 1,781,017 4.84
250,500 HKD Intime Department Store 244,482 0.66
9,046 KRW Kia Motors 491,884 1.34
29,170 KRW Korean Reinsurance Class C 268,189 0.73
1,724 KRW LG Chem 381,920 1.04
7,760 KRW LG Display 186,517 0.51
The accompanying notes form an integral part of these consolidated financial statements.

Ashmore SICAV – Unaudited Semi-Annual Report for the period ended 30 June 2013
153
Ashmore SICAV Emerging Markets Global Equity Fund Schedule of Investments (continued) As at 30 June 2013
Holdings
Currency Description of Investment Market Value
US$ Net Assets
%
Transferable securities admitted to an official stock exchange listing / dealt on another regulated market (continued)
Equities (continued)
Republic of South Korea (continued)
1,008 KRW Samsung Electronics 1,184,481 3.22
3,534 KRW Samsung Engineering 229,298 0.62
11,150 KRW Samsung Heavy Industries 349,521 0.95
8,990 KRW SK Hynix 245,600 0.67
6,721,638 18.28
Russian Federation
54,800 US$ Aeroflot - Russian Airlines 94,333 0.26
15,505 US$ Lukoil ADR 889,987 2.42
1,556 US$ NovaTek GDR 185,942 0.51
149,108 US$ Sberbank of Russia ADR 1,698,340 4.62
30,700 US$ Sberbank of Russia Pref 65,444 0.18
12,819 US$ Sistema JSFC GDR 253,175 0.69
3,187,221 8.68
South Africa
11,408 ZAR Exxaro Resources 167,296 0.46
9,111 ZAR Imperial 192,606 0.52
31,178 ZAR Investec 200,971 0.55
82,828 ZAR Steinhoff International 204,584 0.56
765,457 2.09
Taiwan
98,000 TWD Catcher Technology 510,093 1.39
199,000 TWD China Life Insurance 196,869 0.54
66,000 TWD Formosa Plastics 159,654 0.43
41,200 TWD Hon Hai Precision Industry 101,725 0.28
42,000 TWD HTC 334,924 0.91
232,000 TWD Innolux 115,725 0.31
47,000 TWD MediaTek 546,512 1.49
56,747 TWD Taiwan Fertilizer 137,082 0.37
63,741 US$ Taiwan Semiconductor Manufacturing ADR 1,167,735 3.18
386,000 TWD United Microelectronics 186,747 0.51
3,457,066 9.41
Thailand
42,000 THB BEC World 79,558 0.22
129,300 THB Charoen Pokphand Foods 107,350 0.29
347,000 SGD Thai Beverage 161,421 0.44
348,329 0.95
Turkey
34,625 TRY Turkiye Halk Bankasi 293,409 0.80
293,409 0.80 The accompanying notes form an integral part of these consolidated financial statements.

Ashmore SICAV – Unaudited Semi-Annual Report for the period ended 30 June 2013
154
Ashmore SICAV Emerging Markets Global Equity Fund Schedule of Investments (continued) As at 30 June 2013
Holdings
Currency Description of Investment Market Value
US$ Net Assets
%
Transferable securities admitted to an official stock exchange listing / dealt on another regulated market (continued)
Equities (continued)
United Arab Emirates
100,000 AED First Gulf Bank 434,250 1.18
655,586 AED Sorouh Real Estate 485,487 1.32
919,737 2.50
Total equities 30,899,398 84.07
Total transferable securities admitted to an official stock exchange listing / dealt on another regulated market 30,899,398 84.07
Other transferable securities and money market instruments
REITs
Mexico
99,200 MXN Concentradora Fibra Hotelera Mexicanade REITs 193,970 0.53
193,970 0.53
Total REITs 193,970 0.53
Warrants and rights Maturity date
India
12,405 US$ Axis Bank 16/03/2015 276,350 0.75
1,852 US$ Axis Bank 20/06/2018 41,281 0.11
206,459 US$ Jaiprakash Associates 15/06/2015 186,329 0.51
8,508 US$ Hero Motocorp 22/02/2017 238,564 0.65
11,552 US$ Maruti Suzuki India 30/11/2015 299,109 0.81
97,597 US$ Satyam Computer Services 28/02/2014 200,367 0.54
10,032 US$ Wockhardt 28/02/2014 168,718 0.45
1,410,718 3.82
Saudi Arabia
3,676 US$ Abdullah Al Othaim Markets 09/09/2015 111,741 0.30
10,000 US$ Abdullah Al Othaim Markets 02/02/2016 310,038 0.84
111,741 0.30
Total warrants and rights 1,832,497 4.96
Total other transferable securities and money market instruments 2,026,467 5.49
Undertakings for collective investments
Luxembourg
28,288 US$ Ashmore SICAV Emerging Markets Global Small-Cap Equity Fund 3,493,791 9.50
3,493,791 9.50
Total undertakings for collective investments 3,493,791 9.50
Total investment portfolio 36,419,656 99.06
Cash at bank 250,732 0.68
Other assets and liabilities 97,002 0.26
Total net assets 36,767,390 100.00
The accompanying notes form an integral part of these consolidated financial statements.

Ashmore SICAV – Unaudited Semi-Annual Report for the period ended 30 June 2013
155
Ashmore SICAV EM Equity Select Fund Schedule of Investments As at 30 June 2013
Holdings
Currency Description of Investment Market Value
US$ Net Assets
%
Transferable securities admitted to an official stock exchange listing / dealt on another regulated market
Bonds
United Kingdom
13,029 GBP Edinburgh Dragon Trust PLC 3.5% 31/01/2018 21,095 0.07
21,095 0.07
Total bonds 21,095 0.07
Equities
Brazil
171,600 BRL Itausa - Investimentos Itau SA Pref 643,971 2.23
71,600 BRL Petroleo Brasileiro SA 480,024 1.67
1,123,995 3.90
Malaysia
372,000 MYR Gamuda Bhd Com 558,088 1.94
558,088 1.94
Republic of South Korea
900 KRW Samsung Electronics Co Ltd Pref 696,642 2.42
696,642 2.42
Total equities 2,378,725 8.26
Total transferable securities admitted to an official stock exchange listing / dealt on another regulated market 2,399,820 8.33
Other transferable securities
Warrants and rights
Brazil
4,628 BRL Itausa - Investimentos Itau SA Receipt 17,598 0.06
17,598 0.06
Total warrants and rights 17,598 0.06
Total other transferable securities and money market instruments 17,598 0.06
Undertakings for collective investments
Ireland
33,725 GBP iShares MSCI AC Far East ex-Japan SmallCap UCITS 927,362 3.22
19,010 US$ iShares MSCI Brazil UCITS ETF (Inc) 667,133 2.31
1,594,495 5.53
Luxembourg
7,586 US$ Ashmore SICAV - Emerging Markets Global Small-Cap Equity Class I 936,931 3.25
2,650,738 US$ Ashmore SICAV 2 Global Liquidity US$ Fund 2,650,738 9.20
3,587,669 12.45 The accompanying notes form an integral part of these consolidated financial statements.

Ashmore SICAV – Unaudited Semi-Annual Report for the period ended 30 June 2013
156
Ashmore SICAV EM Equity Select Fund Schedule of Investments (continued) As at 30 June 2013
Holdings
Currency Description of Investment Market Value
US$ Net Assets
%
Undertakings for collective investments (continued)
United Kingdom
39,692 GBP Aberdeen Asian Smaller Companies Investment Trust PLC 603,213 2.09
38,790 US$ Aberdeen Latin America Equity Fund Inc 1,206,757 4.19
11,090 GBP Aberdeen New Dawn Investment Trust PLC 153,484 0.53
40,193 GBP Baring Emerging Europe PLC 443,794 1.54
122,827 GBP Blackrock Emerging Europe PLC 462,003 1.60
23,150 GBP Blackrock Emerging Europe PLC NPV 46 -
18,368 US$ Central Europe Russia and Turkey Fund Inc 547,734 1.90
40,332 US$ China Fund Inc 805,833 2.79
194,902 GBP Edinburgh Dragon Trust PLC 786,317 2.73
36,237 US$ India Fund Inc 694,663 2.41
70,110 US$ JF China Region Fund Inc 924,050 3.21
345,000 GBP JPMorgan Chinese Investment Trust PLC 722,101 2.51
107,447 GBP JPMorgan Russian Securities PLC 815,639 2.83
145,592 US$ Korea Equity Fund Inc 1,138,529 3.95
85,329 US$ Mexico Equity and Income Fund Inc 1,308,094 4.54
2,889 US$ Mexico Fund Inc 88,923 0.31
89,632 GBP New India Investment Trust PLC 292,961 1.02
277,000 GBP Pacific Assets Trust PLC 630,189 2.19
72,296 GBP Schroder AsiaPacific Fund PLC 272,484 0.95
35,352 GBP Scottish Oriental Smaller Companies Trust PLC 450,662 1.56
39,066 US$ Shelton Greater China Fund 260,570 0.90
31,321 US$ Taiwan Fund Inc 508,966 1.77
30,630 US$ Templeton Dragon Fund Inc 768,813 2.67
33,400 GBP Templeton Emerging Markets Investment Trust PLC 280,391 0.97
14,166,216 49.16
United States
60,527 US$ Aberdeen Indonesia Fund Inc 716,640 2.49
20,634 US$ iShares MSCI Brazil Small-Cap ETF Class C NPV ETF 438,473 1.52
36,932 US$ Korea Fund Inc 1,273,046 4.42
14,950 US$ Market Vectors Gulf States Index ETF NPV ETF 364,631 1.26
39,365 US$ Morgan Stanley Eastern Europe Fund Inc NPV 636,532 2.21
34,335 US$ Morgan Stanley India Investment Fund Inc 529,102 1.84
23,074 US$ Templeton Russia and East European Fund 316,345 1.10
46,725 US$ Thai Fund Inc 1,009,260 3.50
12,627 US$ Turkish Investment Fund Inc 200,643 0.70
29,950 US$ WisdomTree Middle East Dividend Fund NPV ETF 516,937 1.79
6,001,609 20.83
Total undertakings for collective investments 25,349,989 87.97
Total investment portfolio 27,767,407 96.36
Cash at bank 1,150,837 3.99
Other assets and liabilities (101,281) (0.35)
Total net assets 28,816,963 100.00
The accompanying notes form an integral part of these consolidated financial statements.

Ashmore SICAV – Unaudited Semi-Annual Report for the period ended 30 June 2013
157
Ashmore SICAV Emerging Markets Global Small-Cap Equity Fund Schedule of Investments As at 30 June 2013
Holdings
Currency Description of Investment Market Value
US$ Net Assets
%
Transferable securities admitted to an official stock exchange listing/dealt on another regulated market
Equities
Brazil
21,100 BRL Abril Educacao 372,513 0.32
285,479 BRL Banco ABC Brasil Pref 1,745,919 1.48
252,661 BRL Cia de Locacao das Americas 1,146,042 0.97
238,200 BRL Direcional Engenharia 1,450,302 1.23
176,740 BRL Iochpe-Maxion 1,927,374 1.64
210,800 BRL Randon Participacoes Pref 1,150,833 0.98
79,300 BRL Sonae Sierra Brasil 875,906 0.74
63,594 BRL Valid Solucoes e Servicos de Seguranca em Meios de Pagamento e Identificacao 939,638 0.80
9,608,527 8.16
Canada
206,300 US$ Gran Tierra Energy 1,239,863 1.05
1,239,863 1.05
Chile
14,643,838 CLP Cia Sud Americana de Vapores 973,950 0.83
973,950 0.83
Hong Kong
1,364,500 HKD Comba Telecom Systems 436,283 0.37
4,421,000 HKD GOME Electrical Appliances 398,989 0.34
4,222,000 HKD Ju Teng International 1,975,911 1.68
4,843,000 HKD Pacific Basin Shipping 2,753,567 2.34
706,000 HKD NagaCorp 550,684 0.47
400,000 HKD Shenzhou International 1,150,025 0.98
7,265,459 6.18
Indonesia
30,848,000 IDR Adi Sarana Armada 885,812 0.75
5,991,500 IDR Berlian Laju Tanker 88,741 0.08
6,194,000 IDR Bumi Serpong Damai 1,123,345 0.95
2,825,500 IDR Erajaya Swasembada 868,290 0.74
2,499,500 IDR Gajah Tunggal 805,884 0.68
6,422,840 IDR Perusahaan Perkebunan London Sumatra Indonesia 1,113,077 0.95
6,921,000 IDR Timah Persero 718,250 0.61
5,862,000 IDR Wismilak Inti Makmur 490,223 0.42
6,093,622 5.18
Malaysia
584,200 MYR AirAsia 589,840 0.50
1,389,200 MYR DRB-Hicom 1,182,766 1.01
1,702,300 MYR Gamuda 2,553,854 2.17
864,100 MYR Padini 516,901 0.44
2,166,518 MYR Wah Seong Corp 1,248,002 1.06
1,141,700 MYR Wct 899,773 0.76
6,991,136 5.94 The accompanying notes form an integral part of these consolidated financial statements.

Ashmore SICAV – Unaudited Semi-Annual Report for the period ended 30 June 2013
158
Ashmore SICAV Emerging Markets Global Small-Cap Equity Fund Schedule of Investments (continued) As at 30 June 2013
Holdings
Currency Description of Investment Market Value
US$ Net Assets
%
Transferable securities admitted to an official stock exchange listing/dealt on another regulated market (continued)
Equities (continued)
Mexico
372,000 MXN Asesor de Activos Prisma SAPI de Reits 542,613 0.46
232,440 MXN Cydsa Class C 819,063 0.70
125,098 US$ Empresas ICA ADR 941,988 0.80
680,000 MXN Grupo Famsa Class A 1,181,896 1.00
687,965 MXN Grupo Industrial Saltillo 1,431,824 1.22
377,900 MXN Grupo KUO Class B Series B 863,093 0.73
867,000 MXN Infraestructura Energetica Nova 3,106,353 2.64
8,886,830 7.55
Nigeria
5,546,947 NGN Zenith Bank 675,749 0.57
675,749 0.57
People's Republic of China
982,000 HKD Anton Oilfield Services Group 708,993 0.60
5,417,000 HKD China Automation 1,033,625 0.88
7,805,000 HKD China Dongxiang Group Class C 1,257,840 1.07
727,000 HKD China High Precision Automation 58,112 0.05
49,106 US$ China Lodging ADR 785,696 0.67
4,010,000 HKD Chinasoft International 1,096,031 0.93
1,387,000 HKD Goodbaby International 550,769 0.47
222,887 US$ Hollysys Automation Technologies 2,766,028 2.35
1,104,000 HKD Honghua 380,034 0.32
1,814,500 HKD Intime Department Store 1,770,906 1.50
77,500 US$ LightInTheBox ADR 1,043,150 0.89
1,154,000 HKD Minth 1,794,303 1.53
69,600 US$ Noah ADR 617,352 0.52
3,063,000 HKD Semiconductor Manufacturing International 225,094 0.19
97,584 US$ SouFun ADR 2,422,035 2.06
97,669 US$ Spreadtrum Communications ADR 2,563,811 2.18
19,073,779 16.21
Philippines
1,675,000 PHP Atlas Consolidated Mining & Development 573,843 0.49
7,886,000 PHP Oriental Peninsula Resources 217,230 0.18
791,073 0.67
Republic of South Korea
74,910 KRW Basic House Co 1,072,439 0.91
71,000 KRW BS Financial 898,341 0.76
11,913 KRW Gamevil 767,739 0.65
39,740 KRW Grand Korea Leisure 1,231,816 1.05
32,485 KRW Hana Tour Service 2,045,157 1.74
18,549 KRW Hyundai Department Store Class C 2,436,277 2.07
52,960 KRW Hyundai Development Co-Engineering & Construction 1,159,319 0.99
8,503 KRW Hyundai Home Shopping Network 1,142,866 0.97
281,726 KRW Korean Reinsurance Class C 2,590,187 2.20
The accompanying notes form an integral part of these consolidated financial statements.

Ashmore SICAV – Unaudited Semi-Annual Report for the period ended 30 June 2013
159
Ashmore SICAV Emerging Markets Global Small-Cap Equity Fund Schedule of Investments (continued) As at 30 June 2013
Holdings
Currency Description of Investment Market Value
US$ Net Assets
%
Transferable securities admitted to an official stock exchange listing/dealt on another regulated market (continued)
Equities (continued)
Republic of South Korea (continued)
90,120 KRW LG Fashion 2,225,283 1.89
39,945 KRW Modetour Network 930,377 0.79
159,849 KRW Nexen Tire 2,288,456 1.94
33,776 KRW Osstem Implant 857,672 0.73
19,645,929 16.69
Russian Federation
57,300 US$ Aeroflot - Russian Airlines 98,636 0.08
98,636 0.08
Taiwan
593,000 TWD Catcher Technology 3,086,584 2.62
146,000 TWD Chicony Electronics 379,967 0.32
2,639,102 TWD China Life Insurance 2,610,836 2.22
1,109,000 TWD Evergreen MarineTaiwan 606,840 0.52
144,000 TWD HTC 1,148,310 0.98
1,032,000 TWD Hung Poo Real Estate Development 1,017,504 0.87
634,000 TWD Kinsus Interconnect Technology 2,411,531 2.05
144,000 TWD Parade Technologies 1,143,505 0.97
656,000 TWD Shin Zu Shing 1,549,658 1.32
3,062,000 TWD Tainan Spinning 1,440,533 1.22
1,091,000 TWD TXC 1,492,476 1.27
16,887,744 14.36
Thailand
1,769,100 THB Amata PCL 1,038,131 0.88
2,834,700 THB Jasmine International 717,472 0.61
3,768,600 THB Supalai 2,150,708 1.83
3,906,311 3.32
Turkey
2,200,607 TRY Turkiye Sinai Kalkinma Bankasi 2,178,424 1.85
2,178,424 1.85
United Arab Emirates
3,165,379 AED Aldar Properties 1,844,245 1.57
1,844,245 1.57
Total equities 106,161,277 90.21
Total transferable securities admitted to an official stock exchange listing/dealt on another regulated market 106,161,277 90.21
Other transferable securities and money market instruments
Warrants and rights Maturity date
India
551,997 US$ Dewan Housing Finance 28/02/2014 1,482,112 1.26
369,941 US$ Hexaware Technologies 06/05/2016 540,373 0.46 The accompanying notes form an integral part of these consolidated financial statements.

Ashmore SICAV – Unaudited Semi-Annual Report for the period ended 30 June 2013
160
Ashmore SICAV Emerging Markets Global Small-Cap Equity Fund Schedule of Investments (continued) As at 30 June 2013
Holdings
Currency Description of Investment Market Value
US$ Net Assets
%
Other transferable securities and money market instruments (continued)
Warrants and rights (continued)
India (continued)
700,120 US$ HT Media 28/02/2014 1,147,497 0.98
454,306 US$ Indian Bank 13/01/2017 880,445 0.75
249,189 US$ KPIT Cummins Infosystems 24/06/2016 509,786 0.43
76,520 US$ KPIT Cummins Infosystems 04/04/2018 156,866 0.13
763,393 US$ MT Educare 20/11/2017 1,201,199 1.02
724,342 US$ PI Industries 28/02/2014 1,568,925 1.33
7,487,203 6.36
Saudi Arabia
45,326 US$ Abdullah Al Othaim Markets 09/09/2015 1,377,800 1.17
7,962 US$ Abdullah Al Othaim Markets 02/02/2016 246,852 0.21
45,310 US$ Fawaz Abdulaziz Alhokair 27/09/2016 1,896,677 1.61
3,521,329 2.99
Total warrants and rights 11,008,532 9.35
Total other transferable securities and money market instruments 11,008,532 9.35
Total investment portfolio 117,169,809 99.56
Cash at bank 1,199,881 1.02
Other assets and liabilities (687,551) (0.58)
Total net assets 117,682,139 100.00
The accompanying notes form an integral part of these consolidated financial statements.

Ashmore SICAV – Unaudited Semi-Annual Report for the period ended 30 June 2013
161
Ashmore SICAV Emerging Markets Frontier Equity Fund Schedule of Investments As at 30 June 2013
Holdings
Currency Description of Investment Market Value
US$ Net Assets
%
Transferable securities admitted to an official stock exchange listing/dealt on another regulated market
Equities
Argentina
18,511 US$ Petrobras Argentina ADR 67,010 0.41
67,010 0.41
Canada
899,500 CAD 360 VOX 123,634 0.76
123,634 0.76
Estonia
101,053 EUR Silvano Fashion Class A 345,460 2.13
345,460 2.13
Georgia
3,400 GBP Bank of Georgia 86,118 0.53
86,118 0.53
Ghana
1,308,000 GHS CAL Bank 525,765 3.24
167,000 GHS Ecobank Ghana 360,196 2.22
759,600 GHS UT Bank 193,624 1.19
1,079,585 6.65
Hong Kong
262,000 HKD NagaCorp 204,362 1.26
204,362 1.26
Kazakhstan
79,373 US$ Halyk Savings Bank of Kazakhstan GDR 585,773 3.61
15,600 US$ KCell GDR 234,780 1.45
820,553 5.06
Kenya
93,000 KES CFC Stanbic 68,768 0.42
1,308,903 KES Co-operative Bank of Kenya 233,964 1.44
15,300 KES Crown Paints Kenya 9,977 0.06
1,385,000 KES Mumias Sugar 67,738 0.42
380,447 2.34
Kuwait
140,000 KWD ALAFCO Aviation Lease and FinanceKSCC Class C 142,331 0.88
372,000 KWD Burgan Bank SAK 782,472 4.82
210,000 KWD Commercial Facilities Class C 222,699 1.37
130,000 KWD KGL LogisticsKSCC 132,165 0.81
85,000 KWD Kuwait Foods Americana 637,686 3.93
105,000 KWD Yiaco MedicalKSCC 156,442 0.96
2,073,795 12.77
Lithuania
4,500 EUR Apranga PVA 14,272 0.09
14,272 0.09
Namibia
497,399 ZAR Trustco 31,566 0.19
31,566 0.19 The accompanying notes form an integral part of these consolidated financial statements.

Ashmore SICAV – Unaudited Semi-Annual Report for the period ended 30 June 2013
162
Ashmore SICAV Emerging Markets Frontier Equity Fund Schedule of Investments (continued) As at 30 June 2013
Holdings
Currency Description of Investment Market Value
US$ Net Assets
%
Transferable securities admitted to an official stock exchange listing/dealt on another regulated market (continued)
Equities (continued)
Nigeria
330 GBP Afren 648 -
3,164,613 NGN Diamond Bank 117,799 0.73
3,266,943 NGN FBN 359,800 2.22
1,211,496 NGN FCMB 35,257 0.22
1,941,940 NGN Guaranty Trust Bank 290,341 1.79
1,485,174 NGN Mansard Insurance 18,458 0.11
4,950,648 NGN MAY & Baker Nigeria 83,460 0.51
685,766 NGN Nigerian Aviation Handling Class C 30,674 0.19
8,192,730 NGN Skye Bank 240,948 1.48
8,705,768 NGN Sterling Bank 141,945 0.87
2,500,000 NGN Zenith Bank 304,559 1.87
1,623,889 9.99
Pakistan
326,823 PKR Bank Al-Habib 89,310 0.55
80,950 PKR Fauji Fertilizer 87,402 0.54
244,209 PKR Fauji Fertilizer Bin Qasim 92,137 0.57
91,393 PKR Habib Bank 109,525 0.67
215,300 PKR HUB Power 133,399 0.82
60,100 PKR Lucky Cement 126,675 0.78
638,448 3.93
Qatar
12,389 QAR Ooredoo 410,074 2.52
20,183 QAR Qatar National Bank SAQ 881,499 5.43
8,261 QAR Qatar Navigation 163,155 1.00
1,454,728 8.95
Romania
829,800 RON Banca Transilvania 297,232 1.83
297,232 1.83
South Africa
6,150 AUD Zimplats 47,906 0.29
47,906 0.29
Togo
700,000 NGN Ecobank Transnational 64,173 0.40
64,173 0.40
Ukraine
5,908 US$ Avangardco Investments Public GDR 51,813 0.32
51,813 0.32
United Arab Emirates
1,467,651 AED Aldar Properties 855,098 5.26
227,429 AED Emaar Properties 321,980 1.98
171,312 AED First Gulf Bank 743,922 4.58
3,488 GBP NMC Health 14,284 0.09
720,000 AED Ras Al Khaimah Cement Class C 182,303 1.12 The accompanying notes form an integral part of these consolidated financial statements.

Ashmore SICAV – Unaudited Semi-Annual Report for the period ended 30 June 2013
163
Ashmore SICAV Emerging Markets Frontier Equity Fund Schedule of Investments (continued) As at 30 June 2013
Holdings
Currency Description of Investment Market Value
US$ Net Assets
%
Transferable securities admitted to an official stock exchange listing/dealt on another regulated market (continued)
Equities (continued)
United Arab Emirates (continued)
733,972 AED Union National Bank PJSC 927,207 5.71
3,044,794 18.74
Total equities 12,449,785 76.64
Total transferable securities admitted to an official stock exchange listing / dealt on another regulated market 12,449,785 76.64
Other transferable securities and money market instruments
Warrants and rights Maturity date
Nigeria
3,264,663 NGN Sterling Bank 31/10/2013 10,646 0.07
10,646 0.07
Qatar
14,688 US$ Qatar Insurance 14/04/2017 245,290 1.51
245,290 1.51
Saudi Arabia
17,000 US$ Al-Abdullatif Industrial 04/05/2015 183,807 1.13
16,000 US$ Al-Hassan G.I. Shaker 23/04/2018 353,038 2.17
17,000 US$ AL-Khaleej Training & Education 04/09/2015 160,466 0.99
29,011 US$ Abdullah Al Othaim Markets 09/09/2015 881,864 5.43
13,000 US$ Astra Industrial 04/05/2015 145,860 0.90
9,411 US$ Fawaz Abdulaziz Alhokair 27/09/2016 393,944 2.43
2,118,979 13.05
United Arab Emirates
400,000 US$ Aramex PJSC 30/03/2016 260,000 1.60
260,000 1.60
Zimbabwe
641,694 US$ Econet Wireless 15/04/2016 408,220 2.51
408,220 2.51
Total warrants and rights 3,043,135 18.74
Total other transferable securities and money market instruments 3,043,135 18.74
Total investment portfolio 15,492,920 95.38
Cash at bank 475,970 2.93
Other assets and liabilities 274,846 1.69
Total net assets 16,243,736 100.00
The accompanying notes form an integral part of these consolidated financial statements.

Ashmore SICAV – Unaudited Semi-Annual Report for the period ended 30 June 2013
164
Ashmore SICAV Brazil Equity Fund Schedule of Investments As at 30 June 2013
Holdings
Currency Description of Investment Market Value
US$ Net Assets
%
Transferable securities admitted to an official stock exchange listing / dealt on another regulated market
Equities
Brazil
59,700 BRL Anhanguera Educacional Participacoes 348,625 9.45
17,100 BRL Banco Santander Brasil 104,889 2.85
23,400 BRL Bematech 75,738 2.05
18,100 BRL BR Malls Participacoes 163,707 4.43
18,400 BRL Bradespar Pref 168,253 4.56
7,400 BRL BRF - Brasil foods 162,300 4.39
9,000 BRL CPFL Energia 84,376 2.28
24,100 BRL Estacio Participacoes 174,555 4.73
46,400 BRL EucatexIndustria e Comercio Pref 131,278 3.55
24,400 BRL General Shopping Brasil 93,997 2.55
15,200 BRL International MealHoldings 146,630 3.97
27,100 BRL Itau Unibanco Pref 352,942 9.56
42,400 BRL Log-in Logistica Intermodal 188,675 5.11
29,500 BRL Lojas Americanas 180,949 4.90
7,990 BRL Lojas Americanas Pref 56,569 1.53
45,400 BRL Petroleo Brasileiro 304,372 8.24
15,900 BRL Porto Seguro 170,585 4.62
14,000 BRL Sonae Sierra Brasil 154,637 4.19
14,800 BRL Vale Pref 181,227 4.92
3,244,304 87.88
Total equities 3,244,304 87.88
Total transferable securities admitted to an official stock exchange listing / dealt on another regulated market 3,244,304 87.88
Total investment portfolio 3,244,304 87.88
Cash at bank 427,130 11.57
Other assets and liabilities 21,792 0.59
Total net assets 3,693,226 100.04
The accompanying notes form an integral part of these consolidated financial statements.

Ashmore SICAV – Unaudited Semi-Annual Report for the period ended 30 June 2013
165
Other Information on Investments As at 30 June 2013 Breakdown by country Ashmore SICAV Emerging Markets Debt Fund
Ashmore SICAV Emerging Markets Sovereign Debt Fund
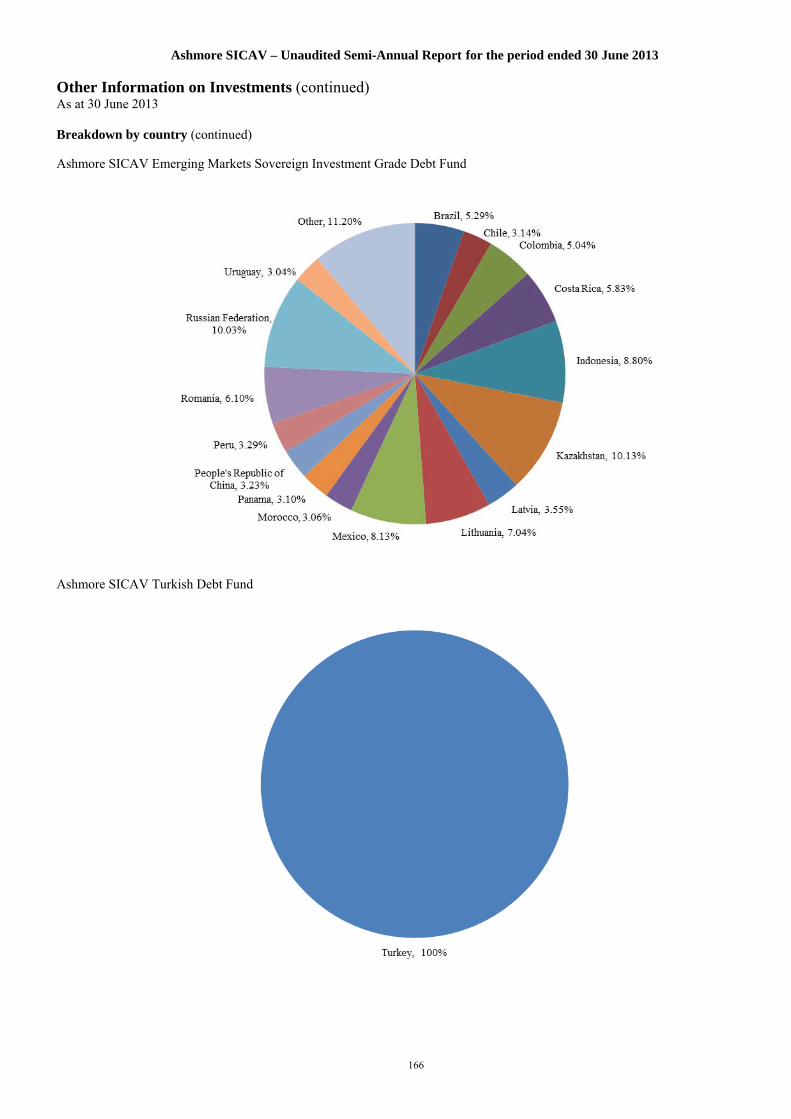
Ashmore SICAV – Unaudited Semi-Annual Report for the period ended 30 June 2013
166
Other Information on Investments (continued) As at 30 June 2013 Breakdown by country (continued) Ashmore SICAV Emerging Markets Sovereign Investment Grade Debt Fund
Ashmore SICAV Turkish Debt Fund
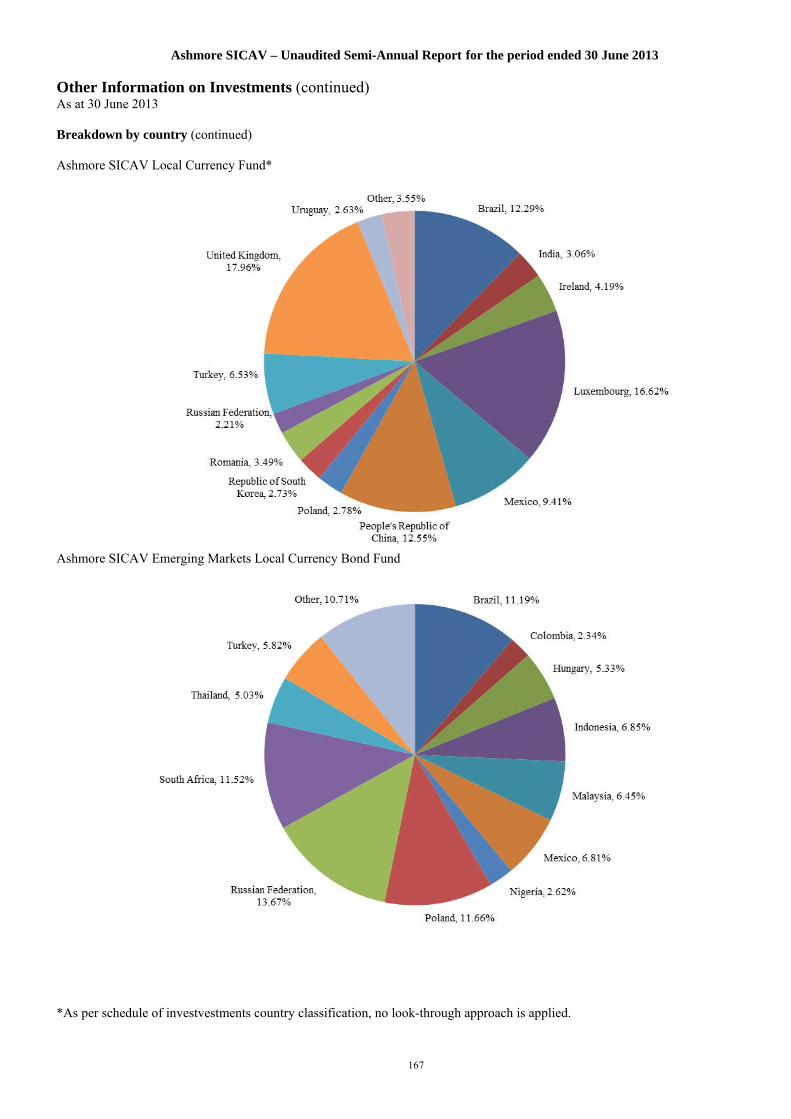
Ashmore SICAV – Unaudited Semi-Annual Report for the period ended 30 June 2013
167
Other Information on Investments (continued) As at 30 June 2013 Breakdown by country (continued) Ashmore SICAV Local Currency Fund*
Ashmore SICAV Emerging Markets Local Currency Bond Fund
*As per schedule of investvestments country classification, no look-through approach is applied.

Ashmore SICAV – Unaudited Semi-Annual Report for the period ended 30 June 2013
168
Other Information on Investments (continued) As at 30 June 2013 Breakdown by country (continued)
Ashmore SICAV Emerging Markets Local Markets Currency Fund*
Ashmore SICAV Emerging Markets Investment Grade Local Currency Fund*
*As per schedule of investvestments country classification, no look-through approach is applied.

Ashmore SICAV – Unaudited Semi-Annual Report for the period ended 30 June 2013
169
Other Information on Investments (continued) As at 30 June 2013 Breakdown by country (continued) Ashmore SICAV Emerging Markets Inflation Linked Bond Fund
Ashmore SICAV Emerging Markets Total Return Fund*
*As per schedule of investvestments country classification, no look-through approach is applied.

Ashmore SICAV – Unaudited Semi-Annual Report for the period ended 30 June 2013
170
Other Information on Investments (continued) As at 30 June 2013 Breakdown by country (continued) Ashmore SICAV Emerging Markets Total Return Fund II*
Ashmore SICAV Emerging Markets Investment Grade Total Return Fund
*As per schedule of investvestments country classification, no look-through approach is applied.

Ashmore SICAV – Unaudited Semi-Annual Report for the period ended 30 June 2013
171
Other Information on Investments (continued) As at 30 June 2013 Breakdown by country (continued) Ashmore SICAV Emerging Markets Corporate Debt Fund
Ashmore SICAV Emerging Markets Investment Grade Corporate Debt Fund

Ashmore SICAV – Unaudited Semi-Annual Report for the period ended 30 June 2013
172
Other Information on Investments (continued) As at 30 June 2013 Breakdown by country (continued) Ashmore SICAV Emerging Markets Local Currency Corporate Debt Fund
Ashmore SICAV Emerging Markets Asian Corporate Debt Fund

Ashmore SICAV – Unaudited Semi-Annual Report for the period ended 30 June 2013
173
Other Information on Investments (continued) As at 30 June 2013 Breakdown by country (continued) Ashmore SICAV Emerging Markets Global Equity Fund*
Ashmore SICAV EM Equity Select Fund*
*As per schedule of investvestments country classification, no look-through approach is applied.

Ashmore SICAV – Unaudited Semi-Annual Report for the period ended 30 June 2013
174
Other Information on Investments (continued) As at 30 June 2013 Breakdown by country (continued) Ashmore SICAV Emerging Markets Global Small-Cap Equity Fund
Ashmore SICAV Emerging Markets Frontier Equity Fund

Ashmore SICAV – Unaudited Semi-Annual Report for the period ended 30 June 2013
175
Other Information on Investments (continued) As at 30 June 2013 Breakdown by country (continued) Ashmore SICAV Brazil Equity Fund

Ashmore SICAV – Unaudited Semi-Annual Report for the period ended 30 June 2013
176
Other Information on Investments (continued) As at 30 June 2013
Breakdown by rating
Emerging Markets Debt Fund Emerging Markets Sovereign Debt Fund
Emerging Markets Sovereign Investment Grade Debt Fund
Turkish Debt Fund Local Currency Fund
Ratings Market Value
in US$ % Investment
Portfolio Market Value
in US$ % Investment
Portfolio Market Value
in US$ % Investment
Portfolio Market Value
in US$ % Investment
Portfolio Market Value
in US$ % Investment
Portfolio
Aa2 1,817,712 0.16% 791,500 0.69% - - - - - -
Aa3 10,106,580 0.90% 1,144,313 0.99% 852,178 1.44% - - 22,723,121 2.71%
A1 16,463,698 1.47% 1,254,677 1.09% 1,442,784 2.45% - - - -
A2 24,114,604 2.15% 2,592,499 2.24% 1,337,125 2.27% - - 23,241,113 2.78%
A3 4,709,285 0.42% 566,410 0.49% 6,293 0.01% - - - -
Baa1 158,698,070 14.17% 15,469,106 13.39% 14,705,084 24.93% - - 100,639,362 12.03%
Baa2 76,390,691 6.82% 9,640,668 8.35% 8,980,162 15.22% - - 100,594,036 12.02%
Baa3 208,177,138 18.59% 30,411,635 26.33% 25,996,963 44.07% - - 24,180,400 2.89%
Ba1 82,628,646 7.38% 12,279,934 10.63% 631,200 1.07% - - 615,197 0.07%
Ba2 18,118,336 1.62% - - - - - - - -
Ba3 56,392,876 5.04% 2,467,091 2.14% - - - - - -
B1 66,124,155 5.91% 4,736,600 4.10% - - - - - -
B2 81,797,596 7.30% 7,033,976 6.09% - - - - 4,900,682 0.59%
B3 71,418,107 6.38% 7,782,648 6.74% - - - - 1,831,068 0.22%
Caa1 32,934,361 2.94% 966,768 0.84% - - - - - -
Caa2 8,116,754 0.72% - - - - - - - -
Ca 6,113,460 0.55% - - - - - - - -
Unrated/not rated 195,750,918 17.48% 18,357,810 15.89% 5,041,583 8.54% 45,134,310 100.00% 558,104,637 66.69%
1,119,872,987 100.00% 115,495,635 100.00% 58,993,372 100.00% 45,134,310 100.00% 836,829,616 100.00%

Ashmore SICAV – Unaudited Semi-Annual Report for the period ended 30 June 2013
177
Other Information on Investments (continued) As at 30 June 2013
Breakdown by rating (continued)
Emerging Markets Local Currency Bond Fund
Emerging Markets Local Markets Currency Fund
Emerging Markets Investment Grade Local Currency Fund
Emerging Markets Inflation Linked Bond Fund
Emerging Markets Total Return Fund
Ratings Market Value
in US$
% Investment
Portfolio
Market Value in US$
% Investment
Portfolio
Market Value in US$
% Investment
Portfolio
Market Value in US$
% Investment
Portfolio
Market Value in US$
% Investment
Portfolio
Aaa 15,845,755 0.62% - - 1,930,447 0.63% - - 482,612 0.17%
Aa2 - - - - - - - - 607,788 0.22%
Aa3 45,888,357 1.79% - - 1,671,332 0.54% - - 3,480,938 1.24%
A1 - - - - - - - - 1,015,418 0.36%
A2 298,563,392 11.65% - - 32,580,655 10.56% 2,125,985 4.79% 12,355,642 4.39%
A3 99,642,253 3.89% - - 13,093,746 4.24% - - 3,640,416 1.29%
Baa1 873,086,181 34.08% 703,626 26.22% 140,408,084 45.50% 12,721,990 28.64% 36,127,631 12.85%
Baa2 254,144,432 9.92% - - 39,070,650 12.66% 10,919,991 24.59% 15,194,999 5.40%
Baa3 246,564,865 9.62% - - 14,002,855 4.54% 2,395,342 5.39% 29,045,917 10.33%
Ba1 156,705,741 6.12% - - 1,782,026 0.58% 630,000 1.42% 15,459,079 5.50%
Ba2 - - - - - - - - 5,474,427 1.95%
Ba3 - - - - - - - - 17,771,350 6.32%
B1 - - - - - - - - 18,221,091 6.48%
B2 - - - - - - - - 15,343,118 5.46%
B3 - - - - - - - - 15,070,229 5.36%
Caa1 - - - - - - - - 8,145,479 2.90%
Caa2 - - - - - - - - 1,709,750 0.61%
Ca - - - - - - - - 1,962,500 0.70%
Unrated/not rated 571,746,760 22.31% 1,979,885 73.78% 64,049,247 20.75% 15,618,282 35.17% 80,083,182 28.47%
2,562,187,736 100.00% 2,683,511 100.00% 308,589,042 100.00% 44,411,590 100.00% 281,191,566 100.00%

Ashmore SICAV – Unaudited Semi-Annual Report for the period ended 30 June 2013
178
Other Information on Investments (continued) As at 30 June 2013
Breakdown by rating (continued)
Emerging Markets Total Return Fund II
Emerging Markets Investment Grade Total Return Fund
Emerging Markets Corporate Debt Fund
Emerging Markets Investment Grade Corporate Debt Fund
Emerging Markets Local Currency Corporate Debt Fund
Ratings Market Value
in US$
% Investment
Portfolio
Market Value in US$
% Investment
Portfolio
Market Value in US$
% Investment
Portfolio
Market Value in US$
% Investment
Portfolio
Market Value in US$
% Investment
Portfolio
Aaa 321,741 0.21% 80,435 0.21% - - - - - -
Aa2 181,738 0.12% - - - - - - - -
Aa3 522,116 0.35% 562,790 1.44% 9,214,230 0.29% 584,056 0.74% 4,307,410 2.67%
A1 449,142 0.30% 723,790 1.85% 40,949,675 1.29% 4,242,436 5.40% 1,796,502 1.11%
A2 6,565,668 4.35% 2,686,622 6.87% 31,870,709 1.01% 4,806,986 6.11% 11,019,776 6.84%
A3 2,520,391 1.67% 1,053,166 2.69% 23,472,751 0.74% 2,122,802 2.70% 4,001,467 2.48%
Baa1 25,159,332 16.66% 8,785,079 22.47% 44,326,762 1.40% 6,677,340 8.49% 8,812,103 5.47%
Baa2 10,480,758 6.94% 6,224,780 15.92% 165,993,781 5.24% 16,734,532 21.29% 10,677,618 6.63%
Baa3 15,556,916 10.30% 13,020,646 33.31% 247,504,912 7.81% 25,696,839 32.68% 4,026,503 2.50%
Ba1 8,258,032 5.47% 1,495,562 3.83% 118,040,766 3.72% 6,431,277 8.18% 7,903,807 4.90%
Ba2 1,236,809 0.82% - - 77,520,897 2.45% - - 4,715,234 2.93%
Ba3 8,895,238 5.89% - - 348,542,798 11.00% - - 13,305,190 8.26%
B1 9,748,191 6.46% - - 298,575,543 9.42% - - 4,414,323 2.74%
B2 7,432,514 4.92% - - 402,904,514 12.71% - - 12,017,443 7.46%
B3 6,366,128 4.22% - - 215,796,848 6.81% - - 886,744 0.55%
Caa1 3,583,063 2.37% - - 250,651,885 7.91% - - 4,015,639 2.49%
Caa2 933,000 0.62% - - 65,625,131 2.07% - - 4,435,738 2.75%
Ca 985,000 0.65% - - 26,010,260 0.82% - - 770,000 0.48%
Unrated/not rated 41,786,583 27.68% 4,462,184 11.41% 802,114,397 25.31% 11,326,225 14.41% 64,030,777 39.74%
150,982,360 100.00% 39,095,054 100.00% 3,169,115,859 100.00% 78,622,493 100.00% 161,136,274 100.00%

Ashmore SICAV – Unaudited Semi-Annual Report for the period ended 30 June 2013
179
Other Information on Investments (continued) As at 30 June 2013
Breakdown by rating (continued)
Emerging Markets Asian Corporate Debt Fund
Emerging Markets Global Equity Fund
EM Equity Select Fund Emerging Markets Global Small-Cap Equity Fund
Emerging Markets Frontier Equity Fund
Ratings Market Value
in US$
% Investment
Portfolio
Market Value in US$
% Investment
Portfolio
Market Value in US$
% Investment
Portfolio
Market Value in US$
% Investment
Portfolio
Market Value in US$
% Investment
Portfolio
Aa2 916,271 3.57% - - - - - - - -
A1 903,307 3.52% - - - - - - - -
A2 426,582 1.66% - - - - - - - -
A3 2,922,021 11.39% - - - - - - - -
Baa1 664,458 2.59% - - - - - - - -
Baa2 2,574,006 10.03% - - - - - - - -
Baa3 918,309 3.58% - - - - - - - -
Ba1 730,242 2.85% - - - - - - - -
Ba2 797,000 3.11% - - - - - - - -
Ba3 2,356,754 9.19% - - - - - - - -
B1 3,576,351 13.94% - - - - - - - -
B2 2,057,327 8.02% - - - - - - - -
B3 376,000 1.47% - - - - - - - -
Caa1 536,958 2.09% - - - - - - - -
Caa2 194,000 0.76% - - - - - - - -
Unrated/not rated 5,700,899 22.23% 36,419,656 100.00% 27,767,407 100.00% 117,169,809 100.00% 15,492,920 100.00%
25,650,485 100.00% 36,419,656 100.00% 27,767,407 100.00% 117,169,809 100.00% 15,492,920 100.00%
Brazil Equity Fund
Market Value in US$
% Investment
Portfolio
Unrated/not rated 3,244,304 100.00%
3,244,304 100.00%

Ashmore SICAV – Unaudited Semi-Annual Report for the period ended 30 June 2013
180
Notes to the Consolidated Financial Statements 1- General Ashmore SICAV (the “Company”) is incorporated as a société anonyme (public limited company) under the laws of the Grand Duchy of Luxembourg and qualifies as an open-ended société d'investissement à capital variable (a “SICAV”) and is authorised as an undertaking for collective investment in transferable securities under part I of the law dated 17 December 2010 on undertakings for collective investment, as amended (the “Law of 2010”). The Company was incorporated under the laws of the Grand Duchy of Luxembourg on 19 December 2002 for an unlimited period of time. It is registered under number B90 279 at the Register of Commerce at the District Court of Luxembourg. As at 30 June 2013 the Company comprised twenty-one active Sub-Funds (individually the “Sub-Fund” and collectively the “Sub-Funds”):
- Ashmore SICAV Emerging Markets Debt Fund - Ashmore SICAV Emerging Markets Sovereign Debt Fund - Ashmore SICAV Emerging Markets Sovereign Investment Grade Debt Fund - Ashmore SICAV Turkish Debt Fund - Ashmore SICAV Local Currency Fund - Ashmore SICAV Emerging Markets Local Currency Bond Fund - Ashmore SICAV Emerging Markets Local Markets Currency Fund - Ashmore SICAV Emerging Markets Investment Grade Local Currency Fund - Ashmore SICAV Emerging Markets Inflation Linked Bond Fund - Ashmore SICAV Emerging Markets Total Return Fund - Ashmore SICAV Emerging Markets Total Return Fund II - Ashmore SICAV Emerging Markets Investment Grade Total Return Fund - Ashmore SICAV Emerging Markets Corporate Debt Fund - Ashmore SICAV Emerging Markets Investment Grade Corporate Debt Fund - Ashmore SICAV Emerging Markets Local Currency Corporate Debt Fund - Ashmore SICAV Emerging Markets Asian Corporate Debt Fund - Ashmore SICAV Emerging Markets Global Equity Fund - Ashmore SICAV EM Equity Select Fund - Ashmore SICAV Emerging Markets Global Small-Cap Equity Fund - Ashmore SICAV Emerging Markets Frontier Equity Fund - Ashmore SICAV Brazil Equity Fund
The institutional and institutional II shares of all the Ashmore SICAV Sub-Funds are listed on the Luxembourg Stock Exchange. The Memorandum and Articles of Association of the Company were published in the Mémorial, Recueil Spécial des Sociétés et Associations du Grand-Duché de Luxembourg (the “Mémorial”) and filed with the Registry of the Luxembourg District Court where they may be consulted and copies may be obtained upon the payment of Registry fees. Share class information As per the prospectus amended in April 2013, the Sub-Funds may contain Institutional Class Shares, Institutional II Class Shares, Retail Class Shares and Z Class Shares denominated in US Dollar (US$), Euro (EUR), British Pound Sterling (GBP), Danish Krone (DKK), Norwegian Krone (NOK), Swedish Krona (SEK), Swiss Franc (CHF), Japanese Yen (JPY), Canadian Dollar (CAD), Mexican Peso (MXP) and Australian Dollar (AUD).
The following table presents share class launches and terminations, which took place during the period under review:
Number of classes
Classes launched Classes terminated active as at 30 June 2013
Emerging Markets Debt Fund Institutional US$ Accumulation, - 13 Z US$ Income, GBP Income
Emerging Markets Sovereign Debt Fund Institutional II JPY Income - 4
Emerging Markets Sovereign Investment Grade Debt Fund
- - 1
Turkish Debt Fund Institutional US$ Accumulation - 1

Ashmore SICAV – Unaudited Semi-Annual Report for the period ended 30 June 2013
181
Notes to the Consolidated Financial Statements (continued) 1- General (continued) Share class information (continued)
Number of classes
active as at Classes launched Classes terminated 30 June 2013
Local Currency Fund Institutional US$ Accumulation, - 12
Z US$ Accumulation, EUR Accumulation, GBP Accumulation
Emerging Markets Local Currency Bond Fund Institutional US$ Accumulation, Institutional CHF Income 9
Z GBP Income, US$ Accumulation
Emerging Markets Local Markets Currency Fund - - 2
Emerging Markets Investment Grade Local Currency Fund
Retail US$ Income Retail US$ Income 2
Emerging Markets Inflation Linked Bond Fund Retail US$ Income, - 3
Institutional US$ Accumulation
Emerging Markets Total Return Fund Retail US$ Income, - 6
Institutional US$ Accumulation, GBP Accumulation
Emerging Markets Total Return Fund II - - 1
Emerging Markets Investment Grade Total Return Fund
- - 2
Emerging Markets Corporate Debt Fund Retail EUR Accumulation, US$ Accumulation, CHF Accumulation,
- 21
Institutional AUD Income, EUR Accumulation, US$ Accumulation, CHF Accumulation, MXN Accumulation, CAD Accumulation,
Institutional II JPY Income,
Z US$ Income, Z GBP Income
Emerging Markets Investment Grade Corporate Debt Fund
Institutional EUR Income, Z GBP Income - 3
Emerging Markets Local Currency Corporate Debt Fund
Retail US$ Income, - 8
Institutional EUR Accumulation, US$ Accumulation, CHF Accumulation
Emerging Markets Asian Corporate Debt Fund - - 1
Emerging Markets Global Equity Fund - Retail EUR Income 4
EM Equity Select Fund - - 2
Emerging Markets Global Small-Cap Equity Fund - - 5
Emerging Markets Frontier Equity Fund Retail GBP Income - 2
Brazil Equity Fund Retail US$ Accumulation, Retail US$ Accumulation 1
Institutional US$ Accumulation
Shares denominated in EUR, GBP, NOK, SEK, DKK, CHF, JPY, CAD, MXN and AUD may, at the Investment Manager’s absolute discretion, be hedged with respect to currency movements in relation to the EUR, GBP, NOK, SEK, DKK, CHF, JPY, CAD, MXN and AUD against the US$. The Investment Manager may, at its absolute discretion, engage, for the exclusive account and cost of each of the EUR, GBP, NOK, SEK, DKK, CHF, JPY, CAD, MXN and AUD dominated shares classes, currency forwards, currency futures, currency option transactions and currency swaps, within the investment restrictions set out in the Prospectus, in order to preserve the current EUR, GBP, NOK, SEK, DKK, CHF, JPY, CAD, MXN and AUD value of the portion, in whole or in part, of the assets attributable to the relevant EUR, GBP, NOK, SEK, DKK, CHF, JPY, CAD, MXP and AUD shares class that is invested in US$ denominated assets. 2- Principal accounting policies a) Presentation of financial statements The financial statements are prepared in accordance with Luxembourg legal and regulatory requirements relating to undertakings for collective investment. The consolidated financial statements of the Company and the financial statements of each Sub-Fund are expressed in US$ (“the reference currency”). The consolidated statement of net assets and the consolidated statement of operations and changes in net assets are the sum of the statement of net assets and the sum of the statement of operations and changes in net assets of each Sub-Fund, after the elimination of transactions and balances between Sub-Funds. The semi-annual report is presented on the basis of the latest net asset value calculated during the financial period (i.e. 28 June, 2013).

Ashmore SICAV – Unaudited Semi-Annual Report for the period ended 30 June 2013
182
Notes to the Consolidated Financial Statements (continued) 2- Principal accounting policies (continued) b) Basis of consolidation The consolidated financial statements include all the assets, liabilities and operations of the Company. Intragroup transactions are fully eliminated on consolidation but this has no impact on the results and financial position of the individual sub-funds. c) Net asset value adjustment (swing pricing) If on any Valuation Day the aggregate transactions in Shares of a Sub-Fund result in a net increase or decrease in the number of Shares which exceeds a threshold of 5% (or a threshold as determined by the Board of Directors and as applicable to all transactions) for that Sub-Fund, as further described in the Fund’s swing policy (a copy of which may be obtained at the registered office of the Fund), the Management Company shall apply an alternative net asset value calculation method (to include such reasonable factors as they see fit) for the net asset value per Share. This method of valuation is intended to pass the estimated costs of the underlying investment activity of the Fund to the active Shareholders by adjusting the net asset value of the relevant Share and thus protect the Fund’s existing Shareholders from the costs associated with ongoing subscription and redemption activity. Where the Management Company, based on the prevailing market conditions and the level of subscriptions or redemptions requested by Shareholders or potential Shareholders in relation to the size of the relevant Sub-Fund, has determined for a particular Sub-Fund to apply an alternative net asset value calculation method, the Sub-Fund may be valued either on a bid or offer basis (which would include the factors referenced in the preceding paragraph). Such adjustment may vary from Sub-Fund to Sub-Fund and will not exceed 3% of the original net asset value per Share. d) Valuation of investments of each Sub-Fund Securities listed on a recognised stock exchange or dealt on any other regulated market that operates regularly, is recognised and is open to the public, are valued at the last known available closing bid price. If such a price is not available, a closing mid price (the mean of the listed closing bid and asking prices) may be taken as a basis for the valuation. If a security is traded on several stock exchanges, the valuation is made on the basis of the last known bid price on the main market on which the securities are traded. In the case of securities for which trading on a stock exchange is not significant, but which are bought and sold on a secondary market with regulated trading among security dealers (with the effect that the price is set on a market basis), the valuation may be based on this secondary market. Securities traded on a regulated market are valued in the same way as securities listed on a stock exchange. Where investments are not listed on any stock exchange or traded on any regulated markets, these investments are valued in good faith based on information provided by any person whom the Board of Directors considers to be suitably qualified (“an Approved Person”). The Approved Persons include the Pricing Methodology & Valuation Committee of the Investment Manager and certain brokers. Where the Company enters into fully funded total return swap (“TRS”) transactions with a swap counterparty, pursuant to which the Company makes an initial payment equal to the estimated value of the underlying emerging market debt securities, loans or other financial instruments, the TRS are valued using the same rules as the underlying assets they represent. Fully funded TRS are recognised as investments and therefore disclosed in the schedules of investments. Investments in open-ended funds are valued on the basis of the last available NAV of the units or shares of such funds. e) Valuation of financial derivative instruments The value of derivative financial instruments not traded on stock exchanges or other regulated markets is determined on a fair and reasonable basis and consistently applied for each different variety of contracts as follows: Forward currency contracts are valued on the marked-to-market value of the position based on the forward rate prevailing on the valuation date of the assets. The forward rate applied is based on WM/Reuters (4pm GMT). Future contracts are valued using the last available price on the exchange where the contracts are traded. Interest rate swaps, currency swaps, swaptions and OTC options are valued based on daily counterparty prices verified against third party pricing agents. f) Realised gain/loss on sales of investments in securities of each Sub-Fund Realised gains or losses on the sale of investments in securities are determined on the basis of the average acquisition cost. Investments in securities are accounted for on a trade date basis and net of any applicable tax.

Ashmore SICAV – Unaudited Semi-Annual Report for the period ended 30 June 2013
183
Notes to the Consolidated Financial Statements (continued) 2- Principal accounting policies (continued) g) Foreign currency translation Assets and liabilities expressed in currencies other than the reference currency of each Sub-Fund were converted into the reference currency at the foreign exchange rate prevailing at 30 June 2013. Income and expenses in currencies other than the reference currency of each Sub-Fund were converted into the reference currency at the foreign exchange rate ruling at the transaction date. Realised and unrealised gains or losses on foreign currencies are accounted for in the consolidated statement of operations. The acquisition cost of investments expressed in currencies other than the reference currency of each Sub-Fund is converted into the reference currency at the foreign exchange rate prevailing at the date of acquisition. Principal exchange rates applied at 30 June 2013 are as follows:
US$ US Dollar = 3.673000 AED United Arab Emirates Dirhams
US$ US Dollar = 5.383750 ARS Argentine Peso
US$ US Dollar = 1.092478 AUD Australian Dollar
US$ US Dollar = 2.209050 BRL Brazilian Real
US$ US Dollar = 1.054950 CAD Canadian Dollar
US$ US Dollar = 0.946150 CHF Swiss Franc
US$ US Dollar = 505.945000 CLP Chilean Peso
US$ US Dollar = 6.134500 CNH Offshore Chinese Yuan Renminbi
US$ US Dollar = 6.137600 CNY Onshore Chinese Yuan Renminbi
US$ US Dollar = 1,931.250000 COP Colombian Peso
US$ US Dollar = 19.983050 CZK Czech Republic Koruna
US$ US Dollar = 0.769320 EUR Euro
US$ US Dollar = 0.659326 GBP Pound Sterling
US$ US Dollar = 2.040000 GHS Ghanaian Cedi
US$ US Dollar = 7.756350 HKD Hong Kong Dollar
US$ US Dollar = 226.591550 HUF Hungarian Forint
US$ US Dollar = 9,925.000000 IDR Indonesian Rupiah
US$ US Dollar = 3.640350 ILS Israel Shekel
US$ US Dollar = 59.425000 INR Indian Rupee
US$ US Dollar = 99.335000 JPY Japanese Yen
US$ US Dollar = 85.875000 KES Kenyan Shilling
US$ US Dollar = 1,142.050000 KRW South Korean Won
US$ US Dollar = 0.285250 KWD Kuwaiti Dinar
US$ US Dollar = 13.025850 MXN Mexican Peso
US$ US Dollar = 3.159500 MYR Malaysian Ringgit
US$ US Dollar = 162.530000 NGN Nigerian Naira
US$ US Dollar = 6.106050 NOK Norwegian Krone
US$ US Dollar = 2.782000 PEN Peruvian Nuevo Sol
US$ US Dollar = 43.200000 PHP Philippine Peso
US$ US Dollar = 99.500000 PKR Pakistani Rupee
US$ US Dollar = 3.331350 PLN Polish Zloty
US$ US Dollar = 3.640500 QAR Qatari Riyal
US$ US Dollar = 3.436650 RON New Romanian Leu
US$ US Dollar = 32.828000 RUB Russian Rouble
US$ US Dollar = 1.268300 SGD Singapore Dollar
US$ US Dollar = 31.015000 THB Thai Baht
US$ US Dollar = 1.929450 TRY New Turkish Lira
US$ US Dollar = 29.971000 TWD Taiwan Dollar
US$ US Dollar = 8.155500 UAH Ukrainian Hryvnia
US$ US Dollar = 20.425000 UYU Uruguayan Peso
US$ US Dollar = 21,205.000000 VND Vietnamese Dong
US$ US Dollar = 9.927200 ZAR South African Rand

Ashmore SICAV – Unaudited Semi-Annual Report for the period ended 30 June 2013
184
Notes to the Consolidated Financial Statements (continued) 2- Principal accounting policies (continued) h) Income and expenses
Allocation of accrued expenses Accrued expenses which can be allocated directly to a Sub-Fund are charged to the relevant Sub-Fund. Accrued expenses which cannot be allocated directly are divided among the Sub-Funds in proportion to the net assets of each Sub-Fund.
Income Interest income is accrued on a daily basis. Dividend income from quoted equity investments and collective investment schemes is shown net of withholding tax deducted at source and is recorded as income on the ex-dividend date.
Apart from Ashmore SICAV Emerging Markets Inflation Linked Bond Fund, all Ashmore SICAV Sub-Funds account for bond and bank interest, with the exception of non-performing assets, on an effective interest basis. Interest income on non-performing assets, pay-in-kind instruments (PIK) and PIK paired with profit participating notes (PIK/PPN) is recognised on receipt unless the Investment Manager deems it appropriate to recognise income on an accruals basis. Fee rebates on investments in other collective investment schemes are recognised on an accruals basis in revenue, unless it is the policy of the underlying fund to charge its fees to capital, in which case, fee rebates should be treated as capital refunds in the investing fund.
i) Repurchase agreements Securities sold under agreements to repurchase are treated as collateralised borrowing transactions. The securities continue to be carried on the statement of net assets at market value and the loans are carried at the amount at which the securities were sold under the agreement. The interest expense recognised under these agreements and the interest income on underlying securities are included in the statement of net assets and in the statement of operations and changes in net assets. Interest expenses are accrued on a daily basis.
Reverse repurchase agreements are securities purchased subject to a simultaneous agreement to sell those securities at an agreed later date at an agreed price. Reverse repurchase agreements (see note 12) are reported as receivables and are carried at cost.
Interest earned on reverse repurchase agreements is recognised as interest income over the term of the agreement using the straight-line method.
3- Expenses
Management fees The Investment Manager is entitled to receive from each Sub-Fund a management fee at an annual rate expressed as a percentage of the net asset value of any class of shares of a Sub-Fund and as determined in the Sub-Funds Appendix of the Prospectus.
The management fees are calculated on the basis of the average net asset value of the relevant class payable monthly in arrears. The rates applied are as follows:
Institutional class shares
Institutional II class shares
Retail class shares Z class shares
% % % %
Emerging Markets Debt Fund 0.95 - 1.50 0.95
Emerging Markets Sovereign Debt Fund 0.85 0.70* 1.40 0.85
Emerging Markets Sovereign Investment Grade Debt Fund 0.80 - 1.35 0.80
Turkish Debt Fund 0.95 - 1.75 0.95
Local Currency Fund 1.00 - 1.50 1.00
Emerging Markets Local Currency Bond Fund 0.95 - 1.50 0.95
Emerging Markets Local Markets Currency Fund 0.80 - 1.35 0.80
Emerging Markets Investment Grade Local Currency Fund 0.90 - 1.50 0.90
Emerging Markets Inflation Linked Bond Fund 0.85 - 1.45 0.85
Emerging Markets Total Return Fund 1.10 - 1.75 1.10
Emerging Markets Total Return Fund II 1.10 - 1.75 1.10
Emerging Markets Investment Grade Total Return Fund 0.85 - 1.40 0.85
Emerging Markets Corporate Debt Fund 1.15 1.00** 1.75 1.15
Emerging Markets Investment Grade Corporate Debt Fund 1.10 - 1.65 1.10

Ashmore SICAV – Unaudited Semi-Annual Report for the period ended 30 June 2013
185
Notes to the Consolidated Financial Statements (continued) 3- Expenses (continued)
Management fees (continued)
Institutional class shares
Institutional II class shares
Retail class shares Z class shares
% % % %
Emerging Markets Local Currency Corporate Debt Fund 1.35 - 1.95 1.35
Emerging Markets Asian Corporate Debt Fund 1.05 - 1.75 1.05
Emerging Markets Global Equity Fund 1.15 - 1.65 1.15
EM Equity Select Fund 1.00 - 1.50 1.00
Emerging Markets Global Small-Cap Equity Fund 1.50 - 1.95 1.50
Emerging Market Frontier Equity Fund 1.50 - 1.95 1.50
Brazil Equity Fund 1.10 - 1.80 1.10
* as per fee waiver agreement dated 15 April 2013, fee equals to 0.40%. ** as per fee waiver agreement dated 27 March 2013, fee equals to 0.40%.
The Investment Manager has appointed the following Sub-Managers, Ashmore Equities Investment Management (US) L.L.C. to act as Sub-Manager of Ashmore SICAV Emerging Markets Global Equity Fund, Ashmore SICAV Emerging Markets Global Small-Cap Equity Fund and Ashmore SICAV Emerging Markets Frontier Equity Fund. Ashmore Management Company Turkey Limited has been appointed to act as Sub-Manager of Ashmore SICAV Turkish Debt Fund, which has in turn sub-delegated these functions to Ashmore Portföy Yönetimi Anonim Sirketi. Ashmore Management Company Brazil Limited has been appointed to act as Sub-Manager of Ashmore SICAV Brazil Equity Fund, which has in turn sub-delegated these functions to Ashmore Brasil Gestora de Recursos Ltda.
The Sub-Manager is entitled to a management fee payable by the Investment Manager out of its own assets. 4- Custodian fees Prior to 1 January 2013, under the Custodian Agreement between Northern Trust Global Services Limited, Luxembourg Branch (the "Custodian") and the Company, the fees due to the Custodian were limited to a maximum of 0.02% per annum of the Company's net assets. Effective 1 January 2013, under the revised Custodian Agreement, the fees due to the Custodian are limited to 0.01% per annum of the Company's net assets. The Custodian is also entitled to reimbursement by the Company of reasonable out-of-pocket expenses incurred by it in performing its duties, including the fees and charges of correspondents and agents. 5- Management Company fees Prior to 1 January 2013, for the execution of its duties (which included the provision of administration services to the Fund), the Management Company of the Fund received fees out of the assets of the Fund, based on the average net asset value of the relevant Sub-Fund and paid monthly in arrears. The fees were calculated as follows:
- Management Company fees: 0.02% per annum - Fund Accounting fees: 0.04% per annum on the first US$500 million, 0.025% between US$500 million to US$1
billion and 0.01% above US$1 billion Effective 1 January 2013, the calculation of the administration fees for the Sub-Funds was amended to:
- Management Company fees: 0.015% per annum (services are capped at US$1million per annum for all Luxembourg Mangement Company services provided for Ashmore SICAV entities)
- Fund Accounting fees: 0.02% per annum 6- Other operating expenses
Other operating expenses represent other amounts paid by the Company relating to the operation of the Sub-Funds. They include legal fees, audit fees, Directors' fees, the cost of printing and distributing the prospectuses and the annual and half yearly reports, they also include fees in connection with obtaining or maintaining any registration or authorisation of the Company with any governmental agency or stock exchange as well as the cost of publication of shares, bank charges and other miscellaneous expenses.

Ashmore SICAV – Unaudited Semi-Annual Report for the period ended 30 June 2013
186
Notes to the Consolidated Financial Statements (continued) 7- Taxation Under Luxembourg law, the Company is not subject to any taxes on income or capital gains. However, the Company is subject to the “Taxe d’abonnement” or “Subscription tax” of 0.01% per annum for all net assets belonging to Institutional class shares and 0.05% per annum for all net assets belonging to Retail class shares. This tax is payable quarterly and calculated on the Net Asset Value of the Company at the end of the relevant calendar quarter. No subscription tax is paid on assets held by the Company in other Undertakings for Collective Investment already subject to that tax in Luxembourg.
The reduced tax rate of 0.01% of the net assets per annum is applicable to Classes which are only sold to and held by Institutional Investors.
8- Transaction fees
Transaction fees represent fees incurred by the Company in relation to the purchase and sale of transferable securities and loan agreements: and in relation to trade communication services. 9- Other assets and liabilities As at 30 June 2013, “Other Assets” comprise:
Emerging Markets Debt Fund
Emerging Markets Sovereign Debt
Fund
Emerging Markets Sovereign
Investment Grade Debt Fund Turkish Debt Fund
US$ US$ US$ US$ Receivable on sales of investments 43,793,206 1,118,166 - -
Accrued income on investments 22,254,813 2,280,084 919,710 1,138,047
Receivable on subscriptions 12,730 - - -
Prepaid fees 2,934 380 273 22,589
66,063,683 3,398,630 919,983 1,160,636
Local Currency Fund
Emerging Markets Local Currency
Bond Fund
Emerging Markets Local Markets
Currency Fund
Emerging Markets Investment Grade
Local Currency Fund
US$ US$ US$ US$ Receivable on sales of investments 2,099,302 36,025,648 - 3,167,315
Accrued income on investments 3,919,862 45,478,992 5,146 4,296,613
Receivable on subscriptions 160,343 4,299,517 - -
Prepaid fees 3,206 9,183 656 1,775
6,182,713 85,813,340 5,802 7,465,703
Emerging Markets Inflation Linked
Bond Fund Emerging Markets Total Return Fund
Emerging Markets Total Return Fund
II
Emerging Markets Investment Grade
Total Return Fund US$ US$ US$ US$
Receivable on sales of investments 498,357 2,197,723 1,446,369 325,554
Accrued income on investments 254,591 5,053,692 2,498,020 618,997
Receivable on subscriptions - 766 - -
Prepaid fees 919 2,344 1,470 1,725
753,867 7,254,525 3,945,859 946,276
Emerging Markets
Corporate Debt Fund
Emerging Markets Investment Grade
Corporate Debt Fund
Emerging Markets Local Currency Corporate Debt
Fund
Emerging Markets Asian Corporate
Debt Fund US$ US$ US$ -
Receivable on sales of investments 5,700,000 5,807,432 - 210,000
Accrued income on investments 62,400,794 1,090,204 2,771,194 414,717
Receivable on subscriptions 65,948,776 - 8,247 -
Prepaid fees 8,496 824 2,277 1,403
134,058,066 6,898,460 2,781,718 626,120

Ashmore SICAV – Unaudited Semi-Annual Report for the period ended 30 June 2013
187
Notes to the Consolidated Financial Statements (continued) 9- Other assets and liabilities As at 30 June 2013, “Other Assets” comprise:
Emerging Markets Global Equity Fund
EM Equity Select Fund
Emerging Markets Global Small-Cap
Equity Fund
Emerging Markets Frontier Equity
Fund
US$ US$ US$ US$ Receivable on sales of investments 115,931 - 113,147 324,896 Accrued income on investments 281,918 21,111 190,650 35,350 Receivable on subscriptions - - - 6,135 Prepaid fees 4,250 357 571 4,316
402,099 21,468 304,368 370,697
Brazil Equity Fund US$
Receivable on sales of investments 123,714 Accrued income on investments 18,710 Prepaid fees 2,494
144,918
As at 30 June 2013, “Other Liabilities” comprise:
Emerging Markets Debt Fund
Emerging Markets Sovereign Debt
Fund
Emerging Markets Sovereign
Investment Grade Debt Fund Turkish Debt Fund
US$ US$ US$ US$ Payable on purchases of investments 34,950,533 - 72,024 - Payable on redemptions 40,775,622 - - - Accrued management fees 819,242 53,028 13,218 37,367 Accrued audit fees 18,013 2,055 1,059 815 Accrued management company fees 24,710 2,131 488 3,000 Accrued custody fees 47,941 4,565 740 2,549 Accrued other budgeted expenses 182,080 31,385 8,825 7,821 Accrued subscription tax 28,787 3,025 386 1,300 Accrued bank interest payable 278 - - - VAT 43,084 1,038 168 -
76,890,290 97,227 96,908 52,852
Local Currency Fund
Emerging Markets Local Currency
Bond Fund
Emerging Markets Local Markets
Currency Fund
Emerging Markets Investment Grade
Local Currency Fund
US$ US$ US$ US$ Payable on purchases of investments 49,917,719 31,921,442 - 2,939,109 Payable on redemptions 852,225 11,575,998 - 212,587 Accrued management fees 1,189,692 2,031,685 7,761 222,715 Accrued audit fees 23,816 45,899 233 5,571 Accrued management company fees 33,593 73,439 368 7,569 Accrued custody fees 71,647 140,312 692 16,357 Accrued other budgeted expenses 179,479 346,772 8,855 48,190 Accrued subscription tax 52,830 71,245 385 8,330 Accrued bank interest payable - 5,369 39 615 VAT 10,248 20,607 194 3,499
52,331,249 46,232,768 18,527 3,464,542
Emerging Markets
Inflation Linked Bond Fund
Emerging Markets Total Return Fund
Emerging Markets Total Return Fund
II
Emerging Markets Investment Grade
Total Return Fund US$ US$ US$ US$
Payable on purchases of investments - 1,418,665 777,235 214,952 Accrued management fees 31,962 248,160 153,959 29,717 Accrued audit fees 846 5,169 3,001 735 Accrued management company fees 1,356 9,232 2,938 1,030 Accrued custody fees 2,750 16,664 8,223 2,106 Accrued other budgeted expenses 17,384 67,025 25,705 12,780 Accrued subscription tax 1,455 9,346 3,830 1,089 Accrued bank interest payable - 760 - - VAT 514 1,670 - -
56,267 1,776,691 974,891 262,409

Ashmore SICAV – Unaudited Semi-Annual Report for the period ended 30 June 2013
188
Notes to the Consolidated Financial Statements (continued) 9- Other assets and liabilities (continued) As at 30 June 2013, “Other Liabilities” comprise:
Emerging Markets
Corporate Debt Fund
Emerging Markets Investment Grade
Corporate Debt Fund
Emerging Markets Local Currency Corporate Debt
Fund
Emerging Markets Asian Corporate
Debt Fund US$ US$ US$ US$
Payable on purchases of investments 29,771,473 7,188,258 1,665,000 2,519,457 Payable on redemptions 2,161,371 - 53,380 - Accrued management fees 3,056,278 66,091 164,015 20,892 Accrued audit fees 56,236 1,311 2,831 464 Accrued management company fees 51,848 1,764 3,513 568 Accrued custody fees 122,859 3,747 7,313 1,076 Accrued other budgeted expenses 317,779 20,431 44,086 6,911 Accrued subscription tax 81,205 1,889 4,341 555 Accrued bank interest payable 190 - - - VAT 20,275 471 1,243 -
35,639,514 7,283,962 1,945,722 2,549,923
Emerging Markets Global Equity Fund
EM Equity Select Fund
Emerging Markets Global Small-Cap
Equity Fund
Emerging Markets Frontier Equity
Fund US$ US$ US$ US$
Payable on purchases of investments 143,407 - 704,854 73,081 Payable on redemptions - - 70,759 - Accrued management fees 28,217 21,526 136,901 17,786 Accrued audit fees 612 476 1,970 273 Accrued management company fees 1,286 902 2,928 321 Accrued custody fees 1,931 1,464 5,534 716 Accrued other budgeted expenses 5,929 8,071 28,606 2,171 Accrued subscription tax 1,117 487 3,130 285 Accrued bank interest payable - 28 1,488 10 VAT 528 192 1,032 62
183,027 33,146 957,202 94,705
Brazil Equity
Fund US$
Payable on purchases of investments 114,605 Accrued management fees 2,677 Accrued audit fees 63 Accrued management company fees 280 Accrued custody fees 217 Accrued other budgeted expenses 5,169 Accrued subscription tax 115
123,126

Ashmore SICAV – Unaudited Semi-Annual Report for the period ended 30 June 2013
189
Notes to the Consolidated Financial Statements (continued) 10- Financial derivative investments Ashmore SICAV Emerging Markets Debt Fund Open financial derivative investments as at 30 June 2013 are detailed below:
Forward currency contracts To receive To pay Rate Date Unrealised gain (US$)
CNY 33,705,350 US$ 5,434,594 6.20 23/08/2013 1,886
MXN 34,623,996 US$ 2,640,000 13.12 23/08/2013 6,725
US$ 26 AUD 28 1.08 19/07/2013 -
US$ 62,687,348 BRL 127,144,842 2.03 02/08/2013 5,452,304
US$ 247,351 CHF 233,097 0.94 01/07/2013 988
US$ 783,666 CHF 735,876 0.94 19/07/2013 5,821
US$ 5,452,264 CNY 33,705,350 6.18 23/08/2013 15,784
US$ 290,367 EUR 223,314 0.77 02/07/2013 92
US$ 9,128,631 EUR 6,973,487 0.76 19/07/2013 63,676
US$ 32,402,311 EUR 24,765,341 0.76 22/07/2013 209,035
US$ 44,432 GBP 28,967 0.65 01/07/2013 498
US$ 19,222,847 GBP 12,467,183 0.65 19/07/2013 315,544
US$ 2,355,789 GBP 1,528,651 0.65 22/07/2013 37,537
US$ 3,869,119 MXN 47,278,247 12.22 26/07/2013 245,975
US$ 65,920,999 MXN 849,721,675 12.89 23/08/2013 966,644
US$ 389,112 NOK 2,376,320 6.11 19/07/2013 111
US$ 4,612,533 RUB 147,400,425 31.96 30/08/2013 167,223
Unrealised gain on forward currency contracts 7,489,843
Total unrealised gain on financial derivative investments 7,489,843
Forward currency contracts To receive To pay Rate Date Unrealised loss (US$)
AUD 507 US$ 480 1.06 19/07/2013 (16)
BRL 31,336,610 US$ 15,534,707 2.02 04/09/2013 (1,524,918)
CHF 230,676 US$ 244,697 0.94 01/07/2013 (892)
CHF 7,951,842 US$ 8,638,020 0.92 19/07/2013 (232,669)
EUR 219,492 US$ 285,405 0.77 02/07/2013 (99)
EUR 108,726,905 US$ 145,680,165 0.75 19/07/2013 (4,344,194)
EUR 6,454,928 US$ 8,434,921 0.77 22/07/2013 (43,949)
GBP 33,953 US$ 52,079 0.65 01/07/2013 (583)
GBP 192,818,491 US$ 301,633,753 0.64 19/07/2013 (9,211,830)
MXN 296,233,722 US$ 24,155,036 12.26 26/07/2013 (1,453,318)
NOK 38,225,972 US$ 6,653,732 5.75 19/07/2013 (396,189)
RUB 136,256,263 US$ 4,257,276 32.01 21/08/2013 (141,231)
US$ 14,364,851 RUB 474,808,593 33.05 31/07/2013 (33,486)
Unrealised (loss) on forward currency contracts (17,383,374)
Total unrealised (loss) on financial derivative investments (17,383,374)
Ashmore SICAV Emerging Markets Sovereign Debt Fund Open financial derivative investments as at 30 June 2013 are detailed below:
Forward currency contracts To receive To pay Rate Date Unrealised gain (US$)
US$ 246,813 GBP 160,012 0.65 19/07/2013 4,145
US$ 3,259,834 JPY 318,622,719 97.74 19/07/2013 52,121
Unrealised gain on forward currency contracts 56,266
Total unrealised gain on financial derivative investments 56,266

Ashmore SICAV – Unaudited Semi-Annual Report for the period ended 30 June 2013
190
Notes to the Consolidated Financial Statements (continued) 10- Financial derivative investments (continued) Ashmore SICAV Emerging Markets Sovereign Debt Fund (continued) Open financial derivative investments as at 30 June 2013 are detailed below: (continued)
Forward currency contracts To receive To pay Rate Date Unrealised loss (US$)
GBP 2,778,638 US$ 4,346,445 0.64 19/07/2013 (132,458)
JPY 5,512,904,045 US$ 58,010,708 95.03 19/07/2013 (2,509,910)
Unrealised (loss) on forward currency contracts (2,642,368)
Total unrealised (loss) on financial derivative investments (2,642,368)
Ashmore SICAV Emerging Markets Sovereign Investment Grade Debt Fund Open financial derivative investments as at 30 June 2013 are detailed below:
Forward currency contracts To receive To pay Rate Date Unrealised gain (US$)
US$ 22,191 EUR 16,976 0.76 22/07/2013 123
Unrealised gain on forward currency contracts 123
Total unrealised gain on financial derivative investments 123
Ashmore SICAV Turkish Debt Fund Open financial derivative investments as at 30 June 2013 are detailed below:
Forward currency contracts To receive To pay Rate Date Unrealised gain (US$)
US$ 3,000,000 TRY 5,628,966 1.88 02/07/2013 82,606
Unrealised gain on forward currency contracts 82,606
Total unrealised gain on financial derivative investments 82,606
Forward currency contracts To receive To pay Rate Date Unrealised loss (US$)
TRY 5,697,132 US$ 3,000,000 1.90 02/07/2013 (47,277)
Unrealised (loss) on forward currency contracts (47,277)
Total unrealised (loss) on financial derivative investments (47,277)
Ashmore SICAV Local Currency Fund Open financial derivative investments as at 30 June 2013 are detailed below:
Forward currency contracts To receive To pay Rate Date Unrealised gain (US$)
ARS 63,705,110 US$ 11,351,000 5.61 18/07/2013 364,547
ARS 9,056,233 US$ 1,410,000 6.42 18/09/2013 175,027
ARS 10,032,300 US$ 1,570,000 6.39 23/09/2013 177,458
ARS 10,956,120 US$ 1,680,000 6.52 25/09/2013 224,702
ARS 30,927,100 US$ 5,050,000 6.12 27/09/2013 316,263
ARS 17,081,406 US$ 2,610,000 6.54 30/09/2013 345,269
ARS 20,766,900 US$ 3,190,000 6.51 03/10/2013 392,466
ARS 63,494,000 US$ 10,600,000 5.99 17/10/2013 178,032
BRL 9,076,800 US$ 4,000,000 2.27 02/08/2013 85,978
BRL 41,804,514 US$ 18,230,567 2.29 02/10/2013 366,055

Ashmore SICAV – Unaudited Semi-Annual Report for the period ended 30 June 2013
191
Notes to the Consolidated Financial Statements (continued) 10- Financial derivative investments (continued) Ashmore SICAV Local Currency Fund Open financial derivative investments as at 30 June 2013 are detailed below: (continued)
Forward currency contracts (continued)
To receive To pay Rate Date Unrealised gain (US$)
CHF 24,068 US$ 25,372 0.95 02/07/2013 66
CNH 37,191,495 US$ 5,759,384 6.46 17/07/2013 296,651
CNH 166,890,645 US$ 25,233,527 6.61 13/04/2015 1,112,792
CNH 105,885,160 US$ 16,134,542 6.56 04/05/2015 568,250
CNH 37,191,495 US$ 5,597,589 6.64 17/07/2015 255,691
CZK 83,022,442 US$ 4,100,961 20.24 30/08/2013 54,844
HUF 7,173,886,822 US$ 30,817,359 232.79 31/07/2013 761,760
HUF 898,735,212 US$ 3,938,287 228.20 30/08/2013 5,808
IDR 532,177,144,457 US$ 52,712,268 10,095.89 17/07/2013 412,848
ILS 89,491,548 US$ 24,047,779 3.72 29/08/2013 506,427
INR 534,857,800 US$ 8,928,438 59.90 17/07/2013 39,663
MXN 80,990,462 US$ 6,030,563 13.43 26/07/2013 176,099
MYR 63,500,000 US$ 19,782,004 3.21 15/07/2013 273,034
US$ 28,180,000 BRL 58,485,214 2.08 02/07/2013 1,704,721
US$ 60,372,011 BRL 122,448,790 2.03 02/08/2013 5,250,925
US$ 12,784,197 BRL 26,644,822 2.08 04/09/2013 871,985
US$ 100,578 CHF 94,784 0.94 01/07/2013 399
US$ 279,517 CHF 261,323 0.93 19/07/2013 3,291
US$ 8,336,503 CLP 4,181,590,000 501.60 06/08/2013 116,273
US$ 11,444,730 CLP 5,797,900,000 506.60 09/09/2013 102,077
US$ 17,090,000 CNY 105,813,317 6.19 12/08/2013 10,707
US$ 38,270,000 CNY 238,306,907 6.23 16/12/2013 44,475
US$ 8,980,742 COP 16,933,189,000 1,885.50 26/07/2013 229,433
US$ 10,579,840 CZK 209,457,467 19.80 31/07/2013 96,958
US$ 136,152 EUR 104,715 0.77 01/07/2013 38
US$ 223,505 EUR 171,891 0.77 02/07/2013 72
US$ 5,881,631 EUR 4,447,637 0.76 19/07/2013 100,071
US$ 7,150,329 EUR 5,470,000 0.76 22/07/2013 39,698
US$ 84,367 GBP 55,003 0.65 01/07/2013 944
US$ 12,124 GBP 7,973 0.66 02/07/2013 31
US$ 7,538,230 GBP 4,904,604 0.65 19/07/2013 100,075
US$ 4,110,000 HUF 933,616,092 227.16 31/07/2013 265
US$ 3,360,000 ILS 12,197,714 3.63 29/08/2013 13,257
US$ 35,030,000 INR 2,024,344,678 57.79 17/07/2013 1,087,282
US$ 5,900,000 INR 335,963,700 56.94 30/08/2013 330,764
US$ 9,307,580 KRW 10,505,186,391 1,128.67 24/07/2013 135,575
US$ 71,208,982 MXN 889,052,259 12.49 26/07/2013 3,076,924
US$ 16,080,000 MYR 49,925,496 3.10 15/07/2013 312,162
US$ 360,000 MYR 1,103,256 3.06 30/08/2013 13,854
US$ 1,870,000 PLN 6,238,569 3.34 31/07/2013 261
US$ 740,000 PLN 2,421,003 3.27 30/08/2013 15,799
US$ 4,488,646 RON 15,330,224 3.42 30/08/2013 54,515
US$ 3,212,649 RUB 102,822,450 32.01 21/08/2013 106,576
US$ 1,780,000 RUB 56,883,255 31.96 30/08/2013 64,511
US$ 4,300,000 SGD 5,355,611 1.25 31/07/2013 77,089
US$ 1,900,000 SGD 2,402,930 1.26 30/08/2013 5,212
US$ 32,932,275 THB 999,361,100 30.35 12/07/2013 721,251
US$ 480,000 TRY 897,753 1.87 29/08/2013 18,638
US$ 262,076 TRY 500,000 1.91 27/09/2013 6,250
US$ 2,600,000 TWD 77,896,000 29.96 24/07/2013 1,659
ZAR 123,672,809 US$ 11,981,045 10.32 30/08/2013 377,103
Unrealised gain on forward currency contracts 22,180,850

Ashmore SICAV – Unaudited Semi-Annual Report for the period ended 30 June 2013
192
Notes to the Consolidated Financial Statements (continued) 10- Financial derivative investments (continued) Ashmore SICAV Local Currency Fund (continued) Open financial derivative investments as at 30 June 2013 are detailed below: (continued)
Interest rate swap contracts
Notional /
Nominal
Currency Paying Receiving Maturity
date Counterparty
Commitment
(US$) Unrealised gain
(US$)
Malaysia
20,096,875 MYR 3.89% KLIBO3M 01/03/2022 Morgan Stanley 6,360,777 109,897
1,588,000 MYR 3.89% KLIBO3M 01/03/2022 Morgan Stanley 502,611 8,684
Singapore
3,970,742 SGD 1.82% SORF6M 25/10/2022 Barclays 3,130,759 194,196
1,343,266 SGD 1.17% SORF6M 14/12/2022 Barclays 1,059,107 78,588
7,303,588 SGD 1.82% SORF6M 14/06/2022 Barclays 5,758,565 317,889
Unrealised gain on interest rate swap contracts 709,254
Total unrealised gain on financial derivative investments 22,890,104
Forward currency contracts To receive To pay Rate Date Unrealised loss (US$)
BRL 100,289,728 US$ 47,130,000 2.13 02/07/2013 (1,730,517)
CHF 60,844,880 US$ 66,093,517 0.92 19/07/2013 (1,778,531)
CLP 7,334,437,500 US$ 14,750,000 497.25 17/07/2013 (281,295)
CLP 10,049,526,080 US$ 19,687,582 510.45 09/09/2013 (27,312)
CNY 943,368,555 US$ 152,586,375 6.18 12/08/2013 (317,563)
CNY 14,348,103 US$ 2,310,000 6.21 16/12/2013 (8,498)
COP 18,538,232,389 US$ 9,721,150 1,907.00 26/07/2013 (140,332)
CZK 1,048,203,287 US$ 53,124,490 19.73 31/07/2013 (664,238)
EUR 23,164 US$ 30,118 0.77 01/07/2013 (8)
EUR 77,399 US$ 100,639 0.77 02/07/2013 (33)
EUR 67,923,128 US$ 91,015,591 0.75 19/07/2013 (2,721,150)
GBP 51,473 US$ 78,952 0.65 01/07/2013 (883)
GBP 645,102,902 US$ 1,009,206,396 0.64 19/07/2013 (30,865,417)
HUF 305,815,312 US$ 1,360,000 224.86 30/08/2013 (17,931)
INR 6,708,557,766 US$ 117,098,707 57.29 17/07/2013 (4,614,562)
MXN 1,446,236,378 US$ 113,363,965 12.76 26/07/2013 (2,532,391)
MXN 278,376,996 US$ 21,668,788 12.85 23/08/2013 (389,116)
MYR 80,340,802 US$ 25,994,031 3.09 15/07/2013 (620,207)
MYR 47,365,669 US$ 15,820,000 2.99 12/08/2013 (944,142)
MYR 59,221,638 US$ 19,864,034 2.98 22/08/2013 (1,274,993)
PEN 32,096,996 US$ 12,176,402 2.64 26/07/2013 (658,767)
PHP 626,819,341 US$ 14,645,312 42.80 24/07/2013 (113,117)
PLN 45,956,348 US$ 13,956,589 3.29 31/07/2013 (183,174)
PLN 71,917,281 US$ 22,024,877 3.27 30/08/2013 (512,069)
RON 49,402,618 US$ 14,505,437 3.41 30/08/2013 (216,169)
RUB 3,383,288,979 US$ 105,765,238 31.99 30/08/2013 (3,731,813)
SGD 74,232,117 US$ 58,862,057 1.26 31/07/2013 (329,876)
SGD 74,350,880 US$ 59,277,501 1.25 30/08/2013 (649,438)
THB 2,175,278,138 US$ 71,992,811 30.22 12/07/2013 (1,880,079)
THB 820,200,588 US$ 27,142,608 30.22 23/07/2013 (722,527)
TRY 2,400,000 US$ 1,290,496 1.86 31/07/2013 (51,379)
TRY 3,597,451 US$ 1,923,195 1.87 29/08/2013 (74,437)
TWD 2,710,380,392 US$ 90,548,237 29.93 24/07/2013 (139,323)

Ashmore SICAV – Unaudited Semi-Annual Report for the period ended 30 June 2013
193
Notes to the Consolidated Financial Statements (continued) 10- Financial derivative investments (continued) Ashmore SICAV Local Currency Fund (continued) Open financial derivative investments as at 30 June 2013 are detailed below: (continued)
Forward currency contracts (continued)
To receive To pay Rate Date Unrealised loss (US$)
US$ 18,538,587 BRL 41,804,514 2.26 02/07/2013 (385,617)
US$ 34,628 CHF 32,848 0.95 02/07/2013 (90)
US$ 5,779,034 CNH 37,191,495 6.44 17/07/2013 (277,002)
US$ 25,660,000 CNH 166,890,645 6.50 13/04/2015 (686,319)
US$ 16,270,000 CNH 105,885,160 6.51 04/05/2015 (432,792)
US$ 5,610,000 CNH 37,191,495 6.63 17/07/2015 (243,280)
US$ 1,100,000 COP 2,132,900,000 1,939.00 26/07/2013 (2,313)
US$ 1,560,000 CZK 31,340,197 20.09 30/08/2013 (8,778)
US$ 1,314,660 HUF 301,600,000 229.41 31/07/2013 (12,970)
US$ 12,915,840 KRW 14,917,795,200 1,155.00 24/07/2013 (108,783)
US$ 36,330,496 MXN 487,662,537 13.42 26/07/2013 (1,041,269)
US$ 9,484,037 MYR 30,415,306 3.21 15/07/2013 (121,949)
US$ 12,427,199 MYR 39,913,678 3.21 12/08/2013 (108,256)
US$ 1,420,000 MYR 4,531,930 3.19 22/08/2013 (2,523)
US$ 13,870,000 RUB 456,669,750 32.93 22/07/2013 (856)
US$ 28,016,168 RUB 926,032,402 33.05 31/07/2013 (65,308)
US$ 1,280,000 THB 39,763,200 31.07 23/07/2013 (842)
US$ 1,400,000 TRY 2,718,940 1.94 31/07/2013 (3,786)
US$ 254,820 TRY 500,000 1.96 28/08/2013 (2,175)
US$ 14,780,000 ZAR 152,200,006 10.30 30/08/2013 (428,762)
Unrealised (loss) on forward currency contracts (62,124,957)
Interest rate swap contracts
Notional / Nominal
Currency Paying Receiving Maturity
date Counterparty Commitment
(US$) Unrealised (loss)
(US$)
Singapore
4,144,955 SGD SORF6M 2.76% 14/06/2032 Barclays 3,268,119 (243,343)
2,162,872 SGD SORF6M 2.60% 25/10/2032 Barclays 1,705,332 (169,893)
749,290 SGD SORF6M 2.54% 14/12/2032 Barclays 590,783 (66,492)
Unrealised (loss) on interest rate swap contracts (479,728)
Total unrealised (loss) on financial derivative investments (62,604,685)
Ashmore SICAV Emerging Markets Local Currency Bond Fund Open financial derivative investments as at 30 June 2013 are detailed below:
Forward currency contracts To receive To pay Rate Date Unrealised gain (US$)
ARS 18,305,151 US$ 2,850,000 6.42 18/09/2013 353,778
ARS 18,531,000 US$ 2,900,000 6.39 23/09/2013 327,789
ARS 20,347,080 US$ 3,120,000 6.52 25/09/2013 417,304
ARS 24,626,900 US$ 3,830,000 6.43 27/09/2013 443,095
ARS 31,872,202 US$ 4,870,000 6.54 30/09/2013 644,238
ARS 38,734,500 US$ 5,950,000 6.51 03/10/2013 732,029
BRL 175,831,825 US$ 77,974,202 2.25 02/07/2013 1,621,926
BRL 8,488,820 US$ 3,800,000 2.23 02/08/2013 21,295
CNH 115,419,595 US$ 17,873,598 6.46 17/07/2013 920,622
CNH 334,536,985 US$ 50,493,344 6.63 13/04/2015 2,318,593
CNH 238,615,960 US$ 36,374,384 6.56 04/05/2015 1,265,949
CNH 176,778,995 US$ 26,704,500 6.62 17/07/2015 1,117,369
CNY 59,616,000 US$ 9,200,000 6.48 17/07/2013 482,411

Ashmore SICAV – Unaudited Semi-Annual Report for the period ended 30 June 2013
194
Notes to the Consolidated Financial Statements (continued) 10- Financial derivative investments (continued) Ashmore SICAV Emerging Markets Local Currency Bond Fund (continued) Open financial derivative investments as at 30 June 2013 are detailed below (continued):
Forward currency contracts (continued)
To receive To pay Rate Date Unrealised gain (US$)
COP 11,623,930,769 US$ 6,013,415 1,933.00 08/07/2013 4,294
COP 11,623,930,769 US$ 6,004,872 1,935.75 26/07/2013 2,538
COP 11,674,112,540 US$ 6,008,293 1,943.00 06/08/2013 18,720
COP 11,704,154,004 US$ 6,008,293 1,948.00 09/09/2013 14,817
HUF 2,685,144,722 US$ 11,739,186 228.73 31/07/2013 80,698
HUF 4,724,151,416 US$ 20,701,386 228.20 30/08/2013 30,529
IDR 532,624,781,365 US$ 52,741,735 10,098.73 17/07/2013 428,067
INR 1,561,121,200 US$ 25,733,474 60.66 17/07/2013 442,254
MXN 176,511,009 US$ 13,151,294 13.42 26/07/2013 375,536
RUB 294,986,849 US$ 8,928,359 33.04 31/07/2013 16,971
THB 151,907,850 US$ 4,890,000 31.07 23/07/2013 3,215
TRY 25,272,461 US$ 13,020,000 1.94 31/07/2013 28,144
TRY 63,313,683 US$ 32,046,203 1.98 27/09/2013 348,477
US$ 193,398,232 BRL 411,233,789 2.13 02/07/2013 7,239,572
US$ 66,778,240 BRL 135,442,145 2.03 02/08/2013 5,808,114
US$ 30,354,006 BRL 63,263,819 2.08 04/09/2013 2,070,387
US$ 2,613,142 CHF 2,462,644 0.94 01/07/2013 10,337
US$ 2,751,010 CHF 2,592,831 0.94 19/07/2013 10,305
US$ 18,629,241 CLP 9,344,427,500 501.60 06/08/2013 259,830
US$ 6,570,646 CLP 3,256,740,500 495.65 07/08/2013 169,408
US$ 22,476,699 CLP 11,390,360,216 506.76 09/09/2013 193,304
US$ 72,530,000 CNY 451,633,584 6.23 16/12/2013 85,894
US$ 9,048,565 COP 17,061,069,600 1,885.50 26/07/2013 231,166
US$ 14,410,000 CZK 285,291,630 19.80 31/07/2013 131,786
US$ 4,712,320 EUR 3,589,581 0.76 19/07/2013 46,162
US$ 7,033 GBP 4,585 0.65 01/07/2013 79
US$ 23,940,488 GBP 15,532,114 0.65 19/07/2013 385,015
US$ 4,460,000 HUF 1,008,776,180 226.18 30/08/2013 32,991
US$ 110,835,605 INR 6,384,433,416 57.60 17/07/2013 3,786,137
US$ 13,516,079 KRW 15,255,192,480 1,128.67 24/07/2013 196,877
US$ 90,804,765 MXN 1,141,219,233 12.57 26/07/2013 3,348,021
US$ 35,290,000 MYR 109,653,088 3.11 15/07/2013 658,554
US$ 2,970,000 MYR 9,395,595 3.16 12/08/2013 19,181
US$ 1,522,863 PEN 4,160,310 2.73 26/07/2013 29,984
US$ 7,897,950 PHP 338,032,240 42.80 24/07/2013 61,002
US$ 70,628,735 PLN 231,881,285 3.28 31/07/2013 1,132,414
US$ 50,961,253 PLN 166,657,923 3.27 30/08/2013 1,108,425
US$ 1,890,000 RON 6,415,259 3.39 30/08/2013 34,443
US$ 6,454,339 RUB 206,574,363 32.01 21/08/2013 214,116
US$ 165,039,639 RUB 5,275,423,366 31.96 30/08/2013 5,943,115
US$ 58,431,978 THB 1,771,235,700 30.31 12/07/2013 1,342,187
US$ 2,194,964 THB 68,000,000 30.98 23/07/2013 4,567
US$ 478,292 TRY 923,819 1.93 31/07/2013 1,325
US$ 8,130,000 TRY 15,319,847 1.88 29/08/2013 257,012
US$ 14,071,499 ZAR 135,600,000 9.64 30/08/2013 521,512
Unrealised gain on forward currency contracts 47,793,880
Interest rate swap contracts
Notional /
Nominal
Currency Paying Receiving Maturity
date Counterparty Commitment
(US$) Unrealised gain (US$)
Brazil
46,531,663 BRL BZDIOVRA 11.03% 02/01/2017 HSBC 21,064,106 144,771

Ashmore SICAV – Unaudited Semi-Annual Report for the period ended 30 June 2013
195
Notes to the Consolidated Financial Statements (continued) 10- Financial derivative investments (continued) Ashmore SICAV Emerging Markets Local Currency Bond Fund (continued) Open financial derivative investments as at 30 June 2013 are detailed below: (continued)
Interest rate swap contracts (continued)
Notional / Nominal
Currency Paying Receiving Maturity
date Counterparty Commitment
(US$) Unrealised gain (US$)
Singapore
2,722,122 SGD 1.82% SORF6M 14/06/2022 Barclays 2,146,276 119,002
16,371,907 SGD 1.82% SORF6M 14/06/2022 Barclays 12,908,545 712,588
2,745,674 SGD 1.72% SORF6M 16/07/2022 Barclays 2,164,846 131,581
4,222,644 SGD 1.81% SORF6M 16/07/2022 Barclays 3,329,373 185,431
4,758,231 SGD 1.71% SORF6M 14/12/2022 Barclays 3,751,660 278,381
Unrealised gain on interest rate swap contracts 1,571,754
Total unrealised gain on financial derivative investments 49,365,634
Forward currency contracts To receive To pay Rate Date Unrealised loss (US$)
BRL 235,401,963 US$ 110,490,000 2.13 02/07/2013 (3,927,467)
BRL 330,262,468 US$ 161,080,927 2.05 04/09/2013 (13,429,109)
CHF 2,438,629 US$ 2,586,856 0.94 01/07/2013 (9,433)
CHF 2,592,831 US$ 2,816,571 0.92 19/07/2013 (75,866)
CLP 13,927,972,500 US$ 28,010,000 497.25 17/07/2013 (534,177)
COP 18,097,983,359 US$ 9,477,341 1,909.61 26/07/2013 (124,050)
CZK 286,284,225 US$ 14,846,325 19.28 31/07/2013 (518,434)
EUR 41,242,500 US$ 55,261,302 0.75 19/07/2013 (1,649,468)
GBP 4,585 US$ 7,032 0.65 01/07/2013 (78)
GBP 239,526,426 US$ 374,710,117 0.64 19/07/2013 (11,452,538)
HUF 390,290,000 US$ 1,740,505 224.24 31/07/2013 (22,467)
IDR 79,039,500,000 US$ 7,900,000 10,005.00 17/07/2013 (9,803)
INR 2,170,858,381 US$ 37,374,036 58.08 17/07/2013 (974,684)
INR 132,963,000 US$ 2,300,000 57.81 30/08/2013 (95,886)
MXN 1,671,359,440 US$ 135,049,650 12.38 26/07/2013 (6,965,887)
MXN 928,656,499 US$ 72,182,276 12.87 23/08/2013 (1,193,992)
MYR 114,147,180 US$ 36,618,429 3.12 15/07/2013 (567,626)
MYR 129,928,610 US$ 43,110,000 3.01 12/08/2013 (2,304,084)
MYR 223,271,674 US$ 74,889,454 2.98 22/08/2013 (4,806,860)
MYR 16,549,650 US$ 5,330,000 3.11 30/08/2013 (137,556)
PEN 50,821,350 US$ 19,219,177 2.64 26/07/2013 (982,524)
PLN 80,510,764 US$ 24,653,233 3.27 31/07/2013 (523,637)
PLN 205,012,948 US$ 61,855,222 3.31 30/08/2013 (529,153)
RON 4,838,659 US$ 1,406,288 3.44 31/07/2013 (2,327)
RON 95,197,250 US$ 27,918,917 3.41 30/08/2013 (383,958)
RUB 359,870,416 US$ 10,991,598 32.74 30/08/2013 (138,605)
THB 2,813,903,141 US$ 93,969,014 29.95 12/07/2013 (3,272,365)
THB 1,249,944,258 US$ 41,121,441 30.40 23/07/2013 (858,571)
TRY 62,311,419 US$ 33,458,489 1.86 31/07/2013 (1,287,171)
TRY 44,996,341 US$ 24,113,795 1.87 29/08/2013 (989,826)
US$ 750,000 ARS 4,432,500 5.91 27/09/2013 (19,098)
US$ 76,678,656 BRL 175,831,825 2.29 02/10/2013 (1,539,644)
US$ 27,264,348 CNH 175,035,595 6.42 17/07/2013 (1,237,375)
US$ 51,337,427 CNH 334,536,985 6.52 13/04/2015 (1,474,509)
US$ 36,570,000 CNH 238,615,960 6.52 04/05/2015 (1,070,333)
US$ 17,410,000 CNH 115,419,595 6.63 17/07/2015 (754,991)
US$ 9,200,000 CNY 61,359,400 6.67 17/07/2015 (430,338)
US$ 6,013,415 COP 11,623,930,769 1,933.00 08/07/2013 (4,294)
US$ 11,575,478 HUF 2,694,623,028 232.79 31/07/2013 (286,129)
US$ 2,270,000 IDR 23,301,550,000 10,265.00 17/07/2013 (56,102)
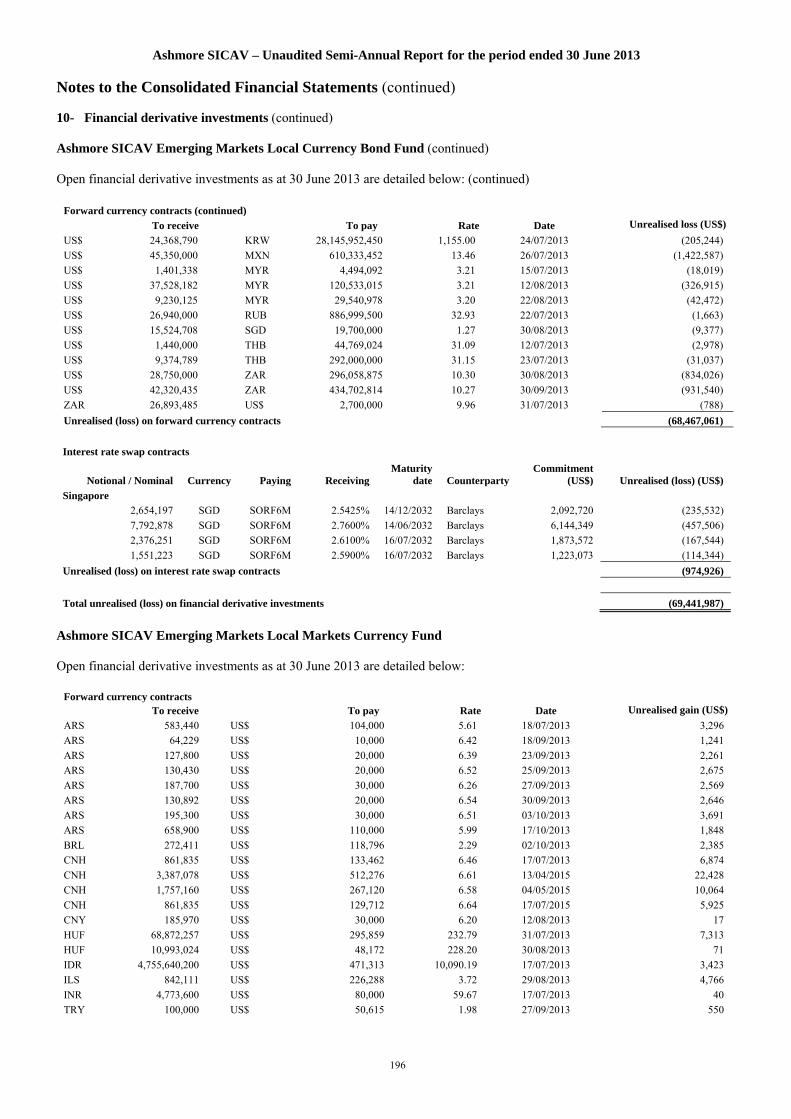
Ashmore SICAV – Unaudited Semi-Annual Report for the period ended 30 June 2013
196
Notes to the Consolidated Financial Statements (continued) 10- Financial derivative investments (continued) Ashmore SICAV Emerging Markets Local Currency Bond Fund (continued) Open financial derivative investments as at 30 June 2013 are detailed below: (continued)
Forward currency contracts (continued)
To receive To pay Rate Date Unrealised loss (US$)
US$ 24,368,790 KRW 28,145,952,450 1,155.00 24/07/2013 (205,244)
US$ 45,350,000 MXN 610,333,452 13.46 26/07/2013 (1,422,587)
US$ 1,401,338 MYR 4,494,092 3.21 15/07/2013 (18,019)
US$ 37,528,182 MYR 120,533,015 3.21 12/08/2013 (326,915)
US$ 9,230,125 MYR 29,540,978 3.20 22/08/2013 (42,472)
US$ 26,940,000 RUB 886,999,500 32.93 22/07/2013 (1,663)
US$ 15,524,708 SGD 19,700,000 1.27 30/08/2013 (9,377)
US$ 1,440,000 THB 44,769,024 31.09 12/07/2013 (2,978)
US$ 9,374,789 THB 292,000,000 31.15 23/07/2013 (31,037)
US$ 28,750,000 ZAR 296,058,875 10.30 30/08/2013 (834,026)
US$ 42,320,435 ZAR 434,702,814 10.27 30/09/2013 (931,540)
ZAR 26,893,485 US$ 2,700,000 9.96 31/07/2013 (788)
Unrealised (loss) on forward currency contracts (68,467,061)
Interest rate swap contracts
Notional / Nominal
Currency Paying Receiving Maturity
date Counterparty Commitment
(US$) Unrealised (loss) (US$)
Singapore
2,654,197 SGD SORF6M 2.5425% 14/12/2032 Barclays 2,092,720 (235,532)
7,792,878 SGD SORF6M 2.7600% 14/06/2032 Barclays 6,144,349 (457,506)
2,376,251 SGD SORF6M 2.6100% 16/07/2032 Barclays 1,873,572 (167,544)
1,551,223 SGD SORF6M 2.5900% 16/07/2032 Barclays 1,223,073 (114,344)
Unrealised (loss) on interest rate swap contracts (974,926)
Total unrealised (loss) on financial derivative investments (69,441,987)
Ashmore SICAV Emerging Markets Local Markets Currency Fund Open financial derivative investments as at 30 June 2013 are detailed below:
Forward currency contracts To receive To pay Rate Date Unrealised gain (US$)
ARS 583,440 US$ 104,000 5.61 18/07/2013 3,296
ARS 64,229 US$ 10,000 6.42 18/09/2013 1,241
ARS 127,800 US$ 20,000 6.39 23/09/2013 2,261
ARS 130,430 US$ 20,000 6.52 25/09/2013 2,675
ARS 187,700 US$ 30,000 6.26 27/09/2013 2,569
ARS 130,892 US$ 20,000 6.54 30/09/2013 2,646
ARS 195,300 US$ 30,000 6.51 03/10/2013 3,691
ARS 658,900 US$ 110,000 5.99 17/10/2013 1,848
BRL 272,411 US$ 118,796 2.29 02/10/2013 2,385
CNH 861,835 US$ 133,462 6.46 17/07/2013 6,874
CNH 3,387,078 US$ 512,276 6.61 13/04/2015 22,428
CNH 1,757,160 US$ 267,120 6.58 04/05/2015 10,064
CNH 861,835 US$ 129,712 6.64 17/07/2015 5,925
CNY 185,970 US$ 30,000 6.20 12/08/2013 17
HUF 68,872,257 US$ 295,859 232.79 31/07/2013 7,313
HUF 10,993,024 US$ 48,172 228.20 30/08/2013 71
IDR 4,755,640,200 US$ 471,313 10,090.19 17/07/2013 3,423
ILS 842,111 US$ 226,288 3.72 29/08/2013 4,766
INR 4,773,600 US$ 80,000 59.67 17/07/2013 40
TRY 100,000 US$ 50,615 1.98 27/09/2013 550
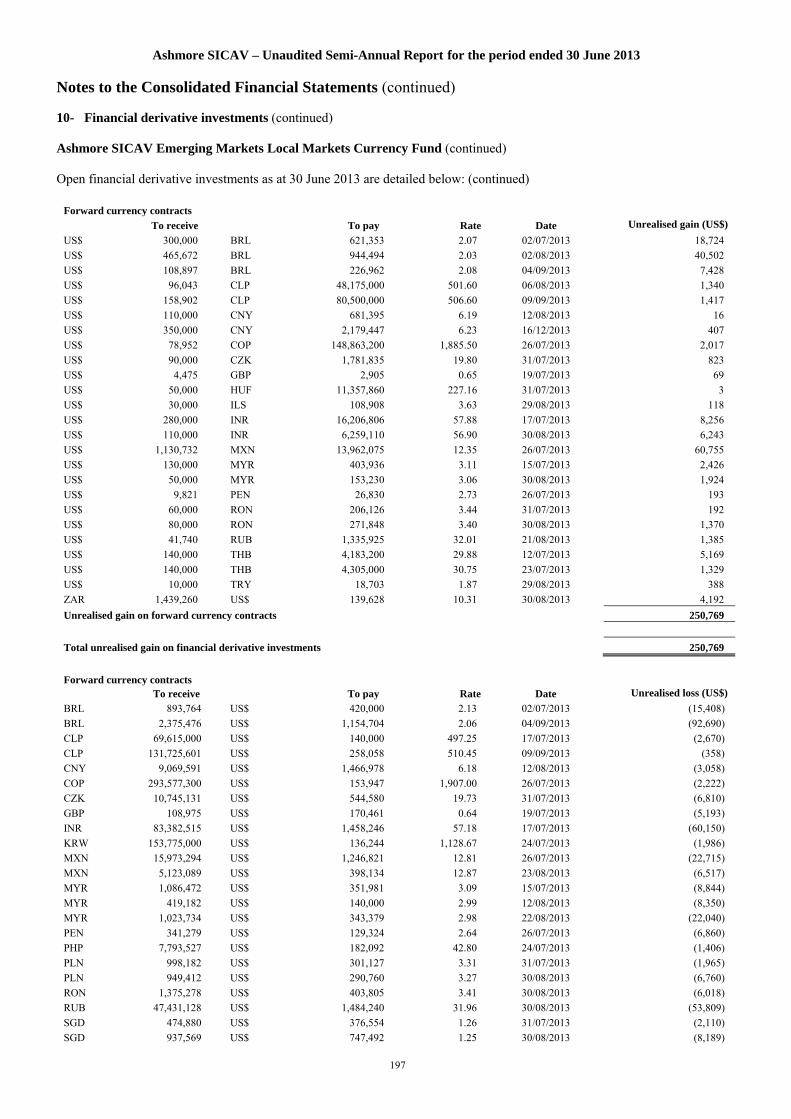
Ashmore SICAV – Unaudited Semi-Annual Report for the period ended 30 June 2013
197
Notes to the Consolidated Financial Statements (continued) 10- Financial derivative investments (continued) Ashmore SICAV Emerging Markets Local Markets Currency Fund (continued) Open financial derivative investments as at 30 June 2013 are detailed below: (continued)
Forward currency contracts
To receive To pay Rate Date Unrealised gain (US$)
US$ 300,000 BRL 621,353 2.07 02/07/2013 18,724
US$ 465,672 BRL 944,494 2.03 02/08/2013 40,502
US$ 108,897 BRL 226,962 2.08 04/09/2013 7,428
US$ 96,043 CLP 48,175,000 501.60 06/08/2013 1,340
US$ 158,902 CLP 80,500,000 506.60 09/09/2013 1,417
US$ 110,000 CNY 681,395 6.19 12/08/2013 16
US$ 350,000 CNY 2,179,447 6.23 16/12/2013 407
US$ 78,952 COP 148,863,200 1,885.50 26/07/2013 2,017
US$ 90,000 CZK 1,781,835 19.80 31/07/2013 823
US$ 4,475 GBP 2,905 0.65 19/07/2013 69
US$ 50,000 HUF 11,357,860 227.16 31/07/2013 3
US$ 30,000 ILS 108,908 3.63 29/08/2013 118
US$ 280,000 INR 16,206,806 57.88 17/07/2013 8,256
US$ 110,000 INR 6,259,110 56.90 30/08/2013 6,243
US$ 1,130,732 MXN 13,962,075 12.35 26/07/2013 60,755
US$ 130,000 MYR 403,936 3.11 15/07/2013 2,426
US$ 50,000 MYR 153,230 3.06 30/08/2013 1,924
US$ 9,821 PEN 26,830 2.73 26/07/2013 193
US$ 60,000 RON 206,126 3.44 31/07/2013 192
US$ 80,000 RON 271,848 3.40 30/08/2013 1,370
US$ 41,740 RUB 1,335,925 32.01 21/08/2013 1,385
US$ 140,000 THB 4,183,200 29.88 12/07/2013 5,169
US$ 140,000 THB 4,305,000 30.75 23/07/2013 1,329
US$ 10,000 TRY 18,703 1.87 29/08/2013 388
ZAR 1,439,260 US$ 139,628 10.31 30/08/2013 4,192
Unrealised gain on forward currency contracts 250,769
Total unrealised gain on financial derivative investments 250,769
Forward currency contracts To receive To pay Rate Date Unrealised loss (US$)
BRL 893,764 US$ 420,000 2.13 02/07/2013 (15,408)
BRL 2,375,476 US$ 1,154,704 2.06 04/09/2013 (92,690)
CLP 69,615,000 US$ 140,000 497.25 17/07/2013 (2,670)
CLP 131,725,601 US$ 258,058 510.45 09/09/2013 (358)
CNY 9,069,591 US$ 1,466,978 6.18 12/08/2013 (3,058)
COP 293,577,300 US$ 153,947 1,907.00 26/07/2013 (2,222)
CZK 10,745,131 US$ 544,580 19.73 31/07/2013 (6,810)
GBP 108,975 US$ 170,461 0.64 19/07/2013 (5,193)
INR 83,382,515 US$ 1,458,246 57.18 17/07/2013 (60,150)
KRW 153,775,000 US$ 136,244 1,128.67 24/07/2013 (1,986)
MXN 15,973,294 US$ 1,246,821 12.81 26/07/2013 (22,715)
MXN 5,123,089 US$ 398,134 12.87 23/08/2013 (6,517)
MYR 1,086,472 US$ 351,981 3.09 15/07/2013 (8,844)
MYR 419,182 US$ 140,000 2.99 12/08/2013 (8,350)
MYR 1,023,734 US$ 343,379 2.98 22/08/2013 (22,040)
PEN 341,279 US$ 129,324 2.64 26/07/2013 (6,860)
PHP 7,793,527 US$ 182,092 42.80 24/07/2013 (1,406)
PLN 998,182 US$ 301,127 3.31 31/07/2013 (1,965)
PLN 949,412 US$ 290,760 3.27 30/08/2013 (6,760)
RON 1,375,278 US$ 403,805 3.41 30/08/2013 (6,018)
RUB 47,431,128 US$ 1,484,240 31.96 30/08/2013 (53,809)
SGD 474,880 US$ 376,554 1.26 31/07/2013 (2,110)
SGD 937,569 US$ 747,492 1.25 30/08/2013 (8,189)

Ashmore SICAV – Unaudited Semi-Annual Report for the period ended 30 June 2013
198
Notes to the Consolidated Financial Statements (continued) 10- Financial derivative investments (continued) Ashmore SICAV Emerging Markets Local Markets Currency Fund (continued) Open financial derivative investments as at 30 June 2013 are detailed below: (continued)
Forward currency contracts To receive To pay Rate Date Unrealised loss (US$)
THB 21,936,598 US$ 728,572 30.11 12/07/2013 (21,520)
THB 7,255,939 US$ 239,701 30.27 23/07/2013 (5,975)
TRY 100,000 US$ 53,771 1.86 31/07/2013 (2,141)
TRY 6,872 US$ 3,683 1.87 29/08/2013 (151)
TWD 25,862,129 US$ 864,343 29.92 24/07/2013 (1,672)
US$ 120,803 BRL 272,411 2.26 02/07/2013 (2,513)
US$ 133,917 CNH 861,835 6.44 17/07/2013 (6,419)
US$ 520,000 CNH 3,387,078 6.51 13/04/2015 (14,704)
US$ 270,000 CNH 1,757,160 6.51 04/05/2015 (7,182)
US$ 130,000 CNH 861,835 6.63 17/07/2015 (5,639)
US$ 9,932 CZK 201,075 20.24 30/08/2013 (133)
US$ 133,139 KRW 153,775,000 1,155.00 24/07/2013 (1,121)
US$ 150,000 MXN 2,018,744 13.46 26/07/2013 (4,705)
US$ 169,053 MYR 542,152 3.21 15/07/2013 (2,174)
US$ 50,000 MYR 159,575 3.19 22/08/2013 (89)
US$ 130,000 RUB 4,280,250 32.93 22/07/2013 (8)
US$ 494,820 RUB 16,355,540 33.05 31/07/2013 (1,153)
US$ 10,000 TRY 19,421 1.94 31/07/2013 (27)
US$ 140,000 ZAR 1,441,678 10.30 30/08/2013 (4,061)
Unrealised (loss) on forward currency contracts (427,515)
Total unrealised (loss) on financial derivative investments (427,515)
Ashmore SICAV Emerging Markets Investment Grade Local Currency Fund Open financial derivative investments as at 30 June 2013 are detailed below:
Forward currency contracts To receive To pay Rate Date Unrealised gain (US$)
BRL 19,398,916 US$ 8,602,623 2.26 02/07/2013 178,941
CNH 21,811,055 US$ 3,377,607 6.46 17/07/2013 173,972
CNH 68,390,634 US$ 10,340,453 6.61 13/04/2015 456,087
CNH 37,225,760 US$ 5,664,895 6.57 04/05/2015 207,260
CNH 21,811,055 US$ 3,282,721 6.64 17/07/2015 149,951
INR 170,498,400 US$ 2,810,490 60.66 17/07/2013 48,301
MXN 21,133,856 US$ 1,574,617 13.42 26/07/2013 44,965
US$ 19,524,918 BRL 41,743,714 2.14 02/07/2013 628,237
US$ 3,167,995 BRL 6,425,446 2.03 02/08/2013 275,540
US$ 3,361,737 BRL 7,006,532 2.08 04/09/2013 229,297
US$ 2,650,778 CLP 1,329,630,000 501.60 06/08/2013 36,972
US$ 3,231,739 CLP 1,639,133,143 507.20 09/09/2013 25,041
US$ 8,670,000 CNY 53,988,003 6.23 16/12/2013 10,076
US$ 1,657,983 COP 3,126,127,200 1,885.50 26/07/2013 42,357
US$ 1,740,000 CZK 34,448,816 19.80 31/07/2013 15,913
US$ 206,669 EUR 157,859 0.76 19/07/2013 1,465
US$ 12,455,420 INR 717,811,461 57.63 17/07/2013 419,687
US$ 1,170,000 INR 66,574,170 56.90 30/08/2013 66,407
US$ 11,077,823 MXN 138,893,469 12.54 26/07/2013 433,794
US$ 4,270,000 MYR 13,267,744 3.11 15/07/2013 79,683
US$ 2,141,355 PHP 91,650,000 42.80 24/07/2013 16,539
US$ 4,725,741 RON 16,090,153 3.40 30/08/2013 71,807
US$ 651,846 RUB 20,862,663 32.01 21/08/2013 21,624
US$ 10,461,515 RUB 334,882,994 32.01 30/08/2013 362,094

Ashmore SICAV – Unaudited Semi-Annual Report for the period ended 30 June 2013
199
Notes to the Consolidated Financial Statements (continued) 10- Financial derivative investments (continued) Ashmore SICAV Emerging Markets Investment Grade Local Currency Fund (continued) Open financial derivative investments as at 30 June 2013 are detailed below: (continued)
Forward currency contracts (continued)
To receive To pay Rate Date Unrealised gain (US$)
US$ 7,186,917 THB 217,807,900 30.31 12/07/2013 166,616
US$ 322,789 THB 10,000,000 30.98 23/07/2013 672
US$ 2,428,268 ZAR 23,400,000 9.64 30/08/2013 89,995
ZAR 8,286,831 US$ 810,000 10.23 30/09/2013 14,522
Unrealised gain on forward currency contracts 4,267,815
Interest rate swap contracts
Notional / Nominal
Currency Paying Receiving Maturity
date Counterparty Commitment
(US$) Unrealised gain (US$)
Poland
10,300,000 PLN WIBO 6M 4.8550% 04/05/2017 Morgan Stanley 3,091,840 143,812
15,870,000 PLN WIBO 6M 4.8800% 15/05/2017 HSBC 4,763,834 227,166
15,870,000 PLN WIBO 6M 4.8800% 15/05/2017 HSBC 4,763,834 232,527
16,600,000 PLN WIBO 6M 4.9400% 04/05/2022 Morgan Stanley 4,982,965 329,541
Singapore
3,362,951 SGD 1.82% SORF6M 14/06/2022 Barclays 2,651,542 146,373
Unrealised gain on interest rate swap contracts 1,079,419
Total unrealised gain on financial derivative investments 5,347,234
Forward currency contracts To receive To pay Rate Date Unrealised loss (US$)
BRL 45,315,799 US$ 21,115,445 2.15 02/07/2013 (601,741)
BRL 20,558,240 US$ 10,144,464 2.03 04/09/2013 (953,406)
CLP 1,685,677,500 US$ 3,390,000 497.25 17/07/2013 (64,652)
COP 2,533,143,423 US$ 1,328,340 1,907.00 26/07/2013 (19,177)
CZK 34,661,064 US$ 1,797,460 19.28 31/07/2013 (62,750)
EUR 3,156,587 US$ 4,226,407 0.75 19/07/2013 (123,105)
INR 280,357,874 US$ 4,828,345 58.07 17/07/2013 (127,511)
KRW 2,834,476,128 US$ 2,511,342 1,128.67 24/07/2013 (36,581)
MXN 153,679,137 US$ 12,466,292 12.33 26/07/2013 (689,171)
MXN 233,338,748 US$ 18,118,955 12.88 23/08/2013 (282,094)
MYR 9,882,032 US$ 3,184,198 3.10 15/07/2013 (63,182)
MYR 11,347,414 US$ 3,790,000 2.99 12/08/2013 (226,184)
MYR 49,249,697 US$ 16,519,260 2.98 22/08/2013 (1,060,307)
PEN 3,080,274 US$ 1,164,611 2.64 26/07/2013 (59,290)
PLN 17,447,801 US$ 5,298,588 3.29 31/07/2013 (69,369)
PLN 36,315,720 US$ 11,120,783 3.27 30/08/2013 (257,565)
RON 15,563,808 US$ 4,509,288 3.45 30/08/2013 (7,595)
RUB 119,488,878 US$ 3,679,252 32.48 30/08/2013 (75,699)
THB 418,143,851 US$ 13,876,662 30.13 12/07/2013 (399,210)
THB 155,234,141 US$ 5,110,875 30.37 23/07/2013 (110,515)
US$ 10,164,159 BRL 22,971,000 2.26 02/07/2013 (234,428)
US$ 8,459,690 BRL 19,398,916 2.29 02/10/2013 (169,864)
US$ 3,389,130 CNH 21,811,055 6.44 17/07/2013 (162,448)
US$ 10,500,000 CNH 68,390,634 6.51 13/04/2015 (296,540)
US$ 5,720,000 CNH 37,225,760 6.51 04/05/2015 (152,155)
US$ 3,290,000 CNH 21,811,055 6.63 17/07/2015 (142,672)
US$ 3,097,830 KRW 3,577,993,650 1,155.00 24/07/2013 (26,091)
US$ 3,595,386 MXN 48,126,435 13.39 26/07/2013 (92,758)
US$ 3,533,039 MYR 11,347,414 3.21 12/08/2013 (30,777)
US$ 1,736,880 MYR 5,581,202 3.21 22/08/2013 (15,000)

Ashmore SICAV – Unaudited Semi-Annual Report for the period ended 30 June 2013
200
Notes to the Consolidated Financial Statements (continued) 10- Financial derivative investments (continued) Ashmore SICAV Emerging Markets Investment Grade Local Currency Fund (continued) Open financial derivative investments as at 30 June 2013 are detailed below: (continued)
Forward currency contracts (continued)
To receive To pay Rate Date Unrealised loss (US$)
US$ 3,230,000 RUB 106,347,750 32.93 22/07/2013 (199)
US$ 4,914,633 RUB 162,445,832 33.05 31/07/2013 (11,456)
US$ 1,891,335 SGD 2,400,000 1.27 30/08/2013 (1,142)
US$ 1,252,402 THB 39,000,000 31.14 23/07/2013 (3,856)
US$ 3,400,000 ZAR 35,012,180 10.30 30/08/2013 (98,633)
US$ 5,554,909 ZAR 57,058,359 10.27 30/09/2013 (122,272)
Unrealised (loss) on forward currency contracts (6,849,395)
Interest rate swap contracts
Notional / Nominal
Currency Paying Receiving Maturity
date Counterparty Commitment
(US$) Unrealised (loss) (US$)
Singapore
1,907,353 SGD SORF6M 2.7600% 14/06/2032 Barclays 1,503,866 (111,978)
Unrealised (loss) on interest rate swap contracts (111,978)
Total unrealised (loss) on financial derivative investments (6,961,373)
Ashmore SICAV Emerging Markets Inflation Linked Bond Fund Open financial derivative investments as at 30 June 2013 are detailed below:
Forward currency contracts To receive To pay Rate Date Unrealised gain (US$)
BRL 1,565,792 US$ 682,828 2.29 02/10/2013 13,711
CNH 3,513,635 US$ 544,113 6.46 17/07/2013 28,026
CNH 11,725,308 US$ 1,773,031 6.61 13/04/2015 77,994
CNH 6,377,840 US$ 970,329 6.57 04/05/2015 35,740
CNH 3,513,635 US$ 528,827 6.64 17/07/2015 24,156
HUF 21,379,754 US$ 93,134 229.56 31/07/2013 978
IDR 6,448,775,000 US$ 637,484 10,115.98 17/07/2013 6,272
ILS 20,783,690 US$ 5,584,903 3.72 29/08/2013 117,613
RUB 2,309,804 US$ 70,000 33.00 31/07/2013 44
THB 19,611,827 US$ 630,106 31.12 23/07/2013 1,625
TRY 568,475 US$ 290,000 1.96 31/07/2013 3,503
US$ 1,340,000 BRL 2,775,346 2.07 02/07/2013 83,647
US$ 1,971,931 BRL 3,999,545 2.03 02/08/2013 171,511
US$ 473,648 BRL 987,177 2.08 04/09/2013 32,307
US$ 268,002 CLP 134,430,000 501.60 06/08/2013 3,738
US$ 426,175 CLP 215,900,000 506.60 09/09/2013 3,801
US$ 1,240,000 CNY 7,721,468 6.23 16/12/2013 1,441
US$ 266,084 COP 503,188,950 1,891.09 26/07/2013 6,029
US$ 271,370 CZK 5,372,751 19.80 31/07/2013 2,476
US$ 350,000 ILS 1,275,240 3.64 29/08/2013 107
US$ 220,000 ILS 797,874 3.63 30/08/2013 1,088
US$ 1,158,788 INR 67,031,526 57.85 17/07/2013 34,852
US$ 10,000 INR 578,100 57.81 30/08/2013 417
US$ 1,670,000 MXN 21,148,575 12.66 26/07/2013 49,290
US$ 862,275 MYR 2,680,332 3.11 15/07/2013 15,752
US$ 3,322 PEN 8,758 2.64 26/07/2013 180
US$ 493 PHP 21,100 42.80 24/07/2013 4
US$ 150,000 PLN 500,436 3.34 31/07/2013 16
US$ 3,769,946 PLN 12,309,910 3.27 30/08/2013 87,650

Ashmore SICAV – Unaudited Semi-Annual Report for the period ended 30 June 2013
201
Notes to the Consolidated Financial Statements (continued) 10- Financial derivative investments (continued) Ashmore SICAV Emerging Markets Inflation Linked Bond Fund (continued) Open financial derivative investments as at 30 June 2013 are detailed below: (continued)
Forward currency contracts (continued)
To receive To pay Rate Date Unrealised gain (US$)
US$ 50,000 RON 172,208 3.44 31/07/2013 33
US$ 30,000 RON 102,838 3.43 30/08/2013 255
US$ 260,000 RUB 8,565,700 32.95 29/07/2013 155
US$ 83,685 RUB 2,678,388 32.01 21/08/2013 2,776
US$ 1,575,109 THB 47,857,364 30.38 12/07/2013 32,589
US$ 537,388 THB 16,551,000 30.80 23/07/2013 4,251
US$ 1,396,569 TRY 2,605,997 1.87 29/08/2013 57,327
US$ 1,127,231 TRY 2,150,577 1.91 27/09/2013 26,881
US$ 60,000 ZAR 597,633 9.96 31/07/2013 17
US$ 684,896 ZAR 6,600,000 9.64 30/08/2013 25,383
Unrealised gain on forward currency contracts 953,635
Total unrealised gain on financial derivative investments 953,635
Forward currency contracts To receive To pay Rate Date Unrealised loss (US$)
BRL 4,341,138 US$ 2,040,000 2.13 02/07/2013 (74,840)
CLP 258,570,000 US$ 520,000 497.25 17/07/2013 (9,917)
CLP 690,660,609 US$ 1,353,043 510.45 09/09/2013 (1,877)
CNY 17,640 US$ 2,853 6.18 12/08/2013 (6)
CZK 5,398,728 US$ 280,000 19.28 31/07/2013 (9,806)
IDR 1,700,850,000 US$ 170,000 10,005.00 17/07/2013 (211)
INR 53,384,376 US$ 933,620 57.18 17/07/2013 (38,510)
INR 14,225,250 US$ 250,000 56.90 30/08/2013 (14,189)
KRW 2,145,153,308 US$ 1,900,603 1,128.67 24/07/2013 (27,684)
MXN 26,962,630 US$ 2,184,494 12.34 26/07/2013 (118,227)
MXN 44,983,737 US$ 3,492,370 12.88 23/08/2013 (53,727)
MYR 1,766,525 US$ 590,000 2.99 12/08/2013 (35,198)
MYR 923,824 US$ 300,000 3.08 30/08/2013 (10,151)
NGN 41,938,000 US$ 258,430 162.28 07/08/2013 (1,624)
PEN 136,000 US$ 50,000 2.72 26/07/2013 (1,198)
PLN 3,949,999 US$ 1,190,559 3.32 31/07/2013 (6,719)
PLN 5,545,694 US$ 1,712,114 3.24 30/08/2013 (53,215)
RON 2,556,745 US$ 749,310 3.41 30/08/2013 (9,794)
RUB 649,202 US$ 20,000 32.46 31/07/2013 (313)
RUB 29,194,001 US$ 913,554 31.96 30/08/2013 (33,120)
THB 20,490,950 US$ 670,000 30.58 12/07/2013 (9,544)
THB 23,802,812 US$ 783,667 30.37 23/07/2013 (16,937)
TRY 1,316,609 US$ 689,165 1.91 31/07/2013 (9,402)
TRY 2,337,609 US$ 1,232,294 1.90 29/08/2013 (30,978)
US$ 694,365 BRL 1,565,792 2.25 02/07/2013 (14,443)
US$ 110,000 CLP 56,448,205 513.17 09/09/2013 (432)
US$ 545,969 CNH 3,513,635 6.44 17/07/2013 (26,169)
US$ 1,800,000 CNH 11,725,308 6.51 13/04/2015 (51,025)
US$ 980,000 CNH 6,377,840 6.51 04/05/2015 (26,069)
US$ 530,000 CNH 3,513,635 6.63 17/07/2015 (22,984)
US$ 11,511 HUF 2,626,828 228.20 30/08/2013 (17)
US$ 808,334 IDR 8,149,625,000 10,082.00 17/07/2013 (5,210)
US$ 506,850 KRW 585,411,750 1,155.00 24/07/2013 (4,269)
US$ 530,000 MXN 7,132,894 13.46 26/07/2013 (16,626)
US$ 550,011 MYR 1,766,525 3.21 12/08/2013 (4,791)
US$ 219,875 MYR 706,843 3.21 30/08/2013 (1,897)

Ashmore SICAV – Unaudited Semi-Annual Report for the period ended 30 June 2013
202
Notes to the Consolidated Financial Statements (continued) 10- Financial derivative investments (continued) Ashmore SICAV Emerging Markets Inflation Linked Bond Fund (continued) Open financial derivative investments as at 30 June 2013 are detailed below: (continued)
Forward currency contracts (continued)
To receive To pay Rate Date Unrealised loss (US$)
US$ 490,000 RUB 16,133,250 32.93 22/07/2013 (30)
US$ 1,835,990 RUB 60,685,896 33.05 31/07/2013 (4,280)
US$ 560,000 TRY 1,086,858 1.94 31/07/2013 (1,144)
US$ 1,096,022 TRY 2,150,577 1.96 28/08/2013 (9,355)
US$ 510,000 ZAR 5,251,827 10.30 30/08/2013 (14,795)
US$ 1,362,419 ZAR 13,988,612 10.27 30/09/2013 (29,417)
Unrealised (loss) on forward currency contracts (800,140)
Total unrealised (loss) on financial derivative investments (800,140)
Ashmore SICAV Emerging Markets Total Return Fund Open financial derivative investments as at 30 June 2013 are detailed below:
Forward currency contracts To receive To pay Rate Date Unrealised gain (US$)
ARS 3,719,430 US$ 663,000 5.61 18/07/2013 21,014
ARS 1,091,886 US$ 170,000 6.42 18/09/2013 21,103
ARS 1,214,100 US$ 190,000 6.39 23/09/2013 21,476
ARS 1,304,300 US$ 200,000 6.52 25/09/2013 26,750
ARS 1,543,200 US$ 240,000 6.43 27/09/2013 27,766
ARS 1,963,380 US$ 300,000 6.54 30/09/2013 39,686
ARS 2,408,700 US$ 370,000 6.51 03/10/2013 45,521
ARS 4,013,300 US$ 670,000 5.99 17/10/2013 11,253
BRL 2,961,006 US$ 1,313,085 2.26 02/07/2013 27,313
CNH 27,831,525 US$ 4,301,925 6.47 17/07/2013 229,990
CNH 34,057,230 US$ 5,136,336 6.63 13/04/2015 240,134
CNH 20,177,990 US$ 3,074,887 6.56 04/05/2015 108,078
CNH 28,267,375 US$ 4,278,226 6.61 17/07/2015 170,556
CZK 5,800,145 US$ 290,000 20.00 30/08/2013 334
EUR 1,225,418 US$ 1,577,275 0.78 22/07/2013 15,686
HUF 73,554,294 US$ 315,972 232.79 31/07/2013 7,810
IDR 13,842,850,000 US$ 1,370,000 10,104.27 17/07/2013 11,876
ILS 2,767,832 US$ 743,760 3.72 29/08/2013 15,663
INR 24,863,300 US$ 409,846 60.67 17/07/2013 7,044
MXN 5,391,370 US$ 401,702 13.42 26/07/2013 11,463
MYR 2,329,795 US$ 730,000 3.19 22/08/2013 1,298
THB 3,106,500 US$ 100,000 31.07 23/07/2013 66
TRY 271,894 US$ 140,000 1.94 31/07/2013 379
TRY 600,000 US$ 303,690 1.98 27/09/2013 3,302
US$ 5,565,802 BRL 11,714,581 2.10 02/07/2013 262,807
US$ 3,879,469 BRL 7,868,486 2.03 02/08/2013 337,421
US$ 3,848,610 BRL 8,021,272 2.08 04/09/2013 262,506
US$ 1,238,950 CLP 621,457,500 501.60 06/08/2013 17,280
US$ 1,220,292 CLP 618,200,000 506.60 09/09/2013 10,884
US$ 1,470,000 CNY 9,099,315 6.19 12/08/2013 1,283
US$ 2,850,000 CNY 17,746,922 6.23 16/12/2013 3,312
US$ 621,744 COP 1,172,297,700 1,885.50 26/07/2013 15,884
US$ 550,000 CZK 10,889,642 19.80 31/07/2013 4,998
US$ 10,263,081 EUR 7,851,254 0.76 22/07/2013 56,979
US$ 5,765,152 GBP 3,737,649 0.65 19/07/2013 96,762
US$ 1,587,789 GBP 1,039,545 0.65 22/07/2013 11,283

Ashmore SICAV – Unaudited Semi-Annual Report for the period ended 30 June 2013
203
Notes to the Consolidated Financial Statements (continued) 10- Financial derivative investments (continued) Ashmore SICAV Emerging Markets Total Return Fund (continued) Open financial derivative investments as at 30 June 2013 are detailed below: (continued)
Forward currency contracts (continued)
To receive To pay Rate Date Unrealised gain (US$)
US$ 220,000 HUF 49,974,584 227.16 31/07/2013 14
US$ 580,000 HUF 130,323,970 224.70 30/08/2013 8,074
US$ 130,000 ILS 471,935 3.63 29/08/2013 513
US$ 2,400,000 INR 138,949,125 57.90 17/07/2013 70,204
US$ 1,653,509 KRW 1,866,265,685 1,128.67 24/07/2013 24,085
US$ 5,051,549 MXN 63,398,023 12.55 26/07/2013 193,075
US$ 2,610,690 MYR 8,119,253 3.11 15/07/2013 46,408
US$ 27,796 PEN 75,936 2.73 26/07/2013 547
US$ 15,031 PHP 643,344 42.80 24/07/2013 116
US$ 2,175,191 PLN 7,210,371 3.31 31/07/2013 14,196
US$ 3,026,826 PLN 9,898,961 3.27 30/08/2013 65,723
US$ 450,000 RON 1,545,944 3.44 31/07/2013 1,436
US$ 420,000 RON 1,423,682 3.39 30/08/2013 8,213
US$ 280,000 RUB 9,224,600 32.95 29/07/2013 167
US$ 3,390,000 RUB 107,494,950 31.71 01/08/2013 130,859
US$ 1,380,000 RUB 44,180,700 32.02 30/08/2013 47,596
US$ 4,545,717 THB 137,283,490 30.20 12/07/2013 120,848
US$ 96,837 THB 3,000,000 30.98 23/07/2013 202
US$ 10,594 TRY 20,463 1.93 31/07/2013 29
US$ 1,792,286 TRY 3,370,386 1.88 29/08/2013 60,218
US$ 1,349,038 ZAR 13,000,000 9.64 30/08/2013 49,997
Unrealised gain on forward currency contracts 2,989,480
Interest rate swap contracts
Notional / Nominal
Currency Paying Receiving Maturity
date Counterparty Commitment
(US$) Unrealised gain (US$)
Brazil
959,644 SGD 1.80% SORF6M 25/10/2022 Barclays 756,638 46,933
155,442 SGD 1.80% SORF6M 25/10/2022 Barclays 122,559 7,829
Unrealised gain on interest rate swap contracts 54,762
Total unrealised gain on financial derivative investments 3,044,242
Forward currency contracts To receive To pay Rate Date Unrealised loss (US$)
BRL 8,753,575 US$ 4,107,219 2.13 02/07/2013 (144,622)
BRL 11,286,520 US$ 5,595,142 2.02 04/09/2013 (549,230)
CLP 556,920,000 US$ 1,120,000 497.25 17/07/2013 (21,359)
CLP 538,206,880 US$ 1,054,377 510.45 09/09/2013 (1,463)
CNY 36,662,429 US$ 5,930,033 6.18 12/08/2013 (12,362)
COP 173,026,924 US$ 90,733 1,907.00 26/07/2013 (1,310)
CZK 62,447,122 US$ 3,168,248 19.71 31/07/2013 (42,908)
EUR 1,774,683 US$ 2,312,584 0.77 22/07/2013 (5,616)
GBP 500 US$ 767 0.65 01/07/2013 (8)
GBP 90,902,034 US$ 142,198,395 0.64 19/07/2013 (4,339,482)
HUF 327,300,455 US$ 1,450,478 225.65 30/08/2013 (14,122)
INR 256,702,504 US$ 4,470,767 57.42 17/07/2013 (166,569)
MXN 89,774,102 US$ 7,341,173 12.23 26/07/2013 (461,381)
MXN 41,181,966 US$ 3,200,377 12.87 23/08/2013 (52,349)
MYR 8,589,357 US$ 2,789,205 3.08 15/07/2013 (76,451)
MYR 5,089,882 US$ 1,700,000 2.99 12/08/2013 (101,450)
MYR 3,300,000 US$ 1,066,339 3.09 30/08/2013 (30,966)
PEN 644,393 US$ 244,459 2.64 26/07/2013 (13,226)

Ashmore SICAV – Unaudited Semi-Annual Report for the period ended 30 June 2013
204
Notes to the Consolidated Financial Statements (continued) 10- Financial derivative investments (continued) Ashmore SICAV Emerging Markets Total Return Fund (continued) Open financial derivative investments as at 30 June 2013 are detailed below: (continued)
Forward currency contracts
To receive To pay Rate Date Unrealised loss (US$)
PLN 1,675,353 US$ 513,652 3.26 31/07/2013 (11,538)
PLN 5,227,663 US$ 1,587,749 3.29 30/08/2013 (23,984)
RON 5,268,383 US$ 1,542,881 3.41 30/08/2013 (19,048)
RUB 755,575 US$ 23,608 32.01 21/08/2013 (783)
RUB 146,341,455 US$ 4,566,557 32.05 30/08/2013 (153,183)
SGD 2,682,228 US$ 2,126,862 1.26 31/07/2013 (11,919)
SGD 2,343,592 US$ 1,868,469 1.25 30/08/2013 (20,471)
THB 159,868,398 US$ 5,327,488 30.01 12/07/2013 (174,671)
THB 64,976,379 US$ 2,152,367 30.19 23/07/2013 (59,365)
TRY 2,837,894 US$ 1,510,278 1.88 29/08/2013 (51,862)
TWD 101,745,719 US$ 3,399,115 29.93 24/07/2013 (5,230)
US$ 560,000 ARS 3,309,600 5.91 27/09/2013 (14,260)
US$ 1,291,268 BRL 2,961,006 2.29 02/10/2013 (25,928)
US$ 4,340,602 CNH 27,831,525 6.41 17/07/2013 (191,313)
US$ 5,230,665 CNH 34,057,230 6.51 13/04/2015 (145,806)
US$ 3,080,000 CNH 20,177,990 6.55 04/05/2015 (102,965)
US$ 4,250,000 CNH 28,267,375 6.65 17/07/2015 (198,782)
US$ 1,120,000 CNY 6,946,760 6.20 12/08/2013 (1,274)
US$ 400,382 CZK 8,105,576 20.24 30/08/2013 (5,354)
US$ 218,204 HUF 50,058,800 229.41 31/07/2013 (2,153)
US$ 664,091 HUF 151,548,652 228.20 30/08/2013 (979)
US$ 560,771 IDR 5,653,697,140 10,082.00 17/07/2013 (3,615)
US$ 100,000 ILS 369,905 3.70 29/08/2013 (1,492)
US$ 919,770 KRW 1,062,334,350 1,155.00 24/07/2013 (7,747)
US$ 1,060,000 MXN 14,265,787 13.46 26/07/2013 (33,251)
US$ 146,587 MYR 470,104 3.21 15/07/2013 (1,885)
US$ 1,584,744 MYR 5,089,882 3.21 12/08/2013 (13,805)
US$ 945,847 MYR 3,040,662 3.21 30/08/2013 (8,159)
US$ 1,080,000 RUB 35,559,000 32.93 22/07/2013 (67)
US$ 4,974,142 RUB 164,412,804 33.05 31/07/2013 (11,595)
US$ 472,834 SGD 600,000 1.27 30/08/2013 (286)
US$ 321,107 THB 10,000,000 31.14 23/07/2013 (1,010)
US$ 1,100,000 ZAR 11,327,470 10.30 30/08/2013 (31,911)
US$ 2,823,990 ZAR 29,007,181 10.27 30/09/2013 (62,160)
Unrealised (loss) on forward currency contracts (7,432,725)
Interest rate swap contracts
Notional / Nominal
Currency Paying Receiving Maturity
date Counterparty Commitment
(US$) Unrealised (loss) (US$)
Singapore
435,482 SGD SORF6M 2.6000% 25/10/2032 Barclays 343,359 (34,207)
Unrealised (loss) on interest rate swap contracts (34,207)
Total unrealised (loss) on financial derivative investments (7,466,932)
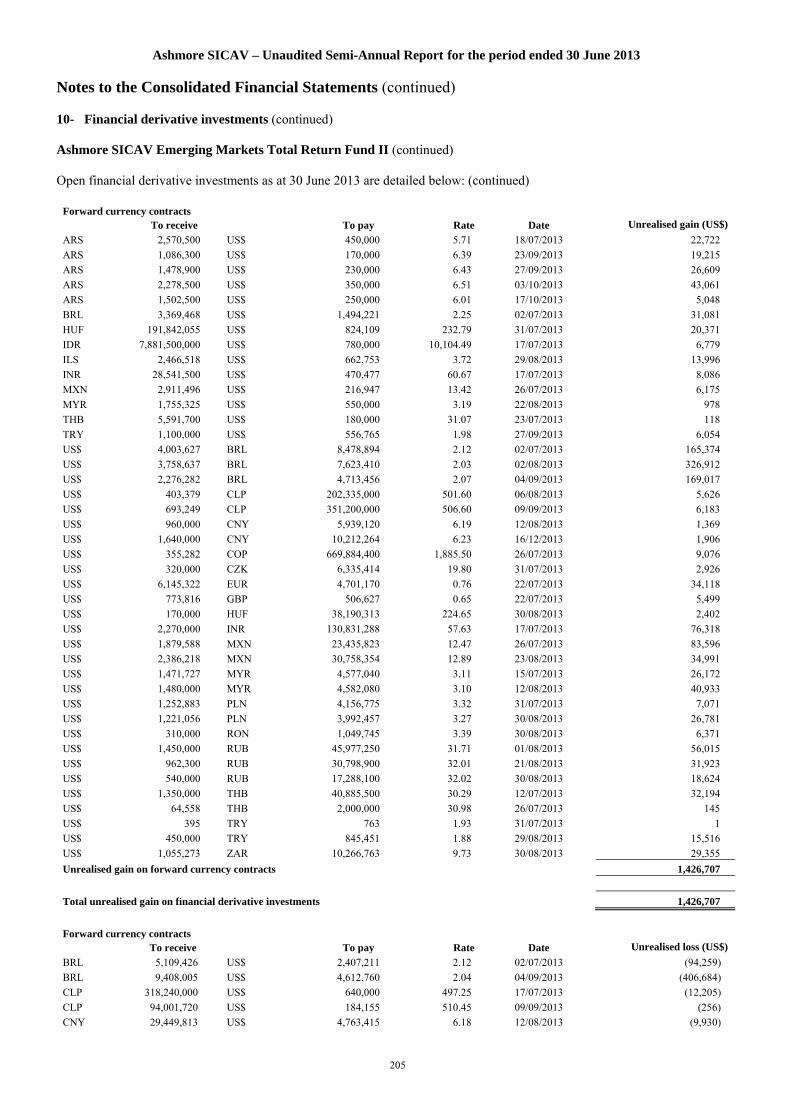
Ashmore SICAV – Unaudited Semi-Annual Report for the period ended 30 June 2013
205
Notes to the Consolidated Financial Statements (continued) 10- Financial derivative investments (continued) Ashmore SICAV Emerging Markets Total Return Fund II (continued) Open financial derivative investments as at 30 June 2013 are detailed below: (continued)
Forward currency contracts To receive To pay Rate Date Unrealised gain (US$)
ARS 2,570,500 US$ 450,000 5.71 18/07/2013 22,722
ARS 1,086,300 US$ 170,000 6.39 23/09/2013 19,215
ARS 1,478,900 US$ 230,000 6.43 27/09/2013 26,609
ARS 2,278,500 US$ 350,000 6.51 03/10/2013 43,061
ARS 1,502,500 US$ 250,000 6.01 17/10/2013 5,048
BRL 3,369,468 US$ 1,494,221 2.25 02/07/2013 31,081
HUF 191,842,055 US$ 824,109 232.79 31/07/2013 20,371
IDR 7,881,500,000 US$ 780,000 10,104.49 17/07/2013 6,779
ILS 2,466,518 US$ 662,753 3.72 29/08/2013 13,996
INR 28,541,500 US$ 470,477 60.67 17/07/2013 8,086
MXN 2,911,496 US$ 216,947 13.42 26/07/2013 6,175
MYR 1,755,325 US$ 550,000 3.19 22/08/2013 978
THB 5,591,700 US$ 180,000 31.07 23/07/2013 118
TRY 1,100,000 US$ 556,765 1.98 27/09/2013 6,054
US$ 4,003,627 BRL 8,478,894 2.12 02/07/2013 165,374
US$ 3,758,637 BRL 7,623,410 2.03 02/08/2013 326,912
US$ 2,276,282 BRL 4,713,456 2.07 04/09/2013 169,017
US$ 403,379 CLP 202,335,000 501.60 06/08/2013 5,626
US$ 693,249 CLP 351,200,000 506.60 09/09/2013 6,183
US$ 960,000 CNY 5,939,120 6.19 12/08/2013 1,369
US$ 1,640,000 CNY 10,212,264 6.23 16/12/2013 1,906
US$ 355,282 COP 669,884,400 1,885.50 26/07/2013 9,076
US$ 320,000 CZK 6,335,414 19.80 31/07/2013 2,926
US$ 6,145,322 EUR 4,701,170 0.76 22/07/2013 34,118
US$ 773,816 GBP 506,627 0.65 22/07/2013 5,499
US$ 170,000 HUF 38,190,313 224.65 30/08/2013 2,402
US$ 2,270,000 INR 130,831,288 57.63 17/07/2013 76,318
US$ 1,879,588 MXN 23,435,823 12.47 26/07/2013 83,596
US$ 2,386,218 MXN 30,758,354 12.89 23/08/2013 34,991
US$ 1,471,727 MYR 4,577,040 3.11 15/07/2013 26,172
US$ 1,480,000 MYR 4,582,080 3.10 12/08/2013 40,933
US$ 1,252,883 PLN 4,156,775 3.32 31/07/2013 7,071
US$ 1,221,056 PLN 3,992,457 3.27 30/08/2013 26,781
US$ 310,000 RON 1,049,745 3.39 30/08/2013 6,371
US$ 1,450,000 RUB 45,977,250 31.71 01/08/2013 56,015
US$ 962,300 RUB 30,798,900 32.01 21/08/2013 31,923
US$ 540,000 RUB 17,288,100 32.02 30/08/2013 18,624
US$ 1,350,000 THB 40,885,500 30.29 12/07/2013 32,194
US$ 64,558 THB 2,000,000 30.98 26/07/2013 145
US$ 395 TRY 763 1.93 31/07/2013 1
US$ 450,000 TRY 845,451 1.88 29/08/2013 15,516
US$ 1,055,273 ZAR 10,266,763 9.73 30/08/2013 29,355
Unrealised gain on forward currency contracts 1,426,707
Total unrealised gain on financial derivative investments 1,426,707
Forward currency contracts To receive To pay Rate Date Unrealised loss (US$)
BRL 5,109,426 US$ 2,407,211 2.12 02/07/2013 (94,259)
BRL 9,408,005 US$ 4,612,760 2.04 04/09/2013 (406,684)
CLP 318,240,000 US$ 640,000 497.25 17/07/2013 (12,205)
CLP 94,001,720 US$ 184,155 510.45 09/09/2013 (256)
CNY 29,449,813 US$ 4,763,415 6.18 12/08/2013 (9,930)

Ashmore SICAV – Unaudited Semi-Annual Report for the period ended 30 June 2013
206
Notes to the Consolidated Financial Statements (continued) 10- Financial derivative investments (continued) Ashmore SICAV Emerging Markets Total Return Fund II (continued) Open financial derivative investments as at 30 June 2013 are detailed below: (continued)
Forward currency contracts (continued)
To receive To pay Rate Date Unrealised loss (US$)
COP 92,934,124 US$ 48,733 1,907.00 26/07/2013 (703)
CZK 6,748,409 US$ 350,000 19.28 31/07/2013 (12,257)
EUR 666,756 US$ 868,848 0.77 22/07/2013 (2,110)
HUF 65,247,956 US$ 289,156 225.65 30/08/2013 (2,815)
INR 220,880,685 US$ 3,851,126 57.35 17/07/2013 (147,562)
KRW 685,335,000 US$ 607,206 1,128.67 24/07/2013 (8,845)
MXN 49,127,513 US$ 4,000,724 12.28 26/07/2013 (235,863)
MXN 8,209,088 US$ 640,000 12.83 23/08/2013 (12,482)
MYR 2,884,868 US$ 965,000 2.99 12/08/2013 (58,967)
MYR 8,948,777 US$ 3,001,586 2.98 22/08/2013 (192,660)
MYR 2,000,000 US$ 646,266 3.09 30/08/2013 (18,767)
PEN 558,900 US$ 212,026 2.64 26/07/2013 (11,471)
PHP 26,500,569 US$ 619,172 42.80 24/07/2013 (4,782)
PLN 1,047,096 US$ 321,033 3.26 31/07/2013 (7,211)
PLN 3,111,864 US$ 945,137 3.29 30/08/2013 (14,277)
RON 4,147,547 US$ 1,217,789 3.41 30/08/2013 (18,148)
RUB 103,339,162 US$ 3,227,661 32.02 30/08/2013 (111,153)
SGD 2,053,849 US$ 1,628,591 1.26 31/07/2013 (9,127)
SGD 1,580,396 US$ 1,259,998 1.25 30/08/2013 (13,804)
THB 31,671,385 US$ 1,039,376 30.47 12/07/2013 (18,556)
THB 19,717,760 US$ 640,000 30.81 23/07/2013 (4,857)
TRY 500,000 US$ 268,853 1.86 31/07/2013 (10,704)
TRY 1,491,785 US$ 795,966 1.87 29/08/2013 (29,326)
TWD 58,858,700 US$ 1,966,348 29.93 24/07/2013 (3,026)
US$ 140,000 ARS 827,400 5.91 27/09/2013 (3,565)
US$ 352,019 BRL 790,000 2.24 02/08/2013 (3,605)
US$ 1,469,394 BRL 3,369,468 2.29 02/10/2013 (29,504)
US$ 420,000 CNY 2,605,260 6.20 12/08/2013 (514)
US$ 606,088 HUF 138,232,930 228.07 30/08/2013 (546)
US$ 122,387 IDR 1,233,909,800 10,082.00 17/07/2013 (789)
US$ 593,364 KRW 685,335,000 1,155.00 24/07/2013 (4,998)
US$ 590,000 MXN 7,940,391 13.46 26/07/2013 (18,508)
US$ 1,753,076 MYR 5,633,248 3.21 22/08/2013 (15,140)
US$ 620,000 RUB 20,413,500 32.93 22/07/2013 (38)
US$ 2,106,008 RUB 69,610,921 33.05 31/07/2013 (4,909)
US$ 315,222 SGD 400,000 1.27 30/08/2013 (190)
US$ 192,664 THB 6,000,000 31.14 23/07/2013 (606)
US$ 610,000 ZAR 6,281,597 10.30 30/08/2013 (17,696)
US$ 1,337,086 ZAR 13,734,144 10.27 30/09/2013 (29,431)
Unrealised (loss) on forward currency contracts (1,602,846)
Total unrealised (loss) on financial derivative investments (1,602,846)
Ashmore SICAV Emerging Markets Investment Grade Total Return Fund Open financial derivative investments as at 30 June 2013 are detailed below:
Forward currency contracts To receive To pay Rate Date Unrealised gain (US$)
BRL 1,610,157 US$ 714,039 2.25 02/07/2013 14,853
CZK 1,143,790 US$ 56,981 20.07 30/08/2013 273
ILS 718,190 US$ 192,978 3.72 29/08/2013 4,075
INR 8,511,800 US$ 140,308 60.67 17/07/2013 2,411

Ashmore SICAV – Unaudited Semi-Annual Report for the period ended 30 June 2013
207
Notes to the Consolidated Financial Statements (continued) 10- Financial derivative investments (continued) Ashmore SICAV Emerging Markets Investment Grade Total Return Fund (continued) Open financial derivative investments as at 30 June 2013 are detailed below: (continued)
Forward currency contracts (continued)
To receive To pay Rate Date Unrealised gain (US$)
MXN 754,732 US$ 56,228 13.42 26/07/2013 1,611
MYR 670,215 US$ 210,000 3.19 22/08/2013 373
US$ 1,377,378 BRL 2,935,167 2.13 02/07/2013 48,677
US$ 514,155 BRL 1,042,828 2.03 02/08/2013 44,719
US$ 471,083 BRL 981,831 2.08 04/09/2013 32,132
US$ 192,085 CLP 96,350,000 501.60 06/08/2013 2,679
US$ 46,122 CLP 22,860,500 495.65 07/08/2013 1,189
US$ 229,239 CLP 116,430,500 507.90 09/09/2013 1,461
US$ 220,000 CNY 1,361,860 6.19 12/08/2013 183
US$ 420,000 CNY 2,615,336 6.23 16/12/2013 488
US$ 88,821 COP 167,471,100 1,885.50 26/07/2013 2,269
US$ 80,000 CZK 1,583,854 19.80 31/07/2013 732
US$ 1,495,665 EUR 1,142,427 0.76 19/07/2013 10,605
US$ 407,254 EUR 311,549 0.76 22/07/2013 2,261
US$ 350,000 INR 20,261,872 57.89 17/07/2013 10,264
US$ 692,342 MXN 8,691,085 12.55 26/07/2013 26,306
US$ 180,000 MYR 559,296 3.11 15/07/2013 3,359
US$ 11,682 PHP 500,000 42.80 24/07/2013 90
US$ 536,369 PLN 1,754,298 3.27 30/08/2013 11,601
US$ 100,000 RON 343,810 3.44 31/07/2013 242
US$ 111,476 RON 379,184 3.40 30/08/2013 1,801
US$ 40,000 RUB 1,317,800 32.95 29/07/2013 24
US$ 470,000 RUB 14,902,350 31.71 01/08/2013 18,176
US$ 62,406 RUB 1,997,350 32.01 21/08/2013 2,070
US$ 220,000 RUB 7,043,300 32.02 30/08/2013 7,588
US$ 667,925 THB 20,171,250 30.20 12/07/2013 17,773
US$ 32,279 THB 1,000,000 30.98 23/07/2013 67
US$ 321,694 ZAR 3,100,000 9.64 30/08/2013 11,922
ZAR 1,227,679 US$ 120,000 10.23 30/09/2013 2,151
Unrealised gain on forward currency contracts 284,425
Interest rate swap contracts
Notional / Nominal
Currency Paying Receiving Maturity
date Counterparty Commitment
(US$) Unrealised gain (US$)
Brazil
338,739 BRL BZDIOVRA 11.0320% 02/01/2017 Barclays 153,341 1,054
Singapore
94,487 SGD 1.71% SORF6M 14/12/2022 Barclays 74,499 5,528
Unrealised gain on interest rate swap contracts 6,582
Total unrealised gain on financial derivative investments 291,007
Forward currency contracts To receive To pay Rate Date Unrealised loss (US$)
BRL 2,190,010 US$ 1,024,940 2.14 02/07/2013 (33,559)
BRL 3,283,948 US$ 1,598,025 2.06 04/09/2013 (129,856)
CLP 79,560,000 US$ 160,000 497.25 17/07/2013 (3,051)
CNY 7,628,077 US$ 1,233,832 6.18 12/08/2013 (2,587)
COP 197,905,387 US$ 103,778 1,907.00 26/07/2013 (1,498)
CZK 8,984,631 US$ 455,970 19.70 31/07/2013 (6,310)
EUR 23,802,674 US$ 31,894,514 0.75 19/07/2013 (953,009)
INR 55,027,086 US$ 959,690 57.34 17/07/2013 (37,036)
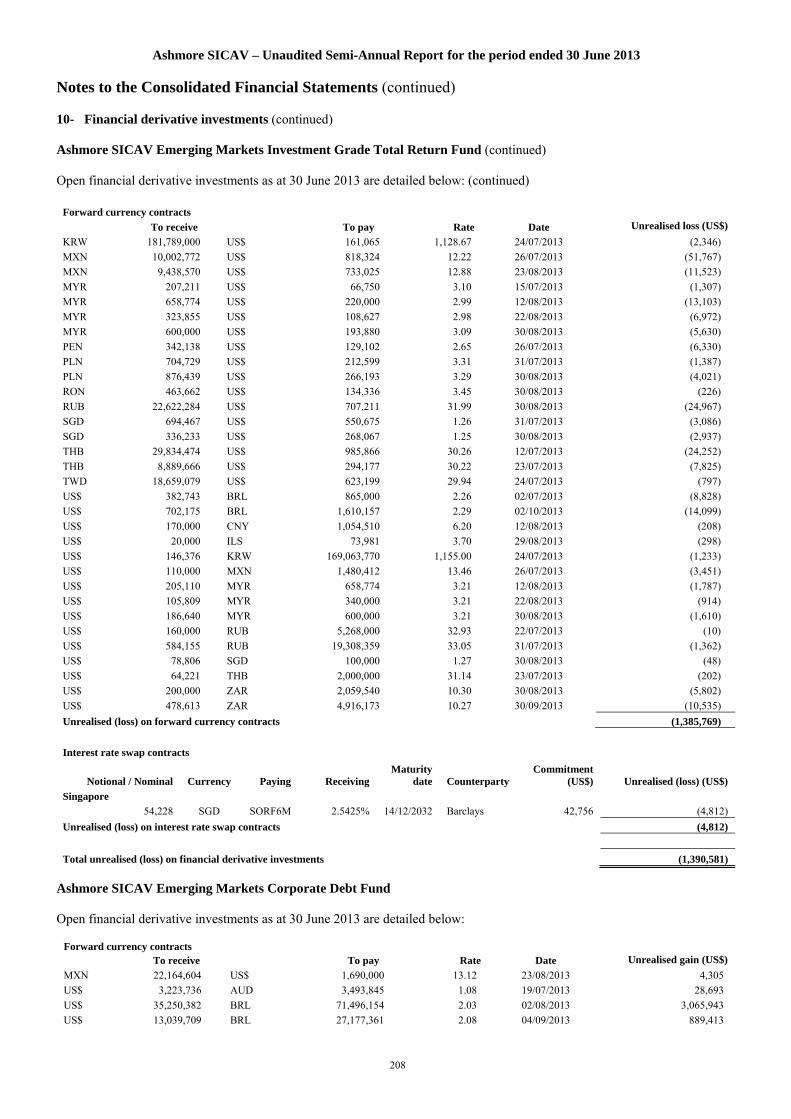
Ashmore SICAV – Unaudited Semi-Annual Report for the period ended 30 June 2013
208
Notes to the Consolidated Financial Statements (continued) 10- Financial derivative investments (continued) Ashmore SICAV Emerging Markets Investment Grade Total Return Fund (continued) Open financial derivative investments as at 30 June 2013 are detailed below: (continued)
Forward currency contracts
To receive To pay Rate Date Unrealised loss (US$)
KRW 181,789,000 US$ 161,065 1,128.67 24/07/2013 (2,346)
MXN 10,002,772 US$ 818,324 12.22 26/07/2013 (51,767)
MXN 9,438,570 US$ 733,025 12.88 23/08/2013 (11,523)
MYR 207,211 US$ 66,750 3.10 15/07/2013 (1,307)
MYR 658,774 US$ 220,000 2.99 12/08/2013 (13,103)
MYR 323,855 US$ 108,627 2.98 22/08/2013 (6,972)
MYR 600,000 US$ 193,880 3.09 30/08/2013 (5,630)
PEN 342,138 US$ 129,102 2.65 26/07/2013 (6,330)
PLN 704,729 US$ 212,599 3.31 31/07/2013 (1,387)
PLN 876,439 US$ 266,193 3.29 30/08/2013 (4,021)
RON 463,662 US$ 134,336 3.45 30/08/2013 (226)
RUB 22,622,284 US$ 707,211 31.99 30/08/2013 (24,967)
SGD 694,467 US$ 550,675 1.26 31/07/2013 (3,086)
SGD 336,233 US$ 268,067 1.25 30/08/2013 (2,937)
THB 29,834,474 US$ 985,866 30.26 12/07/2013 (24,252)
THB 8,889,666 US$ 294,177 30.22 23/07/2013 (7,825)
TWD 18,659,079 US$ 623,199 29.94 24/07/2013 (797)
US$ 382,743 BRL 865,000 2.26 02/07/2013 (8,828)
US$ 702,175 BRL 1,610,157 2.29 02/10/2013 (14,099)
US$ 170,000 CNY 1,054,510 6.20 12/08/2013 (208)
US$ 20,000 ILS 73,981 3.70 29/08/2013 (298)
US$ 146,376 KRW 169,063,770 1,155.00 24/07/2013 (1,233)
US$ 110,000 MXN 1,480,412 13.46 26/07/2013 (3,451)
US$ 205,110 MYR 658,774 3.21 12/08/2013 (1,787)
US$ 105,809 MYR 340,000 3.21 22/08/2013 (914)
US$ 186,640 MYR 600,000 3.21 30/08/2013 (1,610)
US$ 160,000 RUB 5,268,000 32.93 22/07/2013 (10)
US$ 584,155 RUB 19,308,359 33.05 31/07/2013 (1,362)
US$ 78,806 SGD 100,000 1.27 30/08/2013 (48)
US$ 64,221 THB 2,000,000 31.14 23/07/2013 (202)
US$ 200,000 ZAR 2,059,540 10.30 30/08/2013 (5,802)
US$ 478,613 ZAR 4,916,173 10.27 30/09/2013 (10,535)
Unrealised (loss) on forward currency contracts (1,385,769)
Interest rate swap contracts
Notional / Nominal
Currency Paying Receiving Maturity
date Counterparty Commitment
(US$) Unrealised (loss) (US$)
Singapore
54,228 SGD SORF6M 2.5425% 14/12/2032 Barclays 42,756 (4,812)
Unrealised (loss) on interest rate swap contracts (4,812)
Total unrealised (loss) on financial derivative investments (1,390,581)
Ashmore SICAV Emerging Markets Corporate Debt Fund Open financial derivative investments as at 30 June 2013 are detailed below:
Forward currency contracts To receive To pay Rate Date Unrealised gain (US$)
MXN 22,164,604 US$ 1,690,000 13.12 23/08/2013 4,305
US$ 3,223,736 AUD 3,493,845 1.08 19/07/2013 28,693
US$ 35,250,382 BRL 71,496,154 2.03 02/08/2013 3,065,943
US$ 13,039,709 BRL 27,177,361 2.08 04/09/2013 889,413

Ashmore SICAV – Unaudited Semi-Annual Report for the period ended 30 June 2013
209
Notes to the Consolidated Financial Statements (continued) 10- Financial derivative investments (continued) Ashmore SICAV Emerging Markets Corporate Debt Fund (continued) Open financial derivative investments as at 30 June 2013 are detailed below: (continued)
Forward currency contracts (continued)
To receive To pay Rate Date Unrealised gain (US$)
US$ 948,595 CAD 996,564 1.05 19/07/2013 4,228
US$ 372,069 CHF 350,636 0.94 01/07/2013 1,476
US$ 2,672,829 CHF 2,506,130 0.94 19/07/2013 23,769
US$ 848,668 CLP 420,642,500 495.65 07/08/2013 21,881
US$ 2,779,905 CLP 1,408,300,000 506.60 09/09/2013 24,794
US$ 65,171,100 EUR 50,121,992 0.77 01/07/2013 20,025
US$ 37,427 EUR 28,784 0.77 02/07/2013 13
US$ 52,172,548 EUR 39,827,966 0.76 19/07/2013 399,491
US$ 369,662,610 EUR 282,616,961 0.76 22/07/2013 2,279,593
US$ 7,031 GBP 4,584 0.65 01/07/2013 79
US$ 512,888 GBP 331,444 0.65 19/07/2013 10,231
US$ 37,636,580 GBP 24,517,028 0.65 22/07/2013 455,654
US$ 1,319,987 JPY 128,935,085 97.68 19/07/2013 21,942
US$ 17,006 MXN 207,046 12.18 26/07/2013 1,139
US$ 21,169,907 MXN 272,880,101 12.89 23/08/2013 310,429
US$ 42,065 NOK 248,801 5.91 19/07/2013 1,336
Unrealised gain on forward currency contracts 7,564,434
Total unrealised gain on financial derivative investments 7,564,434
Forward currency contracts To receive To pay Rate Date Unrealised loss (US$)
AUD 72,624,100 US$ 68,848,809 1.05 19/07/2013 (2,435,685)
CAD 20,585,100 US$ 20,143,218 1.02 19/07/2013 (636,319)
CHF 75,567,941 US$ 82,085,100 0.92 19/07/2013 (2,207,367)
EUR 50,390,626 US$ 65,519,022 0.77 01/07/2013 (18,764)
EUR 69,375 US$ 90,212 0.77 02/07/2013 (34)
EUR 1,055,019,501 US$ 1,410,136,386 0.75 19/07/2013 (38,698,421)
EUR 30,469,787 US$ 39,816,380 0.77 22/07/2013 (207,710)
GBP 4,585 US$ 7,032 0.65 01/07/2013 (78)
GBP 4,519,090 US$ 7,062,742 0.64 19/07/2013 (209,244)
JPY 2,964,068,539 US$ 31,195,763 95.02 19/07/2013 (1,355,199)
MXN 1,705,820,803 US$ 132,424,251 12.88 19/07/2013 (1,618,398)
NOK 2,284,726 US$ 397,829 5.74 19/07/2013 (23,823)
US$ 71,190 CHF 67,529 0.95 02/07/2013 (182)
US$ 31,775,731 EUR 24,600,443 0.77 22/07/2013 (203,188)
US$ 3,809,169 GBP 2,520,132 0.66 22/07/2013 (12,698)
US$ 5,559,689 MXN 73,902,463 13.29 19/07/2013 (107,304)
US$ 36,550 NOK 223,922 6.13 19/07/2013 (105)
Unrealised (loss) on forward currency contracts (47,734,519)
Total unrealised (loss) on financial derivative investments (47,734,519)
Ashmore SICAV Emerging Markets Investment Grade Corporate Debt Fund Open financial derivative investments as at 30 June 2013 are detailed below:
Forward currency contracts To receive To pay Rate Date Unrealised gain (US$)
MXN 3,016,485 US$ 230,000 13.12 23/08/2013 586
US$ 701,694 BRL 1,423,202 2.03 02/08/2013 61,031
US$ 141,092 CLP 69,932,000 495.65 07/08/2013 3,638
US$ 462,100 CLP 234,100,000 506.60 09/09/2013 4,121

Ashmore SICAV – Unaudited Semi-Annual Report for the period ended 30 June 2013
210
Notes to the Consolidated Financial Statements (continued) 10- Financial derivative investments (continued) Ashmore SICAV Emerging Markets Investment Grade Corporate Debt Fund (continued) Open financial derivative investments as at 30 June 2013 are detailed below: (continued)
Forward currency contracts (continued)
To receive To pay Rate Date Unrealised gain (US$)
US$ 1,878,773 EUR 1,435,054 0.76 19/07/2013 13,321
US$ 1,495,435 EUR 1,144,008 0.76 22/07/2013 8,302
US$ 3,211 GBP 2,082 0.65 19/07/2013 54
US$ 173,435 MXN 2,111,570 12.17 26/07/2013 11,616
US$ 2,007,383 MXN 25,875,164 12.89 23/08/2013 29,436
Unrealised gain on forward currency contracts 132,105
Total unrealised gain on financial derivative investments 132,105
Forward currency contracts To receive To pay Rate Date Unrealised loss (US$)
EUR 29,760,401 US$ 39,872,919 0.75 19/07/2013 (1,186,863)
EUR 487,202 US$ 649,054 0.75 22/07/2013 (15,725)
GBP 43,447 US$ 67,961 0.64 19/07/2013 (2,071)
Unrealised (loss) on forward currency contracts (1,204,659)
Total unrealised (loss) on financial derivative investments (1,204,659)
Ashmore SICAV Emerging Markets Local Currency Corporate Debt Fund Open financial derivative investments as at 30 June 2013 are detailed below:
Forward currency contracts To receive To pay Rate Date Unrealised gain (US$)
ARS 1,150,200 US$ 180,000 6.39 23/09/2013 20,346
ARS 1,108,655 US$ 170,000 6.52 25/09/2013 22,738
ARS 2,956,400 US$ 480,000 6.16 27/09/2013 32,975
ARS 1,701,596 US$ 260,000 6.54 30/09/2013 34,395
ARS 2,343,600 US$ 360,000 6.51 03/10/2013 44,291
BRL 3,011,415 US$ 1,335,439 2.26 02/07/2013 27,778
CHF 5,567 US$ 5,868 0.95 02/07/2013 15
US$ 5,160,000 BRL 10,691,004 2.07 02/07/2013 320,361
US$ 3,601,876 BRL 7,305,461 2.03 02/08/2013 313,277
US$ 2,987,054 BRL 6,225,617 2.08 04/09/2013 203,741
US$ 35,774 CHF 33,715 0.94 01/07/2013 140
US$ 700,722 CHF 656,664 0.94 19/07/2013 6,608
US$ 1,530,000 CLP 768,595,500 502.35 17/07/2013 13,786
US$ 568,605 CLP 281,829,000 495.65 07/08/2013 14,660
US$ 2,313,205 CLP 1,173,602,880 507.35 09/09/2013 17,241
US$ 2,448,729 COP 4,657,879,400 1,902.16 26/07/2013 41,472
US$ 910,000 CZK 18,016,335 19.80 31/07/2013 8,322
US$ 952,499 EUR 724,347 0.76 19/07/2013 10,908
US$ 4,810,920 EUR 3,679,992 0.76 22/07/2013 27,179
US$ 16,520 GBP 10,718 0.65 19/07/2013 266
US$ 2,976,187 INR 172,062,891 57.81 17/07/2013 91,164
US$ 11,880,992 MXN 148,867,210 12.53 26/07/2013 472,631
US$ 7,113,295 MXN 91,690,377 12.89 23/08/2013 104,307
US$ 1,800,000 MYR 5,592,960 3.11 15/07/2013 33,590
US$ 1,464,052 MYR 4,551,006 3.11 12/08/2013 34,744
US$ 18,279 PEN 48,183 2.64 26/07/2013 989
US$ 5,292,915 PLN 17,282,822 3.27 30/08/2013 123,058

Ashmore SICAV – Unaudited Semi-Annual Report for the period ended 30 June 2013
211
Notes to the Consolidated Financial Statements (continued) 10- Financial derivative investments (continued) Ashmore SICAV Emerging Markets Local Currency Corporate Debt Fund (continued) Open financial derivative investments as at 30 June 2013 are detailed below: (continued)
Forward currency contracts (continued)
To receive To pay Rate Date Unrealised gain (US$)
US$ 604,138 RUB 19,140,533 31.68 01/08/2013 23,816
US$ 2,712,750 RUB 86,929,591 32.04 30/08/2013 91,122
US$ 9 THB 290 30.69 12/07/2013 -
US$ 41,509 ZAR 400,000 9.64 30/08/2013 1,538
Unrealised gain on forward currency contracts 2,137,458
Total unrealised gain on financial derivative investments 2,137,458
Forward currency contracts To receive To pay Rate Date Unrealised loss (US$)
BRL 7,679,589 US$ 3,610,000 2.13 02/07/2013 (133,578)
BRL 2,663,112 US$ 1,320,202 2.02 04/09/2013 (129,594)
CHF 15,036,013 US$ 16,333,497 0.92 19/07/2013 (439,950)
CLP 281,829,000 US$ 569,697 494.70 07/08/2013 (15,752)
CLP 1,173,602,880 US$ 2,362,562 496.75 09/09/2013 (66,600)
CZK 17,931,488 US$ 930,000 19.28 31/07/2013 (32,569)
EUR 5,778,898 US$ 7,740,573 0.75 19/07/2013 (228,485)
GBP 1,564 US$ 2,378 0.66 02/07/2013 (6)
GBP 259,915 US$ 406,614 0.64 19/07/2013 (12,436)
INR 172,062,891 US$ 3,009,145 57.18 17/07/2013 (124,121)
KRW 2,015,910,000 US$ 1,786,093 1,128.67 24/07/2013 (26,016)
MXN 71,904,987 US$ 5,650,000 12.73 26/07/2013 (139,599)
MYR 5,592,960 US$ 1,783,754 3.14 15/07/2013 (17,344)
MYR 4,551,006 US$ 1,520,000 2.99 12/08/2013 (90,692)
PHP 3,201,840 US$ 74,809 42.80 24/07/2013 (578)
PLN 17,303,889 US$ 5,220,156 3.31 31/07/2013 (34,069)
RON 4,267,721 US$ 1,253,074 3.41 30/08/2013 (18,674)
RUB 24,932,200 US$ 778,997 32.01 21/08/2013 (25,842)
US$ 1,313,251 BRL 3,011,415 2.29 02/10/2013 (26,369)
US$ 17,605 CHF 16,700 0.95 02/07/2013 (46)
US$ 930,877 IDR 9,385,100,000 10,082.00 17/07/2013 (6,000)
US$ 2,452,690 ILS 9,127,000 3.72 29/08/2013 (51,527)
US$ 1,745,377 KRW 2,015,910,000 1,155.00 24/07/2013 (14,700)
US$ 1,790,000 MXN 24,090,339 13.46 26/07/2013 (56,151)
US$ 2,800,000 MYR 8,996,400 3.21 15/07/2013 (41,309)
US$ 1,730,000 RUB 56,960,250 32.93 22/07/2013 (107)
US$ 7,519,834 RUB 248,556,833 33.05 31/07/2013 (17,529)
US$ 1,800,000 ZAR 18,535,860 10.30 30/08/2013 (52,217)
US$ 1,772,080 ZAR 18,202,273 10.27 30/09/2013 (39,006)
Unrealised (loss) on forward currency contracts (1,840,866)
Total unrealised (loss) on financial derivative investments (1,840,866)
Ashmore SICAV Emerging Markets Global Equity Fund Open financial derivative investments as at 30 June 2013 are detailed below:
Forward currency contracts To receive To pay Rate Date Unrealised gain (US$)
US$ 357,729 CHF 335,293 0.94 19/07/2013 3,313
US$ 31,426 GBP 20,416 0.65 19/07/2013 464
Unrealised gain on forward currency contracts 3,777
Total unrealised gain on financial derivative investments 3,777

Ashmore SICAV – Unaudited Semi-Annual Report for the period ended 30 June 2013
212
Notes to the Consolidated Financial Statements (continued) 10- Financial derivative investments (continued) Ashmore SICAV Emerging Markets Global Equity Fund (continued) Open financial derivative investments as at 30 June 2013 are detailed below: (continued)
To receive To pay Rate Date Unrealised loss (US$)
CHF 4,310,989 US$ 4,680,012 0.92 19/07/2013 (123,159)
GBP 54,910 US$ 85,958 0.64 19/07/2013 (2,683)
HKD 326,839 US$ 42,141 7.76 03/07/2013 (3)
US$ 12,396 HKD 96,159 7.76 02/07/2013 (2)
Unrealised (loss) on forward currency contracts (125,847)
Total unrealised (loss) on financial derivative investments (125,847)
Ashmore SICAV EM Equity Select Fund Open financial derivative investments as at 30 June 2013 are detailed below:
Forward currency contracts To receive To pay Rate Date Unrealised gain (US$)
US$ 3,044 GBP 1,975 0.65 19/07/2013 49
Unrealised gain on forward currency contracts 49
Open future contracts
Quantity Currency Underlying Maturity
date Variation margin (US$)
Commitment (US$) Unrealised gain (US$)
55 USD FTSE CHINA A50 30/07/2013 - 375,375 7,425
32 USD MSCI TAIWAN Index 30/07/2013 - 894,400 16,320
11 HKD H-SHARES Index 30/07/2013 - 655,489 6,099
5 HKD HANG SENG Index 31/07/2013 - 668,130 12,982
28 MYR FTSE KLCI 31/07/2013 - 783,194 9,738
137 TRY BIST 30 30/08/2013 - 654,308 5,700
Unrealised gain on open future contracts 58,264
Total unrealised gain on financial derivative investments 58,313
Forward currency contracts To receive To pay Rate Date Unrealised loss (US$)
GBP 23,153 US$ 36,178 0.64 19/07/2013 (1,065)
ZAR 10,180,331 US$ 1,100,338 9.25 22/07/2013 (77,228)
Unrealised (loss) on forward currency contracts (78,293)
Open future contracts
Quantity Currency Underlying Maturity
date Variation margin (US$)
Commitment (US$) Unrealised loss (US$)
30 TWD ELECTRONICS 17/07/2013 - 1,169,931 (2,704)
15 KRW KOSPI2 Index 13/09/2013 - 1,589,247 (66,919)
Unrealised loss on open future contracts (69,623)
Total unrealised loss on financial derivative investments (147,916)

Ashmore SICAV – Unaudited Semi-Annual Report for the period ended 30 June 2013
213
Notes to the Consolidated Financial Statements (continued) 10- Financial derivative investments (continued) Ashmore SICAV Emerging Markets Global Small – Cap Equity Fund Open financial derivative investments as at 30 June 2013 are detailed below:
Forward currency contracts To receive To pay Rate Date Unrealised gain (US$)
HKD 1,165,271 US$ 150,212 7.76 02/07/2013 23
US$ 6,715 CHF 6,294 0.94 19/07/2013 62
US$ 489,118 EUR 373,504 0.76 19/07/2013 3,593
US$ 25,481 GBP 16,528 0.65 19/07/2013 415
US$ 54,119 HKD 419,733 7.76 03/07/2013 4
Unrealised gain on forward currency contracts 4,097
Total unrealised gain on financial derivative investments 4,097
Forward currency contracts To receive To pay Rate Date Unrealised loss (US$)
CHF 77,321 US$ 83,942 0.92 19/07/2013 (2,211)
EUR 728,058 US$ 974,636 0.75 19/07/2013 (28,221)
GBP 178,858 US$ 279,632 0.64 19/07/2013 (8,382)
Unrealised (loss) on forward currency contracts (38,814)
Total unrealised (loss) on financial derivative investments (38,814)
Ashmore SICAV Emerging Markets Frontier Equity Fund Open financial derivative investments as at 30 June 2013 are detailed below:
Forward currency contracts To receive To pay Rate Date Unrealised gain (US$)
US$ 6,135 GBP 4,000 0.65 01/07/2013 69
Unrealised gain on forward currency contracts 69
Total unrealised gain on financial derivative investments 69
Forward currency contracts To receive To pay Rate Date Unrealised loss (US$)
GBP 4,000 US$ 6,135 0.65 01/07/2013 (68)
GBP 38,127 US$ 58,969 0.65 19/07/2013 (1,147)
Unrealised (loss) on forward currency contracts (1,215)
Total unrealised (loss) on financial derivative investments (1,215)

Ashmore SICAV – Unaudited Semi-Annual Report for the period ended 30 June 2013
214
Notes to the Consolidated Financial Statements (continued) 11- Cash at bank In accordance with the investment strategies of the Ashmore SICAV Local Currency Fund, Ashmore SICAV Emerging Markets Local Currency Bond Fund and Ashmore SICAV Emerging Markets Local Markets Currency Fund, forward positions have been taken primarily to gain market access to emerging market currencies. In order to cover its commitment under such positions, these Sub-Funds maintain appropriate cash levels in their portfolios. As at the balance sheet date, Ashmore SICAV Local Currency Fund held at bank the following time deposits:
Bank Nominal Currency Interest Rate (%) Lock in Period US$
ABN Amro Bank N.V. 50,000,000 US$ 0.30 19/03/2013-19/08/2013 50,000,000
Credit Agricole 50,000,000 US$ 0.28 05/06/2013-05/09/2013 50,000,000
National Bank of Abu Dhabi 50,000,000 US$ 0.19 07/05/2013-08/07/2013 50,000,000
Qatar National Bank London 50,000,000 US$ 0.30 20/05/2013-20/09/2013 50,000,000
Riyad Bank London 50,000,000 US$ 0.23 30/04/2013-30/08/2013 50,000,000
250,000,000
As at the balance sheet date, Ashmore SICAV Emerging Markets Local Markets Currency Fund held at bank the following time deposits:
Bank Nominal Currency Interest Rate (%) Lock in Period US$
ABN Amro Bank N.V. 2,000,000 US$ 0.12 25/06/2013-02/07/2013 2,000,000
Landesbank Hessen-Thueringen 1,300,000 US$ 0.12 28/06/2013-01/07/2013 1,300,000
National Bank of Abu Dhabi 2,000,000 US$ 0.10 27/06/2013-05/07/2013 2,000,000
5,300,000
As at the balance sheet date, Ashmore SICAV Emerging Markets Total Return Fund II held at bank the following time deposits:
Bank Nominal Currency Interest Rate (%) Lock in Period US$
Landesbank Hessen-Thueringen 10,000,000 US$ 0.12 28/06/2013-01/07/2013 10,000,000
10,000,000
The cash balances (in US$) on current accounts as at 30 June 2013 for Ashmore SICAV Sub-Funds were:
Fund Time deposits Cash Balance Total Emerging Markets Debt Fund - 68,924,261 68,924,261 Emerging Markets Sovereign Debt Fund - 7,600,559 7,600,559 Emerging Markets Sovereign Investment Grade Debt Fund - 3,379,366 3,379,366 Turkish Debt Fund 661,720 661,720 Local Currency Fund 250,000,000 338,082,455 588,082,455 Emerging Markets Local Currency Bond Fund - 131,657,356 131,657,356 Emerging Markets Local Markets Currency Fund 5,300,000 1,977,472 7,277,472 Emerging Markets Investment Grade Local Currency Fund - 19,763,972 19,763,972 Emerging Markets Inflation Linked Bond Fund - 4,607,170 4,607,170 Emerging Markets Total Return Fund - 22,573,645 22,573,645 Emerging Markets Total Return Fund II 10,000,000 14,099,386 24,099,386 Emerging Markets Investment Grade Total Return Fund - 5,033,583 5,033,583 Emerging Markets Corporate Debt Fund - 184,099,533 184,099,533 Emerging Markets Investment Grade Corporate Debt Fund - 821,738 821,738 Emerging Markets Local Currency Corporate Debt Fund - 4,907,101 4,907,101 Emerging Markets Asian Corporate Debt Fund - 3,666,697 3,666,697 Emerging Markets Global Equity Fund - 250,732 250,732 EM Equity Select Fund - 1,150,837 1,150,837 Emerging Markets Global Small-Cap Equity Fund - 1,199,881 1,199,881 Emerging Market Frontier Equity Fund - 475,970 475,970 Brazil Equity Fund - 427,130 427,130
The cash balances include collateral for forward exchange contracts which are held with various brokers.

Ashmore SICAV – Unaudited Semi-Annual Report for the period ended 30 June 2013
215
Notes to the Consolidated Financial Statements (continued) 12- Repurchase agreement Ashmore SICAV Emerging Markets Debt Fund
Repurchase agreement contracts as at 30 June 2013 are detailed below:
Name Nominal Interest Rate %
Payable on repo (US$)
Argentina Boden Bonds 7% 03/10/2015 (693,000) 0.25 (693,120)
Argentine Republic Government International Bond 8.28% Discount 31/12/2033 (2,834,759) 0.25 (2,835,821)
Argentine Republic Government International Bond 8.28% Discount 31/12/2033 (1,791,423) 0.30 (1,791,482)
Bolivian Government International Bond 4.875% 29/10/2022 (184,032) - (184,032)
Bolivian Government International Bond 4.875% 29/10/2022 (1,336,000) 0.35 (1,336,052)
Brazil, Banco Nacional de Desenvolvimento Economico e Social 5.5% 12/07/2020 (615,528) 0.35 (616,371)
Brazil, Fibria Overseas Finance 6.75% 03/03/2021 (1,537,650) 0.25 (1,538,152)
Brazil, Marfrig Overseas 9.5% 04/05/2020 (3,201,990) (1.00) (3,201,530)
Brazil, Minerva Luxembourg 7.75% 31/01/2023 (699,680) - (699,680)
Brazil, OSX 3 Leasing 9.25% 20/03/2015 (65,650) (0.45) (65,600)
Brazil, OSX 3 Leasing 9.25% 20/03/2015 (1,134,274) 0.35 (1,135,535)
Brazilian Government International Bond 2.625% 05/01/2023 (2,252,170) - (2,252,170)
Brazilian Government International Bond 8.875% 15/04/2024 (1,921,799) 0.25 (1,922,132)
Brazilian Government International Bond 10.125% 15/05/2027 (4,158,000) 0.34 (4,158,118)
Chile, Automotores Gildemeister 6.75% 15/01/2023 (1,257,600) 0.35 (1,258,945)
Chile, Empresa Nacional del Petroleo 6.25% 08/07/2019 (1,050,000) 0.25 (1,053,325)
Chile, Empresa Nacional del Petroleo 6.25% 08/07/2019 (823,323) 0.35 (824,203)
Chile, Inversiones Alsacia 8% 18/08/2018 (631,600) 0.25 (631,666)
China, China Oriental 7% 17/11/2017 (234,000) (0.25) (233,974)
China, China Oriental 7% 17/11/2017 (509,600) - (509,600)
China, China Oriental 8% 18/08/2015 (153,711) (0.10) (153,593)
China, China Shanshui Cement 10.5% 27/04/2017 (387,141) (0.10) (386,904)
China, Country Garden 11.125% 23/02/2018 (897,300) (0.10) (897,295)
China, Evergrande Real Estate 13% 27/01/2015 (939,050) (0.25) (938,378)
China, Evergrande Real Estate 13% 27/01/2015 (921,148) - (921,148)
China, Fosun International 7.5% 12/05/2016 (553,079) (1.00) (552,695)
China, Hidili Industry International Development 8.625% 04/11/2015 (1,978,845) 0.25 (1,979,560)
China, Longfor Properties 9.5% 07/04/2016 (748,014) - (748,014)
China, Sinochem Overseas Capital 4.5% 12/11/2020 (479,500) 0.35 (480,134)
China, Sinochem Overseas Capital 6.3% 12/11/2040 (850,250) 0.35 (850,266)
China, Sinopec Overseas Development 2012 4.875% 17/05/2042 (855,750) 0.35 (855,767)
China, Sunac China 9.375% 05/04/2018 (3,158,946) (0.25) (3,158,529)
China, Yanlord Land 9.5% 04/05/2017 (1,049,950) (2.00) (1,049,075)
Colombia Government International Bond 6.125% 18/01/2041 (856,800) 0.20 (856,824)
Colombia Government International Bond 7.375% 18/09/2037 (3,167,090) 0.30 (3,171,445)
Croatia Government International Bond 6.375% 24/03/2021 (5,118,340) 0.30 (5,118,466)
Croatia Government International Bond 6.625% 14/07/2020 (1,100,000) - (1,100,000)
Croatia Government International Bond 6.625% 14/07/2020 (1,085,975) 0.25 (1,088,848)
Ghana, Republic of, 8.5% 04/10/2017 (1,423,500) 0.35 (1,423,528)
Hong Kong, Central China Real Estate 8% 28/01/2020 (513,239) - (513,239)
Hong Kong, Shimao Property 9.65% 03/08/2017 (472,360) 0.30 (473,179)
Hungary Government International Bond 6.25% 29/01/2020 (309,304) 0.30 (309,461)
Hungary Government International Bond 6.375% 29/03/2021 (1,710,000) 0.25 (1,715,962)
Indonesia Government International Bond 4.875% 05/05/2021 (2,597,990) 0.25 (2,603,921)
Indonesia Government International Bond 5.875% 13/03/2020 (1,069,110) 0.35 (1,070,004)
Indonesia Government International Bond 11.625% 04/03/2019 (2,593,947) 0.35 (2,594,022)
Indonesia, Perusahaan Listrik Negara 5.25% 24/10/2042 (484,400) 0.35 (484,409)
Ivory Coast Government International Bond Step Cpn 31/12/2032 (1,773,000) 0.25 (1,773,037)
Kazakhstan, ATF Bank 9% 11/05/2016 (833,000) 0.25 (833,029)
Kazakhstan, Halyk Savings Bank of Kazakhstan 7.25% 28/01/2021 (349,670) (0.15) (349,510)
Kazakhstan, Halyk Savings Bank of Kazakhstan 7.25% 28/01/2021 (796,711) - (796,711)
Kazakhstan, Halyk Savings Bank of Kazakhstan 7.25% 28/01/2021 (172,968) 0.25 (173,058)
Kazakhstan, KazMunayGas National 7% 05/05/2020 (1,028,200) 0.25 (1,028,307)
Lebanon Government International Bond 8.25% 12/04/2021 (933,850) 0.35 (933,886)
Lithuania Government International Bond 7.375% 11/02/2020 (5,311,347) 0.25 (5,313,569)

Ashmore SICAV – Unaudited Semi-Annual Report for the period ended 30 June 2013
216
Notes to the Consolidated Financial Statements (continued) 12- Repurchase agreement (continued) Ashmore SICAV Emerging Markets Debt Fund (continued)
Repurchase agreement contracts as at 30 June 2013 are detailed below: (continued)
Name Nominal Interest Rate %
Payable on repo (US$)
Malaysia, Axiata SPV1 Labuan 5.375% 28/04/2020 (523,600) 0.25 (523,607)
Malaysia, Petronas Capital 7.875% 22/05/2022 (964,460) 0.35 (964,497)
Mexico Government International Bond 6.05% 11/01/2040 (1,167,516) 0.25 (1,167,557)
Mexico Government International Bond 6.05% 11/01/2040 (820,828) 0.35 (821,147)
Mexico, Cemex Finance 9.375% 12/10/2022 (1,172,748) 0.25 (1,173,383)
Mexico, Comision Federal de Electricidad 4.875% 26/05/2021 (1,639,080) 0.35 (1,639,144)
Mexico, Corp GEO 8.875% 27/03/2022 (296,944) (2.00) (296,169)
Mexico, Corp GEO FRN 30/06/2020 (675,476) (2.00) (673,712)
Mexico, Desarrolladora Homex 9.75% 25/03/2020 (707,040) (0.50) (706,245)
Mexico, Grupo Papelero Scribede 8.875% 07/04/2020 (312,849) (0.05) (312,822)
Mexico, Urbi Desarrollos Urbanos 9.5% 21/01/2020 (832,480) (1.75) (832,075)
Mexico, Urbi Desarrollos Urbanos 9.75% 03/02/2022 (95,859) (4.00) (95,859)
Mexico, Urbi Desarrollos Urbanos 9.75% 03/02/2022 (128,205) (2.00) (127,998)
Mongolia, Mongolian Mining 8.875% 29/03/2017 (170,100) (0.25) (169,974)
Nigeria, Afren 11.5% 01/02/2016 (3,430,000) 0.25 (3,433,930)
Panama Government International Bond 4.3% 29/04/2053 (339,348) 0.35 (339,503)
Panama Government International Bond 7.125% 29/01/2026 (345,060) 0.35 (345,442)
Peruvian Government International Bond 7.35% 21/07/2025 (737,605) 0.35 (738,616)
Philippine Government International Bond 8.375% 17/06/2019 (695,800) 0.35 (697,146)
Poland Government International Bond 5% 23/03/2022 (5,217,300) 0.30 (5,217,430)
Qatar Government International Bond 6.4% 20/01/2040 (1,262,587) 0.35 (1,262,611)
Qatar, Qtel International Finance 4.5% 31/01/2043 (864,873) (0.10) (864,529)
Russia, Credit Bank of Moscow Via CBOM Finance 7.7% 01/02/2018 (423,337) 0.30 (423,570)
Russia, PromsvyazbankVia PSB Finance 8.5% 25/04/2017 (1,038,000) 0.25 (1,039,067)
Russia, Sberbank of Russia Via SB Capital 6.125% 07/02/2022 (2,342,070) 0.15 (2,342,119)
Russia, SeverstalVia Steel Capital 5.9% 17/10/2022 (632,629) 0.30 (632,983)
Russia, SeverstalVia Steel Capital 6.7% 25/10/2017 (446,542) 0.30 (446,605)
Russia, VimpelCom 7.504% 01/03/2022 (1,464,480) 0.30 (1,464,517)
Russia, Vnesheconombank Via VEB Finance 6.8% 22/11/2025 (2,013,900) 0.35 (2,013,959)
Russian Foreign Bond - Eurobond 5% 29/04/2020 (727,510) 0.25 (728,020)
Russian Foreign Bond - Eurobond Step Cpn 31/03/2030 (4,693,882) 0.30 (4,694,682)
Serbia, Republic of, 4.875% 25/02/2020 (1,272,000) 0.25 (1,272,027)
Serbia, Republic of, 7.25% 28/09/2021 (2,051,244) 0.25 (2,051,787)
South Africa Government International Bond 5.875% 30/05/2022 (1,952,000) 0.20 (1,952,033)
South Africa Government International Bond 5.875% 30/05/2022 (257,869) 0.30 (258,313)
South Africa Government International Bond 5.875% 30/05/2022 (737,730) 0.35 (738,741)
South Africa Government International Bond 6.875% 27/05/2019 (3,543,386) 0.25 (3,543,435)
South Africa Government International Bond 6.875% 27/05/2019 (578,680) 0.25 (578,941)
South Africa, Edcon Pty FRN 15/06/2015 (795,000) (0.10) (1,032,230)
Turkey Government International Bond 3.25% 23/03/2023 (940,253) (0.35) (940,226)
Turkey Government International Bond 6.25% 26/09/2022 (1,008,600) 0.25 (1,008,614)
Ukraine Government International Bond 7.75% 23/09/2020 (2,134,138) 0.25 (2,135,294)
Ukraine Government International Bond 7.8% 28/11/2022 (1,496,000) 0.15 (1,496,031)
United Arab Emirates, Atlantic Finance Step Cpn 27/05/2014 (895,700) 0.25 (898,841)
United Arab Emirates, Dubai Electricity & Water Authority 7.375% 21/10/2020 (836,800) 0.25 (839,857)
United Arab Emirates, Emirate of Dubai Government International Bonds 5.25% 30/01/2043 (1,697,477) 0.25 (1,698,196)
United Arab Emirates, Emirate of Dubai Government International Bonds 7.75% 05/10/2020 (2,035,062) 0.30 (2,037,571)
Uruguay Government International Bond 7.625% 21/03/2036 (2,023,120) 0.25 (2,023,148)
Venezuela Government International Bond 9.25% 15/09/2027 - Eurotlx (1,657,356) 0.30 (1,658,337)
Venezuela Government International Bond 9.25% 15/09/2027 - Eurotlx (790,856) 0.35 (791,594)
Vietnam Government International Bond 6.75% 29/01/2020 (3,042,935) 0.35 (3,046,465)
(139,827,880)

Ashmore SICAV – Unaudited Semi-Annual Report for the period ended 30 June 2013
217
Notes to the Consolidated Financial Statements (continued) 12- Repurchase agreement (continued) Ashmore SICAV Emerging Markets Sovereign Debt Fund Repurchase agreement contracts as at 30 June 2013 are detailed below:
Name Nominal Interest Rate %
Payable on repo (US$)
Argentine Republic Government International Bond 8.75% 02/06/2017 (277,550) (2.50) (277,242)
Russian Foreign Bond - Eurobond Step Cpn 31/03/2030 (1,699,718) 0.25 (1,700,226)
(1,977,468)
Ashmore SICAV Local Currency Fund Reverse repurchase agreement contracts as at 30 June 2013 are detailed below:
Name Nominal Interest Rate %
Receivable on reverse repo (US$)
Turkey Government International Bond 7.25% 15/03/2015 33,804,800 0.30 33,820,012
Turkey Government International Bond 7.5% 14/07/2017 19,816,050 0.30 19,829,261
53,649,273
Ashmore SICAV Emerging Markets Local Markets Currency Fund Reverse repurchase agreement contracts as at 30 June 2013 are detailed below:
Name Nominal Interest Rate %
Receivable on reverse repo (US$)
Hungary Government International Bond 7.625% 29/03/2041 2,002,500 0.40 2,008,797
Turkey Government International Bond 7.5% 14/07/2017 2,011,505 0.50 2,020,333
4,029,130
Ashmore SICAV Emerging Markets Total Return Fund Repurchase agreement contracts as at 30 June 2013 are detailed below:
Name Nominal Interest Rate %
Payable on repo (US$)
Argentine Republic Government International Bond 8.75% 02/06/2017 (89,026) (2.50) (88,927)
(88,927)
Ashmore SICAV Emerging Markets Corporate Debt Fund Repurchase agreement contracts as at 30 June 2013 are detailed below:
Name Nominal Interest Rate %
Payable on repo (US$)
China, Evergrande Real Estate Group Ltd 13% 27/01/2015 (1,635,000) (0.25) (1,632,354)
China, Evergrande Real Estate Group Ltd 13% 27/01/2015 (2,290,847) (0.50) (2,281,907)
Czech Republic, New World Resources NV 7.875% 15/01/2021 (168,600) (3.00) (218,716)
Mexico, Cemex SAB de CV 9.5% 15/06/2018 (1,054,388) (0.25) (1,053,904)
Mexico, Urbi Desarrollos Urbanos SAB de CV 9.75% 03/02/2022 (36,630) (2.00) (36,571)
Peru, Ajecorp BV 6.5% 14/05/2022 (5,926,500) (1.25) (5,926,089)
Peru, Corp Azucarera del Peru SA 6.375% 02/08/2022 (5,278,500) (1.25) (5,278,134)
Qatar, Nakilat Inc 6.267% 31/12/2033 (1,416,053) - (1,416,053)
South Africa, African Bank Ltd 8.125% 24/02/2017 (2,427,142) (0.50) (2,426,569)
(20,270,297)
13- Change in investment portfolio The schedule of changes in the investment portfolios is available on request from the Registered Office in Luxembourg and from the local agents listed under Management and Administration and in the Prospectus.

Ashmore SICAV – Unaudited Semi-Annual Report for the period ended 30 June 2013
218
Notes to the Consolidated Financial Statements (continued)
14- Transactions with related parties
Related party (figures in US$)
Emerging Markets Debt
Fund
Emerging Markets
Sovereign Debt Fund
Emerging Markets
Sovereign Investment
Grade Debt Fund
Turkish Debt Fund Nature
Ashmore Investment Management Limited 4,681,465 333,136 59,375 282,424 Management fees
Ashmore Investment Management Limited 201,309 16,028 (154) 12,632 Promotional fees
Ashmore Investment Management Limited 11,851 1,119 (12) 454 Director insurance fees
Board of Directors (331) (826) 6 42 Director fees
Related Funds 6,000,205 - - 487 Net sales
Related Funds 467 - - 532 Dividends
Related party (figures in US$) Local Currency
Fund
Emerging Markets Local
Currency Bond Fund
Emerging Markets Local
Markets Currency Fund
Emerging Markets
Investment Grade Local
Currency Fund Nature Ashmore Investment Management Limited 7,601,957 13,307,283 56,302 1,479,689 Management fees
Ashmore Investment Management Limited 265,024 606,228 (3,527) 73,551 Promotional fees
Ashmore Investment Management Limited 1,122 7,026 47 1,429 Director insurance fees
Board of Directors 1,284 3,086 (25) (454) Director fees
Related Funds (21,000,000) 14,152,376 (1,299,976) (11,793,411) Net purchases/sales
Related Funds 86,715 27,702 1,118 2,788 Dividends
Related party (figures in US$)
Emerging Markets
Inflation Linked Bond Fund
Emerging Markets Total
Return Fund
Emerging Markets Total
Return Fund II
Emerging Markets
Investment Grade Total
Return Fund Nature
Ashmore Investment Management Limited 238,510 1,836,484 905,390 179,706 Management fees
Ashmore Investment Management Limited 13,374 77,102 37,671 9,847 Promotional fees
Ashmore Investment Management Limited (112) 1,022 719 198 Director insurance fees
Board of Directors (297) 219 152 (13) Director fees
Related Funds - (9,400,000) (6,500,000) - Net purchases
Related Funds - 10,869 7,208 - Dividends
Related party (figures in US$)
Emerging Markets
Corporate Debt Fund
Emerging Markets
Investment Grade Corporate
Debt Fund
Emerging Markets Local
Currency Corporate Debt
Fund
Emerging Markets Asian
Corporate Debt Fund Nature
Ashmore Investment Management Limited 14,426,371 412,707 989,159 113,164 Management fees
Ashmore Investment Management Limited 376,689 12,970 34,721 3,464 Promotional fees
Ashmore Investment Management Limited 8,617 5 275 42 Director insurance fees
Board of Directors 3,308 (147) 14 (28) Director fees
Related Funds 11,350,000 - 10,011,670 - Net sales
Related Funds 31,325 - 7,520 - Dividends
Related party (figures in US$)
Emerging Markets Global
Equity Fund EM Equity Select
Fund
Emerging Markets Global
Small-Cap Equity Fund
Emerging Markets Frontier
Equity Fund Nature Ashmore Investment Management Limited 203,004 142,476 842,768 107,760 Management fees
Ashmore Investment Management Limited 8,477 4,281 25,641 3,092 Promotional fees
Ashmore Investment Management Limited 150 385 (23) 56 Director insurance fees
Board of Directors (35) (1,003) 276 (13) Director fees
Related Funds 612,510 (1,148,558) - - Net sales/purchases
Related Funds 4,642 3,266 - - Dividends

Ashmore SICAV – Unaudited Semi-Annual Report for the period ended 30 June 2013
219
Notes to the Consolidated Financial Statements (continued)
14- Transactions with related parties (continued)
Related party (figures in US$) Brazil Equity
Fund Nature Ashmore Investment Management Limited 29,859 Management fees
Ashmore Investment Management Limited 5,960 Promotional fees
Ashmore Investment Management Limited 38 Director insurance fees
Board of Directors 1,363 Director fees
Relatated Funds are other Funds managed by Ashmore Investment Mangement Limited. 15- Distribution
UK reporting status is granted retrospectively by the UK taxation authorities. The UK taxation authorities have approved the reporting status applications, for the share classes where the Company made applications for the year ended 31 December 2012.
The current list of share classes with UK reporting status and the effective dates when they entered into the UK reporting fund regime can be found on the hmrc.gov.uk website.
The Board of Directors intends to apply to the UK taxation authorities for UK reporting status for the year ended 31 December 2013 and for subsequent years if the Board of Directors deems it appropriate to do so.
The Ashmore SICAV EM Equity Select Fund will not distribute dividends, interest or other income on an annual basis so will not seek to be treated as a “reporting fund” for United Kingdom taxation purposes.
Emerging Markets
Debt Fund
Emerging Markets Sovereign Debt
Fund
Emerging Markets Sovereign
Investment Grade Debt Fund
Local Currency Fund
US$ US$ US$ US$
Retail Class Shares (EUR) Income 966,027 - - 516,506
Retail Class Shares (US$) Income 1,389,650 - - 301,907
Retail Class Shares (GBP) Income 89,092 1,842 - 12,606
Retail Class Shares (NOK) Income 181,844 - - -
Retail Class Shares (CHF) Income - - - 209,475
Retail Class Shares (AUD) Income 525 - - -
Institutional Class Shares (EUR) Income* 1,306,245 - - 516,728
Institutional Class Shares (US$) Income - 2,940,897 503,456 -
Institutional Class Shares (US$) Income* 21,756,007 - - 627,674
Institutional Class Shares (GBP) Income - 207,092 - -
Institutional Class Shares (GBP) Income 19,353,012 - - 4,938,387
Institutional Class Shares (NOK) Income 196,153 - - -
Institutional Class Shares (CHF) Income 387,227 - - 663,699
45,625,782 3,149,831 503,456 7,786,982
Emerging Markets
Local Currency Bond Fund
Emerging Markets Investment Grade
Local Currency Fund
Emerging Markets Inflation Linked
Bond Fund Emerging Markets Total Return Fund
US$ US$ US$ US$
Retail Class Shares (EUR) Income 70,472 - - -
Retail Class Shares (US$) Income 31,955 232 - -
Retail Class Shares (GBP) Income 12,234 - - 3,655
Retail Class Shares (CHF) Income - - - -
Institutional Class Shares (EUR) Income 2,101,046 4,116 - -
Institutional Class Shares (US$) Income 63,488,366 15,296,170 828,953 4,462,760
Institutional Class Shares (GBP) Income 13,515,209 - - 3,053,623
Institutional Class Shares (CHF) Income 203,786 - - -
79,423,068 15,300,518 828,953 7,520,038

Ashmore SICAV – Unaudited Semi-Annual Report for the period ended 30 June 2013
220
Notes to the Consolidated Financial Statements (continued) 15- Distribution (continued) During the period the following distributions were made:
Emerging Markets Total Return Fund
II
Emerging Markets Investment Grade
Total Return Fund
Emerging Markets Corporate Debt
Fund
Emerging Markets Investment Grade
Corporate Debt Fund
US$ US$ US$ US$
Retail Class Shares (EUR) Income - - 926,567 -
Retail Class Shares (US$) Income - - 4,481,066 -
Retail Class Shares (GBP) Income - - 131,665 -
Retail Class Shares (CHF) Income - - 85,546 -
Institutional Class Shares (EUR) Income - 33,536 26,667,994 -
Institutional Class Shares (US$) Income 445,018 108,824 111,772,254 1,747,534
Institutional Class Shares (GBP) Income - - 47,748 -
Institutional Class Shares (NOK) Income - - 78,393 -
Institutional Class Shares (CHF) Income - - 440,816 -
Institutional Class Shares II (JPY) Income - - 283,624 -
445,018 142,360 144,915,673 1,747,534
Emerging Markets Local Currency Corporate Debt
Fund
Emerging Markets Asian Corporate
Debt Fund
Emerging Markets Global Equity
Fund
Emerging Markets Global Small-Cap
Equity Fund US$ US$ US$ US$
Retail Class Shares (EUR) Income 1,816 - 23 -
Retail Class Shares (US$) Income - - 249 -
Retail Class Shares (GBP) Income 6,854 - 47 -
Retail Class Shares (CHF) Income 133 - - -
Institutional Class Shares (US$) Income 5,510,767 541,983 189,514 153,316
Institutional Class Shares (CHF) Income - - 38,430 -
5,519,570 541,983 228,263 153,316
16- European Savings Directive
From 1 July 2005 distributions and proceeds on redemption from UCITS may be reportable or subject to withholding tax in accordance with the EU Savings Directive, Council Directive 2003/48/EC. Ashmore SICAV is a UCITS for the purposes of the Directive. Only savings income payments are reportable or subject to withholding tax. Distributions are savings income payments if a Sub-Fund holds more than 15% of its assets in “eligible money debts” and proceeds on redemptions are savings income payments if a Sub-Fund holds more than 40% of its assets in eligible money debts. All of the Sub-Funds are deemed to be within scope of the Directive with the exception of Emerging Markets Global Equity Fund, EM Equity Select Fund, Emerging Markets Global Small-Cap Equity Fund, Emerging Markets Frontier Equity Fund and Brazil Equity Fund. Responsibility for compliance with the Directive remains that of the “paying agent” as defined by the Directive. 17- Risk Management The Fund uses a risk management process which enables it to assess the exposure of each of the Sub-Funds to market, liquidity and counterparty risks, including operational risks, which are material for the Sub-Fund. As part of the risk management process, the Fund calculates the global exposure of each Sub-Fund by using either the commitment approach or the Value-at-Risk (VaR) methodology. The methodology used depends on an assessment of the risk profile of the relevant Sub-Fund resulting from its policy (including but not limited to its potential use of financial derivative instruments and features thereof) in accordance with relevant European and Luxembourg laws and regulations. In the interest of the Shareholders, the Fund has determined that it will, as a default, use the commitment approach to monitor and measure the global exposure of each Sub-Fund unless otherwise specified for a particular Sub-Fund. This approach measures the global exposure related to positions in financial derivative instruments and other efficient portfolio management techniques which, unless otherwise specified for a particular Sub-Fund, may not exceed the total net value of the portfolio of the relevant Sub-Fund. The global risk on derivatives has been determined according to the commitment approach during the reporting period from 1 January 2013 until 30 June 2013.

Ashmore SICAV – Unaudited Semi-Annual Report for the period ended 30 June 2013
221
Notes to the Consolidated Financial Statements (continued) 18- Additional information concerning representation in Germany Deutsche Bank AG, TSS Post-IPO Services, Taunusanlage 12, 60325 Frankfurt am Main, acts as the German representative of the Company and carries out the function of the Company’s paying agent in relation to the shares distributed in or from Germany.
Foreign investment companies must provide documentation to the German fiscal authorities upon request e.g. in order to verify the accuracy of published tax information. The basis upon which such figures are calculated is open to interpretation and it cannot be guaranteed that the German fiscal authorities will accept the investment company’s calculation methodology in every material respect. In addition, if it transpires that these publications are incorrect, any subsequent correction will, as a general rule, not have a retrospective effect and will, as a general rule, only take effect during the current financial period. Consequently, the correction may positively or negatively affect the investors who receive a distribution or an attribution of deemed income distributions in the current period. 19- Additional information concerning representation in Switzerland The Directors appointed BNP Paribas Securities Services, Paris, Succursale de Zurich, Selnaustrasse 16, CH - 8022 Zurich, as the Company’s representative and paying agent for Switzerland. In accordance with Article 124 CISA, BNP Paribas Securities Services, Paris, Succursale de Zurich, represents the Fund vis a vis the investors and the Swiss Financial Market Supervisory Authority FINMA. For shares distributed in or from Switzerland, the performance place is at the BNP Paribas Securities Services, Paris, Succursale de Zurich address. Investors can obtain the following information free of charge from the representative at the above address: the Prospectus, the Key Investor Information Document (KIID) (both of which are also available for potential investors), the most recent audited annual and un-audited interim reports, copies of the Articles of Incorporation and any amendments thereto, in German, and a list of the purchases and sales made on behalf of the Fund. 19- Subsquent events Effective 17 July 2013, Steve Hicks replaced Micheal Moody as Chairman of the Board of Directors.

Ashmore SICAV – Unaudited Semi-Annual Report for the period ended 30 June 2013
222
Supplementary Information on Fair Value Measurement For certain of the Company’s financial instruments, including cash and cash equivalents, amounts due to/from brokers, dividends receivable and other assets, accounts payable and accrued expenses, their carrying amounts approximate fair value due to the immediate or short-term nature of these financial instruments. The Company’s investments are carried at market value which approximates fair value. Repurchase agreements are of a short term nature and their carrying amount approximates their fair value. FASB ASC Topic 820, Fair Value Measurements and Disclosures ("FASB ASC Topic 820") establishes a fair value hierarchy that prioritises the inputs to valuation techniques used to measure fair value. The hierarchy gives the highest priority to unadjusted quoted prices in active markets for identical assets or liabilities (level 1 measurement) and the lowest priority to unobservable inputs (level 3 measurement). The three levels of the fair value hierarchy under FASB ASC TOPIC 820 are as follows: Level 1 inputs are quoted prices (unadjusted) in active markets for identical assets or liabilities that the reporting entity has the ability to access at the measurement date. Level 2 inputs are inputs other than quoted prices included within Level 1 that are observable for the asset or liability, either directly or indirectly, including: - quoted prices for similar assets or liabilities in active markets - quoted prices for identical or similar assets or liabilities in markets that are not active - inputs other than quoted prices that are observable for the asset or liability - inputs that are derived principally from or corroborated by an observable market. Level 3 inputs are unobservable inputs for the asset or liability. Inputs are used in applying the various valuation techniques and broadly refer to the assumptions that market participants use to make valuation decisions, including assumptions about risk. Inputs may include price information, volatility statistics, specific and broad credit data, liquidity statistics, and other factors. A financial instrument’s level within the fair value hierarchy is based on the lowest level of any input that is significant to the fair value measurement. However, the determination of what constitutes “observable” requires significant judgment by the Investment Manager. The Investment Manager considers observable data to be that market data which is readily available, regularly distributed or updated, reliable and verifiable, not proprietary, and provided by independent sources that are actively involved in the relevant market. The categorisation of a financial instrument within the hierarchy is based upon the pricing transparency of the instrument and does not necessarily correspond to the Investment Manager's perceived risk of that instrument. Investments: Investments whose values are based on quoted market prices in active markets, and are therefore classified within level 1, include active listed equities, certain U.S. government and sovereign obligations, and certain money market securities. The Investment Manager does not adjust the quoted price for such instruments, even in situations where the Company holds a large position and a sale could reasonably impact the quoted price. Investments that trade in markets that are not considered to be active, but are valued based on quoted market prices, dealer quotations or alternative pricing sources supported by observable inputs are classified within level 2. These may include government and sovereign obligations, government agency securities, corporate bonds, and municipal and provincial obligations. Investments classified within level 3 have significant unobservable inputs, as they trade infrequently or not at all. Level 3 instruments may include private equity, certain loan participations, less liquid corporate debt securities (including distressed debt instruments) and collateralised debt obligations. Also included in this category are options, swaps, government and sovereign obligations, government agency securities and corporate bonds for which independent broker prices are used and information relating to the inputs of the price models is currently unavailable. When observable prices are not available for these securities, the Investment Manager uses one or more valuation techniques (e.g., the market approach, the income approach or, the cost approach) for which sufficient and reliable data is available. Within level 3, the use of the market approach generally consists of using comparable market transactions, while the use of the income approach generally consists of the net present value of estimated future cash flows, adjusted as appropriate for liquidity, credit, market and/or other risk factors.

Ashmore SICAV – Unaudited Semi-Annual Report for the period ended 30 June 2013
223
Supplementary Information on Fair Value Measurement (continued) The inputs used by the Investment Manager in estimating the value of level 3 investments include the original transaction price, recent transactions in the same or similar instruments, completed or pending third-party transactions in the underlying investment or comparable issuers, subsequent rounds of financing, recapitalisations and other transactions across the capital structure, offerings in the equity or debt capital markets, and changes in financial ratios or cash flows. Level 3 investments may also be adjusted to reflect illiquidity and/or non-transferability, with the amount of such discount estimated by the Investment Manager in the absence of market information. The fair value measurement of level 3 investments does not include transaction costs that may have been capitalised as part of the security's cost basis. Level 3 fair value measurements are based primarily on the Investment Manager’s own estimates and assumptions. Therefore, the results cannot be determined with precision, cannot be substantiated by comparison to quoted prices in active markets, and may not be realised in a current sale or immediate settlement of the asset or liability. Additionally, there are inherent uncertainties in any fair value measurement technique, and changes in the underlying assumptions used, including discount rates, liquidity risks, and estimates of future cash flows, could significantly affect the fair value measurement amounts and may therefore impact the Company’s results of operations. Derivative Instruments: Derivative instruments can be exchange-traded or privately negotiated over-the-counter ("OTC"). Exchange-traded derivatives, such as futures contracts and exchange traded option contracts, are typically classified within level 1 or level 2 of the fair value hierarchy depending on whether or not they are deemed to be actively traded. OTC derivatives, including forwards, credit default swaps, total return swaps, and interest rate swaps, are valued by the Investment Manager using observable inputs, such as quotations received from the counterparty, dealers or brokers, whenever these are available and considered reliable. In instances where models are used, the value of an OTC derivative depends upon the contractual terms of, and specific risks inherent in, the instrument as well as the availability and reliability of observable inputs. Such inputs include market prices for reference securities, yield curves, credit curves, measures of volatility, prepayment rates and correlations of such inputs. Certain OTC derivatives, such as generic forwards, swaps and options, have inputs which can generally be corroborated by market data and are therefore classified within level 2. Those OTC derivatives that have less liquidity or for which inputs are unobservable are classified within level 3. While the valuations of these less liquid OTC derivatives may utilise some level 1 and/or level 2 inputs, they also include other unobservable inputs which are considered significant to the fair value determination. At each measurement date, the Investment Manager updates the level 1 and level 2 inputs to reflect observable inputs, though the resulting gains and losses are reflected within level 3 due to the significance of the unobservable inputs. The following tables present the assets and liabilities that are measured at fair value on a recurring basis as at 30 June 2013. Ashmore SICAV Emerging Markets Debt Fund
Level 1 Level 2 Level 3 Total Investments 1,003,722,168 108,652,786 7,498,033 1,119,872,987 Derivative assets - 7,489,843 - 7,489,843 Derivative liabilities - (17,383,374) - (17,383,374) Repurchase agreements - (139,827,880) - (139,827,880) Total 1,003,722,168 (41,068,625) 7,498,033 970,151,576
Ashmore SICAV Emerging Markets Sovereign Debt Fund
Level 1 Level 2 Level 3 Total Investments 113,994,618 1,318,450 182,567 115,495,635 Derivative assets - 56,266 - 56,266 Derivative liabilities - (2,642,368) - (2,642,368) Repurchase agreements - (1,977,468) - (1,977,468) Total 113,994,618 (3,245,120) 182,567 110,932,065
Ashmore SICAV Emerging Markets Sovereign Investment Grade Debt Fund
Level 1 Level 2 Level 3 Total Investments 57,990,997 1,002,375 - 58,993,372 Derivative assets - 123 - 123 Total 57,990,997 1,002,498 - 58,993,495

Ashmore SICAV – Unaudited Semi-Annual Report for the period ended 30 June 2013
224
Supplementary Information on Fair Value Measurement (continued) Ashmore SICAV Turkish Debt Fund
Level 1 Level 2 Level 3 Total Investments 30,388,536 10,539,135 4,206,639 45,134,310 Derivative assets - 82,606 - 82,606 Derivative liabilities - (47,277) - (47,277) Total 30,388,536 10,574,464 4,206,639 45,169,639
Ashmore SICAV Local Currency Fund
Level 1 Level 2 Level 3 Total Investments 96,493,340 728,492,405 11,843,871 836,829,616 Derivative assets - 22,180,850 709,254 22,890,104 Derivative liabilities - (62,124,957) (479,728) (62,604,685) Reverse repurchase agreements - 53,649,273 - 53,649,273 Total 96,493,340 742,197,571 12,073,397 850,764,308
Ashmore SICAV Emerging Markets Local Currency Bond Fund
Level 1 Level 2 Level 3 Total Investments 1,184,350,152 1,374,532,045 3,305,539 2,562,187,736 Derivative assets - 47,793,880 1,571,754 49,365,634 Derivative liabilities - (68,467,061) (974,926) (69,441,987) Total 1,184,350,152 1,353,858,864 3,902,367 2,542,111,383
Ashmore SICAV Emerging Markets Local Markets Currency Fund
Level 1 Level 2 Level 3 Total Investments - 2,683,511 - 2,683,511 Derivative assets - 250,769 - 250,769 Derivative liabilities - (427,515) - (427,515) Reverse repurchase agreements - 4,029,130 - 4,029,130 Total - 6,535,895 - 6,535,895
Ashmore SICAV Emerging Markets Investment Grade Local Currency Fund
Level 1 Level 2 Level 3 Total Investments 137,362,560 170,025,628 1,200,854 308,589,042 Derivative assets - 4,267,815 1,079,419 5,347,234 Derivative liabilities - (6,849,395) (111,978) (6,961,373) Total 137,362,560 167,444,048 2,168,295 306,974,903
Ashmore SICAV Emerging Markets Inflation Linked Bond Fund
Level 1 Level 2 Level 3 Total Investments 3,128,901 41,282,689 - 44,411,590 Derivative assets - 953,635 - 953,635 Derivative liabilities - (800,140) - (800,140) Total 3,128,901 41,436,184 - 44,565,085
Ashmore SICAV Emerging Markets Total Return Fund
Level 1 Level 2 Level 3 Total Investments 196,450,604 83,779,223 961,739 281,191,566 Derivative assets - 2,989,480 54,762 3,044,242 Derivative liabilities - (7,432,725) (34,207) (7,466,932) Repurchase agreements - (88,927) - (88,927) Total 196,450,604 79,247,051 982,294 276,679,949

Ashmore SICAV – Unaudited Semi-Annual Report for the period ended 30 June 2013
225
Supplementary Information on Fair Value Measurement (continued) Ashmore SICAV Emerging Markets Total Return Fund II
Level 1 Level 2 Level 3 Total Investments 100,996,632 49,800,467 185,261 150,982,360 Derivative assets - 1,426,707 - 1,426,707 Derivative liabilities - (1,602,846) - (1,602,846) Total 100,996,632 49,624,328 185,261 150,806,221
Ashmore SICAV Emerging Markets Investment Grade Total Return Fund
Level 1 Level 2 Level 3 Total Investments 32,792,663 6,302,391 - 39,095,054 Derivative assets - 284,425 6,582 291,007 Derivative liabilities - (1,385,769) (4,812) (1,390,581) Total 32,792,663 5,201,047 1,770 37,995,480
Ashmore SICAV Emerging Markets Corporate Debt Fund
Level 1 Level 2 Level 3 Total Investments 2,557,312,660 500,551,279 111,251,920 3,169,115,859 Derivative assets - 7,564,434 - 7,564,434 Derivative liabilities - (47,734,519) - (47,734,519) Repurchase agreements - (20,270,297) - (20,270,297) Total 2,557,312,660 440,110,897 111,251,920 3,108,675,477
Ashmore SICAV Emerging Markets Investment Grade Corporate Debt Fund
Level 1 Level 2 Level 3 Total Investments 74,011,389 4,611,104 - 78,622,493 Derivative assets - 132,105 - 132,105 Derivative liabilities - (1,204,659) - (1,204,659) Total 74,011,389 3,538,550 - 77,549,939
Ashmore SICAV Emerging Markets Local Currency Corporate Debt Fund
Level 1 Level 2 Level 3 Total Investments 68,331,940 80,513,025 12,291,309 161,136,274 Derivative assets - 2,137,458 - 2,137,458 Derivative liabilities - (1,840,866) - (1,840,866) Total 68,331,940 80,809,617 12,291,309 161,432,866
Ashmore SICAV Emerging Markets Asian Corporate Debt Fund
Level 1 Level 2 Level 3 Total Investments 22,121,634 3,176,410 352,441 25,650,485 Total 22,121,634 3,176,410 352,441 25,650,485
Ashmore SICAV Emerging Markets Global Equity Fund
Level 1 Level 2 Level 3 Total Investments 36,259,879 159,777 - 36,419,656 Derivative assets - 3,777 - 3,777 Derivative liabilities - (125,847) - (125,847) Total 36,259,879 37,707 - 36,297,586

Ashmore SICAV – Unaudited Semi-Annual Report for the period ended 30 June 2013
226
Supplementary Information on Fair Value Measurement (continued) Ashmore SICAV EM Equity Select Fund
Level 1 Level 2 Level 3 Total Investments 14,029,519 13,737,888 - 27,767,407 Derivative assets 58,264 49 - 58,313 Derivative liabilities (69,623) (78,293) - (147,916) Total 14,018,160 13,659,644 - 27,677,804
Ashmore SICAV Emerging Markets Global Small-Cap Equity Fund
Level 1 Level 2 Level 3 Total Investments 116,924,320 245,489 - 117,169,809 Derivative assets - 4,097 - 4,097 Derivative liabilities - (38,814) - (38,814) Total 116,924,320 210,772 - 117,135,092
Ashmore SICAV Emerging Markets Frontier Equity Fund
Level 1 Level 2 Level 3 Total Investments 15,084,700 408,220 - 15,492,920 Derivative assets - 69 - 69 Derivative liabilities - (1,215) - (1,215) Total 15,084,700 407,074 - 15,491,774
Ashmore SICAV Brazil Equity Fund
Level 1 Level 2 Level 3 Total Investments 3,244,304 - - 3,244,304 Total 3,244,304 - - 3,244,304