Embed Size (px)
Citation preview
Active Sub-Funds : ZENIT MULTISTRATEGY SICAV Global Opportunities
ZENIT MULTISTRATEGY SICAV Global Opportunities ZENIT MULTISTRATEGY SICAV Stock-Picking
ZENIT MULTISTRATEGY SICAV Defender ZENIT MULTISTRATEGY SICAV Stability
I N V E S T M E N T M A N A G E R __________________________________________________________________
ZENIT SGR SpA Milano
R.C.S. Luxembourg B 121.973
Annual Report, including Audited Financial Statements as at December 31st, 2015
No subscription can be received on the basis of this report. Subscriptions can only be accepted on the basis of the key investor information
document and the latest prospectus, if applicable, the latest annual report and the latest semi-annual report if published thereafter
ZENIT MULTISTRATEGY SICAV
2
Société d'Investissement à Capital Variable R.C. Luxembourg B 121.973
Board of Directors Chairman Mr Marco SIMION, Senior Portfolio Manager Member of the Investment Committee ZENIT SGR SPA, Milano
Directors Mr Marco ROSATI, Chief Executive Officer ZENIT SGR SPA, Milano Mr Régis LEONI, Sous Directeur BANQUE DEGROOF LUXEMBOURG S.A. Mr Alessandro BOTTINELLI Premier Conseiller BANQUE DEGROOF LUXEMBOURG S.A. (until February 16th, 2015) Mrs Daniela DI DODO, Fondé de Pouvoir Principal BANQUE DEGROOF LUXEMBOURG S.A. Registered Office 12, rue Eugène Ruppert, L-2453 Luxembourg Co-Promoters BANQUE DEGROOF LUXEMBOURG S.A. 12, rue Eugène Ruppert, L-2453 Luxembourg ZENIT SGR SPA Via Privata Maria Teresa, 7, I-20123 Milano Management Company DEGROOF GESTION INSTITUTIONNELLE - LUXEMBOURG 12, rue Eugène Ruppert, L-2453 Luxembourg Investment Manager ZENIT SGR SPA Via Privata Maria Teresa, 7, I-20123 Milano Custodian, Domiciliary, Corporate BANQUE DEGROOF LUXEMBOURG S.A. and Administrative Agent, 12, rue Eugène Ruppert, L-2453 Luxembourg Paying Agent, Registrar and Transfer Agent. Cabinet de révision agréé / Auditor DELOITTE AUDIT Société à reponsabilité limitée 560, rue de Neudorf, L-2220 Luxembourg
ZENIT MULTISTRATEGY SICAV
3
Contents Page General Information….…………………………………………………..……………………………… 4 Board of Directors’ Report..………………….………………………………………………………… 5 - 7 Report of the réviseur d’entreprises agréé.…………………………………………………………. 8 - 9 Statement of Net Assets………………………………………………………………………………. 10 - 11 Statement of Operations………………………………………………………………………………. 12 - 13 Statement of Changes in Net Assets……………………………………………………………….. 14 - 15 Schedule of Investments………………………………………………………………………………. 16 - 23 Geographic Allocation of Investments……………………………………………………………….. 24 Economic Allocation by Industry Group of Investments ……………………………………..….. 25 - 27 Allocation by Currency…………………………………………………………………………………... 28 Changes in the Number of Shares……………………………………………………………………. 29 Total Expense Ratio……………………………………………………………………………………… 30 Total Net Assets and Net Asset Value per Share…………………………………………………. 31 Notes to the Financial Statements……………………………………..……………………………. 32 - 39 Unaudited Information…………………..………………………………..……………………………. 40
ZENIT MULTISTRATEGY SICAV
4
General Information ZENIT MULTISTRATEGY SICAV (the “SICAV”) was established as an Investment Company with Variable Capital (“SICAV”) on November 29th, 2006 for an unlimited period, in accordance with part I of the Law of December 17th, 2010 relating to Undertakings for Collective Investment of the Grand-Duchy of Luxembourg as amended. Its Articles are registered with the « Greffe du Tribunal d’Arrondissement » of Luxembourg where they are available for inspection. Copies may be obtained there. Semi-annual and annual financial reports, the net asset value, the subscription price and the redemption price along with any other notices to the shareholders are available at the registered office of the SICAV, and the Management Company and from all distributors. The SICAV has four Sub-Funds : . ZENIT MULTISTRATEGY SICAV Global Opportunities; . ZENIT MULTISTRATEGY SICAV Stock-Picking; . ZENIT MULTISTRATEGY SICAV Defender; . ZENIT MULTISTRATEGY SICAV Stability. The Sub-Funds ZENIT MULTISTRATEGY SICAV Global Opportunities, ZENIT
MULTISTRATEGY SICAV Stock-Picking, ZENIT MULTISTRATEGY SICAV Defender and ZENIT MULTISTRATEGY SICAV Stability offer 4 classes of shares which differ in the status of the investors and the minimum amounts of subscription and holding requirement : - Class I Institutional Shares, intended for institutional investors ; - Class P Private Shares, intended for private investors through management or advisory mandate; - Class R Retail Shares, intended for direct distribution to retail investors and individual investors with direct placement; - Class Q Shares, intended for all types of investors listed and tradable on a regulated European Stock Exchange (launched on November 10th, 2015). The Net Asset Value for each Sub-Fund is calculated in Euro (EUR); it is determined on each bank business day in Luxembourg. The SICAV publishes an annual report closed on the last day of the financial year, including audited Financial Statements, as well as unaudited semi-annual report closed on the last day of the sixth month of the financial year.
ZENIT MULTISTRATEGY SICAV
5
Board of Directors’ Report The year 2015 end positively for many financial markets, even if some variables, particularly in the field of raw materials, showed a weak trend that has affected various asset classes.
• The first quarter was marked by a brilliant performance of various indices, especially in Europe, where it has served the program of quantitative easing by the European Central Bank and the weak trend of the Euro against the US Dollar, from which we anticipated a boost for the continental economy in particular for exports. • In the second quarter, the intonation of the markets was characterized by increased nervousness, due to the worsening of the Greek crisis, at stock-list Chinese fibrillation reported a sharp contraction after a very quick, and the possibility of a change in US monetary policy in a more restrictive. • The third quarter saw a major weakness of the financial markets, tight amid fears triggered by the assumptions of rising interest rates in the United States and the impact on global growth to a slowdown increasingly clear though gradual emerging economies. • The last quarter ended so basically positive for markets, although investors' attention was catalysed by a variety of factors that led to a drop in early 2016 quotes. Among these, it should be noted the rising interest rates in December by the Federal Reserve in the United States and the persistent weakness in oil prices, with potential destabilizing effects that could have on oil-producing countries and on some economic sectors more related to mining. Stock marketsStock marketsStock marketsStock markets: stock market results in 2015 were only moderately positive: the MSCI World index in local currency, which summarizes the evolution of purses of developed economies, gained in the year the 2,1%, while the MSCI Emerging Markets index has recorded a result of -5,8%. Among the major markets, the best bag went to Japanese list (+12,1%), followed by the Euro area aggregate index (+7,4%); the United States, however, have gotten a positive result only through dividends (+0,8%), reflecting the fears concerning the more restrictive monetary policy and corporate earnings less exciting than previous years. Within the Euro area, the Italian market has obtained a yield equal to 15,0% for the year. Among the major continental stock exchanges, France has registered a growth of 9,6% and Germany of 13,6%. Among all the sectors, the best was that of essential consumer goods, which achieved 12.2% over a period of twelve months. Bond marketsBond marketsBond marketsBond markets: despite the rise in rates by the Federal Reserve in the last part of the year, they managed to get slightly positive returns in 2015, equivalent to +0,8%. Similar trend for triple-A Government bonds in the Eurozone, which ended the year with a modest gain (+0,4%), while the euro-periphery sovereign bond yields showed aggregate of 0,2%. Among investment-grade corporate bonds segment results, Euro and US Dollar were lined up, albeit slightly negative and 0,4% and -0,7%-respectively. Well marked the divergence in the high-yield segment, where securities denominated in Euro lost 0,3% on year while those denominated in US Dollar 5,0%. Also in the segment of emerging bonds 2015 results were heterogeneous: the securities denominated in hard currencies have gained in the year the 0,8%, while those denominated in local currency have discounted the weakness of its divided losing 10,7%.
ZENIT MULTISTRATEGY SICAV
6
Board of Directors’ Report (continued) Currency markets and raw materialsCurrency markets and raw materialsCurrency markets and raw materialsCurrency markets and raw materials: in addition to the aforementioned weakness emerging currencies (-15,8% the overall result of the 2015), the foreign exchange market is the substantial appreciation of the US Dollar, which has gained 9,0% compared to basket of currencies of trading partners and the descent of the Euro, which finished the year with a loss of 7,2%. The commodities market has recorded a noticeable decline in prices, as measured by the composite index in 24,7%, driven downward by the sector of energy (-38,9%), in turn dominated by the collapse in oil prices, a harbinger as previously noted by numerous effects on the economic outlook and financial markets. ZENIT MULTISTRATEGY SICAV GLOBAL OPPORTUNITIES In 2015, the ZENIT MULTISTRATEGY SICAV GLOBAL OPPORTUNITIES sub-fund Class I, reported a positive return of +10.85% with an average volatility in 30 days of 14,89%. As an indication, it should be noted that the MSCI World equity index showed a return of +2,75% in US Dollar and +8,30% positive in Euro with an average volatility in 30 days of 12,56%. The bond index Barclays Euro Agg Total Return gained a modest +1,00% with an average volatility in 30 days of 3,50%. The sub-fund was on average invested in its equity at 36% in Europe and 25% in USA, the main areas were Information Technology (average weight 24%), Health Care (average weight 9,5%), Consumer Discretionary (average weight 8,2%) and Industrials (average weight of 6,7%). The sectors that contributed most to the positive performance were Information Technology, Materials and Health Care. The use of derivatives instruments in major stock indices contributed positively to more than 50% of the result. The sectors that have penalized the result were Industrials and Consumer Staples. ZENIT MULTISTRATEGY SICAV STOCK PICKING In ZENIT MULTISTRATEGY SICAV STOCK PICKING, the sub-fund reported for class I a result of +18,35% going up more than the FTSE All share, 15,38% Italy Fund's benchmark. This overperformance was obtained with a 30-day average annual volatility 20,31% better than 23,99% recorded by the benchmark index. Asset allocation level : the sub-fund was invested in equity between 85% and 105%.
ZENIT MULTISTRATEGY SICAV
7
Board of Directors’ Report (continued) Areas where concentrated the main investment choices were industrial, cyclical and consumers with a strong tilt on mid-size small. In strong underweight energy and utilities were held. A dynamic exhibition was held on financials, with greater concentration on the banks. At the level of individual titles the main contributions to the final result, they came to Italcementi, Digital bros, Banca popolare di Milano and Saras. Negatively have impacted Banca Monte dei paschi, Carige, Rcs and Caleffi. Liquidity is on average between 5% and 10% of the sub-fund.
ZENIT MULTISTRATEGY SICAV STABILITY The sub-fund, that started on May 19th, 2015, achieved in Class I a negative performance of -6,88% and an average volatility of 30 days of 5,51%. As an indication, it should be remembered that the MSCI World Equity Index has registered in the same period a return of -7,88% in US Dollar and -5,43% in Euro with an average volatility of 13,57% at 30 days. The index Euro Agg Barclays Bond Total Return gained a modest 0,32% with an average volatility of 30 days of 3,97%. The sub-fund was invested on average to 82,5% Equity, in funds 3,6% and 13,9% in cash.
ZENIT MULTISTRATEGY SICAV DEFENDER The sub-fund closed 2015 with a loss of -0,36% for the institutional class. The Sub-Fund has had an average 30-day volatility of 7,59%. On average, the sub-fund was invested in the upper part of the equity exposure permitted with little weight in the US and greater exposure to Europe. The sub-fund was put on hold. March 16th, 2016 Past performance is not necessarily indicative of future performance.
Deloitte. Deloitte Aud it Société à responsabilité limitée
560, rue de Neudorf L-2220 Luxembourg B p 1173 L-lO 11 Luxembourg
Tel +352 451 451 Fax +352 451 452 992 www.deloitte.lu
REPORT OF THE REVISEUR D'ENTREPRISES AGREE
To the Shareholders of ZENIT MUL TIS TRA TEGY SICAV Société d'Investissement à Capital Variable 12, rue Eugène Ruppert L-2453 Luxembourg
Following our appointment by the Annual General Meeting of the Shareholders dated April .so=. 2015, we have audited the accompanying financial statements of ZENIT MUL TISTRATEGY SICAV (the "SICAV") and of each of its Sub-Funds, which comprise the combined statement of net assets, the statement of net assets and the schedule of investments of each of its Sub-Funds as at December 31 st, 2015, and the combined statement of operations and the statement of operations for each of its Sub-Funds and the combined changes in net assets, the statement of changes in net assets of each of its Sub-Funds for the year then ended, and a summary of significant accounting policies and other explanatory notes to the financial statements.
Responsibility of the Board of Directors of the SICAV for the financial statements
The Board of Directors of the SICAV is responsible for the preparation and fair presentation of these financial statements in accordance with Luxembourg legal and regulatory requirements relating to the preparation of the financial statements and for such intemal control as the Board of Directors of the SICAV determines is necessary to enable the preparation of financial statements that are free from material misstatement, whether due to fraud or error.
Responsibility of the réviseur d'entreprises agréé
Our responsibility is to express an opinion on these financial statements based on our audit. We conducted our audit in accordance with International Standards on Auditing as adopted for Luxembourg by the Commission de Surveillance du Secteur Financier. Those standards require that we comply with ethical requirements and plan and perform the audit to obtain reasonable assurance whether the financial statements are free from material misstatement.
An audit involves performing procedures to obtain audit evidence about the amounts and disclosures in the financial statements. The procedures selected depend on the réviseur d'entreprises agréé's judgement, including the assessment of the risks of material misstatement of the financial statements, whether due to fraud or error. In making those risk assessments, the réviseur d'entreprises agréé considers internal control relevant to the entity's preparation and fair presentation of the financial statements in order to design audit procedures that are appropriate in the circumstances, but not for the purpose of expressing an opinion on the effectiveness of the entity's intemal control.
An audit also includes evaluating the appropriateness of accounting policies used and the reasonableness of accounting estimates made by the Board of Directors of the SICA V, as well as evaluating the overall presentation of the financial statements.
We believe that the audit evidence we have obtained is sufficient and appropriate to provide a basis for our audit opinion.
Société à responsabilité limitée au capital de 35.000 € ReS Luxembourg B 67.895 VAT LU25101535 Autorisation d'établissement 10022179
8
Deloitte.
REPORT OF THE REVISEUR D'ENTREPRISES AGREE (continued)
Opinion
In our opinion, the financial statements give a true and fair view of the financial position of ZENIT MUL TISTRATEGY SICAV and of each of its Sub-Funds as at December 31 st, 2015, and of the results of their operations and changes in their net assets for the year then ended in accordance with Luxembourg legal and regulatory requirements relating to the preparation of the financial statements.
Other matter
Supplementary information included in the annual report has been reviewed in the context of our mandate but has not been subject to specific audit procedures carried out in accordance with the standards described above. Consequently, we express no opinion on such information. However, we have no observation to make concerning such information in the context of the financial statements taken as a whole.
For Deloitte Audit, Cabinet de révision agréé
Philippe Lenges, Réviseur d'entreprises agréé Partner
Luxembourg, April 21 ". 2016 560, rue de Neudorf L-2220 Luxembourg
9
ZENIT MULTISTRATEGY SICAV
10
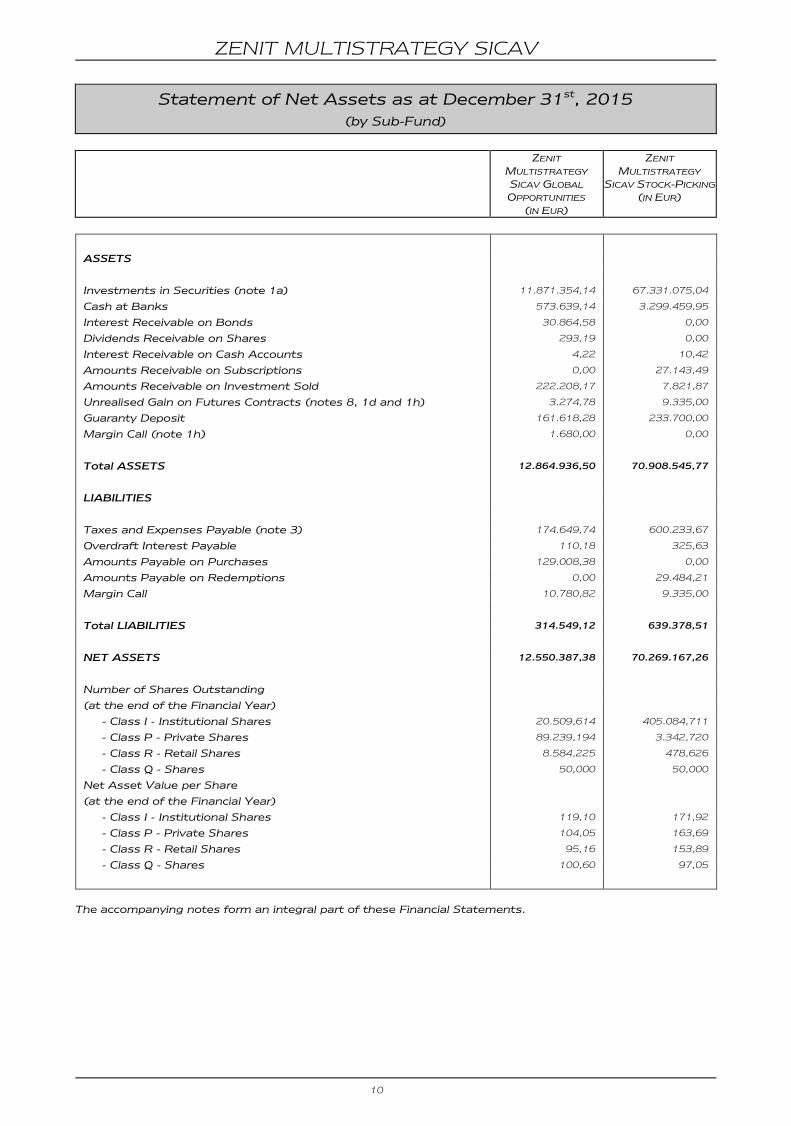
Statement of Net Assets as at December 31st, 2015
(by Sub-Fund)
ZENIT
MULTISTRATEGY
SICAV GLOBAL
OPPORTUNITIES
(IN EUR)
ZENIT
MULTISTRATEGY
SICAV STOCK-PICKING
(IN EUR)
ASSETS
Investments in Securities (note 1a) 11.871.354,14 67.331.075,04
Cash at Banks 573.639,14 3.299.459,95
Interest Receivable on Bonds 30.864,58 0,00
Dividends Receivable on Shares 293,19 0,00
Interest Receivable on Cash Accounts 4,22 10,42
Amounts Receivable on Subscriptions 0,00 27.143,49
Amounts Receivable on Investment Sold 222.208,17 7.821,87
Unrealised Gain on Futures Contracts (notes 8, 1d and 1h) 3.274,78 9.335,00
Guaranty Deposit 161.618,28 233.700,00
Margin Call (note 1h) 1.680,00 0,00
Total ASSETS 12.864.936,50 70.908.545,77
LIABILITIES
Taxes and Expenses Payable (note 3) 174.649,74 600.233,67
Overdraft Interest Payable 110,18 325,63
Amounts Payable on Purchases 129.008,38 0,00
Amounts Payable on Redemptions 0,00 29.484,21
Margin Call 10.780,82 9.335,00
Total LIABILITIES 314.549,12 639.378,51
NET ASSETS 12.550.387,38 70.269.167,26
Number of Shares Outstanding
(at the end of the Financial Year)
- Class I - Institutional Shares 20.509,614 405.084,711
- Class P - Private Shares 89.239,194 3.342,720
- Class R - Retail Shares 8.584,225 478,626
- Class Q - Shares 50,000 50,000
Net Asset Value per Share
(at the end of the Financial Year)
- Class I - Institutional Shares 119,10 171,92
- Class P - Private Shares 104,05 163,69
- Class R - Retail Shares 95,16 153,89
- Class Q - Shares 100,60 97,05
The accompanying notes form an integral part of these Financial Statements.
ZENIT MULTISTRATEGY SICAV
11
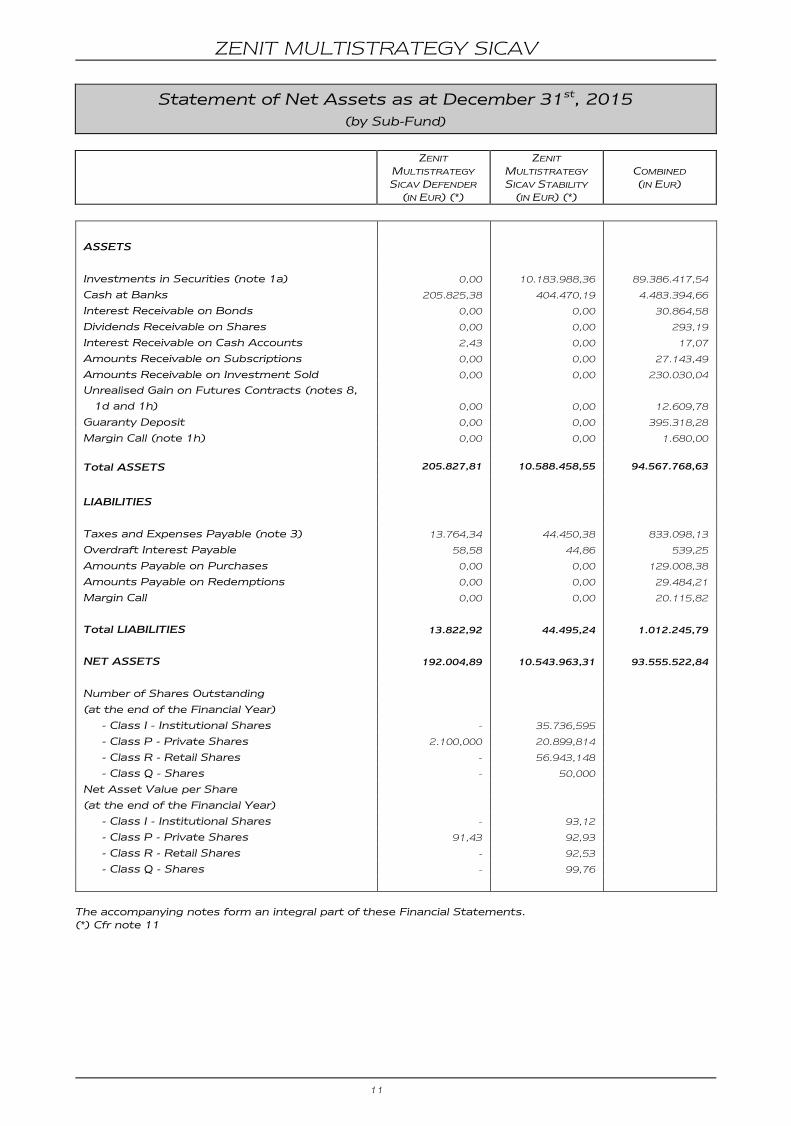
Statement of Net Assets as at December 31st, 2015
(by Sub-Fund)
ZENIT
MULTISTRATEGY
SICAV DEFENDER (IN EUR) (*)
ZENIT
MULTISTRATEGY
SICAV STABILITY (IN EUR) (*)
COMBINED (IN EUR)
ASSETS
Investments in Securities (note 1a) 0,00 10.183.988,36 89.386.417,54
Cash at Banks 205.825,38 404.470,19 4.483.394,66
Interest Receivable on Bonds 0,00 0,00 30.864,58
Dividends Receivable on Shares 0,00 0,00 293,19
Interest Receivable on Cash Accounts 2,43 0,00 17,07
Amounts Receivable on Subscriptions 0,00 0,00 27.143,49
Amounts Receivable on Investment Sold 0,00 0,00 230.030,04
Unrealised Gain on Futures Contracts (notes 8,
1d and 1h)
0,00
0,00
12.609,78
Guaranty Deposit 0,00 0,00 395.318,28
Margin Call (note 1h) 0,00 0,00 1.680,00
Total ASSETS 205.827,81 10.588.458,55 94.567.768,63
LIABILITIES
Taxes and Expenses Payable (note 3) 13.764,34 44.450,38 833.098,13
Overdraft Interest Payable 58,58 44,86 539,25
Amounts Payable on Purchases 0,00 0,00 129.008,38
Amounts Payable on Redemptions 0,00 0,00 29.484,21
Margin Call 0,00 0,00 20.115,82
Total LIABILITIES 13.822,92 44.495,24 1.012.245,79
NET ASSETS 192.004,89 10.543.963,31 93.555.522,84
Number of Shares Outstanding
(at the end of the Financial Year)
- Class I - Institutional Shares - 35.736,595
- Class P - Private Shares 2.100,000 20.899,814
- Class R - Retail Shares - 56.943,148
- Class Q - Shares - 50,000
Net Asset Value per Share
(at the end of the Financial Year)
- Class I - Institutional Shares - 93,12
- Class P - Private Shares 91,43 92,93
- Class R - Retail Shares - 92,53
- Class Q - Shares - 99,76
The accompanying notes form an integral part of these Financial Statements. (*) Cfr note 11
ZENIT MULTISTRATEGY SICAV
12
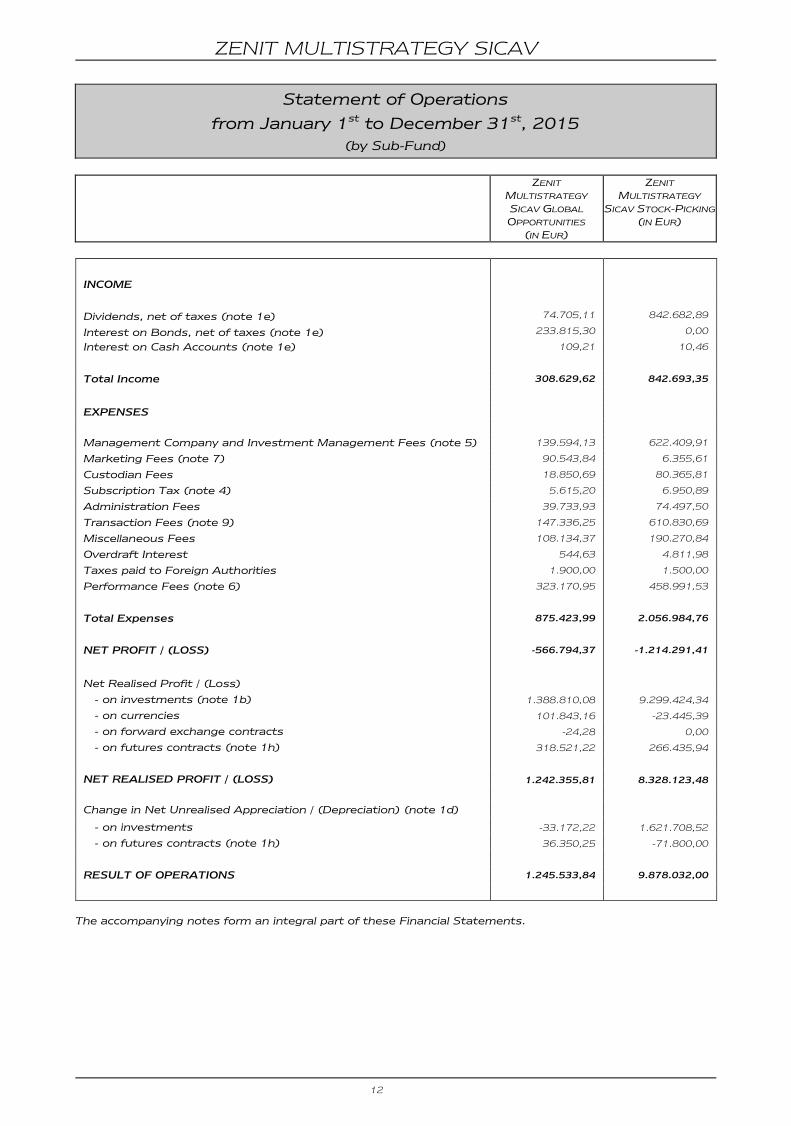
Statement of Operations
from January 1st to December 31st, 2015
(by Sub-Fund)
ZENIT
MULTISTRATEGY
SICAV GLOBAL
OPPORTUNITIES (IN EUR)
ZENIT
MULTISTRATEGY
SICAV STOCK-PICKING
(IN EUR)
INCOME
Dividends, net of taxes (note 1e) 74.705,11 842.682,89
Interest on Bonds, net of taxes (note 1e) 233.815,30 0,00
Interest on Cash Accounts (note 1e) 109,21 10,46
Total Income 308.629,62 842.693,35
EXPENSES
Management Company and Investment Management Fees (note 5) 139.594,13 622.409,91
Marketing Fees (note 7) 90.543,84 6.355,61
Custodian Fees 18.850,69 80.365,81
Subscription Tax (note 4) 5.615,20 6.950,89
Administration Fees 39.733,93 74.497,50
Transaction Fees (note 9) 147.336,25 610.830,69
Miscellaneous Fees 108.134,37 190.270,84
Overdraft Interest 544,63 4.811,98
Taxes paid to Foreign Authorities 1.900,00 1.500,00
Performance Fees (note 6) 323.170,95 458.991,53
Total Expenses 875.423,99 2.056.984,76
NET PROFIT / (LOSS) -566.794,37 -1.214.291,41
Net Realised Profit / (Loss)
- on investments (note 1b) 1.388.810,08 9.299.424,34
- on currencies 101.843,16 -23.445,39
- on forward exchange contracts -24,28 0,00
- on futures contracts (note 1h) 318.521,22 266.435,94
NET REALISED PROFIT / (LOSS) 1.242.355,81 8.328.123,48
Change in Net Unrealised Appreciation / (Depreciation) (note 1d)
- on investments -33.172,22 1.621.708,52
- on futures contracts (note 1h) 36.350,25 -71.800,00
RESULT OF OPERATIONS 1.245.533,84 9.878.032,00
The accompanying notes form an integral part of these Financial Statements.
ZENIT MULTISTRATEGY SICAV
13
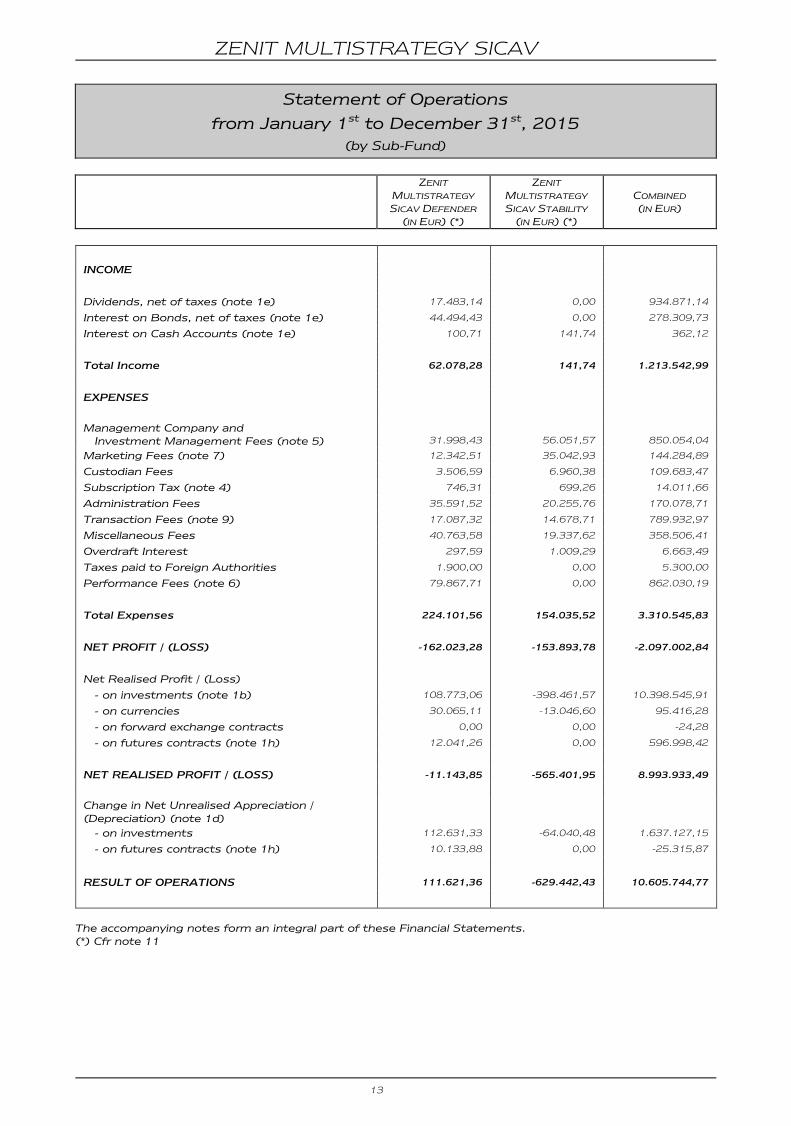
Statement of Operations
from January 1st to December 31st, 2015
(by Sub-Fund)
ZENIT
MULTISTRATEGY
SICAV DEFENDER (IN EUR) (*)
ZENIT
MULTISTRATEGY
SICAV STABILITY (IN EUR) (*)
COMBINED (IN EUR)
INCOME
Dividends, net of taxes (note 1e) 17.483,14 0,00 934.871,14
Interest on Bonds, net of taxes (note 1e) 44.494,43 0,00 278.309,73
Interest on Cash Accounts (note 1e) 100,71 141,74 362,12
Total Income 62.078,28 141,74 1.213.542,99
EXPENSES
Management Company and Investment Management Fees (note 5)
31.998,43
56.051,57
850.054,04
Marketing Fees (note 7) 12.342,51 35.042,93 144.284,89
Custodian Fees 3.506,59 6.960,38 109.683,47
Subscription Tax (note 4) 746,31 699,26 14.011,66
Administration Fees 35.591,52 20.255,76 170.078,71
Transaction Fees (note 9) 17.087,32 14.678,71 789.932,97
Miscellaneous Fees 40.763,58 19.337,62 358.506,41
Overdraft Interest 297,59 1.009,29 6.663,49
Taxes paid to Foreign Authorities 1.900,00 0,00 5.300,00
Performance Fees (note 6) 79.867,71 0,00 862.030,19
Total Expenses 224.101,56 154.035,52 3.310.545,83
NET PROFIT / (LOSS) -162.023,28 -153.893,78 -2.097.002,84
Net Realised Profit / (Loss)
- on investments (note 1b) 108.773,06 -398.461,57 10.398.545,91
- on currencies 30.065,11 -13.046,60 95.416,28
- on forward exchange contracts 0,00 0,00 -24,28
- on futures contracts (note 1h) 12.041,26 0,00 596.998,42
NET REALISED PROFIT / (LOSS) -11.143,85 -565.401,95 8.993.933,49
Change in Net Unrealised Appreciation /
(Depreciation) (note 1d)
- on investments 112.631,33 -64.040,48 1.637.127,15
- on futures contracts (note 1h) 10.133,88 0,00 -25.315,87
RESULT OF OPERATIONS 111.621,36 -629.442,43 10.605.744,77
The accompanying notes form an integral part of these Financial Statements. (*) Cfr note 11
ZENIT MULTISTRATEGY SICAV
14
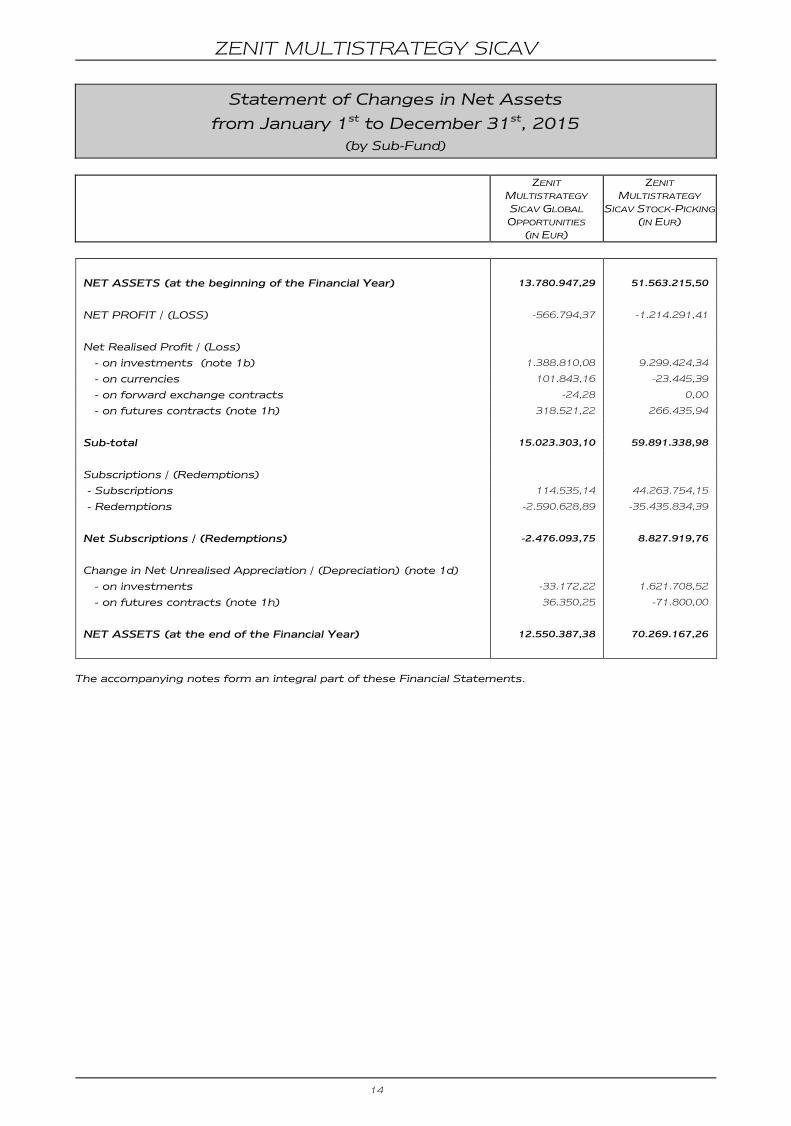
Statement of Changes in Net Assets
from January 1st to December 31st, 2015
(by Sub-Fund)
ZENIT
MULTISTRATEGY
SICAV GLOBAL
OPPORTUNITIES (IN EUR)
ZENIT
MULTISTRATEGY
SICAV STOCK-PICKING
(IN EUR)
NET ASSETS (at the beginning of the Financial Year) 13.780.947,29 51.563.215,50
NET PROFIT / (LOSS) -566.794,37 -1.214.291,41
Net Realised Profit / (Loss)
- on investments (note 1b) 1.388.810,08 9.299.424,34
- on currencies 101.843,16 -23.445,39
- on forward exchange contracts -24,28 0,00
- on futures contracts (note 1h) 318.521,22 266.435,94
Sub-total 15.023.303,10 59.891.338,98
Subscriptions / (Redemptions)
- Subscriptions 114.535,14 44.263.754,15
- Redemptions -2.590.628,89 -35.435.834,39
Net Subscriptions / (Redemptions) -2.476.093,75 8.827.919,76
Change in Net Unrealised Appreciation / (Depreciation) (note 1d)
- on investments -33.172,22 1.621.708,52
- on futures contracts (note 1h) 36.350,25 -71.800,00
NET ASSETS (at the end of the Financial Year) 12.550.387,38 70.269.167,26
The accompanying notes form an integral part of these Financial Statements.
ZENIT MULTISTRATEGY SICAV
15
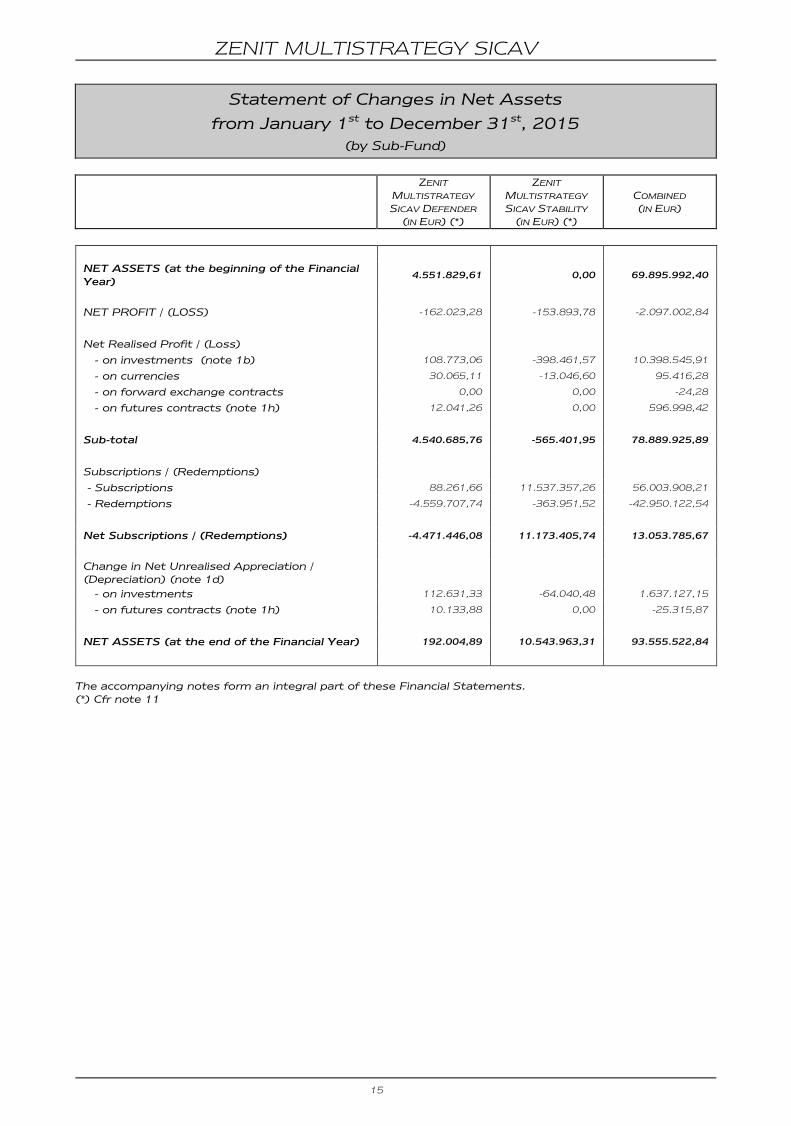
Statement of Changes in Net Assets
from January 1st to December 31st, 2015
(by Sub-Fund)
ZENIT
MULTISTRATEGY
SICAV DEFENDER (IN EUR) (*)
ZENIT
MULTISTRATEGY
SICAV STABILITY (IN EUR) (*)
COMBINED (IN EUR)
NET ASSETS (at the beginning of the Financial
Year) 4.551.829,61 0,00 69.895.992,40
NET PROFIT / (LOSS) -162.023,28 -153.893,78 -2.097.002,84
Net Realised Profit / (Loss)
- on investments (note 1b) 108.773,06 -398.461,57 10.398.545,91
- on currencies 30.065,11 -13.046,60 95.416,28
- on forward exchange contracts 0,00 0,00 -24,28
- on futures contracts (note 1h) 12.041,26 0,00 596.998,42
Sub-total 4.540.685,76 -565.401,95 78.889.925,89
Subscriptions / (Redemptions)
- Subscriptions 88.261,66 11.537.357,26 56.003.908,21
- Redemptions -4.559.707,74 -363.951,52 -42.950.122,54
Net Subscriptions / (Redemptions) -4.471.446,08 11.173.405,74 13.053.785,67
Change in Net Unrealised Appreciation / (Depreciation) (note 1d)
- on investments 112.631,33 -64.040,48 1.637.127,15
- on futures contracts (note 1h) 10.133,88 0,00 -25.315,87
NET ASSETS (at the end of the Financial Year) 192.004,89 10.543.963,31 93.555.522,84
The accompanying notes form an integral part of these Financial Statements. (*) Cfr note 11
ZENIT MULTISTRATEGY SICAV
16
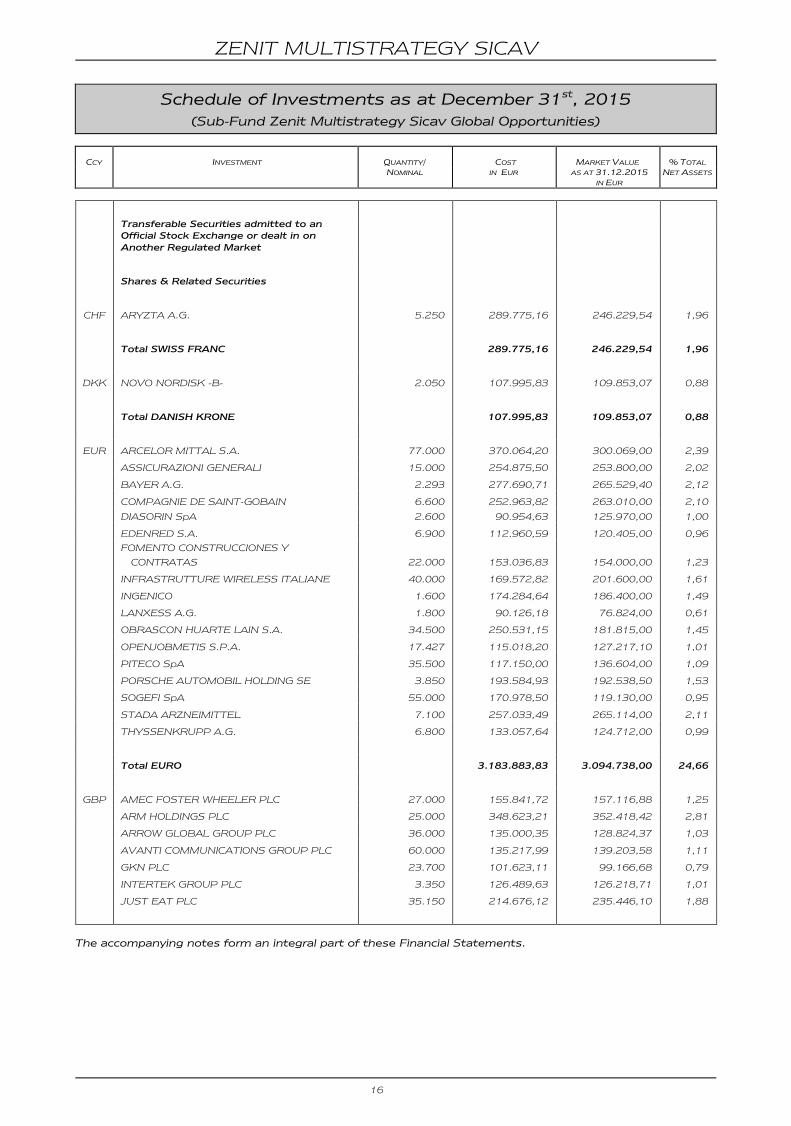
Schedule of Investments as at December 31st, 2015
(Sub-Fund Zenit Multistrategy Sicav Global Opportunities)
CCY INVESTMENT QUANTITY/ COST MARKET VALUE % TOTAL
NOMINAL IN EUR AS AT 31.12.2015
IN EUR
NET ASSETS
Transferable Securities admitted to an Official Stock Exchange or dealt in on
Another Regulated Market
Shares & Related Securities
CHF ARYZTA A.G. 5.250 289.775,16 246.229,54 1,96
Total SWISS FRANC 289.775,16 246.229,54 1,96
DKK NOVO NORDISK -B- 2.050 107.995,83 109.853,07 0,88
Total DANISH KRONE 107.995,83 109.853,07 0,88
EUR ARCELOR MITTAL S.A. 77.000 370.064,20 300.069,00 2,39
EUR ASSICURAZIONI GENERALI 15.000 254.875,50 253.800,00 2,02
EUR BAYER A.G. 2.293 277.690,71 265.529,40 2,12
EUR COMPAGNIE DE SAINT-GOBAIN 6.600 252.963,82 263.010,00 2,10
EUR DIASORIN SpA 2.600 90.954,63 125.970,00 1,00
EUR EDENRED S.A. 6.900 112.960,59 120.405,00 0,96
EUR
FOMENTO CONSTRUCCIONES Y
CONTRATAS
22.000
153.036,83
154.000,00
1,23
EUR INFRASTRUTTURE WIRELESS ITALIANE 40.000 169.572,82 201.600,00 1,61
EUR INGENICO 1.600 174.284,64 186.400,00 1,49
EUR LANXESS A.G. 1.800 90.126,18 76.824,00 0,61
EUR OBRASCON HUARTE LAIN S.A. 34.500 250.531,15 181.815,00 1,45
OPENJOBMETIS S.P.A. 17.427 115.018,20 127.217,10 1,01
EUR PITECO SpA 35.500 117.150,00 136.604,00 1,09
EUR PORSCHE AUTOMOBIL HOLDING SE 3.850 193.584,93 192.538,50 1,53
EUR SOGEFI SpA 55.000 170.978,50 119.130,00 0,95
EUR STADA ARZNEIMITTEL 7.100 257.033,49 265.114,00 2,11
EUR THYSSENKRUPP A.G. 6.800 133.057,64 124.712,00 0,99
Total EURO 3.183.883,83 3.094.738,00 24,66
GBP AMEC FOSTER WHEELER PLC 27.000 155.841,72 157.116,88 1,25
GBP ARM HOLDINGS PLC 25.000 348.623,21 352.418,42 2,81
GBP ARROW GLOBAL GROUP PLC 36.000 135.000,35 128.824,37 1,03
GBP AVANTI COMMUNICATIONS GROUP PLC 60.000 135.217,99 139.203,58 1,11
GBP GKN PLC 23.700 101.623,11 99.166,68 0,79
GBP INTERTEK GROUP PLC 3.350 126.489,63 126.218,71 1,01
GBP JUST EAT PLC 35.150 214.676,12 235.446,10 1,88
The accompanying notes form an integral part of these Financial Statements.
ZENIT MULTISTRATEGY SICAV
17
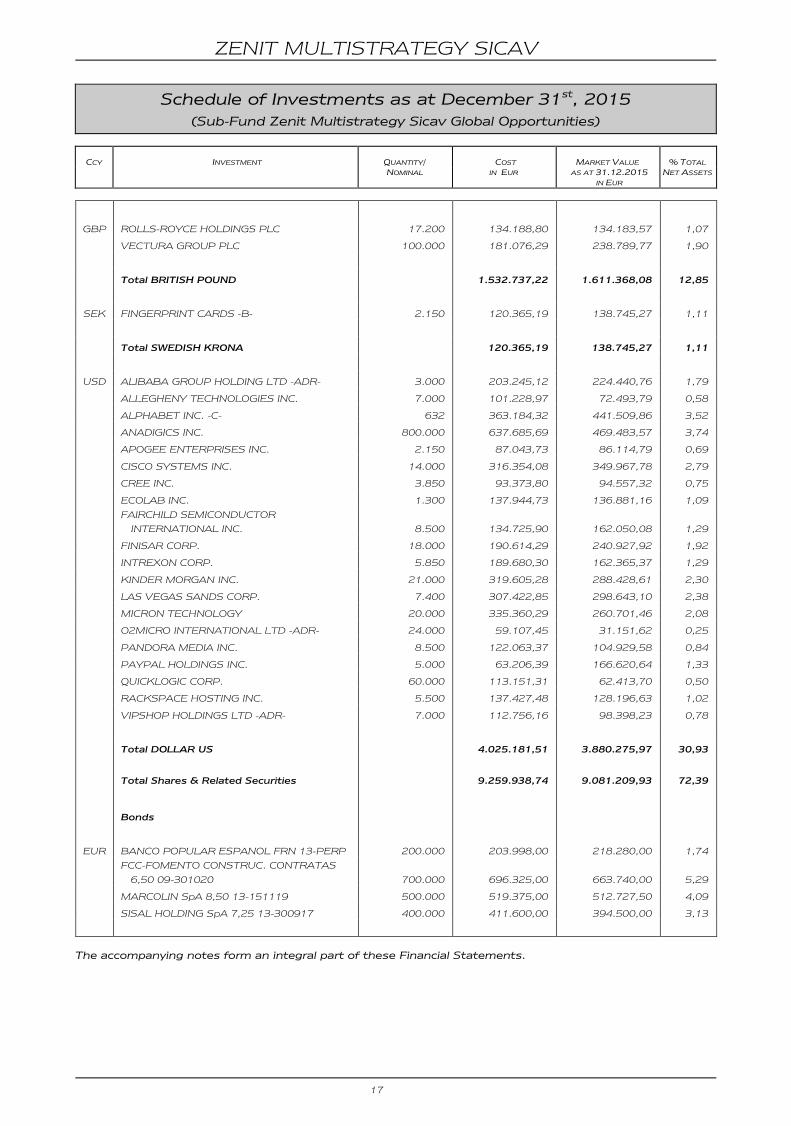
Schedule of Investments as at December 31st, 2015
(Sub-Fund Zenit Multistrategy Sicav Global Opportunities)
CCY INVESTMENT QUANTITY/ COST MARKET VALUE % TOTAL
NOMINAL IN EUR AS AT 31.12.2015
IN EUR
NET ASSETS
GBP ROLLS-ROYCE HOLDINGS PLC 17.200 134.188,80 134.183,57 1,07
GBP VECTURA GROUP PLC 100.000 181.076,29 238.789,77 1,90
Total BRITISH POUND 1.532.737,22 1.611.368,08 12,85
SEK FINGERPRINT CARDS -B- 2.150 120.365,19 138.745,27 1,11
Total SWEDISH KRONA 120.365,19 138.745,27 1,11
USD ALIBABA GROUP HOLDING LTD -ADR- 3.000 203.245,12 224.440,76 1,79
USD ALLEGHENY TECHNOLOGIES INC. 7.000 101.228,97 72.493,79 0,58
USD ALPHABET INC. -C- 632 363.184,32 441.509,86 3,52
USD ANADIGICS INC. 800.000 637.685,69 469.483,57 3,74
USD APOGEE ENTERPRISES INC. 2.150 87.043,73 86.114,79 0,69
USD CISCO SYSTEMS INC. 14.000 316.354,08 349.967,78 2,79
USD CREE INC. 3.850 93.373,80 94.557,32 0,75
USD ECOLAB INC. 1.300 137.944,73 136.881,16 1,09
USD
FAIRCHILD SEMICONDUCTOR
INTERNATIONAL INC.
8.500
134.725,90
162.050,08
1,29
USD FINISAR CORP. 18.000 190.614,29 240.927,92 1,92
USD INTREXON CORP. 5.850 189.680,30 162.365,37 1,29
USD KINDER MORGAN INC. 21.000 319.605,28 288.428,61 2,30
USD LAS VEGAS SANDS CORP. 7.400 307.422,85 298.643,10 2,38
USD MICRON TECHNOLOGY 20.000 335.360,29 260.701,46 2,08
USD O2MICRO INTERNATIONAL LTD -ADR- 24.000 59.107,45 31.151,62 0,25
USD PANDORA MEDIA INC. 8.500 122.063,37 104.929,58 0,84
USD PAYPAL HOLDINGS INC. 5.000 63.206,39 166.620,64 1,33
USD QUICKLOGIC CORP. 60.000 113.151,31 62.413,70 0,50
USD RACKSPACE HOSTING INC. 5.500 137.427,48 128.196,63 1,02
USD VIPSHOP HOLDINGS LTD -ADR- 7.000 112.756,16 98.398,23 0,78
Total DOLLAR US 4.025.181,51 3.880.275,97 30,93
Total Shares & Related Securities 9.259.938,74 9.081.209,93 72,39
Bonds
EUR BANCO POPULAR ESPANOL FRN 13-PERP 200.000 203.998,00 218.280,00 1,74
EUR
FCC-FOMENTO CONSTRUC. CONTRATAS
6,50 09-301020
700.000
696.325,00
663.740,00
5,29
EUR MARCOLIN SpA 8,50 13-151119 500.000 519.375,00 512.727,50 4,09
EUR SISAL HOLDING SpA 7,25 13-300917 400.000 411.600,00 394.500,00 3,13
The accompanying notes form an integral part of these Financial Statements.
ZENIT MULTISTRATEGY SICAV
18
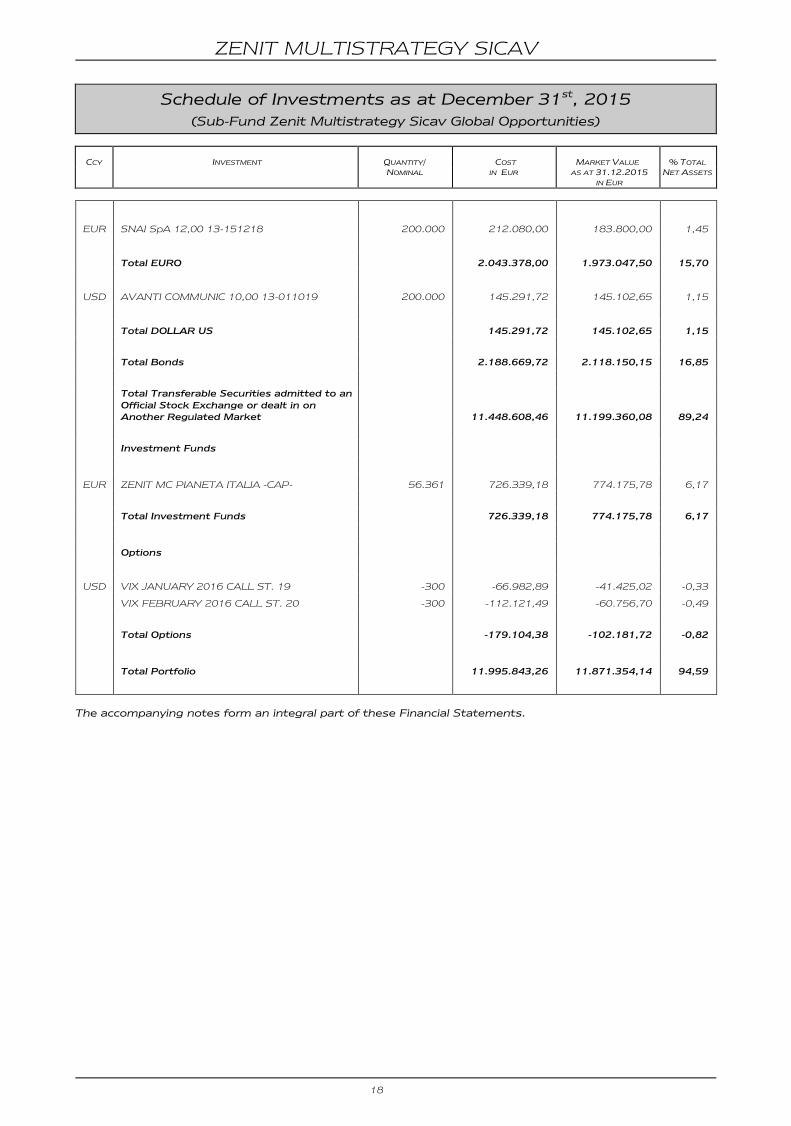
Schedule of Investments as at December 31st, 2015
(Sub-Fund Zenit Multistrategy Sicav Global Opportunities)
CCY INVESTMENT QUANTITY/ COST MARKET VALUE % TOTAL
NOMINAL IN EUR AS AT 31.12.2015
IN EUR
NET ASSETS
EUR SNAI SpA 12,00 13-151218 200.000 212.080,00 183.800,00 1,45
Total EURO 2.043.378,00 1.973.047,50 15,70
USD AVANTI COMMUNIC 10,00 13-011019 200.000 145.291,72 145.102,65 1,15
Total DOLLAR US 145.291,72 145.102,65 1,15
Total Bonds 2.188.669,72 2.118.150,15 16,85
Total Transferable Securities admitted to an
Official Stock Exchange or dealt in on Another Regulated Market
11.448.608,46
11.199.360,08
89,24
Investment Funds
EUR ZENIT MC PIANETA ITALIA -CAP- 56.361 726.339,18 774.175,78 6,17
Total Investment Funds 726.339,18 774.175,78 6,17
Options
USD VIX JANUARY 2016 CALL ST. 19 -300 -66.982,89 -41.425,02 -0,33
USD VIX FEBRUARY 2016 CALL ST. 20 -300 -112.121,49 -60.756,70 -0,49
Total Options -179.104,38 -102.181,72 -0,82
Total Portfolio 11.995.843,26 11.871.354,14 94,59
The accompanying notes form an integral part of these Financial Statements.
ZENIT MULTISTRATEGY SICAV
19
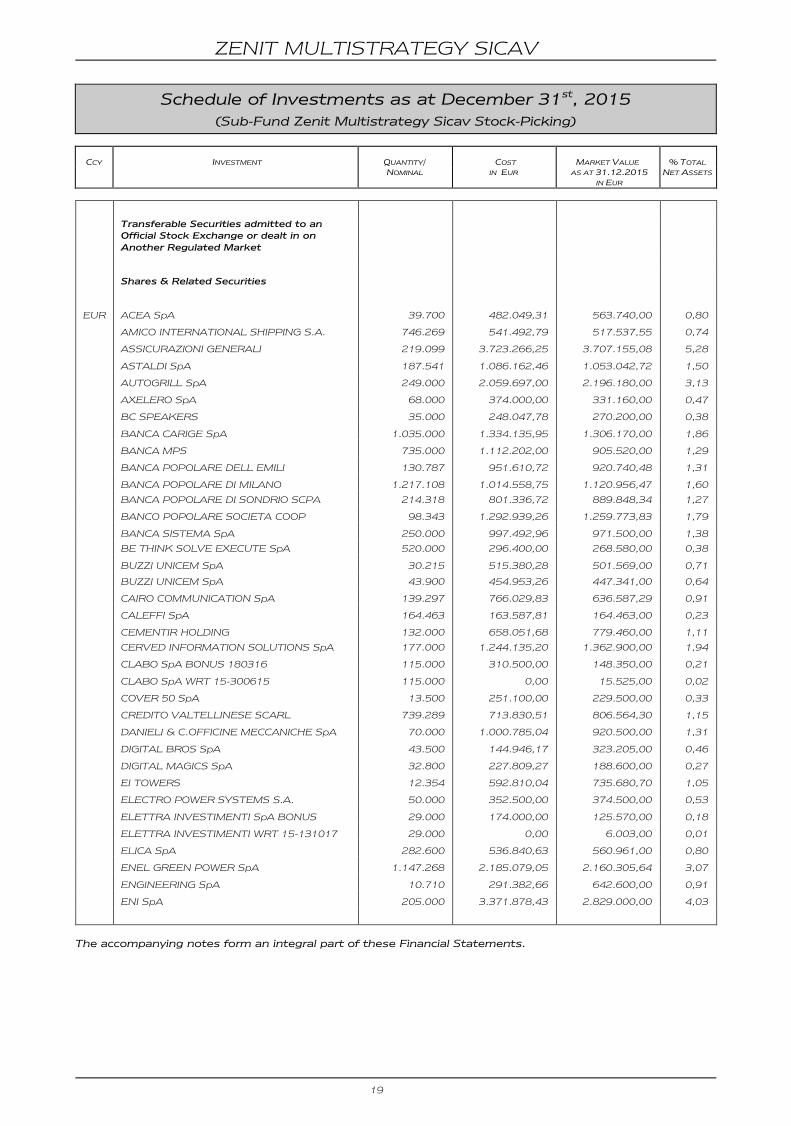
Schedule of Investments as at December 31st, 2015
(Sub-Fund Zenit Multistrategy Sicav Stock-Picking)
CCY INVESTMENT QUANTITY/ COST MARKET VALUE % TOTAL
NOMINAL IN EUR AS AT 31.12.2015
IN EUR
NET ASSETS
Transferable Securities admitted to an Official Stock Exchange or dealt in on
Another Regulated Market
Shares & Related Securities
EUR ACEA SpA 39.700 482.049,31 563.740,00 0,80
EUR AMICO INTERNATIONAL SHIPPING S.A. 746.269 541.492,79 517.537,55 0,74
EUR ASSICURAZIONI GENERALI 219.099 3.723.266,25 3.707.155,08 5,28
EUR ASTALDI SpA 187.541 1.086.162,46 1.053.042,72 1,50
EUR AUTOGRILL SpA 249.000 2.059.697,00 2.196.180,00 3,13
EUR AXELERO SpA 68.000 374.000,00 331.160,00 0,47
BC SPEAKERS 35.000 248.047,78 270.200,00 0,38
BANCA CARIGE SpA 1.035.000 1.334.135,95 1.306.170,00 1,86
BANCA MPS 735.000 1.112.202,00 905.520,00 1,29
BANCA POPOLARE DELL EMILI 130.787 951.610,72 920.740,48 1,31
EUR BANCA POPOLARE DI MILANO 1.217.108 1.014.558,75 1.120.956,47 1,60
EUR BANCA POPOLARE DI SONDRIO SCPA 214.318 801.336,72 889.848,34 1,27
EUR BANCO POPOLARE SOCIETA COOP 98.343 1.292.939,26 1.259.773,83 1,79
EUR BANCA SISTEMA SpA 250.000 997.492,96 971.500,00 1,38
EUR BE THINK SOLVE EXECUTE SpA 520.000 296.400,00 268.580,00 0,38
EUR BUZZI UNICEM SpA 30.215 515.380,28 501.569,00 0,71
EUR BUZZI UNICEM SpA 43.900 454.953,26 447.341,00 0,64
EUR CAIRO COMMUNICATION SpA 139.297 766.029,83 636.587,29 0,91
EUR CALEFFI SpA 164.463 163.587,81 164.463,00 0,23
EUR CEMENTIR HOLDING 132.000 658.051,68 779.460,00 1,11
EUR CERVED INFORMATION SOLUTIONS SpA 177.000 1.244.135,20 1.362.900,00 1,94
EUR CLABO SpA BONUS 180316 115.000 310.500,00 148.350,00 0,21
EUR CLABO SpA WRT 15-300615 115.000 0,00 15.525,00 0,02
EUR COVER 50 SpA 13.500 251.100,00 229.500,00 0,33
EUR CREDITO VALTELLINESE SCARL 739.289 713.830,51 806.564,30 1,15
EUR DANIELI & C.OFFICINE MECCANICHE SpA 70.000 1.000.785,04 920.500,00 1,31
EUR DIGITAL BROS SpA 43.500 144.946,17 323.205,00 0,46
EUR DIGITAL MAGICS SpA 32.800 227.809,27 188.600,00 0,27
EUR EI TOWERS 12.354 592.810,04 735.680,70 1,05
EUR ELECTRO POWER SYSTEMS S.A. 50.000 352.500,00 374.500,00 0,53
EUR ELETTRA INVESTIMENTI SpA BONUS 29.000 174.000,00 125.570,00 0,18
EUR ELETTRA INVESTIMENTI WRT 15-131017 29.000 0,00 6.003,00 0,01
EUR ELICA SpA 282.600 536.840,63 560.961,00 0,80
EUR ENEL GREEN POWER SpA 1.147.268 2.185.079,05 2.160.305,64 3,07
EUR ENGINEERING SpA 10.710 291.382,66 642.600,00 0,91
EUR ENI SpA 205.000 3.371.878,43 2.829.000,00 4,03
The accompanying notes form an integral part of these Financial Statements.
ZENIT MULTISTRATEGY SICAV
20
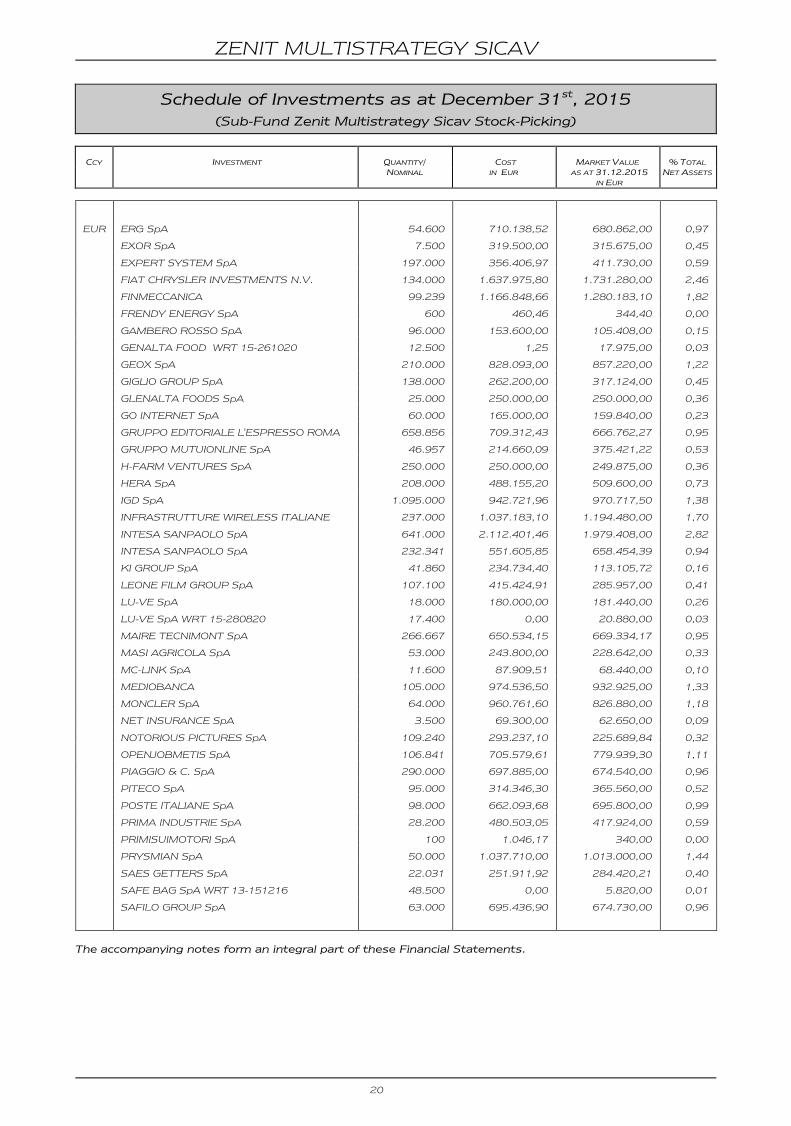
Schedule of Investments as at December 31st, 2015
(Sub-Fund Zenit Multistrategy Sicav Stock-Picking)
CCY INVESTMENT QUANTITY/ COST MARKET VALUE % TOTAL
NOMINAL IN EUR AS AT 31.12.2015
IN EUR
NET ASSETS
EUR ERG SpA 54.600 710.138,52 680.862,00 0,97
EUR EXOR SpA 7.500 319.500,00 315.675,00 0,45
EUR EXPERT SYSTEM SpA 197.000 356.406,97 411.730,00 0,59
EUR FIAT CHRYSLER INVESTMENTS N.V. 134.000 1.637.975,80 1.731.280,00 2,46
EUR FINMECCANICA 99.239 1.166.848,66 1.280.183,10 1,82
EUR FRENDY ENERGY SpA 600 460,46 344,40 0,00
EUR GAMBERO ROSSO SpA 96.000 153.600,00 105.408,00 0,15
EUR GENALTA FOOD WRT 15-261020 12.500 1,25 17.975,00 0,03
EUR GEOX SpA 210.000 828.093,00 857.220,00 1,22
EUR GIGLIO GROUP SpA 138.000 262.200,00 317.124,00 0,45
EUR GLENALTA FOODS SpA 25.000 250.000,00 250.000,00 0,36
EUR GO INTERNET SpA 60.000 165.000,00 159.840,00 0,23
EUR GRUPPO EDITORIALE L'ESPRESSO ROMA 658.856 709.312,43 666.762,27 0,95
EUR GRUPPO MUTUIONLINE SpA 46.957 214.660,09 375.421,22 0,53
EUR H-FARM VENTURES SpA 250.000 250.000,00 249.875,00 0,36
EUR HERA SpA 208.000 488.155,20 509.600,00 0,73
EUR IGD SpA 1.095.000 942.721,96 970.717,50 1,38
EUR INFRASTRUTTURE WIRELESS ITALIANE 237.000 1.037.183,10 1.194.480,00 1,70
EUR INTESA SANPAOLO SpA 641.000 2.112.401,46 1.979.408,00 2,82
EUR INTESA SANPAOLO SpA 232.341 551.605,85 658.454,39 0,94
EUR KI GROUP SpA 41.860 234.734,40 113.105,72 0,16
EUR LEONE FILM GROUP SpA 107.100 415.424,91 285.957,00 0,41
EUR LU-VE SpA 18.000 180.000,00 181.440,00 0,26
EUR LU-VE SpA WRT 15-280820 17.400 0,00 20.880,00 0,03
EUR MAIRE TECNIMONT SpA 266.667 650.534,15 669.334,17 0,95
EUR MASI AGRICOLA SpA 53.000 243.800,00 228.642,00 0,33
EUR MC-LINK SpA 11.600 87.909,51 68.440,00 0,10
EUR MEDIOBANCA 105.000 974.536,50 932.925,00 1,33
EUR MONCLER SpA 64.000 960.761,60 826.880,00 1,18
EUR NET INSURANCE SpA 3.500 69.300,00 62.650,00 0,09
EUR NOTORIOUS PICTURES SpA 109.240 293.237,10 225.689,84 0,32
EUR OPENJOBMETIS SpA 106.841 705.579,61 779.939,30 1,11
EUR PIAGGIO & C. SpA 290.000 697.885,00 674.540,00 0,96
EUR PITECO SpA 95.000 314.346,30 365.560,00 0,52
EUR POSTE ITALIANE SpA 98.000 662.093,68 695.800,00 0,99
EUR PRIMA INDUSTRIE SpA 28.200 480.503,05 417.924,00 0,59
EUR PRIMISUIMOTORI SpA 100 1.046,17 340,00 0,00
EUR PRYSMIAN SpA 50.000 1.037.710,00 1.013.000,00 1,44
EUR SAES GETTERS SpA 22.031 251.911,92 284.420,21 0,40
EUR SAFE BAG SpA WRT 13-151216 48.500 0,00 5.820,00 0,01
EUR SAFILO GROUP SpA 63.000 695.436,90 674.730,00 0,96
The accompanying notes form an integral part of these Financial Statements.
ZENIT MULTISTRATEGY SICAV
21
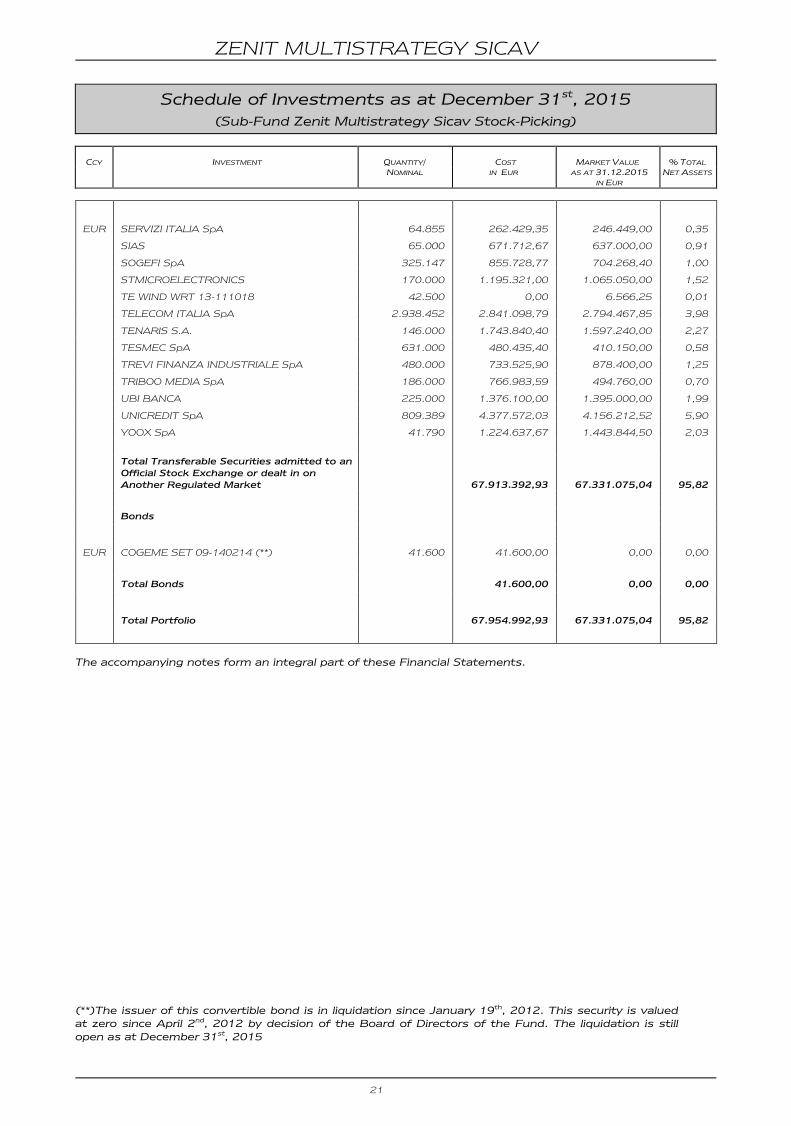
Schedule of Investments as at December 31st, 2015
(Sub-Fund Zenit Multistrategy Sicav Stock-Picking)
CCY INVESTMENT QUANTITY/ COST MARKET VALUE % TOTAL
NOMINAL IN EUR AS AT 31.12.2015
IN EUR
NET ASSETS
EUR SERVIZI ITALIA SpA 64.855 262.429,35 246.449,00 0,35
EUR SIAS 65.000 671.712,67 637.000,00 0,91
EUR SOGEFI SpA 325.147 855.728,77 704.268,40 1,00
EUR STMICROELECTRONICS 170.000 1.195.321,00 1.065.050,00 1,52
EUR TE WIND WRT 13-111018 42.500 0,00 6.566,25 0,01
EUR TELECOM ITALIA SpA 2.938.452 2.841.098,79 2.794.467,85 3,98
EUR TENARIS S.A. 146.000 1.743.840,40 1.597.240,00 2,27
EUR TESMEC SpA 631.000 480.435,40 410.150,00 0,58
EUR TREVI FINANZA INDUSTRIALE SpA 480.000 733.525,90 878.400,00 1,25
EUR TRIBOO MEDIA SpA 186.000 766.983,59 494.760,00 0,70
EUR UBI BANCA 225.000 1.376.100,00 1.395.000,00 1,99
EUR UNICREDIT SpA 809.389 4.377.572,03 4.156.212,52 5,90
EUR YOOX SpA 41.790 1.224.637,67 1.443.844,50 2,03
Total Transferable Securities admitted to an
Official Stock Exchange or dealt in on Another Regulated Market
67.913.392,93
67.331.075,04
95,82
Bonds
EUR COGEME SET 09-140214 (**) 41.600 41.600,00 0,00 0,00
Total Bonds 41.600,00 0,00 0,00
Total Portfolio 67.954.992,93 67.331.075,04 95,82
The accompanying notes form an integral part of these Financial Statements.
(**)The issuer of this convertible bond is in liquidation since January 19th, 2012. This security is valued at zero since April 2nd, 2012 by decision of the Board of Directors of the Fund. The liquidation is still
open as at December 31st, 2015
ZENIT MULTISTRATEGY SICAV
22
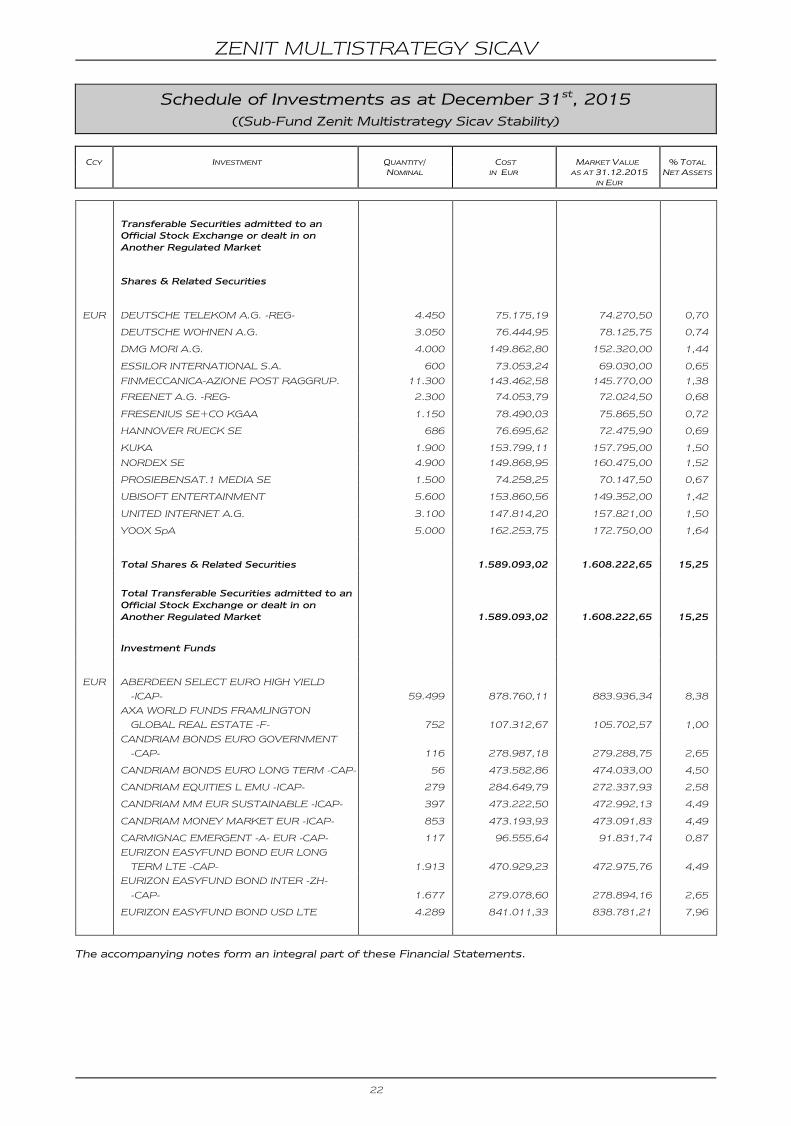
Schedule of Investments as at December 31st, 2015
((Sub-Fund Zenit Multistrategy Sicav Stability)
CCY INVESTMENT QUANTITY/ COST MARKET VALUE % TOTAL
NOMINAL IN EUR AS AT 31.12.2015
IN EUR
NET ASSETS
Transferable Securities admitted to an Official Stock Exchange or dealt in on
Another Regulated Market
Shares & Related Securities
EUR DEUTSCHE TELEKOM A.G. -REG- 4.450 75.175,19 74.270,50 0,70
EUR DEUTSCHE WOHNEN A.G. 3.050 76.444,95 78.125,75 0,74
EUR DMG MORI A.G. 4.000 149.862,80 152.320,00 1,44
EUR ESSILOR INTERNATIONAL S.A. 600 73.053,24 69.030,00 0,65
EUR FINMECCANICA-AZIONE POST RAGGRUP. 11.300 143.462,58 145.770,00 1,38
EUR FREENET A.G. -REG- 2.300 74.053,79 72.024,50 0,68
EUR FRESENIUS SE+CO KGAA 1.150 78.490,03 75.865,50 0,72
EUR HANNOVER RUECK SE 686 76.695,62 72.475,90 0,69
EUR KUKA 1.900 153.799,11 157.795,00 1,50
EUR NORDEX SE 4.900 149.868,95 160.475,00 1,52
EUR PROSIEBENSAT.1 MEDIA SE 1.500 74.258,25 70.147,50 0,67
EUR UBISOFT ENTERTAINMENT 5.600 153.860,56 149.352,00 1,42
EUR UNITED INTERNET A.G. 3.100 147.814,20 157.821,00 1,50
EUR YOOX SpA 5.000 162.253,75 172.750,00 1,64
Total Shares & Related Securities 1.589.093,02 1.608.222,65 15,25
Total Transferable Securities admitted to an
Official Stock Exchange or dealt in on
Another Regulated Market
1.589.093,02
1.608.222,65
15,25
Investment Funds
EUR
ABERDEEN SELECT EURO HIGH YIELD
-ICAP-
59.499
878.760,11
883.936,34
8,38
EUR
AXA WORLD FUNDS FRAMLINGTON
GLOBAL REAL ESTATE -F-
752
107.312,67
105.702,57
1,00
EUR
CANDRIAM BONDS EURO GOVERNMENT
-CAP-
116
278.987,18
279.288,75
2,65
EUR CANDRIAM BONDS EURO LONG TERM -CAP- 56 473.582,86 474.033,00 4,50
EUR CANDRIAM EQUITIES L EMU -ICAP- 279 284.649,79 272.337,93 2,58
EUR CANDRIAM MM EUR SUSTAINABLE -ICAP- 397 473.222,50 472.992,13 4,49
EUR CANDRIAM MONEY MARKET EUR -ICAP- 853 473.193,93 473.091,83 4,49
EUR CARMIGNAC EMERGENT -A- EUR -CAP- 117 96.555,64 91.831,74 0,87
EUR
EURIZON EASYFUND BOND EUR LONG
TERM LTE -CAP-
1.913
470.929,23
472.975,76
4,49
EUR
EURIZON EASYFUND BOND INTER -ZH-
-CAP-
1.677
279.078,60
278.894,16
2,65
EUR EURIZON EASYFUND BOND USD LTE 4.289 841.011,33 838.781,21 7,96
The accompanying notes form an integral part of these Financial Statements.
ZENIT MULTISTRATEGY SICAV
23
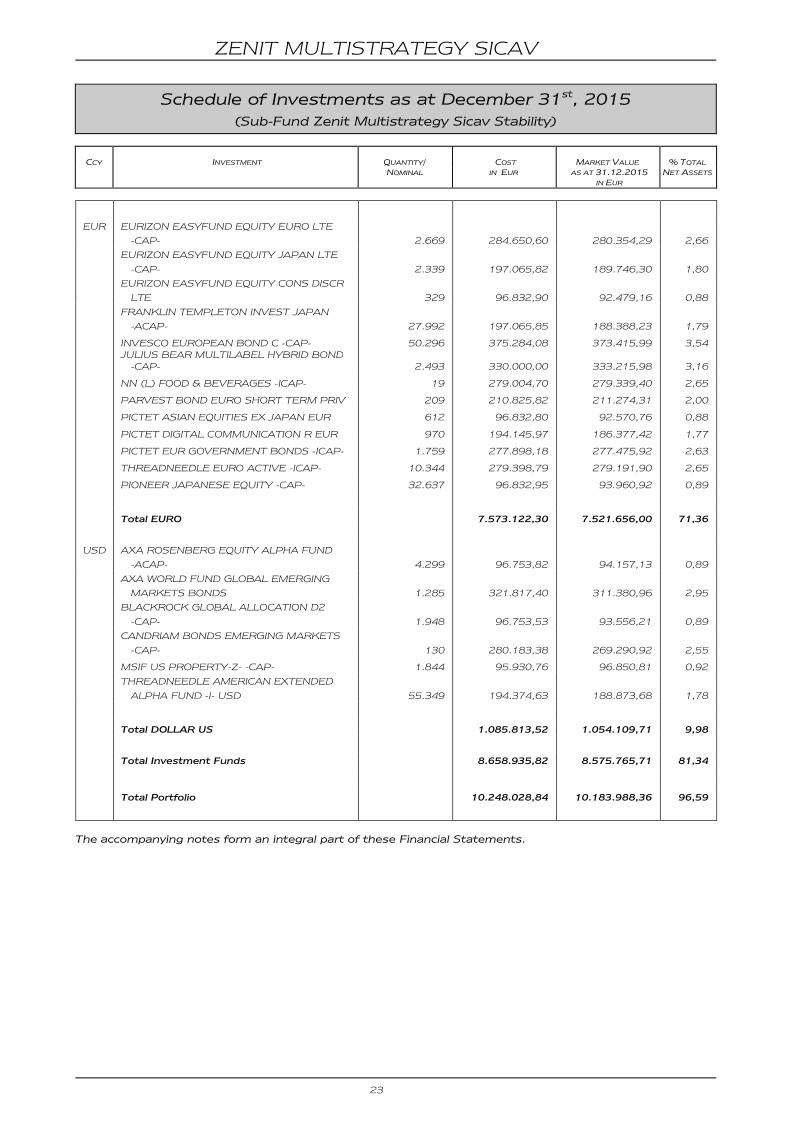
Schedule of Investments as at December 31st, 2015
(Sub-Fund Zenit Multistrategy Sicav Stability)
CCY INVESTMENT QUANTITY/ COST MARKET VALUE % TOTAL
NOMINAL IN EUR AS AT 31.12.2015
IN EUR
NET ASSETS
EUR
EURIZON EASYFUND EQUITY EURO LTE
-CAP-
2.669
284.650,60
280.354,29
2,66
EUR
EURIZON EASYFUND EQUITY JAPAN LTE
-CAP-
2.339
197.065,82
189.746,30
1,80
EUR
EURIZON EASYFUND EQUITY CONS DISCR
LTE
329
96.832,90
92.479,16
0,88
EUR
FRANKLIN TEMPLETON INVEST JAPAN
-ACAP-
27.992
197.065,85
188.388,23
1,79
EUR INVESCO EUROPEAN BOND C -CAP- 50.296 375.284,08 373.415,99 3,54
EUR JULIUS BEAR MULTILABEL HYBRID BOND -CAP-
2.493
330.000,00
333.215,98
3,16
EUR NN (L) FOOD & BEVERAGES -ICAP- 19 279.004,70 279.339,40 2,65
EUR PARVEST BOND EURO SHORT TERM PRIV 209 210.825,82 211.274,31 2,00
EUR PICTET ASIAN EQUITIES EX JAPAN EUR 612 96.832,80 92.570,76 0,88
EUR PICTET DIGITAL COMMUNICATION R EUR 970 194.145,97 186.377,42 1,77
EUR PICTET EUR GOVERNMENT BONDS -ICAP- 1.759 277.898,18 277.475,92 2,63
EUR THREADNEEDLE EURO ACTIVE -ICAP- 10.344 279.398,79 279.191,90 2,65
EUR PIONEER JAPANESE EQUITY -CAP- 32.637 96.832,95 93.960,92 0,89
Total EURO 7.573.122,30 7.521.656,00 71,36
USD
AXA ROSENBERG EQUITY ALPHA FUND
-ACAP-
4.299
96.753,82
94.157,13
0,89
USD
AXA WORLD FUND GLOBAL EMERGING
MARKETS BONDS
1.285
321.817,40
311.380,96
2,95
USD
BLACKROCK GLOBAL ALLOCATION D2
-CAP-
1.948
96.753,53
93.556,21
0,89
USD
CANDRIAM BONDS EMERGING MARKETS
-CAP-
130
280.183,38
269.290,92
2,55
USD MSIF US PROPERTY-Z- -CAP- 1.844 95.930,76 96.850,81 0,92
USD
THREADNEEDLE AMERICAN EXTENDED
ALPHA FUND -I- USD
55.349
194.374,63
188.873,68
1,78
Total DOLLAR US 1.085.813,52 1.054.109,71 9,98
Total Investment Funds 8.658.935,82 8.575.765,71 81,34
Total Portfolio 10.248.028,84 10.183.988,36 96,59
The accompanying notes form an integral part of these Financial Statements.
ZENIT MULTISTRATEGY SICAV
24
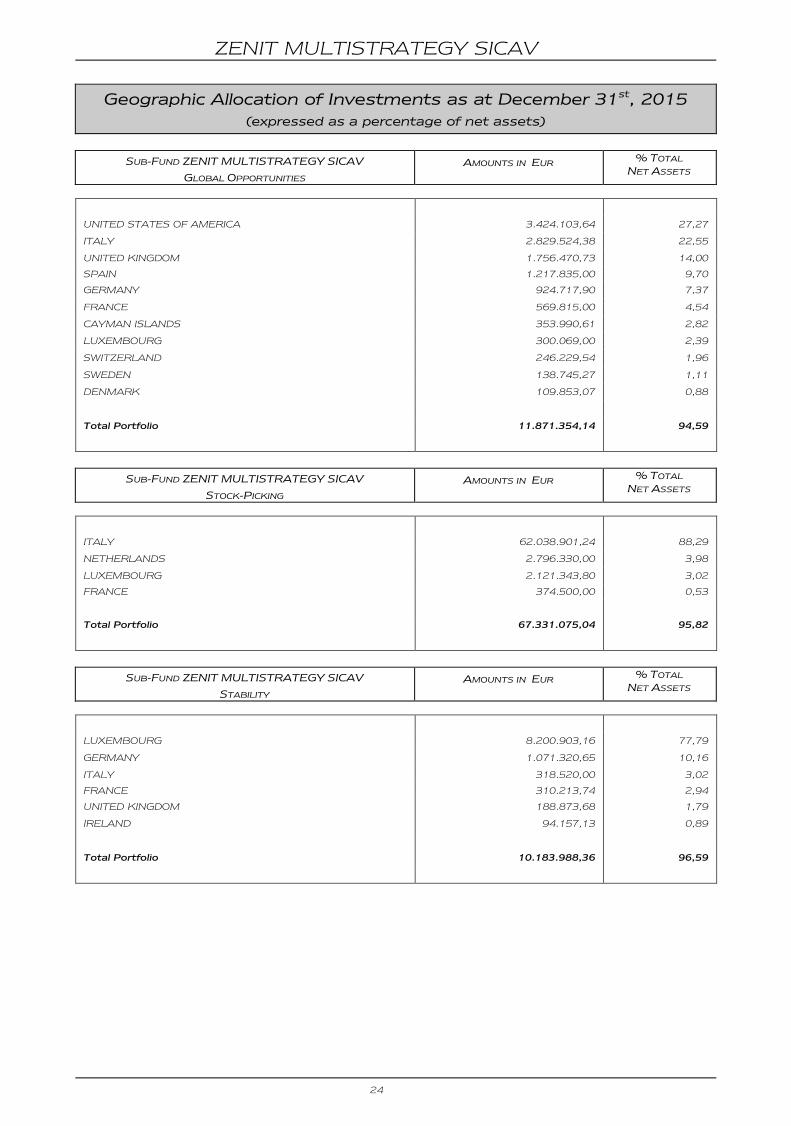
Geographic Allocation of Investments as at December 31st, 2015
(expressed as a percentage of net assets)
SUB-FUND ZENIT MULTISTRATEGY SICAV
GLOBAL OPPORTUNITIES
AMOUNTS IN EUR % TOTAL NET ASSETS
UNITED STATES OF AMERICA 3.424.103,64 27,27
ITALY 2.829.524,38 22,55
UNITED KINGDOM 1.756.470,73 14,00
SPAIN 1.217.835,00 9,70
GERMANY 924.717,90 7,37
FRANCE 569.815,00 4,54
CAYMAN ISLANDS 353.990,61 2,82
LUXEMBOURG 300.069,00 2,39
SWITZERLAND 246.229,54 1,96
SWEDEN 138.745,27 1,11
DENMARK 109.853,07 0,88
Total Portfolio 11.871.354,14 94,59
SUB-FUND ZENIT MULTISTRATEGY SICAV
STOCK-PICKING
AMOUNTS IN EUR % TOTAL NET ASSETS
ITALY 62.038.901,24 88,29
NETHERLANDS 2.796.330,00 3,98
LUXEMBOURG 2.121.343,80 3,02
FRANCE 374.500,00 0,53
Total Portfolio 67.331.075,04 95,82
SUB-FUND ZENIT MULTISTRATEGY SICAV
STABILITY
AMOUNTS IN EUR % TOTAL NET ASSETS
LUXEMBOURG 8.200.903,16 77,79
GERMANY 1.071.320,65 10,16
ITALY 318.520,00 3,02
FRANCE 310.213,74 2,94
UNITED KINGDOM 188.873,68 1,79
IRELAND 94.157,13 0,89
Total Portfolio 10.183.988,36 96,59
ZENIT MULTISTRATEGY SICAV
25
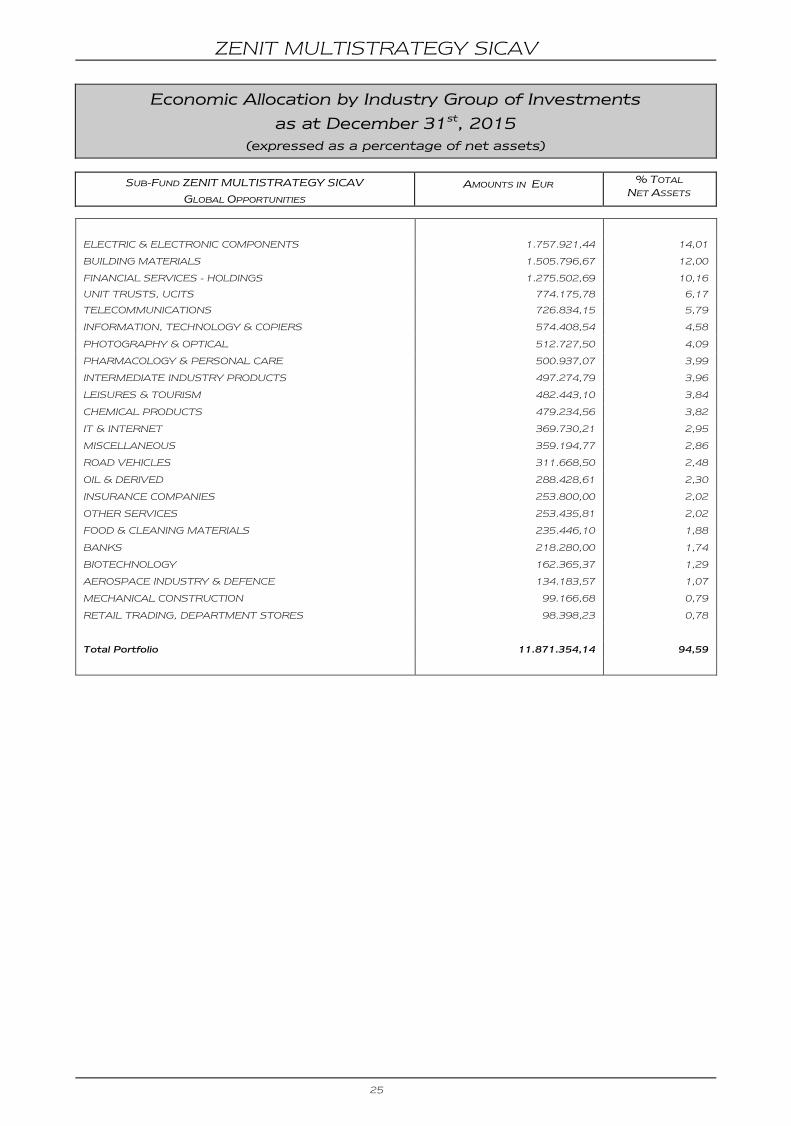
Economic Allocation by Industry Group of Investments
as at December 31st, 2015
(expressed as a percentage of net assets)
SUB-FUND ZENIT MULTISTRATEGY SICAV
GLOBAL OPPORTUNITIES
AMOUNTS IN EUR % TOTAL
NET ASSETS
ELECTRIC & ELECTRONIC COMPONENTS 1.757.921,44 14,01
BUILDING MATERIALS 1.505.796,67 12,00
FINANCIAL SERVICES - HOLDINGS 1.275.502,69 10,16
UNIT TRUSTS, UCITS 774.175,78 6,17
TELECOMMUNICATIONS 726.834,15 5,79
INFORMATION, TECHNOLOGY & COPIERS 574.408,54 4,58
PHOTOGRAPHY & OPTICAL 512.727,50 4,09
PHARMACOLOGY & PERSONAL CARE 500.937,07 3,99
INTERMEDIATE INDUSTRY PRODUCTS 497.274,79 3,96
LEISURES & TOURISM 482.443,10 3,84
CHEMICAL PRODUCTS 479.234,56 3,82
IT & INTERNET 369.730,21 2,95
MISCELLANEOUS 359.194,77 2,86
ROAD VEHICLES 311.668,50 2,48
OIL & DERIVED 288.428,61 2,30
INSURANCE COMPANIES 253.800,00 2,02
OTHER SERVICES 253.435,81 2,02
FOOD & CLEANING MATERIALS 235.446,10 1,88
BANKS 218.280,00 1,74
BIOTECHNOLOGY 162.365,37 1,29
AEROSPACE INDUSTRY & DEFENCE 134.183,57 1,07
MECHANICAL CONSTRUCTION 99.166,68 0,79
RETAIL TRADING, DEPARTMENT STORES 98.398,23 0,78
Total Portfolio 11.871.354,14 94,59
ZENIT MULTISTRATEGY SICAV
26
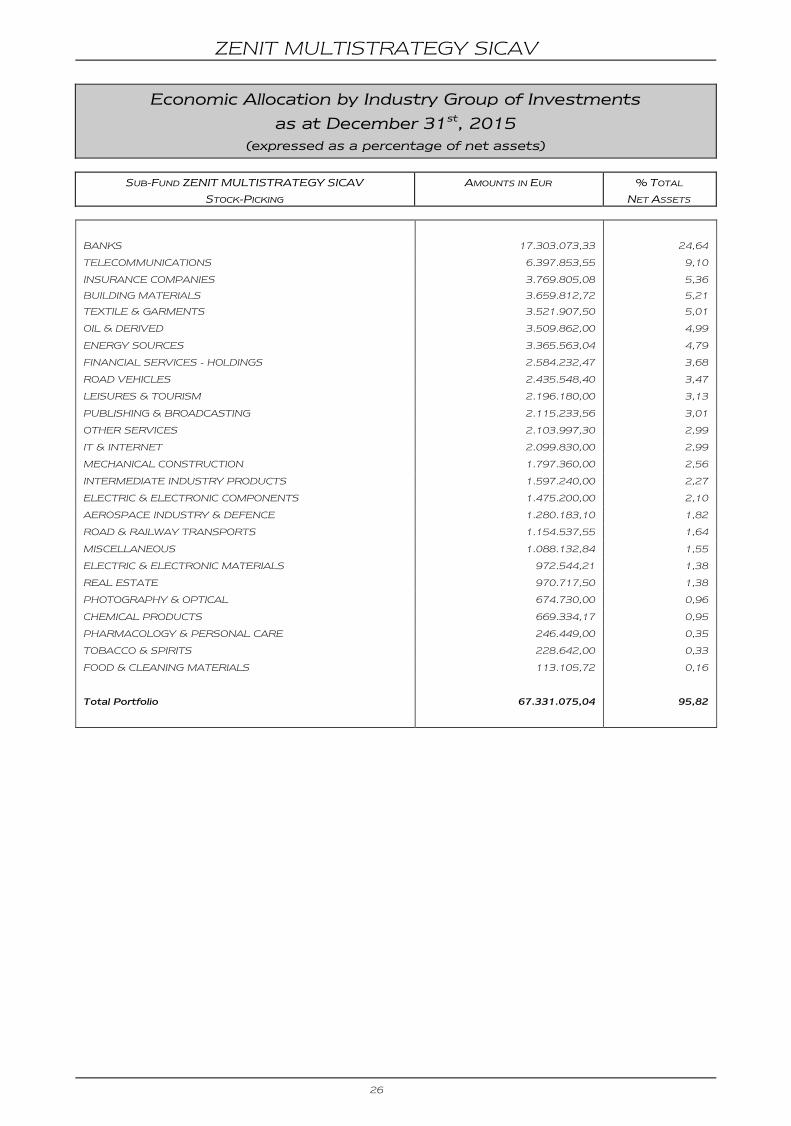
Economic Allocation by Industry Group of Investments
as at December 31st, 2015
(expressed as a percentage of net assets)
SUB-FUND ZENIT MULTISTRATEGY SICAV
STOCK-PICKING
AMOUNTS IN EUR % TOTAL
NET ASSETS
BANKS 17.303.073,33 24,64
TELECOMMUNICATIONS 6.397.853,55 9,10
INSURANCE COMPANIES 3.769.805,08 5,36
BUILDING MATERIALS 3.659.812,72 5,21
TEXTILE & GARMENTS 3.521.907,50 5,01
OIL & DERIVED 3.509.862,00 4,99
ENERGY SOURCES 3.365.563,04 4,79
FINANCIAL SERVICES - HOLDINGS 2.584.232,47 3,68
ROAD VEHICLES 2.435.548,40 3,47
LEISURES & TOURISM 2.196.180,00 3,13
PUBLISHING & BROADCASTING 2.115.233,56 3,01
OTHER SERVICES 2.103.997,30 2,99
IT & INTERNET 2.099.830,00 2,99
MECHANICAL CONSTRUCTION 1.797.360,00 2,56
INTERMEDIATE INDUSTRY PRODUCTS 1.597.240,00 2,27
ELECTRIC & ELECTRONIC COMPONENTS 1.475.200,00 2,10
AEROSPACE INDUSTRY & DEFENCE 1.280.183,10 1,82
ROAD & RAILWAY TRANSPORTS 1.154.537,55 1,64
MISCELLANEOUS 1.088.132,84 1,55
ELECTRIC & ELECTRONIC MATERIALS 972.544,21 1,38
REAL ESTATE 970.717,50 1,38
PHOTOGRAPHY & OPTICAL 674.730,00 0,96
CHEMICAL PRODUCTS 669.334,17 0,95
PHARMACOLOGY & PERSONAL CARE 246.449,00 0,35
TOBACCO & SPIRITS 228.642,00 0,33
FOOD & CLEANING MATERIALS 113.105,72 0,16
Total Portfolio 67.331.075,04 95,82
ZENIT MULTISTRATEGY SICAV
27
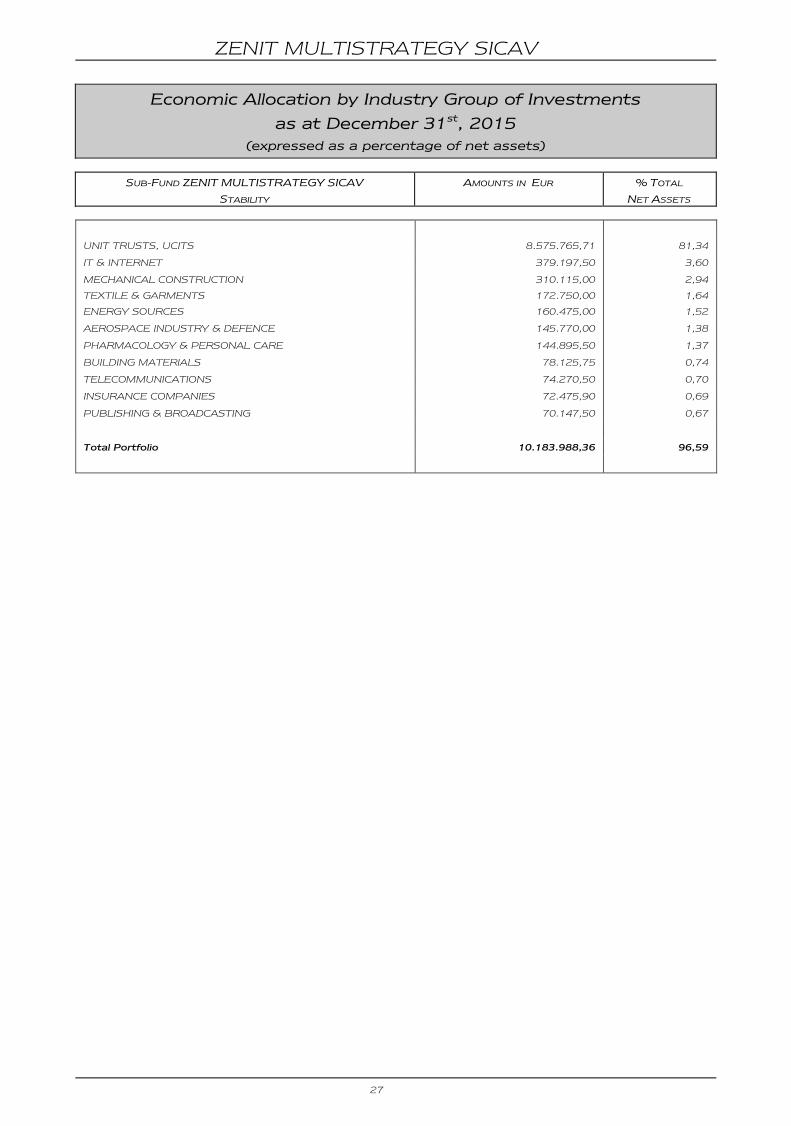
Economic Allocation by Industry Group of Investments
as at December 31st, 2015
(expressed as a percentage of net assets)
SUB-FUND ZENIT MULTISTRATEGY SICAV
STABILITY
AMOUNTS IN EUR % TOTAL
NET ASSETS
UNIT TRUSTS, UCITS 8.575.765,71 81,34
IT & INTERNET 379.197,50 3,60
MECHANICAL CONSTRUCTION 310.115,00 2,94
TEXTILE & GARMENTS 172.750,00 1,64
ENERGY SOURCES 160.475,00 1,52
AEROSPACE INDUSTRY & DEFENCE 145.770,00 1,38
PHARMACOLOGY & PERSONAL CARE 144.895,50 1,37
BUILDING MATERIALS 78.125,75 0,74
TELECOMMUNICATIONS 74.270,50 0,70
INSURANCE COMPANIES 72.475,90 0,69
PUBLISHING & BROADCASTING 70.147,50 0,67
Total Portfolio 10.183.988,36 96,59
ZENIT MULTISTRATEGY SICAV
28
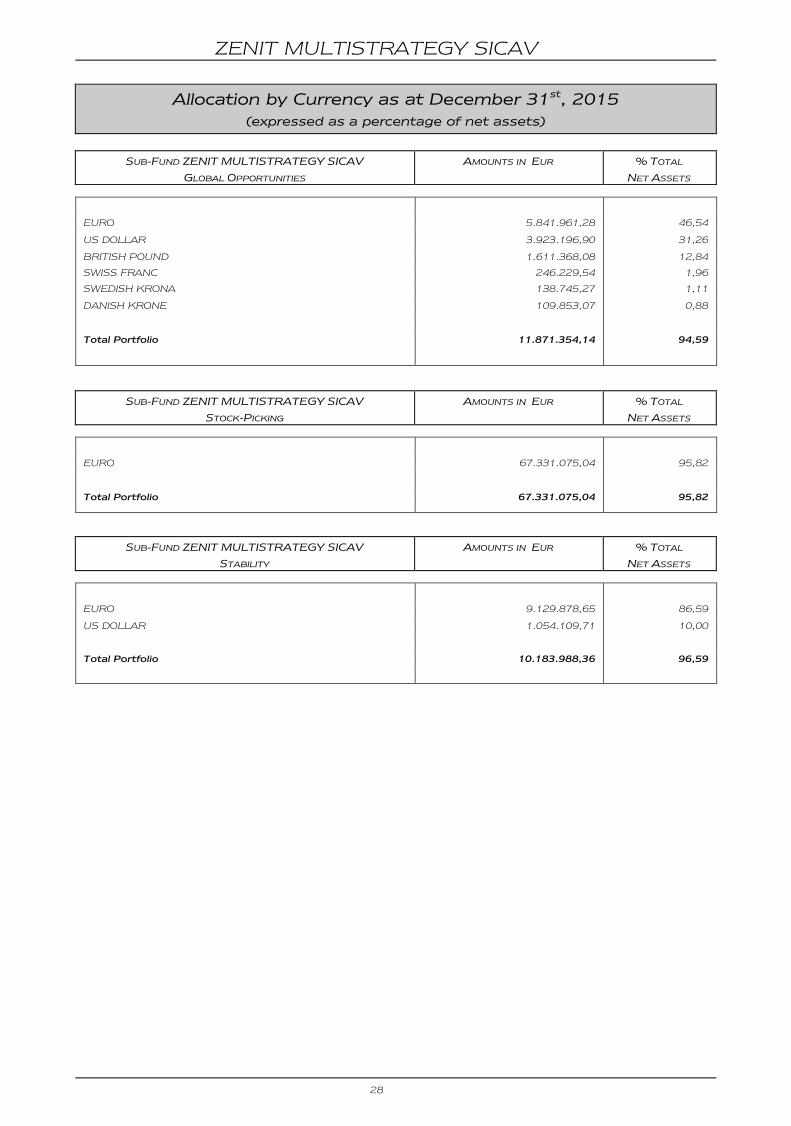
Allocation by Currency as at December 31st, 2015
(expressed as a percentage of net assets)
SUB-FUND ZENIT MULTISTRATEGY SICAV
GLOBAL OPPORTUNITIES
AMOUNTS IN EUR % TOTAL
NET ASSETS
EURO 5.841.961,28 46,54
US DOLLAR 3.923.196,90 31,26
BRITISH POUND 1.611.368,08 12,84
SWISS FRANC 246.229,54 1,96
SWEDISH KRONA 138.745,27 1,11
DANISH KRONE 109.853,07 0,88
Total Portfolio 11.871.354,14 94,59
SUB-FUND ZENIT MULTISTRATEGY SICAV
STOCK-PICKING
AMOUNTS IN EUR % TOTAL
NET ASSETS
EURO 67.331.075,04 95,82
Total Portfolio 67.331.075,04 95,82
SUB-FUND ZENIT MULTISTRATEGY SICAV
STABILITY
AMOUNTS IN EUR % TOTAL
NET ASSETS
EURO 9.129.878,65 86,59
US DOLLAR 1.054.109,71 10,00
Total Portfolio 10.183.988,36 96,59
ZENIT MULTISTRATEGY SICAV
29
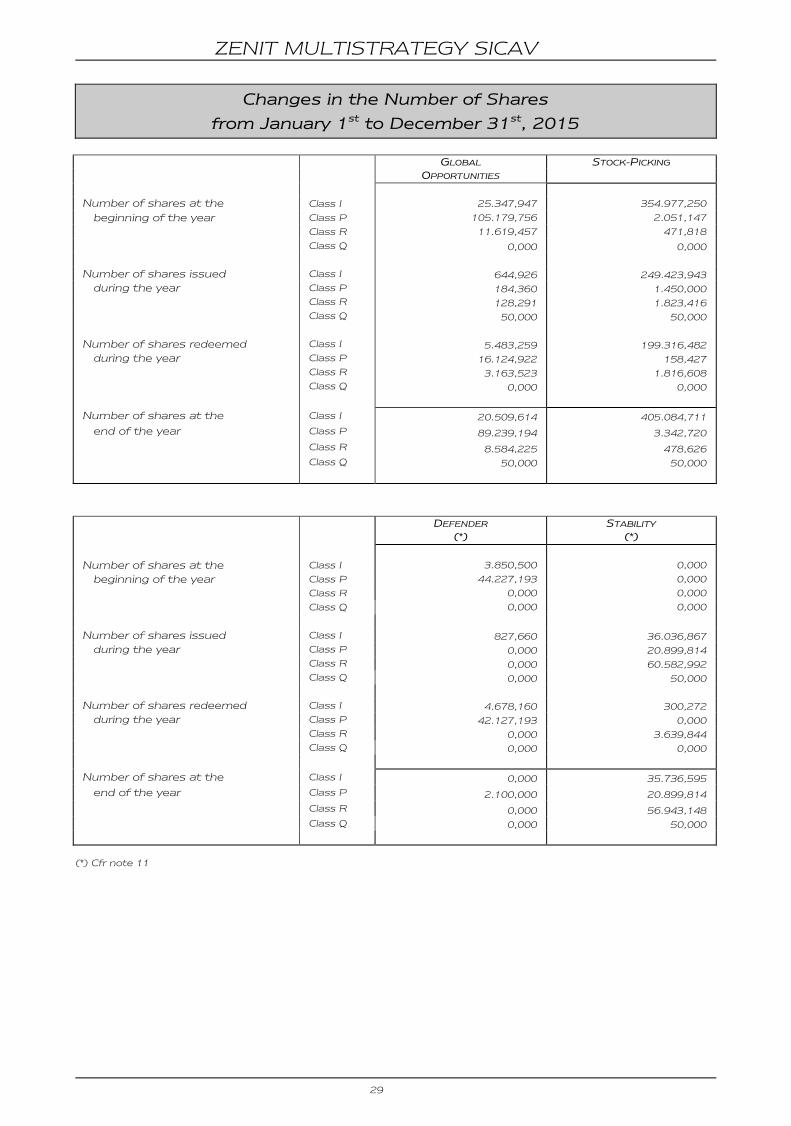
Changes in the Number of Shares
from January 1st to December 31st, 2015
GLOBAL
STOCK-PICKING
OPPORTUNITIES
Number of shares at the The
Class I 25.347,947 354.977,250
beginning of the year Class P 105.179,756 2.051,147
Class R 11.619,457 471,818
Class Q 0,000 0,000
Number of shares issued Class I 644,926 249.423,943
during the year Class P 184,360 1.450,000
Class R 128,291 1.823,416
Class Q 50,000 50,000
Number of shares redeemed Class I 5.483,259 199.316,482
during the year Class P 16.124,922 158,427
Class R 3.163,523 1.816,608
Class Q 0,000 0,000
Number of shares at the Class I 20.509,614 405.084,711
end of the year Class P 89.239,194 3.342,720
Class R 8.584,225 478,626
Class Q 50,000 50,000
DEFENDER STABILITY
(*) (*)
Number of shares at the Class I 3.850,500 0,000
beginning of the year Class P 44.227,193 0,000
Class R 0,000 0,000
Class Q 0,000 0,000
Number of shares issued Class I 827,660 36.036,867
during the year Class P 0,000 20.899,814
Class R 0,000 60.582,992
Class Q 0,000 50,000
Number of shares redeemed Class I 4.678,160 300,272
during the year Class P 42.127,193 0,000
Class R 0,000 3.639,844
Class Q 0,000 0,000
Number of shares at the Class I 0,000 35.736,595
end of the year Class P 2.100,000 20.899,814
Class R 0,000 56.943,148
Class Q 0,000 50,000
(*) Cfr note 11
ZENIT MULTISTRATEGY SICAV
30
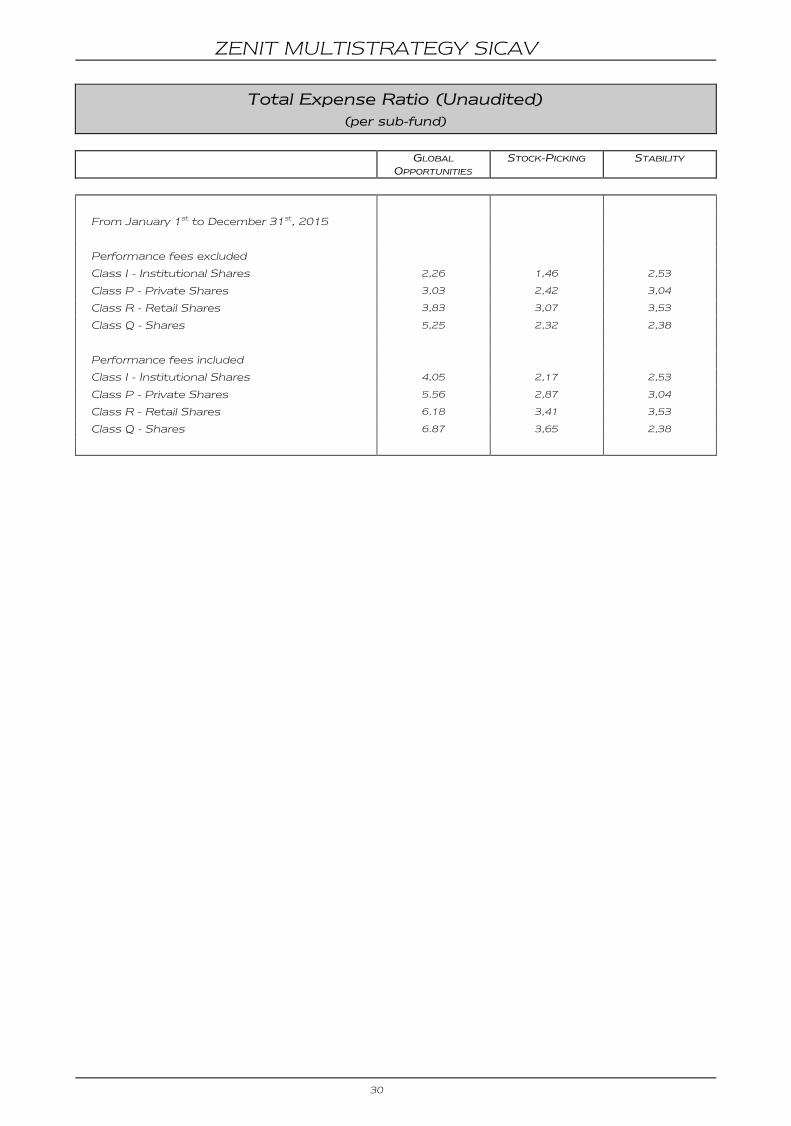
Total Expense Ratio (Unaudited)
(per sub-fund)
GLOBAL
OPPORTUNITIES STOCK-PICKING STABILITY
From January 1st to December 31st, 2015
Performance fees excluded
Class I - Institutional Shares 2,26 1,46 2,53
Class P - Private Shares 3,03 2,42 3,04
Class R - Retail Shares 3,83 3,07 3,53
Class Q - Shares 5,25 2,32 2,38
Performance fees included
Class I - Institutional Shares 4,05 2,17 2,53
Class P - Private Shares 5.56 2,87 3,04
Class R - Retail Shares 6.18 3,41 3,53
Class Q - Shares 6.87 3,65 2,38
ZENIT MULTISTRATEGY SICAV
31
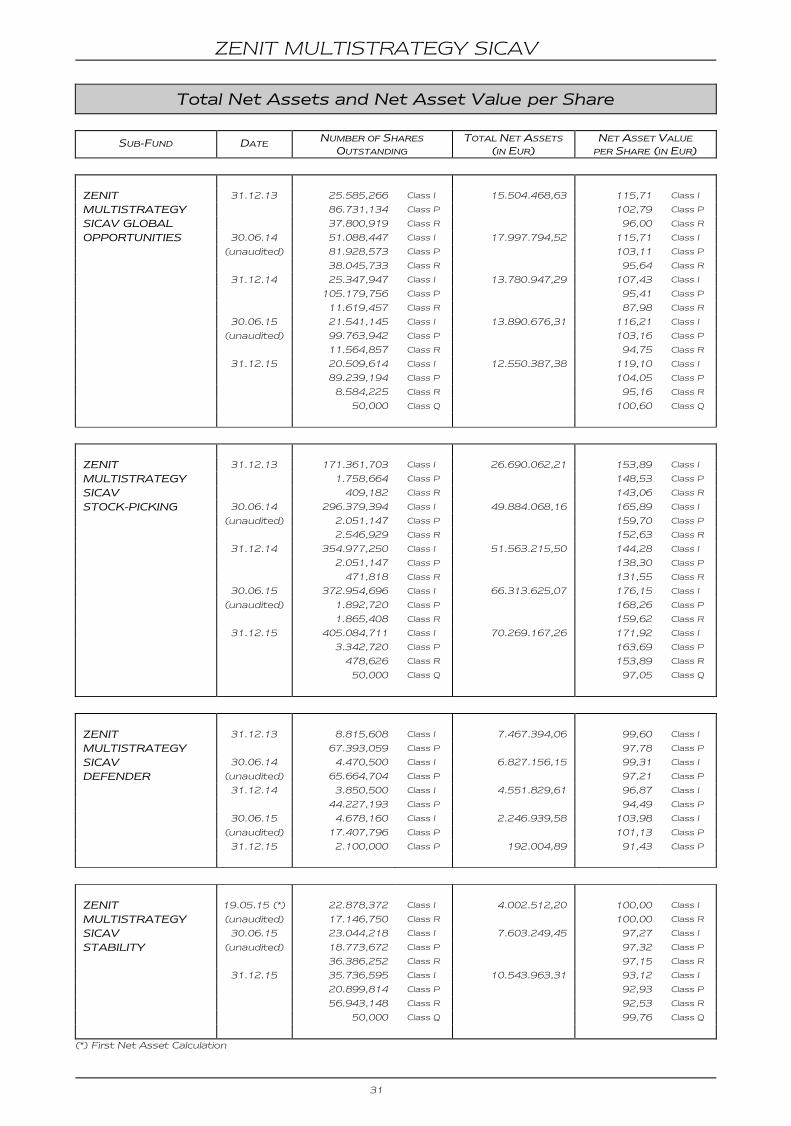
Total Net Assets and Net Asset Value per Share
SUB-FUND DATE NUMBER OF SHARES OUTSTANDING
TOTAL NET ASSETS (IN EUR)
NET ASSET VALUE PER SHARE (IN EUR)
ZENIT 31.12.13 25.585,266 Class I 15.504.468,63 115,71 Class I
MULTISTRATEGY 86.731,134 Class P 102,79 Class P
SICAV GLOBAL 37.800,919 Class R 96,00 Class R
OPPORTUNITIES 30.06.14 51.088,447 Class I 17.997.794,52 115,71 Class I
(unaudited) 81.928,573 Class P 103,11 Class P
38.045,733 Class R 95,64 Class R
31.12.14 25.347,947 Class I 13.780.947,29 107,43 Class I
105.179,756 Class P 95,41 Class P
11.619,457 Class R 87,98 Class R
30.06.15 21.541,145 Class I 13.890.676,31 116,21 Class I
(unaudited) 99.763,942 Class P 103,16 Class P
11.564,857 Class R 94,75 Class R
31.12.15 20.509,614 Class I 12.550.387,38 119,10 Class I
89.239,194 Class P 104,05 Class P
8.584,225 Class R 95,16 Class R
50,000 Class Q 100,60 Class Q
ZENIT 31.12.13 171.361,703 Class I 26.690.062,21 153,89 Class I
MULTISTRATEGY 1.758,664 Class P 148,53 Class P
SICAV 409,182 Class R 143,06 Class R
STOCK-PICKING 30.06.14 296.379,394 Class I 49.884.068,16 165,89 Class I
(unaudited) 2.051,147 Class P 159,70 Class P
2.546,929 Class R 152,63 Class R
31.12.14 354.977,250 Class I 51.563.215,50 144,28 Class I
2.051,147 Class P 138,30 Class P
471,818 Class R 131,55 Class R
30.06.15 372.954,696 Class I 66.313.625,07 176,15 Class I
(unaudited) 1.892,720 Class P 168,26 Class P
1.865,408 Class R 159,62 Class R
31.12.15 405.084,711 Class I 70.269.167,26 171,92 Class I
3.342,720 Class P 163,69 Class P
478,626 Class R 153,89 Class R
50,000 Class Q 97,05 Class Q
ZENIT 31.12.13 8.815,608 Class I 7.467.394,06 99,60 Class I
MULTISTRATEGY 67.393,059 Class P 97,78 Class P
SICAV 30.06.14 4.470,500 Class I 6.827.156,15 99,31 Class I
DEFENDER (unaudited) 65.664,704 Class P 97,21 Class P
31.12.14 3.850,500 Class I 4.551.829,61 96,87 Class I
44.227,193 Class P 94,49 Class P
30.06.15 4.678,160 Class I 2.246.939,58 103,98 Class I
(unaudited) 17.407,796 Class P 101,13 Class P
31.12.15 2.100,000 Class P 192.004,89 91,43 Class P
ZENIT 19.05.15 (*) 22.878,372 Class I 4.002.512,20 100,00 Class I
MULTISTRATEGY (unaudited) 17.146,750 Class R 100,00 Class R
SICAV 30.06.15 23.044,218 Class I 7.603.249,45 97,27 Class I
STABILITY (unaudited) 18.773,672 Class P 97,32 Class P
36.386,252 Class R 97,15 Class R
31.12.15 35.736,595 Class I 10.543.963,31 93,12 Class I
20.899,814 Class P 92,93 Class P
56.943,148 Class R 92,53 Class R
50,000 Class Q 99,76 Class Q
(*) First Net Asset Calculation
ZENIT MULTISTRATEGY SICAV
32
Notes to the Financial Statements
as at December 31st, 2015
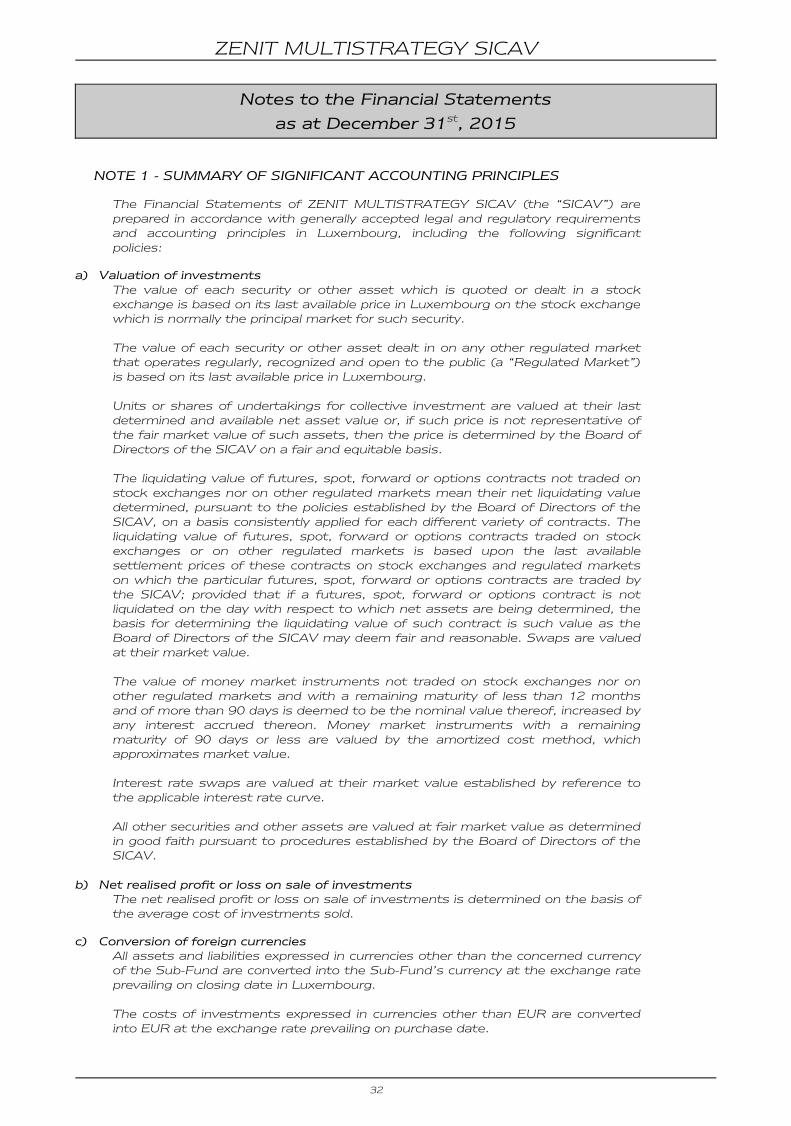
NOTE 1 - SUMMARY OF SIGNIFICANT ACCOUNTING PRINCIPLES
The Financial Statements of ZENIT MULTISTRATEGY SICAV (the “SICAV”) are prepared in accordance with generally accepted legal and regulatory requirements and accounting principles in Luxembourg, including the following significant policies:
a) Valuation of investments The value of each security or other asset which is quoted or dealt in a stock exchange is based on its last available price in Luxembourg on the stock exchange which is normally the principal market for such security. The value of each security or other asset dealt in on any other regulated market that operates regularly, recognized and open to the public (a “Regulated Market”) is based on its last available price in Luxembourg. Units or shares of undertakings for collective investment are valued at their last determined and available net asset value or, if such price is not representative of the fair market value of such assets, then the price is determined by the Board of Directors of the SICAV on a fair and equitable basis. The liquidating value of futures, spot, forward or options contracts not traded on stock exchanges nor on other regulated markets mean their net liquidating value determined, pursuant to the policies established by the Board of Directors of the SICAV, on a basis consistently applied for each different variety of contracts. The liquidating value of futures, spot, forward or options contracts traded on stock exchanges or on other regulated markets is based upon the last available settlement prices of these contracts on stock exchanges and regulated markets on which the particular futures, spot, forward or options contracts are traded by the SICAV; provided that if a futures, spot, forward or options contract is not liquidated on the day with respect to which net assets are being determined, the basis for determining the liquidating value of such contract is such value as the Board of Directors of the SICAV may deem fair and reasonable. Swaps are valued at their market value. The value of money market instruments not traded on stock exchanges nor on other regulated markets and with a remaining maturity of less than 12 months and of more than 90 days is deemed to be the nominal value thereof, increased by any interest accrued thereon. Money market instruments with a remaining maturity of 90 days or less are valued by the amortized cost method, which approximates market value. Interest rate swaps are valued at their market value established by reference to the applicable interest rate curve. All other securities and other assets are valued at fair market value as determined in good faith pursuant to procedures established by the Board of Directors of the SICAV.
b) Net realised profit or loss on sale of investments The net realised profit or loss on sale of investments is determined on the basis of the average cost of investments sold.
c) Conversion of foreign currencies All assets and liabilities expressed in currencies other than the concerned currency of the Sub-Fund are converted into the Sub-Fund’s currency at the exchange rate prevailing on closing date in Luxembourg. The costs of investments expressed in currencies other than EUR are converted into EUR at the exchange rate prevailing on purchase date.
ZENIT MULTISTRATEGY SICAV
33
Notes to the Financial Statements
as at December 31st, 2015 (continued)
NOTE 1 - SUMMARY OF SIGNIFICANT ACCOUNTING PRINCIPLES (continued)
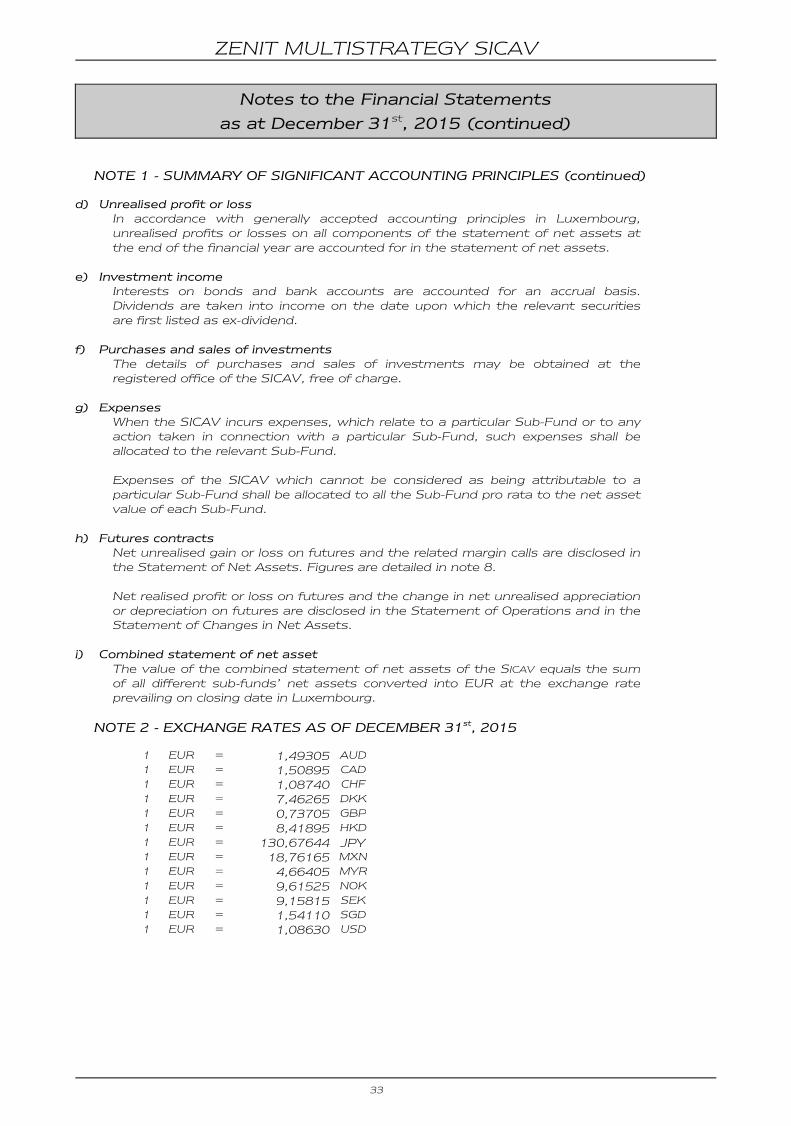
d) Unrealised profit or loss In accordance with generally accepted accounting principles in Luxembourg, unrealised profits or losses on all components of the statement of net assets at the end of the financial year are accounted for in the statement of net assets.
e) Investment income Interests on bonds and bank accounts are accounted for an accrual basis. Dividends are taken into income on the date upon which the relevant securities are first listed as ex-dividend.
f) Purchases and sales of investments The details of purchases and sales of investments may be obtained at the registered office of the SICAV, free of charge.
g) Expenses When the SICAV incurs expenses, which relate to a particular Sub-Fund or to any action taken in connection with a particular Sub-Fund, such expenses shall be allocated to the relevant Sub-Fund. Expenses of the SICAV which cannot be considered as being attributable to a particular Sub-Fund shall be allocated to all the Sub-Fund pro rata to the net asset value of each Sub-Fund.
h) Futures contracts Net unrealised gain or loss on futures and the related margin calls are disclosed in the Statement of Net Assets. Figures are detailed in note 8. Net realised profit or loss on futures and the change in net unrealised appreciation or depreciation on futures are disclosed in the Statement of Operations and in the Statement of Changes in Net Assets.
i) Combined statement of net asset The value of the combined statement of net assets of the SICAV equals the sum of all different sub-funds’ net assets converted into EUR at the exchange rate prevailing on closing date in Luxembourg.
NOTE 2 - EXCHANGE RATES AS OF DECEMBER 31st, 2015
1 EUR = 1,49305 AUD
1 EUR = 1,50895 CAD
1 EUR = 1,08740 CHF
1 EUR = 7,46265 DKK
1 EUR = 0,73705 GBP
1 EUR = 8,41895 HKD
1 EUR = 130,67644 JPY 1 EUR = 18,76165 MXN
1 EUR = 4,66405 MYR
1 EUR = 9,61525 NOK
1 EUR = 9,15815 SEK
1 EUR = 1,54110 SGD
1 EUR = 1,08630 USD
ZENIT MULTISTRATEGY SICAV
34
Notes to the Financial Statements
as at December 31st, 2015 (continued)
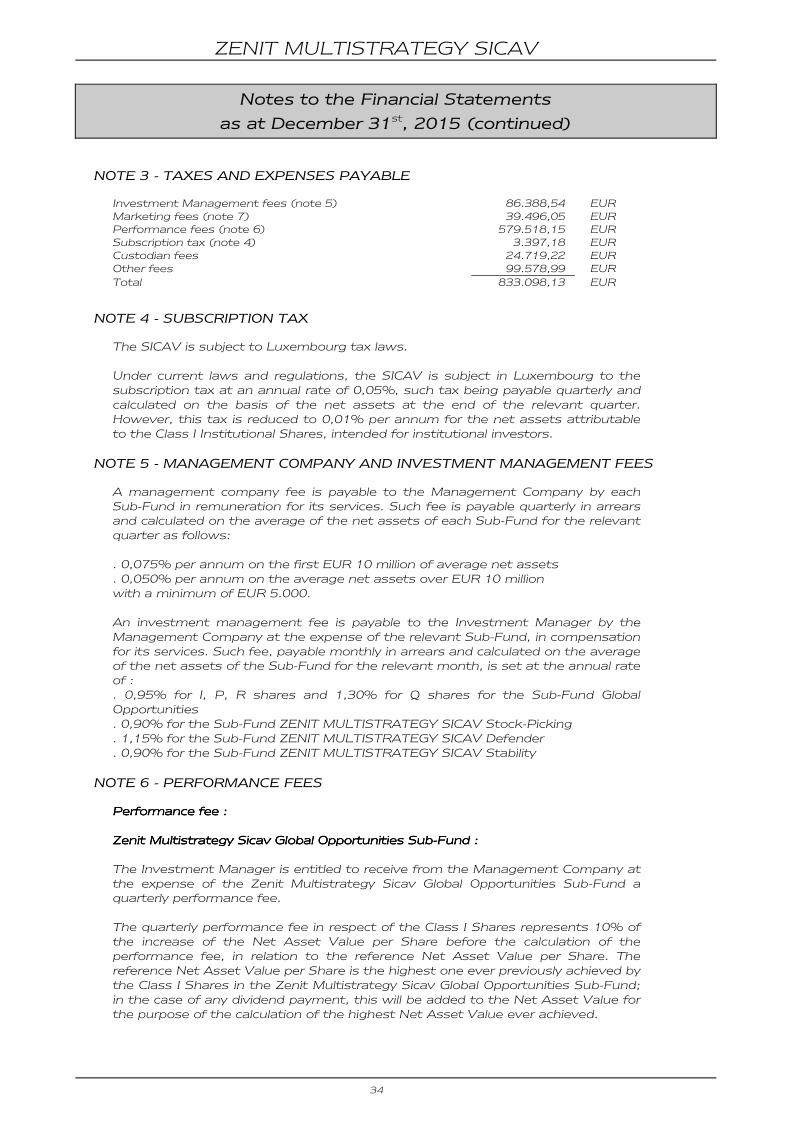
NOTE 3 - TAXES AND EXPENSES PAYABLE
Investment Management fees (note 5) 86.388,54 EUR Marketing fees (note 7) 39.496,05 EUR Performance fees (note 6) 579.518,15 EUR Subscription tax (note 4) 3.397,18 EUR Custodian fees 24.719,22 EUR Other fees 99.578,99 EUR Total 833.098,13 EUR
NOTE 4 - SUBSCRIPTION TAX
The SICAV is subject to Luxembourg tax laws. Under current laws and regulations, the SICAV is subject in Luxembourg to the subscription tax at an annual rate of 0,05%, such tax being payable quarterly and calculated on the basis of the net assets at the end of the relevant quarter. However, this tax is reduced to 0,01% per annum for the net assets attributable to the Class I Institutional Shares, intended for institutional investors.
NOTE 5 - MANAGEMENT COMPANY AND INVESTMENT MANAGEMENT FEES
A management company fee is payable to the Management Company by each Sub-Fund in remuneration for its services. Such fee is payable quarterly in arrears and calculated on the average of the net assets of each Sub-Fund for the relevant quarter as follows: . 0,075% per annum on the first EUR 10 million of average net assets . 0,050% per annum on the average net assets over EUR 10 million with a minimum of EUR 5.000. An investment management fee is payable to the Investment Manager by the Management Company at the expense of the relevant Sub-Fund, in compensation for its services. Such fee, payable monthly in arrears and calculated on the average of the net assets of the Sub-Fund for the relevant month, is set at the annual rate of : . 0,95% for I, P, R shares and 1,30% for Q shares for the Sub-Fund Global Opportunities . 0,90% for the Sub-Fund ZENIT MULTISTRATEGY SICAV Stock-Picking . 1,15% for the Sub-Fund ZENIT MULTISTRATEGY SICAV Defender . 0,90% for the Sub-Fund ZENIT MULTISTRATEGY SICAV Stability
NOTE 6 - PERFORMANCE FEES
Performance feePerformance feePerformance feePerformance fee :::: Zenit Multistrategy Sicav Global Opportunities SubZenit Multistrategy Sicav Global Opportunities SubZenit Multistrategy Sicav Global Opportunities SubZenit Multistrategy Sicav Global Opportunities Sub----FundFundFundFund :::: The Investment Manager is entitled to receive from the Management Company at the expense of the Zenit Multistrategy Sicav Global Opportunities Sub-Fund a quarterly performance fee. The quarterly performance fee in respect of the Class I Shares represents 10% of the increase of the Net Asset Value per Share before the calculation of the performance fee, in relation to the reference Net Asset Value per Share. The reference Net Asset Value per Share is the highest one ever previously achieved by the Class I Shares in the Zenit Multistrategy Sicav Global Opportunities Sub-Fund; in the case of any dividend payment, this will be added to the Net Asset Value for the purpose of the calculation of the highest Net Asset Value ever achieved.
ZENIT MULTISTRATEGY SICAV
35
Notes to the Financial Statements
as at December 31st, 2015 (continued)
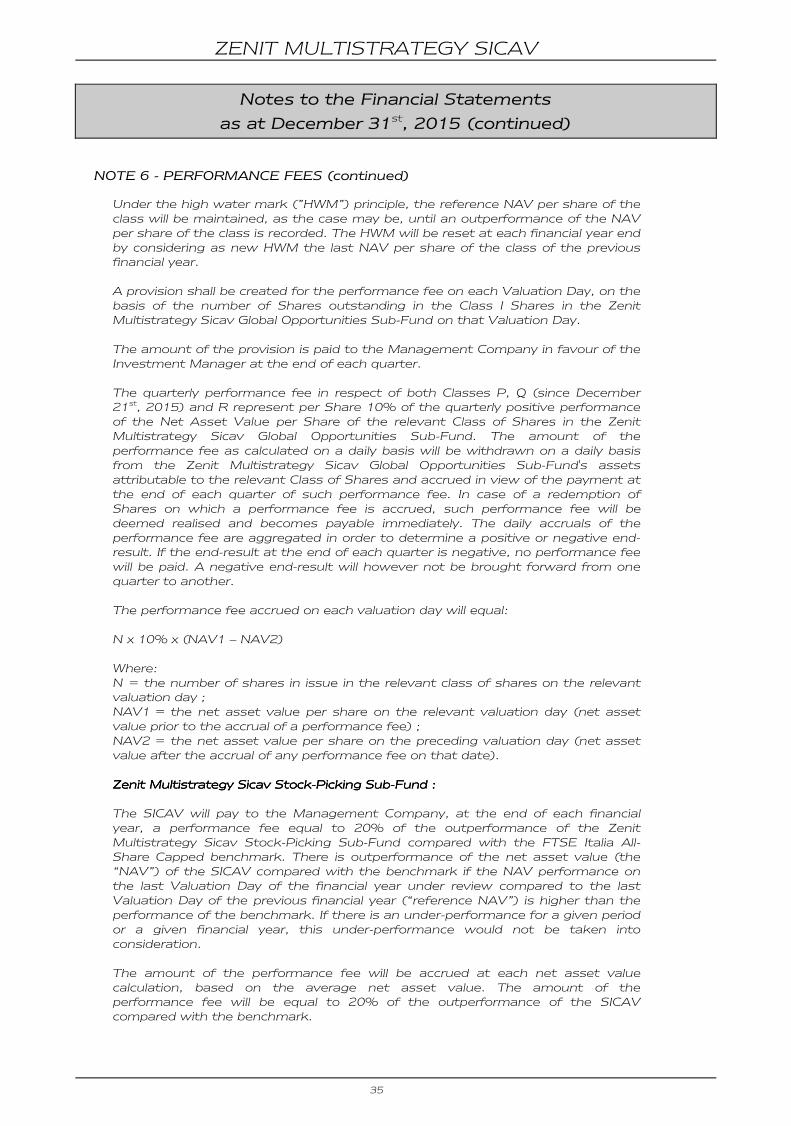
NOTE 6 - PERFORMANCE FEES (continued)
Under the high water mark (”HWM”) principle, the reference NAV per share of the class will be maintained, as the case may be, until an outperformance of the NAV per share of the class is recorded. The HWM will be reset at each financial year end by considering as new HWM the last NAV per share of the class of the previous financial year. A provision shall be created for the performance fee on each Valuation Day, on the basis of the number of Shares outstanding in the Class I Shares in the Zenit Multistrategy Sicav Global Opportunities Sub-Fund on that Valuation Day. The amount of the provision is paid to the Management Company in favour of the Investment Manager at the end of each quarter. The quarterly performance fee in respect of both Classes P, Q (since December 21st, 2015) and R represent per Share 10% of the quarterly positive performance of the Net Asset Value per Share of the relevant Class of Shares in the Zenit Multistrategy Sicav Global Opportunities Sub-Fund. The amount of the performance fee as calculated on a daily basis will be withdrawn on a daily basis from the Zenit Multistrategy Sicav Global Opportunities Sub-Fund's assets attributable to the relevant Class of Shares and accrued in view of the payment at the end of each quarter of such performance fee. In case of a redemption of Shares on which a performance fee is accrued, such performance fee will be deemed realised and becomes payable immediately. The daily accruals of the performance fee are aggregated in order to determine a positive or negative end-result. If the end-result at the end of each quarter is negative, no performance fee will be paid. A negative end-result will however not be brought forward from one quarter to another. The performance fee accrued on each valuation day will equal: N x 10% x (NAV1 – NAV2) Where: N = the number of shares in issue in the relevant class of shares on the relevant valuation day ; NAV1 = the net asset value per share on the relevant valuation day (net asset value prior to the accrual of a performance fee) ; NAV2 = the net asset value per share on the preceding valuation day (net asset value after the accrual of any performance fee on that date). Zenit Multistrategy Sicav StockZenit Multistrategy Sicav StockZenit Multistrategy Sicav StockZenit Multistrategy Sicav Stock----Picking SubPicking SubPicking SubPicking Sub----FundFundFundFund :::: The SICAV will pay to the Management Company, at the end of each financial year, a performance fee equal to 20% of the outperformance of the Zenit Multistrategy Sicav Stock-Picking Sub-Fund compared with the FTSE Italia All-Share Capped benchmark. There is outperformance of the net asset value (the “NAV”) of the SICAV compared with the benchmark if the NAV performance on the last Valuation Day of the financial year under review compared to the last Valuation Day of the previous financial year (“reference NAV”) is higher than the performance of the benchmark. If there is an under-performance for a given period or a given financial year, this under-performance would not be taken into consideration. The amount of the performance fee will be accrued at each net asset value calculation, based on the average net asset value. The amount of the performance fee will be equal to 20% of the outperformance of the SICAV compared with the benchmark.
ZENIT MULTISTRATEGY SICAV
36
Notes to the Financial Statements
as at December 31st, 2015 (continued)
NOTE 6 - PERFORMANCE FEES (continued)
Zenit Multistrategy Sicav Zenit Multistrategy Sicav Zenit Multistrategy Sicav Zenit Multistrategy Sicav Defender Defender Defender Defender SubSubSubSub----FundFundFundFund :::: The Investment Manager is entitled to receive from the Management Company a quarterly performance fee equal to 18% of the increase of the Net Asset Value (the “NAV”) per share of each class before the calculation of the performance fee, compared to the reference NAV per share of the class. The reference NAV per share of each class is the highest NAV per share (after performance fee accrual) ever previously achieved by the class during the fiscal year (for the first fiscal year of each class the first reference NAV per share is the initial subscription price). Under the high water mark (”HWM”) principle, the reference NAV per share of the class will be maintained, as the case may be, until an outperformance of the NAV per share of the class is recorded. The HWM will be reset at each financial year end by considering as new HWM the last NAV per share of the class of the previous financial year. The amount of the performance fee will be accrued at each Net Asset Value calculation, based on the outstanding Shares of each class on the day the Net Asset Value is calculated. The amount of the provision is paid to the Management Company in favour of the Investment Manager at the end of each quarter. Zenit Multistrategy Sicav Zenit Multistrategy Sicav Zenit Multistrategy Sicav Zenit Multistrategy Sicav Stability Stability Stability Stability SubSubSubSub----FundFundFundFund :::: The Investment Manager is entitled to receive from the Management Company at the end of each financial year, a performance fee equal to 20% of the outperformance of the sub-fund compared with the Euribor 3 months plus 3% benchmark. There is outperformance of the net asset value (the “NAV”) of the Company compared with the benchmark if the NAV performance on the last Valuation Day of the financial year under review compared to the last Valuation Day of the previous financial year (“reference NAV”) is higher than the performance of the benchmark. If there is an under-performance for a given period or a given financial year, this under-performance would not be taken into consideration. The amount of the performance fee will be accrued at each net asset value calculation, based on the average net asset value. The amount of the performance fee will be equal to 20% of the outperformance of the SICAV compared with the benchmark. Performance Fees will be calculated and will be paid to the Management Company from January 1st, 2016. For the year ended December 31st, 2015, the amount of performance fees charged to the SICAV is EUR 862.030,19, split as follows :
- EUR 323.170,95 for Zenit Multistrategy Sicav Global Opportunities Sub-Fund;
- EUR 458.991,53 for Zenit Multistrategy Sicav Stock-Picking Sub-Fund; - EUR 79.867,71 for Zenit Multistrategy Sicav Defender Sub-Fund.
ZENIT MULTISTRATEGY SICAV
37
Notes to the Financial Statements
as at December 31st, 2015 (continued)
NOTE 7 - MARKETING FEES
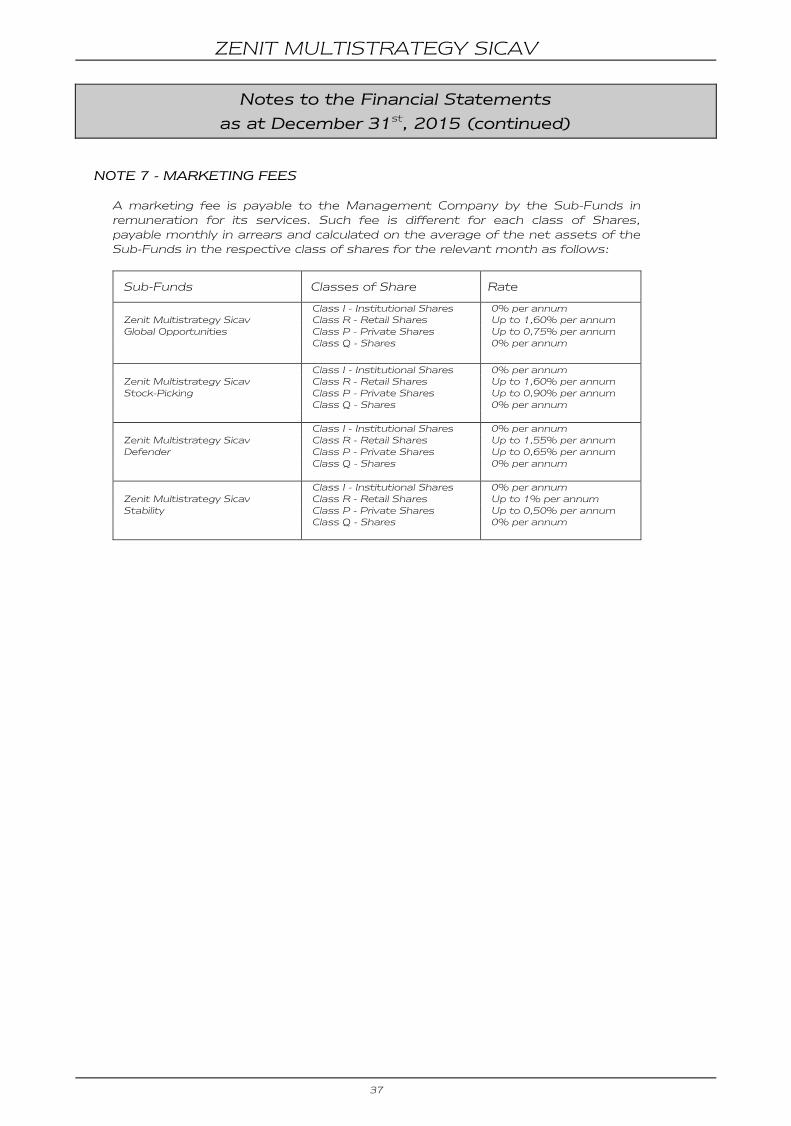
A marketing fee is payable to the Management Company by the Sub-Funds in remuneration for its services. Such fee is different for each class of Shares, payable monthly in arrears and calculated on the average of the net assets of the Sub-Funds in the respective class of shares for the relevant month as follows:
Sub-Funds Classes of Share Rate
Class I - Institutional Shares 0% per annum Zenit Multistrategy Sicav Class R - Retail Shares Up to 1,60% per annum Global Opportunities Class P - Private Shares Up to 0,75% per annum Class Q - Shares 0% per annum
Class I - Institutional Shares 0% per annum Zenit Multistrategy Sicav Class R - Retail Shares Up to 1,60% per annum Stock-Picking Class P - Private Shares Up to 0,90% per annum Class Q - Shares 0% per annum Class I - Institutional Shares 0% per annum Zenit Multistrategy Sicav Class R - Retail Shares Up to 1,55% per annum Defender Class P - Private Shares Up to 0,65% per annum Class Q - Shares 0% per annum Class I - Institutional Shares 0% per annum Zenit Multistrategy Sicav Class R - Retail Shares Up to 1% per annum Stability Class P - Private Shares Up to 0,50% per annum Class Q - Shares 0% per annum
ZENIT MULTISTRATEGY SICAV
38
Notes to the Financial Statements
as at December 31st, 2015 (continued)
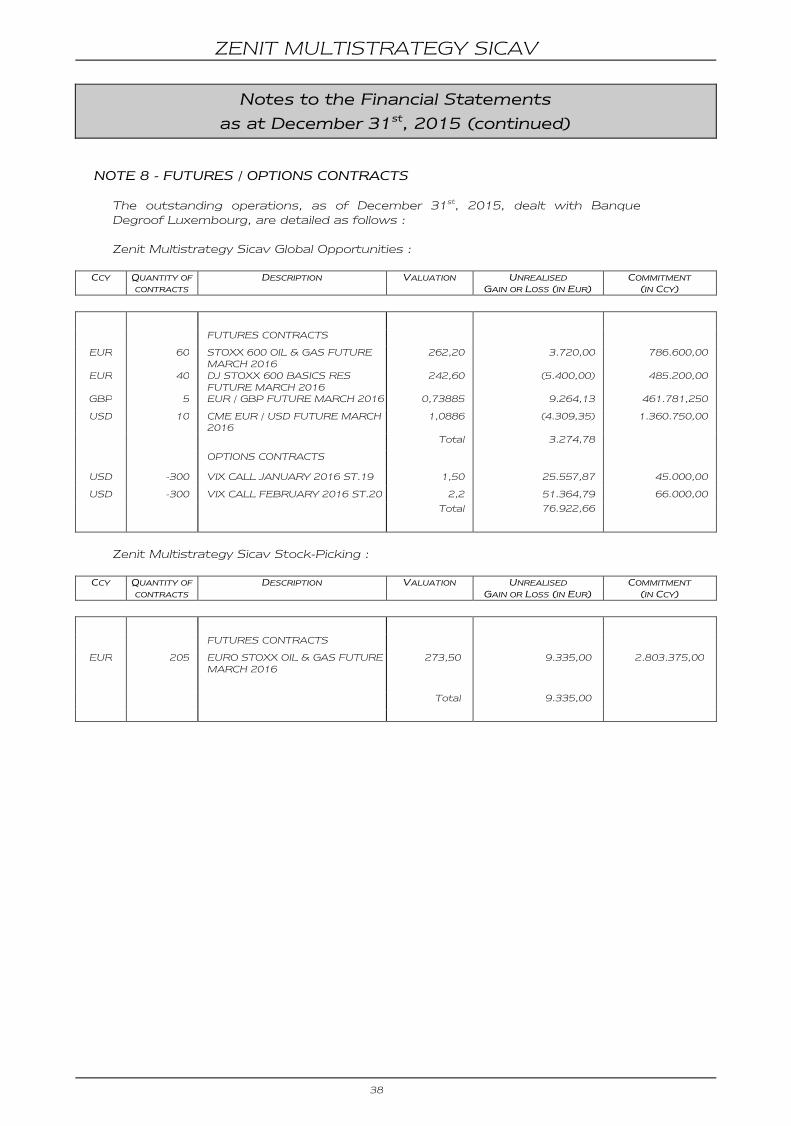
NOTE 8 - FUTURES / OPTIONS CONTRACTS The outstanding operations, as of December 31st, 2015, dealt with Banque Degroof Luxembourg, are detailed as follows : Zenit Multistrategy Sicav Global Opportunities :
CCY QUANTITY OF
CONTRACTS DESCRIPTION VALUATION UNREALISED
GAIN OR LOSS (IN EUR) COMMITMENT
(IN CCY)
FUTURES CONTRACTS
EUR 60 STOXX 600 OIL & GAS FUTURE MARCH 2016
262,20 3.720,00 786.600,00
EUR 40 DJ STOXX 600 BASICS RES FUTURE MARCH 2016
242,60 (5.400,00) 485.200,00
GBP 5 EUR / GBP FUTURE MARCH 2016 0,73885 9.264,13 461.781,250
USD 10 CME EUR / USD FUTURE MARCH 2016
1,0886 (4.309,35) 1.360.750,00
Total 3.274,78
OPTIONS CONTRACTS
USD -300 VIX CALL JANUARY 2016 ST.19 1,50 25.557,87 45.000,00
USD -300 VIX CALL FEBRUARY 2016 ST.20 2,2 51.364,79 66.000,00
Total 76.922,66
Zenit Multistrategy Sicav Stock-Picking :
CCY QUANTITY OF
CONTRACTS
DESCRIPTION VALUATION UNREALISED
GAIN OR LOSS (IN EUR)
COMMITMENT
(IN CCY)
FUTURES CONTRACTS
EUR 205 EURO STOXX OIL & GAS FUTURE MARCH 2016
273,50 9.335,00 2.803.375,00
Total 9.335,00
ZENIT MULTISTRATEGY SICAV
39
Notes to the Financial Statements
as at December 31st, 2015 (continued)
NOTE 9 - TRANSACTION FEES
The caption “Transaction Fees” includes fees on purchases and sales of securities and derivatives as brokerage fees, bank charges, taxes and other costs.
NOTE 10 - MOVEMENTS IN THE SECURITIES PORTFOLIOS
The list of changes in the composition of the securities portfolios is available free of charge at the registered office of the SICAV.
NOTE 11 - EVENTS DURING THE FINANCIAL YEAR
The Zenit Multistrategy Sicav Stability Sub-Fund was launched on May 19th, 2015. For all Sub-Funds except Zenit Multistrategy Sicav Defender, the Share Class Q, intended for all types of investors listed and tradable on a regulated European Stock Exchange, was opened on November 10th, 2015. On January 7th, 2016, the Board of Directors of the SICAV decided to put Zenit MultiStrategy SICAV – Defender (the “Sub-Fund”) on hold. Zenit SGR SpA, the Investment Manager and sponsor of the SICAV, immediately invited its Shareholders to redeem. The decision was motivated by the economic situation and the unsatisfactory sizeable level of assets of the Sub-Fund; these rendered the prudent asset allocation investment objectives and policy treacherous to be prolonged. Consequently, the Sub-Fund logged important redemptions from December 10th, 2015 on. The Net Asset Value of the Sub-Fund felt to EUR 1.128.426,02 on December 14th, 2015. The penultimate redemption of 4.678,16 shares was communicated by the SICAV Transfer Agent on December 22nd, 2015. Due to technical issues, one redemption order had not been put in place on a timely manner. On December 22nd, 2015, when the Investment Manager liquidated the whole portfolio, the Sub-Fund still had 2.100,00 shares outstanding. From December 22nd, 2015 on, the Sub-Fund was therefore not invested pursuant to its investment policy. In addition, it was fully liquid from December 28th, 2015 on (after the settlement of all sales). On January 7th, 2016, further to the accounting of the last 2.100,00 shares redemption, the Domiciliary Agent officially announced that the Sub-Fund’s activity was on-hold from this date on.
ZENIT MULTISTRATEGY SICAV
40
Unaudited Information
RISK MANAGEMENT Each Sub-Fund shall ensure that the global exposure relating to financial derivative instruments does not exceed the total net value of their portfolio. Global exposure is a measure designed to limit the leverage generated by each Sub-Fund through the use of financial derivative instruments. In order to calculate its global exposure, each Sub-Fund will use the commitment approach, thereby aggregating the market value of the equivalent position of underlying assets. When using the commitment approach the maximum leverage generated by the use of financial derivative instruments will be of 100%.