Embed Size (px)
Citation preview
Shuttle Inc.
Financial Statements for the Years Ended December 31, 2013 and 2012 and Independent Auditors’ Report
- 1 -
INDEPENDENT AUDITORS’ REPORT The Board of Directors and Stockholders Shuttle Inc. We have audited the accompanying balance sheets of Shuttle Inc. as of December 31, 2013, December 31, 2012 and January 1, 2012, and the related statements of comprehensive income, changes in equity and cash flows for the years ended December 31, 2013 and 2012. These financial statements are the responsibility of Shuttle Inc. management. Our responsibility is to express an opinion on these financial statements based on our audits. We conducted our audits in accordance with the Rules Governing the Audit of Financial Statements by Certified Public Accountants and auditing standards generally accepted in the Republic of China. Those rules and standards require that we plan and perform the audit to obtain reasonable assurance about whether the financial statements are free of material misstatement. An audit includes examining, on a test basis, evidence supporting the amounts and disclosures in the financial statements. An audit also includes assessing the accounting principles used and significant estimates made by management, as well as evaluating the overall financial statement presentation. We believe that our audits provide a reasonable basis for our opinion. In our opinion, the financial statements referred to above present fairly, in all material respects, the financial position of Shuttle Inc. as of December 31, 2013, December 31, 2012 and January 1, 2012, and its financial performance and its cash flows for the years ended December 31, 2013 and 2012, in conformity with the Regulations Governing the Preparation of Financial Reports by Securities Issuers. March 25, 2014
Notice to Readers
The accompanying financial statements are intended only to present the financial position,
financial performance and cash flows in accordance with accounting principles and practices
generally accepted in the Republic of China and not those of any other jurisdictions. The
standards, procedures and practices to audit such financial statements are those generally applied
in the Republic of China.
For the convenience of readers, the independent auditors’ report and the accompanying financial
statements have been translated into English from the original Chinese version prepared and used
in the Republic of China. If there is any conflict between the English version and the original
Chinese version or any difference in the interpretation of the two versions, the Chinese-language
independent auditors’ report and financial statements shall prevail.
- 2 -
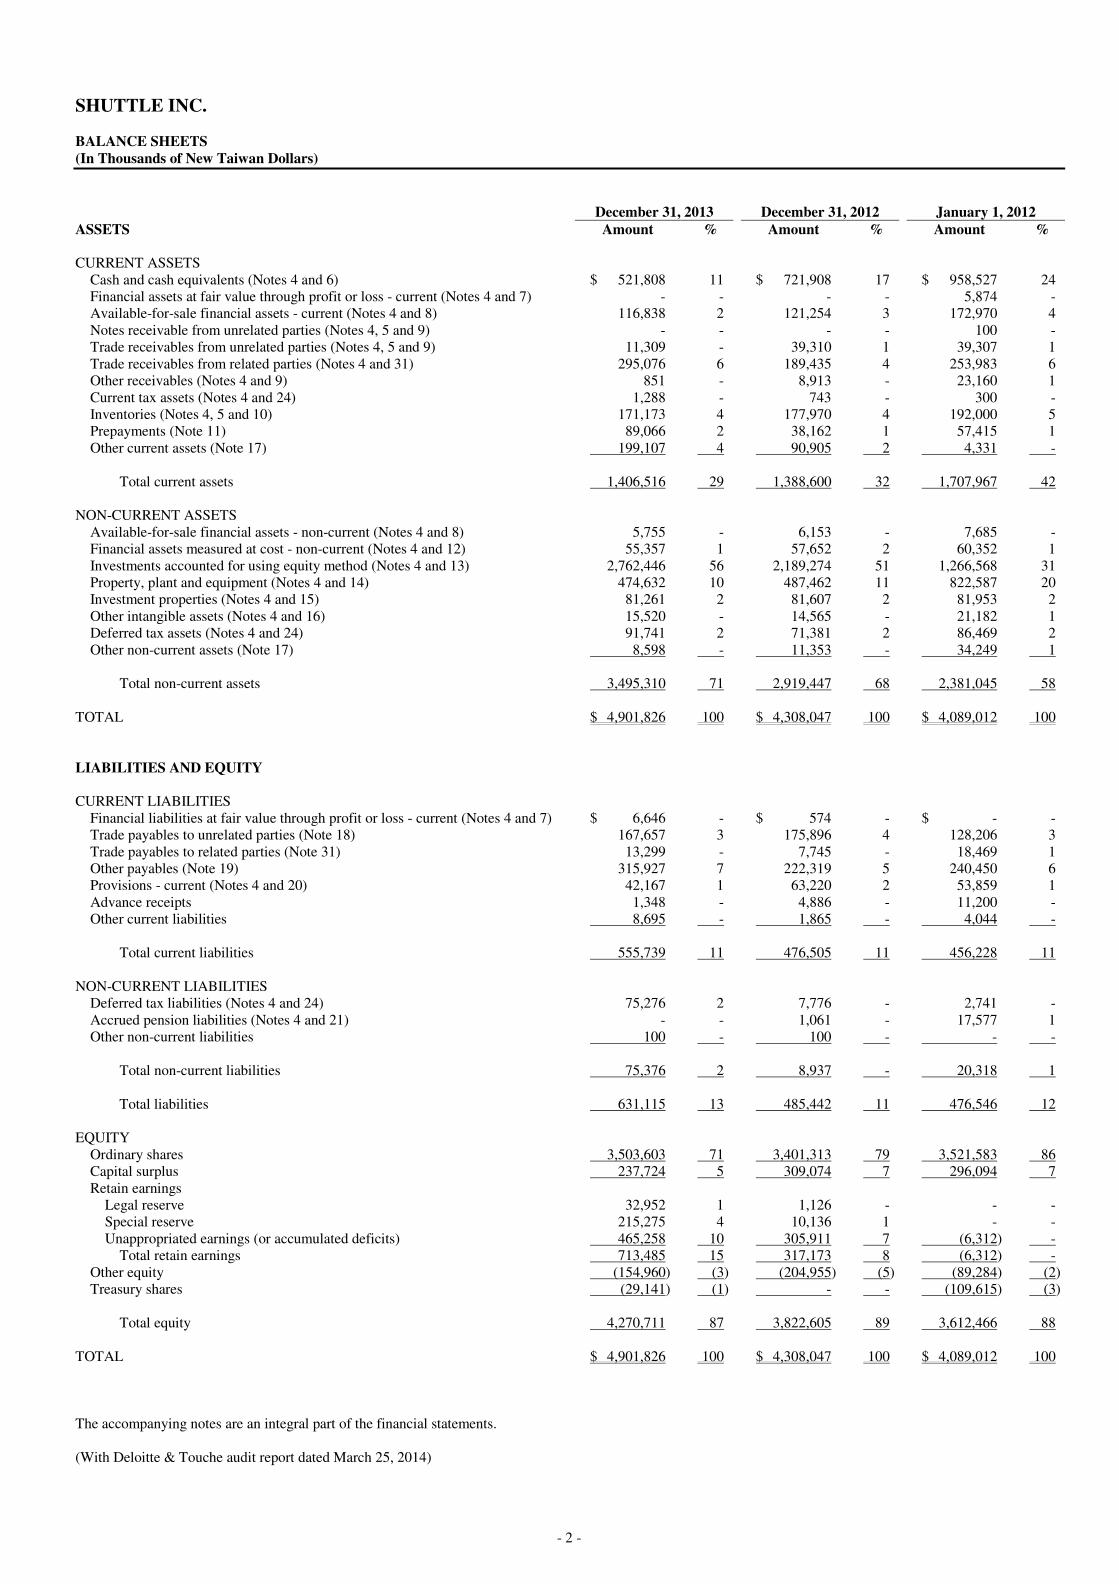
SHUTTLE INC. BALANCE SHEETS (In Thousands of New Taiwan Dollars)
December 31, 2013 December 31, 2012 January 1, 2012 ASSETS Amount % Amount % Amount % CURRENT ASSETS
Cash and cash equivalents (Notes 4 and 6) $ 521,808 11 $ 721,908 17 $ 958,527 24 Financial assets at fair value through profit or loss - current (Notes 4 and 7) - - - - 5,874 - Available-for-sale financial assets - current (Notes 4 and 8) 116,838 2 121,254 3 172,970 4 Notes receivable from unrelated parties (Notes 4, 5 and 9) - - - - 100 - Trade receivables from unrelated parties (Notes 4, 5 and 9) 11,309 - 39,310 1 39,307 1 Trade receivables from related parties (Notes 4 and 31) 295,076 6 189,435 4 253,983 6 Other receivables (Notes 4 and 9) 851 - 8,913 - 23,160 1 Current tax assets (Notes 4 and 24) 1,288 - 743 - 300 - Inventories (Notes 4, 5 and 10) 171,173 4 177,970 4 192,000 5 Prepayments (Note 11) 89,066 2 38,162 1 57,415 1 Other current assets (Note 17) 199,107 4 90,905 2 4,331 -
Total current assets 1,406,516 29 1,388,600 32 1,707,967 42
NON-CURRENT ASSETS
Available-for-sale financial assets - non-current (Notes 4 and 8) 5,755 - 6,153 - 7,685 - Financial assets measured at cost - non-current (Notes 4 and 12) 55,357 1 57,652 2 60,352 1 Investments accounted for using equity method (Notes 4 and 13) 2,762,446 56 2,189,274 51 1,266,568 31 Property, plant and equipment (Notes 4 and 14) 474,632 10 487,462 11 822,587 20 Investment properties (Notes 4 and 15) 81,261 2 81,607 2 81,953 2 Other intangible assets (Notes 4 and 16) 15,520 - 14,565 - 21,182 1 Deferred tax assets (Notes 4 and 24) 91,741 2 71,381 2 86,469 2 Other non-current assets (Note 17) 8,598 - 11,353 - 34,249 1
Total non-current assets 3,495,310 71 2,919,447 68 2,381,045 58
TOTAL $ 4,901,826 100 $ 4,308,047 100 $ 4,089,012 100 LIABILITIES AND EQUITY CURRENT LIABILITIES
Financial liabilities at fair value through profit or loss - current (Notes 4 and 7) $ 6,646 - $ 574 - $ - - Trade payables to unrelated parties (Note 18) 167,657 3 175,896 4 128,206 3 Trade payables to related parties (Note 31) 13,299 - 7,745 - 18,469 1 Other payables (Note 19) 315,927 7 222,319 5 240,450 6 Provisions - current (Notes 4 and 20) 42,167 1 63,220 2 53,859 1 Advance receipts 1,348 - 4,886 - 11,200 - Other current liabilities 8,695 - 1,865 - 4,044 -
Total current liabilities 555,739 11 476,505 11 456,228 11
NON-CURRENT LIABILITIES
Deferred tax liabilities (Notes 4 and 24) 75,276 2 7,776 - 2,741 - Accrued pension liabilities (Notes 4 and 21) - - 1,061 - 17,577 1 Other non-current liabilities 100 - 100 - - -
Total non-current liabilities 75,376 2 8,937 - 20,318 1
Total liabilities 631,115 13 485,442 11 476,546 12
EQUITY
Ordinary shares 3,503,603 71 3,401,313 79 3,521,583 86 Capital surplus 237,724 5 309,074 7 296,094 7 Retain earnings
Legal reserve 32,952 1 1,126 - - - Special reserve 215,275 4 10,136 1 - - Unappropriated earnings (or accumulated deficits) 465,258 10 305,911 7 (6,312) -
Total retain earnings 713,485 15 317,173 8 (6,312) - Other equity (154,960) (3) (204,955) (5) (89,284) (2) Treasury shares (29,141) (1) - - (109,615) (3)
Total equity 4,270,711 87 3,822,605 89 3,612,466 88
TOTAL $ 4,901,826 100 $ 4,308,047 100 $ 4,089,012 100 The accompanying notes are an integral part of the financial statements. (With Deloitte & Touche audit report dated March 25, 2014)
- 3 -
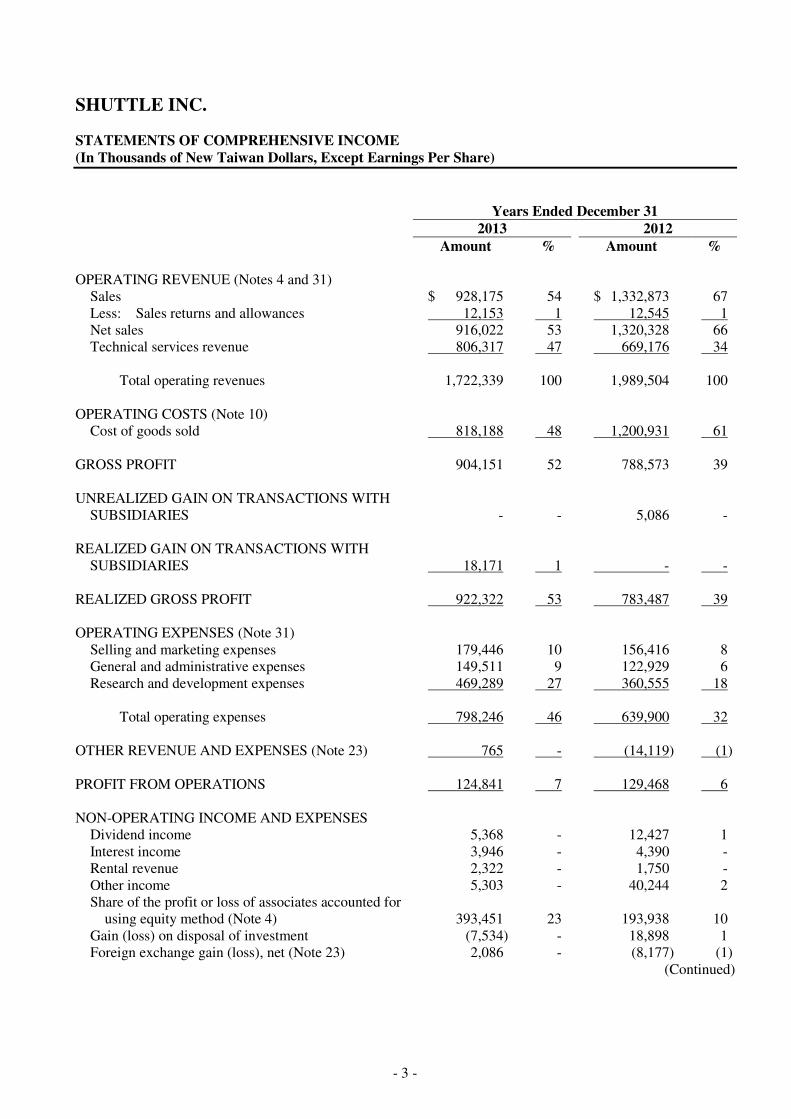
SHUTTLE INC. STATEMENTS OF COMPREHENSIVE INCOME (In Thousands of New Taiwan Dollars, Except Earnings Per Share)
Years Ended December 31 2013 2012 Amount % Amount % OPERATING REVENUE (Notes 4 and 31)
Sales $ 928,175 54 $ 1,332,873 67 Less: Sales returns and allowances 12,153 1 12,545 1 Net sales 916,022 53 1,320,328 66 Technical services revenue 806,317 47 669,176 34
Total operating revenues 1,722,339 100 1,989,504 100
OPERATING COSTS (Note 10)
Cost of goods sold 818,188 48 1,200,931 61 GROSS PROFIT 904,151 52 788,573 39 UNREALIZED GAIN ON TRANSACTIONS WITH
SUBSIDIARIES - - 5,086 - REALIZED GAIN ON TRANSACTIONS WITH
SUBSIDIARIES 18,171 1 - - REALIZED GROSS PROFIT 922,322 53 783,487 39 OPERATING EXPENSES (Note 31)
Selling and marketing expenses 179,446 10 156,416 8 General and administrative expenses 149,511 9 122,929 6 Research and development expenses 469,289 27 360,555 18
Total operating expenses 798,246 46 639,900 32
OTHER REVENUE AND EXPENSES (Note 23) 765 - (14,119) (1) PROFIT FROM OPERATIONS 124,841 7 129,468 6 NON-OPERATING INCOME AND EXPENSES
Dividend income 5,368 - 12,427 1 Interest income 3,946 - 4,390 - Rental revenue 2,322 - 1,750 - Other income 5,303 - 40,244 2 Share of the profit or loss of associates accounted for
using equity method (Note 4) 393,451 23 193,938 10 Gain (loss) on disposal of investment (7,534) - 18,898 1 Foreign exchange gain (loss), net (Note 23) 2,086 - (8,177) (1)
(Continued)
- 4 -
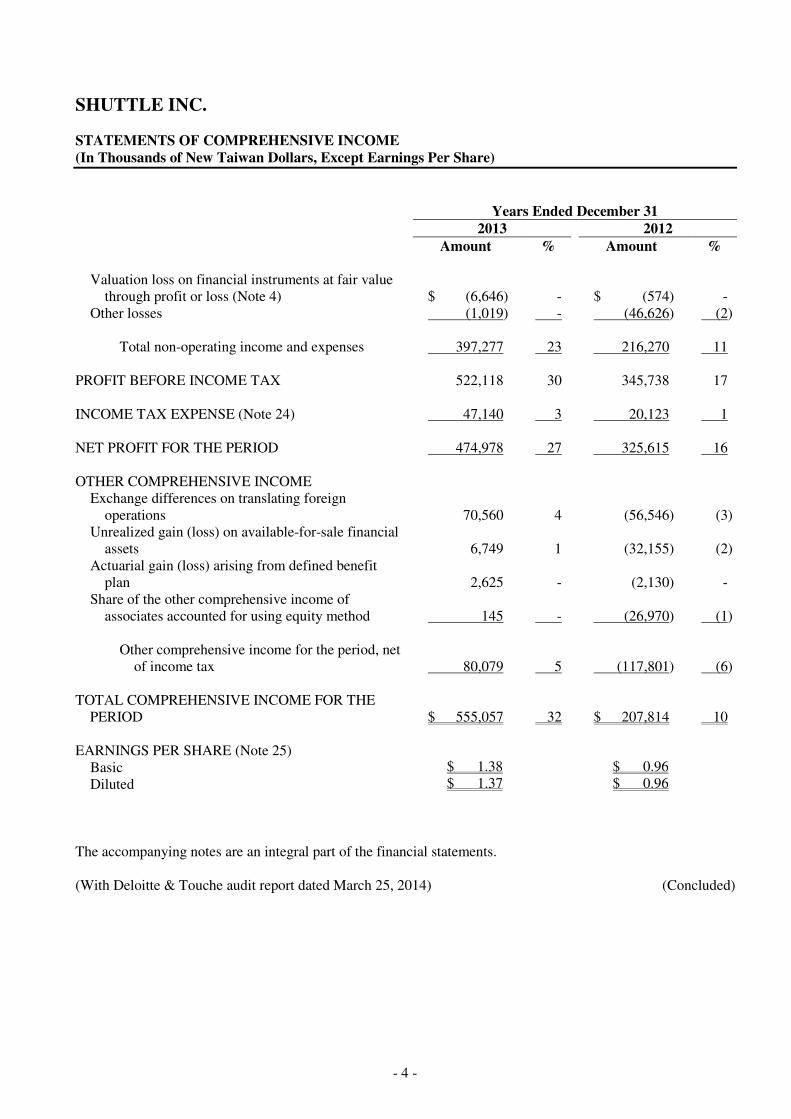
SHUTTLE INC. STATEMENTS OF COMPREHENSIVE INCOME (In Thousands of New Taiwan Dollars, Except Earnings Per Share)
Years Ended December 31 2013 2012 Amount % Amount %
Valuation loss on financial instruments at fair value through profit or loss (Note 4) $ (6,646) - $ (574) -
Other losses (1,019) - (46,626) (2)
Total non-operating income and expenses 397,277 23 216,270 11 PROFIT BEFORE INCOME TAX 522,118 30 345,738 17 INCOME TAX EXPENSE (Note 24) 47,140 3 20,123 1 NET PROFIT FOR THE PERIOD 474,978 27 325,615 16 OTHER COMPREHENSIVE INCOME
Exchange differences on translating foreign operations 70,560 4 (56,546) (3)
Unrealized gain (loss) on available-for-sale financial assets 6,749 1 (32,155) (2)
Actuarial gain (loss) arising from defined benefit plan 2,625 - (2,130) -
Share of the other comprehensive income of associates accounted for using equity method 145 - (26,970) (1)
Other comprehensive income for the period, net
of income tax 80,079 5 (117,801) (6) TOTAL COMPREHENSIVE INCOME FOR THE
PERIOD $ 555,057 32 $ 207,814 10 EARNINGS PER SHARE (Note 25)
Basic $ 1.38 $ 0.96 Diluted $ 1.37 $ 0.96
The accompanying notes are an integral part of the financial statements. (With Deloitte & Touche audit report dated March 25, 2014) (Concluded)
- 5 -
SHUTTLE INC. STATEMENTS OF CHANGES IN EQUITY (In Thousands of New Taiwan Dollars, Except Cash Dividends Per Share)
Other Equity (Notes 22 and 26)
Unappropriated Exchange
Differences on Unrealized Gain
(Loss) on
Share Capital
(Notes 22 and 26) Capital Surplus
(Notes 22 and 26) Legal Reserve Special Reserve Earnings
(Notes 22 and 24) Translating
Foreign Operations Available-for-sale Financial Assets
Unearned Compensation
Treasury Shares (Note 22) Total Equity
BALANCE, JANUARY 1, 2012 $ 3,521,583 $ 296,094 $ - $ - $ (6,312) $ - $ (89,284) $ - $ (109,615) $ 3,612,466 Appropriation of the 2011 earnings
Legal reserve - - 1,126 - (1,126) - - - - - Special reserve - - - 10,136 (10,136) - - - - -
- - 1,126 10,136 (11,262) - - - - -
Change in capital surplus from investments in associates
accounted for by using equity method - 2,325 - - - - - - - 2,325 Retirement of treasury stock (120,270) 10,655 - - - - - - 109,615 - Net profit for the year ended December 31, 2012 - - - - 325,615 - - - - 325,615 Other comprehensive income for the year ended December 31,
2013 - - - - (2,130) (56,546) (59,125) - - (117,801) Total comprehensive for the year ended December 31, 2012 - - - - 323,485 (56,546) (59,125) - - 207,814 BALANCE AT DECEMBER 31, 2012 3,401,313 309,074 1,126 10,136 305,911 (56,546) (148,409) - - 3,822,605 Appropriation of the 2012 earnings
Legal reserve - - 31,826 - (31,826) - - - - - Special reserve - - - 205,139 (205,139) - - - - - Cash dividends distributed by the Company - $0.239 per share - - - - (81,291) - - - - (81,291)
- - 31,826 205,139 (318,256) - - - - (81,291)
Issue of cash dividends from capital surplus - $0.261 per share - (88,774) - - - - - - - (88,774) Share-based payment arrangement 102,290 17,424 - - - - - (27,459) - 92,255 Net profit for the year ended December 31, 2013 - - - - 474,978 - - - - 474,978 Other comprehensive income for the year ended December 31,
2013 - - - - 2,625 70,560 6,894 - - 80,079 Total comprehensive income for the year ended December 31,
2013 - - - - 477,603 70,560 6,894 - - 555,057 Buy-back of ordinary shares - - - - - - - - (29,141) (29,141) BALANCE AT DECEMBER 31, 2013 $ 3,503,603 $ 237,724 $ 32,952 $ 215,275 $ 465,258 $ 14,014 $ (141,515) $ (27,459) $ (29,141) $ 4,270,711 The accompanying notes are an integral part of the financial statements. (With Deloitte & Touche audit report dated March 25, 2014)
- 6 -
SHUTTLE INC. STATEMENTS OF CASH FLOWS (In Thousands of New Taiwan Dollars)
Years Ended December 31 2013 2012 CASH FLOWS FROM OPERATING ACTIVITIES
Income before income tax $ 522,118 $ 345,738 Adjustments to reconcile income before income tax to net cash
provided by operating activities: Depreciation 19,484 19,447 Amortization 119,009 91,796 Provision for (reversal of) doubtful accounts 840 (9,058) Compensation expense 32,397 - Valuation loss on financial assets and liabilities at fair value through
profit or loss, net 6,646 574 Interest expenses 3 7 Interest income (3,946) (4,390) Dividend income (5,368) (12,427) Share of the loss of associates accounted for using equity method (393,451) (193,938) Loss (gain) on disposal of property, plant and equipment (765) 14,119 Loss (gain) on disposal of investment 7,534 (18,898) Provision for loss on inventory 10,724 18,809 Unrealized gain on the transactions with subsidiaries - 5,086 Realized gain on the transactions with subsidiaries (18,171) - Changes in operating assets and liabilities:
Financial assets held for trading (574) 5,874 Notes receivable - 100 Trade receivables 27,161 9,055 Trade receivable from related parties (105,641) 64,548 Other receivables 8,204 14,192 Inventories (3,927) (4,779) Prepayment (162,000) (62,419) Other current assets 30,125 (127,298) Trade payable (8,239) 47,690 Trade payables to related parties 5,554 (10,724) Other payables 93,717 (9,035) Advance receipts (3,538) (6,314) Provisions (21,053) 9,361 Other current liabilities 6,830 (2,179) Accrued pension liabilities (3,191) (18,646)
Cash generated from operations 160,482 166,291 Interest paid (3) (7) Income tax paid (545) (443)
Net cash provided by operating activities 159,934 165,841
(Continued)
- 7 -
SHUTTLE INC. STATEMENTS OF CASH FLOWS (In Thousands of New Taiwan Dollars)
Years Ended December 31 2013 2012 CASH FLOWS FROM INVESTING ACTIVITIES
Acquisition of available-for-sale financial assets $ - $ (45,595) Proceeds from disposal of available-for-sale financial assets 4,029 85,586 Acquisition of investments accounted for using equity method (133,482) (814,977) Acquisition of property, plant and equipment (7,303) (24,521) Proceeds from disposal of property, plant and equipment 1,377 317,262 Acquisition of intangible assets (8,868) (12,783) Decrease (increase) in other financial assets (138,327) 50,000 Decrease in other noncurrent assets 2,755 22,896 Capital reduction of financial assets carried at cost 45,000 2,700 Interest received 3,805 4,445 Cash dividends received 5,368 12,427
Net cash used in investing activities (225,646) (402,560)
CASH FLOWS FROM FINANCING ACTIVITIES
Increase in guarantee deposits - 100 Return of subscription price of restricted shares (7,182) - Cash dividends paid to owners of the Company (81,291) - Cash distributed from additional paid-in capital (88,774) - Proceeds from issue of ordinary shares 72,000 - Payments for buy-back of ordinary shares (29,141) -
Net cash provided by (used in) financing activities (134,388) 100
NET DECREASE IN CASH AND CASH EQUIVALENTS (200,100) (236,619) CASH AND CASH EQUIVALENTS, BEGINNING OF YEAR 721,908 958,527 CASH AND CASH EQUIVALENTS, END OF YEAR $ 521,808 $ 721,908 The accompanying notes are an integral part of the financial statements. (With Deloitte & Touche audit report dated March 25, 2014) (Concluded)
- 8 -
SHUTTLE INC. NOTES TO FINANCIAL STATEMENTS FOR THE YEARS ENDED DECEMBER 31, 2013 AND 2012 (In Thousands of New Taiwan Dollars, Unless Stated Otherwise)
1. ORGANIZATION AND OPERATIONS
Shuttle Inc. (the “Company”) was incorporated in June 1983. The Company is engaged in manufacturing and selling laptops, barebones, mainboards, other computer peripherals, and in providing related technical services. The Company’s shares were listed and traded on the Taiwan GreTai Securities Market (the “TGTSM”) on December 8, 1998 until the shares became listed and traded on the Taiwan Stock Exchange (the “TWSE”) since March 17, 2000.
2. APPROVAL OF FINANCIAL STATEMENTS The financial statements were approved by the board of directors and authorized for issue on March 25, 2014.
3. APPLICATION OF NEW, AMENDED AND REVISED STANDARDS AND INTERPRETATIONS
a. New, amended and revised standards and interpretations (the “New IFRSs”) in issue but not yet effective The Company have not applied the following International Financial Reporting Standards (IFRS), International Accounting Standards (IAS), Interpretations of IFRS (IFRIC), and Interpretations of IAS (SIC) issued by the IASB. As of the date that the financial statements were authorized for issue, the Financial Supervisory Commission (the “FSC”) has not announced the effective dates for the following new, amended and revised standards and interpretations (the “New IFRSs”)./On January 28, 2014, the Financial Supervisory Commission (FSC) announced the framework for the adoption of updated IFRSs version in the ROC. Under this framework, starting January 1, 2015, the previous version of IFRSs endorsed by the FSC (the 2010 IFRSs version) currently applied by companies with shares listed on the Taiwan Stock Exchange or traded on the Taiwan GreTai Securities Market or Emerging Stock Market will be replaced by the updated IFRSs without IFRS 9 (the 2013 IFRSs version). However, as of the date that the financial statements were authorized for issue, the FSC has not endorsed the following new, amended and revised standards and interpretations issued by the IASB (the “New IFRSs”) included in the 2013 IFRSs version.
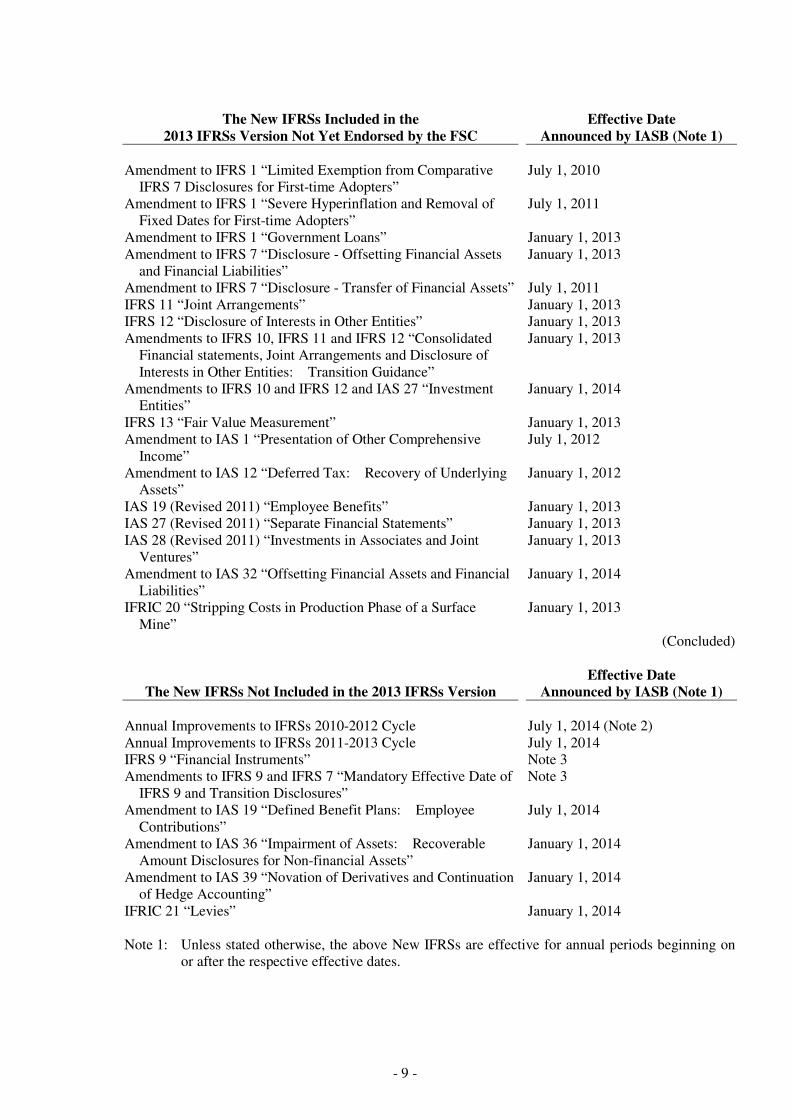
The New IFRSs Included in the 2013 IFRSs Version Not Yet Endorsed by the FSC
Effective Date Announced by IASB (Note 1)
Improvements to IFRSs (2009) - amendment to IAS 39 January 1, 2009 and January 1,
2010, as appropriate Amendment to IAS 39 “Embedded Derivatives” Effective for annual periods ending
on or after June 30, 2009 Improvements to IFRSs (2010) July 1, 2010 and January 1, 2011,
as appropriate Annual Improvements to IFRSs 2009-2011 Cycle January 1, 2013
(Continued)
- 9 -
The New IFRSs Included in the
2013 IFRSs Version Not Yet Endorsed by the FSC Effective Date
Announced by IASB (Note 1) Amendment to IFRS 1 “Limited Exemption from Comparative
IFRS 7 Disclosures for First-time Adopters” July 1, 2010
Amendment to IFRS 1 “Severe Hyperinflation and Removal of Fixed Dates for First-time Adopters”
July 1, 2011
Amendment to IFRS 1 “Government Loans” January 1, 2013 Amendment to IFRS 7 “Disclosure - Offsetting Financial Assets
and Financial Liabilities” January 1, 2013
Amendment to IFRS 7 “Disclosure - Transfer of Financial Assets” July 1, 2011 IFRS 11 “Joint Arrangements” January 1, 2013 IFRS 12 “Disclosure of Interests in Other Entities” January 1, 2013 Amendments to IFRS 10, IFRS 11 and IFRS 12 “Consolidated
Financial statements, Joint Arrangements and Disclosure of Interests in Other Entities: Transition Guidance”
January 1, 2013
Amendments to IFRS 10 and IFRS 12 and IAS 27 “Investment Entities”
January 1, 2014
IFRS 13 “Fair Value Measurement” January 1, 2013 Amendment to IAS 1 “Presentation of Other Comprehensive
Income” July 1, 2012
Amendment to IAS 12 “Deferred Tax: Recovery of Underlying Assets”
January 1, 2012
IAS 19 (Revised 2011) “Employee Benefits” January 1, 2013 IAS 27 (Revised 2011) “Separate Financial Statements” January 1, 2013 IAS 28 (Revised 2011) “Investments in Associates and Joint
Ventures” January 1, 2013
Amendment to IAS 32 “Offsetting Financial Assets and Financial Liabilities”
January 1, 2014
IFRIC 20 “Stripping Costs in Production Phase of a Surface Mine”
January 1, 2013
(Concluded)
The New IFRSs Not Included in the 2013 IFRSs Version Effective Date
Announced by IASB (Note 1) Annual Improvements to IFRSs 2010-2012 Cycle July 1, 2014 (Note 2) Annual Improvements to IFRSs 2011-2013 Cycle July 1, 2014 IFRS 9 “Financial Instruments” Note 3 Amendments to IFRS 9 and IFRS 7 “Mandatory Effective Date of
IFRS 9 and Transition Disclosures” Note 3
Amendment to IAS 19 “Defined Benefit Plans: Employee Contributions”
July 1, 2014
Amendment to IAS 36 “Impairment of Assets: Recoverable Amount Disclosures for Non-financial Assets”
January 1, 2014
Amendment to IAS 39 “Novation of Derivatives and Continuation of Hedge Accounting”
January 1, 2014
IFRIC 21 “Levies” January 1, 2014 Note 1: Unless stated otherwise, the above New IFRSs are effective for annual periods beginning on
or after the respective effective dates.
- 10 -
Note 2: The amendment to IFRS 2 applies to share-based payment transactions for which the grant date is on or after July 1, 2014; the amendment to IFRS 3 applies to business combinations for which the acquisition date is on or after July 1, 2014; the amendment to IFRS 13 is effective immediately; the remaining amendments are effective for annual periods beginning on or after July 1, 2014.
Note 3: IASB tentatively decided that an entity should apply IFRS 9 for annual periods beginning on
or after January 1, 2018.
b. Significant impending changes in accounting policy that would result from adoption of New IFRSs in issue but not yet effective Except for the following, the initial application of the above New IFRSs, whenever applied, would not have any material impact on the Company’s accounting policies: 1) IFRS 9 “Financial Instruments”
Recognition and measurement of financial assets With regards to financial assets, all recognized financial assets that are within the scope of IAS 39 “Financial Instruments: Recognition and Measurement” are subsequently measured at amortized cost or fair value. Specifically, financial assets that are held within a business model whose objective is to collect the contractual cash flows, and that have contractual cash flows that are solely payments of principal and interest on the principal outstanding are generally measured at amortized cost at the end of subsequent accounting periods. All other financial assets are measured at their fair values at the end of reporting period. However, the Company may make an irrevocable election to present subsequent changes in the fair value of an equity investment (that is not held for trading) in other comprehensive income, with only dividend income generally recognized in profit or loss.
2) IFRS 13 “Fair Value Measurement”
IFRS 13 establishes a single source of guidance for fair value measurements. It defines fair value, establishes a framework for measuring fair value, and requires disclosures about fair value measurements. The disclosure requirements in IFRS 13 are more extensive than those required in the current standards. For example, quantitative and qualitative disclosures based on the three-level fair value hierarchy currently required for financial instruments only will be extended by IFRS 13 to cover all assets and liabilities within its scope.
Except for the above impact, as of the date the financial statements were authorized for issue, the Company is continuingly assessing the possible impact that the application of other standards and interpretations will have on the Company’s financial position and operating result, and will disclose the relevant impact when the assessment is complete.
4. SUMMARY OF SIGNIFICANT ACCOUNTING POLICIES The Company’s financial statements for the year ended December 31, 2013 are its first IFRS financial statements prepared in accordance with the Regulations Governing the Preparation of Financial Reports by Securities Issuers. a. Statement of compliance
The parent company only financial statements have been prepared in accordance with the Regulations Governing the Preparation of Financial Reports by Securities Issuers.
- 11 -
b. Basis of preparation The financial statements have been prepared on the historical cost basis except for financial instruments that are measured at fair values. Historical cost is generally based on the fair value of the consideration given in exchange for assets. When preparing its parent company only financial statements, the Company used equity method to account for its investment in subsidiaries and associates. In order for the amounts of the net profit for the year, other comprehensive income for the year and total equity in the parent company only financial statements to be the same with the amounts attributable to the owner of the Company in its consolidated financial statements, adjustments arising from the differences in accounting treatment between parent company only basis and consolidated basis were made to investments accounted for by equity method, share of profit or loss of subsidiaries, share of other comprehensive income of subsidiaries, and related equity items, as appropriate, in the parent company only financial statements.
c. Classification of current and non-current assets and liabilities Current assets include: 1) Assets held primarily for the purpose of trading; 2) Assets expected to be realized within twelve months after the reporting period; and 3) Cash and cash equivalents unless the asset is restricted from being exchanged or used to settle a
liability for at least twelve months after the reporting period. Current liabilities include: 1) Liabilities held primarily for the purpose of trading; 2) Liabilities due to be settled within twelve months after the reporting period, even if an agreement to
refinance, or to reschedule payments, on a long-term basis is completed after the reporting period and before the financial statements are authorized for issue; and
3) Liabilities for which the Company does not have an unconditional right to defer settlement for at
least twelve months after the reporting period. Terms of a liability that could, at the option of the counterparty, result in its settlement by the issue of equity instruments do not affect its classification.
Assets and liabilities that are not classified as current are classified as non-current.
d. Foreign currencies In preparing the Company’s financial statements, transactions in currencies other than the Company’s functional currency (foreign currencies) are recognized at the rates of exchange prevailing at the dates of the transactions. At the end of each reporting period, monetary items denominated in foreign currencies are retranslated at the rates prevailing at that date. Exchange differences on monetary items arising from settlement or translation are recognized in profit or loss in the period in which they arise.
- 12 -
Non-monetary items measured at fair value that are denominated in foreign currencies are retranslated at the rates prevailing at the date when the fair value was determined. Exchange differences arising on the retranslation of non-monetary items are included in profit or loss for the period except for exchange differences arising from the retranslation of non-monetary items in respect of which gains and losses are recognized directly in other comprehensive income, in which case, the exchange differences are also recognized directly in other comprehensive income. Non-monetary items that are measured at historical cost in a foreign currency are not retranslated. For the purposes of presenting financial statements, the assets and liabilities of the Company’s foreign operations (including of the subsidiaries, associates operations in other countries or currencies used different with the Company) are translated into New Taiwan dollars using exchange rates prevailing at the end of each reporting period. Income and expense items are translated at the average exchange rates for the period. Exchange differences arising are recognized in other comprehensive income.
e. Inventories
Inventories are stated at the lower of cost or net realizable value. Inventory write-downs are made by item, except where it may be appropriate to group similar or related items. Net realizable value is the estimated selling price of inventories less all estimated costs of completion and costs necessary to make the sale. Inventories are recorded at weighted-average cost on the balance sheet date.
f. Investment accounted for using equity method Investments in subsidiaries are accounted for by the equity method. Investment in subsidiaries Subsidiaries are the entities controlled by the Company. Under the equity method, the investment is initially recognized at cost and the carrying amount is increased or decreased to recognize the Company’s share of the profit or loss and other comprehensive income of the subsidiary after the date of acquisition. Besides, the Company also recognizes the Company’s share of the change in other equity of the subsidiary. Profits and losses from downstream transactions with a subsidiary are eliminated in full. Profits and losses from upstream with a subsidiary and sidestream transactions between subsidiaries are recognized in the Company’s financial statements only to the extent of interests in the subsidiary that are not related to the Company.
g. Property, plant, and equipment Property, plant and equipment are stated at cost, less subsequent accumulated depreciation and subsequent accumulated impairment loss. Freehold land is not depreciated. Depreciation is recognized using the straight-line method. Each significant part is depreciated separately. The estimated useful lives, residual values and depreciation method are reviewed at the end of each reporting period, with the effect of any changes in estimate accounted for on a prospective basis. Any gain or loss arising on the disposal or retirement of an item of property, plant and equipment is determined as the difference between the sales proceeds and the carrying amount of the asset and is recognized in profit or loss.
- 13 -
h. Investment properties Investment properties are properties held to earn rentals and/or for capital appreciation. Investment properties are measured initially at cost, including transaction costs. Subsequent to initial recognition, investment properties are measured at cost less accumulated depreciation and accumulated impairment loss. Depreciation is recognized using the straight-line method. Any gain or loss arising on derecognition of the property is calculated as the difference between the net disposal proceeds and the carrying amount of the asset and is included in profit or loss in the period in which the property is derecognized.
i. Other intangible assets Intangible assets with finite useful lives that are acquired separately are initially measured at cost and subsequently measured at cost less accumulated amortization and accumulated impairment loss. Amortization is recognized on a straight-line basis. The estimated useful life, residual value, and amortization method are reviewed at the end of each reporting period, with the effect of any changes in estimate accounted for on a prospective basis. The residual value of an intangible asset with a finite useful life shall be assumed to be zero unless the Company expects to dispose of the intangible asset before the end of its economic life. Intangible assets with indefinite useful lives that are acquired separately are measured at cost less accumulated impairment loss. Gains or losses arising from derecognition of an intangible asset, which are measured as the difference between the net disposal proceeds and the carrying amount of the asset, are recognized in profit or loss when the asset is derecognized.
j. Impairment of tangible and intangible assets At the end of each reporting period, the Company reviews the carrying amounts of its tangible and intangible assets, to determine whether there is any indication that those assets have suffered an impairment loss. If any such indication exists, the recoverable amount of the asset is estimated in order to determine the extent of the impairment loss. When it is not possible to estimate the recoverable amount of an individual asset, the Company estimates the recoverable amount of the cash-generating unit to which the asset belongs. Recoverable amount is the higher of fair value less costs to sell and value in use. If the recoverable amount of an asset or cash-generating unit is estimated to be less than its carrying amount, the carrying amount of the asset or cash-generating unit is reduced to its recoverable amount. When an impairment loss is subsequently reversed, the carrying amount of the asset or cash-generating unit is increased to the revised estimate of its recoverable amount, but only to the extent of the carrying amount that would have been determined had no impairment loss been recognized for the asset or cash-generating unit in prior years. A reversal of an impairment loss is recognized in profit or loss.
k. Financial instruments All regular way purchases or sales of financial assets are recognized and derecognized on a trade date basis. 1) Financial assets
a) Measurement category
Financial assets are classified into the following categories: Financial assets at fair value through profit or loss, available-for-sale financial assets, and loans and receivables.
- 14 -
i. Financial assets at fair value through profit or loss
Financial assets are classified as at fair value through profit or loss when the financial asset is held for trading. Financial assets at fair value through profit or loss are stated at fair value, with any gains or losses arising on remeasurement recognized in profit or loss. The net gain or loss recognized in profit or loss does not incorporate any dividend or interest earned on the financial asset.
ii. Available-for-sale financial assets Available-for-sale financial assets are non-derivatives that are either designated as available-for-sale or are not classified as loans and receivables or financial assets at fair value through profit or loss. Available-for-sale financial assets are measured at fair value. Changes in the carrying amount of available-for-sale monetary financial assets relating to dividends on available-for-sale equity investments are recognized in profit or loss. Other changes in the carrying amount of available-for-sale financial assets are recognized in other comprehensive income and will be reclassified to profit or loss when the investment is disposed of or is determined to be impaired. Dividends on available-for-sale equity instruments are recognized in profit or loss when the Company’s right to receive the dividends is established. Available-for-sale equity investments that do not have a quoted market price in an active market are measured at cost less any identified impairment loss at the end of each reporting period and are presented in a separate line item as financial assets carried at cost. If, in a subsequent period, the fair value of the financial assets can be reliably measured, the financial assets are remeasured at fair value. The difference between carrying amount and fair value is recognized in other comprehensive income on financial assets. Any impairment losses are recognized in profit and loss.
iii. Loans and receivables Loans and receivables (including cash and cash equivalent, note receivables, trade receivables, other receivables, refundable deposits and other financial assets are measured at amortized cost using the effective interest method, less any impairment, except for short-term receivables when the effect of discounting is immaterial. Cash equivalent includes time deposits with original maturities within three months from the date of acquisition, highly liquid, readily convertible to a known amount of cash and be subject to an insignificant risk of changes in value. These cash equivalents are held for the purpose of meeting short-term cash commitments.
b) Impairment of financial assets Financial assets, other than those at fair value through profit or loss, are assessed for indicators of impairment at the end of each reporting period. Financial assets are considered to be impaired when there is objective evidence that, as a result of one or more events that occurred after the initial recognition of the financial asset, the estimated future cash flows of the investment have been affected.
- 15 -
For financial assets carried at amortized cost, such as cash and cash equivalent, note receivables, trade receivables, other receivables, refundable deposits and other financial assets, assets are assessed for impairment on a collective basis even if they were assessed not to be impaired individually. Objective evidence of impairment for a portfolio of receivables could include the Company’s past experience of collecting payments, an increase in the number of delayed payments in the portfolio past the average credit period of 90-120 days, as well as observable changes in national or local economic conditions that correlate with default on receivables. For financial assets carried at amortized cost, the amount of the impairment loss recognized is the difference between the asset’s carrying amount and the present value of estimated future cash flows, discounted at the financial asset’s original effective interest rate. For financial assets measured at amortized cost, if, in a subsequent period, the amount of the impairment loss decreases and the decrease can be related objectively to an event occurring after the impairment was recognized, the previously recognized impairment loss is reversed through profit or loss to the extent that the carrying amount of the investment at the date the impairment is reversed does not exceed what the amortized cost would have been had the impairment not been recognized. For available-for-sale equity investments, a significant or prolonged decline in the fair value of the security below its cost is considered to be objective evidence of impairment. When an available-for-sale financial asset is considered to be impaired, cumulative gains or losses previously recognized in other comprehensive income are reclassified to profit or loss in the period. In respect of available-for-sale equity securities, impairment loss previously recognized in profit or loss are not reversed through profit or loss. Any increase in fair value subsequent to an impairment loss is recognized in other comprehensive income. For financial assets that are carried at cost, the amount of the impairment loss is measured as the difference between the asset’s carrying amount and the present value of the estimated future cash flows discounted at the current market rate of return for a similar financial asset. Such impairment loss will not be reversed in subsequent periods. The carrying amount of the financial asset is reduced by the impairment loss directly for all financial assets with the exception of note receivables, trade receivables and other receivables, where the carrying amount is reduced through the use of an allowance account. When a trade receivable and other receivables are considered uncollectible, it is written off against the allowance account. Subsequent recoveries of amounts previously written off are credited against the allowance account. Changes in the carrying amount of the allowance account are recognized in profit or loss except for uncollectible note receivables, trade receivables and other receivables that are written off against the allowance account.
c) Derecognition of financial assets The Company derecognizes a financial asset only when the contractual rights to the cash flows from the asset expire, or when it transfers the financial asset and substantially all the risks and rewards of ownership of the asset to another party. On derecognition of a financial asset in its entirety, the difference between the asset’s carrying amount and the sum of the consideration received and receivable and the cumulative gain or loss that had been recognized in other comprehensive income is recognized in profit or loss.
- 16 -
2) Financial liabilities
a) Subsequent measurement
Except the financial liabilities at fair value through profit or loss, all the financial liabilities are measured at amortized cost using the effective interest method.
b) Derecognition of financial liabilities
The difference between the carrying amount of the financial liability derecognized and the consideration paid, including any non-cash assets transferred or liabilities assumed, is recognized in profit or loss.
3) Derivative financial instruments
Derivatives are initially recognized at fair value at the date the derivative contracts are entered into and are subsequently remeasured to their fair value at the end of each reporting period. The resulting gain or loss is recognized in profit or loss immediately. When the fair value of derivative financial instruments is positive, the derivative is recognized as a financial asset; when the fair value of derivative financial instruments is negative, the derivative is recognized as a financial liability. Derivatives embedded in non-derivative host contracts are treated as separate derivatives when they meet the definition of a derivative, their risks and characteristics are not closely related to those of the host contracts and the contracts are not measured at fair value through profit or loss.
l. Provisions
Provisions for the expected cost of warranty obligations are recognized at the date of sale of the relevant products, at the best estimate of the expenditure required to settle the Company’s obligation by the management of the Company.
m. Revenue recognition Revenue is measured at the fair value of the consideration received or receivable. 1) Sale of goods
Revenue from the sale of goods is recognized when the goods are delivered and titles have passed, at which time all the following conditions are satisfied: a) The Company has transferred to the buyer the significant risks and rewards of ownership of the
goods; b) The Company retains neither continuing managerial involvement to the degree usually
associated with ownership nor effective control over the goods sold; c) The amount of revenue can be measured reliably; d) It is probable that the economic benefits associated with the transaction will flow to the
Company; and e) The costs incurred or to be incurred in respect of the transaction can be measured reliably. The Company does not recognize sales revenue on materials delivered to subcontractors because this delivery does not involve a transfer of risks and rewards of materials ownership.
- 17 -
2) Rendering of services
Technical service revenue is recognized based on contractual sales volume and price. 3) Dividend and interest income
Dividend income from investments is recognized when the shareholder’s right to receive payment has been established provided that it is probable that the economic benefits will flow to the Company and the amount of income can be measured reliably. Interest income from a financial asset is recognized when it is probable that the economic benefits will flow to the Company and the amount of income can be measured reliably. Interest income is accrued on a time basis, by reference to the principal outstanding and at the effective interest rate applicable.
n. Leasing
1) The Company as lessor
Rental income from operating leases is recognized on a straight-line basis over the term of the relevant lease.
2) The Company as lessee Operating lease payments are recognized as an expense on a straight-line basis over the lease term.
o. Retirement benefit costs
Payments to defined contribution retirement benefit plans are recognized as an expense when employees have rendered service entitling them to the contributions. For defined benefit retirement benefit plans, the cost of providing benefits is determined using the Projected Unit Credit Method. All actuarial gains and losses on the defined benefit obligation are recognized immediately in other comprehensive income. Past service cost is recognized immediately to the extent that the benefits are already vested, and otherwise is amortized on a straight-line basis over the average period until the benefits become vested. The retirement benefit obligation recognized in the consolidated balance sheets represents the present value of the defined benefit obligation as adjusted for unrecognized past service cost, and as reduced by the fair value of plan assets. Any asset resulting from this calculation is limited to the unrecognized past service cost, plus the present value of available refunds and reductions in future contributions to the plan. Curtailment or settlement gains or losses on the defined benefit plan are recognized when the curtailment or settlement occurs.
p. Share-based payment arrangements Restricted shares for employees are measured at fair value on the date of grant, with a corresponding increase in capital surplus - restricted shares for employees. If restricted shares for employees are granted for consideration, and should be returned, they are recognized as payables. Dividends paid to employees on the restricted shares that do not need to be returned if employees resign in the vesting period, are recognized as expenses when the dividends are declared with a corresponding adjustment in capital surplus - restricted shares for employees.
- 18 -
At the end of each reporting period, the Company revises its estimate of the number of equity instruments expected to vest. The impact of the revision of the original estimates is recognized in profit or loss such that the cumulative expense reflects the revised estimate, with a corresponding adjustment to the capital surplus - restricted shares for employees.
q. Taxation Income tax expense represents the sum of the tax currently payable and deferred tax. 1) Current tax
According to the Income Tax Law, an additional tax at 10% of unappropriated earnings is provided for as income tax in the year the shareholders approve to retain the earnings. Adjustments of prior years’ tax liabilities are added to or deducted from the current year’s tax provision.
2) Deferred tax
Deferred tax is recognized on temporary differences between the carrying amounts of assets and liabilities in the financial statements and the corresponding tax bases used in the computation of taxable profit. Deferred tax liabilities are generally recognized for all taxable temporary differences. Deferred tax assets are generally recognized for all deductible temporary differences and unused loss carry forward to the extent that it is probable that taxable profits will be available against which those deductible temporary differences can be utilized. Deferred tax liabilities are recognized for taxable temporary differences associated with investments in subsidiaries, except where the Company is able to control the reversal of the temporary difference and it is probable that the temporary difference will not reverse in the foreseeable future. Deferred tax assets arising from deductible temporary differences associated with such investments and interests are only recognized to the extent that it is probable that there will be sufficient taxable profits against which to utilize the benefits of the temporary differences and they are expected to reverse in the foreseeable future. The carrying amount of deferred tax assets is reviewed at the end of each reporting period and reduced to the extent that it is no longer probable that sufficient taxable profits will be available to allow all or part of the asset to be recovered. A previously unrecognized deferred tax asset is also reviewed at the end of each reporting period and recognized to the to the extent that it has become probable that future taxable profit will allow the deferred tax asset to be recovered. Deferred tax liabilities and assets are measured at the tax rates that are expected to apply in the period in which the liability is settled or the asset realized, based on tax rates (and tax laws) that have been enacted or substantively enacted by the end of the reporting period. The measurement of deferred tax liabilities and assets reflects the tax consequences that would follow from the manner in which the Company expects, at the end of the reporting period, to recover or settle the carrying amount of its assets and liabilities.
5. CRITICAL ACCOUNTING JUDGMENTS AND KEY SOURCES OF ESTIMATION
UNCERTAINTY In the application of the Company’s accounting policies, management is required to make judgments, estimates and assumptions about the carrying amounts of assets and liabilities that are not readily apparent from other sources. The estimates and associated assumptions are based on historical experience and other factors that are considered relevant. Actual results may differ from these estimates.
- 19 -
The estimates and underlying assumptions are reviewed on an ongoing basis. Revisions to accounting estimates are recognized in the period in which the estimate is revised if the revision affects only that period or in the period of the revision and future periods if the revision affects both current and future periods. a. Estimated impairment of note receivable and trade receivables
Objective evidence of impairment for a portfolio of receivables could include the Company’s past experience of collecting payments, an increase in the number of delayed payments in the portfolio past the average credit period of 30-120 days, as well as observable changes in national or local economic conditions that correlate with default on receivables, and other situation.
b. Write-down of inventory
Net realizable value of inventory is the estimated selling price in the ordinary course of business less the estimated costs of completion and the estimated costs necessary to make the sale. The estimation of net realizable value was based on current market conditions and the historical experience of selling products of a similar nature. Changes in market conditions may have a material impact on the estimation of net realizable value.
c. Provisions The Company estimates the amount of provision for expected cost of warranty per month based on the number of units sold, the rate of return of units for maintenance after selling and the warranty expense in the past.
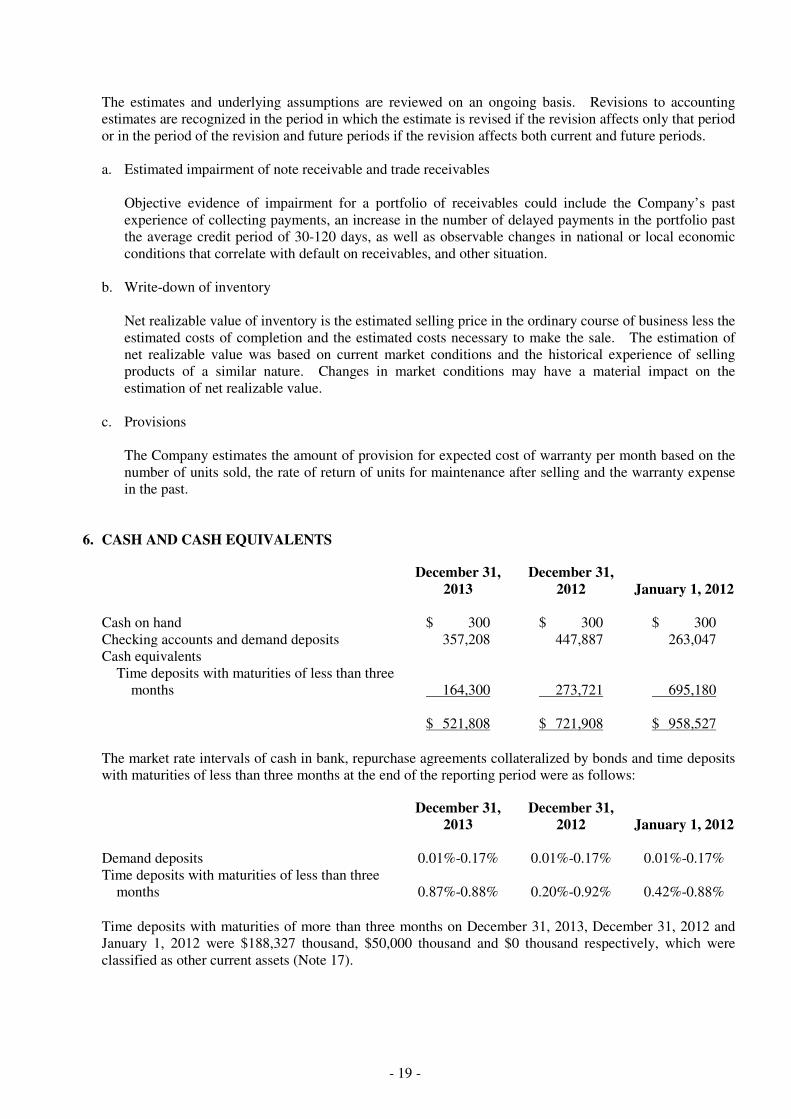
6. CASH AND CASH EQUIVALENTS
December 31,
2013 December 31,
2012 January 1, 2012 Cash on hand $ 300 $ 300 $ 300 Checking accounts and demand deposits 357,208 447,887 263,047 Cash equivalents
Time deposits with maturities of less than three months 164,300 273,721 695,180
$ 521,808 $ 721,908 $ 958,527
The market rate intervals of cash in bank, repurchase agreements collateralized by bonds and time deposits with maturities of less than three months at the end of the reporting period were as follows:
December 31,
2013 December 31,
2012 January 1, 2012 Demand deposits 0.01%-0.17% 0.01%-0.17% 0.01%-0.17% Time deposits with maturities of less than three
months
0.87%-0.88% 0.20%-0.92% 0.42%-0.88%
Time deposits with maturities of more than three months on December 31, 2013, December 31, 2012 and January 1, 2012 were $188,327 thousand, $50,000 thousand and $0 thousand respectively, which were classified as other current assets (Note 17).
- 20 -
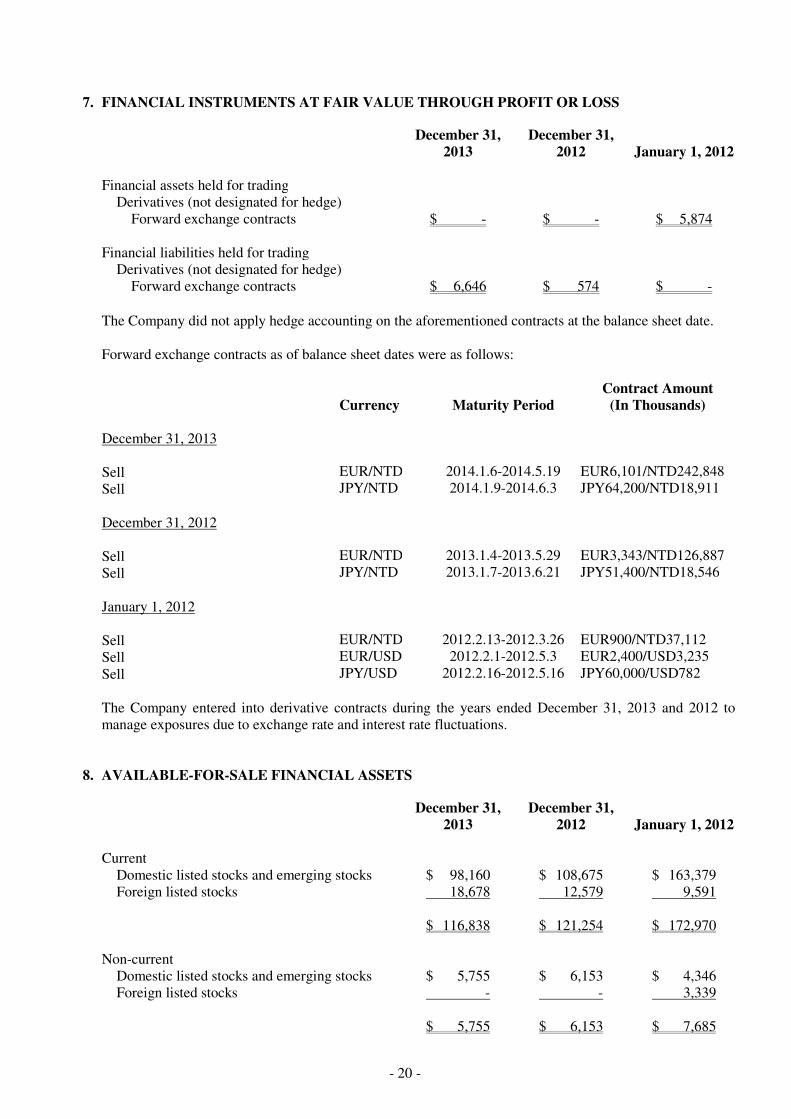
7. FINANCIAL INSTRUMENTS AT FAIR VALUE THROUGH PROFIT OR LOSS
December 31,
2013 December 31,
2012 January 1, 2012 Financial assets held for trading
Derivatives (not designated for hedge) Forward exchange contracts $ - $ - $ 5,874
Financial liabilities held for trading
Derivatives (not designated for hedge) Forward exchange contracts $ 6,646 $ 574 $ -
The Company did not apply hedge accounting on the aforementioned contracts at the balance sheet date. Forward exchange contracts as of balance sheet dates were as follows:
Currency Maturity Period Contract Amount
(In Thousands)
December 31, 2013
Sell EUR/NTD 2014.1.6-2014.5.19 EUR6,101/NTD242,848
Sell JPY/NTD 2014.1.9-2014.6.3 JPY64,200/NTD18,911
December 31, 2012
Sell EUR/NTD 2013.1.4-2013.5.29 EUR3,343/NTD126,887
Sell JPY/NTD 2013.1.7-2013.6.21 JPY51,400/NTD18,546
January 1, 2012
Sell EUR/NTD 2012.2.13-2012.3.26 EUR900/NTD37,112
Sell EUR/USD 2012.2.1-2012.5.3 EUR2,400/USD3,235
Sell JPY/USD 2012.2.16-2012.5.16 JPY60,000/USD782
The Company entered into derivative contracts during the years ended December 31, 2013 and 2012 to manage exposures due to exchange rate and interest rate fluctuations.
8. AVAILABLE-FOR-SALE FINANCIAL ASSETS
December 31,
2013 December 31,
2012 January 1, 2012 Current
Domestic listed stocks and emerging stocks $ 98,160 $ 108,675 $ 163,379 Foreign listed stocks 18,678 12,579 9,591
$ 116,838 $ 121,254 $ 172,970 Non-current
Domestic listed stocks and emerging stocks $ 5,755 $ 6,153 $ 4,346 Foreign listed stocks - - 3,339 $ 5,755 $ 6,153 $ 7,685
- 21 -
In February 2012, Techmosa International Inc. (Techmosa) was merged into WT Microelectronics Co., Ltd. (WT Microelectronics); therefore, the stock of Techmosa held by the Group has been converted into stock of WT Microelectronics. The Company has recognized gain on merger included in gain on sale of investment in the amount of $28,722 thousand for the year ended December 31, 2012.
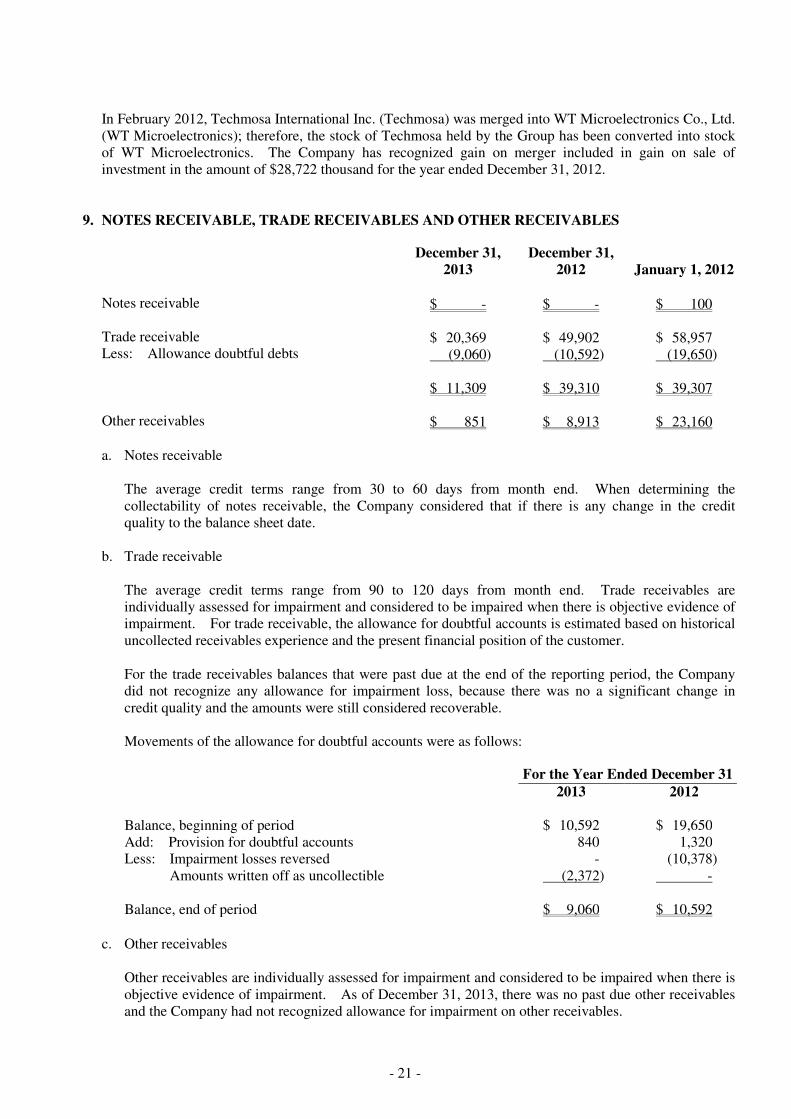
9. NOTES RECEIVABLE, TRADE RECEIVABLES AND OTHER RECEIVABLES
December 31,
2013 December 31,
2012 January 1, 2012 Notes receivable $ - $ - $ 100 Trade receivable $ 20,369 $ 49,902 $ 58,957 Less: Allowance doubtful debts (9,060) (10,592) (19,650) $ 11,309 $ 39,310 $ 39,307 Other receivables $ 851 $ 8,913 $ 23,160
a. Notes receivable
The average credit terms range from 30 to 60 days from month end. When determining the collectability of notes receivable, the Company considered that if there is any change in the credit quality to the balance sheet date.
b. Trade receivable The average credit terms range from 90 to 120 days from month end. Trade receivables are individually assessed for impairment and considered to be impaired when there is objective evidence of impairment. For trade receivable, the allowance for doubtful accounts is estimated based on historical uncollected receivables experience and the present financial position of the customer. For the trade receivables balances that were past due at the end of the reporting period, the Company did not recognize any allowance for impairment loss, because there was no a significant change in credit quality and the amounts were still considered recoverable. Movements of the allowance for doubtful accounts were as follows: For the Year Ended December 31 2013 2012 Balance, beginning of period $ 10,592 $ 19,650 Add: Provision for doubtful accounts 840 1,320 Less: Impairment losses reversed - (10,378) Amounts written off as uncollectible (2,372) - Balance, end of period $ 9,060 $ 10,592
c. Other receivables
Other receivables are individually assessed for impairment and considered to be impaired when there is objective evidence of impairment. As of December 31, 2013, there was no past due other receivables and the Company had not recognized allowance for impairment on other receivables.
- 22 -
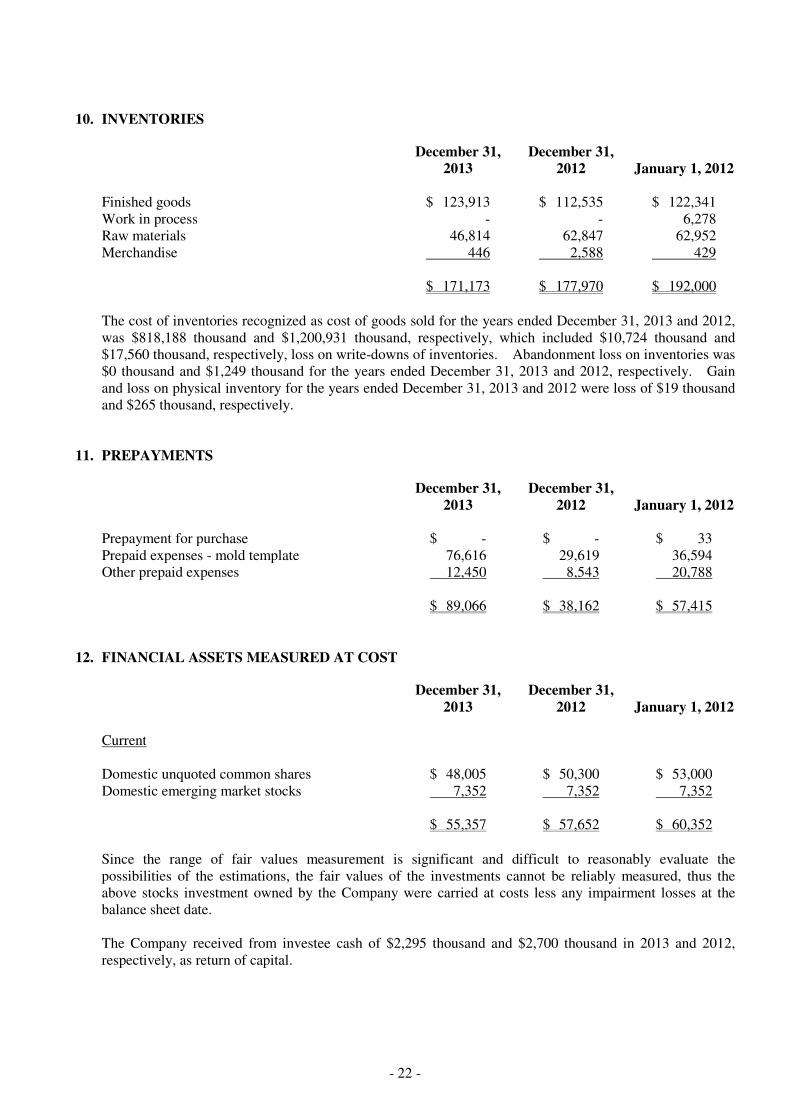
10. INVENTORIES
December 31,
2013 December 31,
2012 January 1, 2012 Finished goods $ 123,913 $ 112,535 $ 122,341 Work in process - - 6,278 Raw materials 46,814 62,847 62,952 Merchandise 446 2,588 429 $ 171,173 $ 177,970 $ 192,000
The cost of inventories recognized as cost of goods sold for the years ended December 31, 2013 and 2012, was $818,188 thousand and $1,200,931 thousand, respectively, which included $10,724 thousand and $17,560 thousand, respectively, loss on write-downs of inventories. Abandonment loss on inventories was $0 thousand and $1,249 thousand for the years ended December 31, 2013 and 2012, respectively. Gain and loss on physical inventory for the years ended December 31, 2013 and 2012 were loss of $19 thousand and $265 thousand, respectively.
11. PREPAYMENTS
December 31,
2013 December 31,
2012 January 1, 2012 Prepayment for purchase $ - $ - $ 33 Prepaid expenses - mold template 76,616 29,619 36,594 Other prepaid expenses 12,450 8,543 20,788 $ 89,066 $ 38,162 $ 57,415
12. FINANCIAL ASSETS MEASURED AT COST
December 31,
2013 December 31,
2012 January 1, 2012 Current Domestic unquoted common shares $ 48,005 $ 50,300 $ 53,000 Domestic emerging market stocks 7,352 7,352 7,352 $ 55,357 $ 57,652 $ 60,352
Since the range of fair values measurement is significant and difficult to reasonably evaluate the possibilities of the estimations, the fair values of the investments cannot be reliably measured, thus the above stocks investment owned by the Company were carried at costs less any impairment losses at the balance sheet date. The Company received from investee cash of $2,295 thousand and $2,700 thousand in 2013 and 2012, respectively, as return of capital.
- 23 -
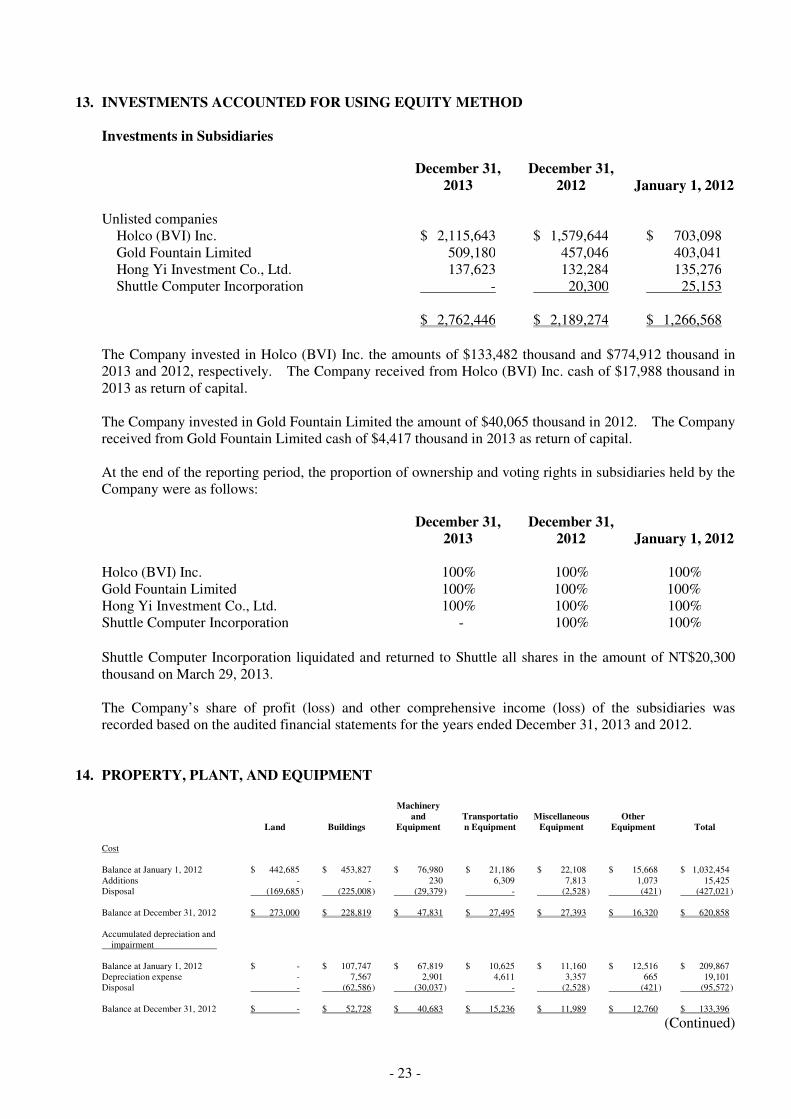
13. INVESTMENTS ACCOUNTED FOR USING EQUITY METHOD Investments in Subsidiaries
December 31,
2013 December 31,
2012 January 1, 2012 Unlisted companies
Holco (BVI) Inc. $ 2,115,643 $ 1,579,644 $ 703,098 Gold Fountain Limited 509,180 457,046 403,041 Hong Yi Investment Co., Ltd. 137,623 132,284 135,276 Shuttle Computer Incorporation - 20,300 25,153
$ 2,762,446 $ 2,189,274 $ 1,266,568
The Company invested in Holco (BVI) Inc. the amounts of $133,482 thousand and $774,912 thousand in 2013 and 2012, respectively. The Company received from Holco (BVI) Inc. cash of $17,988 thousand in 2013 as return of capital. The Company invested in Gold Fountain Limited the amount of $40,065 thousand in 2012. The Company received from Gold Fountain Limited cash of $4,417 thousand in 2013 as return of capital. At the end of the reporting period, the proportion of ownership and voting rights in subsidiaries held by the Company were as follows:
December 31,
2013 December 31,
2012 January 1, 2012 Holco (BVI) Inc. 100% 100% 100% Gold Fountain Limited 100% 100% 100% Hong Yi Investment Co., Ltd. 100% 100% 100% Shuttle Computer Incorporation - 100% 100%
Shuttle Computer Incorporation liquidated and returned to Shuttle all shares in the amount of NT$20,300 thousand on March 29, 2013. The Company’s share of profit (loss) and other comprehensive income (loss) of the subsidiaries was recorded based on the audited financial statements for the years ended December 31, 2013 and 2012.
14. PROPERTY, PLANT, AND EQUIPMENT
Land Buildings
Machinery and
Equipment Transportation Equipment
Miscellaneous Equipment
Other Equipment Total
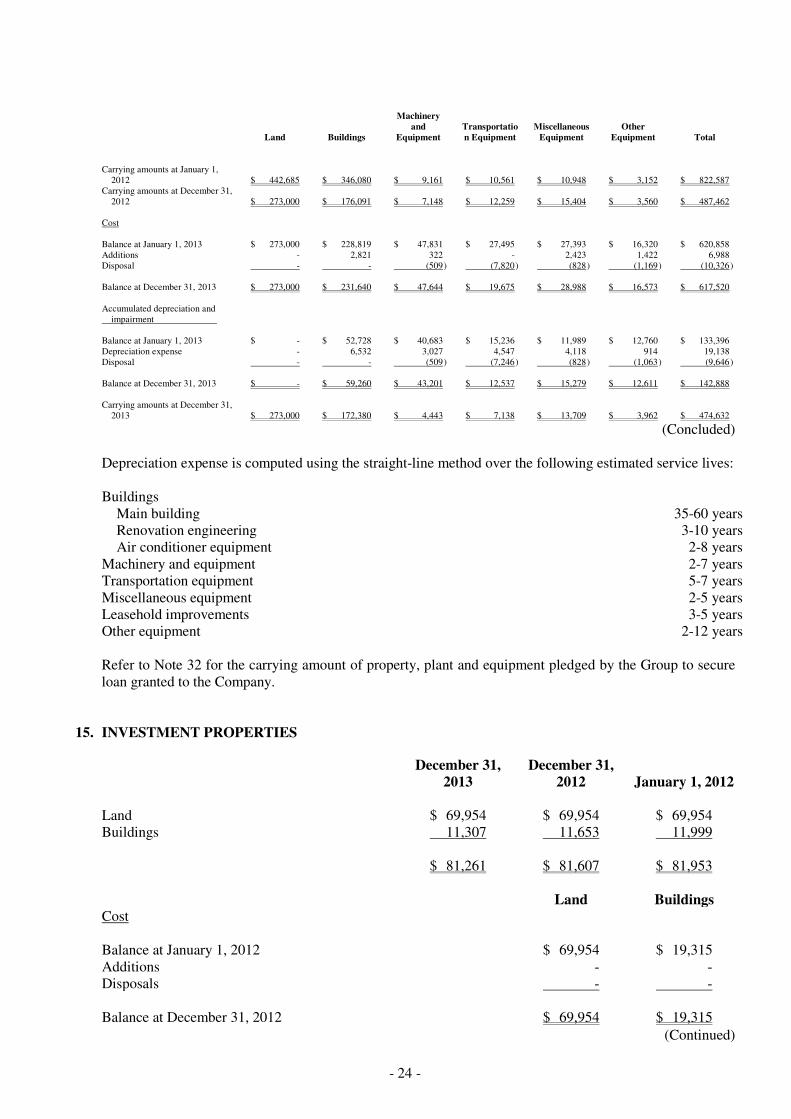
Cost Balance at January 1, 2012 $ 442,685 $ 453,827 $ 76,980 $ 21,186 $ 22,108 $ 15,668 $ 1,032,454 Additions - - 230 6,309 7,813 1,073 15,425 Disposal (169,685 ) (225,008 ) (29,379 ) - (2,528 ) (421 ) (427,021 ) Balance at December 31, 2012 $ 273,000 $ 228,819 $ 47,831 $ 27,495 $ 27,393 $ 16,320 $ 620,858
Accumulated depreciation and impairment Balance at January 1, 2012 $ - $ 107,747 $ 67,819 $ 10,625 $ 11,160 $ 12,516 $ 209,867 Depreciation expense - 7,567 2,901 4,611 3,357 665 19,101 Disposal - (62,586 ) (30,037 ) - (2,528 ) (421 ) (95,572 ) Balance at December 31, 2012 $ - $ 52,728 $ 40,683 $ 15,236 $ 11,989 $ 12,760 $ 133,396
(Continued)
- 24 -
Land Buildings
Machinery and
Equipment Transportation Equipment
Miscellaneous Equipment
Other Equipment Total
Carrying amounts at January 1,
2012 $ 442,685 $ 346,080 $ 9,161 $ 10,561 $ 10,948 $ 3,152 $ 822,587 Carrying amounts at December 31,
2012 $ 273,000 $ 176,091 $ 7,148 $ 12,259 $ 15,404 $ 3,560 $ 487,462 Cost Balance at January 1, 2013 $ 273,000 $ 228,819 $ 47,831 $ 27,495 $ 27,393 $ 16,320 $ 620,858 Additions - 2,821 322 - 2,423 1,422 6,988 Disposal - - (509 ) (7,820 ) (828 ) (1,169 ) (10,326 ) Balance at December 31, 2013 $ 273,000 $ 231,640 $ 47,644 $ 19,675 $ 28,988 $ 16,573 $ 617,520 Accumulated depreciation and impairment Balance at January 1, 2013 $ - $ 52,728 $ 40,683 $ 15,236 $ 11,989 $ 12,760 $ 133,396 Depreciation expense - 6,532 3,027 4,547 4,118 914 19,138 Disposal - - (509 ) (7,246 ) (828 ) (1,063 ) (9,646 ) Balance at December 31, 2013 $ - $ 59,260 $ 43,201 $ 12,537 $ 15,279 $ 12,611 $ 142,888 Carrying amounts at December 31,
2013 $ 273,000 $ 172,380 $ 4,443 $ 7,138 $ 13,709 $ 3,962 $ 474,632
(Concluded)
Depreciation expense is computed using the straight-line method over the following estimated service lives: Buildings
Main building 35-60 years Renovation engineering 3-10 years Air conditioner equipment 2-8 years
Machinery and equipment 2-7 years Transportation equipment 5-7 years Miscellaneous equipment 2-5 years Leasehold improvements 3-5 years Other equipment 2-12 years Refer to Note 32 for the carrying amount of property, plant and equipment pledged by the Group to secure loan granted to the Company.
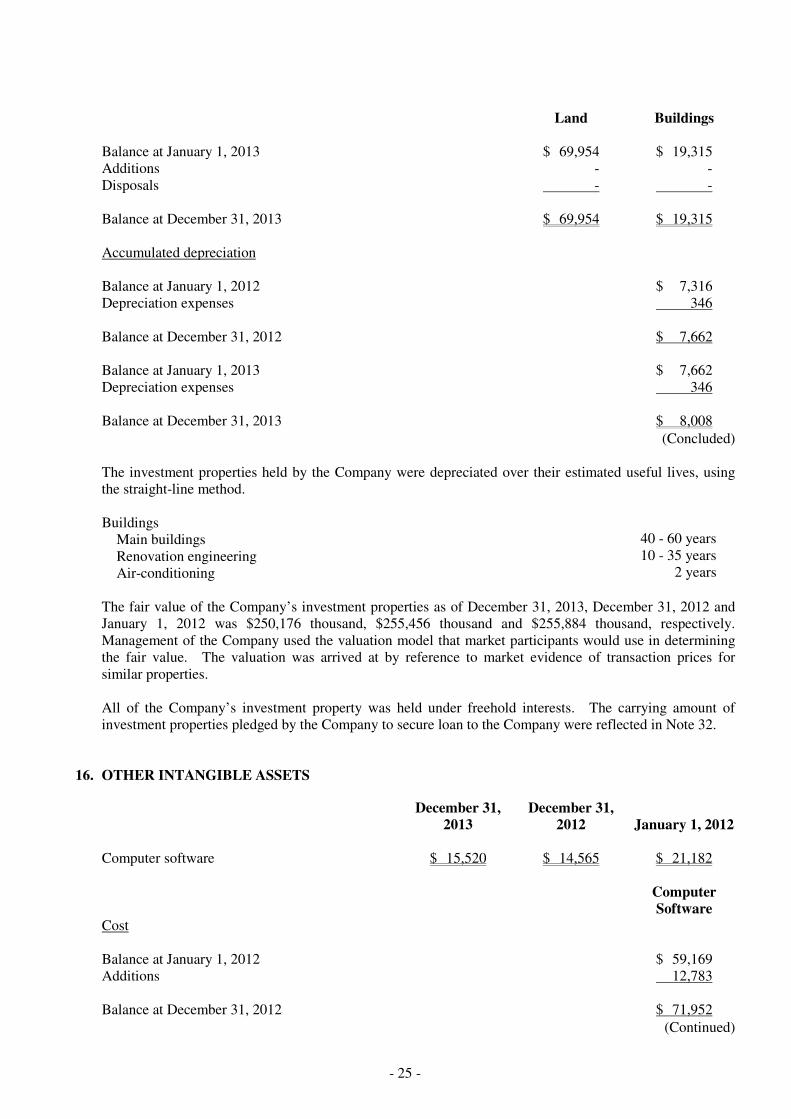
15. INVESTMENT PROPERTIES
December 31,
2013 December 31,
2012 January 1, 2012 Land $ 69,954 $ 69,954 $ 69,954 Buildings 11,307 11,653 11,999 $ 81,261 $ 81,607 $ 81,953
Land Buildings Cost Balance at January 1, 2012 $ 69,954 $ 19,315 Additions - - Disposals - - Balance at December 31, 2012 $ 69,954 $ 19,315
(Continued)
- 25 -
Land Buildings Balance at January 1, 2013 $ 69,954 $ 19,315 Additions - - Disposals - - Balance at December 31, 2013 $ 69,954 $ 19,315 Accumulated depreciation Balance at January 1, 2012 $ 7,316 Depreciation expenses 346 Balance at December 31, 2012 $ 7,662 Balance at January 1, 2013 $ 7,662 Depreciation expenses 346 Balance at December 31, 2013 $ 8,008
(Concluded)
The investment properties held by the Company were depreciated over their estimated useful lives, using the straight-line method. Buildings
Main buildings 40 - 60 years
Renovation engineering 10 - 35 years
Air-conditioning 2 years
The fair value of the Company’s investment properties as of December 31, 2013, December 31, 2012 and January 1, 2012 was $250,176 thousand, $255,456 thousand and $255,884 thousand, respectively. Management of the Company used the valuation model that market participants would use in determining the fair value. The valuation was arrived at by reference to market evidence of transaction prices for similar properties.
All of the Company’s investment property was held under freehold interests. The carrying amount of investment properties pledged by the Company to secure loan to the Company were reflected in Note 32.
16. OTHER INTANGIBLE ASSETS
December 31,
2013 December 31,
2012 January 1, 2012 Computer software $ 15,520 $ 14,565 $ 21,182
Computer Software
Cost Balance at January 1, 2012 $ 59,169 Additions 12,783 Balance at December 31, 2012 $ 71,952
(Continued)
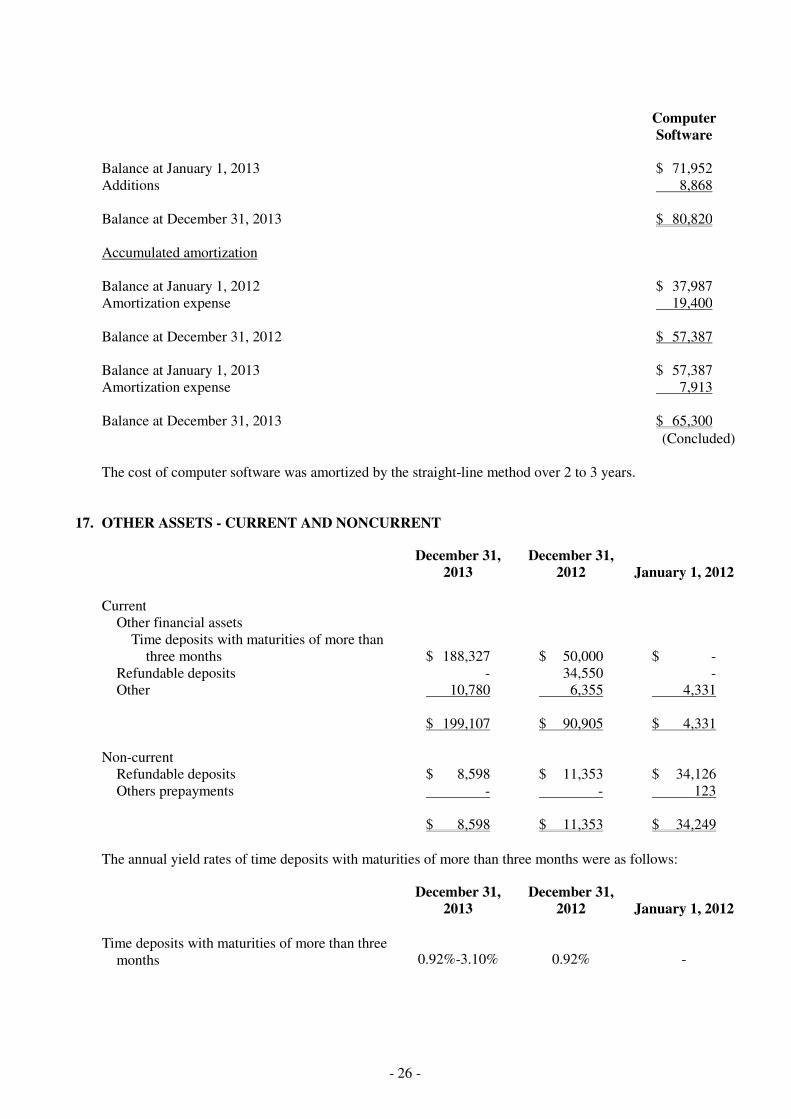
- 26 -
Computer Software
Balance at January 1, 2013 $ 71,952 Additions 8,868 Balance at December 31, 2013 $ 80,820 Accumulated amortization Balance at January 1, 2012 $ 37,987 Amortization expense 19,400 Balance at December 31, 2012 $ 57,387 Balance at January 1, 2013 $ 57,387 Amortization expense 7,913 Balance at December 31, 2013 $ 65,300
(Concluded)
The cost of computer software was amortized by the straight-line method over 2 to 3 years.
17. OTHER ASSETS - CURRENT AND NONCURRENT
December 31,
2013 December 31,
2012 January 1, 2012 Current
Other financial assets Time deposits with maturities of more than
three months $ 188,327 $ 50,000 $ - Refundable deposits - 34,550 - Other 10,780 6,355 4,331
$ 199,107 $ 90,905 $ 4,331 Non-current
Refundable deposits $ 8,598 $ 11,353 $ 34,126 Others prepayments - - 123 $ 8,598 $ 11,353 $ 34,249
The annual yield rates of time deposits with maturities of more than three months were as follows:
December 31,
2013 December 31,
2012 January 1, 2012
Time deposits with maturities of more than three months 0.92%-3.10% 0.92% -
- 27 -
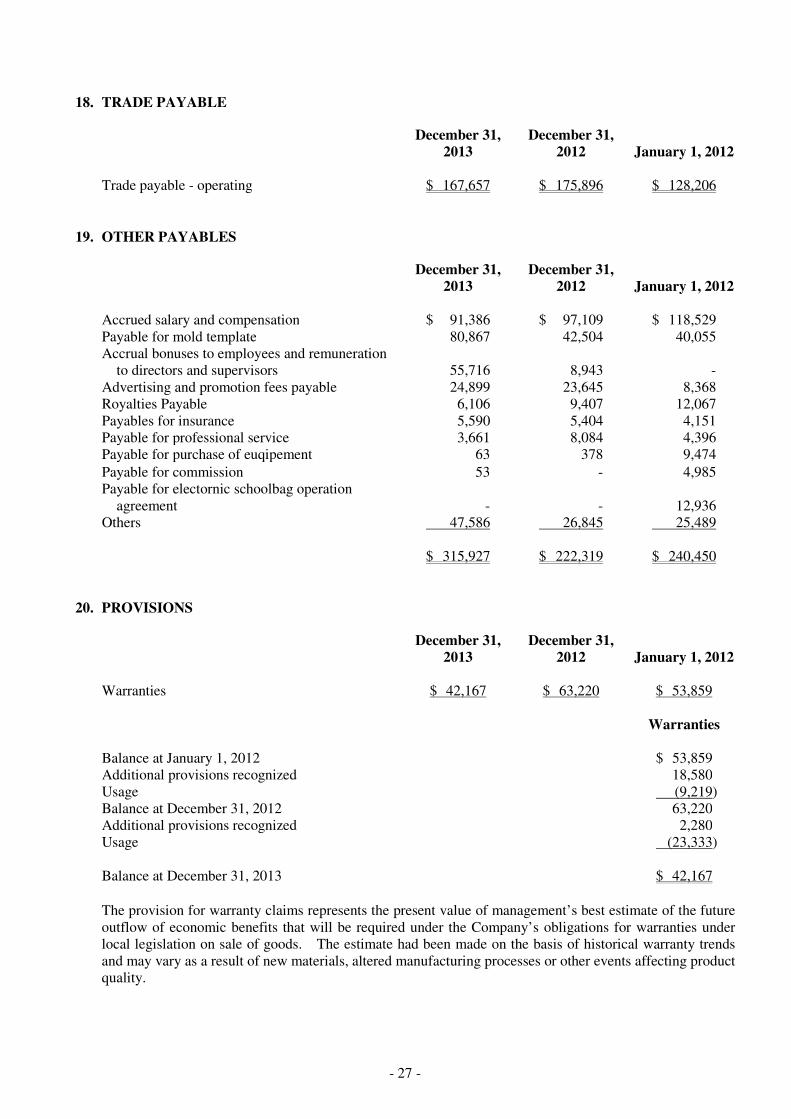
18. TRADE PAYABLE
December 31,
2013 December 31,
2012 January 1, 2012 Trade payable - operating $ 167,657 $ 175,896 $ 128,206
19. OTHER PAYABLES
December 31,
2013 December 31,
2012 January 1, 2012 Accrued salary and compensation $ 91,386 $ 97,109 $ 118,529 Payable for mold template 80,867 42,504 40,055 Accrual bonuses to employees and remuneration
to directors and supervisors 55,716 8,943 - Advertising and promotion fees payable 24,899 23,645 8,368 Royalties Payable 6,106 9,407 12,067 Payables for insurance 5,590 5,404 4,151 Payable for professional service 3,661 8,084 4,396 Payable for purchase of euqipement 63 378 9,474
Payable for commission 53 - 4,985 Payable for electornic schoolbag operation
agreement - - 12,936 Others 47,586 26,845 25,489 $ 315,927 $ 222,319 $ 240,450
20. PROVISIONS
December 31,
2013 December 31,
2012 January 1, 2012 Warranties $ 42,167 $ 63,220 $ 53,859
Warranties Balance at January 1, 2012 $ 53,859 Additional provisions recognized 18,580 Usage (9,219) Balance at December 31, 2012 63,220 Additional provisions recognized 2,280 Usage (23,333) Balance at December 31, 2013 $ 42,167
The provision for warranty claims represents the present value of management’s best estimate of the future outflow of economic benefits that will be required under the Company’s obligations for warranties under local legislation on sale of goods. The estimate had been made on the basis of historical warranty trends and may vary as a result of new materials, altered manufacturing processes or other events affecting product quality.
- 28 -
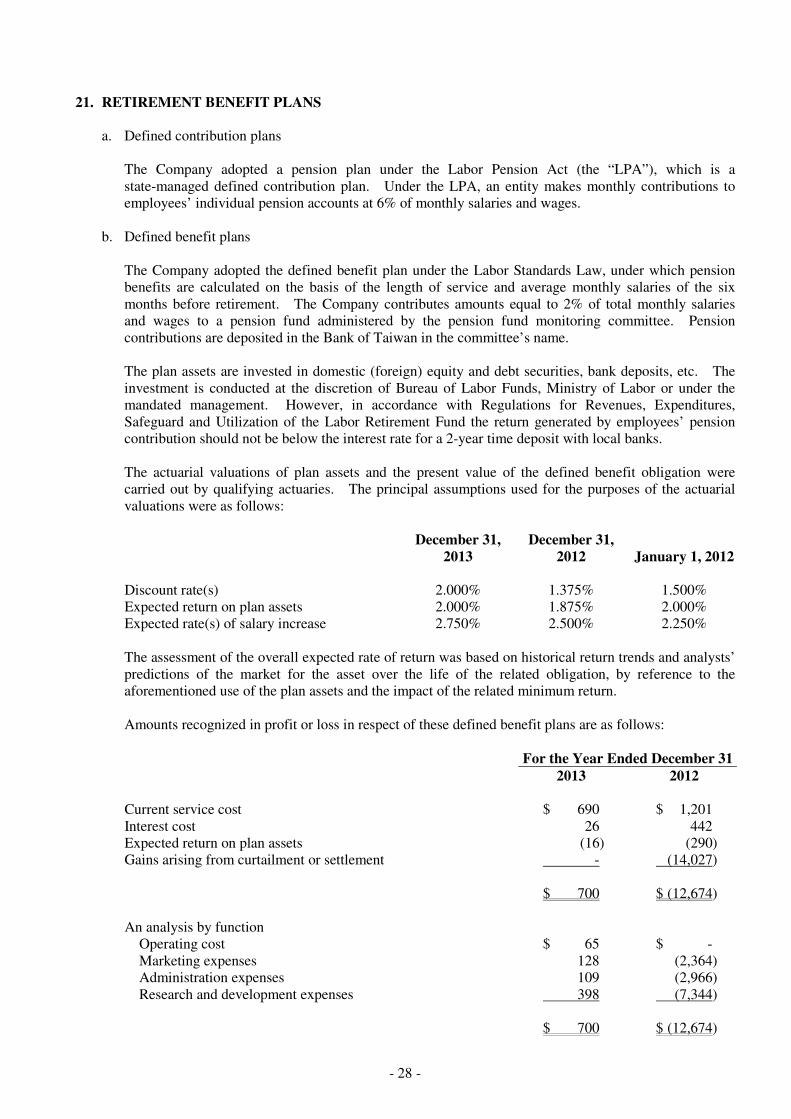
21. RETIREMENT BENEFIT PLANS a. Defined contribution plans
The Company adopted a pension plan under the Labor Pension Act (the “LPA”), which is a state-managed defined contribution plan. Under the LPA, an entity makes monthly contributions to employees’ individual pension accounts at 6% of monthly salaries and wages.
b. Defined benefit plans
The Company adopted the defined benefit plan under the Labor Standards Law, under which pension benefits are calculated on the basis of the length of service and average monthly salaries of the six months before retirement. The Company contributes amounts equal to 2% of total monthly salaries and wages to a pension fund administered by the pension fund monitoring committee. Pension contributions are deposited in the Bank of Taiwan in the committee’s name. The plan assets are invested in domestic (foreign) equity and debt securities, bank deposits, etc. The investment is conducted at the discretion of Bureau of Labor Funds, Ministry of Labor or under the mandated management. However, in accordance with Regulations for Revenues, Expenditures, Safeguard and Utilization of the Labor Retirement Fund the return generated by employees’ pension contribution should not be below the interest rate for a 2-year time deposit with local banks. The actuarial valuations of plan assets and the present value of the defined benefit obligation were carried out by qualifying actuaries. The principal assumptions used for the purposes of the actuarial valuations were as follows:
December 31,
2013 December 31,
2012 January 1, 2012 Discount rate(s) 2.000% 1.375% 1.500% Expected return on plan assets 2.000% 1.875% 2.000% Expected rate(s) of salary increase 2.750% 2.500% 2.250% The assessment of the overall expected rate of return was based on historical return trends and analysts’ predictions of the market for the asset over the life of the related obligation, by reference to the aforementioned use of the plan assets and the impact of the related minimum return. Amounts recognized in profit or loss in respect of these defined benefit plans are as follows: For the Year Ended December 31 2013 2012 Current service cost $ 690 $ 1,201 Interest cost 26 442 Expected return on plan assets (16) (290) Gains arising from curtailment or settlement - (14,027) $ 700 $ (12,674) An analysis by function
Operating cost $ 65 $ - Marketing expenses 128 (2,364) Administration expenses 109 (2,966) Research and development expenses 398 (7,344)
$ 700 $ (12,674)
- 29 -
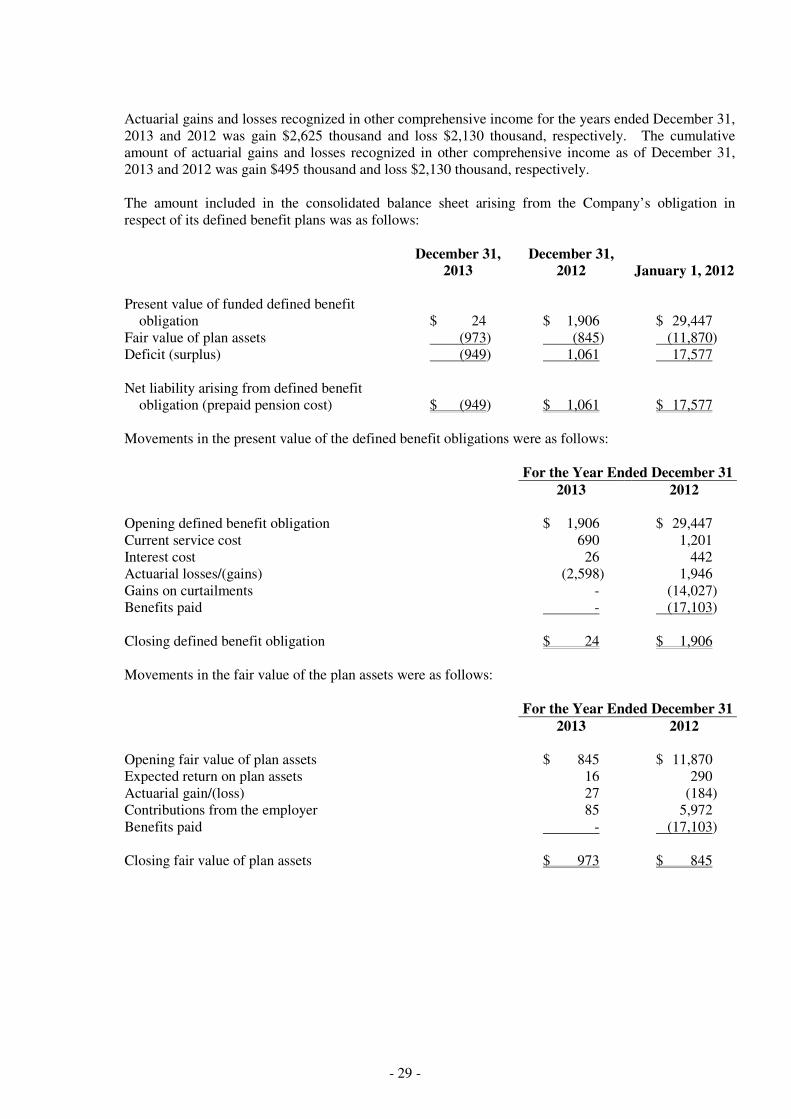
Actuarial gains and losses recognized in other comprehensive income for the years ended December 31, 2013 and 2012 was gain $2,625 thousand and loss $2,130 thousand, respectively. The cumulative amount of actuarial gains and losses recognized in other comprehensive income as of December 31, 2013 and 2012 was gain $495 thousand and loss $2,130 thousand, respectively. The amount included in the consolidated balance sheet arising from the Company’s obligation in respect of its defined benefit plans was as follows:
December 31,
2013 December 31,
2012 January 1, 2012 Present value of funded defined benefit
obligation $ 24 $ 1,906 $ 29,447 Fair value of plan assets (973) (845) (11,870) Deficit (surplus) (949) 1,061 17,577 Net liability arising from defined benefit
obligation (prepaid pension cost) $ (949) $ 1,061 $ 17,577 Movements in the present value of the defined benefit obligations were as follows: For the Year Ended December 31 2013 2012 Opening defined benefit obligation $ 1,906 $ 29,447 Current service cost 690 1,201 Interest cost 26 442 Actuarial losses/(gains) (2,598) 1,946 Gains on curtailments - (14,027) Benefits paid - (17,103) Closing defined benefit obligation $ 24 $ 1,906 Movements in the fair value of the plan assets were as follows: For the Year Ended December 31 2013 2012 Opening fair value of plan assets $ 845 $ 11,870 Expected return on plan assets 16 290 Actuarial gain/(loss) 27 (184) Contributions from the employer 85 5,972 Benefits paid - (17,103) Closing fair value of plan assets $ 973 $ 845
- 30 -
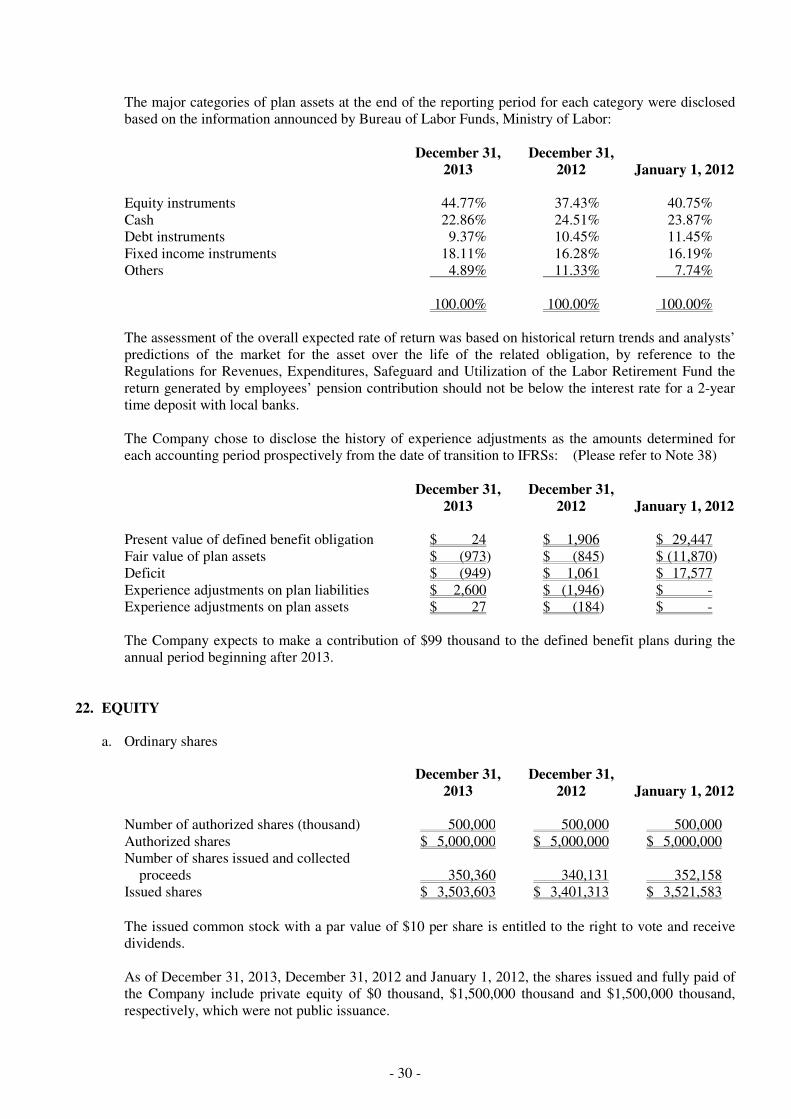
The major categories of plan assets at the end of the reporting period for each category were disclosed based on the information announced by Bureau of Labor Funds, Ministry of Labor:
December 31,
2013 December 31,
2012 January 1, 2012 Equity instruments 44.77% 37.43% 40.75% Cash 22.86% 24.51% 23.87% Debt instruments 9.37% 10.45% 11.45% Fixed income instruments 18.11% 16.28% 16.19% Others 4.89% 11.33% 7.74% 100.00% 100.00% 100.00% The assessment of the overall expected rate of return was based on historical return trends and analysts’ predictions of the market for the asset over the life of the related obligation, by reference to the Regulations for Revenues, Expenditures, Safeguard and Utilization of the Labor Retirement Fund the return generated by employees’ pension contribution should not be below the interest rate for a 2-year time deposit with local banks. The Company chose to disclose the history of experience adjustments as the amounts determined for each accounting period prospectively from the date of transition to IFRSs: (Please refer to Note 38)
December 31,
2013 December 31,
2012 January 1, 2012 Present value of defined benefit obligation $ 24 $ 1,906 $ 29,447 Fair value of plan assets $ (973) $ (845) $ (11,870) Deficit $ (949) $ 1,061 $ 17,577 Experience adjustments on plan liabilities $ 2,600 $ (1,946) $ - Experience adjustments on plan assets $ 27 $ (184) $ - The Company expects to make a contribution of $99 thousand to the defined benefit plans during the annual period beginning after 2013.
22. EQUITY
a. Ordinary shares
December 31,
2013 December 31,
2012 January 1, 2012 Number of authorized shares (thousand) 500,000 500,000 500,000 Authorized shares $ 5,000,000 $ 5,000,000 $ 5,000,000 Number of shares issued and collected
proceeds 350,360 340,131 352,158 Issued shares $ 3,503,603 $ 3,401,313 $ 3,521,583
The issued common stock with a par value of $10 per share is entitled to the right to vote and receive dividends. As of December 31, 2013, December 31, 2012 and January 1, 2012, the shares issued and fully paid of the Company include private equity of $0 thousand, $1,500,000 thousand and $1,500,000 thousand, respectively, which were not public issuance.
- 31 -
In their meeting on June 15, 2012, the stockholders of the Company approved a restricted stock plan for employees which were reflected in Note 26.
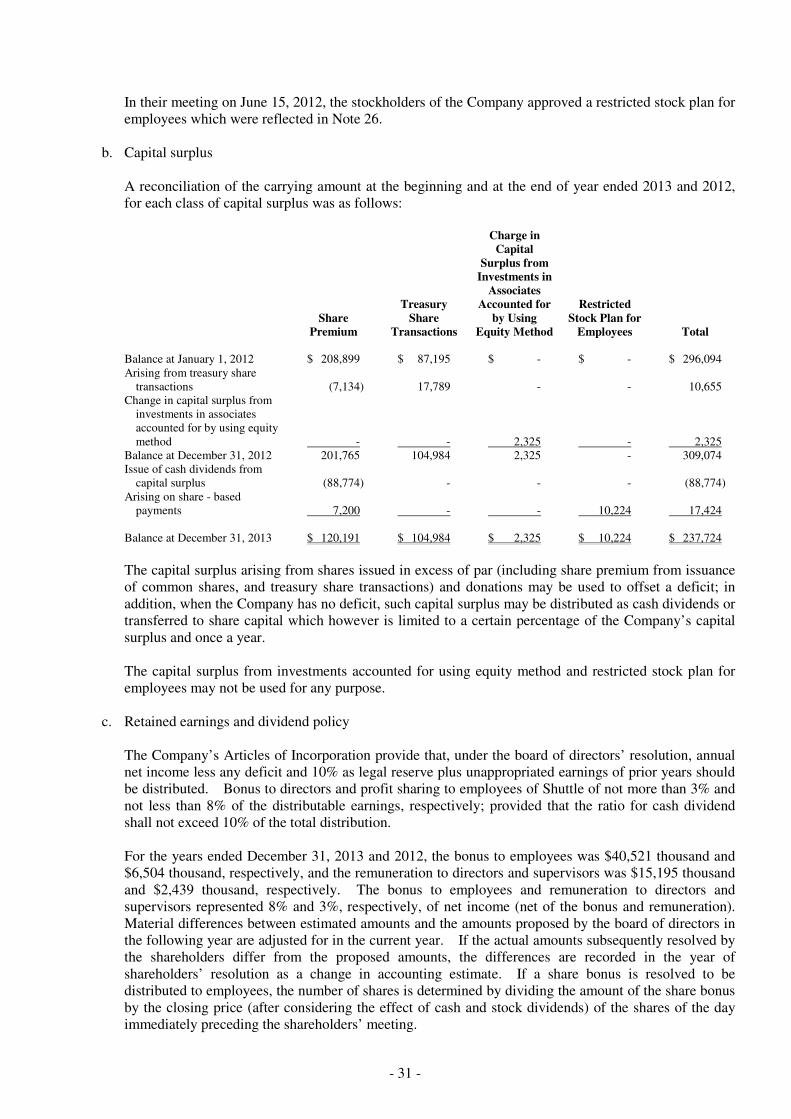
b. Capital surplus
A reconciliation of the carrying amount at the beginning and at the end of year ended 2013 and 2012, for each class of capital surplus was as follows:
Share
Premium
Treasury Share
Transactions
Charge in Capital
Surplus from Investments in
Associates Accounted for
by Using Equity Method
Restricted Stock Plan for
Employees Total Balance at January 1, 2012 $ 208,899 $ 87,195 $ - $ - $ 296,094 Arising from treasury share
transactions (7,134) 17,789 - - 10,655 Change in capital surplus from
investments in associates accounted for by using equity method - - 2,325 - 2,325
Balance at December 31, 2012 201,765 104,984 2,325 - 309,074 Issue of cash dividends from
capital surplus (88,774) - - - (88,774) Arising on share - based
payments 7,200 - - 10,224 17,424 Balance at December 31, 2013 $ 120,191 $ 104,984 $ 2,325 $ 10,224 $ 237,724
The capital surplus arising from shares issued in excess of par (including share premium from issuance of common shares, and treasury share transactions) and donations may be used to offset a deficit; in addition, when the Company has no deficit, such capital surplus may be distributed as cash dividends or transferred to share capital which however is limited to a certain percentage of the Company’s capital surplus and once a year. The capital surplus from investments accounted for using equity method and restricted stock plan for employees may not be used for any purpose.
c. Retained earnings and dividend policy The Company’s Articles of Incorporation provide that, under the board of directors’ resolution, annual net income less any deficit and 10% as legal reserve plus unappropriated earnings of prior years should be distributed. Bonus to directors and profit sharing to employees of Shuttle of not more than 3% and not less than 8% of the distributable earnings, respectively; provided that the ratio for cash dividend shall not exceed 10% of the total distribution. For the years ended December 31, 2013 and 2012, the bonus to employees was $40,521 thousand and $6,504 thousand, respectively, and the remuneration to directors and supervisors was $15,195 thousand and $2,439 thousand, respectively. The bonus to employees and remuneration to directors and supervisors represented 8% and 3%, respectively, of net income (net of the bonus and remuneration). Material differences between estimated amounts and the amounts proposed by the board of directors in the following year are adjusted for in the current year. If the actual amounts subsequently resolved by the shareholders differ from the proposed amounts, the differences are recorded in the year of shareholders’ resolution as a change in accounting estimate. If a share bonus is resolved to be distributed to employees, the number of shares is determined by dividing the amount of the share bonus by the closing price (after considering the effect of cash and stock dividends) of the shares of the day immediately preceding the shareholders’ meeting.
- 32 -
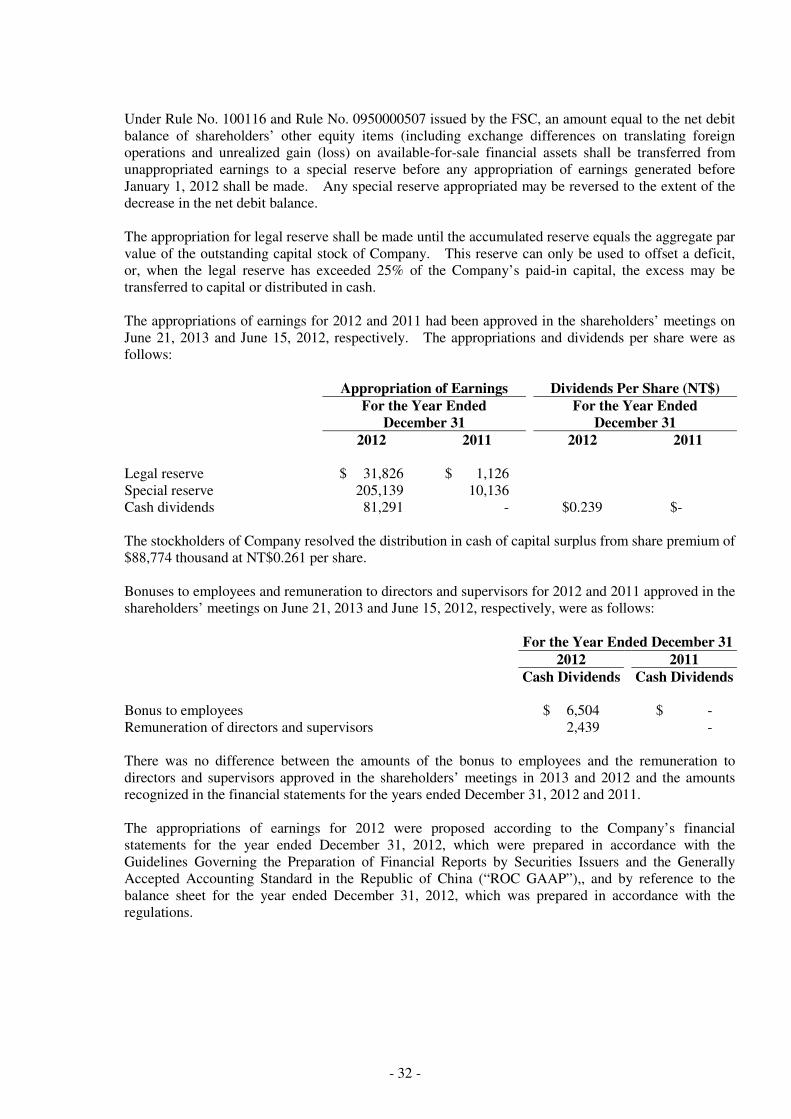
Under Rule No. 100116 and Rule No. 0950000507 issued by the FSC, an amount equal to the net debit balance of shareholders’ other equity items (including exchange differences on translating foreign operations and unrealized gain (loss) on available-for-sale financial assets shall be transferred from unappropriated earnings to a special reserve before any appropriation of earnings generated before January 1, 2012 shall be made. Any special reserve appropriated may be reversed to the extent of the decrease in the net debit balance. The appropriation for legal reserve shall be made until the accumulated reserve equals the aggregate par value of the outstanding capital stock of Company. This reserve can only be used to offset a deficit, or, when the legal reserve has exceeded 25% of the Company’s paid-in capital, the excess may be transferred to capital or distributed in cash. The appropriations of earnings for 2012 and 2011 had been approved in the shareholders’ meetings on June 21, 2013 and June 15, 2012, respectively. The appropriations and dividends per share were as follows: Appropriation of Earnings Dividends Per Share (NT$)
For the Year Ended
December 31 For the Year Ended
December 31 2012 2011 2012 2011 Legal reserve $ 31,826 $ 1,126 Special reserve 205,139 10,136 Cash dividends 81,291 - $0.239 $- The stockholders of Company resolved the distribution in cash of capital surplus from share premium of $88,774 thousand at NT$0.261 per share. Bonuses to employees and remuneration to directors and supervisors for 2012 and 2011 approved in the shareholders’ meetings on June 21, 2013 and June 15, 2012, respectively, were as follows: For the Year Ended December 31 2012 2011 Cash Dividends Cash Dividends Bonus to employees $ 6,504 $ - Remuneration of directors and supervisors 2,439 - There was no difference between the amounts of the bonus to employees and the remuneration to directors and supervisors approved in the shareholders’ meetings in 2013 and 2012 and the amounts recognized in the financial statements for the years ended December 31, 2012 and 2011. The appropriations of earnings for 2012 were proposed according to the Company’s financial statements for the year ended December 31, 2012, which were prepared in accordance with the Guidelines Governing the Preparation of Financial Reports by Securities Issuers and the Generally Accepted Accounting Standard in the Republic of China (“ROC GAAP”),, and by reference to the balance sheet for the year ended December 31, 2012, which was prepared in accordance with the regulations.
- 33 -
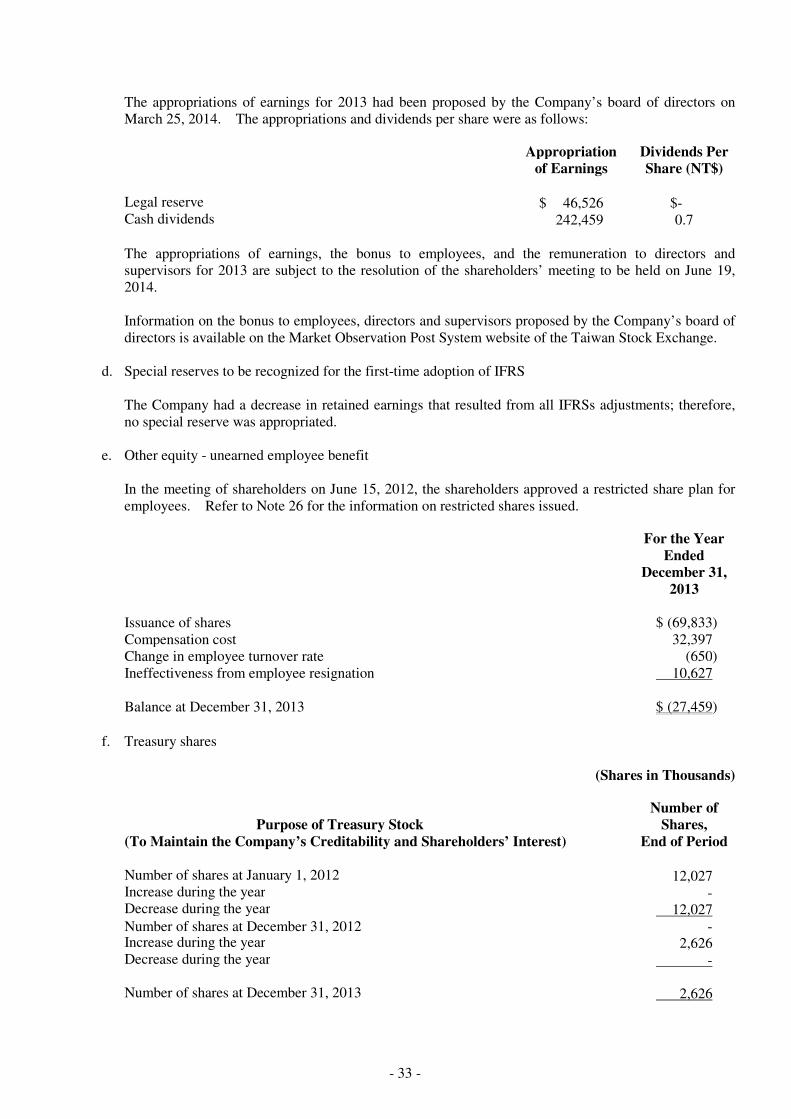
The appropriations of earnings for 2013 had been proposed by the Company’s board of directors on March 25, 2014. The appropriations and dividends per share were as follows:
Appropriation
of Earnings Dividends Per Share (NT$)
Legal reserve $ 46,526 $- Cash dividends 242,459 0.7 The appropriations of earnings, the bonus to employees, and the remuneration to directors and supervisors for 2013 are subject to the resolution of the shareholders’ meeting to be held on June 19, 2014. Information on the bonus to employees, directors and supervisors proposed by the Company’s board of directors is available on the Market Observation Post System website of the Taiwan Stock Exchange.
d. Special reserves to be recognized for the first-time adoption of IFRS
The Company had a decrease in retained earnings that resulted from all IFRSs adjustments; therefore, no special reserve was appropriated.
e. Other equity - unearned employee benefit In the meeting of shareholders on June 15, 2012, the shareholders approved a restricted share plan for employees. Refer to Note 26 for the information on restricted shares issued.
For the Year Ended
December 31, 2013
Issuance of shares $ (69,833) Compensation cost 32,397 Change in employee turnover rate (650) Ineffectiveness from employee resignation 10,627 Balance at December 31, 2013 $ (27,459)
f. Treasury shares
(Shares in Thousands)
Purpose of Treasury Stock (To Maintain the Company’s Creditability and Shareholders’ Interest)
Number of Shares,
End of Period Number of shares at January 1, 2012 12,027 Increase during the year - Decrease during the year 12,027 Number of shares at December 31, 2012 - Increase during the year 2,626 Decrease during the year - Number of shares at December 31, 2013 2,626
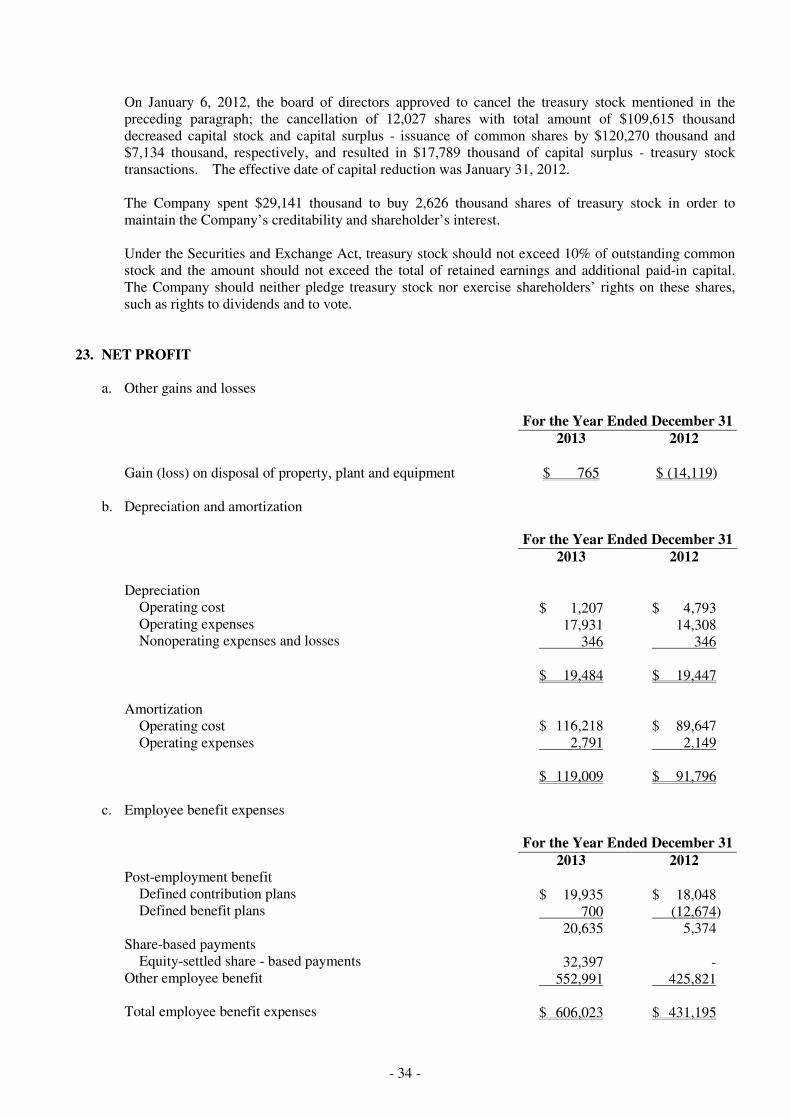
- 34 -
On January 6, 2012, the board of directors approved to cancel the treasury stock mentioned in the preceding paragraph; the cancellation of 12,027 shares with total amount of $109,615 thousand decreased capital stock and capital surplus - issuance of common shares by $120,270 thousand and $7,134 thousand, respectively, and resulted in $17,789 thousand of capital surplus - treasury stock transactions. The effective date of capital reduction was January 31, 2012. The Company spent $29,141 thousand to buy 2,626 thousand shares of treasury stock in order to maintain the Company’s creditability and shareholder’s interest. Under the Securities and Exchange Act, treasury stock should not exceed 10% of outstanding common stock and the amount should not exceed the total of retained earnings and additional paid-in capital. The Company should neither pledge treasury stock nor exercise shareholders’ rights on these shares, such as rights to dividends and to vote.
23. NET PROFIT
a. Other gains and losses
For the Year Ended December 31
2013 2012
Gain (loss) on disposal of property, plant and equipment $ 765 $ (14,119)
b. Depreciation and amortization
For the Year Ended December 31
2013 2012 Depreciation
Operating cost $ 1,207 $ 4,793 Operating expenses 17,931 14,308 Nonoperating expenses and losses 346 346 $ 19,484 $ 19,447
Amortization
Operating cost $ 116,218 $ 89,647 Operating expenses 2,791 2,149 $ 119,009 $ 91,796
c. Employee benefit expenses
For the Year Ended December 31
2013 2012 Post-employment benefit
Defined contribution plans $ 19,935 $ 18,048 Defined benefit plans 700 (12,674)
20,635 5,374 Share-based payments
Equity-settled share - based payments 32,397 - Other employee benefit 552,991 425,821 Total employee benefit expenses $ 606,023 $ 431,195
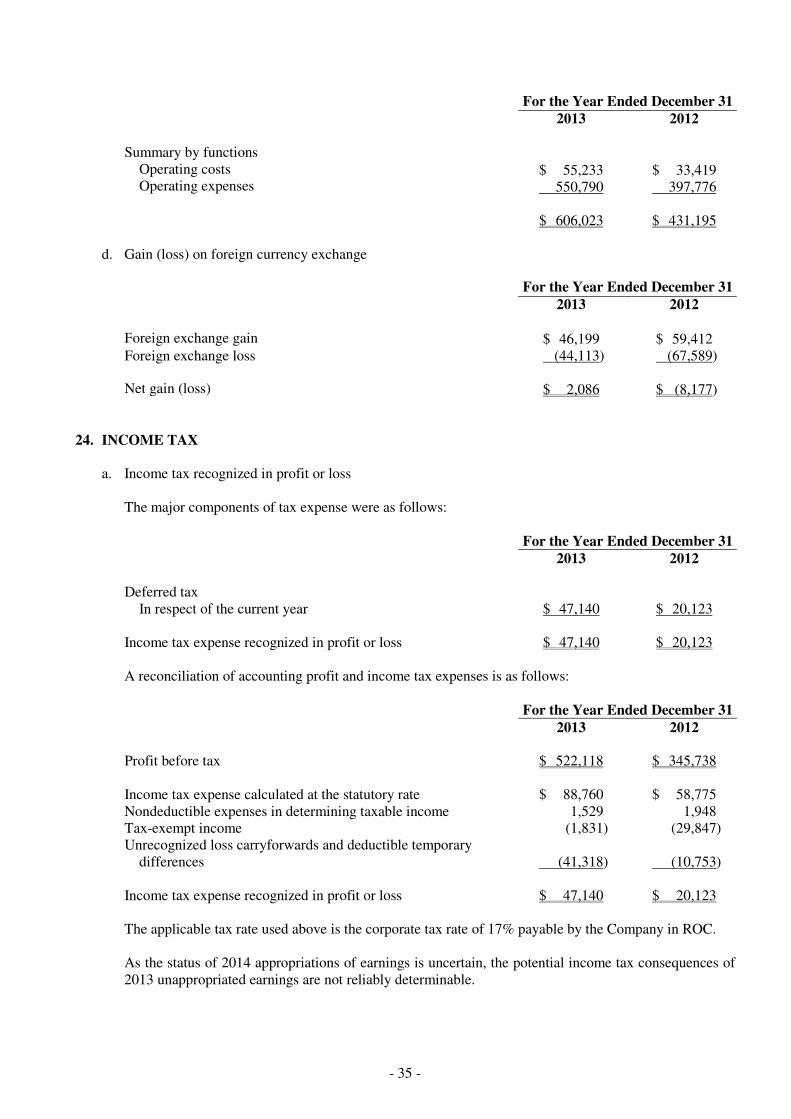
- 35 -
For the Year Ended December 31
2013 2012 Summary by functions
Operating costs $ 55,233 $ 33,419 Operating expenses 550,790 397,776
$ 606,023 $ 431,195
d. Gain (loss) on foreign currency exchange
For the Year Ended December 31
2013 2012 Foreign exchange gain $ 46,199 $ 59,412 Foreign exchange loss (44,113) (67,589) Net gain (loss) $ 2,086 $ (8,177)
24. INCOME TAX
a. Income tax recognized in profit or loss
The major components of tax expense were as follows: For the Year Ended December 31 2013 2012 Deferred tax
In respect of the current year $ 47,140 $ 20,123 Income tax expense recognized in profit or loss $ 47,140 $ 20,123 A reconciliation of accounting profit and income tax expenses is as follows: For the Year Ended December 31
2013 2012 Profit before tax $ 522,118 $ 345,738 Income tax expense calculated at the statutory rate $ 88,760 $ 58,775 Nondeductible expenses in determining taxable income 1,529 1,948 Tax-exempt income (1,831) (29,847) Unrecognized loss carryforwards and deductible temporary
differences (41,318) (10,753)
Income tax expense recognized in profit or loss $ 47,140 $ 20,123 The applicable tax rate used above is the corporate tax rate of 17% payable by the Company in ROC. As the status of 2014 appropriations of earnings is uncertain, the potential income tax consequences of 2013 unappropriated earnings are not reliably determinable.
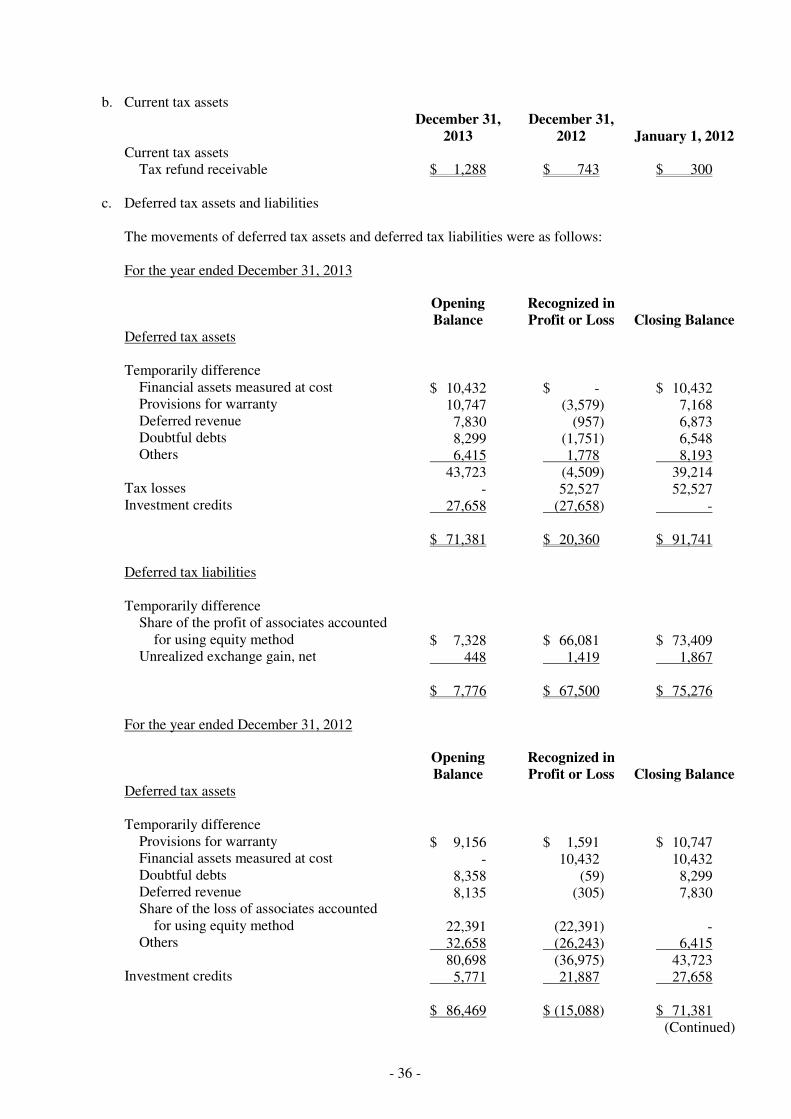
- 36 -
b. Current tax assets
December 31,
2013 December 31,
2012 January 1, 2012 Current tax assets
Tax refund receivable $ 1,288 $ 743 $ 300
c. Deferred tax assets and liabilities The movements of deferred tax assets and deferred tax liabilities were as follows: For the year ended December 31, 2013
Opening Balance
Recognized in Profit or Loss Closing Balance
Deferred tax assets Temporarily difference
Financial assets measured at cost $ 10,432 $ - $ 10,432 Provisions for warranty 10,747 (3,579) 7,168 Deferred revenue 7,830 (957) 6,873 Doubtful debts 8,299 (1,751) 6,548 Others 6,415 1,778 8,193
43,723 (4,509) 39,214 Tax losses - 52,527 52,527 Investment credits 27,658 (27,658) - $ 71,381 $ 20,360 $ 91,741 Deferred tax liabilities Temporarily difference
Share of the profit of associates accounted for using equity method $ 7,328 $ 66,081 $ 73,409
Unrealized exchange gain, net 448 1,419 1,867 $ 7,776 $ 67,500 $ 75,276 For the year ended December 31, 2012
Opening Balance
Recognized in Profit or Loss Closing Balance
Deferred tax assets Temporarily difference
Provisions for warranty $ 9,156 $ 1,591 $ 10,747 Financial assets measured at cost - 10,432 10,432 Doubtful debts 8,358 (59) 8,299 Deferred revenue 8,135 (305) 7,830 Share of the loss of associates accounted
for using equity method
22,391
(22,391)
- Others 32,658 (26,243) 6,415
80,698 (36,975) 43,723 Investment credits 5,771 21,887 27,658 $ 86,469 $ (15,088) $ 71,381
(Continued)
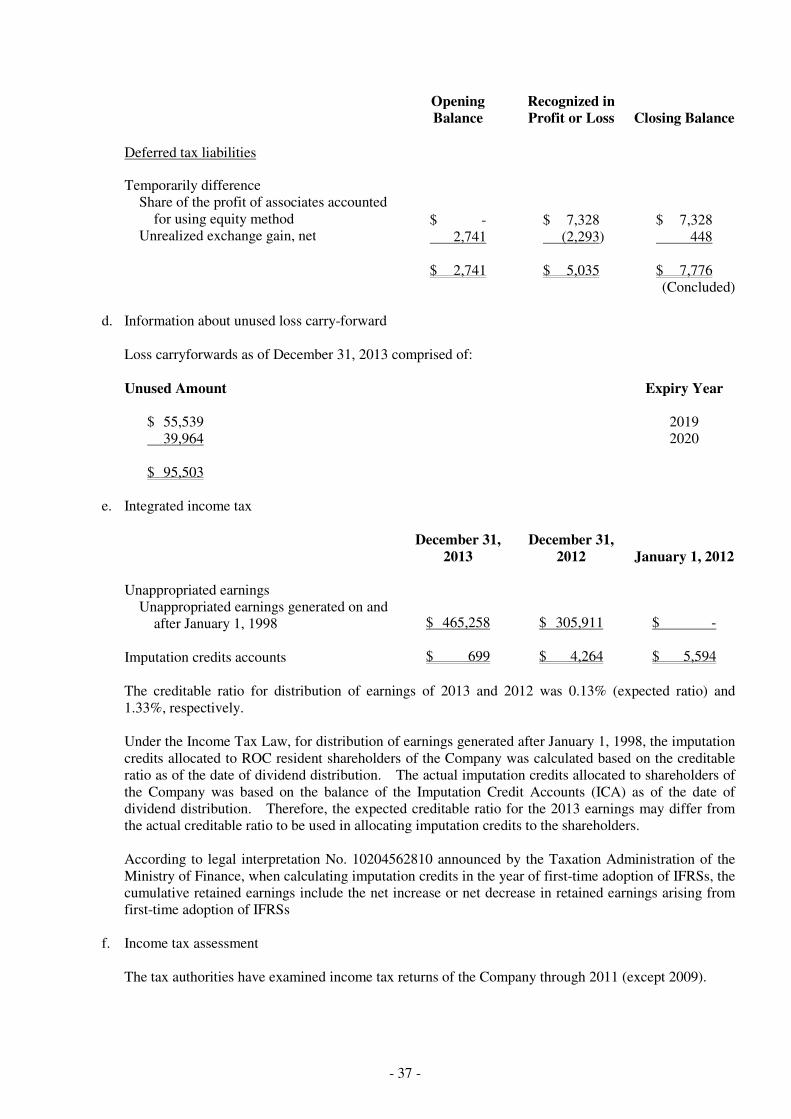
- 37 -
Opening Balance
Recognized in Profit or Loss Closing Balance
Deferred tax liabilities Temporarily difference
Share of the profit of associates accounted for using equity method
$ -
$ 7,328
$ 7,328
Unrealized exchange gain, net 2,741 (2,293) 448
$ 2,741 $ 5,035 $ 7,776 (Concluded)
d. Information about unused loss carry-forward
Loss carryforwards as of December 31, 2013 comprised of: Unused Amount Expiry Year $ 55,539 2019 39,964 2020 $ 95,503
e. Integrated income tax
December 31,
2013 December 31,
2012 January 1, 2012 Unappropriated earnings
Unappropriated earnings generated on and after January 1, 1998 $ 465,258 $ 305,911 $ -
Imputation credits accounts $ 699 $ 4,264 $ 5,594
The creditable ratio for distribution of earnings of 2013 and 2012 was 0.13% (expected ratio) and 1.33%, respectively. Under the Income Tax Law, for distribution of earnings generated after January 1, 1998, the imputation credits allocated to ROC resident shareholders of the Company was calculated based on the creditable ratio as of the date of dividend distribution. The actual imputation credits allocated to shareholders of the Company was based on the balance of the Imputation Credit Accounts (ICA) as of the date of dividend distribution. Therefore, the expected creditable ratio for the 2013 earnings may differ from the actual creditable ratio to be used in allocating imputation credits to the shareholders. According to legal interpretation No. 10204562810 announced by the Taxation Administration of the Ministry of Finance, when calculating imputation credits in the year of first-time adoption of IFRSs, the cumulative retained earnings include the net increase or net decrease in retained earnings arising from first-time adoption of IFRSs
f. Income tax assessment The tax authorities have examined income tax returns of the Company through 2011 (except 2009).
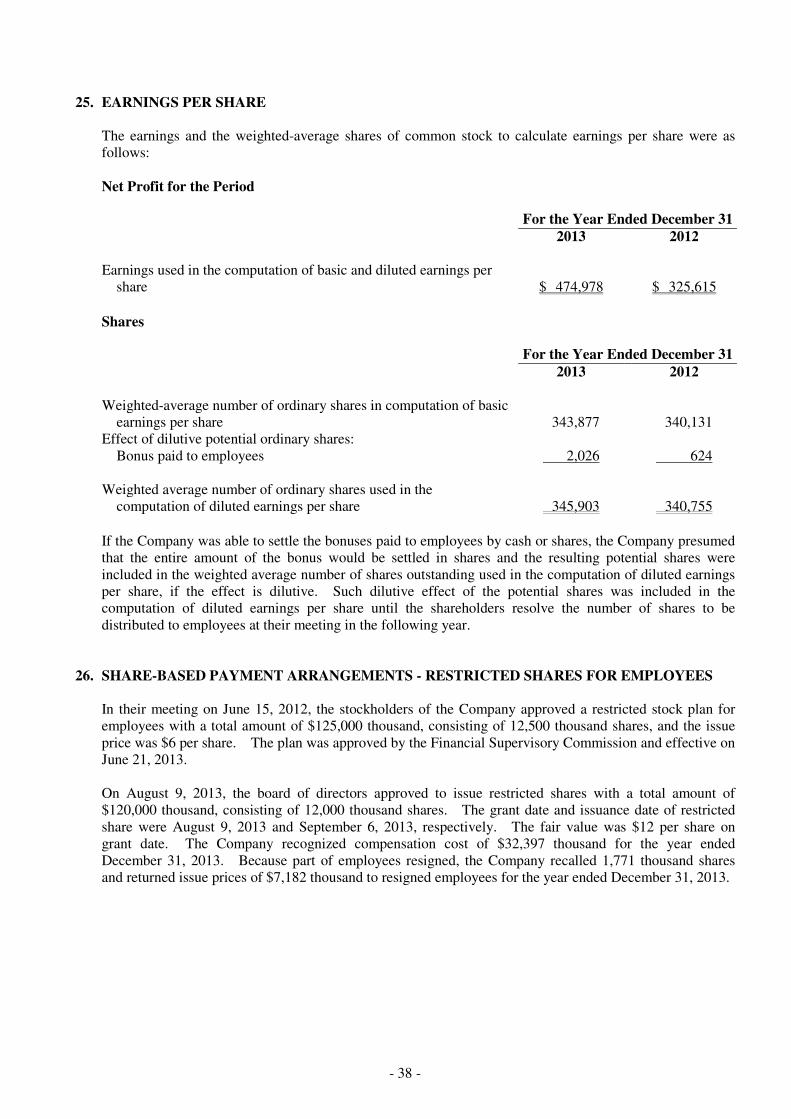
- 38 -
25. EARNINGS PER SHARE
The earnings and the weighted-average shares of common stock to calculate earnings per share were as follows: Net Profit for the Period For the Year Ended December 31
2013 2012 Earnings used in the computation of basic and diluted earnings per
share $ 474,978 $ 325,615
Shares For the Year Ended December 31
2013 2012 Weighted-average number of ordinary shares in computation of basic
earnings per share 343,877 340,131 Effect of dilutive potential ordinary shares:
Bonus paid to employees 2,026 624 Weighted average number of ordinary shares used in the
computation of diluted earnings per share 345,903 340,755
If the Company was able to settle the bonuses paid to employees by cash or shares, the Company presumed that the entire amount of the bonus would be settled in shares and the resulting potential shares were included in the weighted average number of shares outstanding used in the computation of diluted earnings per share, if the effect is dilutive. Such dilutive effect of the potential shares was included in the computation of diluted earnings per share until the shareholders resolve the number of shares to be distributed to employees at their meeting in the following year.
26. SHARE-BASED PAYMENT ARRANGEMENTS - RESTRICTED SHARES FOR EMPLOYEES
In their meeting on June 15, 2012, the stockholders of the Company approved a restricted stock plan for employees with a total amount of $125,000 thousand, consisting of 12,500 thousand shares, and the issue price was $6 per share. The plan was approved by the Financial Supervisory Commission and effective on June 21, 2013. On August 9, 2013, the board of directors approved to issue restricted shares with a total amount of $120,000 thousand, consisting of 12,000 thousand shares. The grant date and issuance date of restricted share were August 9, 2013 and September 6, 2013, respectively. The fair value was $12 per share on grant date. The Company recognized compensation cost of $32,397 thousand for the year ended December 31, 2013. Because part of employees resigned, the Company recalled 1,771 thousand shares and returned issue prices of $7,182 thousand to resigned employees for the year ended December 31, 2013.
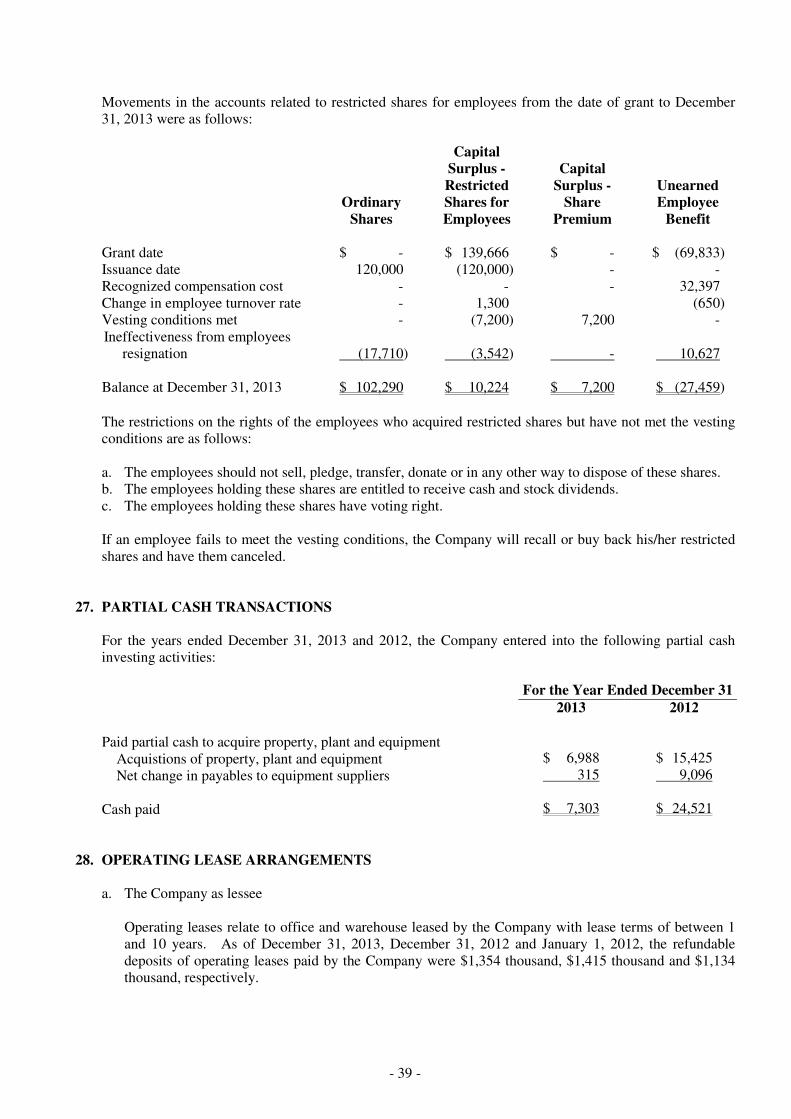
- 39 -
Movements in the accounts related to restricted shares for employees from the date of grant to December 31, 2013 were as follows:
Ordinary
Shares
Capital Surplus - Restricted Shares for Employees
Capital Surplus -
Share Premium
Unearned Employee
Benefit Grant date $ - $ 139,666 $ - $ (69,833) Issuance date 120,000 (120,000) - - Recognized compensation cost - - - 32,397 Change in employee turnover rate - 1,300 (650) Vesting conditions met - (7,200) 7,200 - Ineffectiveness from employees
resignation (17,710) (3,542) - 10,627 Balance at December 31, 2013 $ 102,290 $ 10,224 $ 7,200 $ (27,459)
The restrictions on the rights of the employees who acquired restricted shares but have not met the vesting conditions are as follows: a. The employees should not sell, pledge, transfer, donate or in any other way to dispose of these shares. b. The employees holding these shares are entitled to receive cash and stock dividends. c. The employees holding these shares have voting right. If an employee fails to meet the vesting conditions, the Company will recall or buy back his/her restricted shares and have them canceled.
27. PARTIAL CASH TRANSACTIONS For the years ended December 31, 2013 and 2012, the Company entered into the following partial cash investing activities: For the Year Ended December 31
2013 2012
Paid partial cash to acquire property, plant and equipment
Acquistions of property, plant and equipment $ 6,988 $ 15,425
Net change in payables to equipment suppliers 315 9,096
Cash paid $ 7,303 $ 24,521
28. OPERATING LEASE ARRANGEMENTS
a. The Company as lessee Operating leases relate to office and warehouse leased by the Company with lease terms of between 1 and 10 years. As of December 31, 2013, December 31, 2012 and January 1, 2012, the refundable deposits of operating leases paid by the Company were $1,354 thousand, $1,415 thousand and $1,134 thousand, respectively.
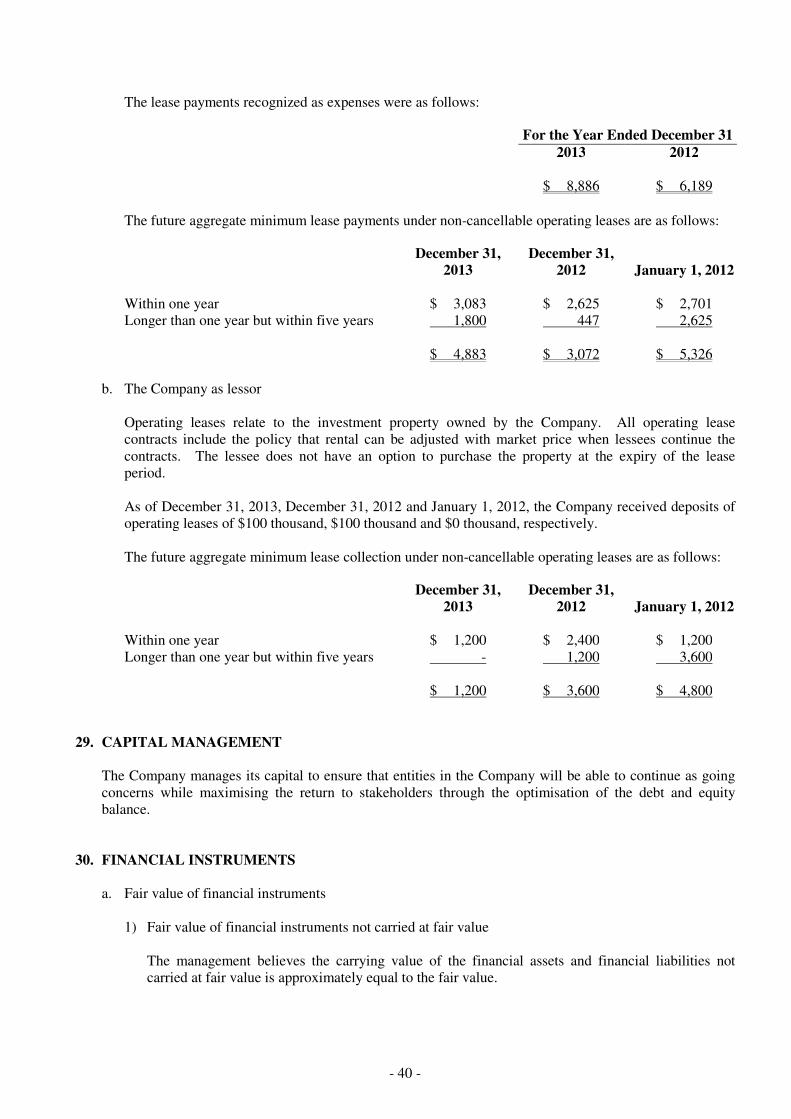
- 40 -
The lease payments recognized as expenses were as follows: For the Year Ended December 31
2013 2012 $ 8,886 $ 6,189
The future aggregate minimum lease payments under non-cancellable operating leases are as follows:
December 31,
2013 December 31,
2012 January 1, 2012 Within one year $ 3,083 $ 2,625 $ 2,701 Longer than one year but within five years 1,800 447 2,625 $ 4,883 $ 3,072 $ 5,326
b. The Company as lessor
Operating leases relate to the investment property owned by the Company. All operating lease contracts include the policy that rental can be adjusted with market price when lessees continue the contracts. The lessee does not have an option to purchase the property at the expiry of the lease period. As of December 31, 2013, December 31, 2012 and January 1, 2012, the Company received deposits of operating leases of $100 thousand, $100 thousand and $0 thousand, respectively. The future aggregate minimum lease collection under non-cancellable operating leases are as follows:
December 31,
2013 December 31,
2012 January 1, 2012 Within one year $ 1,200 $ 2,400 $ 1,200 Longer than one year but within five years - 1,200 3,600 $ 1,200 $ 3,600 $ 4,800
29. CAPITAL MANAGEMENT
The Company manages its capital to ensure that entities in the Company will be able to continue as going concerns while maximising the return to stakeholders through the optimisation of the debt and equity balance.
30. FINANCIAL INSTRUMENTS
a. Fair value of financial instruments
1) Fair value of financial instruments not carried at fair value The management believes the carrying value of the financial assets and financial liabilities not carried at fair value is approximately equal to the fair value.
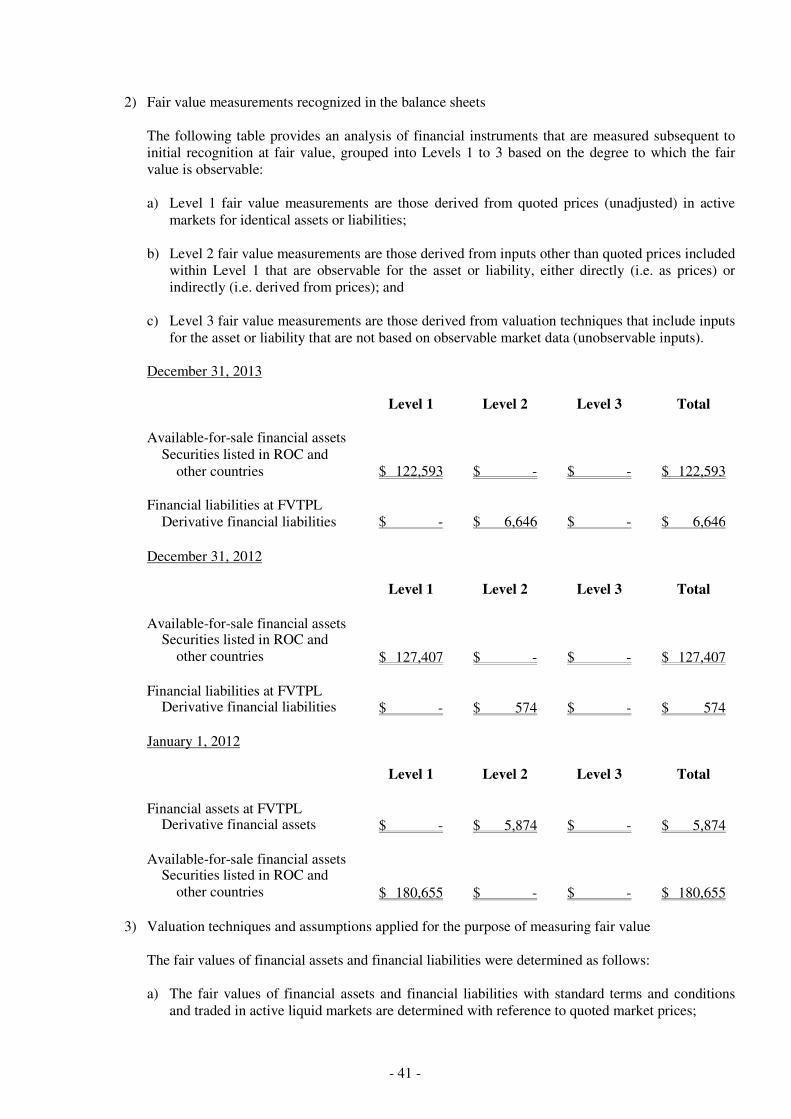
- 41 -
2) Fair value measurements recognized in the balance sheets The following table provides an analysis of financial instruments that are measured subsequent to initial recognition at fair value, grouped into Levels 1 to 3 based on the degree to which the fair value is observable: a) Level 1 fair value measurements are those derived from quoted prices (unadjusted) in active
markets for identical assets or liabilities; b) Level 2 fair value measurements are those derived from inputs other than quoted prices included
within Level 1 that are observable for the asset or liability, either directly (i.e. as prices) or indirectly (i.e. derived from prices); and
c) Level 3 fair value measurements are those derived from valuation techniques that include inputs
for the asset or liability that are not based on observable market data (unobservable inputs). December 31, 2013 Level 1 Level 2 Level 3 Total Available-for-sale financial assets
Securities listed in ROC and other countries $ 122,593 $ - $ - $ 122,593
Financial liabilities at FVTPL
Derivative financial liabilities $ - $ 6,646 $ - $ 6,646
December 31, 2012 Level 1 Level 2 Level 3 Total
Available-for-sale financial assets Securities listed in ROC and
other countries $ 127,407 $ - $ - $ 127,407 Financial liabilities at FVTPL
Derivative financial liabilities $ - $ 574 $ - $ 574
January 1, 2012 Level 1 Level 2 Level 3 Total
Financial assets at FVTPL Derivative financial assets $ - $ 5,874 $ - $ 5,874
Available-for-sale financial assets
Securities listed in ROC and other countries $ 180,655 $ - $ - $ 180,655
3) Valuation techniques and assumptions applied for the purpose of measuring fair value
The fair values of financial assets and financial liabilities were determined as follows: a) The fair values of financial assets and financial liabilities with standard terms and conditions
and traded in active liquid markets are determined with reference to quoted market prices;
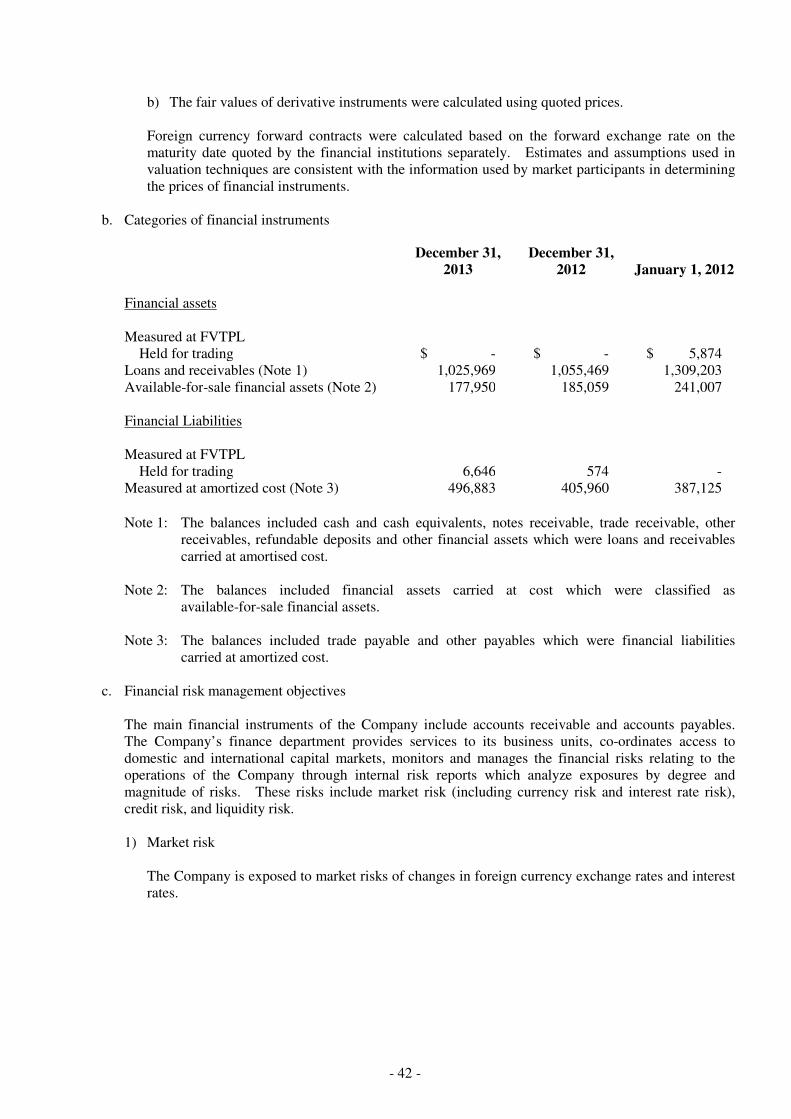
- 42 -
b) The fair values of derivative instruments were calculated using quoted prices. Foreign currency forward contracts were calculated based on the forward exchange rate on the maturity date quoted by the financial institutions separately. Estimates and assumptions used in valuation techniques are consistent with the information used by market participants in determining the prices of financial instruments.
b. Categories of financial instruments
December 31,
2013 December 31,
2012 January 1, 2012 Financial assets Measured at FVTPL
Held for trading $ - $ - $ 5,874 Loans and receivables (Note 1) 1,025,969 1,055,469 1,309,203 Available-for-sale financial assets (Note 2) 177,950 185,059 241,007 Financial Liabilities Measured at FVTPL
Held for trading 6,646 574 - Measured at amortized cost (Note 3) 496,883 405,960 387,125
Note 1: The balances included cash and cash equivalents, notes receivable, trade receivable, other
receivables, refundable deposits and other financial assets which were loans and receivables carried at amortised cost.
Note 2: The balances included financial assets carried at cost which were classified as
available-for-sale financial assets. Note 3: The balances included trade payable and other payables which were financial liabilities
carried at amortized cost. c. Financial risk management objectives
The main financial instruments of the Company include accounts receivable and accounts payables. The Company’s finance department provides services to its business units, co-ordinates access to domestic and international capital markets, monitors and manages the financial risks relating to the operations of the Company through internal risk reports which analyze exposures by degree and magnitude of risks. These risks include market risk (including currency risk and interest rate risk), credit risk, and liquidity risk. 1) Market risk
The Company is exposed to market risks of changes in foreign currency exchange rates and interest rates.
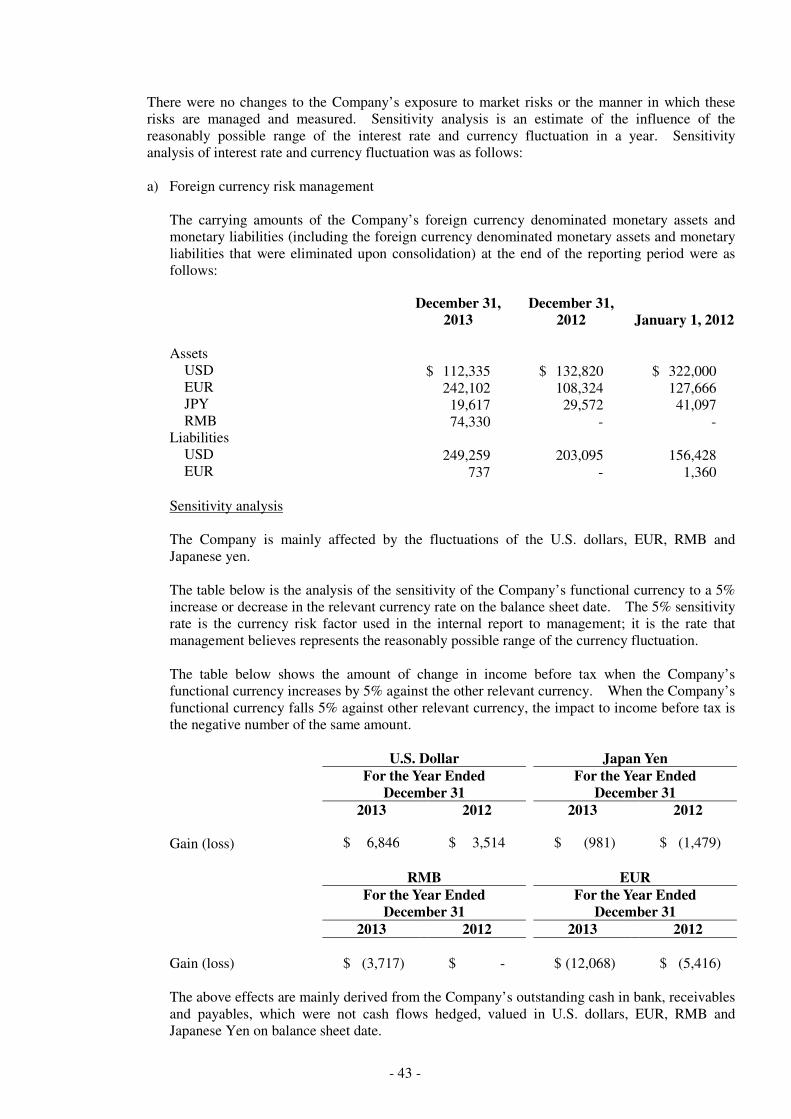
- 43 -
There were no changes to the Company’s exposure to market risks or the manner in which these risks are managed and measured. Sensitivity analysis is an estimate of the influence of the reasonably possible range of the interest rate and currency fluctuation in a year. Sensitivity analysis of interest rate and currency fluctuation was as follows:
a) Foreign currency risk management
The carrying amounts of the Company’s foreign currency denominated monetary assets and monetary liabilities (including the foreign currency denominated monetary assets and monetary liabilities that were eliminated upon consolidation) at the end of the reporting period were as follows:
December 31,
2013 December 31,
2012 January 1, 2012 Assets
USD $ 112,335 $ 132,820 $ 322,000 EUR 242,102 108,324 127,666 JPY 19,617 29,572 41,097 RMB 74,330 - -
Liabilities USD 249,259 203,095 156,428 EUR 737 - 1,360
Sensitivity analysis The Company is mainly affected by the fluctuations of the U.S. dollars, EUR, RMB and Japanese yen.
The table below is the analysis of the sensitivity of the Company’s functional currency to a 5% increase or decrease in the relevant currency rate on the balance sheet date. The 5% sensitivity rate is the currency risk factor used in the internal report to management; it is the rate that management believes represents the reasonably possible range of the currency fluctuation.
The table below shows the amount of change in income before tax when the Company’s functional currency increases by 5% against the other relevant currency. When the Company’s functional currency falls 5% against other relevant currency, the impact to income before tax is the negative number of the same amount.
U.S. Dollar Japan Yen
For the Year Ended
December 31 For the Year Ended
December 31 2013 2012 2013 2012
Gain (loss) $ 6,846 $ 3,514 $ (981) $ (1,479)
RMB EUR
For the Year Ended
December 31 For the Year Ended
December 31 2013 2012 2013 2012
Gain (loss) $ (3,717) $ - $ (12,068) $ (5,416)
The above effects are mainly derived from the Company’s outstanding cash in bank, receivables and payables, which were not cash flows hedged, valued in U.S. dollars, EUR, RMB and Japanese Yen on balance sheet date.
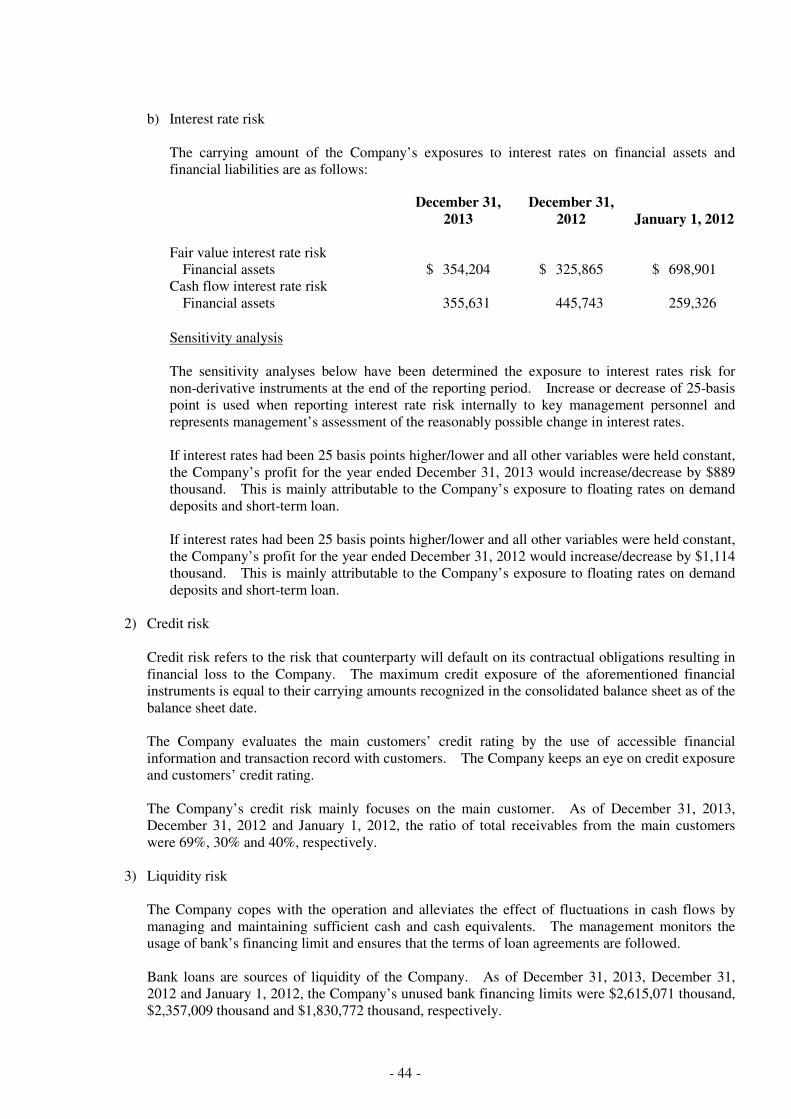
- 44 -
b) Interest rate risk
The carrying amount of the Company’s exposures to interest rates on financial assets and financial liabilities are as follows:
December 31,
2013 December 31,
2012 January 1, 2012 Fair value interest rate risk
Financial assets $ 354,204 $ 325,865 $ 698,901 Cash flow interest rate risk
Financial assets 355,631 445,743 259,326
Sensitivity analysis The sensitivity analyses below have been determined the exposure to interest rates risk for non-derivative instruments at the end of the reporting period. Increase or decrease of 25-basis point is used when reporting interest rate risk internally to key management personnel and represents management’s assessment of the reasonably possible change in interest rates.
If interest rates had been 25 basis points higher/lower and all other variables were held constant, the Company’s profit for the year ended December 31, 2013 would increase/decrease by $889 thousand. This is mainly attributable to the Company’s exposure to floating rates on demand deposits and short-term loan.
If interest rates had been 25 basis points higher/lower and all other variables were held constant, the Company’s profit for the year ended December 31, 2012 would increase/decrease by $1,114 thousand. This is mainly attributable to the Company’s exposure to floating rates on demand deposits and short-term loan.
2) Credit risk
Credit risk refers to the risk that counterparty will default on its contractual obligations resulting in financial loss to the Company. The maximum credit exposure of the aforementioned financial instruments is equal to their carrying amounts recognized in the consolidated balance sheet as of the balance sheet date. The Company evaluates the main customers’ credit rating by the use of accessible financial information and transaction record with customers. The Company keeps an eye on credit exposure and customers’ credit rating. The Company’s credit risk mainly focuses on the main customer. As of December 31, 2013, December 31, 2012 and January 1, 2012, the ratio of total receivables from the main customers were 69%, 30% and 40%, respectively.
3) Liquidity risk
The Company copes with the operation and alleviates the effect of fluctuations in cash flows by managing and maintaining sufficient cash and cash equivalents. The management monitors the usage of bank’s financing limit and ensures that the terms of loan agreements are followed. Bank loans are sources of liquidity of the Company. As of December 31, 2013, December 31, 2012 and January 1, 2012, the Company’s unused bank financing limits were $2,615,071 thousand, $2,357,009 thousand and $1,830,772 thousand, respectively.
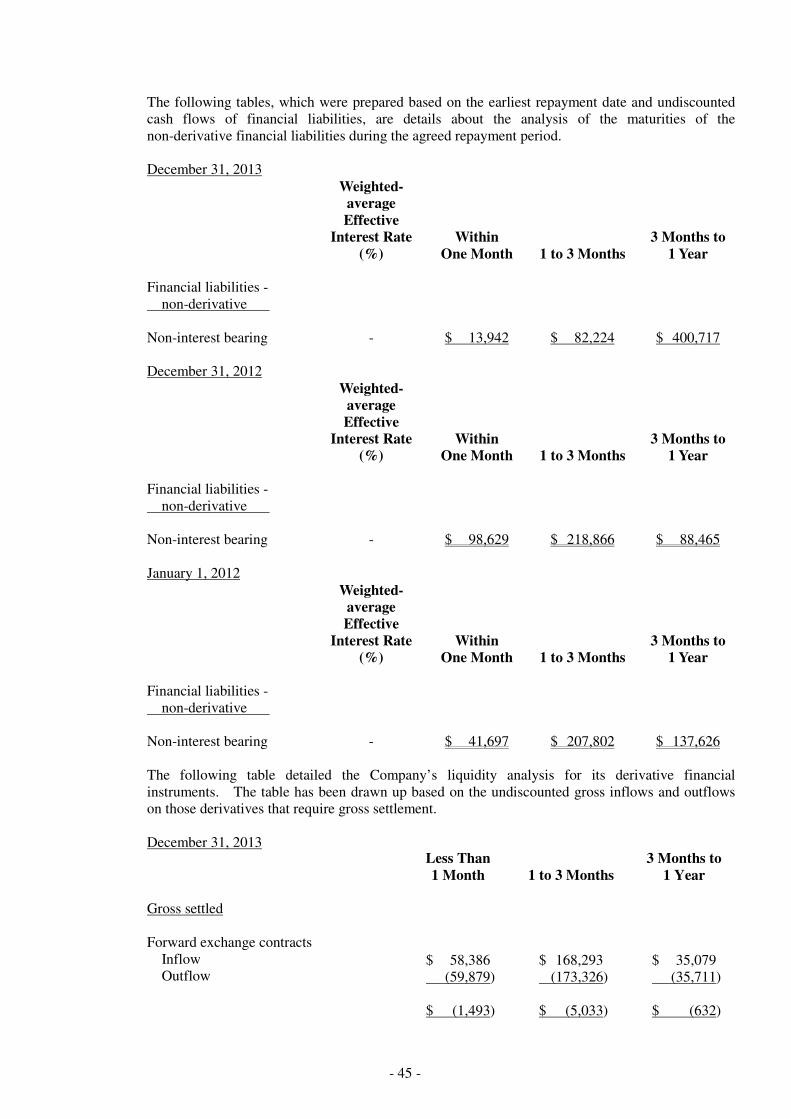
- 45 -
The following tables, which were prepared based on the earliest repayment date and undiscounted cash flows of financial liabilities, are details about the analysis of the maturities of the non-derivative financial liabilities during the agreed repayment period. December 31, 2013
Weighted- average Effective
Interest Rate (%)
Within One Month 1 to 3 Months
3 Months to 1 Year
Financial liabilities - non-derivative
Non-interest bearing - $ 13,942 $ 82,224 $ 400,717
December 31, 2012
Weighted- average Effective
Interest Rate (%)
Within One Month 1 to 3 Months
3 Months to 1 Year
Financial liabilities - non-derivative Non-interest bearing - $ 98,629 $ 218,866 $ 88,465
January 1, 2012
Weighted- average Effective
Interest Rate (%)
Within One Month 1 to 3 Months
3 Months to 1 Year
Financial liabilities - non-derivative Non-interest bearing - $ 41,697 $ 207,802 $ 137,626
The following table detailed the Company’s liquidity analysis for its derivative financial instruments. The table has been drawn up based on the undiscounted gross inflows and outflows on those derivatives that require gross settlement. December 31, 2013
Less Than 1 Month 1 to 3 Months
3 Months to 1 Year
Gross settled Forward exchange contracts
Inflow $ 58,386 $ 168,293 $ 35,079 Outflow (59,879) (173,326) (35,711)
$ (1,493) $ (5,033) $ (632)
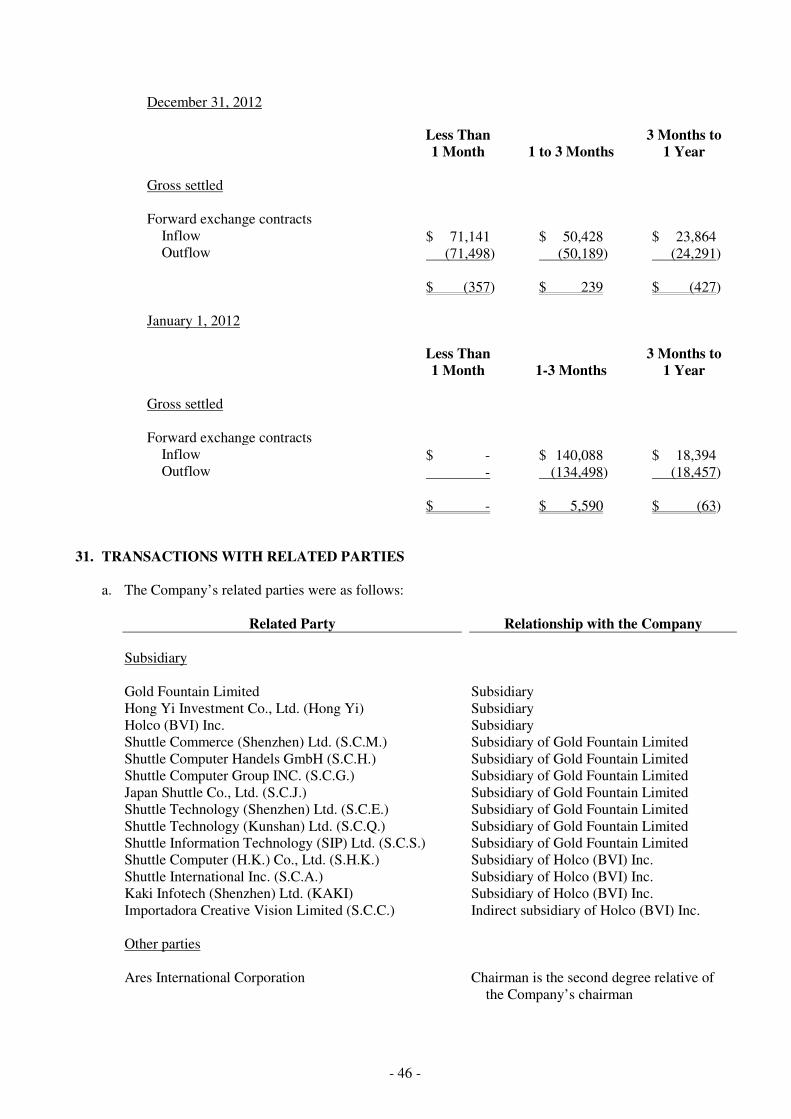
- 46 -
December 31, 2012
Less Than 1 Month 1 to 3 Months
3 Months to 1 Year
Gross settled Forward exchange contracts
Inflow $ 71,141 $ 50,428 $ 23,864 Outflow (71,498) (50,189) (24,291)
$ (357) $ 239 $ (427)
January 1, 2012
Less Than 1 Month 1-3 Months
3 Months to 1 Year
Gross settled Forward exchange contracts
Inflow $ - $ 140,088 $ 18,394 Outflow - (134,498) (18,457)
$ - $ 5,590 $ (63)
31. TRANSACTIONS WITH RELATED PARTIES
a. The Company’s related parties were as follows:
Related Party Relationship with the Company Subsidiary Gold Fountain Limited Subsidiary Hong Yi Investment Co., Ltd. (Hong Yi) Subsidiary Holco (BVI) Inc. Subsidiary Shuttle Commerce (Shenzhen) Ltd. (S.C.M.) Subsidiary of Gold Fountain Limited Shuttle Computer Handels GmbH (S.C.H.) Subsidiary of Gold Fountain Limited Shuttle Computer Group INC. (S.C.G.) Subsidiary of Gold Fountain Limited Japan Shuttle Co., Ltd. (S.C.J.) Subsidiary of Gold Fountain Limited Shuttle Technology (Shenzhen) Ltd. (S.C.E.) Subsidiary of Gold Fountain Limited Shuttle Technology (Kunshan) Ltd. (S.C.Q.) Subsidiary of Gold Fountain Limited Shuttle Information Technology (SIP) Ltd. (S.C.S.) Subsidiary of Gold Fountain Limited Shuttle Computer (H.K.) Co., Ltd. (S.H.K.) Subsidiary of Holco (BVI) Inc. Shuttle International Inc. (S.C.A.) Subsidiary of Holco (BVI) Inc. Kaki Infotech (Shenzhen) Ltd. (KAKI) Subsidiary of Holco (BVI) Inc. Importadora Creative Vision Limited (S.C.C.) Indirect subsidiary of Holco (BVI) Inc. Other parties Ares International Corporation Chairman is the second degree relative of
the Company’s chairman
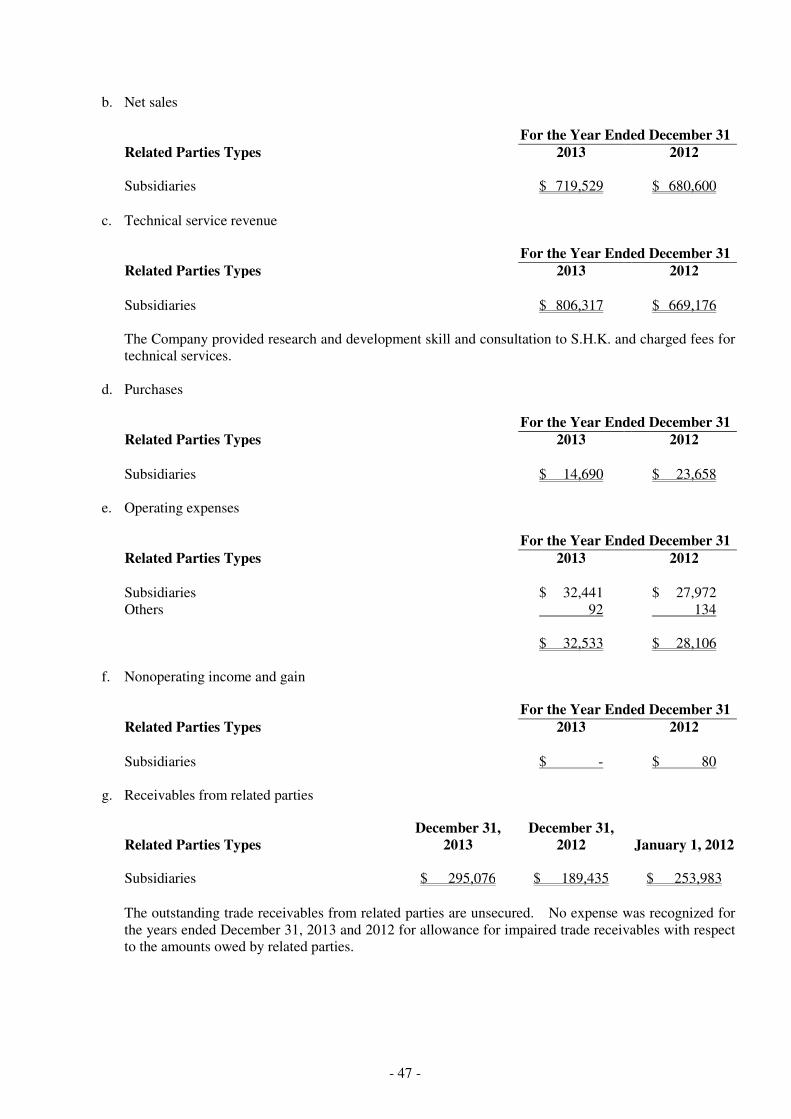
- 47 -
b. Net sales
For the Year Ended December 31 Related Parties Types 2013 2012 Subsidiaries $ 719,529 $ 680,600
c. Technical service revenue
For the Year Ended December 31 Related Parties Types 2013 2012
Subsidiaries $ 806,317 $ 669,176
The Company provided research and development skill and consultation to S.H.K. and charged fees for technical services.
d. Purchases
For the Year Ended December 31 Related Parties Types 2013 2012
Subsidiaries $ 14,690 $ 23,658 e. Operating expenses
For the Year Ended December 31
Related Parties Types 2013 2012
Subsidiaries $ 32,441 $ 27,972 Others 92 134 $ 32,533 $ 28,106
f. Nonoperating income and gain
For the Year Ended December 31
Related Parties Types 2013 2012
Subsidiaries $ - $ 80
g. Receivables from related parties
Related Parties Types December 31,
2013 December 31,
2012 January 1, 2012 Subsidiaries $ 295,076 $ 189,435 $ 253,983
The outstanding trade receivables from related parties are unsecured. No expense was recognized for the years ended December 31, 2013 and 2012 for allowance for impaired trade receivables with respect to the amounts owed by related parties.
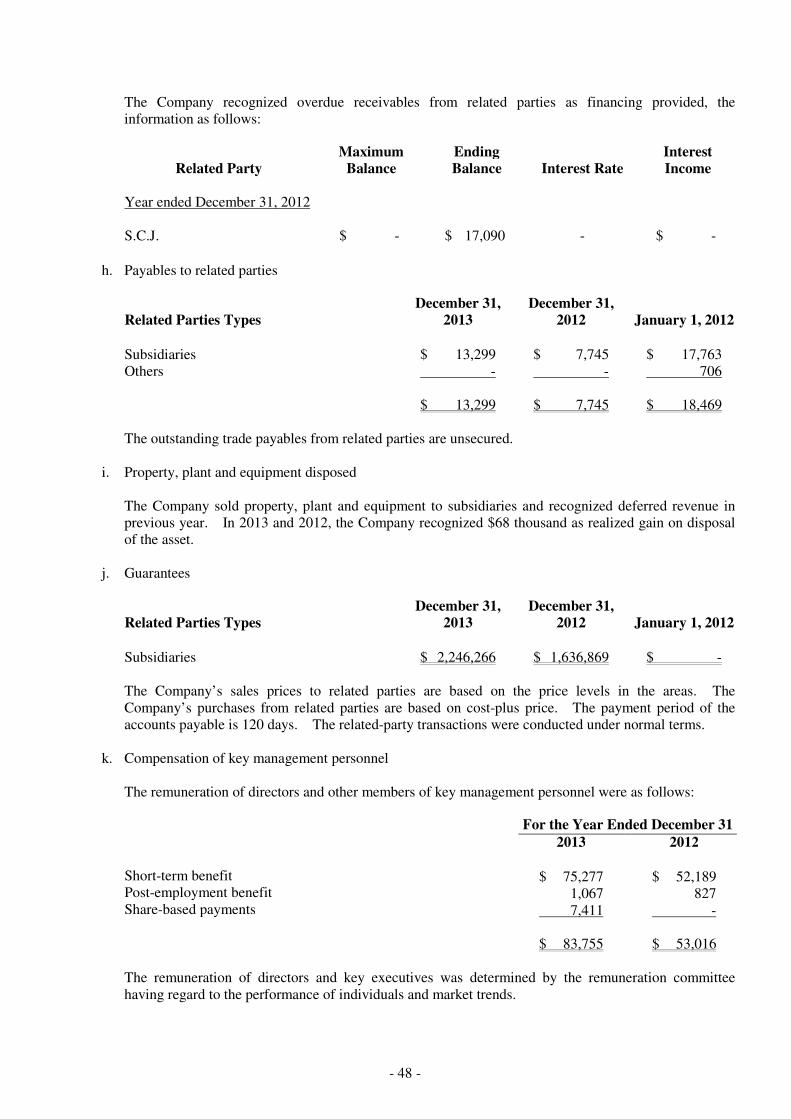
- 48 -
The Company recognized overdue receivables from related parties as financing provided, the information as follows:
Related Party Maximum
Balance Ending Balance Interest Rate
Interest Income
Year ended December 31, 2012 S.C.J. $ - $ 17,090 - $ -
h. Payables to related parties
Related Parties Types December 31,
2013 December 31,
2012 January 1, 2012
Subsidiaries $ 13,299 $ 7,745 $ 17,763 Others - - 706 $ 13,299 $ 7,745 $ 18,469 The outstanding trade payables from related parties are unsecured.
i. Property, plant and equipment disposed
The Company sold property, plant and equipment to subsidiaries and recognized deferred revenue in previous year. In 2013 and 2012, the Company recognized $68 thousand as realized gain on disposal of the asset.
j. Guarantees
Related Parties Types December 31,
2013 December 31,
2012 January 1, 2012
Subsidiaries $ 2,246,266 $ 1,636,869 $ - The Company’s sales prices to related parties are based on the price levels in the areas. The Company’s purchases from related parties are based on cost-plus price. The payment period of the accounts payable is 120 days. The related-party transactions were conducted under normal terms.
k. Compensation of key management personnel
The remuneration of directors and other members of key management personnel were as follows:
For the Year Ended December 31
2013 2012 Short-term benefit $ 75,277 $ 52,189 Post-employment benefit 1,067 827 Share-based payments 7,411 - $ 83,755 $ 53,016
The remuneration of directors and key executives was determined by the remuneration committee having regard to the performance of individuals and market trends.
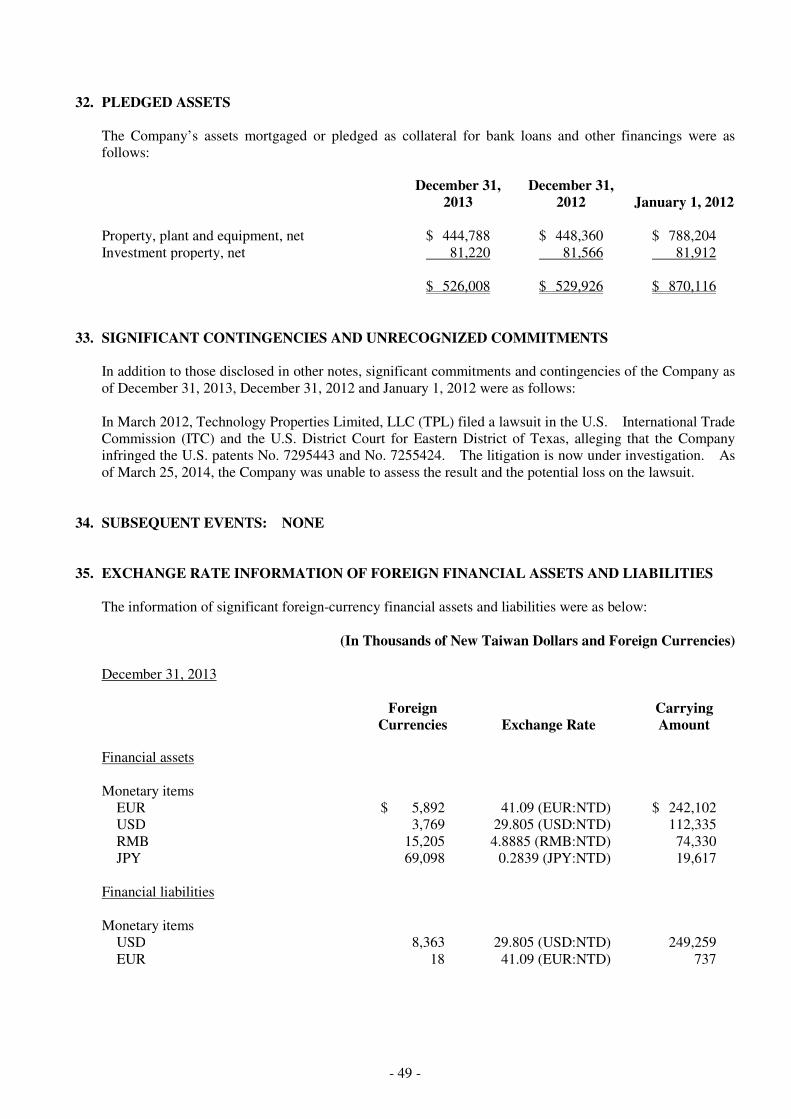
- 49 -
32. PLEDGED ASSETS
The Company’s assets mortgaged or pledged as collateral for bank loans and other financings were as follows:
December 31,
2013 December 31,
2012 January 1, 2012 Property, plant and equipment, net $ 444,788 $ 448,360 $ 788,204 Investment property, net 81,220 81,566 81,912 $ 526,008 $ 529,926 $ 870,116
33. SIGNIFICANT CONTINGENCIES AND UNRECOGNIZED COMMITMENTS In addition to those disclosed in other notes, significant commitments and contingencies of the Company as of December 31, 2013, December 31, 2012 and January 1, 2012 were as follows: In March 2012, Technology Properties Limited, LLC (TPL) filed a lawsuit in the U.S. International Trade Commission (ITC) and the U.S. District Court for Eastern District of Texas, alleging that the Company infringed the U.S. patents No. 7295443 and No. 7255424. The litigation is now under investigation. As of March 25, 2014, the Company was unable to assess the result and the potential loss on the lawsuit.
34. SUBSEQUENT EVENTS: NONE 35. EXCHANGE RATE INFORMATION OF FOREIGN FINANCIAL ASSETS AND LIABILITIES
The information of significant foreign-currency financial assets and liabilities were as below:
(In Thousands of New Taiwan Dollars and Foreign Currencies) December 31, 2013
Foreign
Currencies Exchange Rate Carrying Amount
Financial assets Monetary items
EUR $ 5,892 41.09 (EUR:NTD) $ 242,102 USD 3,769 29.805 (USD:NTD) 112,335 RMB 15,205 4.8885 (RMB:NTD) 74,330 JPY 69,098 0.2839 (JPY:NTD) 19,617
Financial liabilities Monetary items
USD 8,363 29.805 (USD:NTD) 249,259 EUR 18 41.09 (EUR:NTD) 737
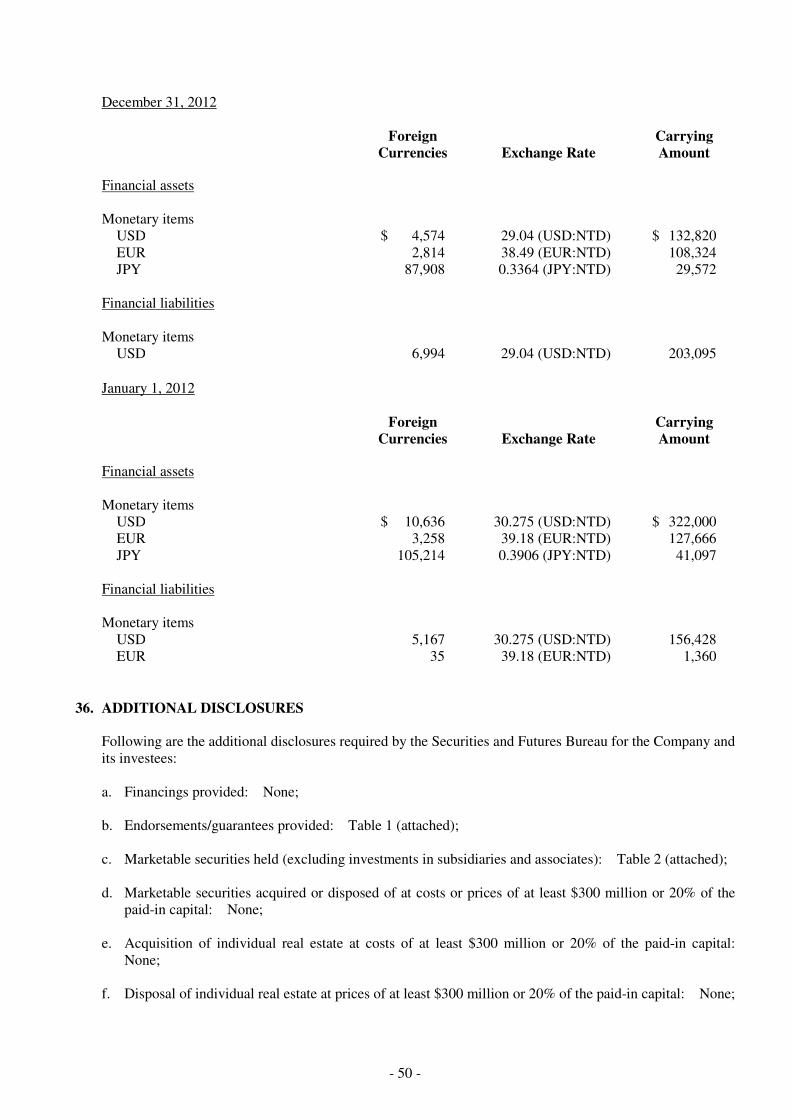
- 50 -
December 31, 2012
Foreign
Currencies Exchange Rate Carrying Amount
Financial assets Monetary items
USD $ 4,574 29.04 (USD:NTD) $ 132,820 EUR 2,814 38.49 (EUR:NTD) 108,324 JPY 87,908 0.3364 (JPY:NTD) 29,572
Financial liabilities Monetary items
USD 6,994 29.04 (USD:NTD) 203,095
January 1, 2012
Foreign
Currencies Exchange Rate Carrying Amount
Financial assets Monetary items
USD $ 10,636 30.275 (USD:NTD) $ 322,000 EUR 3,258 39.18 (EUR:NTD) 127,666 JPY 105,214 0.3906 (JPY:NTD) 41,097
Financial liabilities Monetary items
USD 5,167 30.275 (USD:NTD) 156,428 EUR 35 39.18 (EUR:NTD) 1,360
36. ADDITIONAL DISCLOSURES
Following are the additional disclosures required by the Securities and Futures Bureau for the Company and its investees: a. Financings provided: None; b. Endorsements/guarantees provided: Table 1 (attached); c. Marketable securities held (excluding investments in subsidiaries and associates): Table 2 (attached); d. Marketable securities acquired or disposed of at costs or prices of at least $300 million or 20% of the
paid-in capital: None; e. Acquisition of individual real estate at costs of at least $300 million or 20% of the paid-in capital:
None; f. Disposal of individual real estate at prices of at least $300 million or 20% of the paid-in capital: None;
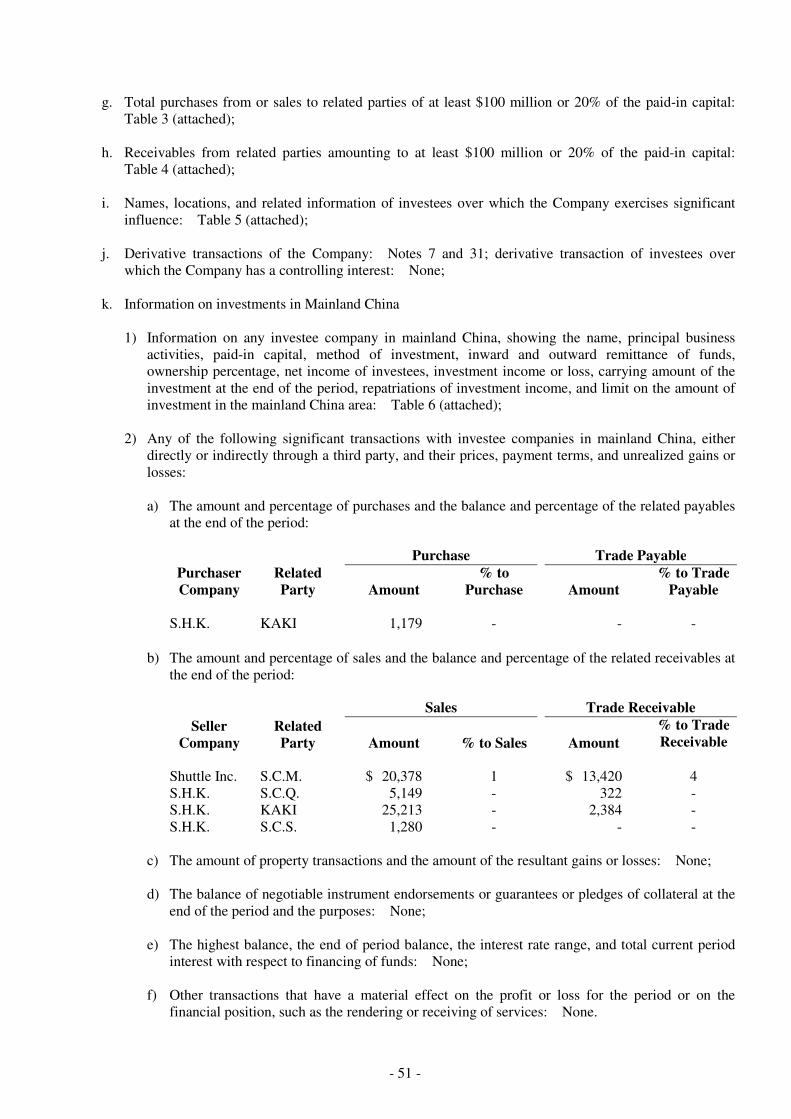
- 51 -
g. Total purchases from or sales to related parties of at least $100 million or 20% of the paid-in capital: Table 3 (attached);
h. Receivables from related parties amounting to at least $100 million or 20% of the paid-in capital:
Table 4 (attached); i. Names, locations, and related information of investees over which the Company exercises significant
influence: Table 5 (attached); j. Derivative transactions of the Company: Notes 7 and 31; derivative transaction of investees over
which the Company has a controlling interest: None; k. Information on investments in Mainland China
1) Information on any investee company in mainland China, showing the name, principal business activities, paid-in capital, method of investment, inward and outward remittance of funds, ownership percentage, net income of investees, investment income or loss, carrying amount of the investment at the end of the period, repatriations of investment income, and limit on the amount of investment in the mainland China area: Table 6 (attached);
2) Any of the following significant transactions with investee companies in mainland China, either
directly or indirectly through a third party, and their prices, payment terms, and unrealized gains or losses: a) The amount and percentage of purchases and the balance and percentage of the related payables
at the end of the period:
Purchase Trade Payable Purchaser Company
Related Party Amount
% to Purchase Amount
% to Trade Payable
S.H.K. KAKI 1,179 - - -
b) The amount and percentage of sales and the balance and percentage of the related receivables at
the end of the period:
Sales Trade Receivable
Seller Company
Related Party Amount % to Sales Amount
% to Trade Receivable
Shuttle Inc. S.C.M. $ 20,378 1 $ 13,420 4 S.H.K. S.C.Q. 5,149 - 322 - S.H.K. KAKI 25,213 - 2,384 - S.H.K. S.C.S. 1,280 - - -
c) The amount of property transactions and the amount of the resultant gains or losses: None; d) The balance of negotiable instrument endorsements or guarantees or pledges of collateral at the
end of the period and the purposes: None; e) The highest balance, the end of period balance, the interest rate range, and total current period
interest with respect to financing of funds: None; f) Other transactions that have a material effect on the profit or loss for the period or on the
financial position, such as the rendering or receiving of services: None.
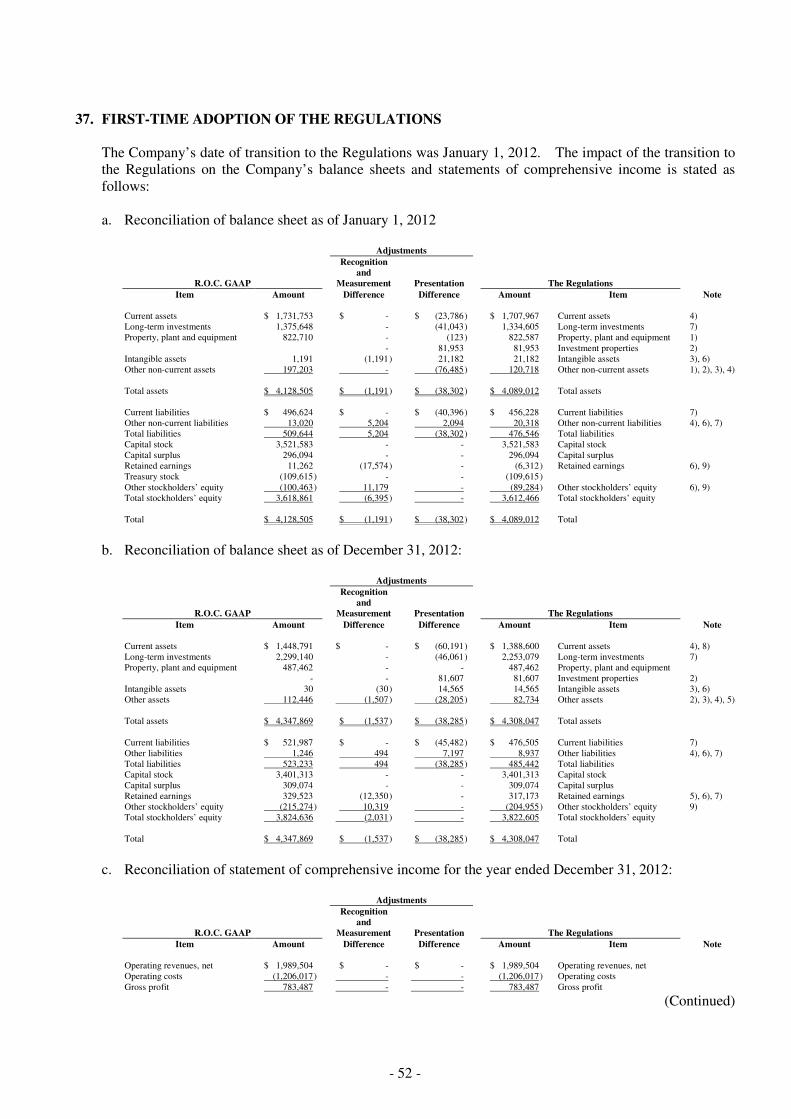
- 52 -
37. FIRST-TIME ADOPTION OF THE REGULATIONS
The Company’s date of transition to the Regulations was January 1, 2012. The impact of the transition to the Regulations on the Company’s balance sheets and statements of comprehensive income is stated as follows: a. Reconciliation of balance sheet as of January 1, 2012
Adjustments
Recognition
and R.O.C. GAAP Measurement Presentation The Regulations
Item Amount Difference Difference Amount Item Note Current assets $ 1,731,753 $ - $ (23,786 ) $ 1,707,967 Current assets 4) Long-term investments 1,375,648 - (41,043 ) 1,334,605 Long-term investments 7) Property, plant and equipment 822,710 - (123 ) 822,587 Property, plant and equipment 1) - 81,953 81,953 Investment properties 2) Intangible assets 1,191 (1,191 ) 21,182 21,182 Intangible assets 3), 6) Other non-current assets 197,203 - (76,485 ) 120,718 Other non-current assets 1), 2), 3), 4) Total assets $ 4,128,505 $ (1,191 ) $ (38,302 ) $ 4,089,012 Total assets Current liabilities $ 496,624 $ - $ (40,396 ) $ 456,228 Current liabilities 7) Other non-current liabilities 13,020 5,204 2,094 20,318 Other non-current liabilities 4), 6), 7) Total liabilities 509,644 5,204 (38,302 ) 476,546 Total liabilities Capital stock 3,521,583 - - 3,521,583 Capital stock Capital surplus 296,094 - - 296,094 Capital surplus Retained earnings 11,262 (17,574 ) - (6,312 ) Retained earnings 6), 9) Treasury stock (109,615 ) - - (109,615 ) Other stockholders’ equity (100,463 ) 11,179 - (89,284 ) Other stockholders’ equity 6), 9) Total stockholders’ equity 3,618,861 (6,395 ) - 3,612,466 Total stockholders’ equity Total $ 4,128,505 $ (1,191 ) $ (38,302 ) $ 4,089,012 Total
b. Reconciliation of balance sheet as of December 31, 2012:
Adjustments
Recognition
and R.O.C. GAAP Measurement Presentation The Regulations
Item Amount Difference Difference Amount Item Note Current assets $ 1,448,791 $ - $ (60,191 ) $ 1,388,600 Current assets 4), 8) Long-term investments 2,299,140 - (46,061 ) 2,253,079 Long-term investments 7) Property, plant and equipment 487,462 - - 487,462 Property, plant and equipment - - 81,607 81,607 Investment properties 2) Intangible assets 30 (30 ) 14,565 14,565 Intangible assets 3), 6) Other assets 112,446 (1,507 ) (28,205 ) 82,734 Other assets 2), 3), 4), 5) Total assets $ 4,347,869 $ (1,537 ) $ (38,285 ) $ 4,308,047 Total assets Current liabilities $ 521,987 $ - $ (45,482 ) $ 476,505 Current liabilities 7) Other liabilities 1,246 494 7,197 8,937 Other liabilities 4), 6), 7) Total liabilities 523,233 494 (38,285 ) 485,442 Total liabilities Capital stock 3,401,313 - - 3,401,313 Capital stock Capital surplus 309,074 - - 309,074 Capital surplus Retained earnings 329,523 (12,350 ) - 317,173 Retained earnings 5), 6), 7) Other stockholders’ equity (215,274 ) 10,319 - (204,955 ) Other stockholders’ equity 9) Total stockholders’ equity 3,824,636 (2,031 ) - 3,822,605 Total stockholders’ equity Total $ 4,347,869 $ (1,537 ) $ (38,285 ) $ 4,308,047 Total
c. Reconciliation of statement of comprehensive income for the year ended December 31, 2012:
Adjustments
Recognition
and
R.O.C. GAAP Measurement Presentation The Regulations
Item Amount Difference Difference Amount Item Note Operating revenues, net $ 1,989,504 $ - $ - $ 1,989,504 Operating revenues, net Operating costs (1,206,017 ) - - (1,206,017 ) Operating costs Gross profit 783,487 - - 783,487 Gross profit
(Continued)
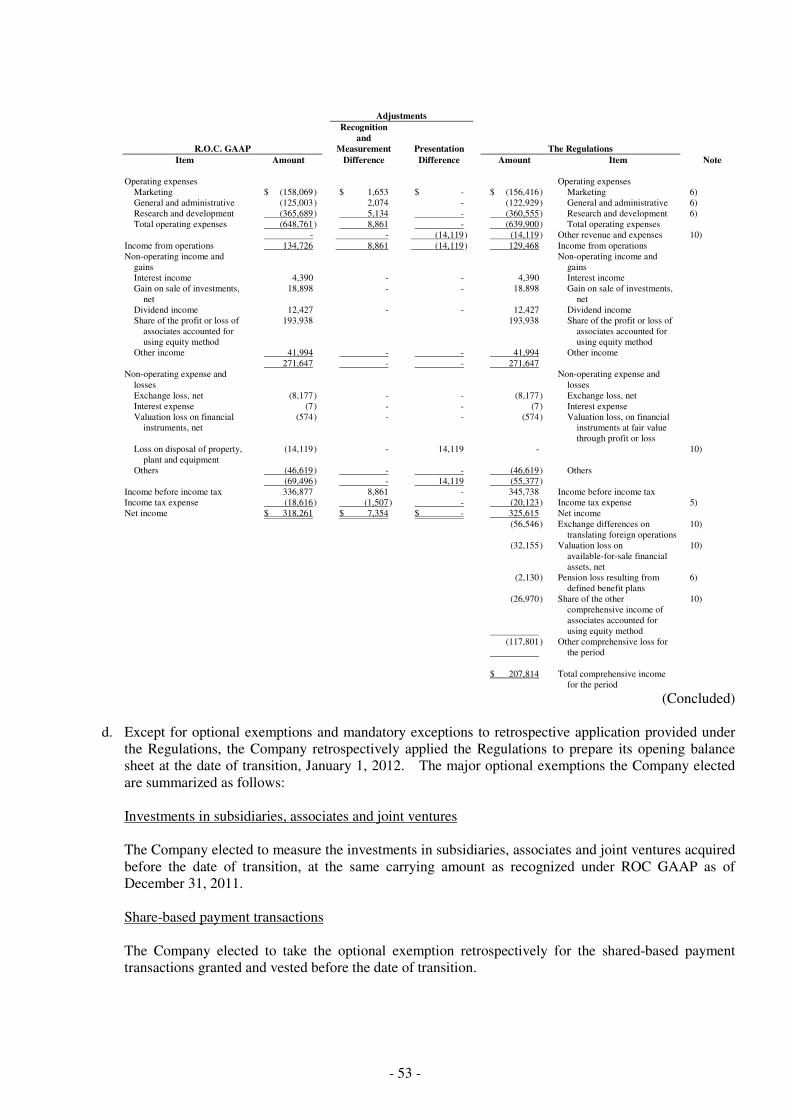
- 53 -
Adjustments
Recognition
and
R.O.C. GAAP Measurement Presentation The Regulations
Item Amount Difference Difference Amount Item Note Operating expenses Operating expenses
Marketing $ (158,069 ) $ 1,653 $ - $ (156,416 ) Marketing 6) General and administrative (125,003 ) 2,074 - (122,929 ) General and administrative 6) Research and development (365,689 ) 5,134 - (360,555 ) Research and development 6) Total operating expenses (648,761 ) 8,861 - (639,900 ) Total operating expenses
- - (14,119 ) (14,119 ) Other revenue and expenses 10) Income from operations 134,726 8,861 (14,119 ) 129,468 Income from operations Non-operating income and
gains Non-operating income and
gains
Interest income 4,390 - - 4,390 Interest income Gain on sale of investments,
net 18,898 - - 18,898 Gain on sale of investments,
net
Dividend income 12,427 - - 12,427 Dividend income Share of the profit or loss of
associates accounted for using equity method
193,938 193,938 Share of the profit or loss of associates accounted for using equity method
Other income 41,994 - - 41,994 Other income 271,647 - - 271,647 Non-operating expense and
losses Non-operating expense and
losses
Exchange loss, net (8,177 ) - - (8,177 ) Exchange loss, net Interest expense (7 ) - - (7 ) Interest expense Valuation loss on financial
instruments, net (574 ) - - (574 ) Valuation loss, on financial
instruments at fair value through profit or loss
Loss on disposal of property, plant and equipment
(14,119 ) - 14,119 -
10)
Others (46,619 ) - - (46,619 ) Others (69,496 ) - 14,119 (55,377 ) Income before income tax 336,877 8,861 - 345,738 Income before income tax Income tax expense (18,616 ) (1,507 ) - (20,123 ) Income tax expense 5) Net income $ 318,261 $ 7,354 $ - 325,615 Net income (56,546 ) Exchange differences on
translating foreign operations 10)
(32,155 ) Valuation loss on available-for-sale financial assets, net
10)
(2,130 ) Pension loss resulting from defined benefit plans
6)
(26,970 )
Share of the other comprehensive income of associates accounted for using equity method
10)
(117,801 )
Other comprehensive loss for the period
$ 207,814 Total comprehensive income
for the period
(Concluded)
d. Except for optional exemptions and mandatory exceptions to retrospective application provided under the Regulations, the Company retrospectively applied the Regulations to prepare its opening balance sheet at the date of transition, January 1, 2012. The major optional exemptions the Company elected are summarized as follows: Investments in subsidiaries, associates and joint ventures The Company elected to measure the investments in subsidiaries, associates and joint ventures acquired before the date of transition, at the same carrying amount as recognized under ROC GAAP as of December 31, 2011. Share-based payment transactions The Company elected to take the optional exemption retrospectively for the shared-based payment transactions granted and vested before the date of transition.
- 54 -
Employee benefits The Company elected to recognize all cumulative actuarial gains and losses in retained earnings as of the date of transition. In addition, the Company elected to apply the exemption disclosure requirement provided by the Regulations, in which the experience adjustments are determined for each accounting period prospectively from the transition date. Cumulative translation differences The Company elected to reset the cumulative translation differences to zero at the date of transition to the Regulations and adjusted retained earnings accordingly. Gains or losses of a subsequent disposal of any foreign operations will exclude the translation differences that arose before the date of transition to the Regulations.
e. Explanation for the adjustments of the Regulations transition:
1) Presentation of prepayments for equipment
Before transition to the Regulations, prepayments for equipment were classified under property, plant and equipment; after transition to the Regulations, prepayments for equipment should be classified as prepayment under non-current assets. On December 31, 2012 and January 1, 2012, the amount reclassified from property, plant and equipment to other assets was $0 thousand and $123 thousand, respectively.
2) Classification of investment properties As of December 31, 2012 and January 1, 2012, certain assets of the Company meet the definitions of IAS No. 40 “Investment Property” and were reclassified from other asset - leased assets to investment property in the amount of $81,607 thousand and $81,953 thousand, respectively.
3) Classification of deferred charges Before the transition to the Regulations, deferred charges are recorded as other assets; after the transition to the Regulations, they are reclassified as intangible assets. As of December 31, 2012 and January 1, 2012, deferred charges reclassified to intangible assets were $14,565 thousand and $21,182 thousand, respectively.
4) Classifications of deferred income tax asset/liability and valuation allowance Under R.O.C. GAAP, a deferred tax asset or liability is classified as current or non-current in accordance with the classification of its related asset or liability. However, if a deferred income tax asset or liability does not relate to an asset or liability in the financial statements, it is classified as either current or non-current based on the expected length of time before it is realized or settled. Under the Regulations, a deferred tax asset and liability is classified as non-current asset or liability and cannot be presented by offsetting each other. In addition, under R.O.C. GAAP, valuation allowances are provided to the extent, if any, that it is more likely than not that deferred income tax assets will not be realized. Under the Regulations, deferred tax assets are only recognized to the extent that it is probable that there will be sufficient taxable profits and the valuation allowance account is no longer used.
- 55 -
As of December 31, 2012 and January 1, 2012, deferred income tax assets reclassified to non-current assets was $60,191 thousand and $23,786 thousand, respectively, the Company reclassified deferred tax liabilities $7,776 thousand and $2,741 thousand, respectively, which have been offset with deferred tax assets under R.O.C. GAAP to deferred tax liabilities.
5) Income tax According to IAS No. 12 “Income Taxes”, the Company shall adjust related income tax accounts (income tax expense or benefit, deferred income tax assets or liabilities), due to transition to the Regulations. For year ended December 31, 2012, the Company increased income tax expense by $1,507 thousand, due to transition to the Regulations (decreased by $1,507 thousand in deferred tax assets.)
6) Employee benefits The Company had previously applied an actuarial valuation on its defined benefit obligation and recognized the related pension cost and retirement benefit obligation in conformity with R.O.C. GAAP. Under the Regulations, the Company should carry out actuarial valuation on defined benefit obligation in accordance with IAS No. 19, “Employee Benefits.” Further, the Company elected to recognize pension gains (losses), resulting from defined benefit plans as other comprehensive income immediately and subsequent reclassification to earnings is not permitted. In addition, under R.O.C. GAAP, unrecognized transition net assets or obligations should be amortized on a straight-line basis over the employee’s expected remaining service period. Under the Regulations, the unrecognized transition net obligations generated according to R.O.C. GAAP should be zero at the transition date. Due to the transition to the Regulations, as of December 31, 2012 and January 1, 2012, accrued pension cost (recorded as other liabilities), increased by $494 thousand and $5,204 thousand, respectively; deferred pension costs decreased by $30 thousand and $1,191 thousand, respectively; retained earnings decreased by $7,255 thousand; and net loss not recognized as pension cost decreased by $0 thousand and $860 thousand, respectively. For year ended December 31, 2012, pension cost decreased by $8,861 thousand; marketing expense decreased by $1,653 thousand; general and administrative expense decreased by $2,074 thousand; and research and development expense decreased by $5,134 thousand; and actuarial loss arising from defined benefit plan increased by $2,130 thousand.
7) Unrealized gain or loss on transactions with associates
Before the transition to the Regulations, unrealized gain or loss on transactions with associates are recorded as other current or non-current liabilities; after the transition to the Regulations, they are reclassified as reduction of Investments accounted for using equity method. On December 31, 2012, the amounts of current and non-current liabilities reclassified as reduction of Investments accounted for using equity method were $45,482 thousand and $579 thousand, respectively; on January 1, 2012, the amounts of current and non-current liabilities reclassified as reduction of Investments accounted for using equity method were $40,396 thousand and $647 thousand, respectively.
8) Time deposits with maturities of more than three months
Under ROC GAAP, cash and cash equivalents includes time deposits that are cancellable but without any loss of principal. Under the Regulations, the time deposits with periods of over three months were under other financial assets - current because there is fixed or determinable payments that are not quoted in an active market.
- 56 -
As of December 31, 2012 and January 1, 2012, time deposits with maturities of more than three months reclassified to other financial assets - current was $40,396 thousand and $647 thousand, respectively.
9) Cumulative translation differences The Company elected to record all cumulative translation adjustments as zero and recognized as retained earnings at the date of transition to the Regulations. As of December 31, 2012 and January 1, 2012, cumulative translation adjustments (recorded as other equity), both increased by $10,319 thousand and both retained earnings decreased by $10,319 thousand.
10) Presentation of statement of comprehensive income Under the Regulations, statement of comprehensive income included current year net income and other comprehensive income. Certain accounts in the financial statements have been reclassified to conform to the presentation of financial statements under the Regulations.
11) Deemed costs of property, plant and equipment, investment properties and intangible assets. The Company elected to measure its property, plant and equipment, investment properties and other intangible assets at the date of transition to the Regulations at cost model under the Regulations and used the carrying amounts as the deemed cost.
12) Explanation of material adjustments to the statement of cash flows. According to ROC GAAP, interest paid and received and dividends received are classified as operating activities while dividends paid are classified as financing activities. Additional disclosure is required for interest expenses when reporting cash flow using indirect method. However, under the Regulations, cash flows from interest and dividends received and paid shall each be disclosed separately. Each shall be classified in a consistent manner from period to period as operating, investing or financing activities. Therefore, interests and dividends received by the Company of $4,445 thousand and $12,427 thousand, respectively, for the year ended December 31, 2012 were presented separately at the date of transition to the Regulations.
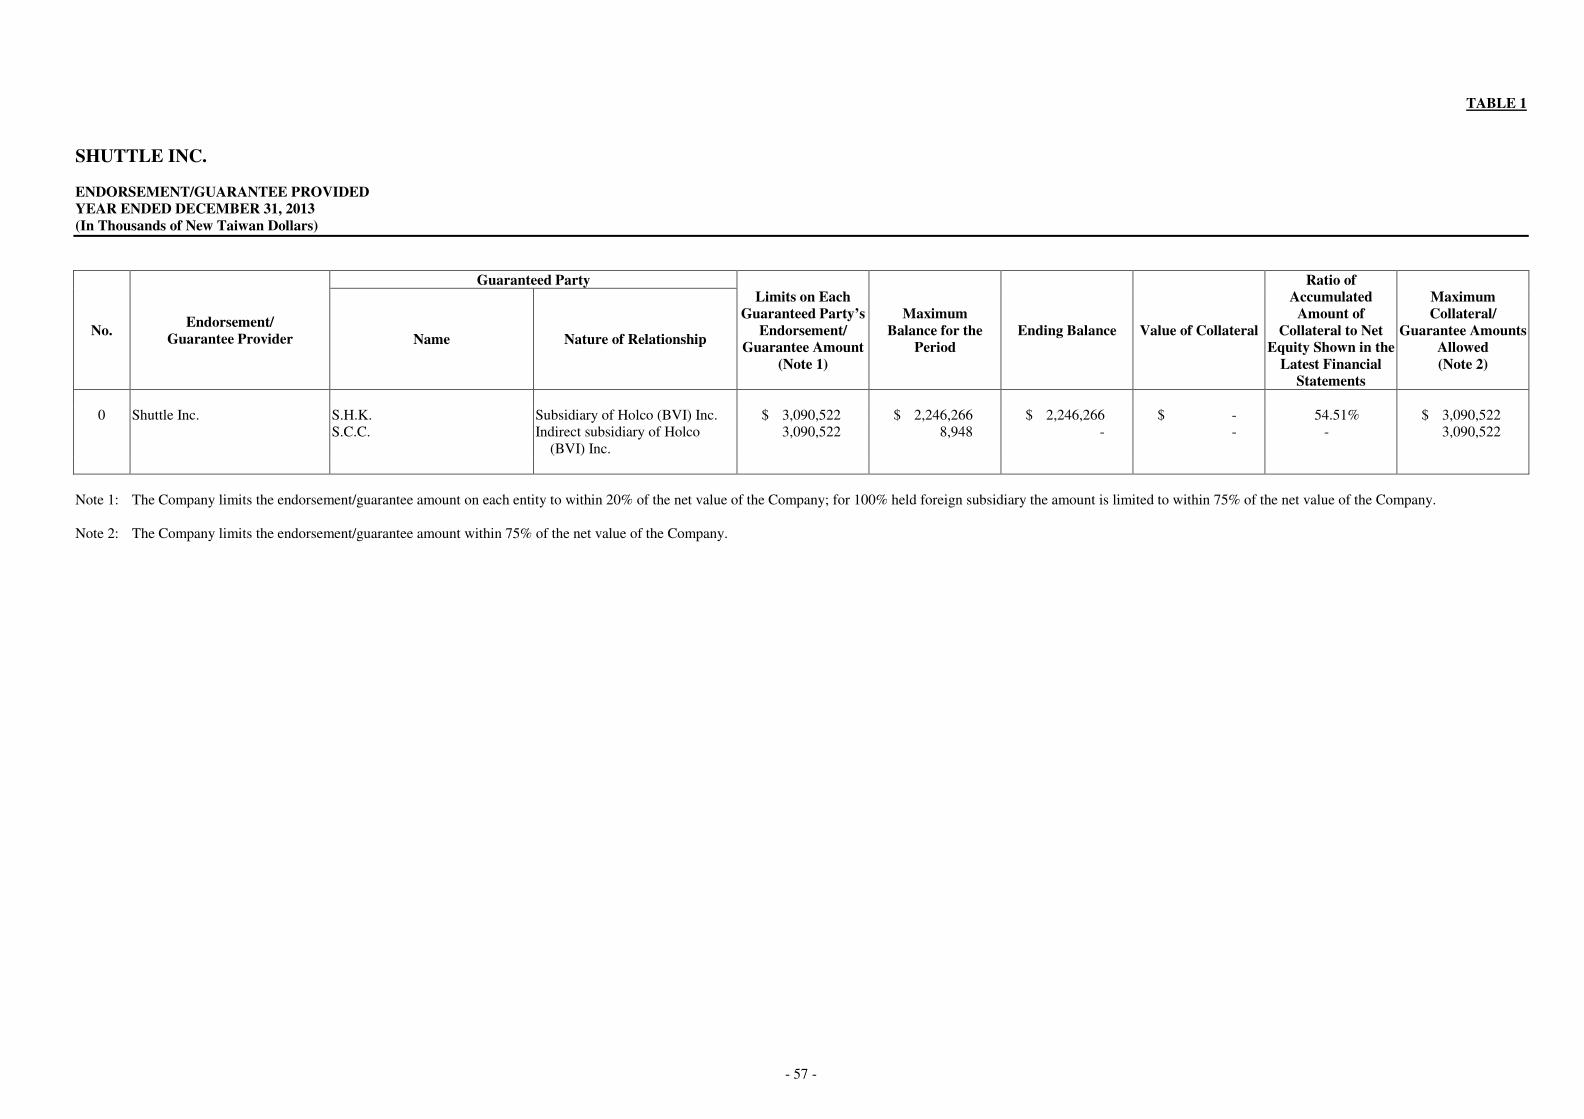
- 57 -
TABLE 1
SHUTTLE INC. ENDORSEMENT/GUARANTEE PROVIDED YEAR ENDED DECEMBER 31, 2013 (In Thousands of New Taiwan Dollars)
No. Endorsement/
Guarantee Provider
Guaranteed Party Limits on Each
Guaranteed Party’s Endorsement/
Guarantee Amount (Note 1)
Maximum Balance for the
Period Ending Balance Value of Collateral
Ratio of Accumulated
Amount of Collateral to Net
Equity Shown in the Latest Financial
Statements
Maximum Collateral/
Guarantee Amounts Allowed (Note 2)
Name Nature of Relationship
0 Shuttle Inc. S.H.K. Subsidiary of Holco (BVI) Inc. $ 3,090,522 $ 2,246,266 $ 2,246,266 $ - 54.51% $ 3,090,522 S.C.C. Indirect subsidiary of Holco
(BVI) Inc. 3,090,522 8,948 - - - 3,090,522
Note 1: The Company limits the endorsement/guarantee amount on each entity to within 20% of the net value of the Company; for 100% held foreign subsidiary the amount is limited to within 75% of the net value of the Company. Note 2: The Company limits the endorsement/guarantee amount within 75% of the net value of the Company.
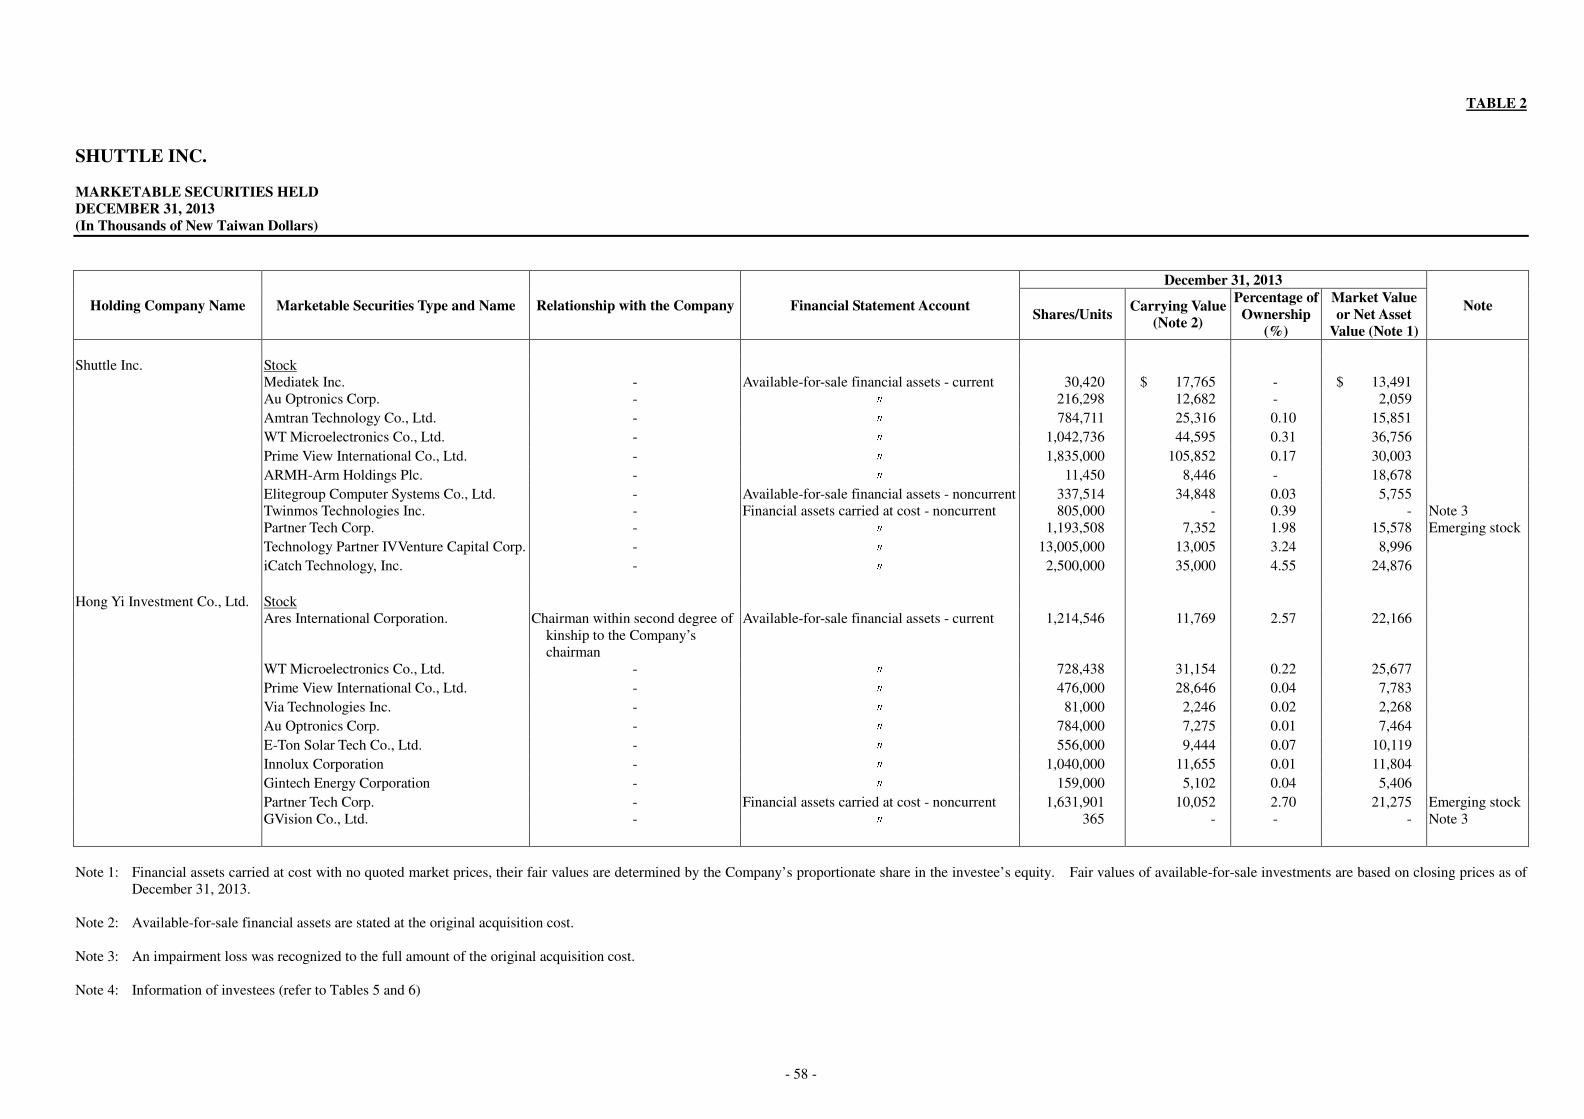
- 58 -
TABLE 2
SHUTTLE INC. MARKETABLE SECURITIES HELD DECEMBER 31, 2013 (In Thousands of New Taiwan Dollars)
Holding Company Name Marketable Securities Type and Name Relationship with the Company Financial Statement Account
December 31, 2013
Note Shares/Units
Carrying Value (Note 2)
Percentage of Ownership
(%)
Market Value or Net Asset
Value (Note 1) Shuttle Inc. Stock Mediatek Inc. - Available-for-sale financial assets - current 30,420 $ 17,765 - $ 13,491 Au Optronics Corp. - 〃 216,298 12,682 - 2,059
Amtran Technology Co., Ltd. - 〃 784,711 25,316 0.10 15,851
WT Microelectronics Co., Ltd. - 〃 1,042,736 44,595 0.31 36,756
Prime View International Co., Ltd. - 〃 1,835,000 105,852 0.17 30,003
ARMH-Arm Holdings Plc. - 〃 11,450 8,446 - 18,678
Elitegroup Computer Systems Co., Ltd. - Available-for-sale financial assets - noncurrent 337,514 34,848 0.03 5,755 Twinmos Technologies Inc. - Financial assets carried at cost - noncurrent 805,000 - 0.39 - Note 3 Partner Tech Corp. - 〃 1,193,508 7,352 1.98 15,578 Emerging stock
Technology Partner IVVenture Capital Corp. - 〃 13,005,000 13,005 3.24 8,996
iCatch Technology, Inc. - 〃 2,500,000 35,000 4.55 24,876
Hong Yi Investment Co., Ltd. Stock Ares International Corporation. Chairman within second degree of
kinship to the Company’s chairman
Available-for-sale financial assets - current 1,214,546 11,769 2.57 22,166
WT Microelectronics Co., Ltd. - 〃 728,438 31,154 0.22 25,677
Prime View International Co., Ltd. - 〃 476,000 28,646 0.04 7,783
Via Technologies Inc. - 〃 81,000 2,246 0.02 2,268
Au Optronics Corp. - 〃 784,000 7,275 0.01 7,464
E-Ton Solar Tech Co., Ltd. - 〃 556,000 9,444 0.07 10,119
Innolux Corporation - 〃 1,040,000 11,655 0.01 11,804
Gintech Energy Corporation - 〃 159,000 5,102 0.04 5,406
Partner Tech Corp. - Financial assets carried at cost - noncurrent 1,631,901 10,052 2.70 21,275 Emerging stock GVision Co., Ltd. - 〃 365 - - - Note 3
Note 1: Financial assets carried at cost with no quoted market prices, their fair values are determined by the Company’s proportionate share in the investee’s equity. Fair values of available-for-sale investments are based on closing prices as of
December 31, 2013. Note 2: Available-for-sale financial assets are stated at the original acquisition cost. Note 3: An impairment loss was recognized to the full amount of the original acquisition cost. Note 4: Information of investees (refer to Tables 5 and 6)
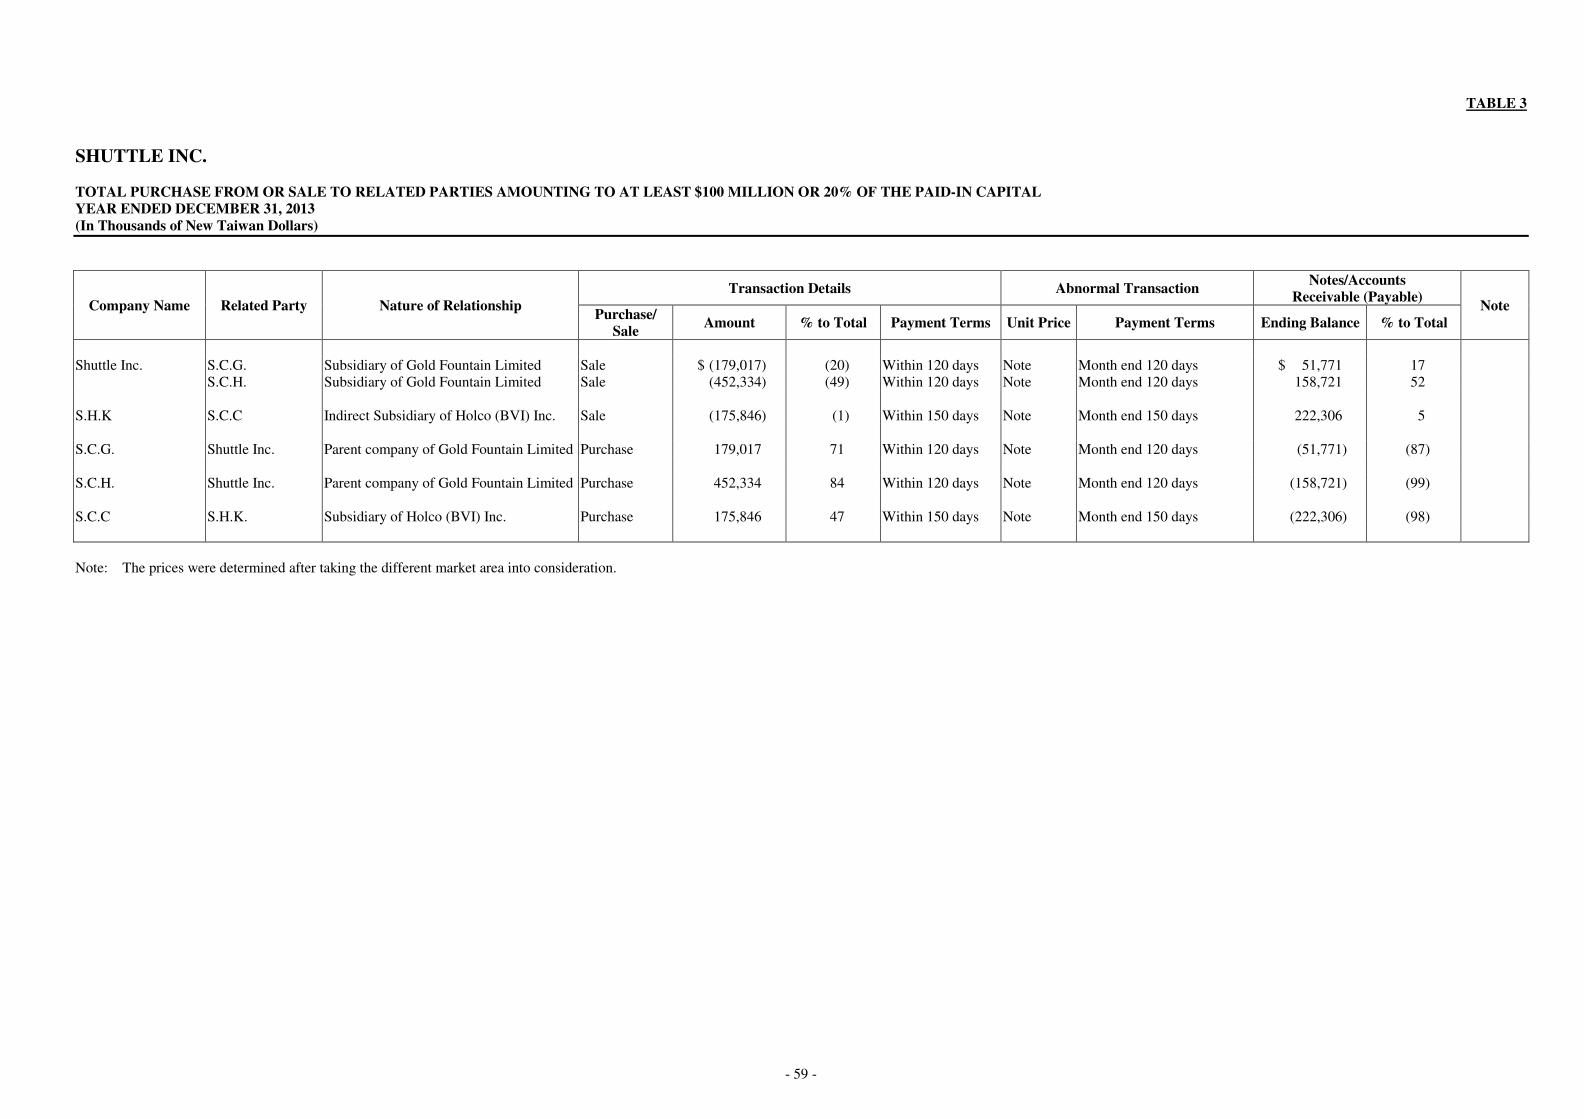
- 59 -
TABLE 3
SHUTTLE INC. TOTAL PURCHASE FROM OR SALE TO RELATED PARTIES AMOUNTING TO AT LEAST $100 MILLION OR 20% OF THE PAID-IN CAPITAL YEAR ENDED DECEMBER 31, 2013 (In Thousands of New Taiwan Dollars)
Company Name Related Party Nature of Relationship Transaction Details Abnormal Transaction
Notes/Accounts Receivable (Payable)
Note Purchase/
Sale Amount % to Total Payment Terms Unit Price Payment Terms Ending Balance % to Total
Shuttle Inc. S.C.G. Subsidiary of Gold Fountain Limited Sale $ (179,017) (20) Within 120 days Note Month end 120 days $ 51,771 17 S.C.H. Subsidiary of Gold Fountain Limited Sale (452,334) (49) Within 120 days Note Month end 120 days 158,721 52 S.H.K S.C.C Indirect Subsidiary of Holco (BVI) Inc. Sale (175,846) (1) Within 150 days Note Month end 150 days 222,306 5 S.C.G. Shuttle Inc. Parent company of Gold Fountain Limited Purchase 179,017 71 Within 120 days Note Month end 120 days (51,771) (87) S.C.H. Shuttle Inc. Parent company of Gold Fountain Limited Purchase 452,334 84 Within 120 days Note Month end 120 days (158,721) (99) S.C.C S.H.K. Subsidiary of Holco (BVI) Inc. Purchase 175,846 47 Within 150 days Note Month end 150 days (222,306) (98)
Note: The prices were determined after taking the different market area into consideration.
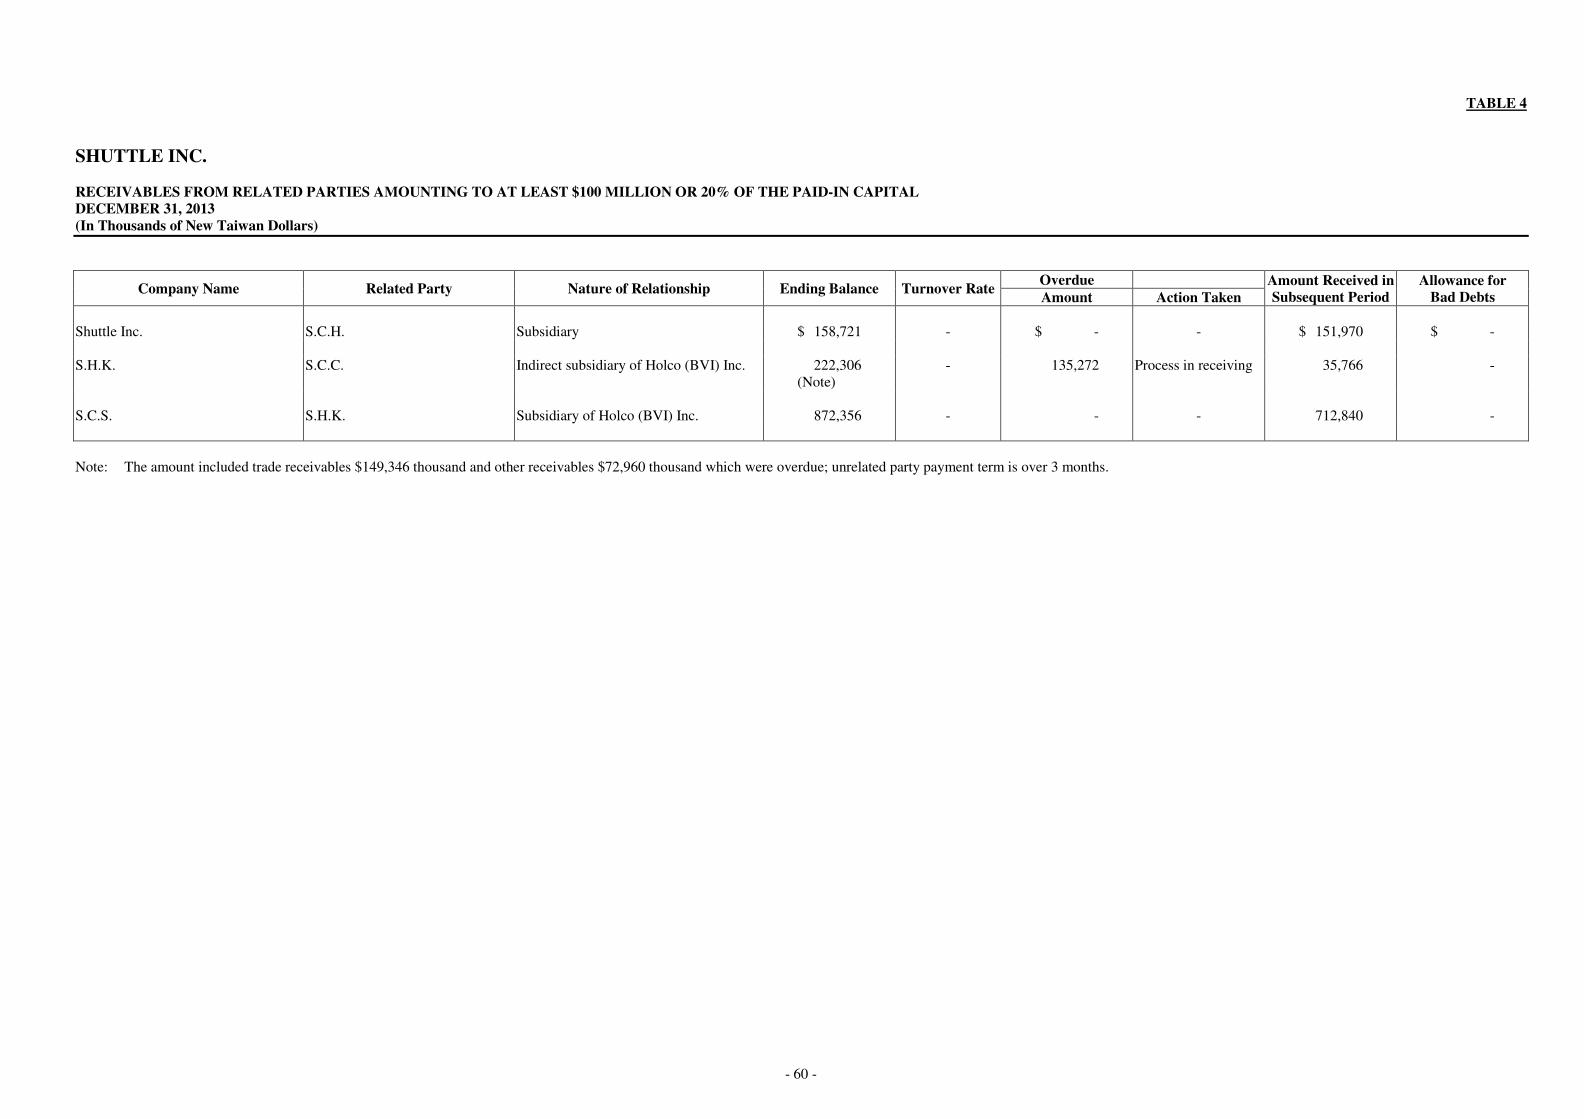
- 60 -
TABLE 4
SHUTTLE INC. RECEIVABLES FROM RELATED PARTIES AMOUNTING TO AT LEAST $100 MILLION OR 20% OF THE PAID-IN CAPITAL DECEMBER 31, 2013 (In Thousands of New Taiwan Dollars)
Company Name Related Party Nature of Relationship Ending Balance Turnover Rate Overdue Amount Received in
Subsequent Period Allowance for
Bad Debts Amount Action Taken Shuttle Inc. S.C.H. Subsidiary $ 158,721 - $ - - $ 151,970 $ - S.H.K. S.C.C. Indirect subsidiary of Holco (BVI) Inc. 222,306
(Note) - 135,272 Process in receiving 35,766 -
S.C.S. S.H.K. Subsidiary of Holco (BVI) Inc. 872,356 - - - 712,840 -
Note: The amount included trade receivables $149,346 thousand and other receivables $72,960 thousand which were overdue; unrelated party payment term is over 3 months.
- 61 -
TABLE 5
SHUTTLE INC. NAMES, LOCATIONS, AND OTHER INFORMATION OF INVESTEES ON WHICH THE COMPANY EXERCISES SIGNIFICANT INFLUENCE YEAR ENDED DECEMBER 31, 2013 (In Thousands of New Taiwan Dollars)
Investor Investee Location Main Businesses and
Products
Investment Amount Balance as of December 31, 2013 Net Income (Loss) of
the Investee Investment Gain
(Loss) Note
December 31, 2013 December 31, 2012 Shares Percentage of
Ownership Carrying Value
Shuttle Inc. Holco (BVI) Inc. B.V.I. Holding company $ 1,551,896 $ 1,436,402 5,210 100 $ 2,115,643 $ 371,684 $ 371,684 Subsidiary;
Note 1 Gold Fountain Limited Cayman Islands Holding company 840,147 844,564 19,375,886 100 509,180 16,573 16,573 Subsidiary;
Note 1 Hong Yi Investment Co., Ltd. 1F., No. 30, Ln. 76, Ruiguang Rd.,
Neihu Dist., Taipei City Investment 160,000 160,000 16,000,000 100 137,623 5,194 5,194 Subsidiary;
Note 1 Shuttle Computer
Incorporation 1F., No. 30, Ln. 76, Ruiguang Rd.,
Neihu Dist., Taipei City Selling of computer
peripherals - 50,000 - - - - - Subsidiary;
Notes 1 and 3 Holco (BVI) Inc. S.H.K. Unit 511 5/F, Tower 1 Silvercord 30
Canton Road Kl Selling of computer
peripherals 1,502,008 1,364,813 - 100 2,126,378 436,154 436,154 Indirect
subsidiary; Note 1
S.C.A. 48389 Fremont Blvd Ste 110 Fremont CA 94538-6558
Selling of computer peripherals
25,737 25,737 - 100 25,339 1,561 1,561 Indirect subsidiary; Note 1
KAKI 2F, West Wing, Guanghua Building, Terra 8th Road, Futian District, Shenzhen
Selling of computer peripherals
43,024 43,024 - 75 - (18,280) (13,710) Indirect subsidiary; Notes 1,and 5
Atron Mall, Inc. 17068 Evergreen PL, City of Industry, CA 91745 U.S.A.
Holding company 7,834 7,834 197,500 100 - (52,427) (52,427) Indirect subsidiary; Notes 1 and 5
Gold Fountain Limited S.C.G. 17068 Evergreen Place Industry, CA
91745 U.S.A. Selling of computer
peripherals 186,662 186,662 30,000 100 96,680 (26,600) (26,600) Indirect
subsidiary; Note 1
S.C.H. Fritz-Strassmann Str. 5 D-25337 Elmshorn, Germany
Selling of computer peripherals
239,815 239,815 - 100 174,377 4,840 4,840 Indirect subsidiary; Note 1
Shuttle International Brazil Informatica Ltda.
Avenida Brigadeiro Faria Lima, 1903-CJ. 143 - Jardim Paulist Ano
Selling of computer peripherals
10,624 10,624 638,085 100 4,773 (2,986) (2,986) Indirect subsidiary; Note 1
S.C.M. 6H, West Wing, No. 210 Bldg Terra Technical & Commercial Garden, Terra 4th Road, Shenzhen
Selling of computer peripherals
40,457 40,457 - 100 4,893 5,291 5,291 Indirect subsidiary; Note 1
S.C.J. 7F, Aioisonpo Building, 2-8-11 Sumiyosi Koutou-Ku Tokyo 135-0002, Japan
Selling of computer peripherals
34,658 34,658 1,000 100 19,393 1,762 1,762 Indirect subsidiary; Notes 1
S.C.E. D26, 8 Floor, No. 210 Bldg Terra Technical & Commercial Garden, Terra 4th Road, Shenzhen
Selling of computer peripherals
- 25,736 - - - - - Indirect subsidiary; Notes 1 and 4
S.C.Q. No. 520, Haoteng Road, Development Zone, Kunshan Jiangsu P.R. China
Selling of computer peripherals
32,010 32,010 - 100 27,522 (653) (653) Indirect subsidiary; Note 1
S.C.S. No. 200, Central Suhong Rd. Integrated Free Trade Zone, Suzhou Industrial Park
Selling of computer peripherals
215,745 215,745 - 100 206,184 35,049 35,049 Indirect subsidiary; Note 1
(Continued)
- 62 -
Investor Investee Location Main Businesses and
Products
Investment Amount Balance as of December 31, 2013 Net Income (Loss) of
the Investee Investment Gain
(Loss) Note
December 31, 2013 December 31, 2012 Shares Percentage of
Ownership Carrying Value
Atron Mall, Inc. S.C.C. Santa Clara 301 of 2806 Hue Churaba,
Santiago, Chile Selling of computer
peripherals $ 5,440 $ 5,440 - 75 $ - $ (69,792) $ (52,344) Indirect
subsidiary; Notes 1,and 5
S.C.S. Shanghai Wiwin Information
Technology Co., Ltd. Room 203, No. 10, Lane 198,
Zhangheng Rd., Zhongjiang Hi-Tech Park Shanghai 201203, China
Selling of computer peripherals
7,495 7,495 - 30 - (3,517) (1,055) Notes 2 and 6
Note 1: Recognition of investment gains (losses) was based on the investee’s audited financial statements. Note 2: Recognition of investment gains (losses) was based on the investee’s unaudited financial statements. Note 3: Shuttle Computer liquidated and returned all shares to Shuttle on March 2013. Note 4: S.C.E. liquidated and returned all shares to shuttle on September 2013. Note 5: The accumulated book value of KAKI, Atron Mall, Inc, and S.C.C. had a credit amount of $1,174 thousand, $39,050 thousand and $39,390 thousand as of December 31, 2013, respectively, and was classified as other liabilities. Note 6: S.C.S. recognized impairment loss on its investments in Shanghai Wiwin Information Technology Co., Ltd. on September 2013.
(Concluded)
- 63 -
TABLE 6
SHUTTLE INC. INVESTMENT IN MAINLAND CHINA YEAR ENDED DECEMBER 31, 2013 (In Thousands of New Taiwan Dollars)
Investee Company Main Businesses and Products Total Amount
of Paid-in Capital
Investment Type
Accumulated Outflow of Investment
from Taiwan as of
January 1, 2013
Investment Flows Accumulated Outflow of Investment
from Taiwan as of
December 31, 2013
Net Income (Loss) of the
Investee
Percentage of
Ownership in
Investment
Investment Gain (Loss)
(Note 2)
Carrying Value as of
December 31, 2013
Accumulated Inward
Remittance of Earnings as of December 31,
2013
Outflow Inflow
S.C.M. Selling of computer peripherals $ 40,457 (Note 1) $ 40,457 $ - $ - $ 40,457 $ 5,291 100 $ 5,291 $ 4,893 $ - S.C.E. Selling of computer peripherals 25,736 (Note 1) 25,736 - - 25,736
(Note 5) - - - - -
S.C.Q. Selling of computer peripherals 32,010 (Note 1) 32,010 - - 32,010 (653) 100 (653) 27,522 - S.C.S. Selling of computer peripherals 215,745 (Note 1) 215,745 - - 215,745 35,049 100 35,049 206,184 - KAKI Selling of computer peripherals 57,125 (Note 1) 43,024 - - 43,024 (18,280) 75 (13,710) -
(Note 3) -
Accumulated Investment in Mainland China as of December 31, 2013
Investment Amounts Authorized by Investment Commission, MOEA
Upper Limit on Investment (Note 4)
$364,593 US$16,750,000 $4,270,711 × 60% = $2,562,427
Note 1: Investments were through a holding company registered in a third region. Note 2: The investee companies were calculated on audited financial statements for the same period. Note 3: The accumulated book value had a credit amount of $1,174 thousand as of December 31, 2013 and was classified as other liabilities. Note 4: Subject to 60% of net asset value of GUC according to the revised “Guidelines Governing the Approval of Investment or Technical Cooperation in Mainland China” issued by the Investment Commission. Note 5: S.C.E. liquidated and returned all shares to shuttle on September 2013.