Embed Size (px)
Citation preview

VTTI
Dri
vin
g T
ran
sp
ort
atio
n w
ith
Te
ch
no
log
y
SHRP 2 L10: Project Summary, Results and Recommendations
Work performed by:
Virginia Tech Transportation Institute Center for
Sustainable Mobility and SAIC
Presented by: Hesham Rakha
Professor, Charles E. Via Jr. Dept. of CEE at Virginia Tech
Director, Center for Sustainable Mobility at VTTI
VTTI
Dri
vin
g T
ran
sp
ort
atio
n w
ith
Te
ch
no
log
y
Project FindingsSHRP 2 L10 Slide 2
Presentation Outline
� Study objective
� Study approach
� Datasets
� Proposed approach for modeling travel time reliability
� Study findings
� Study recommendations
VTTI
Dri
vin
g T
ran
sp
ort
atio
n w
ith
Te
ch
no
log
y
Project FindingsSHRP 2 L10 Slide 3
Study Objective
� Determine the feasibility of using in-vehicle video data to make inferences about driver behavior that would allow investigation of the relationship between observable driver behavior and non-recurring congestion to improve travel time reliability
VTTI
Dri
vin
g T
ran
sp
ort
atio
n w
ith
Te
ch
no
log
y
Project FindingsSHRP 2 L10 Slide 4
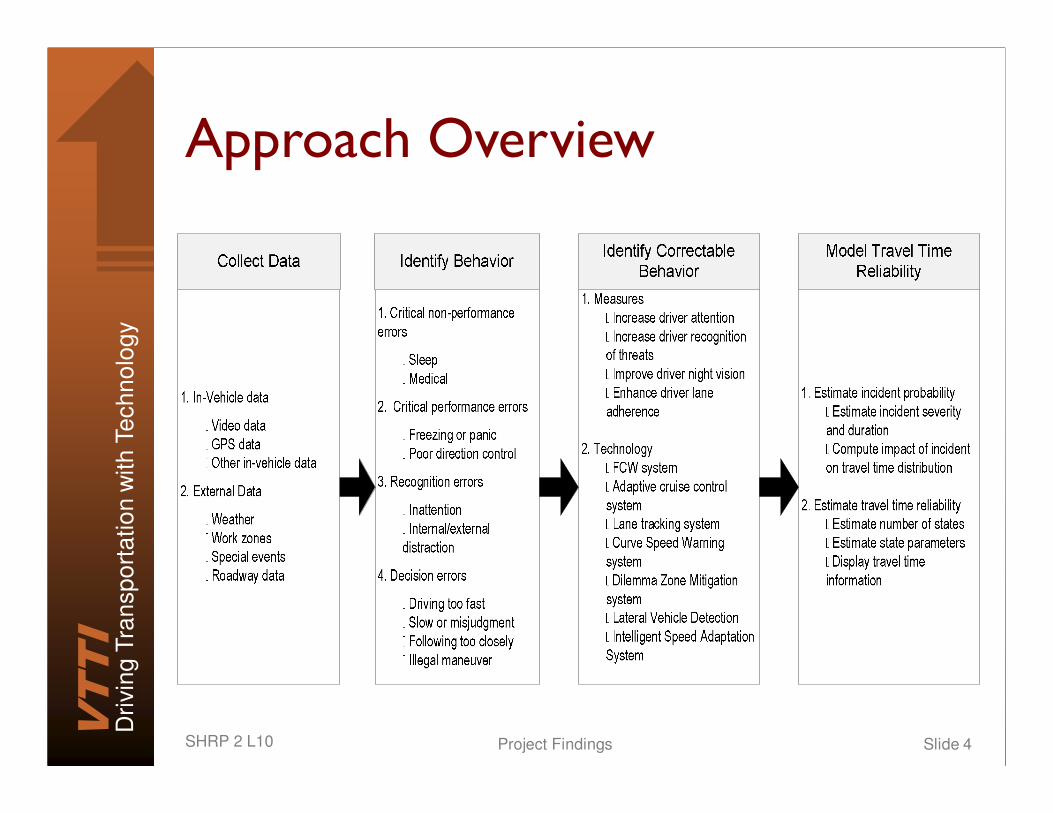
Approach Overview
VTTI
Dri
vin
g T
ran
sp
ort
atio
n w
ith
Te
ch
no
log
y
Project FindingsSHRP 2 L10 Slide 5
VTTI
Dri
vin
g T
ran
sp
ort
atio
n w
ith
Te
ch
no
log
y
Project FindingsSHRP 2 L10 Slide 6
Dataset Findings
� Key domestic and international studies where in-vehicle video cameras were used to collect data were investigated
• A total of 16 datasets were initially identified
• Studies ranged from 1997 to 2010
� A list of qualified data sets was identified for further data reduction and analysis
• This list was composed of 7 studies
• The studies were then rated based on several criteria
VTTI
Dri
vin
g T
ran
sp
ort
atio
n w
ith
Te
ch
no
log
y
Project FindingsSHRP 2 L10 Slide 7
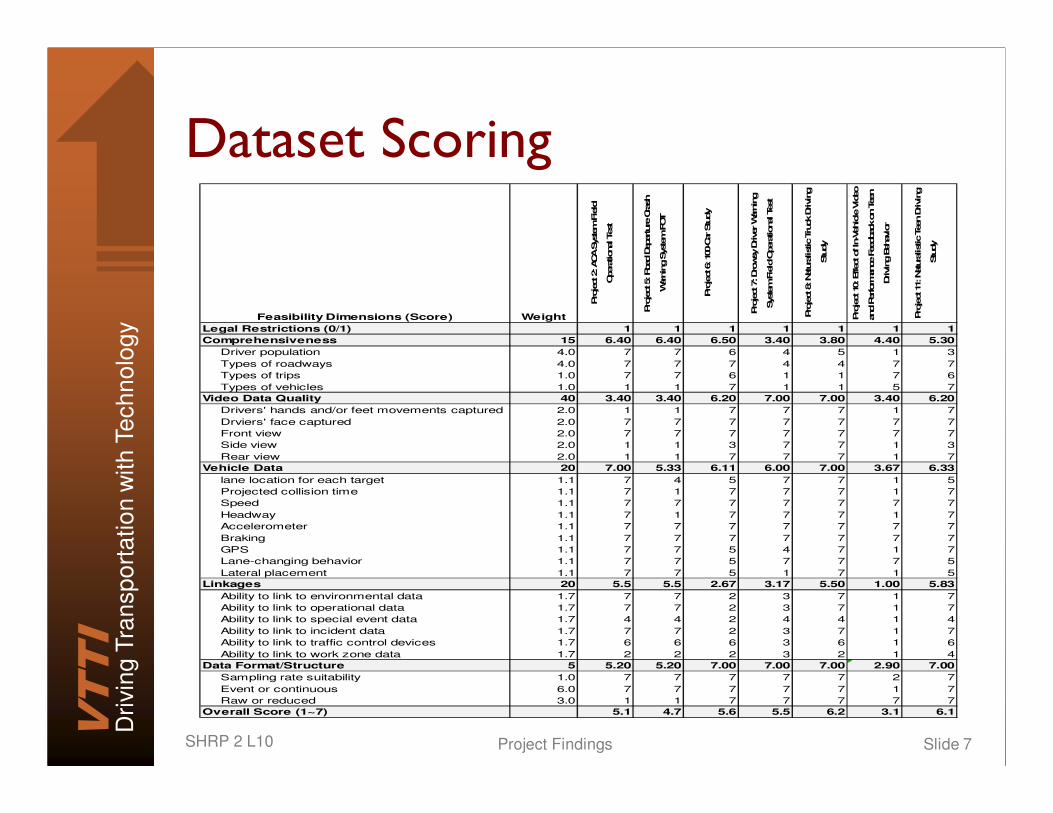
Dataset Scoring
Feasibility Dimensions (Score) Weight
Pro
ject 2: ACA S
ystem
Field
Opera
tional Test
Pro
ject 5: Road D
eparture
Cra
sh
Warn
ing S
ystem
FOT
Pro
ject 6: 100-C
ar Stu
dy
Pro
ject 7: Dro
wsy D
river W
arn
ing
System
Field
Opera
tional Test
Pro
ject 8: Natu
ralistic T
ruck D
rivin
g
Stu
dy
Pro
ject 10: Effect of In
-Vehicle V
ideo
and P
erform
ance F
eedback o
n T
een
Drivin
g B
ehavio
r
Pro
ject 11: Natu
ralistic T
een D
rivin
g
Stu
dy
Legal Restrictions (0/1) 1 1 1 1 1 1 1
Comprehensiveness 15 6.40 6.40 6.50 3.40 3.80 4.40 5.30
Driver population 4.0 7 7 6 4 5 1 3
Types of roadways 4.0 7 7 7 4 4 7 7
Types of trips 1.0 7 7 6 1 1 7 6
Types of vehicles 1.0 1 1 7 1 1 5 7
Video Data Quality 40 3.40 3.40 6.20 7.00 7.00 3.40 6.20
Drivers' hands and/or feet movements captured 2.0 1 1 7 7 7 1 7
Drviers' face captured 2.0 7 7 7 7 7 7 7
Front view 2.0 7 7 7 7 7 7 7
Side view 2.0 1 1 3 7 7 1 3
Rear view 2.0 1 1 7 7 7 1 7
Vehicle Data 20 7.00 5.33 6.11 6.00 7.00 3.67 6.33
lane location for each target 1.1 7 4 5 7 7 1 5
Projected collision time 1.1 7 1 7 7 7 1 7
Speed 1.1 7 7 7 7 7 7 7
Headway 1.1 7 1 7 7 7 1 7
Accelerometer 1.1 7 7 7 7 7 7 7
Braking 1.1 7 7 7 7 7 7 7
GPS 1.1 7 7 5 4 7 1 7
Lane-changing behavior 1.1 7 7 5 7 7 7 5
Lateral placement 1.1 7 7 5 1 7 1 5
Linkages 20 5.5 5.5 2.67 3.17 5.50 1.00 5.83
Ability to link to environmental data 1.7 7 7 2 3 7 1 7
Ability to link to operational data 1.7 7 7 2 3 7 1 7
Ability to link to special event data 1.7 4 4 2 4 4 1 4
Ability to link to incident data 1.7 7 7 2 3 7 1 7
Ability to link to traffic control devices 1.7 6 6 6 3 6 1 6
Ability to link to work zone data 1.7 2 2 2 3 2 1 4
Data Format/Structure 5 5.20 5.20 7.00 7.00 7.00 2.90 7.00
Sampling rate suitability 1.0 7 7 7 7 7 2 7
Event or continuous 6.0 7 7 7 7 7 1 7
Raw or reduced 3.0 1 1 7 7 7 7 7
Overall Score (1~7) 5.1 4.7 5.6 5.5 6.2 3.1 6.1
VTTI
Dri
vin
g T
ran
sp
ort
atio
n w
ith
Te
ch
no
log
y
Project FindingsSHRP 2 L10 Slide 8
Data Reduction: Overview100-Car Study
� Dataset 7 Terabytes
� Critical events identified using pre-defined trigger criteria values
� Event video data were reviewed
• 90-s epoch for each event (from 60 s prior)
� Valid events were classified
• non-conflict, proximity events, crash-relevant, near-crash, and crash
• 69 crashes and 761 near-crashes identified
VTTI
Dri
vin
g T
ran
sp
ort
atio
n w
ith
Te
ch
no
log
y
Project FindingsSHRP 2 L10 Slide 9
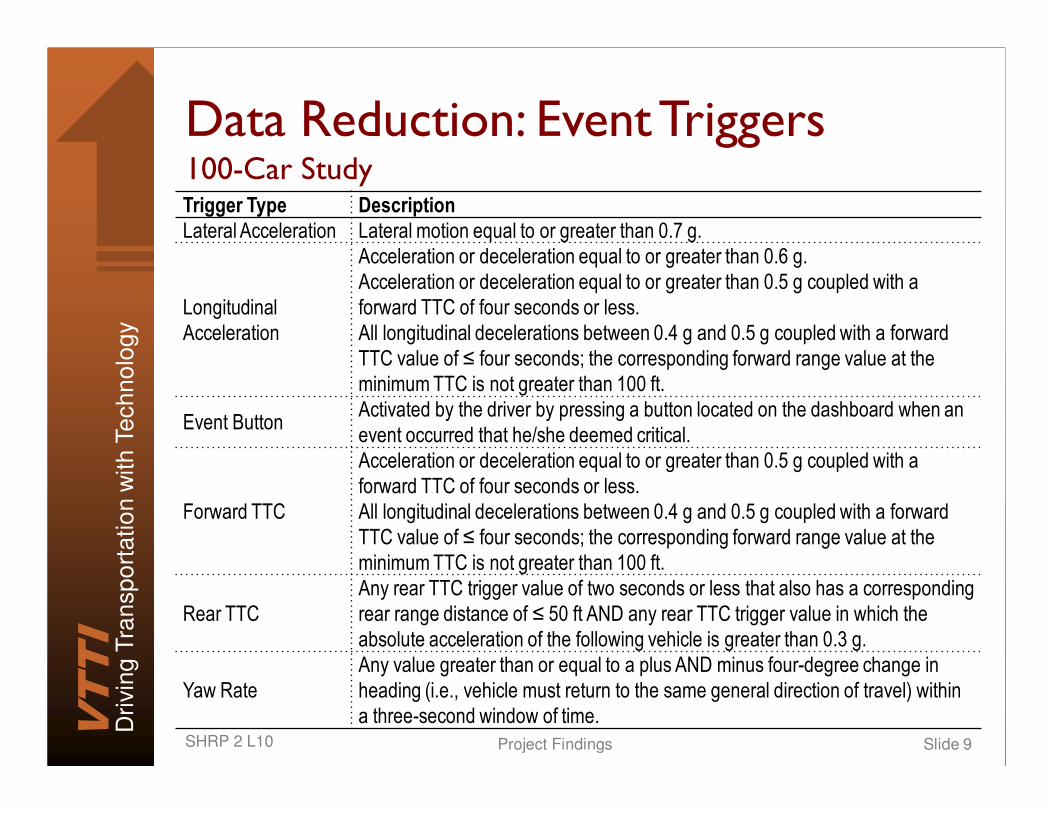
Data Reduction: Event Triggers100-Car StudyTrigger Type DescriptionLateral Acceleration Lateral motion equal to or greater than 0.7 g.
Longitudinal
Acceleration
Acceleration or deceleration equal to or greater than 0.6 g.
Acceleration or deceleration equal to or greater than 0.5 g coupled with a
forward TTC of four seconds or less.
All longitudinal decelerations between 0.4 g and 0.5 g coupled with a forward
TTC value of ≤ four seconds; the corresponding forward range value at the
minimum TTC is not greater than 100 ft.
Event ButtonActivated by the driver by pressing a button located on the dashboard when an
event occurred that he/she deemed critical.
Forward TTC
Acceleration or deceleration equal to or greater than 0.5 g coupled with a
forward TTC of four seconds or less.
All longitudinal decelerations between 0.4 g and 0.5 g coupled with a forward
TTC value of ≤ four seconds; the corresponding forward range value at the
minimum TTC is not greater than 100 ft.
Rear TTC
Any rear TTC trigger value of two seconds or less that also has a corresponding
rear range distance of ≤ 50 ft AND any rear TTC trigger value in which the
absolute acceleration of the following vehicle is greater than 0.3 g.
Yaw Rate
Any value greater than or equal to a plus AND minus four-degree change in
heading (i.e., vehicle must return to the same general direction of travel) within
a three-second window of time.
VTTI
Dri
vin
g T
ran
sp
ort
atio
n w
ith
Te
ch
no
log
y
Project FindingsSHRP 2 L10 Slide 10
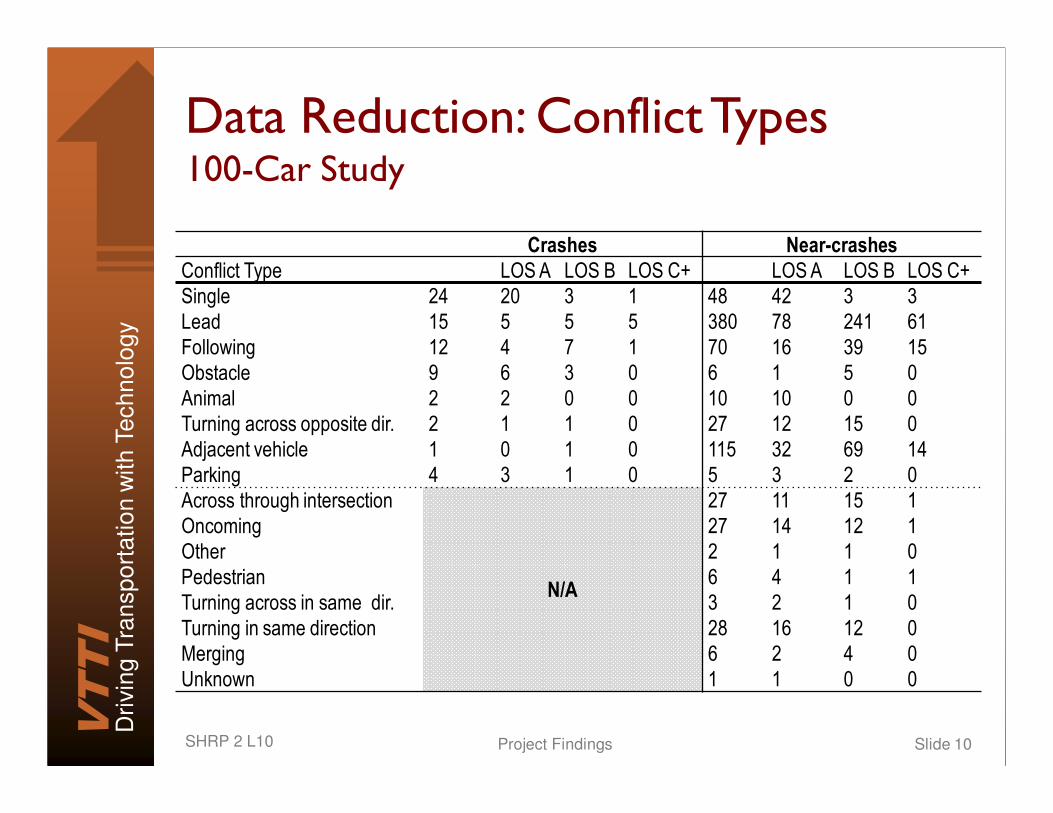
Data Reduction: Conflict Types100-Car Study
Crashes Near-crashesConflict Type LOS A LOS B LOS C+ LOS A LOS B LOS C+
Single 24 20 3 1 48 42 3 3
Lead 15 5 5 5 380 78 241 61
Following 12 4 7 1 70 16 39 15
Obstacle 9 6 3 0 6 1 5 0
Animal 2 2 0 0 10 10 0 0
Turning across opposite dir. 2 1 1 0 27 12 15 0
Adjacent vehicle 1 0 1 0 115 32 69 14
Parking 4 3 1 0 5 3 2 0
Across through intersection
N/A
27 11 15 1
Oncoming 27 14 12 1
Other 2 1 1 0
Pedestrian 6 4 1 1
Turning across in same dir. 3 2 1 0
Turning in same direction 28 16 12 0
Merging 6 2 4 0
Unknown 1 1 0 0
VTTI
Dri
vin
g T
ran
sp
ort
atio
n w
ith
Te
ch
no
log
y
Project FindingsSHRP 2 L10 Slide 11
Data Reduction: Weather Conditions100-Car Study
� Clear weather
• 78 percent of crash and near-crash events
� Rainy conditions
• 12 percent crashes and 8 percent near-crashes
� Cloudy weather
• 13 percent crashes and 9 percent near-crashes
� Only one crash had snow as an associated factor
VTTI
Dri
vin
g T
ran
sp
ort
atio
n w
ith
Te
ch
no
log
y
Project FindingsSHRP 2 L10 Slide 12
Modeling Travel Time ReliabilityCurrent Methodologies
� A set of Specific, Measurable, Achievable, Results-oriented, and Timely (SMART) performance measures are required
� State-of-practice
• 90th or 95th percentile travel times
• Buffer index
• Planning time index
• Frequency with which congestion exceeds a threshold
VTTI
Dri
vin
g T
ran
sp
ort
atio
n w
ith
Te
ch
no
log
y
Project FindingsSHRP 2 L10 Slide 13
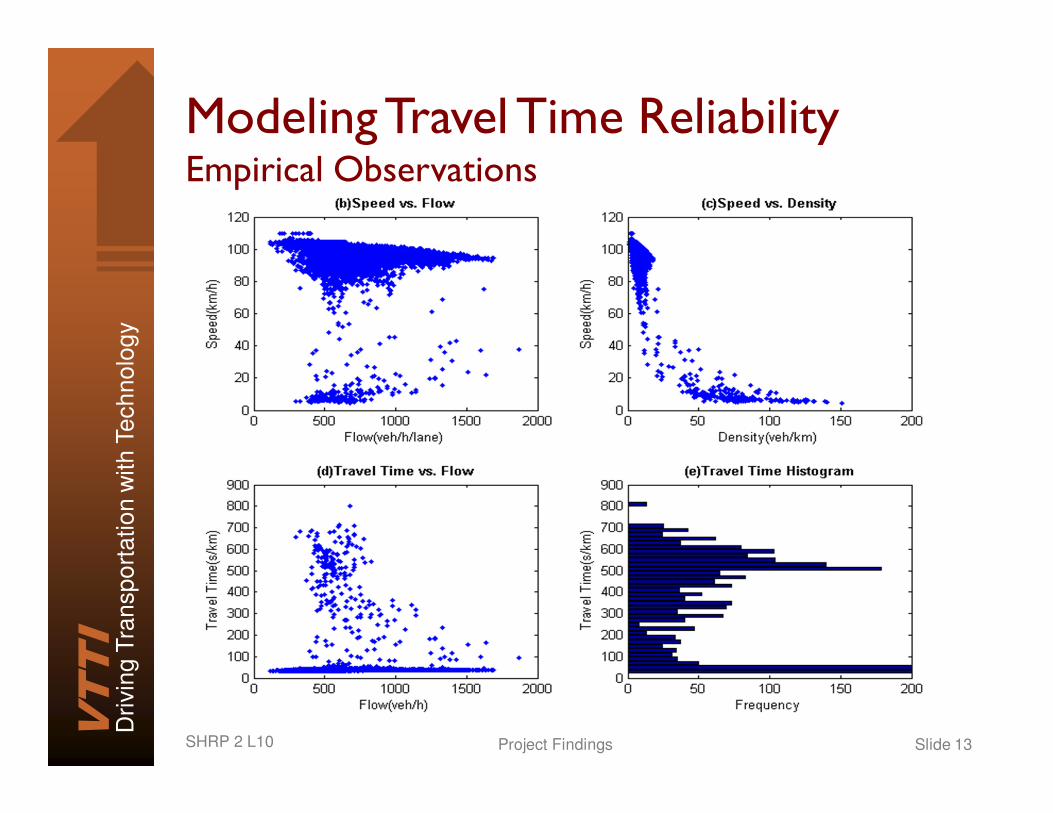
Modeling Travel Time ReliabilityEmpirical Observations
VTTI
Dri
vin
g T
ran
sp
ort
atio
n w
ith
Te
ch
no
log
y
Project FindingsSHRP 2 L10 Slide 14
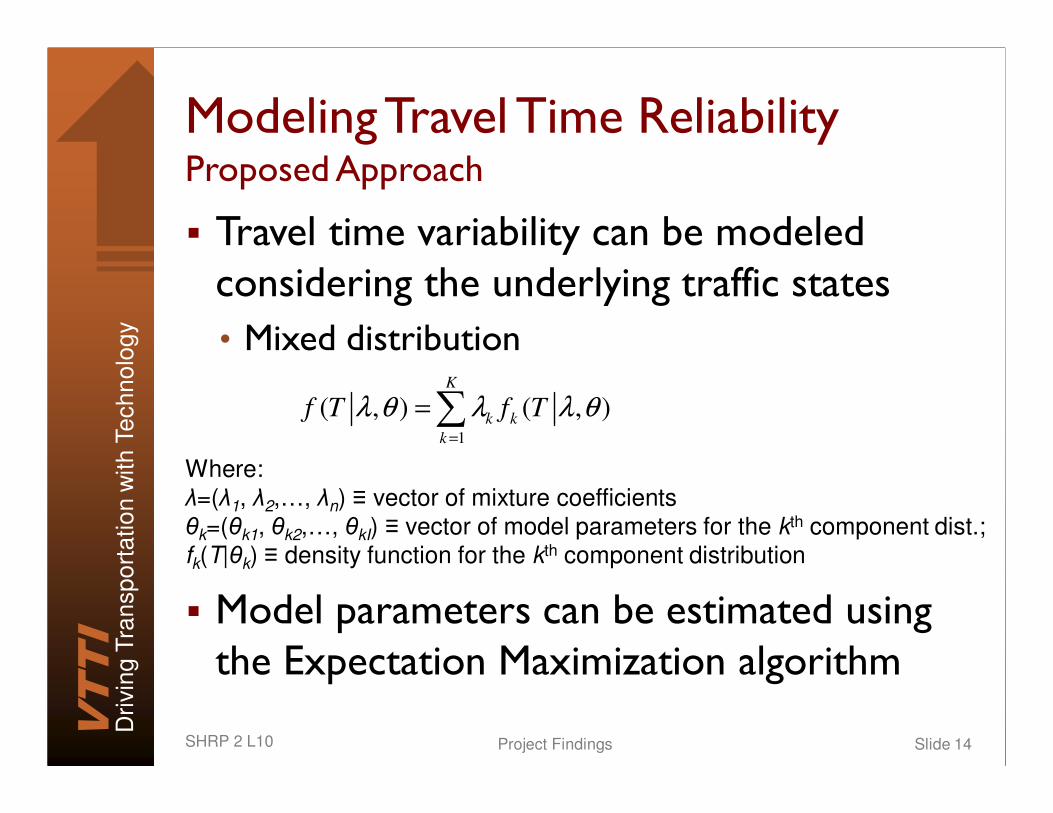
Modeling Travel Time ReliabilityProposed Approach
� Travel time variability can be modeled considering the underlying traffic states
• Mixed distribution
� Model parameters can be estimated using the Expectation Maximization algorithm
1
( , ) ( , )K
k k
k
f T f Tλ θ λ λ θ=
=∑
Where:
λ=(λ1, λ2,…, λn) ≡ vector of mixture coefficients
θk=(θk1, θk2,…, θkI) ≡ vector of model parameters for the kth component dist.;
fk(T|θk) ≡ density function for the kth component distribution
VTTI
Dri
vin
g T
ran
sp
ort
atio
n w
ith
Te
ch
no
log
y
Project FindingsSHRP 2 L10 Slide 15
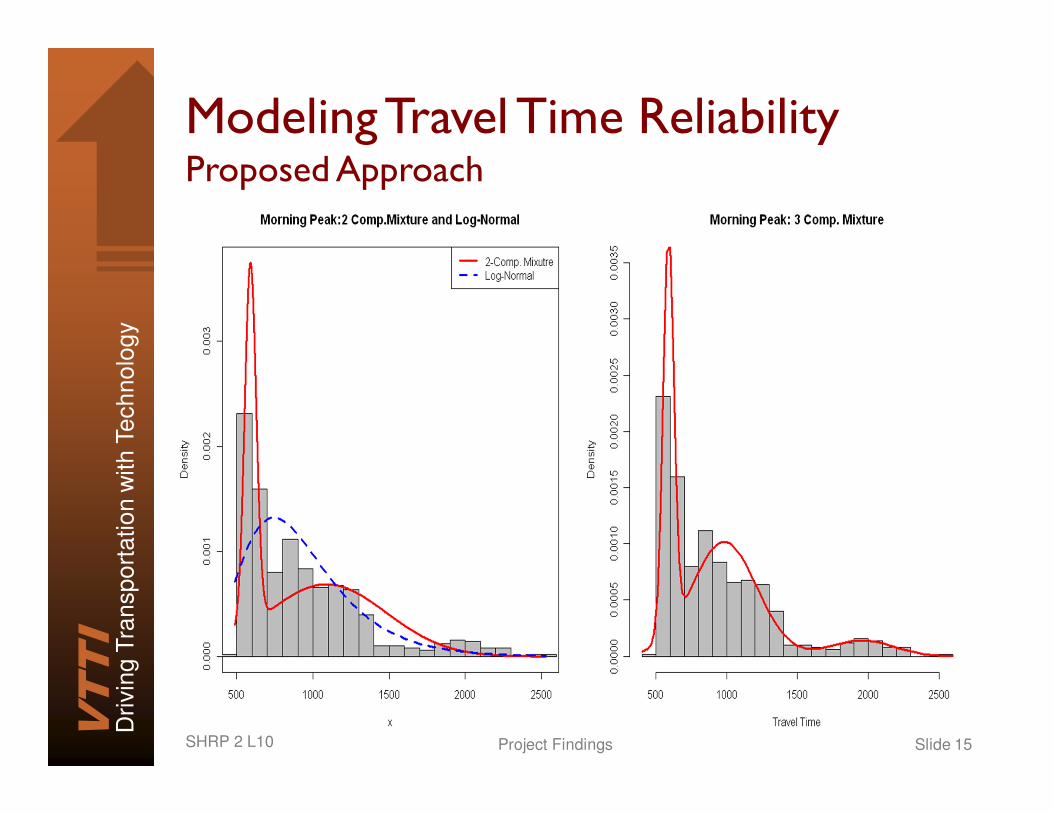
Modeling Travel Time ReliabilityProposed Approach
VTTI
Dri
vin
g T
ran
sp
ort
atio
n w
ith
Te
ch
no
log
y
Project FindingsSHRP 2 L10 Slide 16
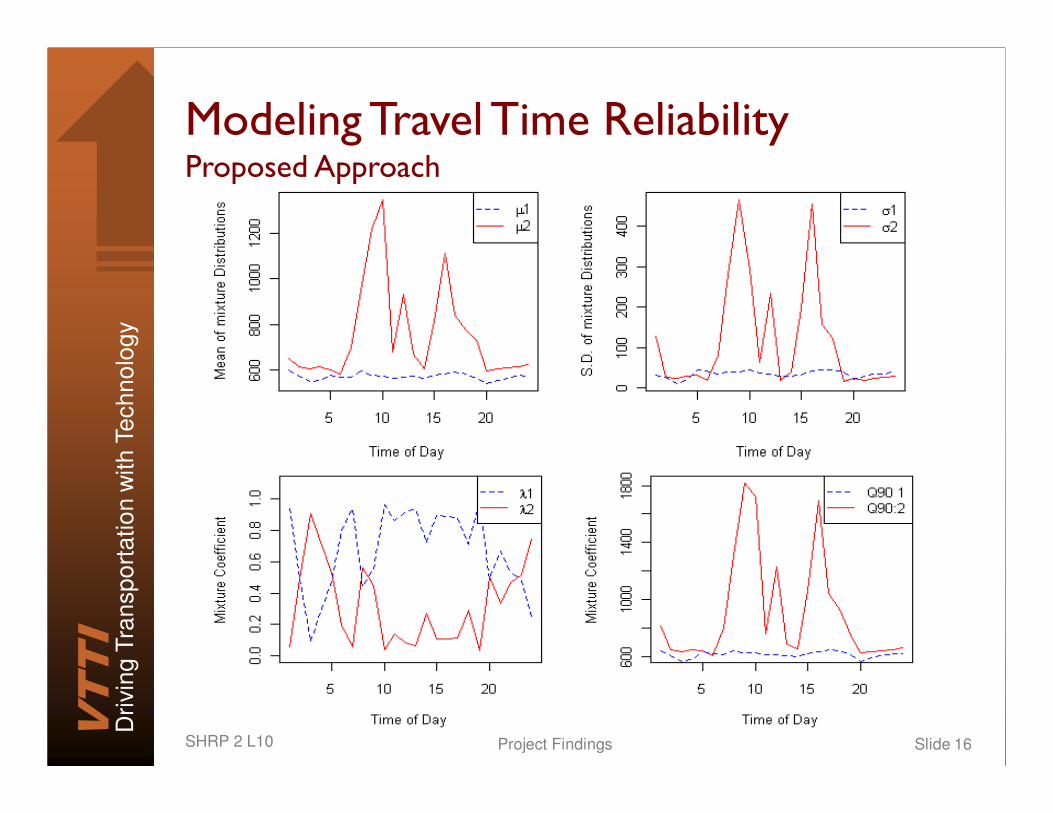
Modeling Travel Time ReliabilityProposed Approach
VTTI
Dri
vin
g T
ran
sp
ort
atio
n w
ith
Te
ch
no
log
y
Project FindingsSHRP 2 L10 Slide 17
Findings
� It is feasible to identify driver behavior prior to near-crashes and crashes from video data
� Naturalistic data can quantify impacts of crashes on traffic conditions when integrated with external data sources
� Increased integration of naturalistic data with weather, construction, incident and traffic volume data is required
VTTI
Dri
vin
g T
ran
sp
ort
atio
n w
ith
Te
ch
no
log
y
Project FindingsSHRP 2 L10 Slide 18
Findings
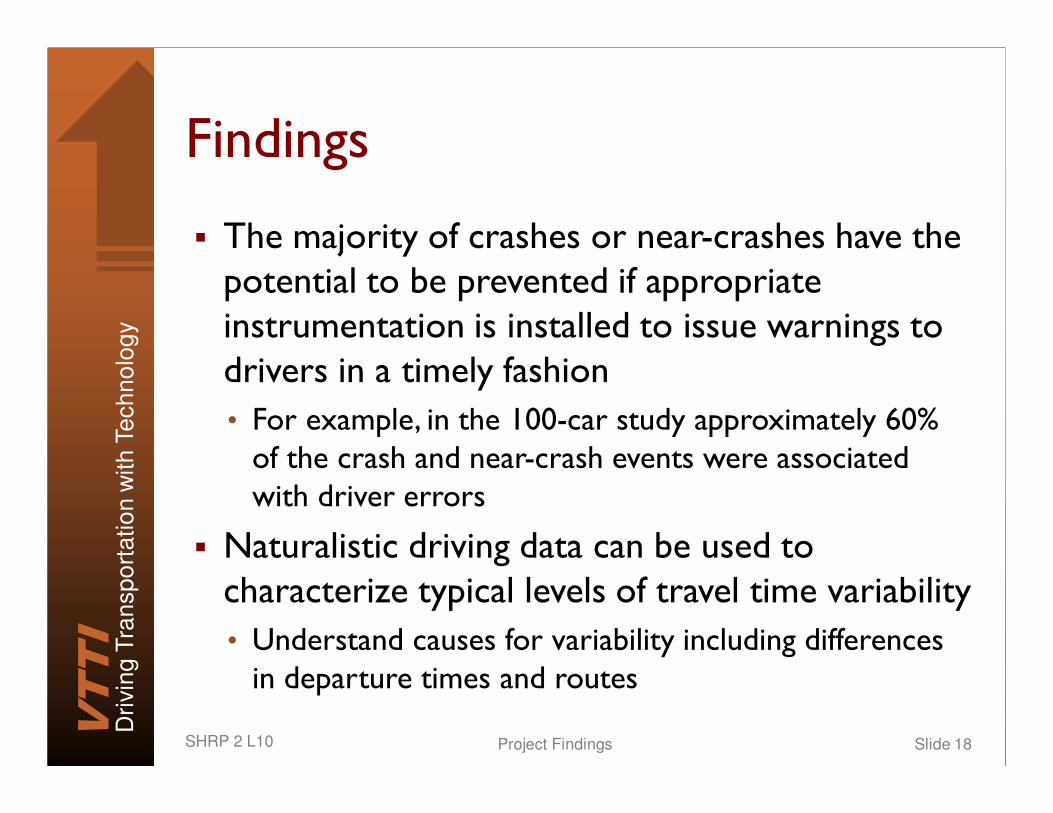
� The majority of crashes or near-crashes have the potential to be prevented if appropriate instrumentation is installed to issue warnings to drivers in a timely fashion
• For example, in the 100-car study approximately 60% of the crash and near-crash events were associated with driver errors
� Naturalistic driving data can be used to characterize typical levels of travel time variability
• Understand causes for variability including differences in departure times and routes
VTTI
Dri
vin
g T
ran
sp
ort
atio
n w
ith
Te
ch
no
log
y
Project FindingsSHRP 2 L10 Slide 19
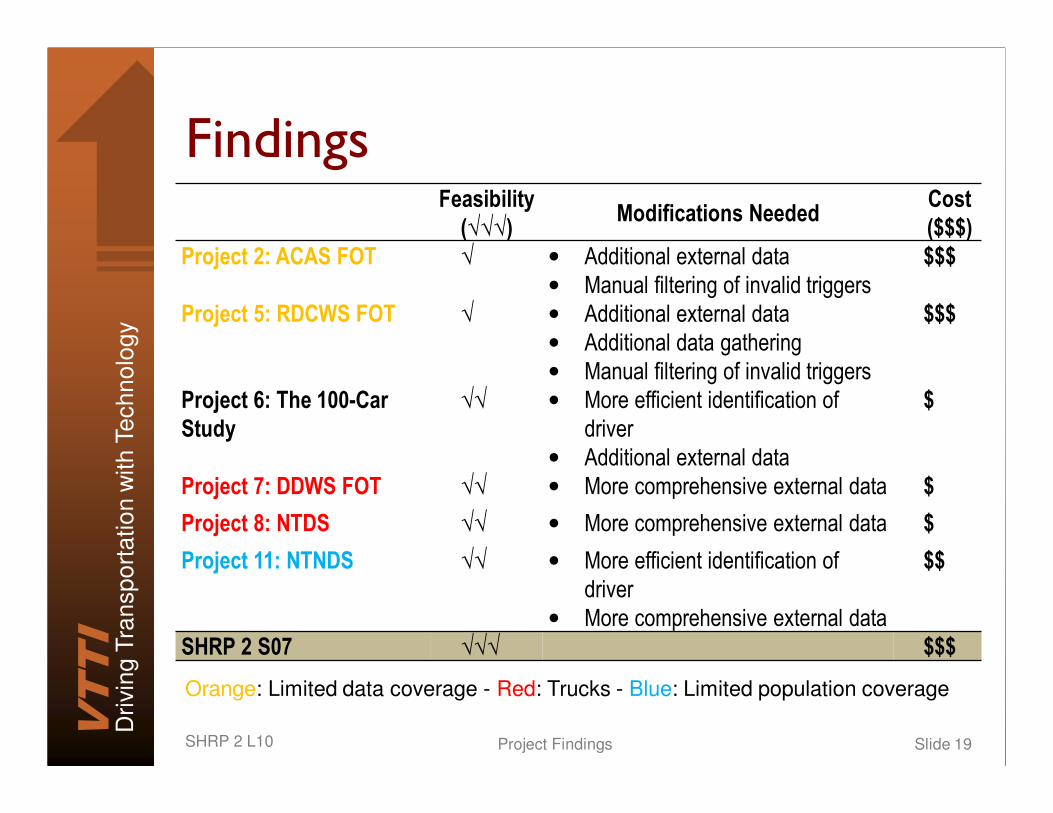
FindingsFeasibility(√√√)
Modifications NeededCost($$$)
Project 2: ACAS FOT √ • Additional external data
• Manual filtering of invalid triggers
$$$
Project 5: RDCWS FOT √ • Additional external data
• Additional data gathering
• Manual filtering of invalid triggers
$$$
Project 6: The 100-Car Study
√√ • More efficient identification of
driver
• Additional external data
$
Project 7: DDWS FOT √√ • More comprehensive external data $
Project 8: NTDS √√ • More comprehensive external data $
Project 11: NTNDS √√ • More efficient identification of
driver
• More comprehensive external data
$$
SHRP 2 S07 √√√ $$$
Orange: Limited data coverage - Red: Trucks - Blue: Limited population coverage
VTTI
Dri
vin
g T
ran
sp
ort
atio
n w
ith
Te
ch
no
log
y
Project FindingsSHRP 2 L10 Slide 20
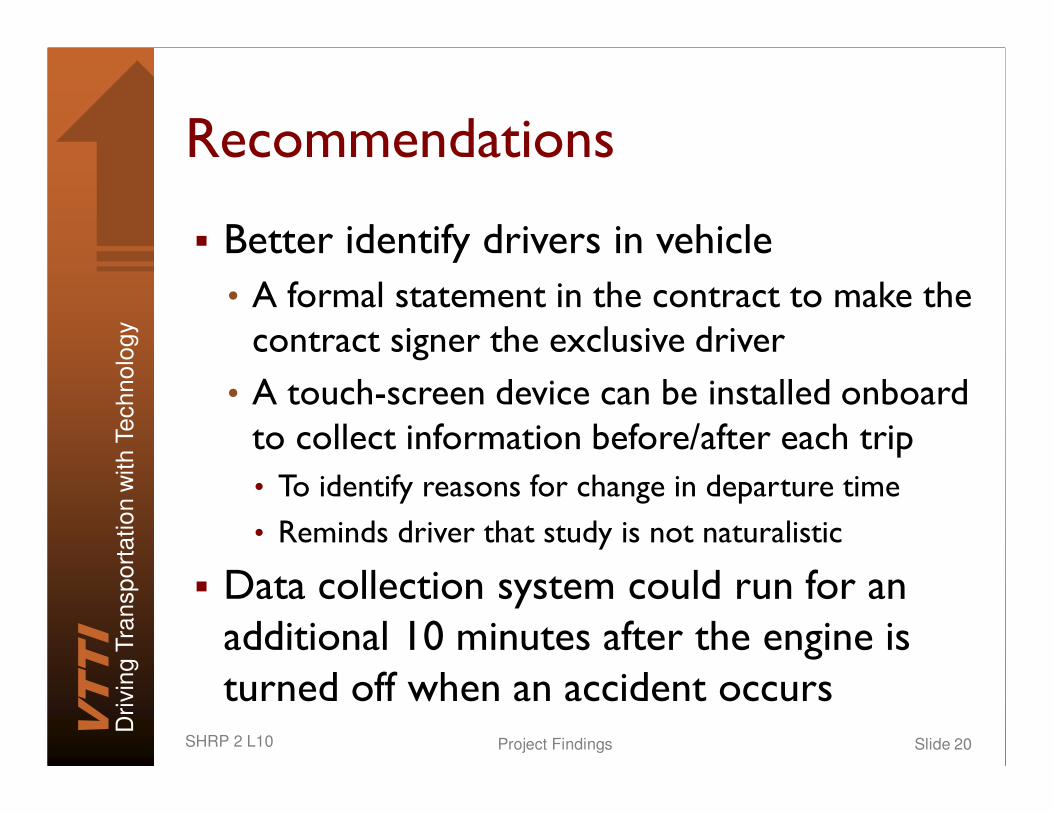
Recommendations
� Better identify drivers in vehicle
• A formal statement in the contract to make the contract signer the exclusive driver
• A touch-screen device can be installed onboard to collect information before/after each trip
• To identify reasons for change in departure time
• Reminds driver that study is not naturalistic
� Data collection system could run for an additional 10 minutes after the engine is turned off when an accident occurs
VTTI
Dri
vin
g T
ran
sp
ort
atio
n w
ith
Te
ch
no
log
y
Project FindingsSHRP 2 L10 Slide 21
Recommendations
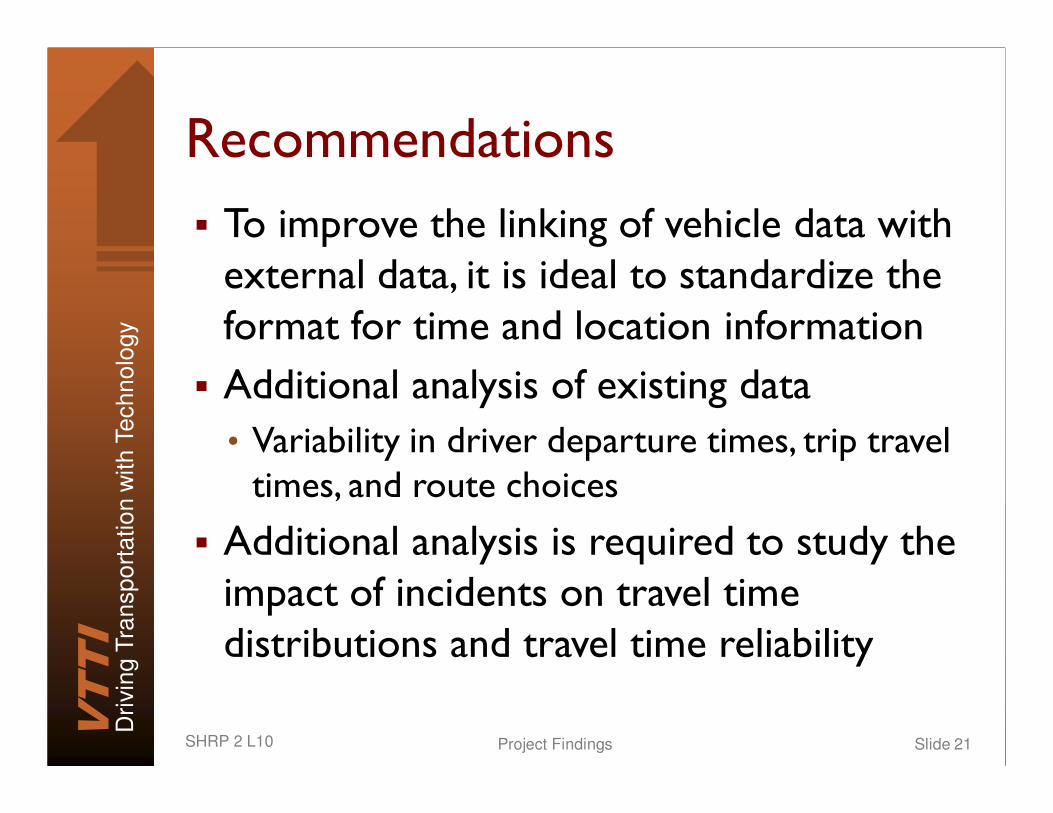
� To improve the linking of vehicle data with external data, it is ideal to standardize the format for time and location information
� Additional analysis of existing data
• Variability in driver departure times, trip travel times, and route choices
� Additional analysis is required to study the impact of incidents on travel time distributions and travel time reliability
VTTI
Dri
vin
g T
ran
sp
ort
atio
n w
ith
Te
ch
no
log
y
Project FindingsSHRP 2 L10 Slide 22
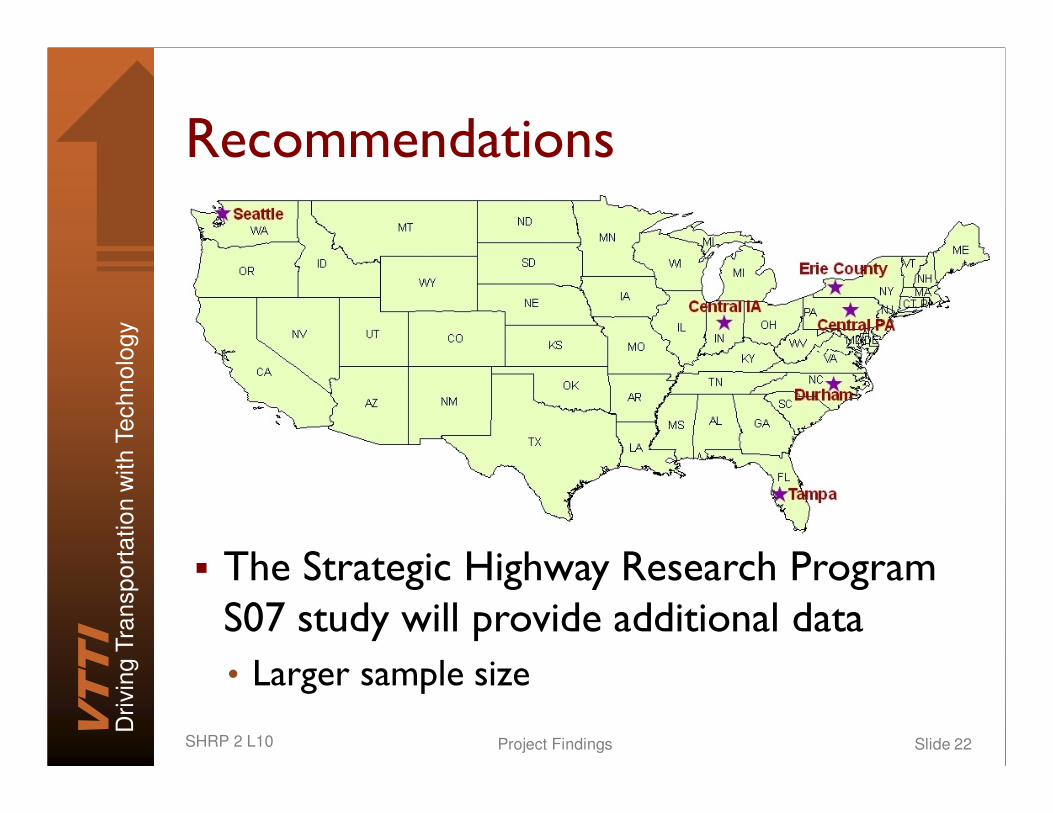
Recommendations
� The Strategic Highway Research Program S07 study will provide additional data
• Larger sample size

VTTI
Dri
vin
g T
ran
sp
ort
atio
n w
ith
Te
ch
no
log
y
Project FindingsSHRP 2 L10 Slide 23
Questions ?