Embed Size (px)
Citation preview
Should Alberta Upgrade Oil Sands Bitumen?:An Integrated Life Cycle Framework to
Evaluate Energy System Investment Tradeoffs
Nicolas Choquette-LevyDr. Heather MacLeanDr. Joule Bergerson
31st USAEE ConferenceNovember 6, 2012
1
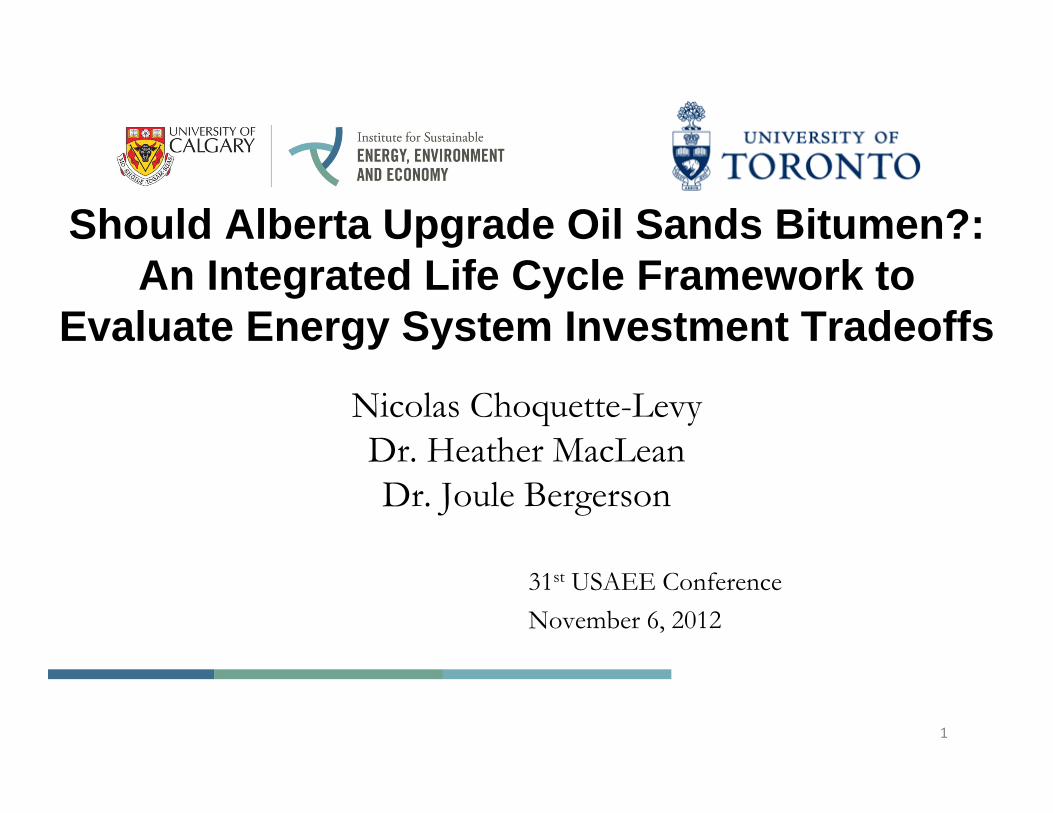
Case Study: Should Alberta Upgrade Oil Sands Bitumen?• Motivation for study:
Oil sands = 3rd largest proven oil reserves in the world
60% of bitumen upgraded (2009)
Alberta’s target: 72% of bitumen upgraded (2016)
2
• Key Tradeoffs:High upstream GHG emissions vs. low downstream emissions
High capital expenses vs. higher expected profit margins
Bitumen Production
Bitumen Production
Heavy Crude
Refineries
Heavy Crude
Refineries
Medium Crude
Refineries
Medium Crude
Refineries
Light Crude
Refineries
Light Crude
RefineriesUpgradingUpgrading
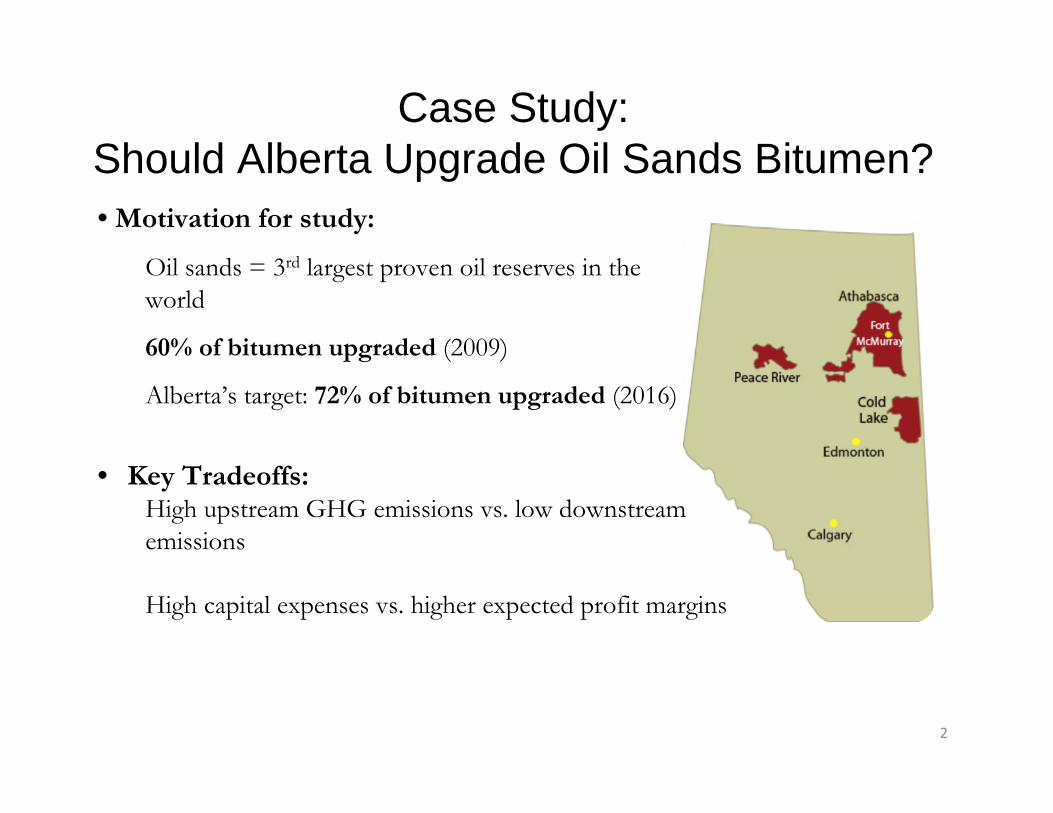
Light Sweet SCO
Heavy Sour SCO
DiluentDiluent
Medium Sweet SCO
Dilbit
Source: Adapted from Gary R. Brierley et al, 2006 3
Technical Overview
Synbit
Coke
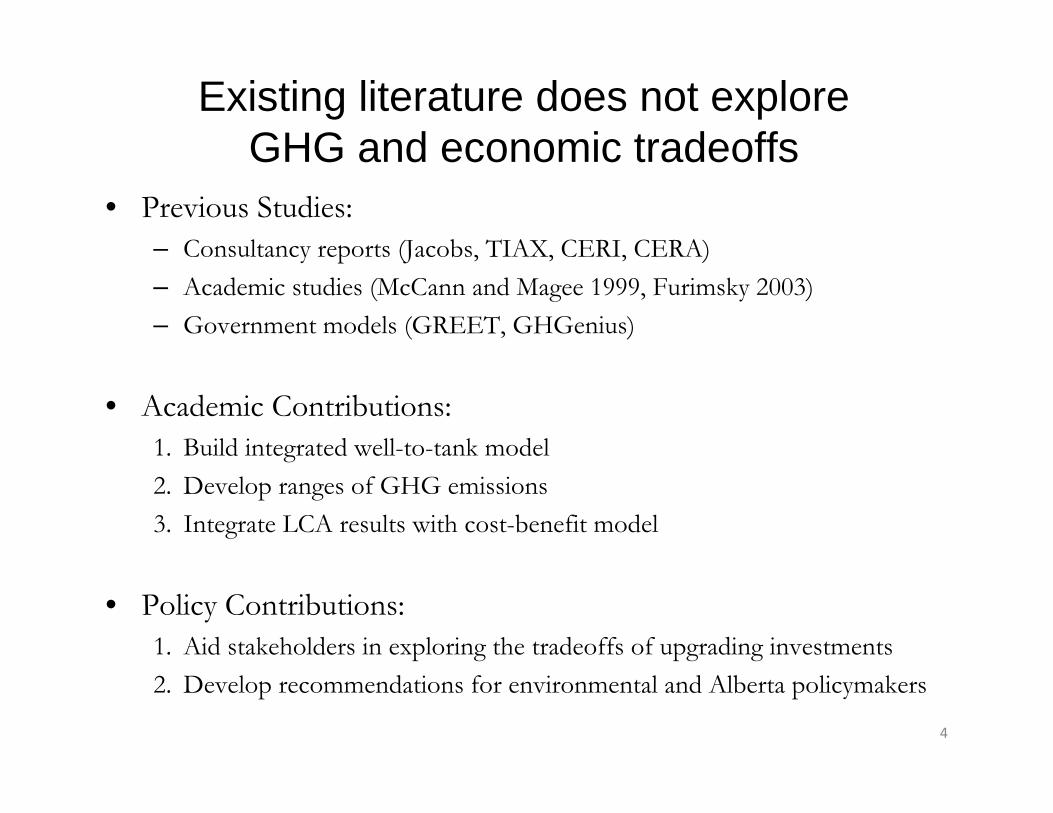
• Previous Studies:– Consultancy reports (Jacobs, TIAX, CERI, CERA) – Academic studies (McCann and Magee 1999, Furimsky 2003)– Government models (GREET, GHGenius)
• Academic Contributions:1. Build integrated well-to-tank model2. Develop ranges of GHG emissions3. Integrate LCA results with cost-benefit model
• Policy Contributions:1. Aid stakeholders in exploring the tradeoffs of upgrading investments2. Develop recommendations for environmental and Alberta policymakers
4
Existing literature does not explore GHG and economic tradeoffs
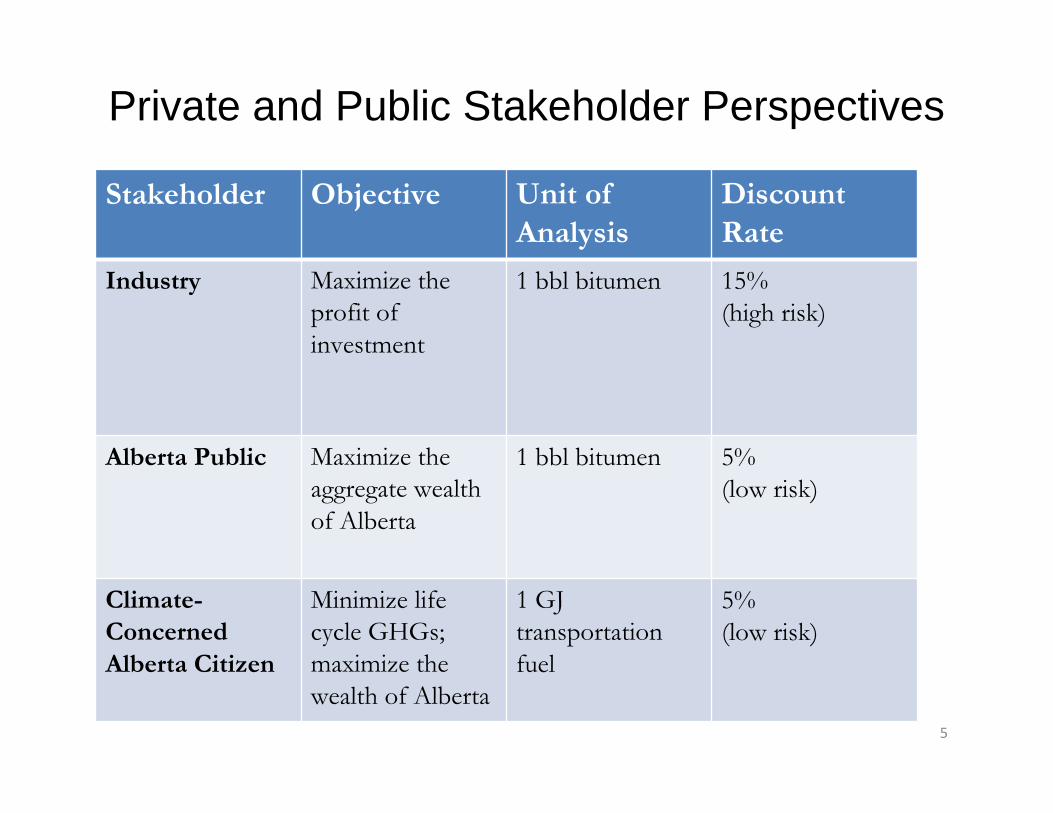
Private and Public Stakeholder Perspectives
Stakeholder Objective Unit of Analysis
Discount Rate
Industry Maximize the profit of investment
1 bbl bitumen 15%(high risk)
Alberta Public Maximize the aggregate wealth of Alberta
1 bbl bitumen 5%(low risk)
Climate-Concerned Alberta Citizen
Minimize life cycle GHGs; maximize the wealth of Alberta
1 GJ transportation fuel
5%(low risk)
5
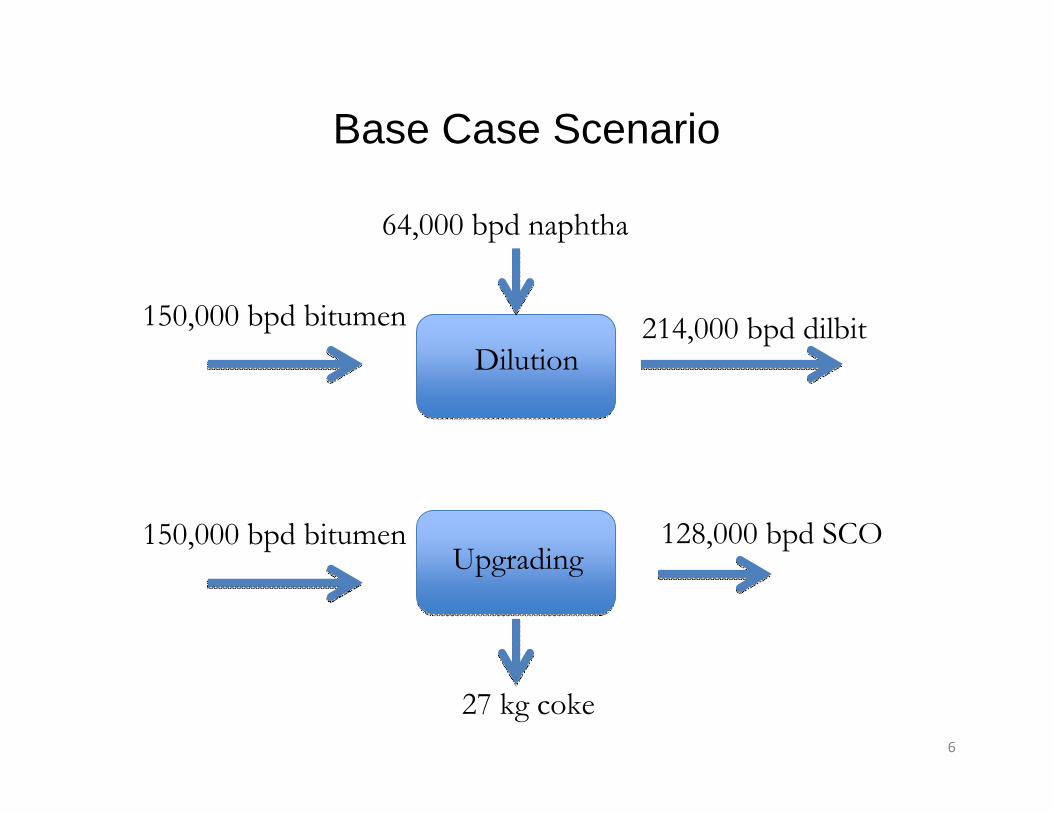
Base Case Scenario
150,000 bpd bitumen 214,000 bpd dilbit
128,000 bpd SCO
Dilution
Upgrading
64,000 bpd naphtha
6
150,000 bpd bitumen
27 kg coke
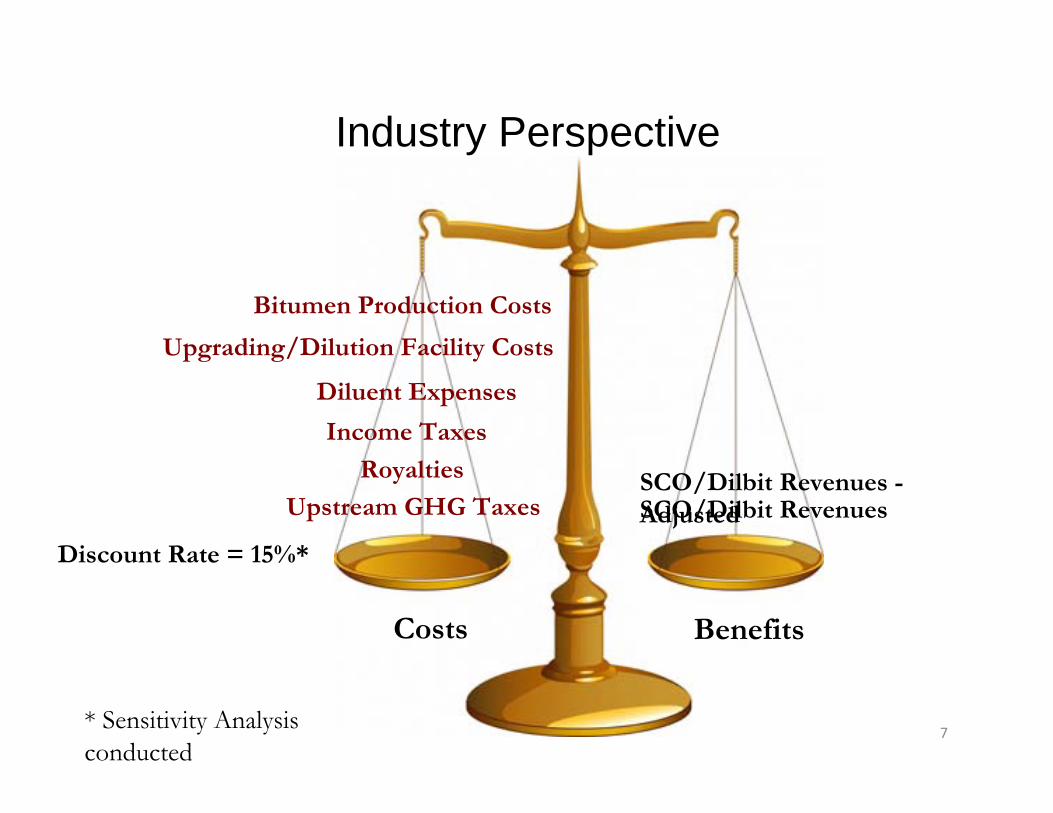
Industry Perspective
Costs Benefits
Bitumen Production Costs
Upgrading/Dilution Facility Costs
Royalties
Income Taxes
Upstream GHG Taxes
Diluent Expenses
SCO/Dilbit RevenuesSCO/Dilbit Revenues -Adjusted
Discount Rate = 15%*
7* Sensitivity Analysis conducted
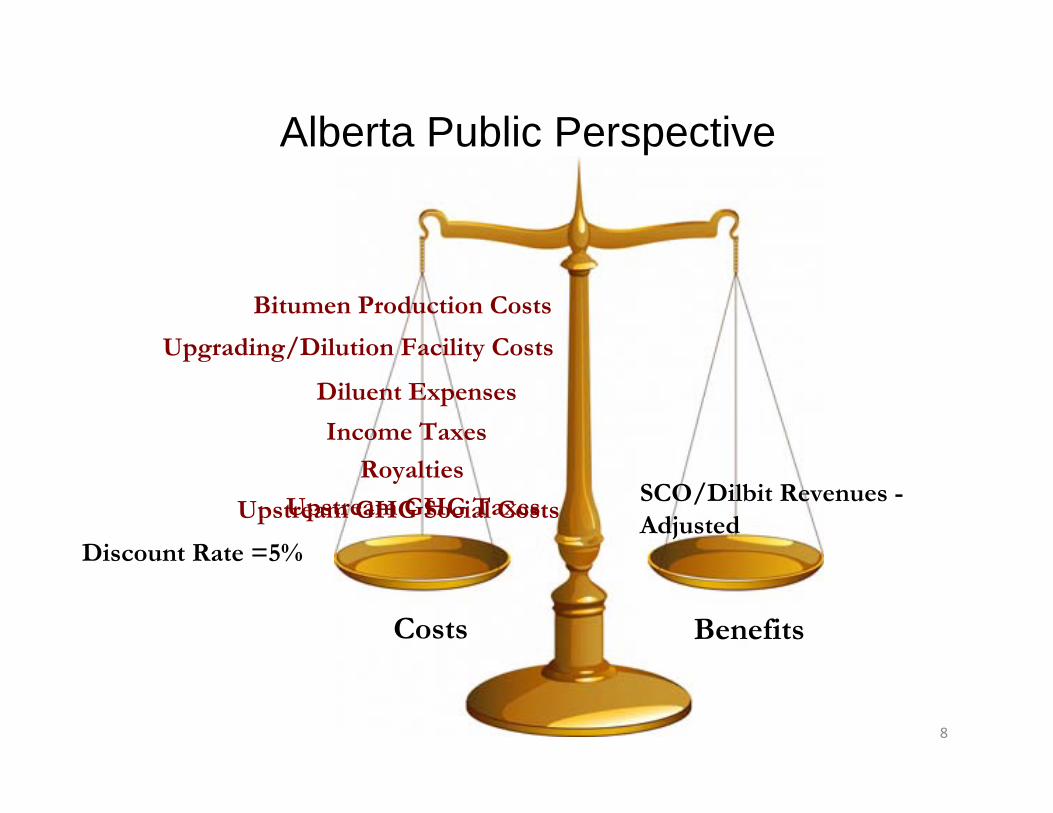
Alberta Public Perspective
Costs Benefits
Bitumen Production Costs
Upgrading/Dilution Facility Costs
Royalties
Income Taxes
Upstream GHG Taxes
Diluent Expenses
SCO/Dilbit Revenues -Adjusted
Upstream GHG Social Costs
Discount Rate =5%
8
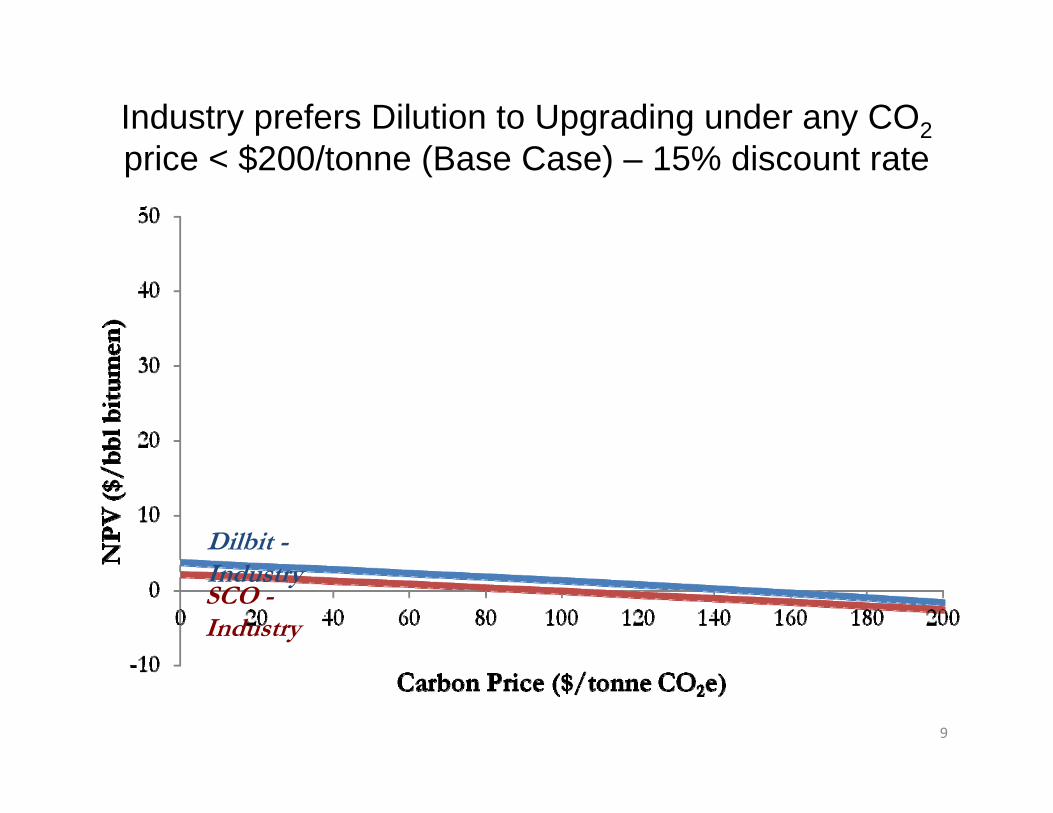
Industry prefers Dilution to Upgrading under any CO2price < $200/tonne (Base Case) – 15% discount rate
Dilbit -IndustrySCO -Industry
9
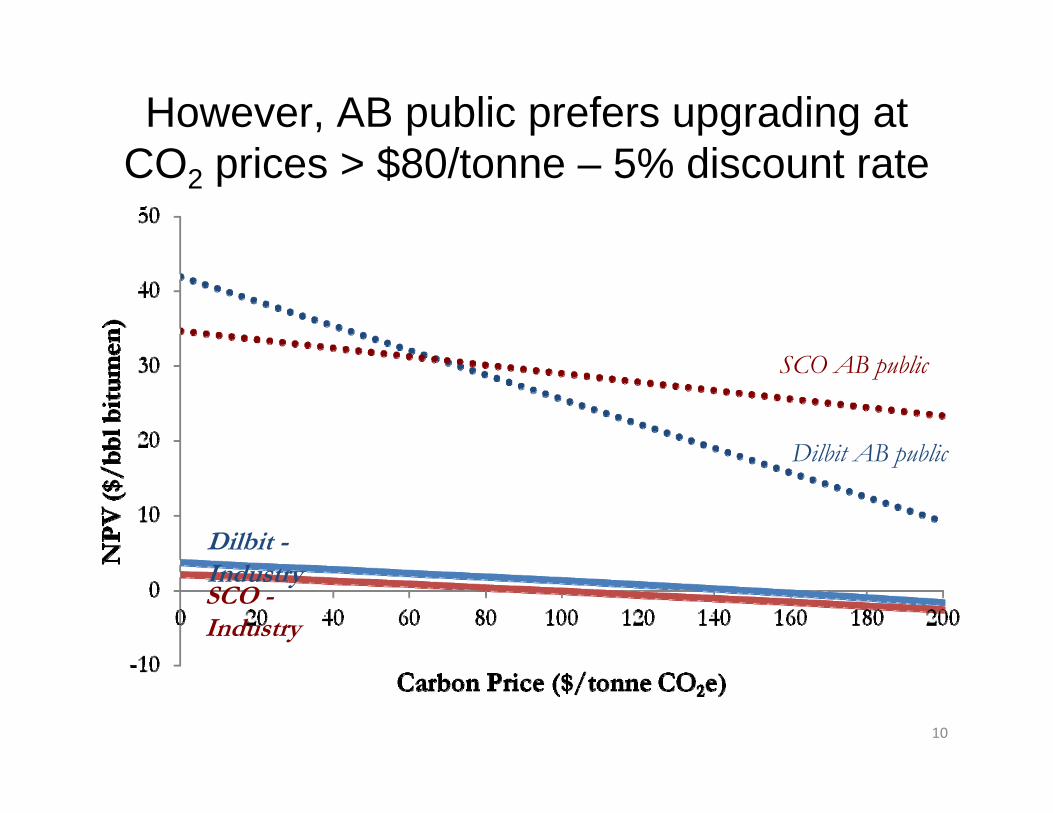
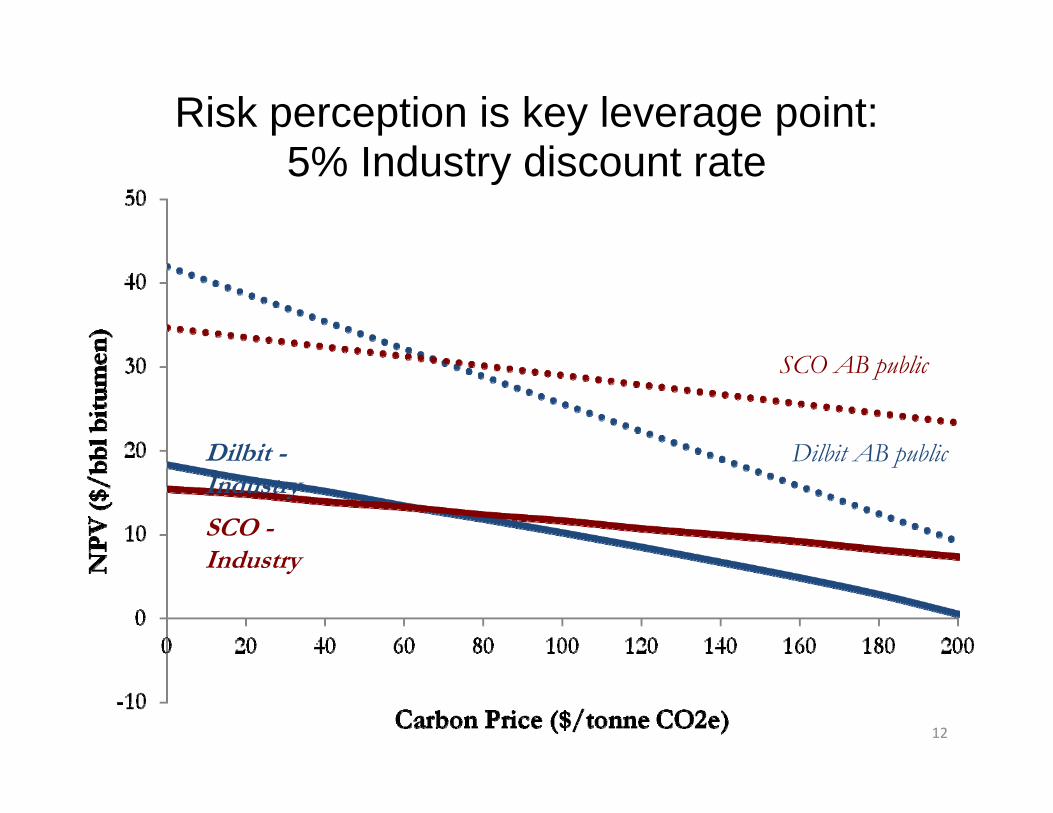
However, AB public prefers upgrading at CO2 prices > $80/tonne – 5% discount rate
SCO AB public
Dilbit AB public
10
Dilbit -IndustrySCO -Industry
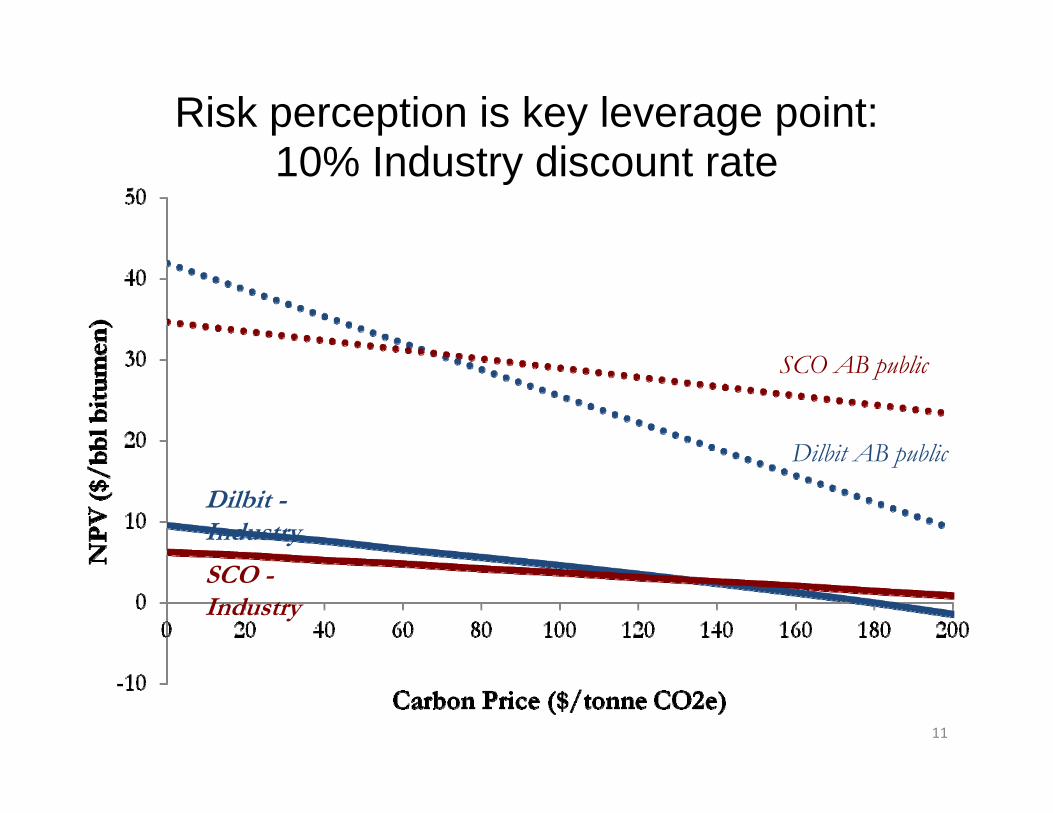
Risk perception is key leverage point:10% Industry discount rate
11
SCO -Industry
Dilbit -Industry
SCO AB public
Dilbit AB public
12
Risk perception is key leverage point:5% Industry discount rate
SCO AB public
Dilbit AB publicDilbit -Industry
SCO -Industry
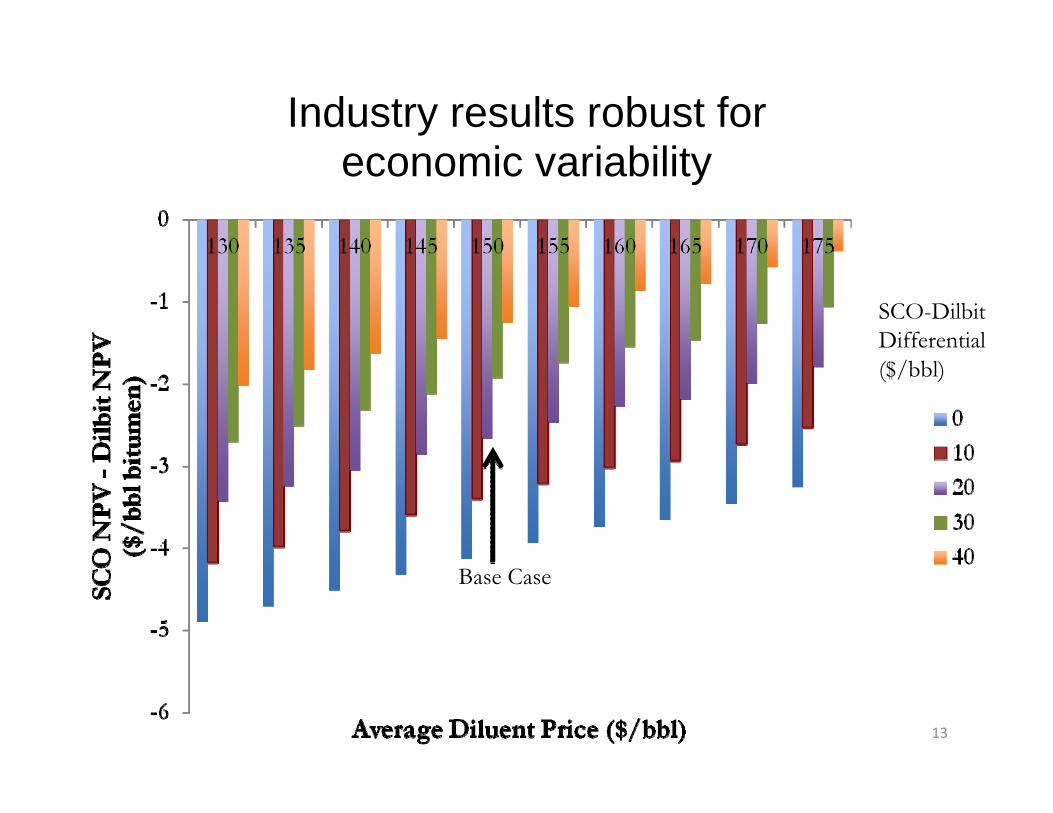
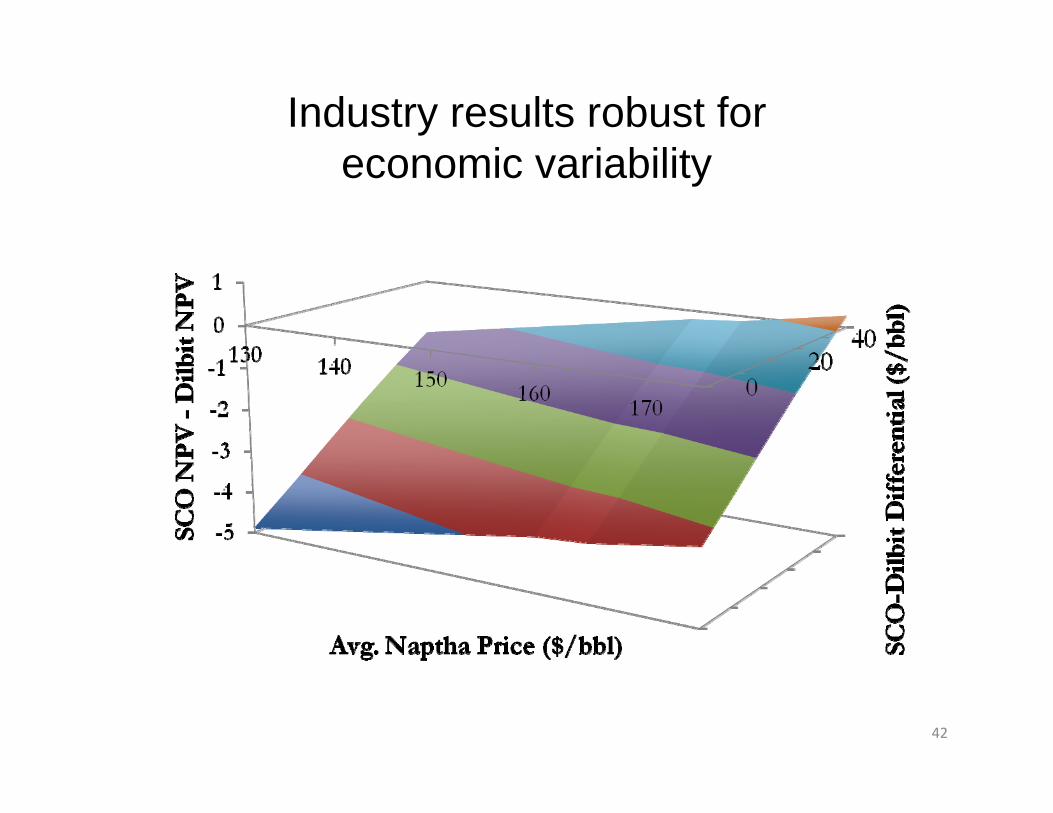
Industry results robust for economic variability
13
SCO-Dilbit Differential ($/bbl)
Base Case
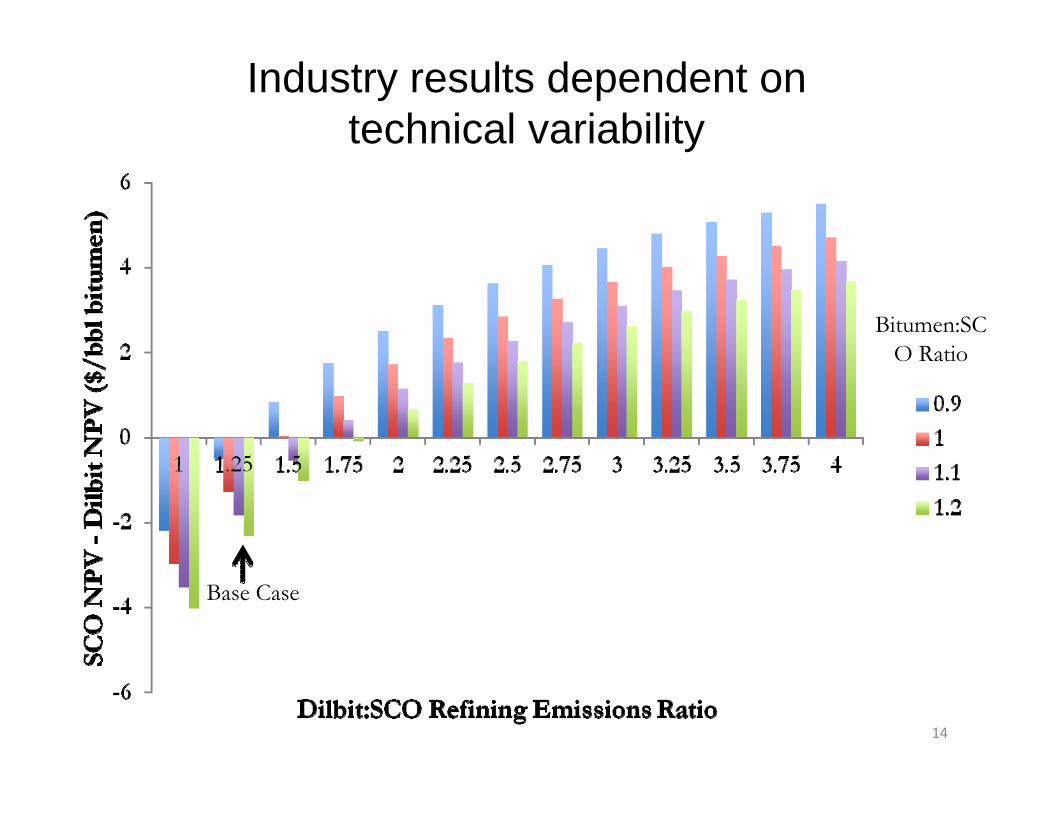
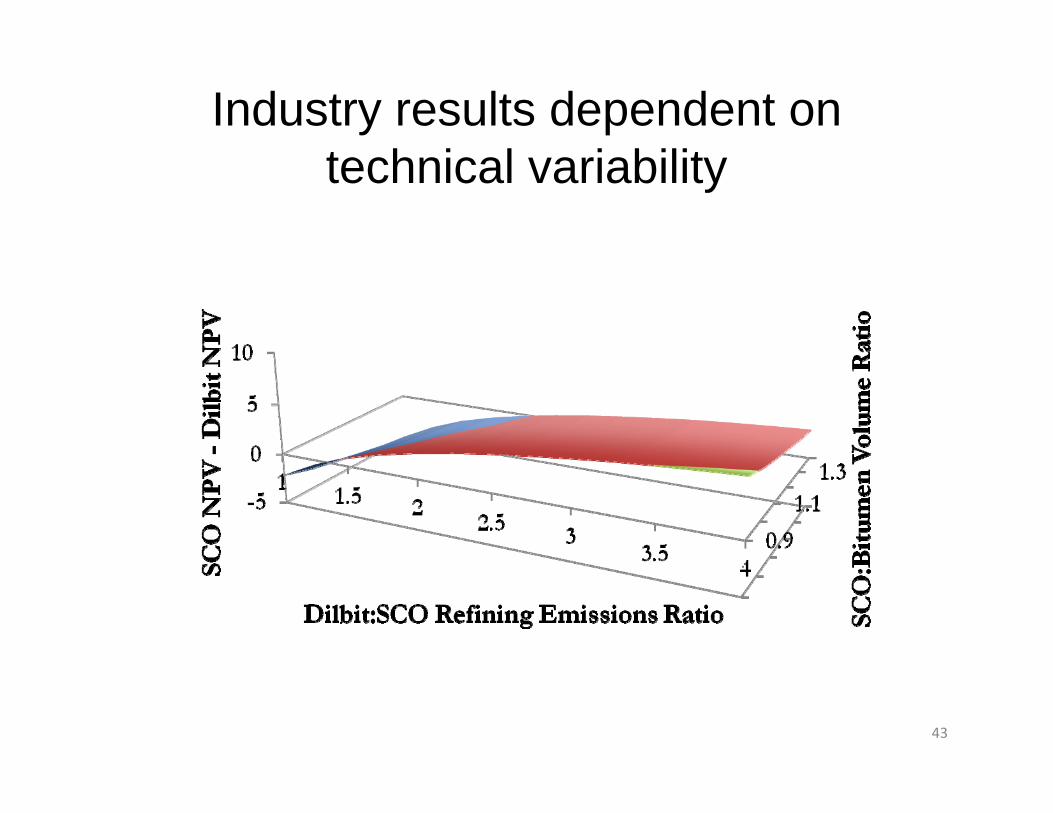
Industry results dependent on technical variability
14
Base Case
Bitumen:SCO Ratio
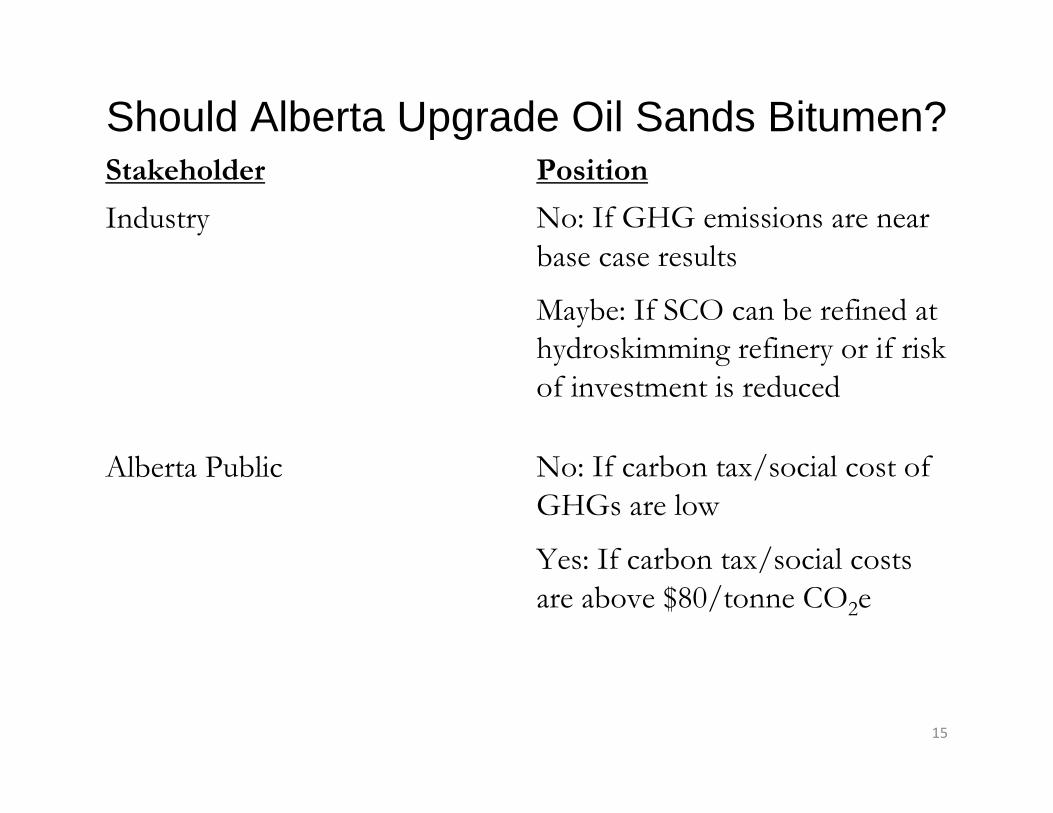
Should Alberta Upgrade Oil Sands Bitumen?Stakeholder Position
Industry No: If GHG emissions are near base case results
Maybe: If SCO can be refined at hydroskimming refinery or if risk of investment is reduced
Alberta Public No: If carbon tax/social cost of GHGs are low
Yes: If carbon tax/social costs are above $80/tonne CO2e
15
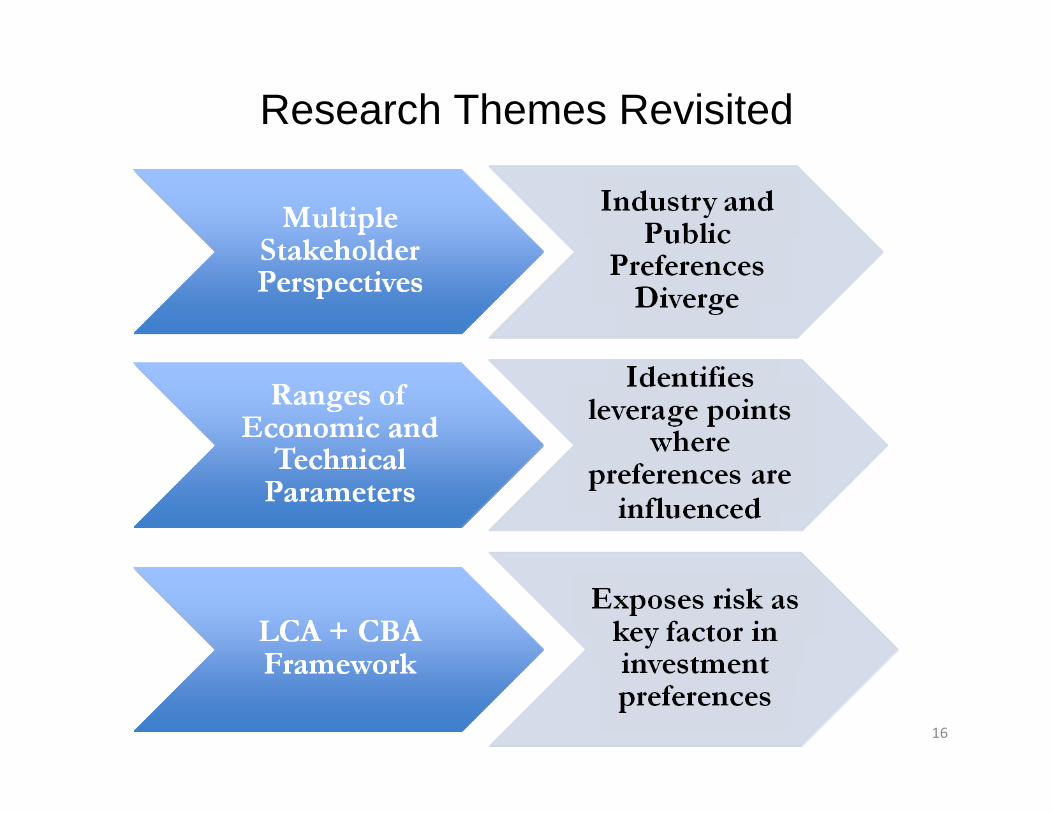
Research Themes Revisited
16
Future Work• Improve LCA model
1. Link parameters (e.g. electricity consumption and SOR) for more plausible GHG ranges
2. Track other indicators of crude quality (e.g. aromaticity) that affect refinery emissions
• Develop alternate scenarios (e.g. partial upgrading)
• Explore other research questions/approaches
1. Real Options Analysis
2. Consequential LCA
17
Acknowledgements• Dr. Joule Bergerson and Dr. Heather MacLean
• LCAOST research group members
• Institute for Sustainable Energy, Environment, and Economy
• Natural Sciences and Engineering Research Council of Canada
• Carbon Management Canada
• Canada School of Energy and the Environment
• Oil sands industry reviewers18

Alternate Slides
20

Context
21
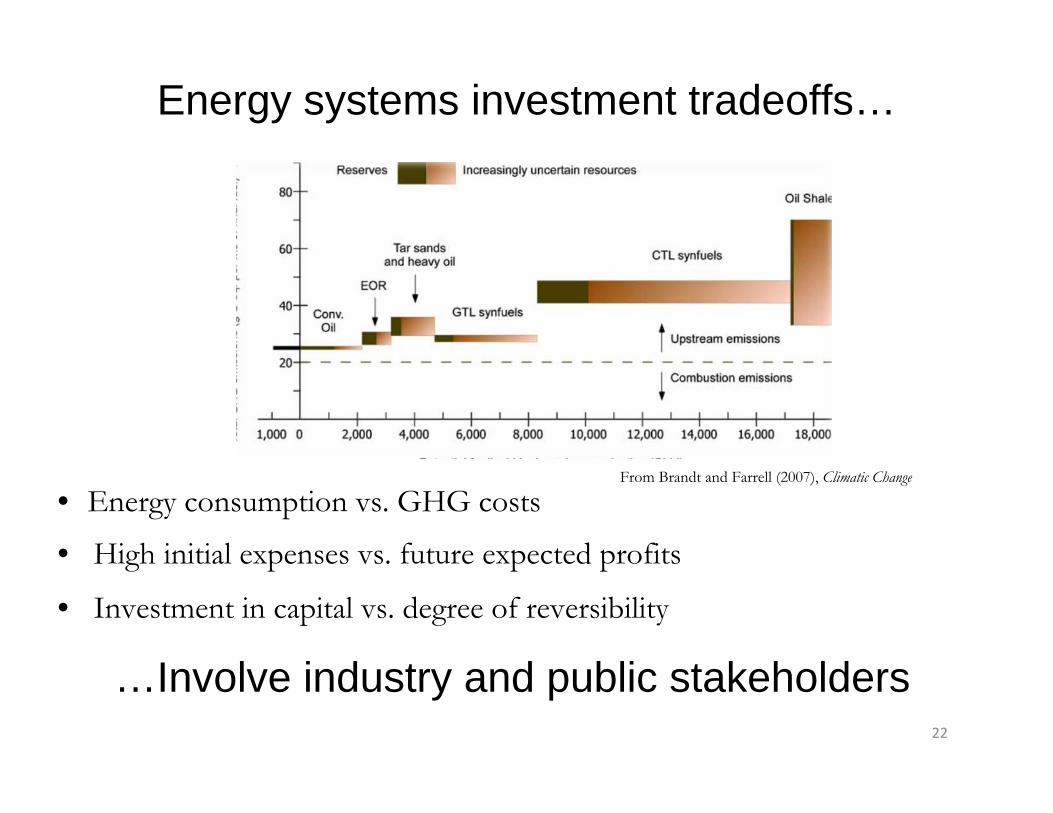
From Brandt and Farrell (2007), Climatic Change
• High initial expenses vs. future expected profits
• Investment in capital vs. degree of reversibility
Energy systems investment tradeoffs…
• Energy consumption vs. GHG costs
22
…Involve industry and public stakeholders
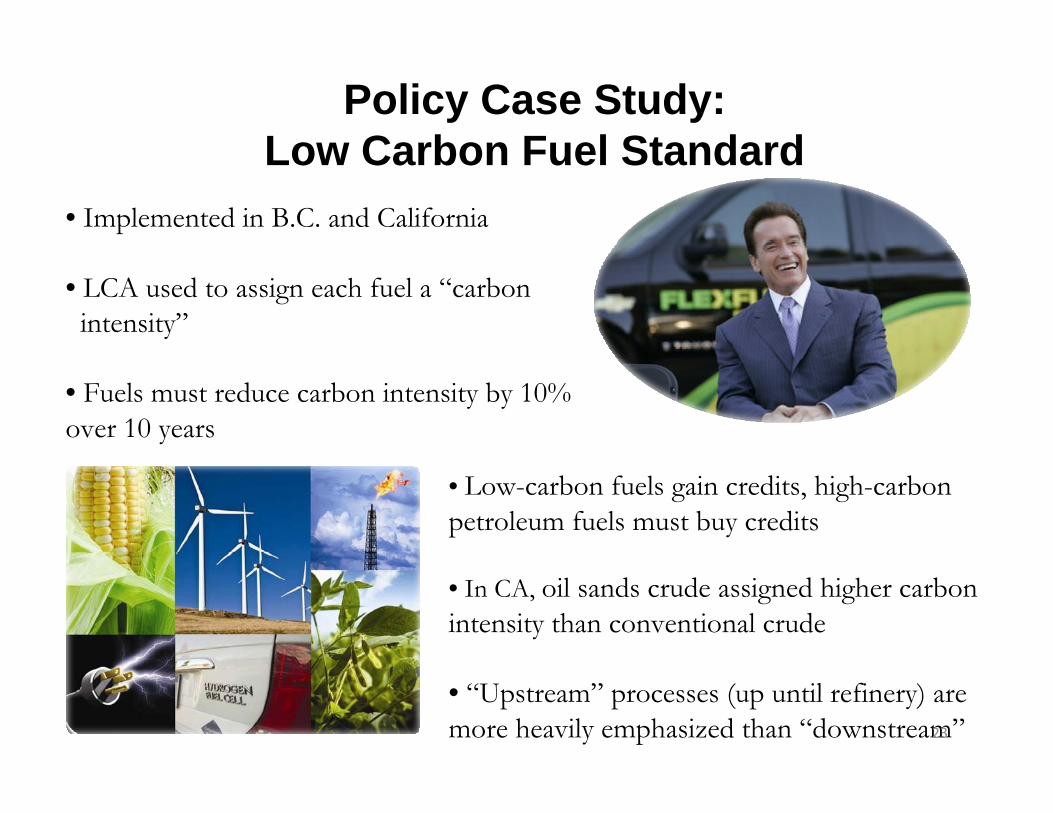
Policy Case Study: Low Carbon Fuel Standard
• Implemented in B.C. and California
• LCA used to assign each fuel a “carbonintensity”
• Fuels must reduce carbon intensity by 10% over 10 years
• Low-carbon fuels gain credits, high-carbon petroleum fuels must buy credits
• In CA, oil sands crude assigned higher carbon intensity than conventional crude
• “Upstream” processes (up until refinery) are more heavily emphasized than “downstream”23
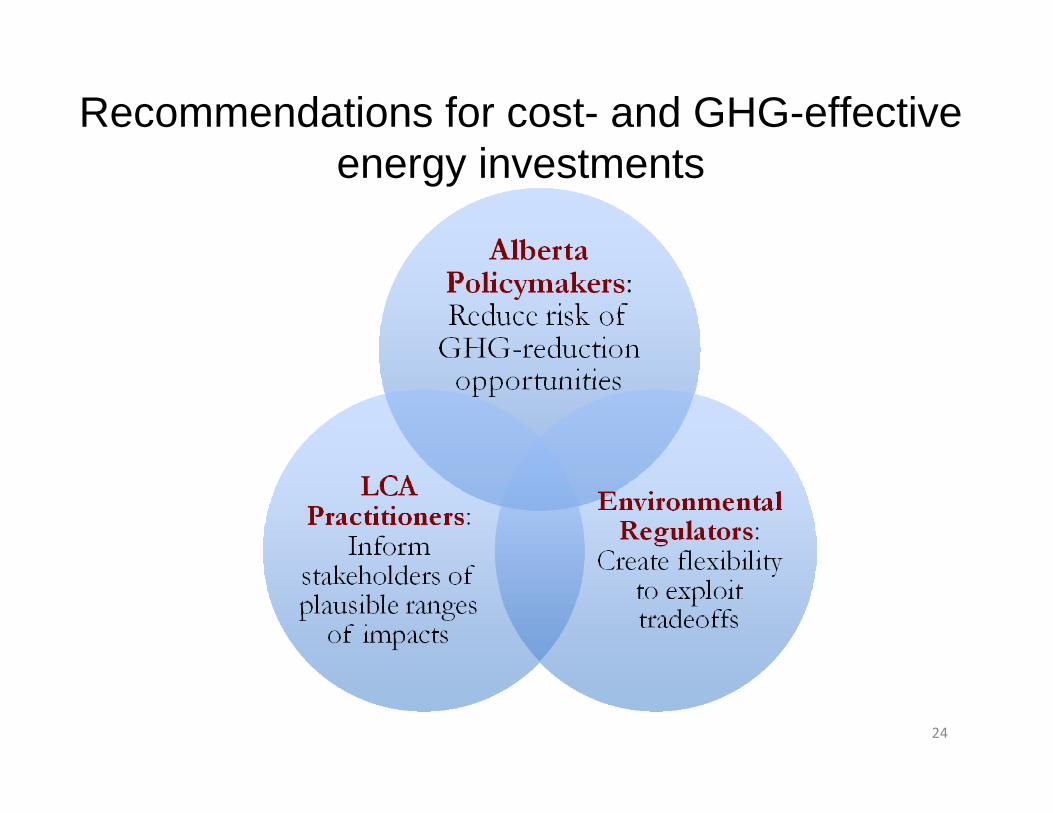
Recommendations for cost- and GHG-effective energy investments
24

Methods
25
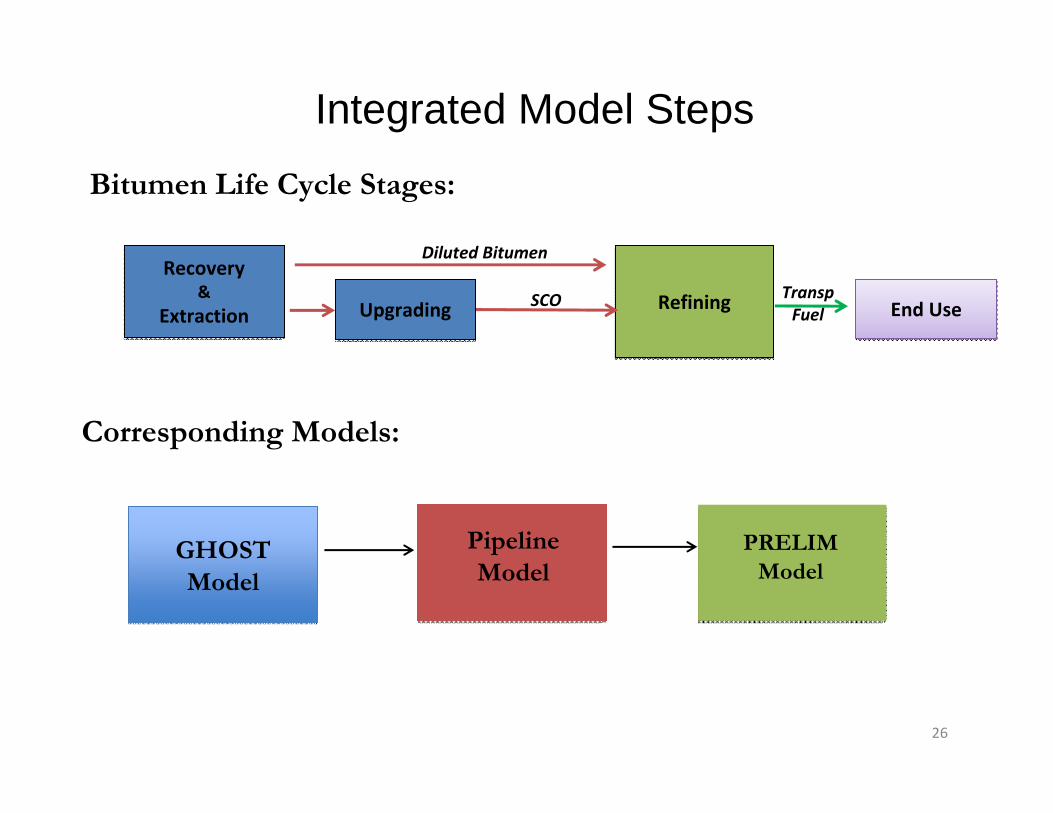
Integrated Model Steps
GHOST Model
Pipeline Model
PRELIM Model
Bitumen Life Cycle Stages:
Corresponding Models:
26
Recovery&
Extraction
Recovery&
Extraction RefiningRefining End UseEnd Use
Diluted Bitumen
SCO TranspFuelUpgradingUpgrading
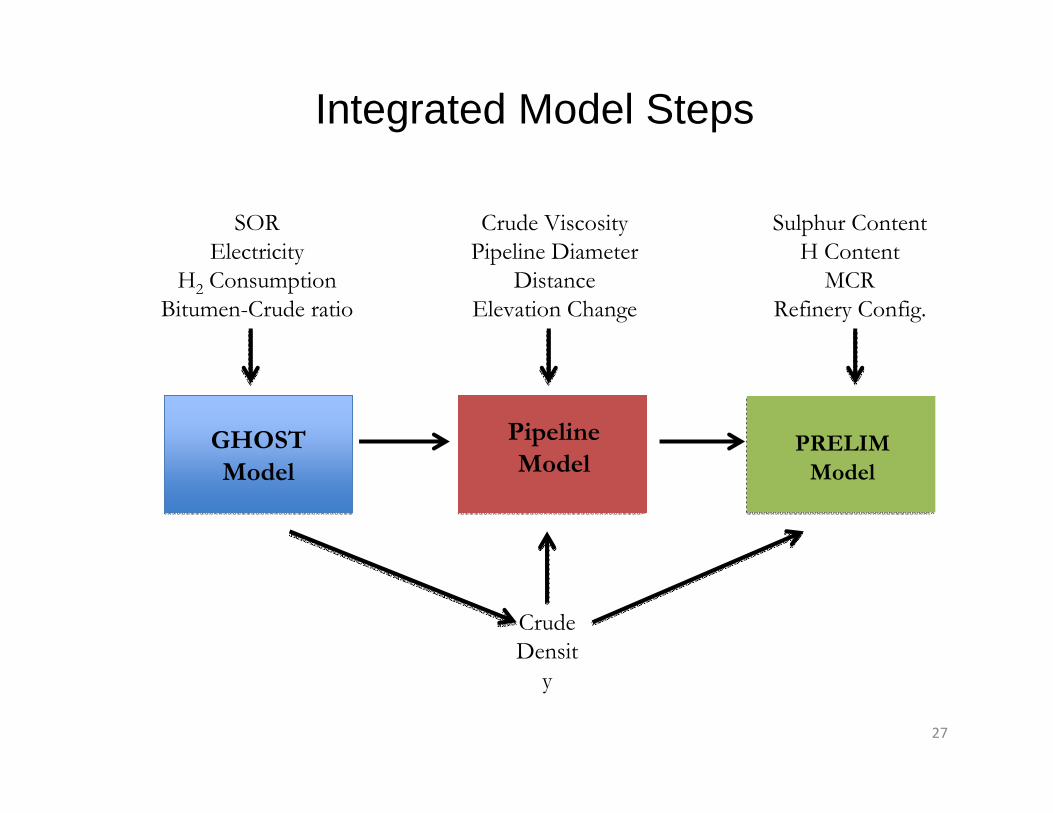
Integrated Model Steps
GHOST Model
Pipeline Model
PRELIM Model
27
SORElectricity
H2 ConsumptionBitumen-Crude ratio
Crude Densit
y
Crude ViscosityPipeline Diameter
DistanceElevation Change
Sulphur ContentH Content
MCRRefinery Config.
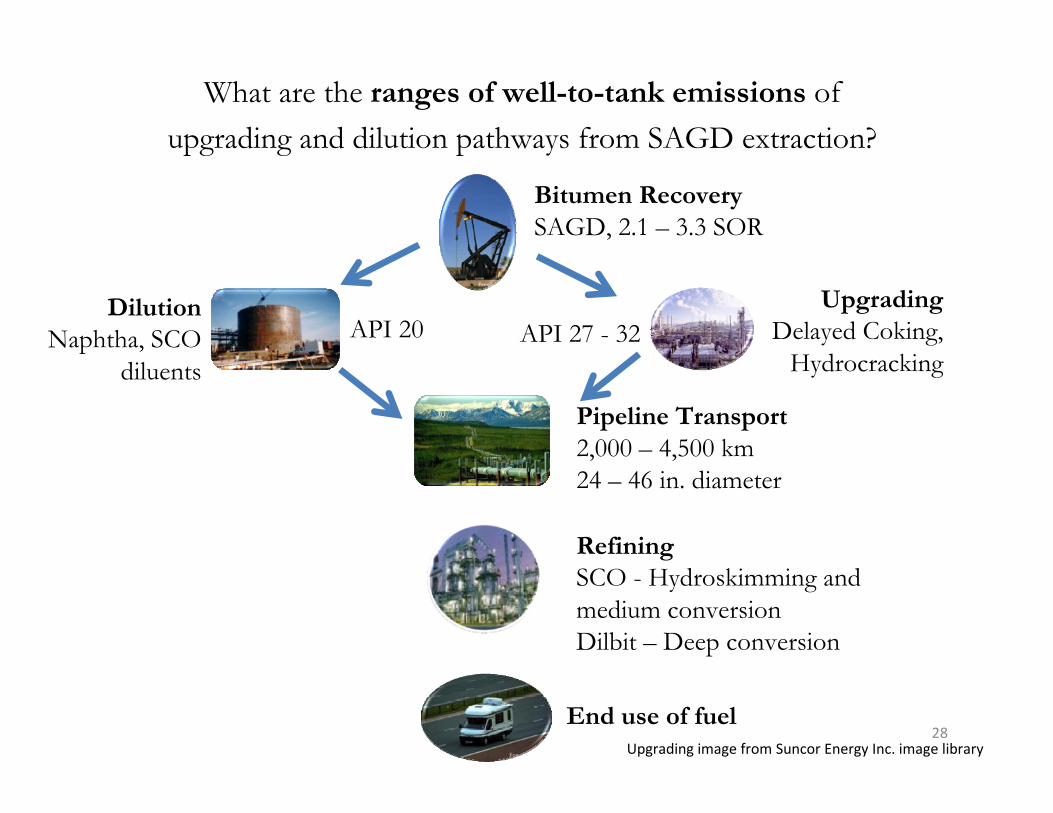
Upgrading image from Suncor Energy Inc. image library
Bitumen RecoverySAGD, 2.1 – 3.3 SOR
UpgradingDelayed Coking,
Hydrocracking
End use of fuel
DilutionNaphtha, SCO
diluents
Pipeline Transport2,000 – 4,500 km24 – 46 in. diameter
RefiningSCO - Hydroskimming and medium conversionDilbit – Deep conversion
API 20 API 27 - 32
What are the ranges of well-to-tank emissions of upgrading and dilution pathways from SAGD extraction?
28
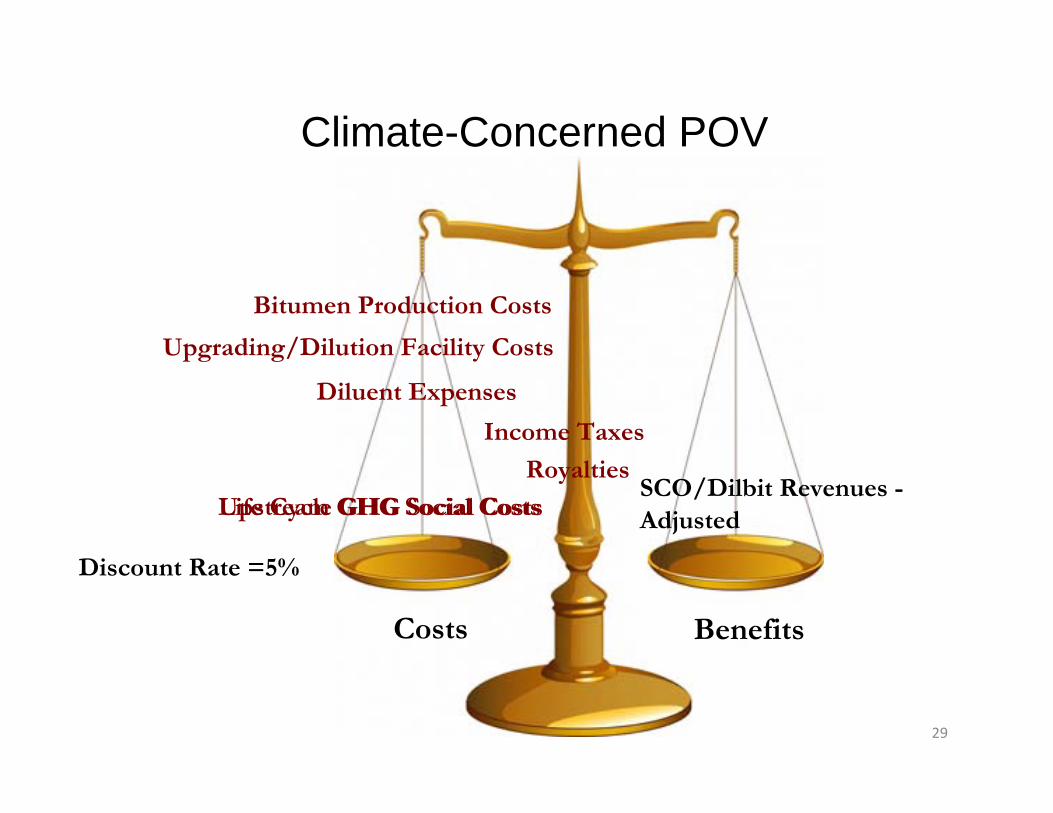
Climate-Concerned POV
Costs Benefits
Bitumen Production Costs
Upgrading/Dilution Facility Costs
Diluent Expenses
SCO/Dilbit Revenues -AdjustedLife Cycle GHG Social Costs
Discount Rate =5%
Royalties
Income Taxes
Upstream GHG Social Costs
29

Results
30
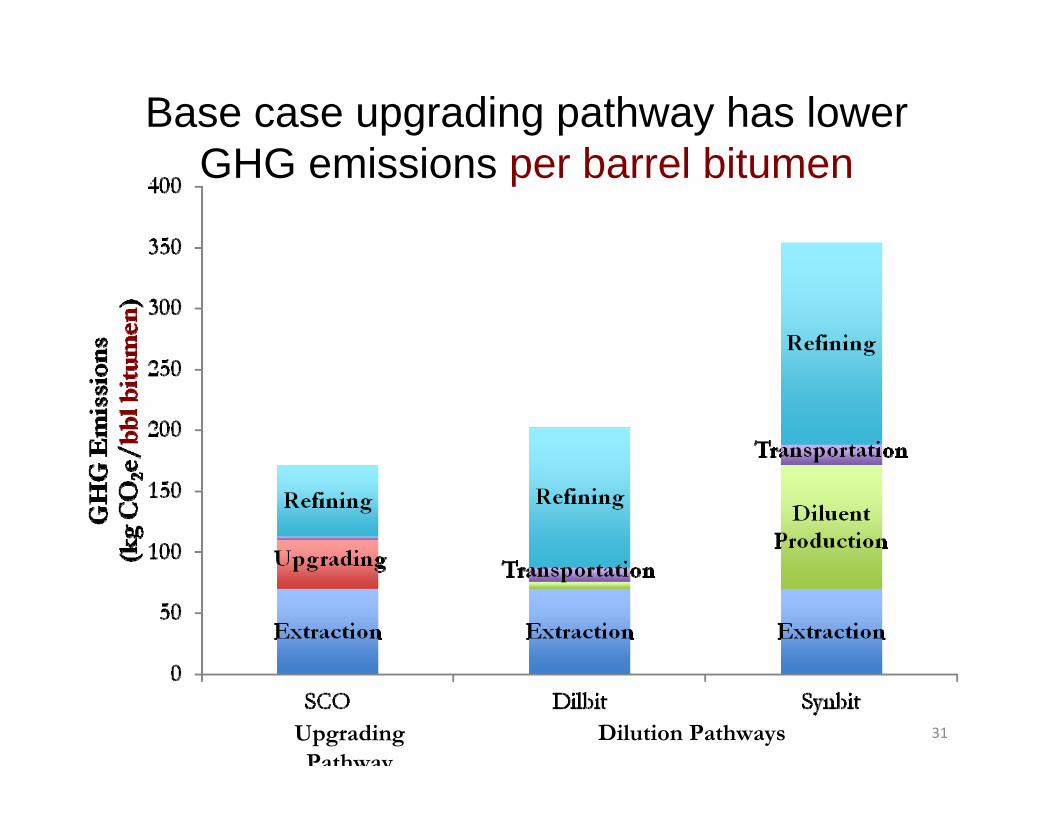
Base case upgrading pathway has lower GHG emissions per barrel bitumen
31Upgrading Pathway
Dilution Pathways
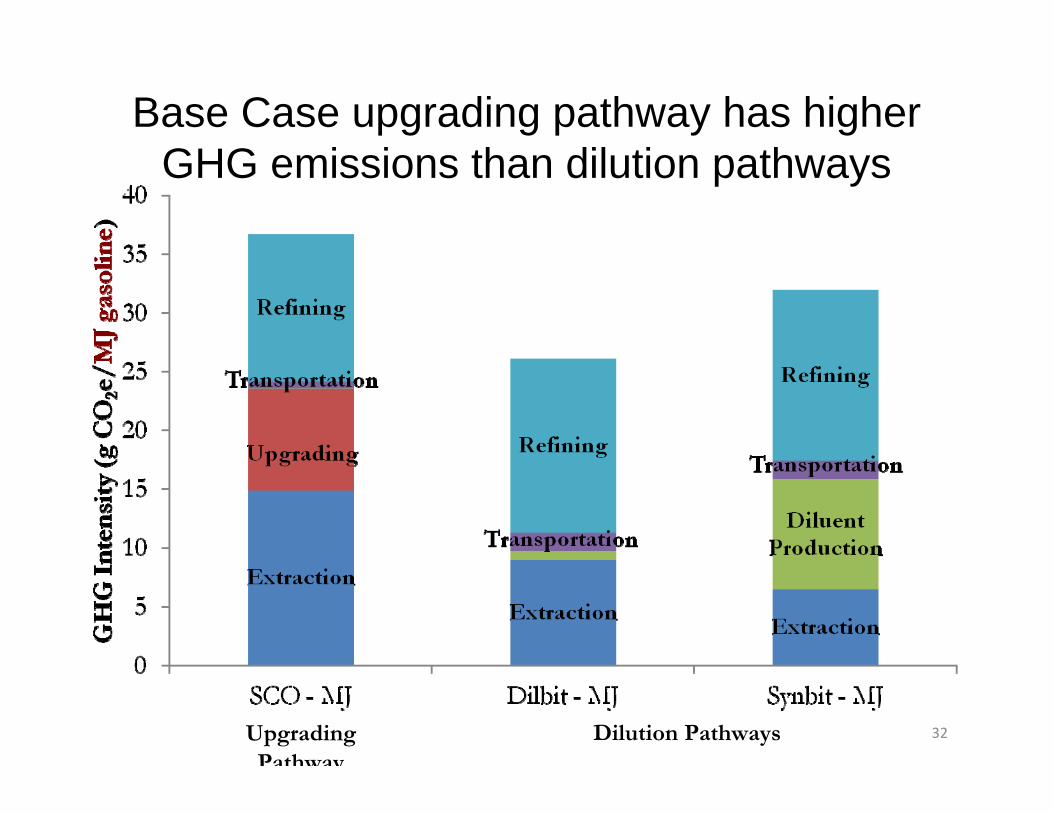
Base Case upgrading pathway has higher GHG emissions than dilution pathways
32Dilution PathwaysUpgrading Pathway
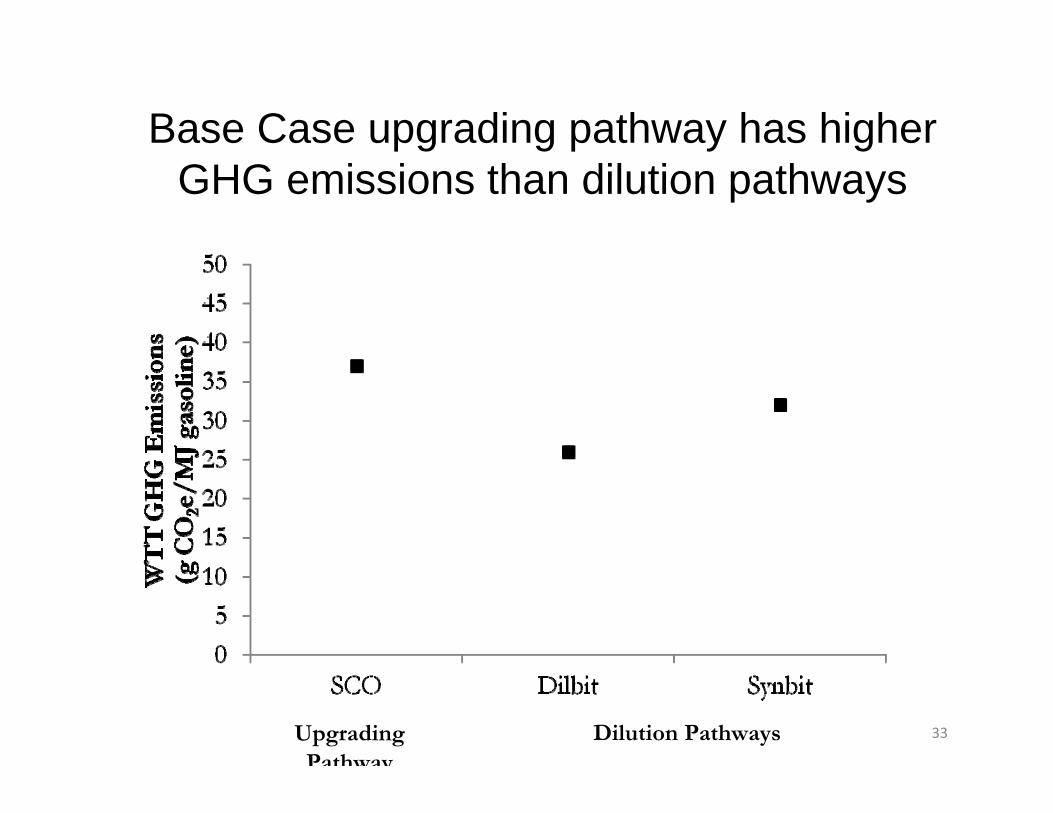
Base Case upgrading pathway has higher GHG emissions than dilution pathways
33Upgrading Pathway
Dilution Pathways
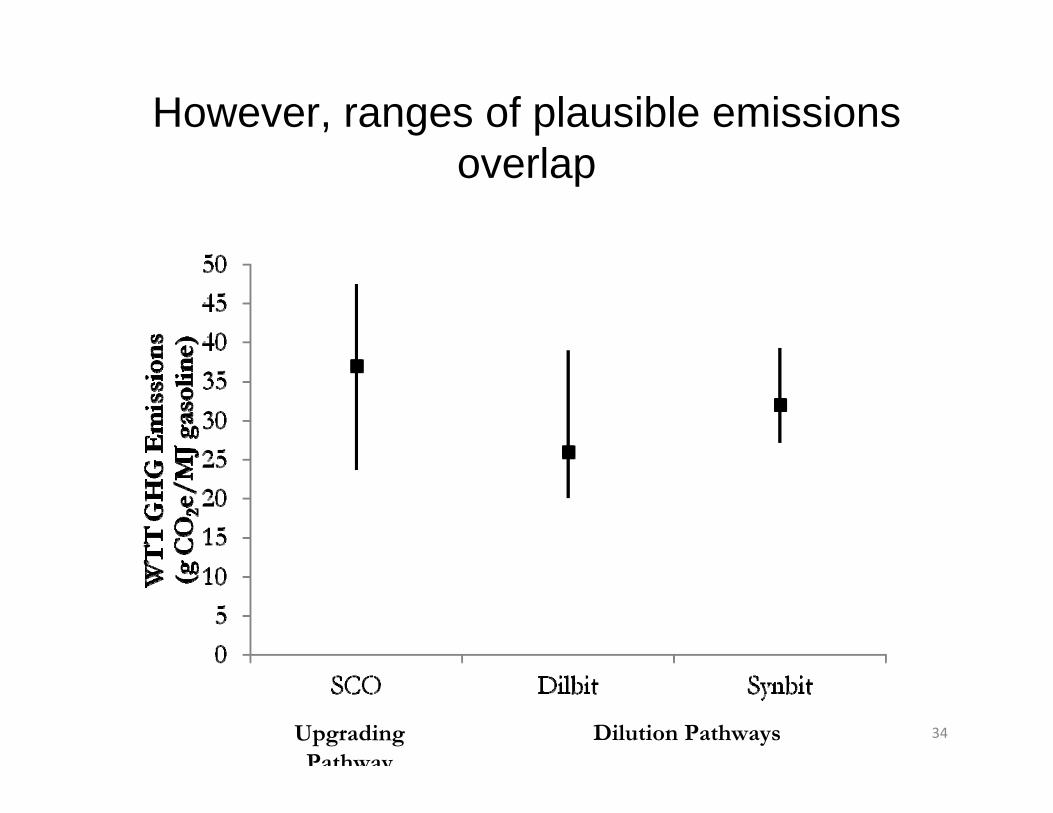
However, ranges of plausible emissions overlap
34Dilution PathwaysUpgrading Pathway
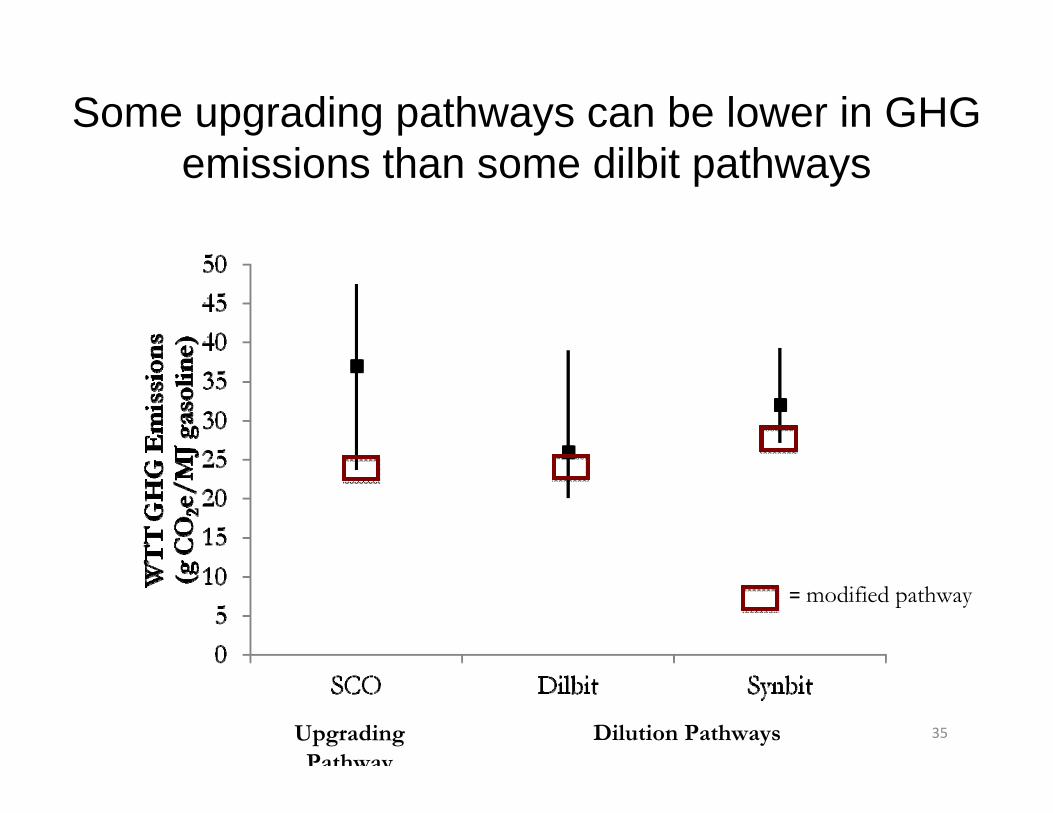
Some upgrading pathways can be lower in GHG emissions than some dilbit pathways
35
= modified pathway
Upgrading Pathway
Dilution Pathways
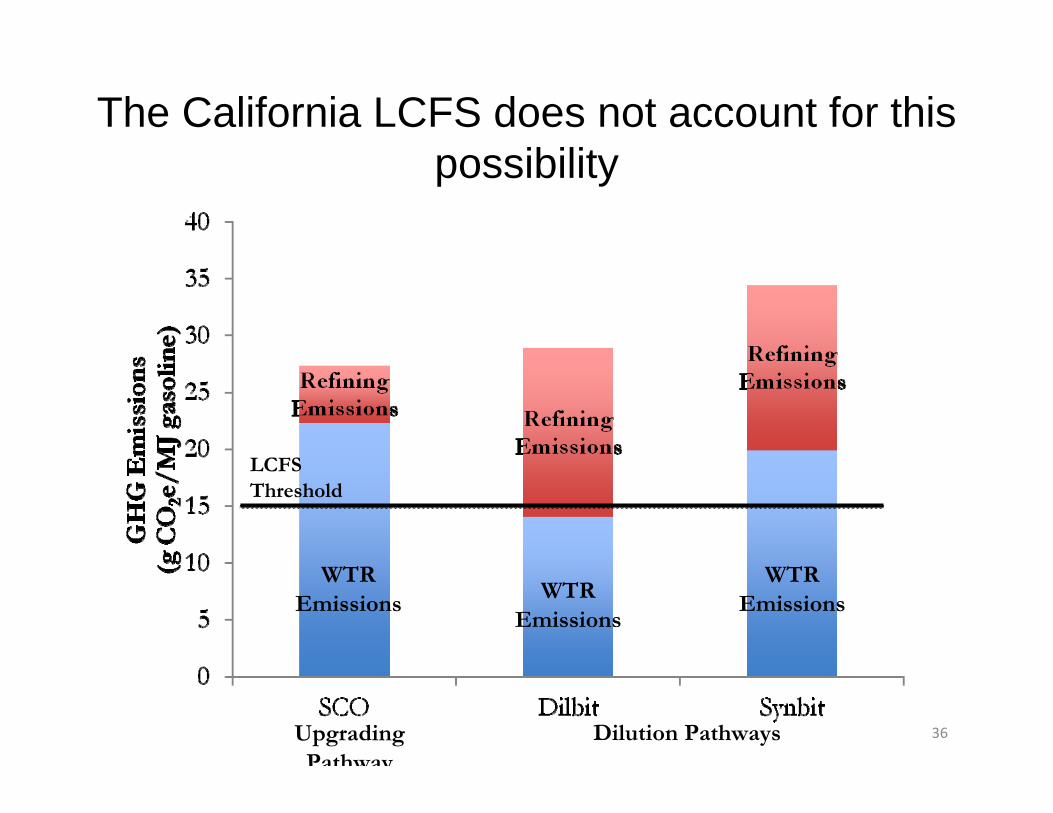
The California LCFS does not account for this possibility
WTR Emissions
WTR Emissions
WTR Emissions
36
LCFS Threshold
Dilution PathwaysUpgrading Pathway
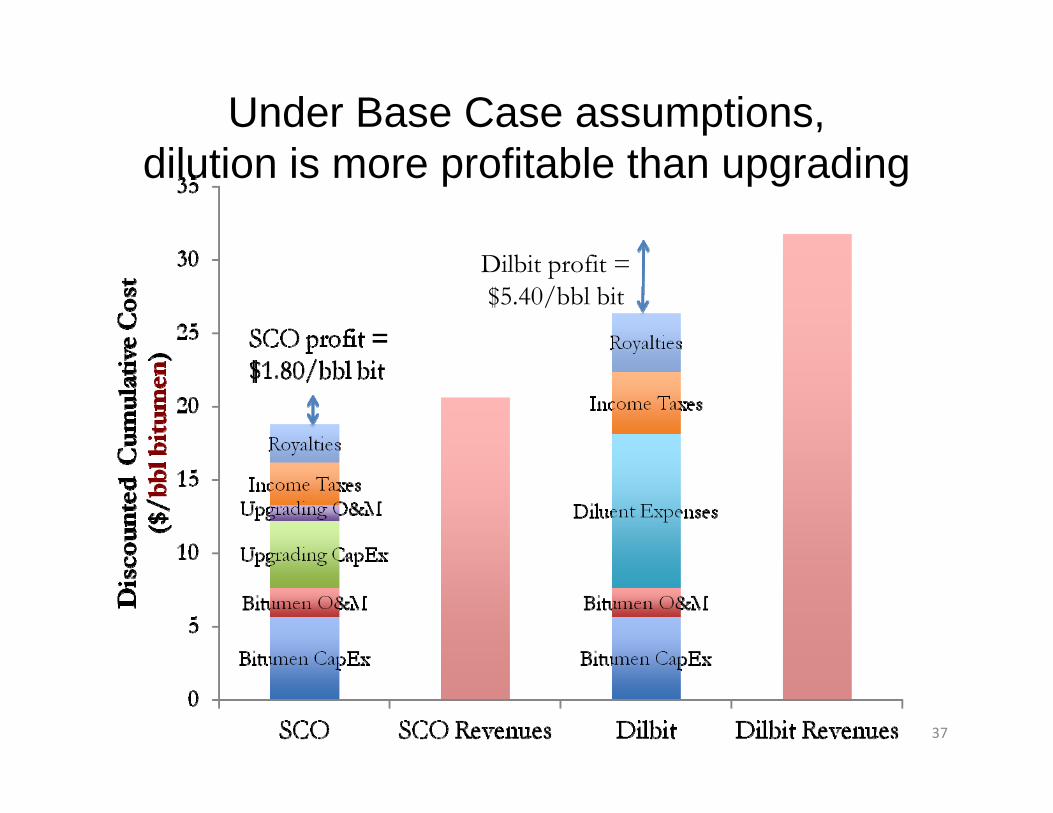
Under Base Case assumptions, dilution is more profitable than upgrading
Dilbit profit = $5.40/bbl bit
37
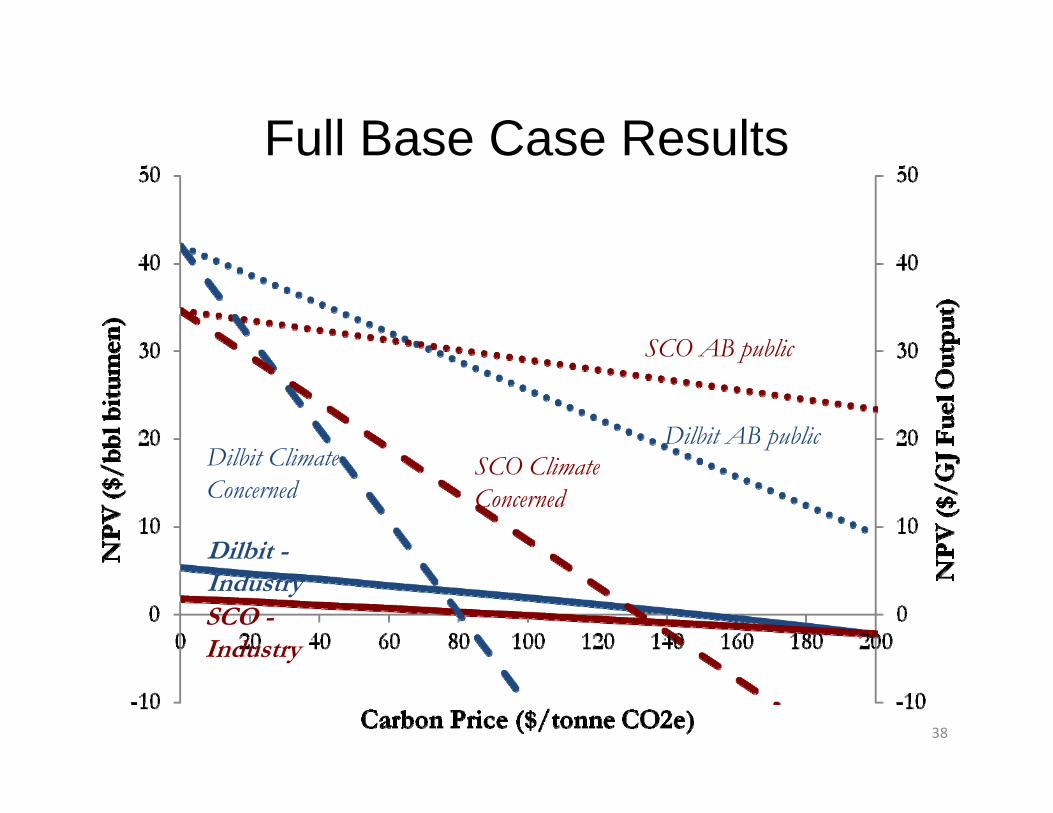
Full Base Case Results
38
Dilbit AB public
SCO AB public
Dilbit -IndustrySCO -Industry
Dilbit Climate Concerned
SCO Climate Concerned

Sensitivity Analyses
39
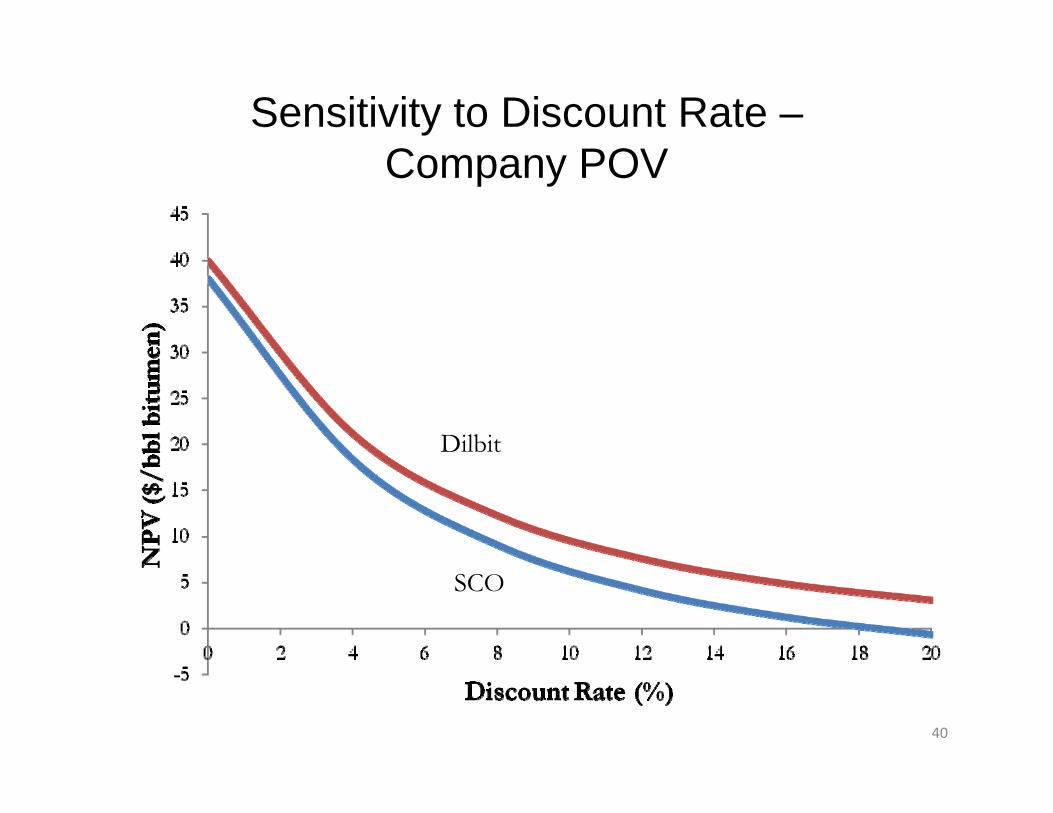
Sensitivity to Discount Rate –Company POV
40
Dilbit
SCO
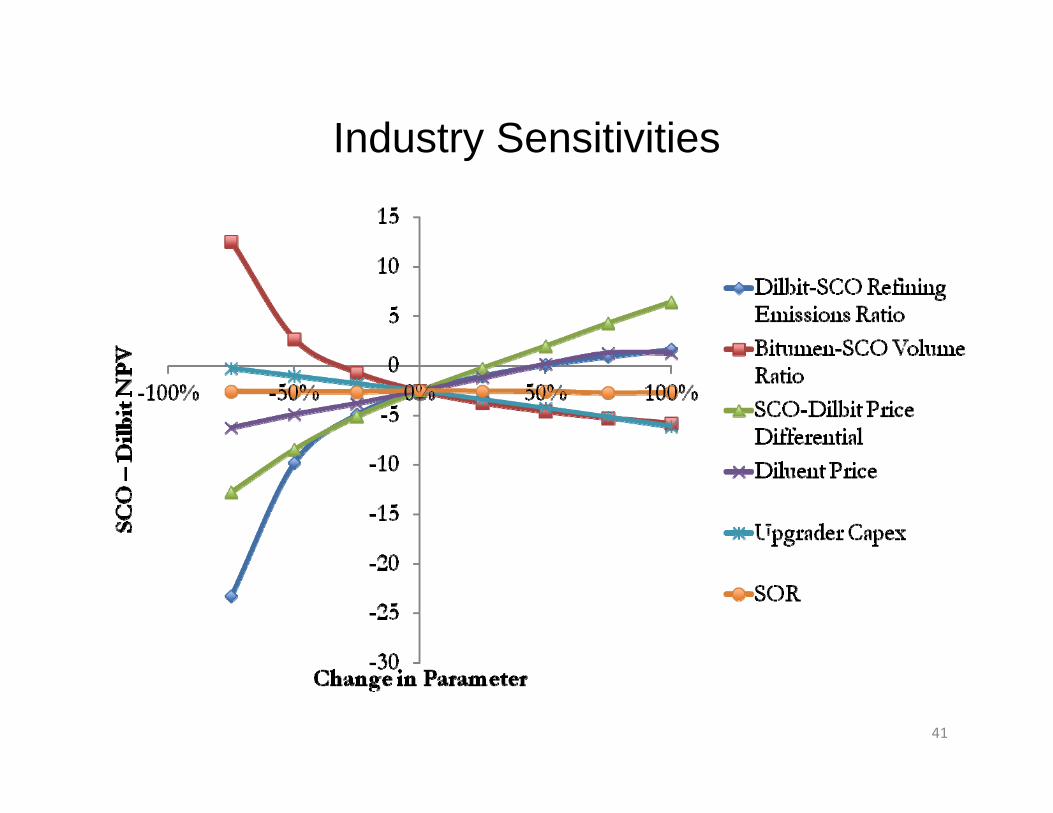
Industry Sensitivities
41
Industry results robust for economic variability
42
Industry results dependent ontechnical variability
43
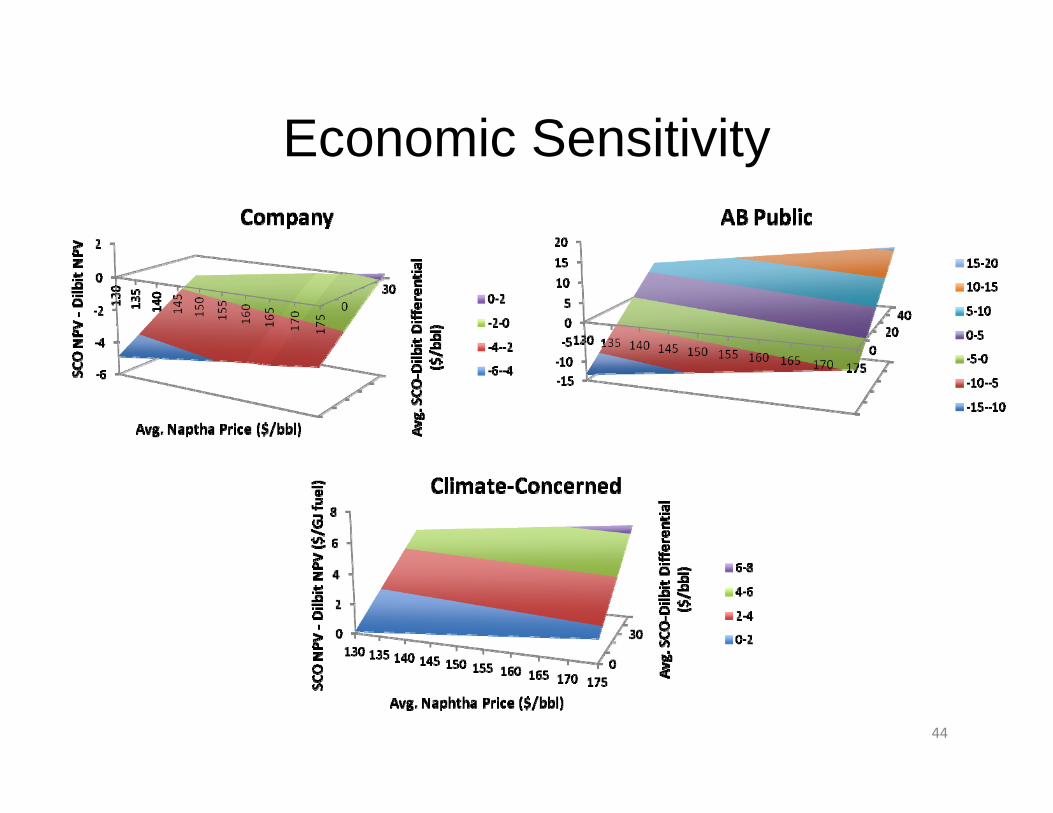
Economic Sensitivity
44

Economic Assumptions
45
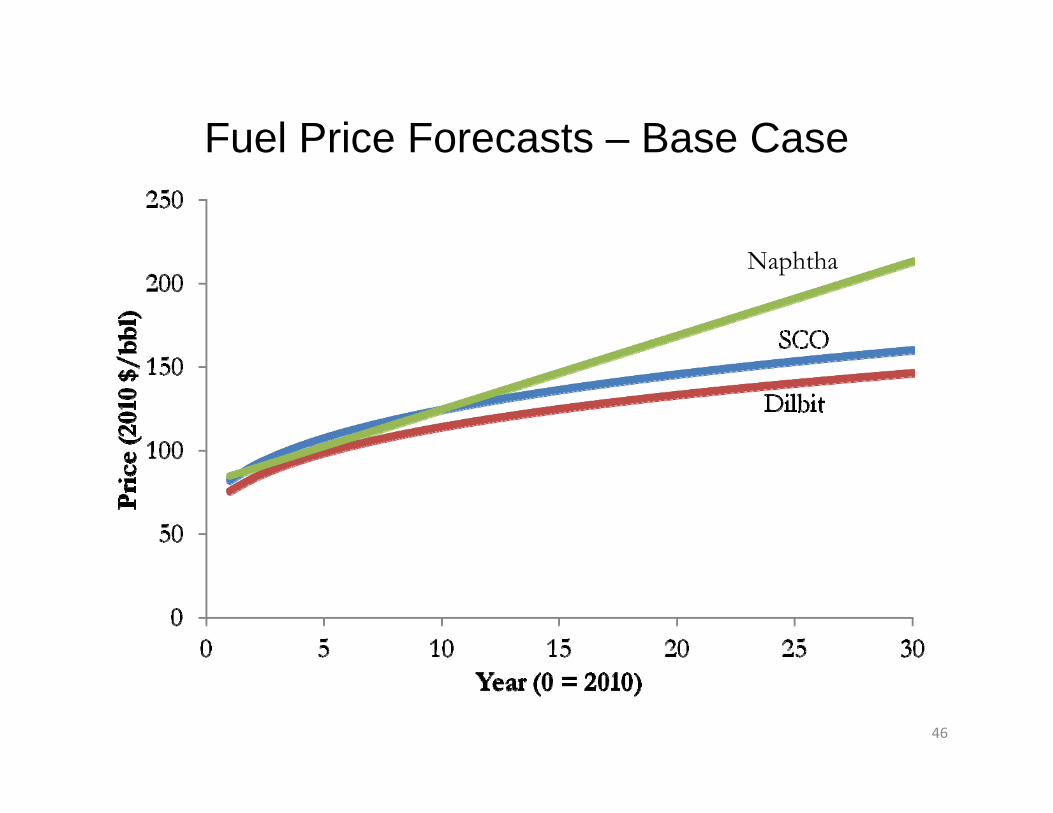
Fuel Price Forecasts – Base Case
46
Naphtha
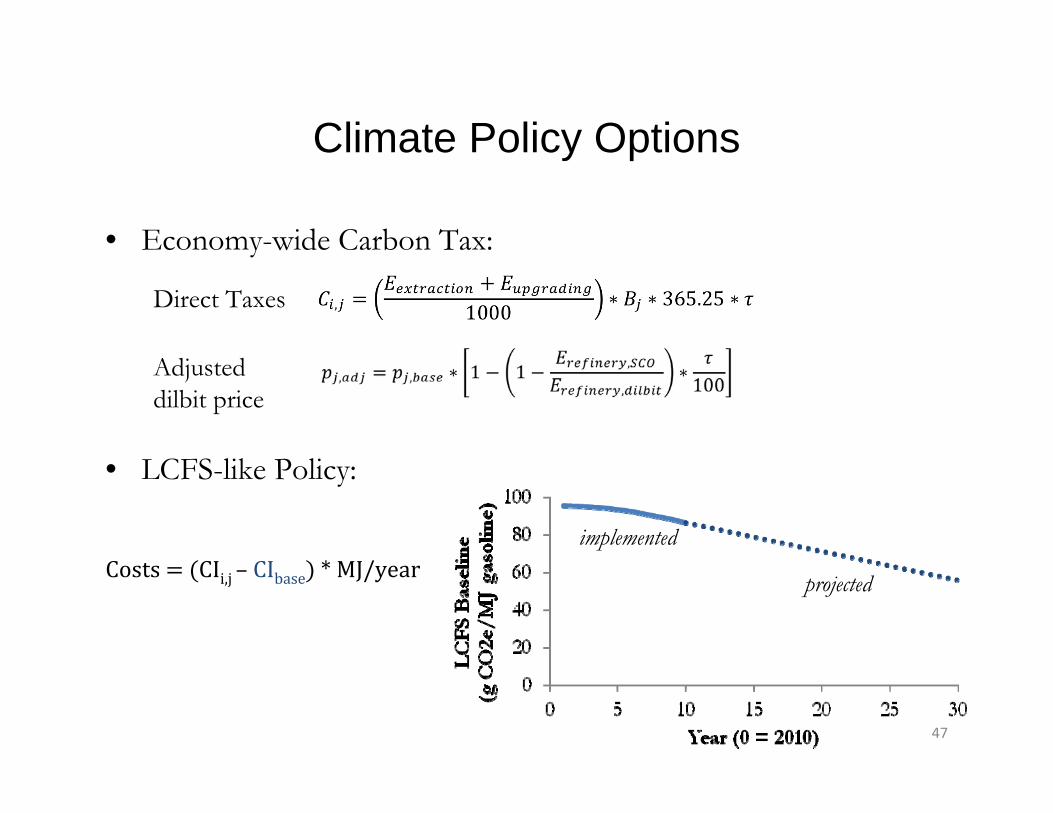
Climate Policy Options
• Economy-wide Carbon Tax:
• LCFS-like Policy:
Direct Taxes
Adjusted dilbit price
projected
implementedCosts CIi,j– CIbase *MJ/year
47

Comparison with Other Studies
48
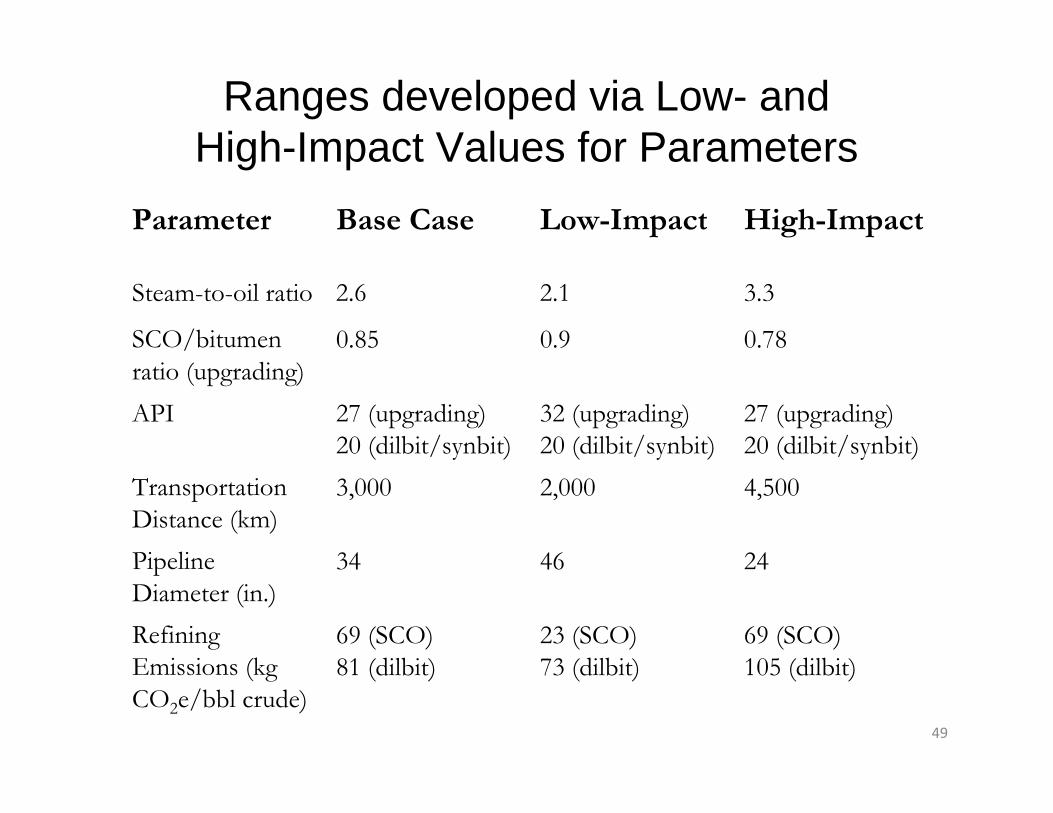
Ranges developed via Low- and High-Impact Values for Parameters
Parameter Base Case Low-Impact High-Impact
Steam-to-oil ratio 2.6 2.1 3.3
SCO/bitumen ratio (upgrading)
0.85 0.9 0.78
API 27 (upgrading)20 (dilbit/synbit)
32 (upgrading)20 (dilbit/synbit)
27 (upgrading)20 (dilbit/synbit)
Transportation Distance (km)
3,000 2,000 4,500
Pipeline Diameter (in.)
34 46 24
Refining Emissions (kg CO2e/bbl crude)
69 (SCO)81 (dilbit)
23 (SCO)73 (dilbit)
69 (SCO)105 (dilbit)
49
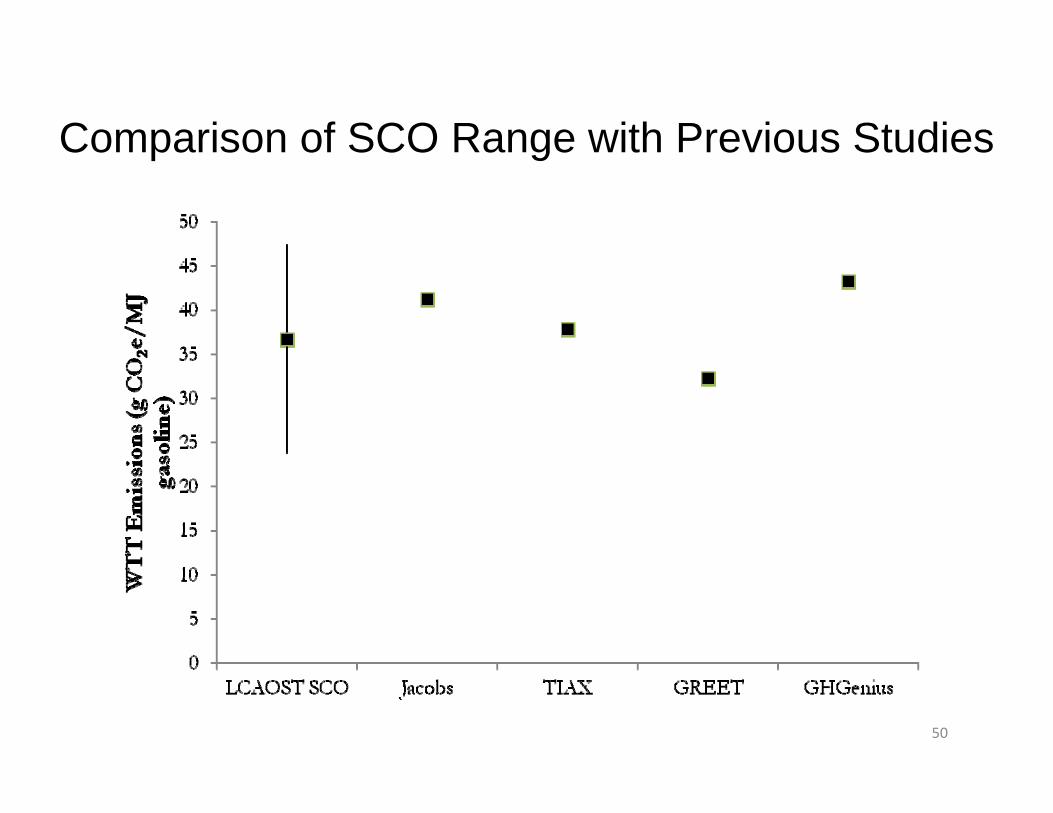
Comparison of SCO Range with Previous Studies
50
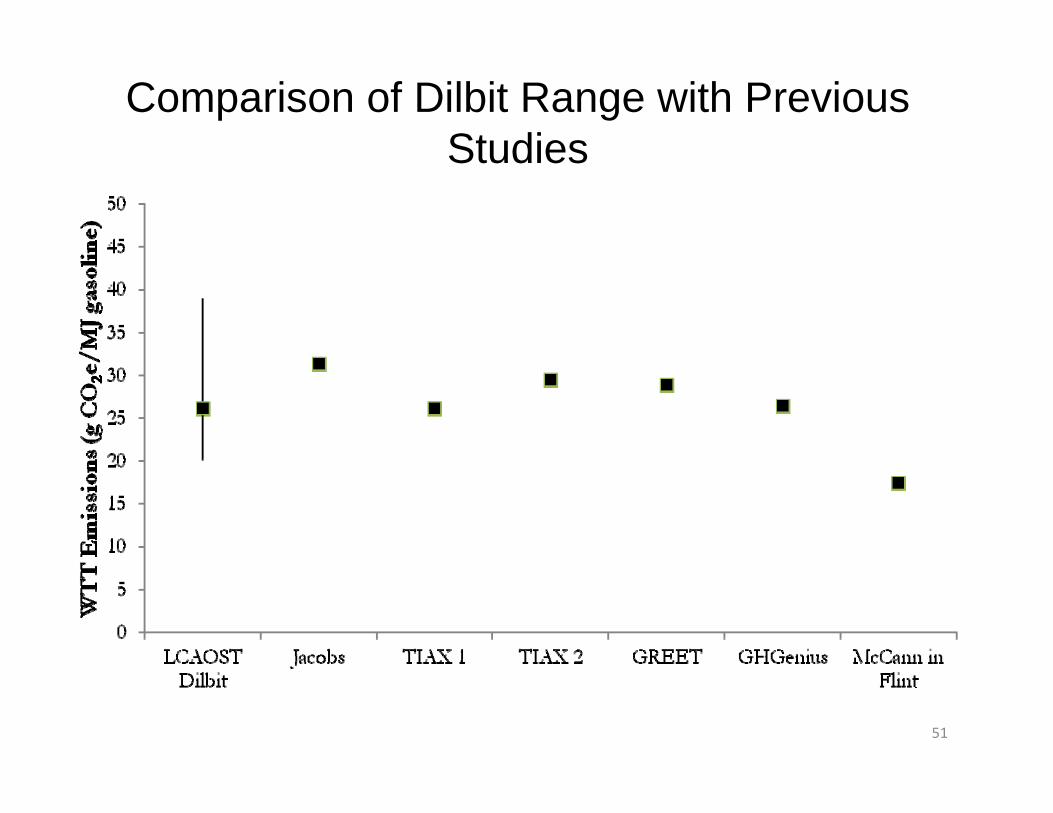
Comparison of Dilbit Range with Previous Studies
51
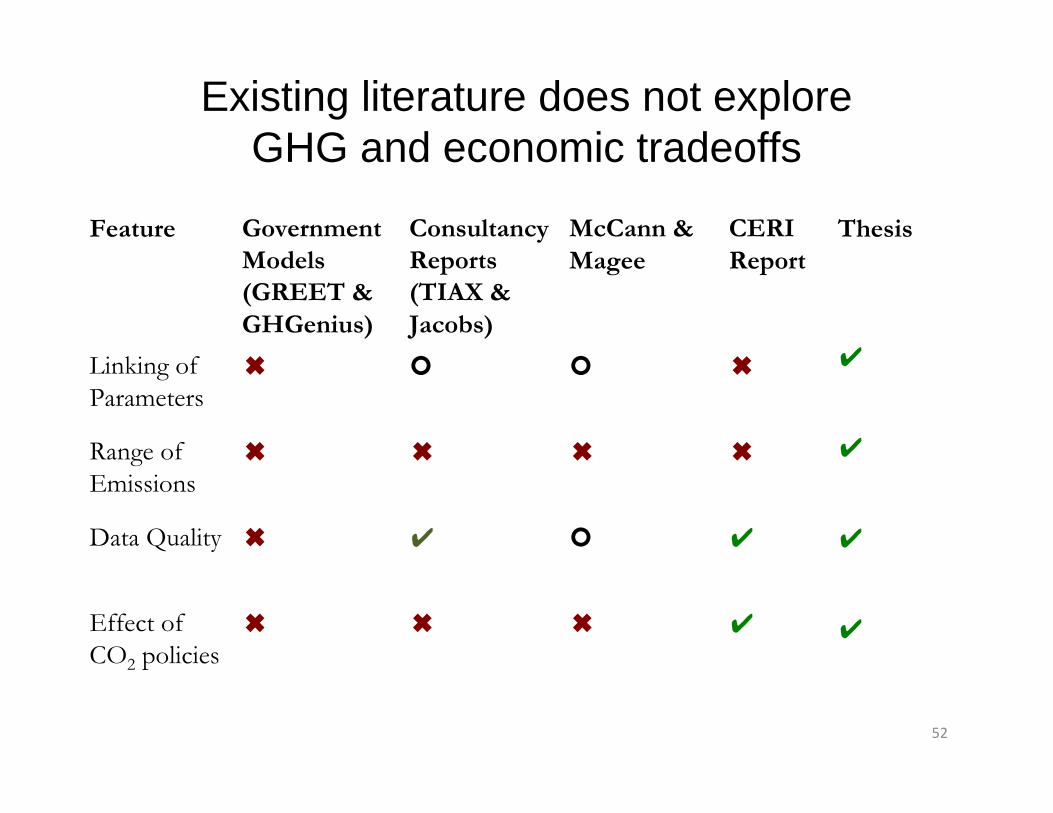
Existing literature does not explore GHG and economic tradeoffs
52
Feature Government Models (GREET & GHGenius)
Consultancy Reports (TIAX & Jacobs)
McCann & Magee
CERI Report
Linking of Parameters
✖ ✖
Range of Emissions
✖ ✖ ✖ ✖
Data Quality ✖ ✔ ✔
Effect of CO2 policies
✖ ✖ ✖ ✔
Thesis
✔
✔
✔
✔

Additional Material
53
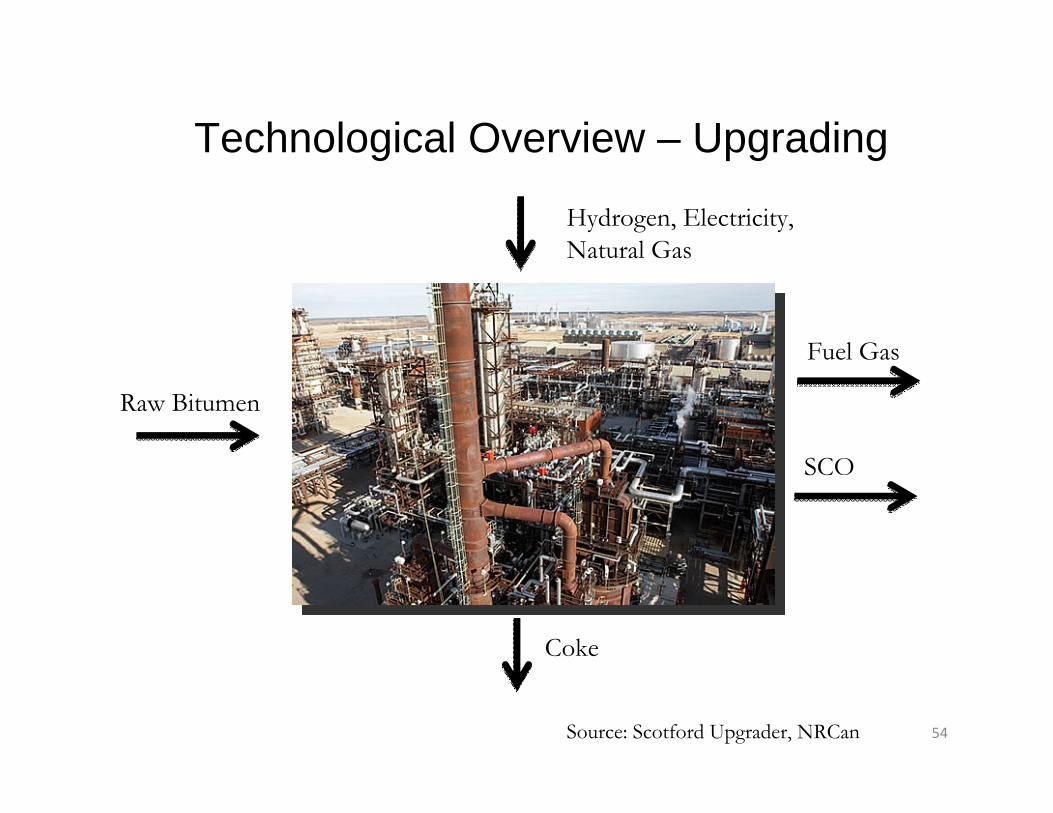
Technological Overview – Upgrading
54Source: Scotford Upgrader, NRCan
Raw Bitumen
Hydrogen, Electricity, Natural Gas
Coke
SCO
Fuel Gas
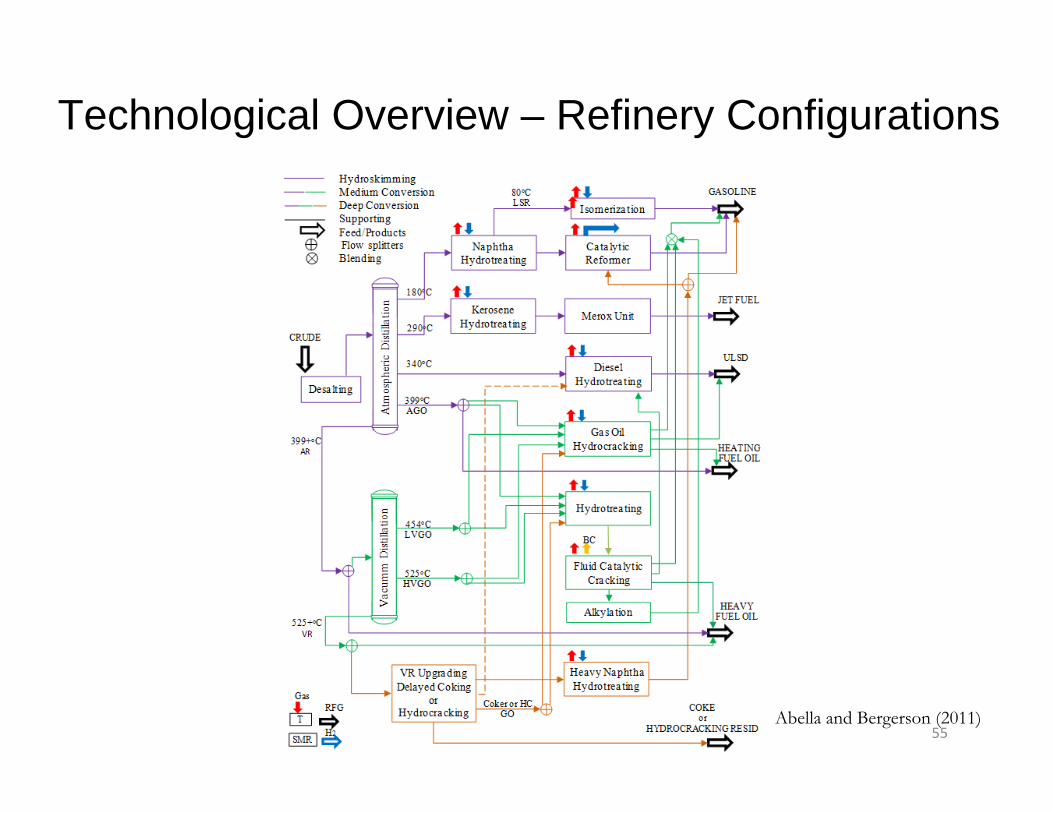
Technological Overview – Refinery Configurations
55Abella and Bergerson (2011)
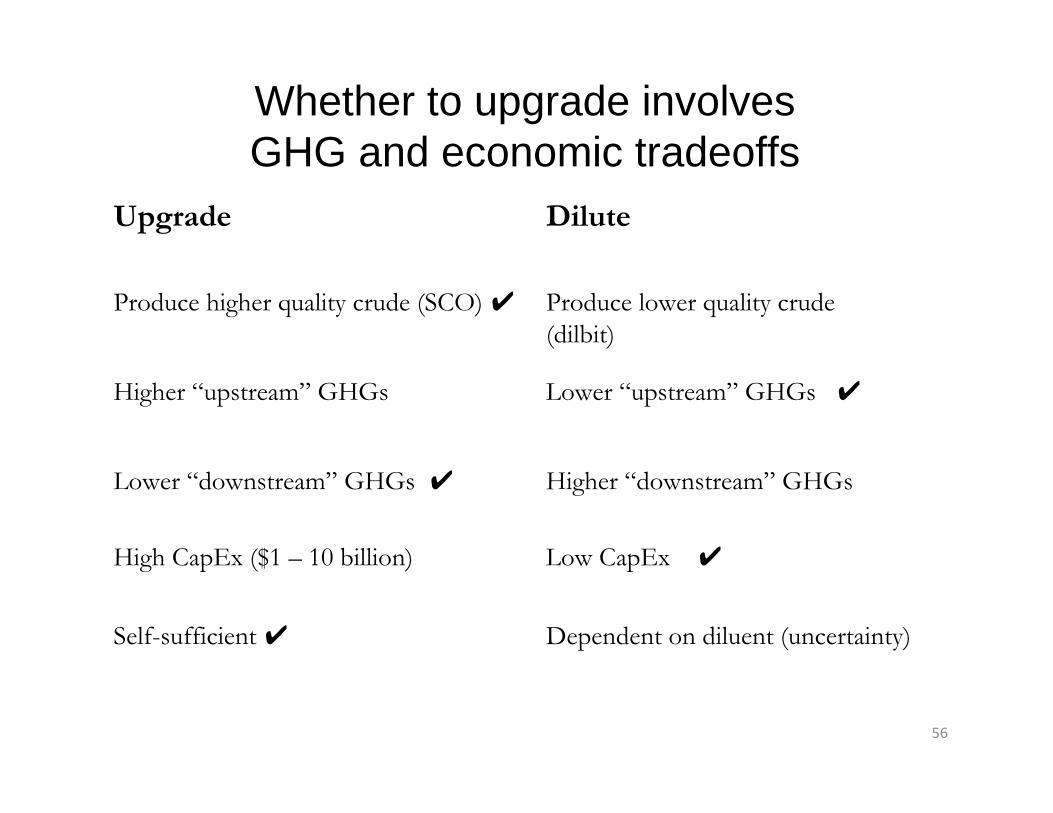
Whether to upgrade involvesGHG and economic tradeoffs
Upgrade Dilute
Produce higher quality crude (SCO) ✔ Produce lower quality crude(dilbit)
Higher “upstream” GHGs Lower “upstream” GHGs ✔
Lower “downstream” GHGs ✔ Higher “downstream” GHGs
High CapEx ($1 – 10 billion) Low CapEx ✔
Self-sufficient ✔ Dependent on diluent (uncertainty)
56