Embed Size (px)
Citation preview
Alberta Royalty Review 2007 Oil Sands Economics and Royalty Series
Alberta Department of Energy 1
Appendix “A” - Technical Report OS#1
Markets and Pricing for Alberta Bitumen Production
Introduction Bitumen prices form the basis for royalty calculation and valuation for all new oil sands projects since 1997. As such, the pricing of bitumen and synthetic crude oil (SCO) is critical to the understanding of oil sands project economics, including the Crown’s interests as the resource owner and royalty collector. This report compliments Technical Report OS#1: Alberta’s Oil Sands Fiscal System – History and System Performance. It is intended to provide background to the prices used for the analysis in that report. The present report will describe: (1) the oil sands resource, (2) the markets for oil sands products, (3) the context and manner in which bitumen and SCO are priced, (4) Oil Prices and Price Volatility, and (5) Special Issues in Pricing Bitumen and SCO. The report concludes with (6) a discussion of price risk for both the investor and the Crown.
1. Alberta’s Oil Sands Resource Alberta’s oil sands resource is very heavy oil called bitumen. Heavy oil and bitumen have larger, more complex molecules than light oil. Figure 1 shows the hydrocarbon spectrum from very light oil (Natural Gas Liquids) to very heavy oil (Bitumen). Figure 1: Density Spectrum of Alberta Crude Types1
Alberta Crude Density and Type
Condensates
Light crude
Medium crude
Heavy crude Bitumen
Natural Gas Liquids
0
0.2
0.4
0.6
0.8
1
1.2
152
104 45 30 25 16
API Gravity
Spec
ific
Gra
vity
(wat
er =
1)
Requires Blending with Diluent
Source: Alberta Energy, Enbridge, Alberta Energy and Utilities Board
1 Specific gravity measures weight. The reference is 1, which is the weight of water. Specific gravity and
API gravity are related by the following formula:
API Gravity = (141.5/Specific Gravity @ 60o F) – 131.5
Alberta Royalty Review 2007 Oil Sands Economics and Royalty Series
Alberta Department of Energy 2
Within this spectrum there are various crude types. Natural gas liquids and condensate are light oils that come from natural gas production and processing. Heavy crude such as Bow River Blend is produced by conventional means. Bitumen, however, is very heavy and thus generally requires other production methods such as mining or in-situ Steam Assisted Gravity Drainage. Light crude oil, such as Edmonton Mixed Sweet and medium crude such as Central Alberta Sour are comparable to many other crudes produced around the world. As such, these crudes have readily available substitutes in the international market. For heavy and very heavy crude, however, there are fewer international substitutes. The most direct comparators for Alberta heavy crude and bitumen are Venezuela and Mexico. It is noted that most heavy crude and all bitumen require blending with light oil referred to as diluent to enable pipeline transportation. Synthetic crude oil is produced by upgrading heavy oil or bitumen. Upgrading removes the heavier part of the crude, leaving a lighter crude oil. An upgrader can be designed to improve the quality of heavy oil or bitumen to anywhere within the medium to light range of crude density.
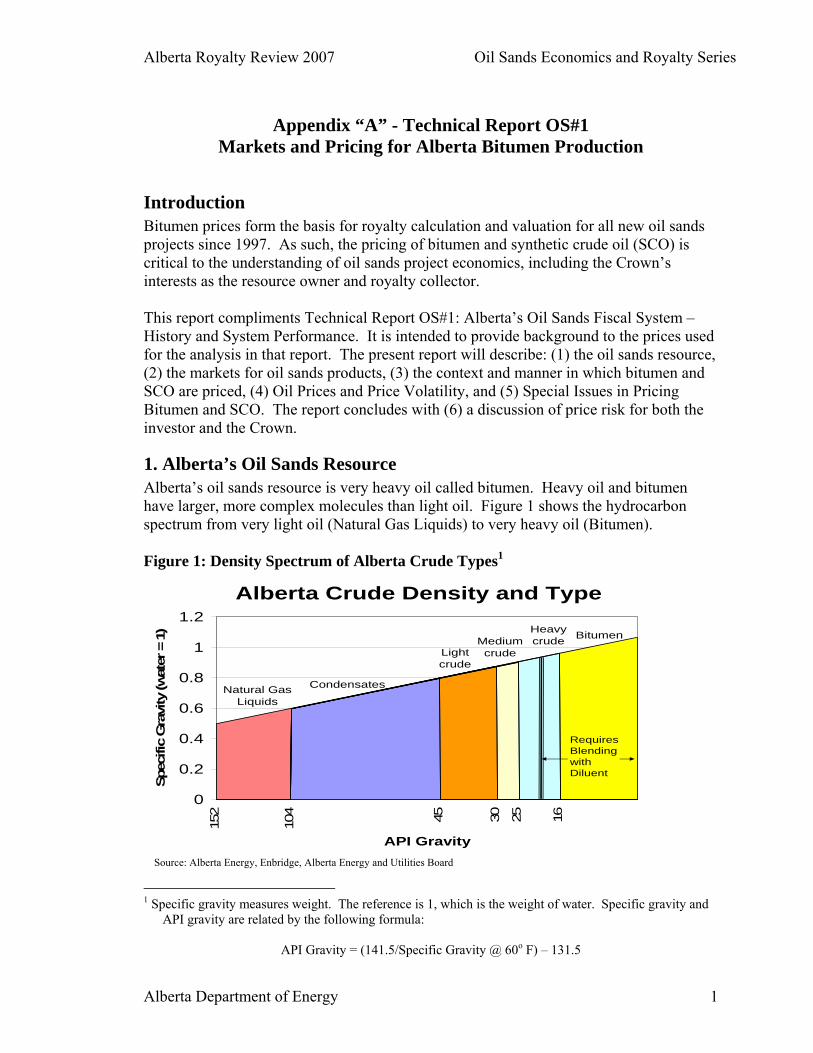
(2) Alberta Crude Disposition and Markets Large-scale oil production began in Alberta with the discovery at Leduc in 1947. Conventional production peaked at 1.4 million bbl/d in 1973. Since then Alberta’s oil production has been supplemented with additional volumes of heavy oil and with synthetic crude from the oil sands. Total production today at 1.7 million bbl/d, is higher than it was over 30 years ago. See Figure 2. Figure 2: Alberta Crude Oil Production; 1973-2005
Alberta Crude Oil Production
0.00.20.40.60.81.01.21.41.61.8
1973
1977
1981
1985
1989
1993
1997
2001
2005
Mill
ions
bbl
/d BitumenHeavy CrudeC5+Synthetic CrudeLight crude
Source: Alberta Energy and Utilities Board
Alberta Royalty Review 2007 Oil Sands Economics and Royalty Series
Alberta Department of Energy 3
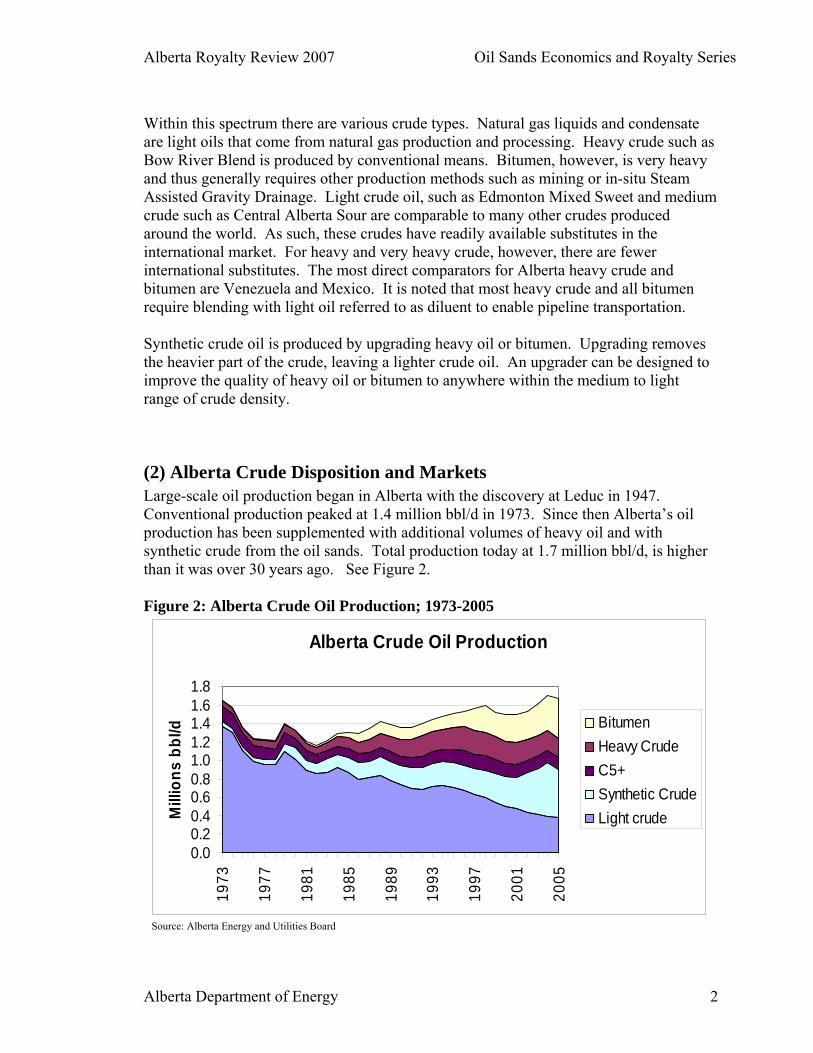
As Alberta crude oil production increased additional markets were needed. Core markets for Alberta crude were established in the 1950s with the construction of the Interprovincial Pipeline east across the prairies and then to the US and central Canada, as well as the Trans Mountain Pipeline west to British Columbia and then to Washington State. As Western Canadian crude oil production continued to increase, more-and-more western Canadian crude found a home in the US Midwest (Chicago area). Figure 3 shows the markets for Alberta crude oil, SCO, and bitumen. The share to the Midwest has grown and Canadian imports dominate in that market. The share to other US markets has experienced strong growth since the mid 1990s when the Express pipeline connecting Alberta to the US Rocky Mountain district was commissioned. Figure 3: Disposition of Alberta Crude by Destination; 1990-2005
Disposition of Alberta Crude Oil
0
500
1,000
1,500
2,000
2,500
1990
1993
1996
1999
2002
2005
thou
sand
s bb
l/d
OffshoreOther USRest of CanadaAlbertaUS Midwest
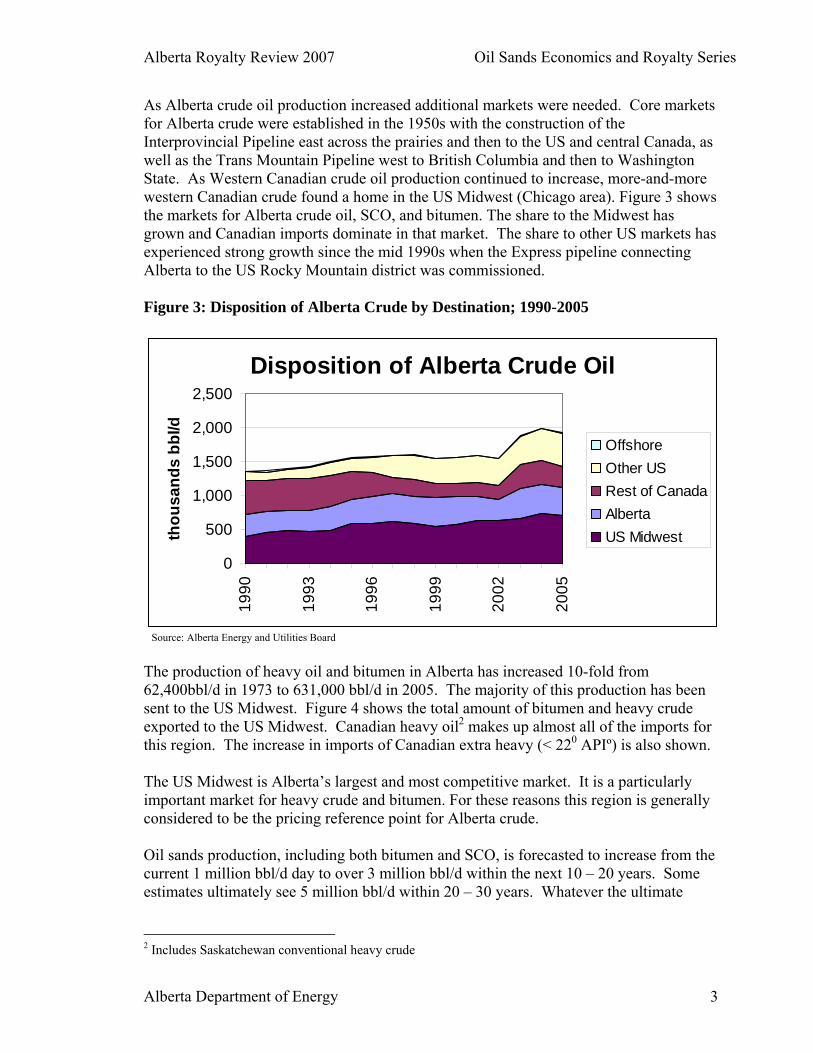
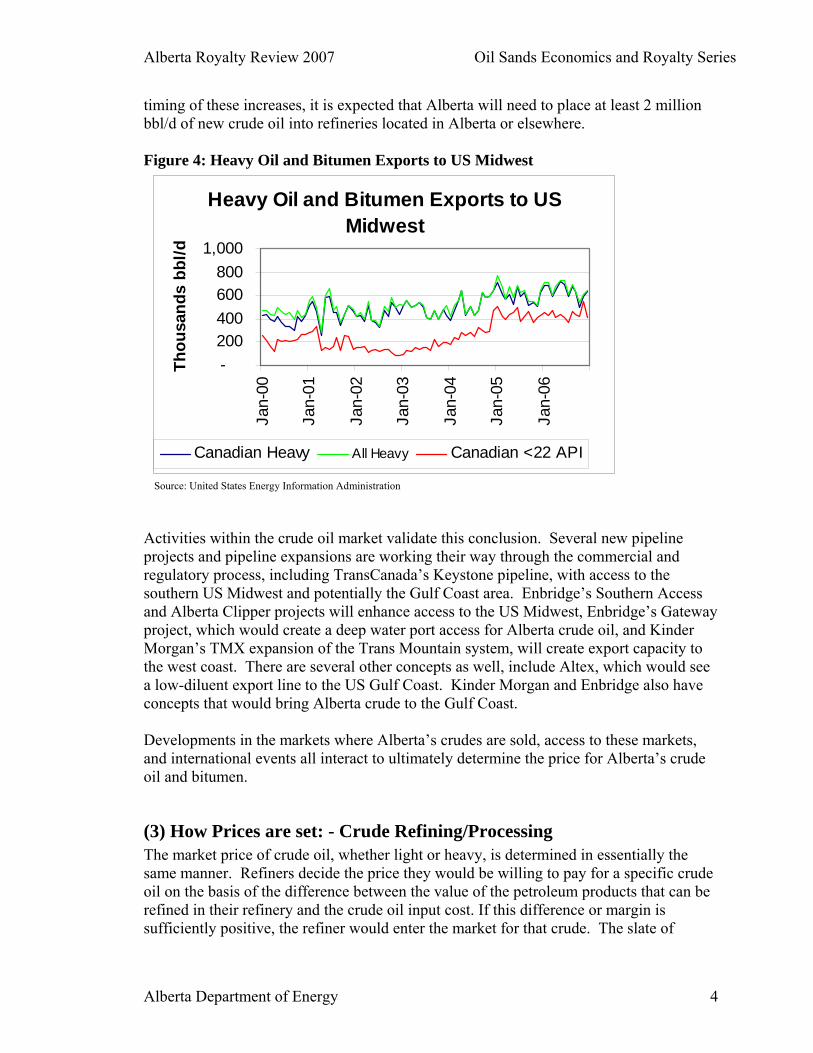
Source: Alberta Energy and Utilities Board The production of heavy oil and bitumen in Alberta has increased 10-fold from 62,400bbl/d in 1973 to 631,000 bbl/d in 2005. The majority of this production has been sent to the US Midwest. Figure 4 shows the total amount of bitumen and heavy crude exported to the US Midwest. Canadian heavy oil2 makes up almost all of the imports for this region. The increase in imports of Canadian extra heavy (< 220 APIº) is also shown. The US Midwest is Alberta’s largest and most competitive market. It is a particularly important market for heavy crude and bitumen. For these reasons this region is generally considered to be the pricing reference point for Alberta crude. Oil sands production, including both bitumen and SCO, is forecasted to increase from the current 1 million bbl/d day to over 3 million bbl/d within the next 10 – 20 years. Some estimates ultimately see 5 million bbl/d within 20 – 30 years. Whatever the ultimate
2 Includes Saskatchewan conventional heavy crude
Alberta Royalty Review 2007 Oil Sands Economics and Royalty Series
Alberta Department of Energy 4
timing of these increases, it is expected that Alberta will need to place at least 2 million bbl/d of new crude oil into refineries located in Alberta or elsewhere. Figure 4: Heavy Oil and Bitumen Exports to US Midwest
Heavy Oil and Bitumen Exports to US Midwest
-200400600800
1,000Ja
n-00
Jan-
01
Jan-
02
Jan-
03
Jan-
04
Jan-
05
Jan-
06
Thou
sand
s bb
l/d
Canadian Heavy All Heavy Canadian <22 API
Source: United States Energy Information Administration Activities within the crude oil market validate this conclusion. Several new pipeline projects and pipeline expansions are working their way through the commercial and regulatory process, including TransCanada’s Keystone pipeline, with access to the southern US Midwest and potentially the Gulf Coast area. Enbridge’s Southern Access and Alberta Clipper projects will enhance access to the US Midwest, Enbridge’s Gateway project, which would create a deep water port access for Alberta crude oil, and Kinder Morgan’s TMX expansion of the Trans Mountain system, will create export capacity to the west coast. There are several other concepts as well, include Altex, which would see a low-diluent export line to the US Gulf Coast. Kinder Morgan and Enbridge also have concepts that would bring Alberta crude to the Gulf Coast. Developments in the markets where Alberta’s crudes are sold, access to these markets, and international events all interact to ultimately determine the price for Alberta’s crude oil and bitumen.
(3) How Prices are set: - Crude Refining/Processing The market price of crude oil, whether light or heavy, is determined in essentially the same manner. Refiners decide the price they would be willing to pay for a specific crude oil on the basis of the difference between the value of the petroleum products that can be refined in their refinery and the crude oil input cost. If this difference or margin is sufficiently positive, the refiner would enter the market for that crude. The slate of
Alberta Royalty Review 2007 Oil Sands Economics and Royalty Series
Alberta Department of Energy 5
products a refiner can extract from a particular crude type is a function of the type of refining units that exist in the refinery.
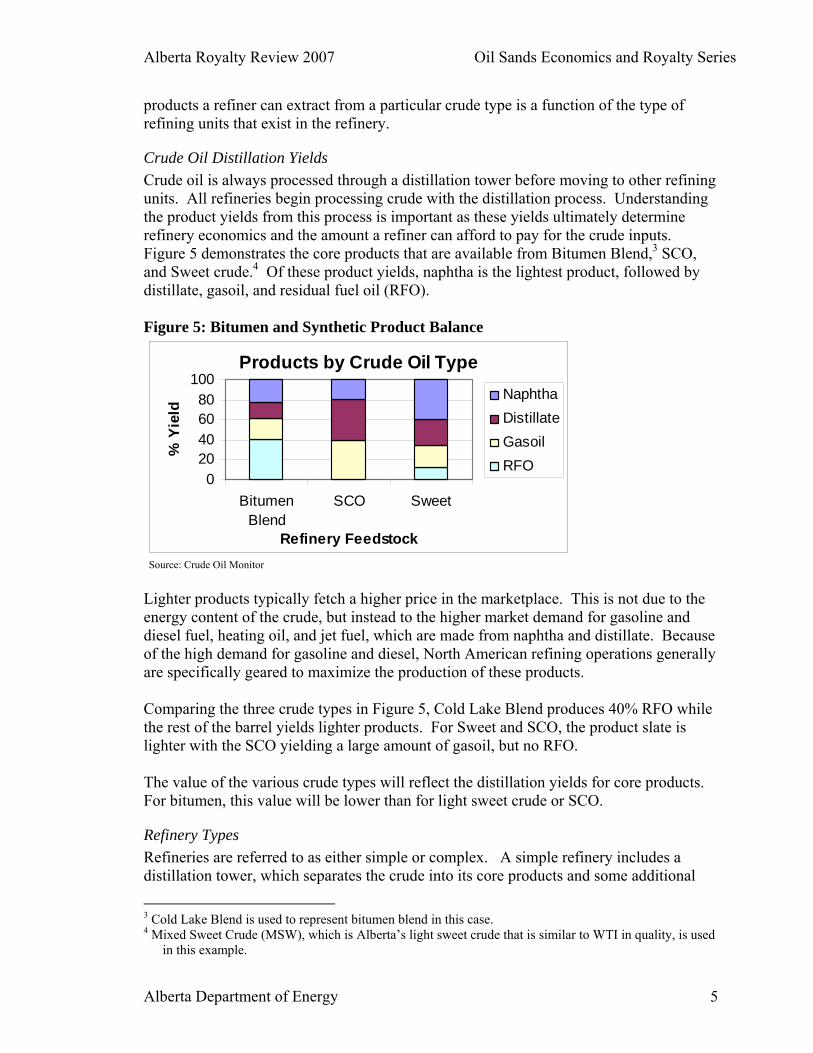
Crude Oil Distillation Yields Crude oil is always processed through a distillation tower before moving to other refining units. All refineries begin processing crude with the distillation process. Understanding the product yields from this process is important as these yields ultimately determine refinery economics and the amount a refiner can afford to pay for the crude inputs. Figure 5 demonstrates the core products that are available from Bitumen Blend,3 SCO, and Sweet crude.4 Of these product yields, naphtha is the lightest product, followed by distillate, gasoil, and residual fuel oil (RFO). Figure 5: Bitumen and Synthetic Product Balance
Products by Crude Oil Type
020406080
100
BitumenBlend
SCO Sweet
Refinery Feedstock
% Y
ield
NaphthaDistillateGasoilRFO
Source: Crude Oil Monitor Lighter products typically fetch a higher price in the marketplace. This is not due to the energy content of the crude, but instead to the higher market demand for gasoline and diesel fuel, heating oil, and jet fuel, which are made from naphtha and distillate. Because of the high demand for gasoline and diesel, North American refining operations generally are specifically geared to maximize the production of these products. Comparing the three crude types in Figure 5, Cold Lake Blend produces 40% RFO while the rest of the barrel yields lighter products. For Sweet and SCO, the product slate is lighter with the SCO yielding a large amount of gasoil, but no RFO. The value of the various crude types will reflect the distillation yields for core products. For bitumen, this value will be lower than for light sweet crude or SCO.
Refinery Types Refineries are referred to as either simple or complex. A simple refinery includes a distillation tower, which separates the crude into its core products and some additional
3 Cold Lake Blend is used to represent bitumen blend in this case. 4 Mixed Sweet Crude (MSW), which is Alberta’s light sweet crude that is similar to WTI in quality, is used
in this example.
Alberta Royalty Review 2007 Oil Sands Economics and Royalty Series
Alberta Department of Energy 6
units that prepare the core products for market. Complex refineries have specialized refining units that can process the denser oil molecules. These specialized units are generically referred to as heavy oil conversion capacity. Since heavy crude oil has more dense molecules than light crude oil, heavy oil conversion capacity is more critical to creating value for heavy oil. An example of this type of refining unit is a coker. The coker unit breaks dense oil molecules into lighter ones by controlled cracking of the crude. Although refineries are often classified as simple or complex, in reality there is a spectrum of refinery types which range from very simple to very complex, depending on the type and capacity of the units in the refinery. Complex refineries can afford to pay more for heavy crudes than simple refineries because they can produce higher valued products.
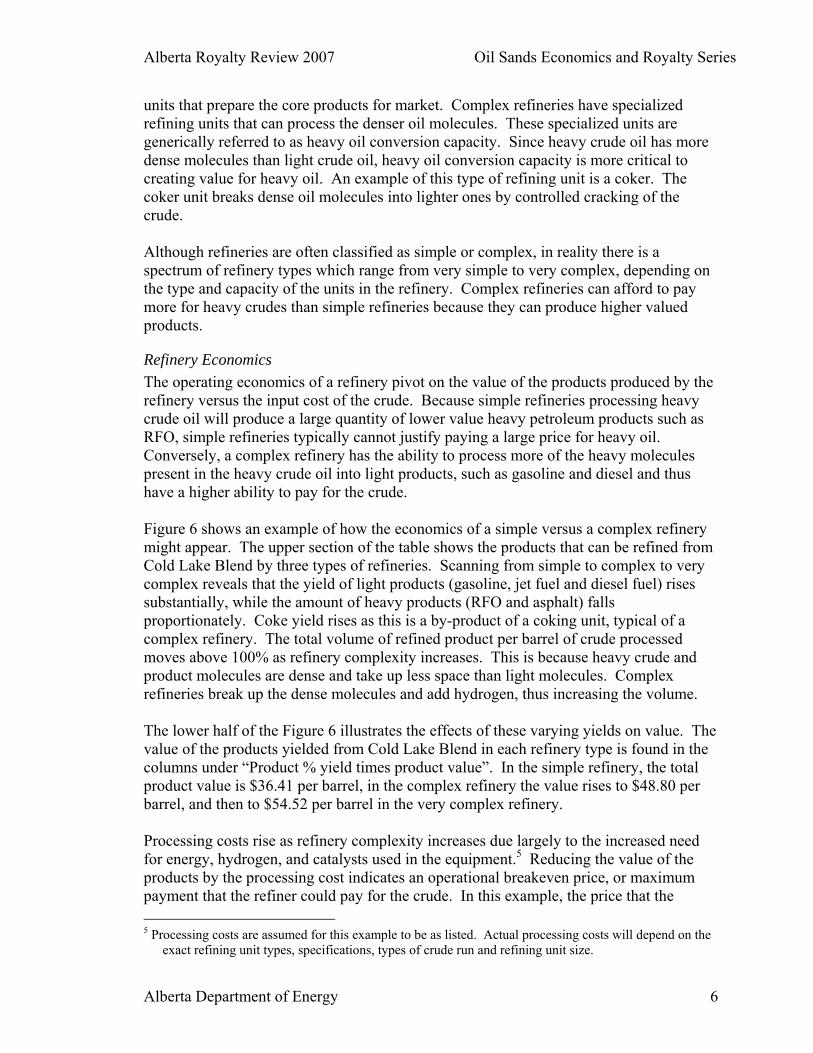
Refinery Economics The operating economics of a refinery pivot on the value of the products produced by the refinery versus the input cost of the crude. Because simple refineries processing heavy crude oil will produce a large quantity of lower value heavy petroleum products such as RFO, simple refineries typically cannot justify paying a large price for heavy oil. Conversely, a complex refinery has the ability to process more of the heavy molecules present in the heavy crude oil into light products, such as gasoline and diesel and thus have a higher ability to pay for the crude. Figure 6 shows an example of how the economics of a simple versus a complex refinery might appear. The upper section of the table shows the products that can be refined from Cold Lake Blend by three types of refineries. Scanning from simple to complex to very complex reveals that the yield of light products (gasoline, jet fuel and diesel fuel) rises substantially, while the amount of heavy products (RFO and asphalt) falls proportionately. Coke yield rises as this is a by-product of a coking unit, typical of a complex refinery. The total volume of refined product per barrel of crude processed moves above 100% as refinery complexity increases. This is because heavy crude and product molecules are dense and take up less space than light molecules. Complex refineries break up the dense molecules and add hydrogen, thus increasing the volume. The lower half of the Figure 6 illustrates the effects of these varying yields on value. The value of the products yielded from Cold Lake Blend in each refinery type is found in the columns under “Product % yield times product value”. In the simple refinery, the total product value is $36.41 per barrel, in the complex refinery the value rises to $48.80 per barrel, and then to $54.52 per barrel in the very complex refinery. Processing costs rise as refinery complexity increases due largely to the increased need for energy, hydrogen, and catalysts used in the equipment.5 Reducing the value of the products by the processing cost indicates an operational breakeven price, or maximum payment that the refiner could pay for the crude. In this example, the price that the 5 Processing costs are assumed for this example to be as listed. Actual processing costs will depend on the
exact refining unit types, specifications, types of crude run and refining unit size.
Alberta Royalty Review 2007 Oil Sands Economics and Royalty Series
Alberta Department of Energy 7
simple refinery could afford to pay for Cold Lake Blend would be up to $31.41 per barrel.6 Similarly, the price the complex refinery could afford would be higher at $42.30 per barrel and the very complex refinery could afford to pay up to $46.02 per barrel. The implied differential shows the price differential between WTI and the bitumen blend that makes the bitumen blend operationally viable from an economics point of view. Figure 6: Example of Refining Economics for Cold Lake Blend
Simple Refinery
Complex Refinery
Very Complex Refinery
1.1% 1.1% 1.1%12.9% 42.8% 57.8%4.7% 4.7% 5.9%13.5% 17.7% 19.4%12.5% 2.8% 2.8%0.0% 2.8% 11.2%55.3% 33.2% 8.3%100.0% 105.0% 106.5%
Product Value $/bblWTI 50.00$ LPG 38.94$ 0.43$ 0.43$ 0.43$
Gasoline 60.00$ 7.74$ 25.71$ 34.69$ Jet Fuel 57.50$ 2.70$ 2.70$ 3.37$ Diesel 59.00$ 7.97$ 10.42$ 11.44$
Fuel Oil 30.00$ 3.75$ 0.83$ 0.83$ Coke 15.00$ -$ 0.42$ 1.68$
Asphalt 25.00$ 13.83$ 8.30$ 2.07$ Value 36.41$ 48.80$ 54.52$
Process Cost 5.00$ 6.50$ 8.50$ Maximum Payment 31.41$ 42.30$ 46.02$ Implied Differential 18.59$ 7.70$ 3.98$
GasolineJet Fuel
Product % yield times product value
DieselFuel OilCoke
Asphalt
Refinery Type
Refinery products from Cold Lake BlendLPG
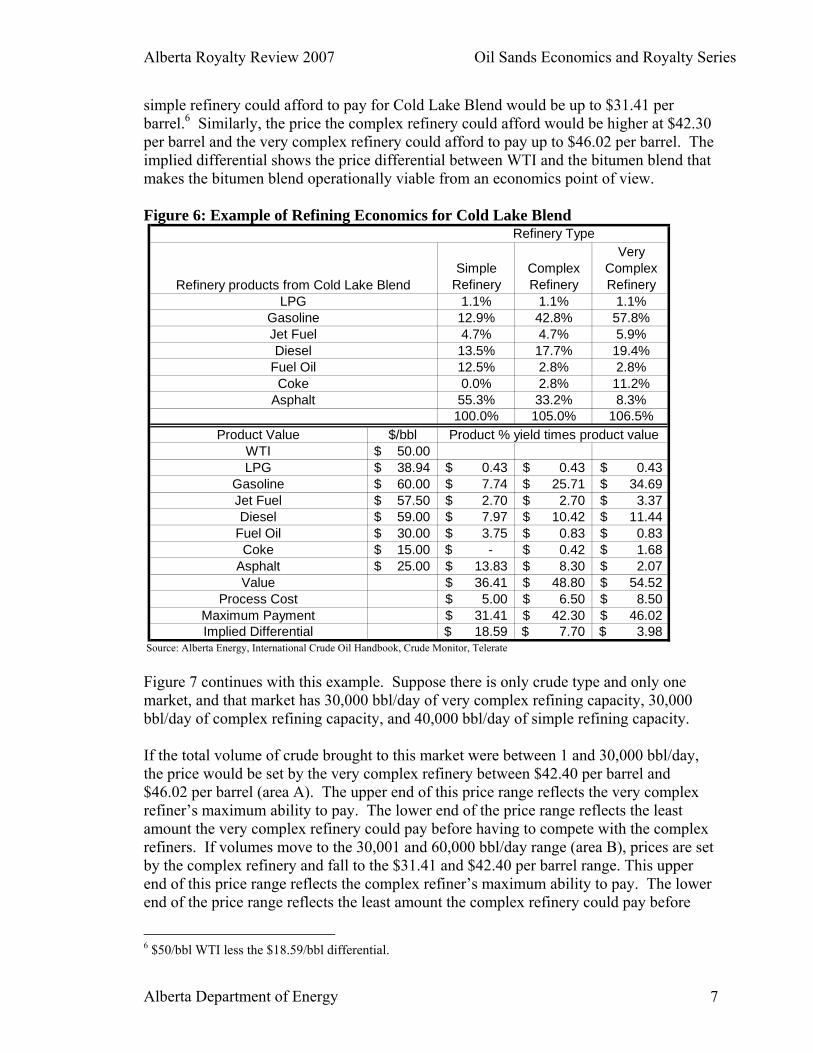
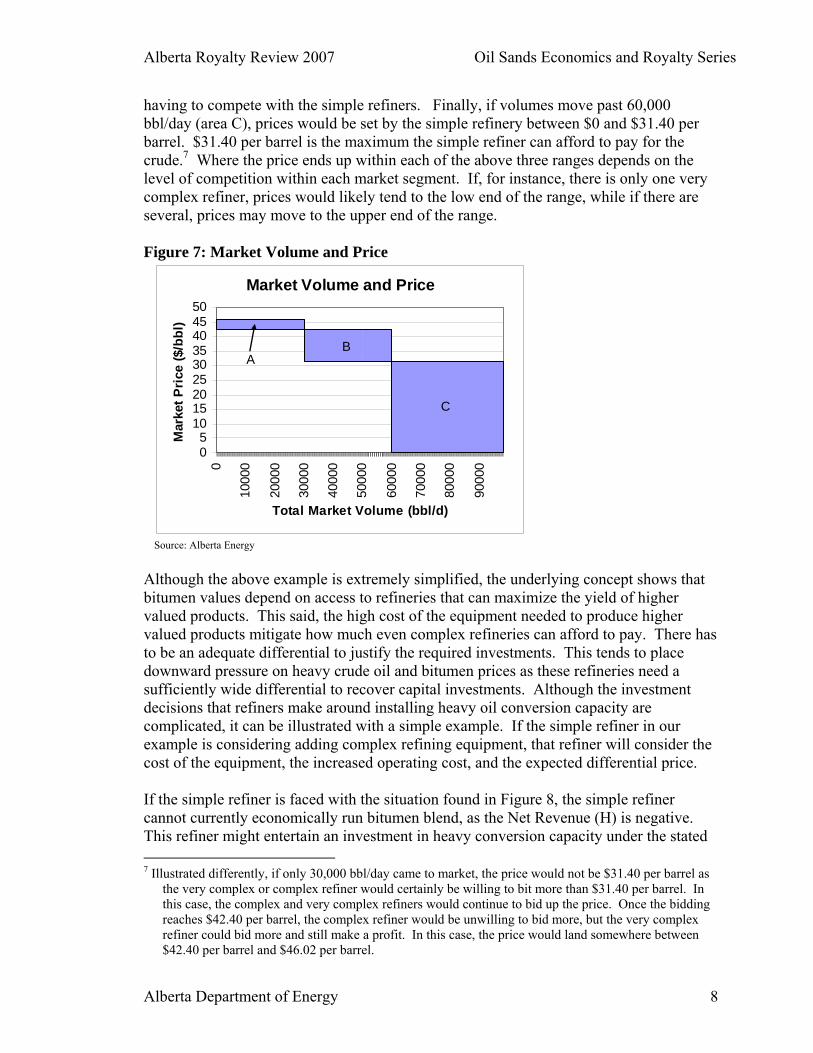
Source: Alberta Energy, International Crude Oil Handbook, Crude Monitor, Telerate Figure 7 continues with this example. Suppose there is only crude type and only one market, and that market has 30,000 bbl/day of very complex refining capacity, 30,000 bbl/day of complex refining capacity, and 40,000 bbl/day of simple refining capacity. If the total volume of crude brought to this market were between 1 and 30,000 bbl/day, the price would be set by the very complex refinery between $42.40 per barrel and $46.02 per barrel (area A). The upper end of this price range reflects the very complex refiner’s maximum ability to pay. The lower end of the price range reflects the least amount the very complex refinery could pay before having to compete with the complex refiners. If volumes move to the 30,001 and 60,000 bbl/day range (area B), prices are set by the complex refinery and fall to the $31.41 and $42.40 per barrel range. This upper end of this price range reflects the complex refiner’s maximum ability to pay. The lower end of the price range reflects the least amount the complex refinery could pay before
6 $50/bbl WTI less the $18.59/bbl differential.
Alberta Royalty Review 2007 Oil Sands Economics and Royalty Series
Alberta Department of Energy 8
having to compete with the simple refiners. Finally, if volumes move past 60,000 bbl/day (area C), prices would be set by the simple refinery between $0 and $31.40 per barrel. $31.40 per barrel is the maximum the simple refiner can afford to pay for the crude.7 Where the price ends up within each of the above three ranges depends on the level of competition within each market segment. If, for instance, there is only one very complex refiner, prices would likely tend to the low end of the range, while if there are several, prices may move to the upper end of the range. Figure 7: Market Volume and Price
Market Volume and Price
05
101520253035404550
0
1000
0
2000
0
3000
0
4000
0
5000
0
6000
0
7000
0
8000
0
9000
0
Total Market Volume (bbl/d)
Mar
ket P
rice
($/b
bl)
AB
C
Source: Alberta Energy Although the above example is extremely simplified, the underlying concept shows that bitumen values depend on access to refineries that can maximize the yield of higher valued products. This said, the high cost of the equipment needed to produce higher valued products mitigate how much even complex refineries can afford to pay. There has to be an adequate differential to justify the required investments. This tends to place downward pressure on heavy crude oil and bitumen prices as these refineries need a sufficiently wide differential to recover capital investments. Although the investment decisions that refiners make around installing heavy oil conversion capacity are complicated, it can be illustrated with a simple example. If the simple refiner in our example is considering adding complex refining equipment, that refiner will consider the cost of the equipment, the increased operating cost, and the expected differential price. If the simple refiner is faced with the situation found in Figure 8, the simple refiner cannot currently economically run bitumen blend, as the Net Revenue (H) is negative. This refiner might entertain an investment in heavy conversion capacity under the stated 7 Illustrated differently, if only 30,000 bbl/day came to market, the price would not be $31.40 per barrel as
the very complex or complex refiner would certainly be willing to bit more than $31.40 per barrel. In this case, the complex and very complex refiners would continue to bid up the price. Once the bidding reaches $42.40 per barrel, the complex refiner would be unwilling to bid more, but the very complex refiner could bid more and still make a profit. In this case, the price would land somewhere between $42.40 per barrel and $46.02 per barrel.
Alberta Royalty Review 2007 Oil Sands Economics and Royalty Series
Alberta Department of Energy 9
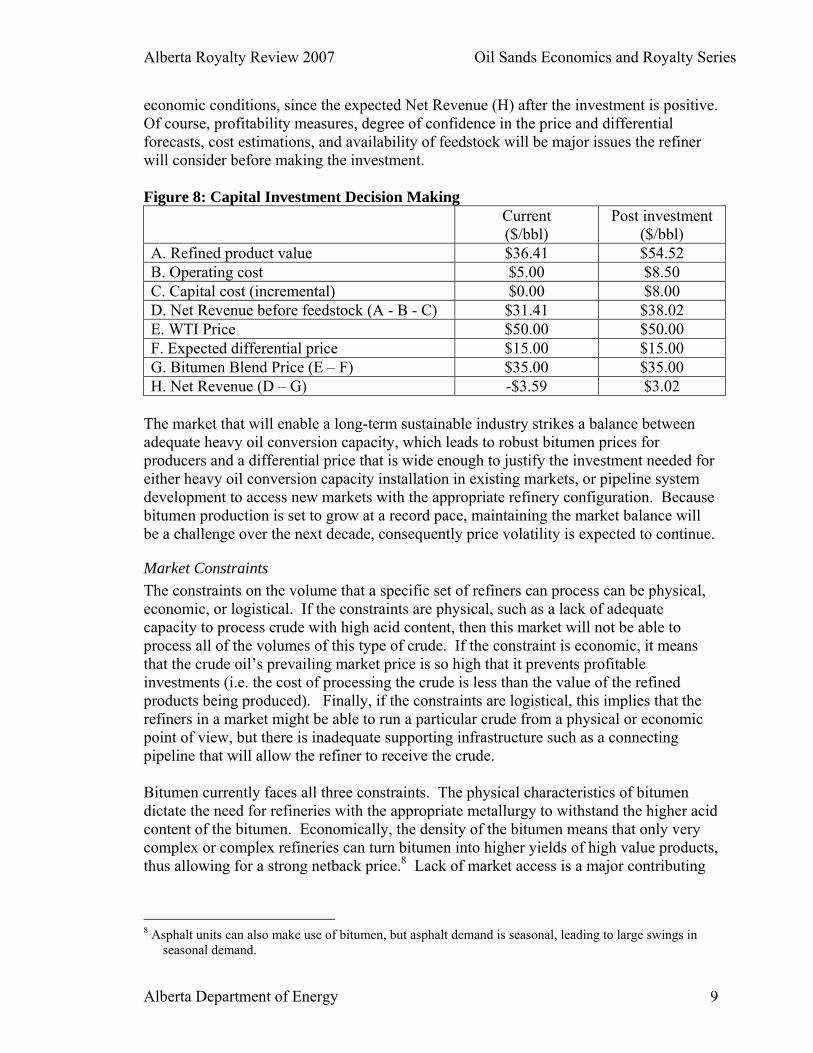
economic conditions, since the expected Net Revenue (H) after the investment is positive. Of course, profitability measures, degree of confidence in the price and differential forecasts, cost estimations, and availability of feedstock will be major issues the refiner will consider before making the investment. Figure 8: Capital Investment Decision Making Current
($/bbl) Post investment
($/bbl) A. Refined product value $36.41 $54.52 B. Operating cost $5.00 $8.50 C. Capital cost (incremental) $0.00 $8.00 D. Net Revenue before feedstock (A - B - C) $31.41 $38.02 E. WTI Price $50.00 $50.00 F. Expected differential price $15.00 $15.00 G. Bitumen Blend Price (E – F) $35.00 $35.00 H. Net Revenue (D – G) -$3.59 $3.02
The market that will enable a long-term sustainable industry strikes a balance between adequate heavy oil conversion capacity, which leads to robust bitumen prices for producers and a differential price that is wide enough to justify the investment needed for either heavy oil conversion capacity installation in existing markets, or pipeline system development to access new markets with the appropriate refinery configuration. Because bitumen production is set to grow at a record pace, maintaining the market balance will be a challenge over the next decade, consequently price volatility is expected to continue.
Market Constraints The constraints on the volume that a specific set of refiners can process can be physical, economic, or logistical. If the constraints are physical, such as a lack of adequate capacity to process crude with high acid content, then this market will not be able to process all of the volumes of this type of crude. If the constraint is economic, it means that the crude oil’s prevailing market price is so high that it prevents profitable investments (i.e. the cost of processing the crude is less than the value of the refined products being produced). Finally, if the constraints are logistical, this implies that the refiners in a market might be able to run a particular crude from a physical or economic point of view, but there is inadequate supporting infrastructure such as a connecting pipeline that will allow the refiner to receive the crude. Bitumen currently faces all three constraints. The physical characteristics of bitumen dictate the need for refineries with the appropriate metallurgy to withstand the higher acid content of the bitumen. Economically, the density of the bitumen means that only very complex or complex refineries can turn bitumen into higher yields of high value products, thus allowing for a strong netback price.8 Lack of market access is a major contributing
8 Asphalt units can also make use of bitumen, but asphalt demand is seasonal, leading to large swings in
seasonal demand.
Alberta Royalty Review 2007 Oil Sands Economics and Royalty Series
Alberta Department of Energy 10
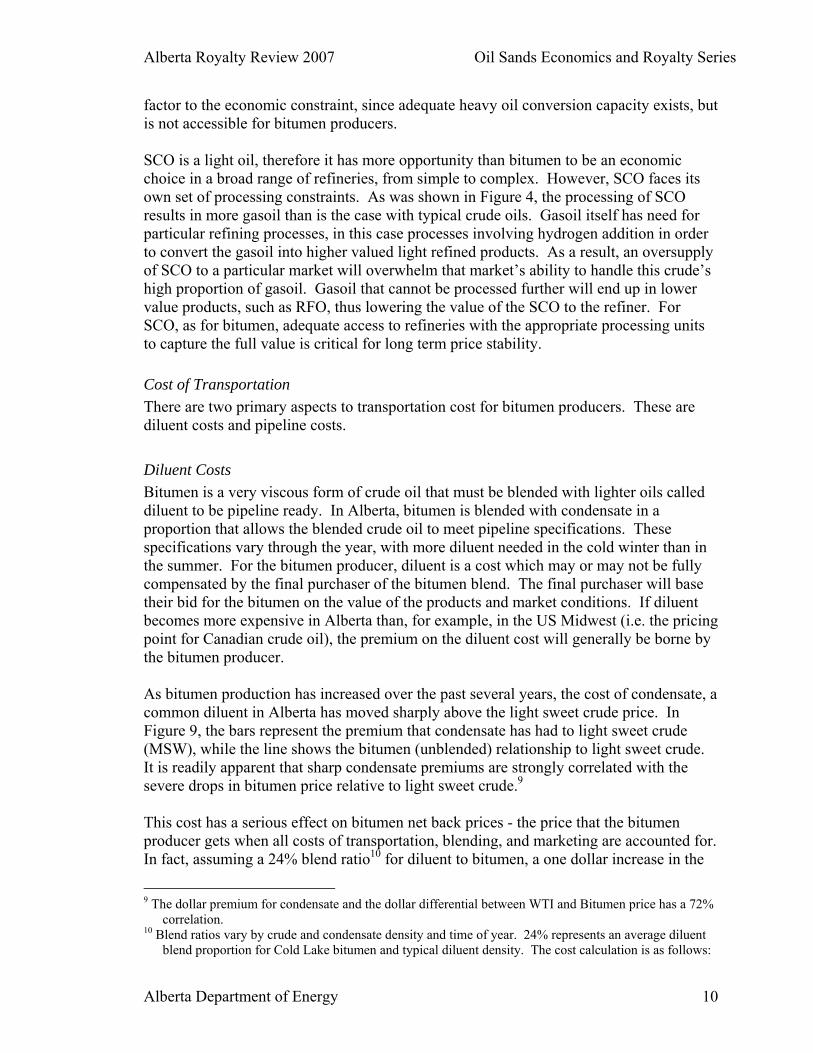
factor to the economic constraint, since adequate heavy oil conversion capacity exists, but is not accessible for bitumen producers. SCO is a light oil, therefore it has more opportunity than bitumen to be an economic choice in a broad range of refineries, from simple to complex. However, SCO faces its own set of processing constraints. As was shown in Figure 4, the processing of SCO results in more gasoil than is the case with typical crude oils. Gasoil itself has need for particular refining processes, in this case processes involving hydrogen addition in order to convert the gasoil into higher valued light refined products. As a result, an oversupply of SCO to a particular market will overwhelm that market’s ability to handle this crude’s high proportion of gasoil. Gasoil that cannot be processed further will end up in lower value products, such as RFO, thus lowering the value of the SCO to the refiner. For SCO, as for bitumen, adequate access to refineries with the appropriate processing units to capture the full value is critical for long term price stability. Cost of Transportation There are two primary aspects to transportation cost for bitumen producers. These are diluent costs and pipeline costs. Diluent Costs Bitumen is a very viscous form of crude oil that must be blended with lighter oils called diluent to be pipeline ready. In Alberta, bitumen is blended with condensate in a proportion that allows the blended crude oil to meet pipeline specifications. These specifications vary through the year, with more diluent needed in the cold winter than in the summer. For the bitumen producer, diluent is a cost which may or may not be fully compensated by the final purchaser of the bitumen blend. The final purchaser will base their bid for the bitumen on the value of the products and market conditions. If diluent becomes more expensive in Alberta than, for example, in the US Midwest (i.e. the pricing point for Canadian crude oil), the premium on the diluent cost will generally be borne by the bitumen producer. As bitumen production has increased over the past several years, the cost of condensate, a common diluent in Alberta has moved sharply above the light sweet crude price. In Figure 9, the bars represent the premium that condensate has had to light sweet crude (MSW), while the line shows the bitumen (unblended) relationship to light sweet crude. It is readily apparent that sharp condensate premiums are strongly correlated with the severe drops in bitumen price relative to light sweet crude.9 This cost has a serious effect on bitumen net back prices - the price that the bitumen producer gets when all costs of transportation, blending, and marketing are accounted for. In fact, assuming a 24% blend ratio10 for diluent to bitumen, a one dollar increase in the
9 The dollar premium for condensate and the dollar differential between WTI and Bitumen price has a 72%
correlation. 10 Blend ratios vary by crude and condensate density and time of year. 24% represents an average diluent
blend proportion for Cold Lake bitumen and typical diluent density. The cost calculation is as follows:
Alberta Royalty Review 2007 Oil Sands Economics and Royalty Series
Alberta Department of Energy 11
premium on condensate costs the bitumen producer 31.6 cents per barrel, which typically must be borne by the bitumen producer. Since 1998, the condensate premium is calculated to have reduced bitumen netback prices by approximately C$1 per barrel on average, and as much as C$8 per barrel in some months.11 Figure 9: Condensate Price Premium and Bitumen Differentials; 1998-2006
Condensate Premium Effect
0.00
0.05
0.10
0.15
0.20
0.25
0.30
0.35
0.40
0.45
Jan-98 Jan-00 Jan-02 Jan-04 Jan-06
Dilu
ent P
rem
ium
ove
r Lig
ht
Swee
t Cru
de (%
)
0
0.1
0.2
0.3
0.4
0.5
0.6
0.7
0.8
0.9
Bit:W
TI d
iffer
entia
l
Diluent Premium Cost Bitumen Differential
Source: Light Sweet Postings (Ave. of Shell, Suncor, Imperial, PetroCan), Enbridge, Telerate, Oil sands producers can also use SCO as diluent. The bitumen producers’ choice of diluents will be determined by availability, transportation costs, and the cost of the diluent. For instance, SCO is more commonly used as a diluent in the Athabasca region of the oil sands because condensate is not yet readily available, while SCO from local upgrading operations is. At this point it cannot be known with certainty how much bitumen production will be diluted with SCO versus condensate. Some of the current indications are that there is considerable interest in importing condensate as the blending agent. Currently there are three pipeline proposals12 for this purpose. This said, there is also a significant amount of upgrading being planned, that could see 80% or more of the bitumen production upgraded to SCO before going to market. Both importation of condensate and bitumen upgrading to produce more diluent are viable alternatives. Of course the more bitumen
Bitumen Blend = Condensate cost * a + Bitumen cost * (1-a) Rearranged: Bitumen Cost = (Bitumen Blend - Condensate Cost * a) / (1-a) Differential Calculation: δ Bitumen Blend / δ Condensate = - a / (1-a) For our example: δ Bitumen Blend / δ Condensate = -0.24 / (1 - 0.24) = -0.316 11 This calculation is based on monthly condensate premiums and actual blend percentages. 12 These are the Enbridge Southern Lights Condensate line from the Chicago area, Pembina Pipeline’s
Spirit Pipeline from Kitimat, B.C. on the West Coast, and Enbridge’s Gateway Condensate line also from Kitimat B.C.
Alberta Royalty Review 2007 Oil Sands Economics and Royalty Series
Alberta Department of Energy 12
upgraded in the first place, the less need for diluent. The precise share of each will be determined by the associated costs and value created. The optimum solution is not uniform from project to project, which is why there is such a diversity of projects under consideration.
Pipeline Tolls The second cost of transportation for oil sands products is the pipeline toll. These tolls include transportation from the field to either Edmonton or Hardisty Alberta, and then to markets further away. For a trunkline system such as Enbridge’s, there is an approximate 20% premium to transport heavy crude versus light crude. This is due to the higher viscosity, or friction, of heavy crude, thus requiring the pipeline to employ higher pumping capacity and/or deliver at a slower transit speed.13
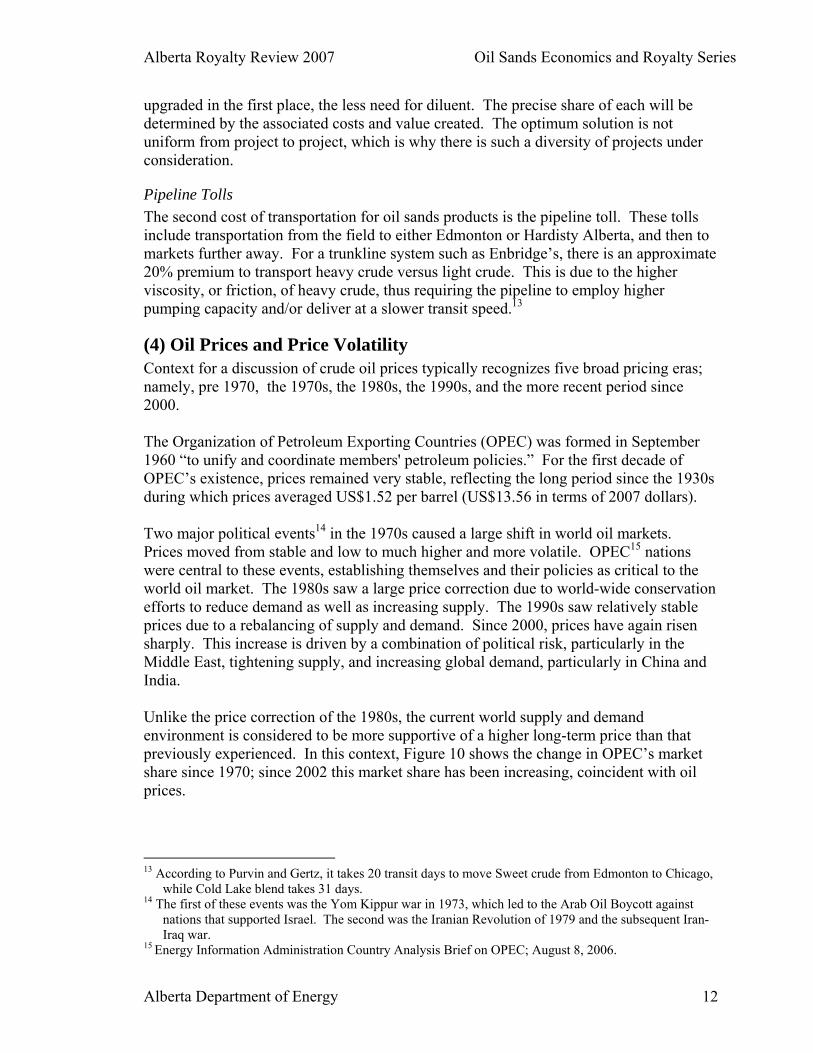
(4) Oil Prices and Price Volatility Context for a discussion of crude oil prices typically recognizes five broad pricing eras; namely, pre 1970, the 1970s, the 1980s, the 1990s, and the more recent period since 2000. The Organization of Petroleum Exporting Countries (OPEC) was formed in September 1960 “to unify and coordinate members' petroleum policies.” For the first decade of OPEC’s existence, prices remained very stable, reflecting the long period since the 1930s during which prices averaged US$1.52 per barrel (US$13.56 in terms of 2007 dollars). Two major political events14 in the 1970s caused a large shift in world oil markets. Prices moved from stable and low to much higher and more volatile. OPEC15 nations were central to these events, establishing themselves and their policies as critical to the world oil market. The 1980s saw a large price correction due to world-wide conservation efforts to reduce demand as well as increasing supply. The 1990s saw relatively stable prices due to a rebalancing of supply and demand. Since 2000, prices have again risen sharply. This increase is driven by a combination of political risk, particularly in the Middle East, tightening supply, and increasing global demand, particularly in China and India. Unlike the price correction of the 1980s, the current world supply and demand environment is considered to be more supportive of a higher long-term price than that previously experienced. In this context, Figure 10 shows the change in OPEC’s market share since 1970; since 2002 this market share has been increasing, coincident with oil prices.
13 According to Purvin and Gertz, it takes 20 transit days to move Sweet crude from Edmonton to Chicago,
while Cold Lake blend takes 31 days. 14 The first of these events was the Yom Kippur war in 1973, which led to the Arab Oil Boycott against
nations that supported Israel. The second was the Iranian Revolution of 1979 and the subsequent Iran-Iraq war.
15 Energy Information Administration Country Analysis Brief on OPEC; August 8, 2006.
Alberta Royalty Review 2007 Oil Sands Economics and Royalty Series
Alberta Department of Energy 13
Figure 10: OPEC Market Share and Price; 1970-2005
OPEC Market Share and Price
20%30%40%50%60%
1970
1973
1976
1979
1982
1985
1988
1991
1994
1997
2000
2003
OP
EC M
arke
t S
hare
020406080100
Pric
e (2
005$
)
OPEC Market Share Price (2005$)
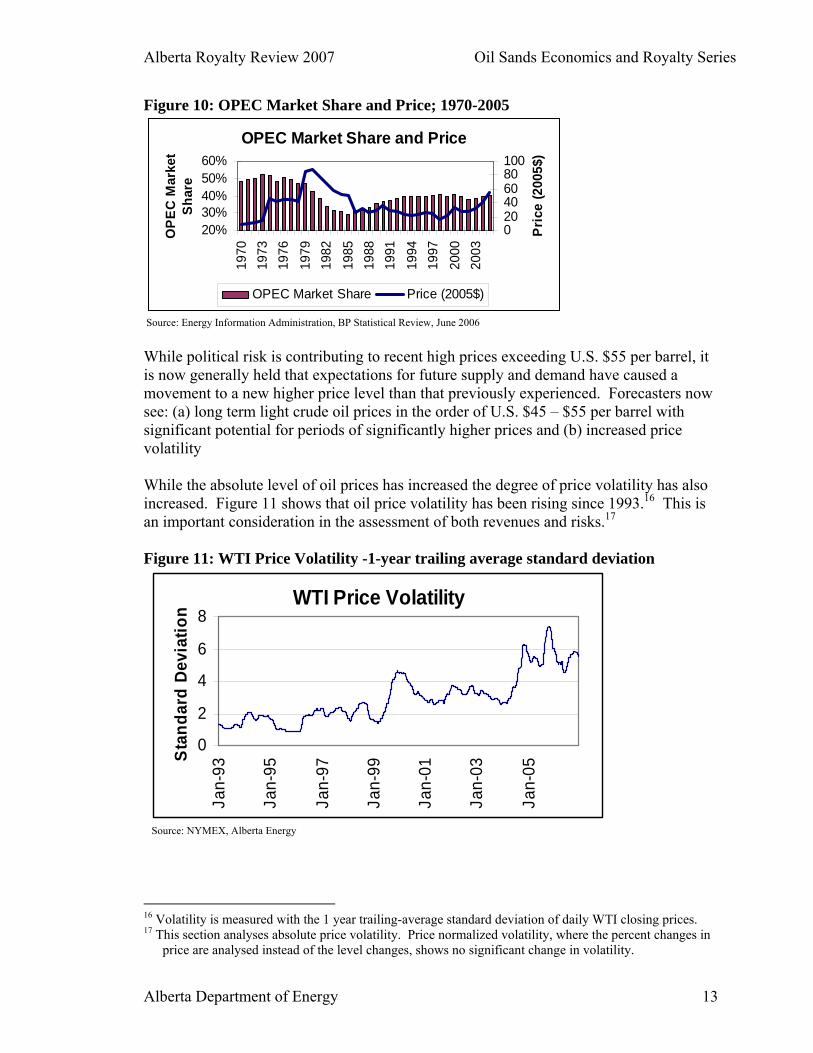
Source: Energy Information Administration, BP Statistical Review, June 2006 While political risk is contributing to recent high prices exceeding U.S. $55 per barrel, it is now generally held that expectations for future supply and demand have caused a movement to a new higher price level than that previously experienced. Forecasters now see: (a) long term light crude oil prices in the order of U.S. $45 – $55 per barrel with significant potential for periods of significantly higher prices and (b) increased price volatility While the absolute level of oil prices has increased the degree of price volatility has also increased. Figure 11 shows that oil price volatility has been rising since 1993.16 This is an important consideration in the assessment of both revenues and risks.17 Figure 11: WTI Price Volatility -1-year trailing average standard deviation
WTI Price Volatility
0
2
4
6
8
Jan-
93
Jan-
95
Jan-
97
Jan-
99
Jan-
01
Jan-
03
Jan-
05
Stan
dard
Dev
iatio
n
Source: NYMEX, Alberta Energy
16 Volatility is measured with the 1 year trailing-average standard deviation of daily WTI closing prices. 17 This section analyses absolute price volatility. Price normalized volatility, where the percent changes in
price are analysed instead of the level changes, shows no significant change in volatility.
Alberta Royalty Review 2007 Oil Sands Economics and Royalty Series
Alberta Department of Energy 14
(5) Special Issues in Pricing Bitumen and SCO
Synthetic Crude Oil SCO prices generally track light sweet prices. SCO however is not all of the same quality. In general, sour (higher sulphur content) synthetics trade around 92% of WTI while sweet synthetics trade at approximately 99% of WTI. Overall, the pricing for SCO has been under significantly less pressure than bitumen prices. However, given the expected increase in synthetic production, synthetic crude will also have its share of market challenges. Synthetic producers are recognising the potential impact of market constraints and many are considering or taking steps to mitigate this risk. Typically, the approach is to further upgrade the bitumen, thus decreasing the amount of gasoil in the synthetic crude and avoiding the market constraint that excessive gasoil volumes create.
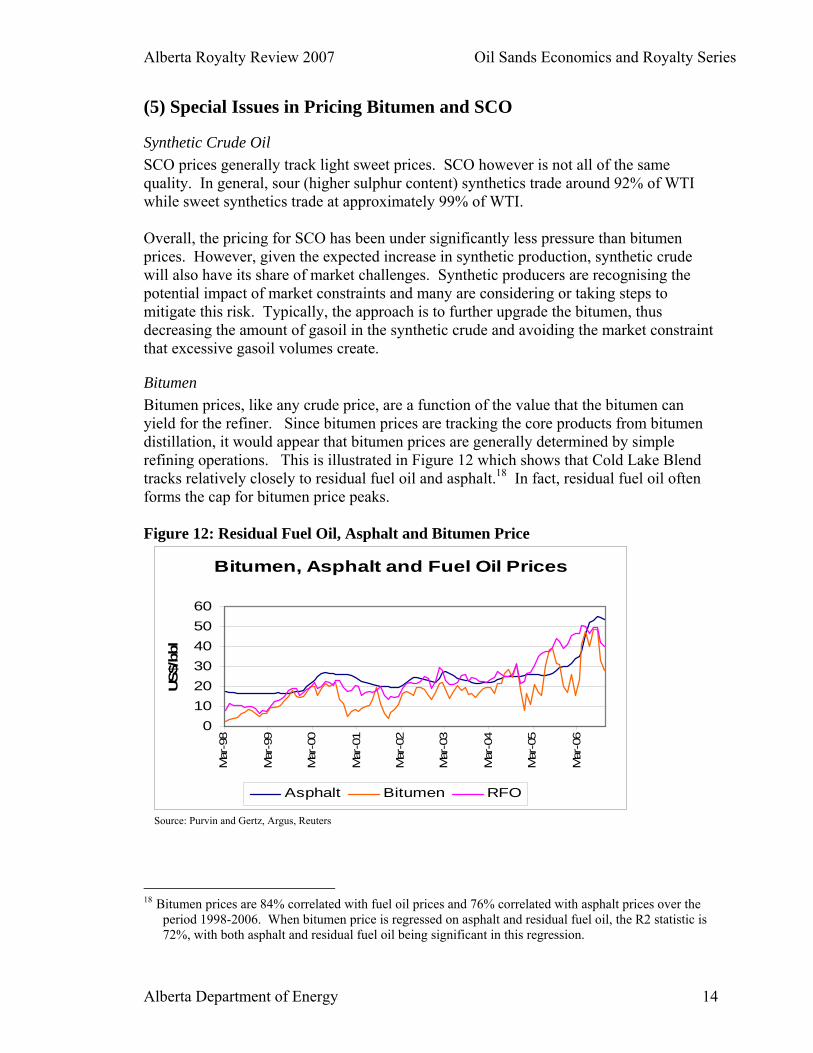
Bitumen Bitumen prices, like any crude price, are a function of the value that the bitumen can yield for the refiner. Since bitumen prices are tracking the core products from bitumen distillation, it would appear that bitumen prices are generally determined by simple refining operations. This is illustrated in Figure 12 which shows that Cold Lake Blend tracks relatively closely to residual fuel oil and asphalt.18 In fact, residual fuel oil often forms the cap for bitumen price peaks. Figure 12: Residual Fuel Oil, Asphalt and Bitumen Price
Bitumen, Asphalt and Fuel Oil Prices
0102030405060
Mar
-98
Mar
-99
Mar
-00
Mar
-01
Mar
-02
Mar
-03
Mar
-04
Mar
-05
Mar
-06
US$
/bbl
Asphalt Bitumen RFO
Source: Purvin and Gertz, Argus, Reuters
18 Bitumen prices are 84% correlated with fuel oil prices and 76% correlated with asphalt prices over the
period 1998-2006. When bitumen price is regressed on asphalt and residual fuel oil, the R2 statistic is 72%, with both asphalt and residual fuel oil being significant in this regression.
Alberta Royalty Review 2007 Oil Sands Economics and Royalty Series
Alberta Department of Energy 15
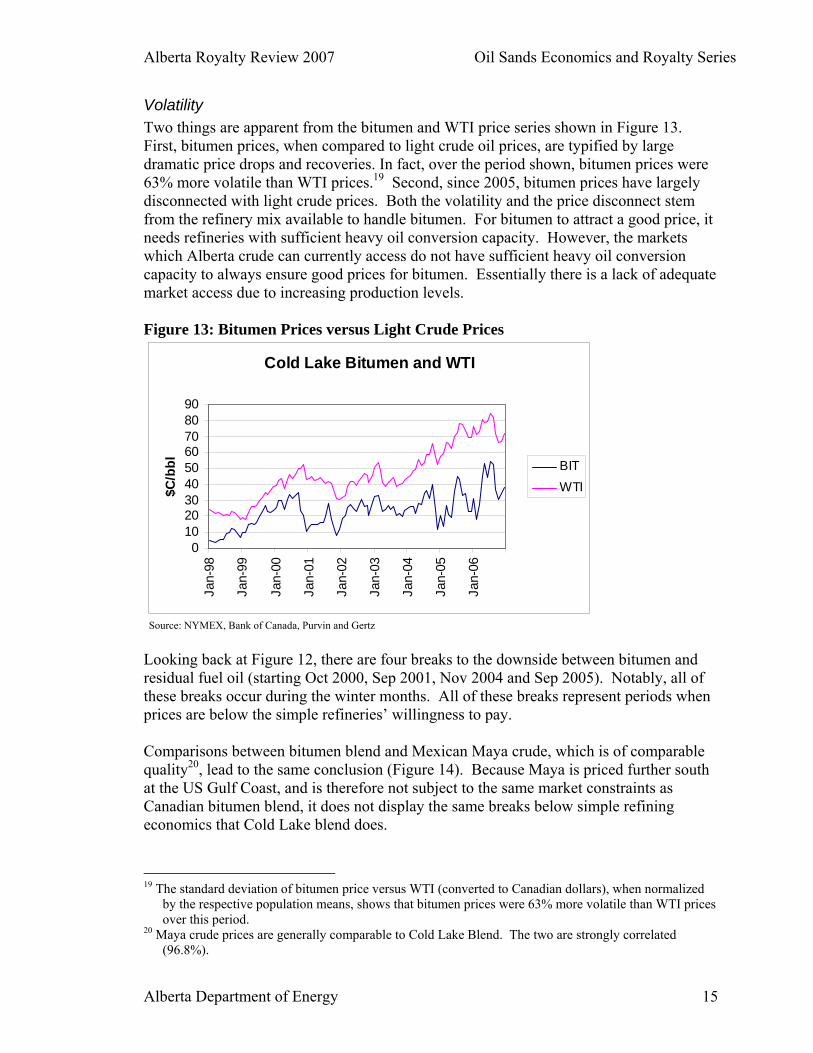
Volatility Two things are apparent from the bitumen and WTI price series shown in Figure 13. First, bitumen prices, when compared to light crude oil prices, are typified by large dramatic price drops and recoveries. In fact, over the period shown, bitumen prices were 63% more volatile than WTI prices.19 Second, since 2005, bitumen prices have largely disconnected with light crude prices. Both the volatility and the price disconnect stem from the refinery mix available to handle bitumen. For bitumen to attract a good price, it needs refineries with sufficient heavy oil conversion capacity. However, the markets which Alberta crude can currently access do not have sufficient heavy oil conversion capacity to always ensure good prices for bitumen. Essentially there is a lack of adequate market access due to increasing production levels. Figure 13: Bitumen Prices versus Light Crude Prices
Cold Lake Bitumen and WTI
0102030405060708090
Jan-
98
Jan-
99
Jan-
00
Jan-
01
Jan-
02
Jan-
03
Jan-
04
Jan-
05
Jan-
06
$C/b
bl BITWTI
Source: NYMEX, Bank of Canada, Purvin and Gertz Looking back at Figure 12, there are four breaks to the downside between bitumen and residual fuel oil (starting Oct 2000, Sep 2001, Nov 2004 and Sep 2005). Notably, all of these breaks occur during the winter months. All of these breaks represent periods when prices are below the simple refineries’ willingness to pay. Comparisons between bitumen blend and Mexican Maya crude, which is of comparable quality20, lead to the same conclusion (Figure 14). Because Maya is priced further south at the US Gulf Coast, and is therefore not subject to the same market constraints as Canadian bitumen blend, it does not display the same breaks below simple refining economics that Cold Lake blend does.
19 The standard deviation of bitumen price versus WTI (converted to Canadian dollars), when normalized
by the respective population means, shows that bitumen prices were 63% more volatile than WTI prices over this period.
20 Maya crude prices are generally comparable to Cold Lake Blend. The two are strongly correlated (96.8%).
Alberta Royalty Review 2007 Oil Sands Economics and Royalty Series
Alberta Department of Energy 16
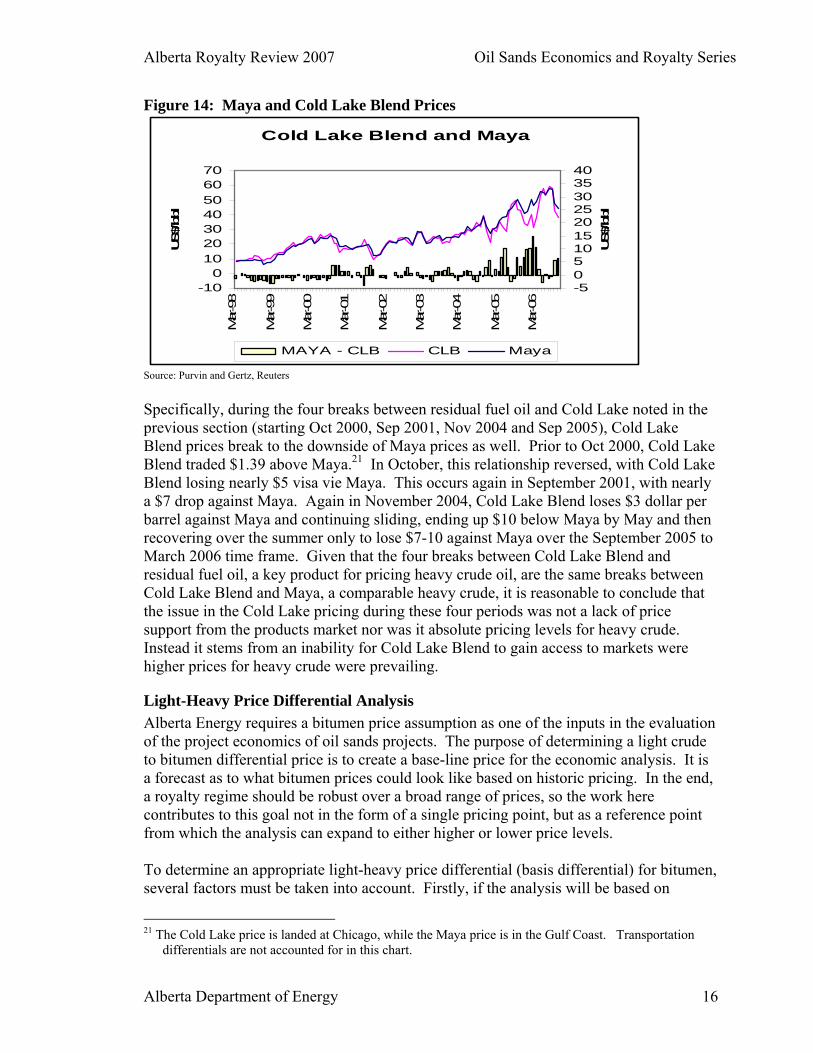
Figure 14: Maya and Cold Lake Blend Prices
Cold Lake Blend and Maya
-100
10203040506070
Mar-98
Mar-99
Mar-00
Mar-01
Mar-02
Mar-03
Mar-04
Mar-05
Mar-06
US$/bb
l
-50510152025303540
US$/bb
l
MAYA - CLB CLB Maya
Source: Purvin and Gertz, Reuters Specifically, during the four breaks between residual fuel oil and Cold Lake noted in the previous section (starting Oct 2000, Sep 2001, Nov 2004 and Sep 2005), Cold Lake Blend prices break to the downside of Maya prices as well. Prior to Oct 2000, Cold Lake Blend traded $1.39 above Maya.21 In October, this relationship reversed, with Cold Lake Blend losing nearly $5 visa vie Maya. This occurs again in September 2001, with nearly a $7 drop against Maya. Again in November 2004, Cold Lake Blend loses $3 dollar per barrel against Maya and continuing sliding, ending up $10 below Maya by May and then recovering over the summer only to lose $7-10 against Maya over the September 2005 to March 2006 time frame. Given that the four breaks between Cold Lake Blend and residual fuel oil, a key product for pricing heavy crude oil, are the same breaks between Cold Lake Blend and Maya, a comparable heavy crude, it is reasonable to conclude that the issue in the Cold Lake pricing during these four periods was not a lack of price support from the products market nor was it absolute pricing levels for heavy crude. Instead it stems from an inability for Cold Lake Blend to gain access to markets were higher prices for heavy crude were prevailing.
Light-Heavy Price Differential Analysis Alberta Energy requires a bitumen price assumption as one of the inputs in the evaluation of the project economics of oil sands projects. The purpose of determining a light crude to bitumen differential price is to create a base-line price for the economic analysis. It is a forecast as to what bitumen prices could look like based on historic pricing. In the end, a royalty regime should be robust over a broad range of prices, so the work here contributes to this goal not in the form of a single pricing point, but as a reference point from which the analysis can expand to either higher or lower price levels. To determine an appropriate light-heavy price differential (basis differential) for bitumen, several factors must be taken into account. Firstly, if the analysis will be based on
21 The Cold Lake price is landed at Chicago, while the Maya price is in the Gulf Coast. Transportation
differentials are not accounted for in this chart.
Alberta Royalty Review 2007 Oil Sands Economics and Royalty Series
Alberta Department of Energy 17
historic price relationships, is there reasonable confidence that these relationships will hold into the future? Second, what is the appropriate methodology to determine the price relationship? Third, if there is a divergence between historic and expected price levels, do the relationships hold at expected price levels?
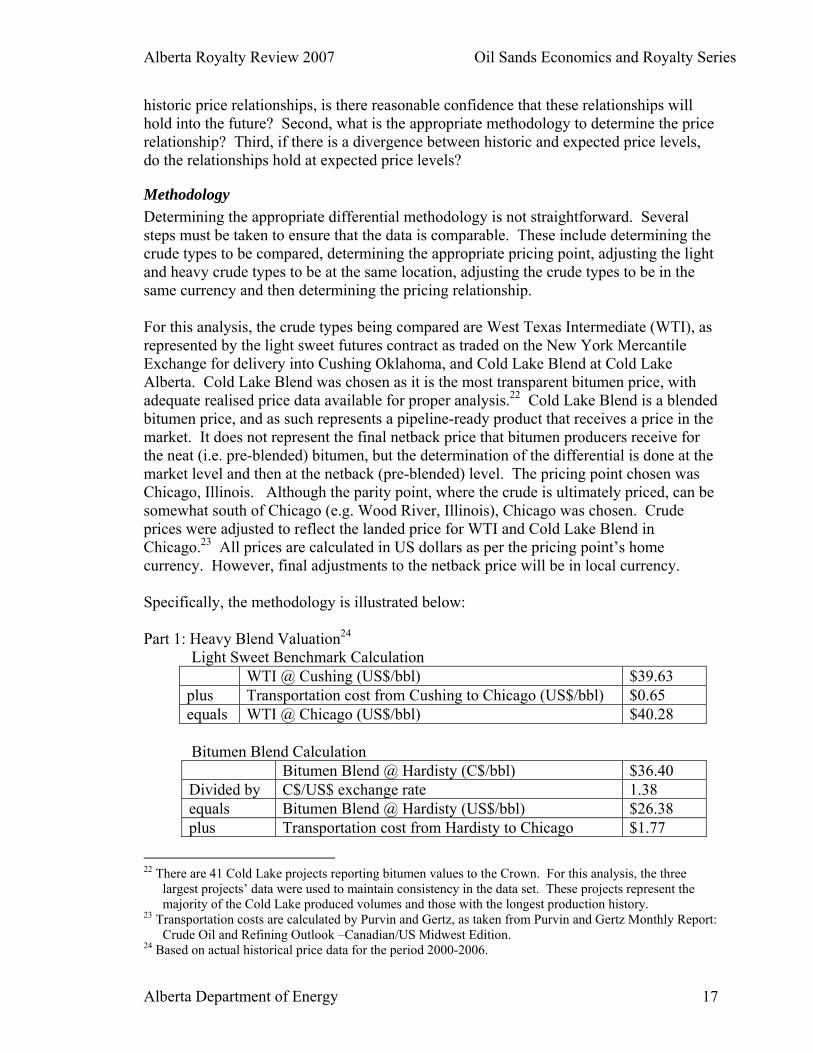
Methodology Determining the appropriate differential methodology is not straightforward. Several steps must be taken to ensure that the data is comparable. These include determining the crude types to be compared, determining the appropriate pricing point, adjusting the light and heavy crude types to be at the same location, adjusting the crude types to be in the same currency and then determining the pricing relationship. For this analysis, the crude types being compared are West Texas Intermediate (WTI), as represented by the light sweet futures contract as traded on the New York Mercantile Exchange for delivery into Cushing Oklahoma, and Cold Lake Blend at Cold Lake Alberta. Cold Lake Blend was chosen as it is the most transparent bitumen price, with adequate realised price data available for proper analysis.22 Cold Lake Blend is a blended bitumen price, and as such represents a pipeline-ready product that receives a price in the market. It does not represent the final netback price that bitumen producers receive for the neat (i.e. pre-blended) bitumen, but the determination of the differential is done at the market level and then at the netback (pre-blended) level. The pricing point chosen was Chicago, Illinois. Although the parity point, where the crude is ultimately priced, can be somewhat south of Chicago (e.g. Wood River, Illinois), Chicago was chosen. Crude prices were adjusted to reflect the landed price for WTI and Cold Lake Blend in Chicago.23 All prices are calculated in US dollars as per the pricing point’s home currency. However, final adjustments to the netback price will be in local currency. Specifically, the methodology is illustrated below: Part 1: Heavy Blend Valuation24
Light Sweet Benchmark Calculation WTI @ Cushing (US$/bbl) $39.63 plus Transportation cost from Cushing to Chicago (US$/bbl) $0.65 equals WTI @ Chicago (US$/bbl) $40.28
Bitumen Blend Calculation Bitumen Blend @ Hardisty (C$/bbl) $36.40 Divided by C$/US$ exchange rate 1.38 equals Bitumen Blend @ Hardisty (US$/bbl) $26.38 plus Transportation cost from Hardisty to Chicago $1.77
22 There are 41 Cold Lake projects reporting bitumen values to the Crown. For this analysis, the three
largest projects’ data were used to maintain consistency in the data set. These projects represent the majority of the Cold Lake produced volumes and those with the longest production history.
23 Transportation costs are calculated by Purvin and Gertz, as taken from Purvin and Gertz Monthly Report: Crude Oil and Refining Outlook –Canadian/US Midwest Edition.
24 Based on actual historical price data for the period 2000-2006.
Alberta Royalty Review 2007 Oil Sands Economics and Royalty Series
Alberta Department of Energy 18
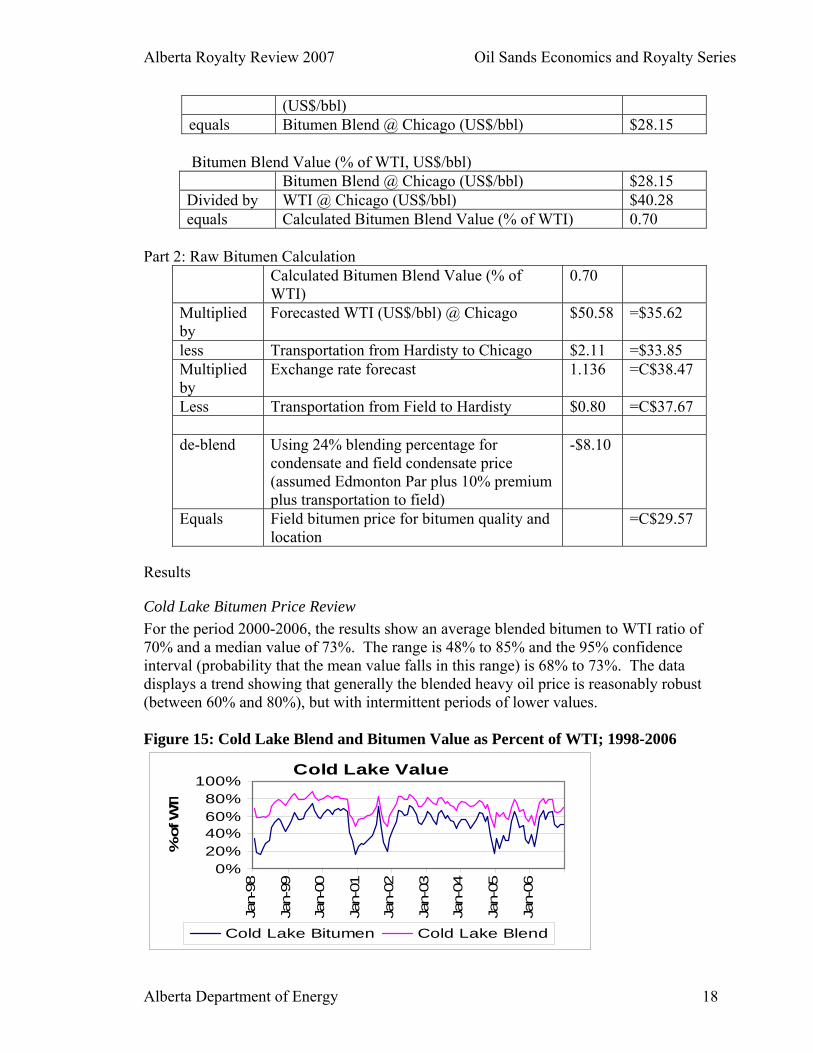
(US$/bbl) equals Bitumen Blend @ Chicago (US$/bbl) $28.15
Bitumen Blend Value (% of WTI, US$/bbl)
Bitumen Blend @ Chicago (US$/bbl) $28.15 Divided by WTI @ Chicago (US$/bbl) $40.28 equals Calculated Bitumen Blend Value (% of WTI) 0.70
Part 2: Raw Bitumen Calculation
Calculated Bitumen Blend Value (% of WTI)
0.70
Multiplied by
Forecasted WTI (US$/bbl) @ Chicago $50.58 =$35.62
less Transportation from Hardisty to Chicago $2.11 =$33.85 Multiplied by
Exchange rate forecast 1.136 =C$38.47
Less Transportation from Field to Hardisty $0.80 =C$37.67 de-blend Using 24% blending percentage for
condensate and field condensate price (assumed Edmonton Par plus 10% premium plus transportation to field)
-$8.10
Equals Field bitumen price for bitumen quality and location
=C$29.57
Results
Cold Lake Bitumen Price Review For the period 2000-2006, the results show an average blended bitumen to WTI ratio of 70% and a median value of 73%. The range is 48% to 85% and the 95% confidence interval (probability that the mean value falls in this range) is 68% to 73%. The data displays a trend showing that generally the blended heavy oil price is reasonably robust (between 60% and 80%), but with intermittent periods of lower values. Figure 15: Cold Lake Blend and Bitumen Value as Percent of WTI; 1998-2006
Cold Lake Value
0%20%40%60%80%
100%
Jan-
98
Jan-
99
Jan-
00
Jan-
01
Jan-
02
Jan-
03
Jan-
04
Jan-
05
Jan-
06
% o
f WTI
Cold Lake Bitumen Cold Lake Blend
Alberta Royalty Review 2007 Oil Sands Economics and Royalty Series
Alberta Department of Energy 19
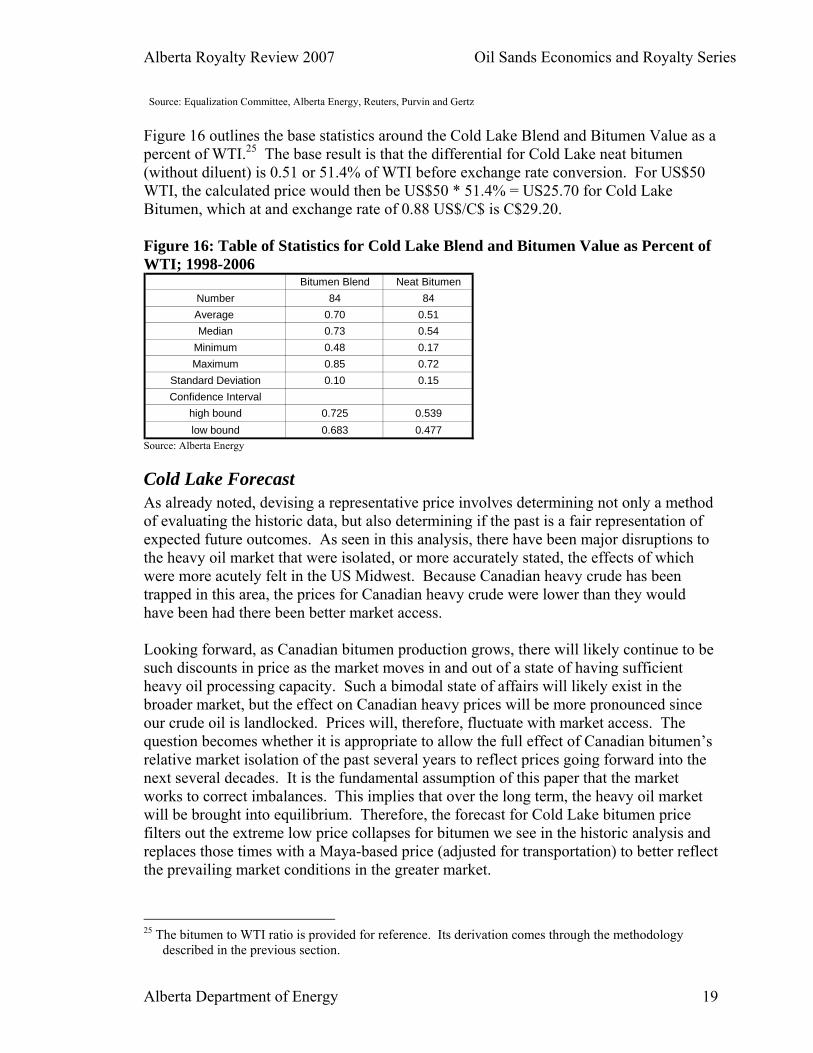
Source: Equalization Committee, Alberta Energy, Reuters, Purvin and Gertz Figure 16 outlines the base statistics around the Cold Lake Blend and Bitumen Value as a percent of WTI.25 The base result is that the differential for Cold Lake neat bitumen (without diluent) is 0.51 or 51.4% of WTI before exchange rate conversion. For US$50 WTI, the calculated price would then be US$50 * 51.4% = US25.70 for Cold Lake Bitumen, which at and exchange rate of 0.88 US$/C$ is C$29.20. Figure 16: Table of Statistics for Cold Lake Blend and Bitumen Value as Percent of WTI; 1998-2006
Bitumen Blend Neat BitumenNumber 84 84Average 0.70 0.51Median 0.73 0.54
Minimum 0.48 0.17Maximum 0.85 0.72
Standard Deviation 0.10 0.15Confidence Interval
high bound 0.725 0.539low bound 0.683 0.477
Source: Alberta Energy
Cold Lake Forecast As already noted, devising a representative price involves determining not only a method of evaluating the historic data, but also determining if the past is a fair representation of expected future outcomes. As seen in this analysis, there have been major disruptions to the heavy oil market that were isolated, or more accurately stated, the effects of which were more acutely felt in the US Midwest. Because Canadian heavy crude has been trapped in this area, the prices for Canadian heavy crude were lower than they would have been had there been better market access. Looking forward, as Canadian bitumen production grows, there will likely continue to be such discounts in price as the market moves in and out of a state of having sufficient heavy oil processing capacity. Such a bimodal state of affairs will likely exist in the broader market, but the effect on Canadian heavy prices will be more pronounced since our crude oil is landlocked. Prices will, therefore, fluctuate with market access. The question becomes whether it is appropriate to allow the full effect of Canadian bitumen’s relative market isolation of the past several years to reflect prices going forward into the next several decades. It is the fundamental assumption of this paper that the market works to correct imbalances. This implies that over the long term, the heavy oil market will be brought into equilibrium. Therefore, the forecast for Cold Lake bitumen price filters out the extreme low price collapses for bitumen we see in the historic analysis and replaces those times with a Maya-based price (adjusted for transportation) to better reflect the prevailing market conditions in the greater market.
25 The bitumen to WTI ratio is provided for reference. Its derivation comes through the methodology
described in the previous section.
Alberta Royalty Review 2007 Oil Sands Economics and Royalty Series
Alberta Department of Energy 20
This filter moves Cold Lake bitumen up from 51% of WTI price to 55% of WTI price, which becomes the reference for the analysis contained in Technical Report OS#1. Specifically, 55% of $50 (WTI) is US$27.50, or C$31.25 for bitumen at Cold Lake. Of course, the analysis contains a full range of price expectations, from WTI $20 to WTI $120/barrel.
Athabasca Bitumen Athabasca bitumen pricing has several difficulties. At the fore is the lack of liquidity for Athabasca bitumen. The majority of Athabasca bitumen produced volumes are integrated with upgraders. Consequently there is very little actual Athabasca bitumen on the market.26 Due to this fact, a derived price, not an actual market price, must be used. This represents an added risk for the Crown as the bitumen price is not readily transparent. Reflecting added transportation costs and quality differences the Athabasca bitumen price was set at 82% of the price for Cold Lake bitumen. This translates into 45% of WTI. Specifically, 45% of US$50 WTI is US$22.50, or C$25.57 with a 0.88 exchange rate. As with the Cold Lake analysis, this reference price was supplemented with analysis of the full range of price expectations.
(6) Price Risks From this analysis of prices, it is apparent that there are several price risk factors for Alberta oil sands producers and the Crown. Price volatility for bitumen, especially the extreme low prices that have been witnessed several times over the past several years, is the most obvious risk. This, of course is also a revenue risk for the resource owner. Other risks vary with a given company’s strategy. If, for instance, a company decides to ship blended bitumen without any upgrading, that company runs the risk of poor bitumen prices, high diluent costs, and less than adequate diluent availability. There are various risk mitigation strategies a bitumen producer can undertake:
• Downstream integration with a refinery • Long-term supply contracts to sell bitumen blend to a refiner • Long-term supply contracts to purchase diluent • Subscribing to pipeline space for the importation of diluent into Alberta • Subscribing to pipeline space to export bitumen blend to new markets such as the
US Gulf Coast • Financial hedging • Using storage to lessen the impact of relatively high condensate costs and low
bitumen values in the winter season All of these strategies have a risk and reward profile, and currently all of these avenues are being pursued by industry.
26 Specifically, there is only one project available that had sufficient arm’s length data for analysis.
Alberta Royalty Review 2007 Oil Sands Economics and Royalty Series
Alberta Department of Energy 21
Several examples of downstream strategies are already showing up in the marketplace. EnCana has entered a joint venture with ConnocoPhilips beginning in 2007 which allows a financial hedging of bitumen price with refining values. Other deals are being sought, including Marathon, a major US refiner, actively seeking an upstream partner, and BP refitting its US northern tier refineries to run almost exclusively on bitumen. There are also merchant upgraders moving forward with plans that will also cloud the price of bitumen.27 Added to this is the large number of upgrading projects announced for Alberta, with at least 10 projects announced.28 For SCO, diluent risks are eliminated and price volatility generally tracks light sweet crude, though this could change with increasing volumes. For SCO producers, market access is a critical consideration, though still not as critical as for bitumen blend For the Province, the variety of risk mitigation strategies that can be pursued by industry is generally not available. Therefore Alberta is absorbing a higher share of price risk, particularly where royalty is based on bitumen values. Another important risk for the Province comes from valuation of the bitumen. Due primarily to the volume of non-arms length sales bitumen prices are generally less transparent than crude prices. Downstream integration and upgrading are causing more and more prices to become non-arm’s length transfer prices, thus eroding the confidence the Province can have in market pricing. This underscores the need for the Province to develop a reliable framework to value its bitumen.
27 Merchant upgraders process bitumen on a fee for service basis, and as such do not add market
information as to the price of bitumen, just the cost of upgrading the bitumen. 28 The Alberta Energy and Utilities Board lists 10 major upgrading projects in its 2006 ST-98 Report.
Several other projects are rumoured.