Embed Size (px)
Citation preview
Short Term Hypoxia Synergizes with Interleukin 15 Priming inDriving Glycolytic Gene Transcription and Supports HumanNatural Killer Cell Activities*
Received for publication, February 12, 2016, and in revised form, April 6, 2016 Published, JBC Papers in Press, April 28, 2016, DOI 10.1074/jbc.M116.721753
Sonia Y. Velasquez‡1, Doreen Killian‡1, Jutta Schulte‡, Carsten Sticht§, Manfred Thiel‡, and Holger A. Lindner‡2
From the ‡Department of Anesthesiology and Surgical Intensive Care Medicine, and §Medical Research Center, University MedicalCenter Mannheim, Medical Faculty Mannheim, Heidelberg University, 68167 Mannheim, Germany
Natural killer (NK) cells induce apoptosis in infected andtransformed cells and are important producers of immunoregu-latory cytokines. Therefore, they operate under low oxygen con-ditions (hypoxia) in inflammatory and tumor environments. Invitro studies of NK cells are, however, commonly performed inambient air (normoxia). We used global gene expression profil-ing to evaluate changes in transcriptional pathways in primaryhuman NK cells following short term culture under hypoxiacompared with normoxia and in response to interleukin 15 (IL-15) priming using a 2 � 2 factorial design. The largest contrastsobserved were priming dependences for associations betweenhypoxia and the hypoxia-inducible factor (Hif) 1 signaling andglycolysis pathways. RT-PCR confirmed positive synergistichypoxia/IL-15 interactions for genes of key regulatory and met-abolic enzymes. IL-15 primes NK cells for effector functions,which were recently demonstrated to depend on glycolyticswitching. We did not, however, observe important increases inglycolytic flux through hypoxia and priming alone. ChemicalHif-1� inhibition suggested equal importance of this transcrip-tion factor for glycolysis and energy production under normoxiaand hypoxia. Hypoxia promoted secretion of CC chemokinesCcl3/4/5 and macrophage migration inhibitory factor. Unex-pectedly, hypoxia also stimulated migration of NK cells throughthe extracellular matrix and shifted amounts of susceptible leu-kemia target cells toward late apoptosis in a cell killing assay. Weconclude that short term hypoxia supports these activities bypositively interacting with NK cell priming at the level of glyco-lytic gene transcription. Hypoxic conditioning of NK cells maythus benefit their use in cell-based immunotherapy of cancer.
Natural killer (NK)3 cells mediate innate immunity by induc-ing apoptosis in infected and transformed cells and are impor-
tant producers of immunoregulatory cytokines (1, 2). There-fore, they experience oxygen levels ranging from 5% in venousto 13% in arterial blood and down to 3–2% in healthy tissue andbelow (hypoxia) in the bone marrow, the lymphatic system, atsites of inflammation, and in the tumor microenvironment(3–9). Tumor hypoxia is thought to support tumor escape fromNK cell-mediated cytotoxicity (9, 10). In vitro, promotion of NKcell-mediated cell killing by interleukin-2 (IL-2) was reported tobe reduced after 96 h at 1% O2 compared with 20% O2, althoughantibody-dependent cellular cytotoxicity was not affected(11). Short term hypoxia (14 –17 h, 1% O2) similarly reducedtarget cell killing, but sustaining hypoxia during the 4 – 4.5-hcell killing assay contributed to this reduction (12, 13). So far,effects of short term hypoxia on NK cell intrinsic activity andon cytolytic susceptibility of target cells, respectively, havenot been separated.
NK cell effector functions are controlled by the cytokinemilieu and integration of activating and inhibitory signals onpotential target cells (14). During an active immune response,the ability of NK cells to respond to activation is substantiallyenhanced through IL-15, which is produced by monocytes,macrophages, and dendritic cells. IL-15 initiates Janus kinase-signal transducer and activator of transcription (Jak-Stat) sig-naling that promotes growth of cytotoxic lymphocytes, includ-ing NK cells (15, 16). Recently, NK cell treatment with IL-15, inaddition to stimulation by cytokines (IL-2, -12, and -18) andbinding of ligands for activating NK receptors, was shown tosupport switching to glycolytic metabolism, which involvesnutrient-sensing mechanistic target of rapamycin (mTor) sig-naling and is a requirement for production of Ifn-� and cyto-lytic effector molecules (17–20). Different signaling pathwaysthus underlie the effectiveness of IL-15 treatment and, conse-quently, of current ex vivo expansion and stimulation strategiesthat make use of this cytokine in NK cell-based immunotherapyof cancer (21–24).
Importantly, NK cell treatment with IL-15 also triggersmiRNA-27a-5p-mediated down-regulation of the cytotoxiceffector molecules granzyme B (Gzmb) and perforin beyondthe first 6 h of cytokine addition (25). Here, we thus use the termIL-15 priming to refer to an initial period of IL-15 exposurelimited to 6 h. We were interested in transcriptional pathway
* The authors declare that they have no conflicts of interest with the contentsof this article.
Raw and normalized microarray data are deposited in the Gene ExpressionOmnibus database (www.ncbi.nlm.nih.gov/geo/; accession No. GSE70214).
1 Both authors contributed equally to this work.2 To whom correspondence should be addressed: Dept. of Anesthesiology
and Surgical Intensive Care Medicine, Medical Faculty Mannheim, Heidel-berg University, Theodor-Kutzer-Ufer 1-3, 68167 Mannheim, Germany.Tel.: 49-621-383-2669; Fax: 49-621-383-3806; E-mail: [email protected].
3 The abbreviations used are: NK, natural killer; 7-AAD, 7-amino-actinomycinD; CTM, chetomin; ECAR, extracellular acidification rate; ECM, extracellularmatrix; GZMB, granzyme B; HIF-1, hypoxia inducible factor 1; MIF, macro-phage migration inhibitory factor; Pdh, pyruvate dehydrogenase; PPP,pentose phosphate pathway; STAT, signal transducer and activator of tran-
scription; TCA, tricarboxylic acid or citric acid; GSEA, Gene Set EnrichmentAnalysis; mTOR, mechanistic target of rapamycin; CFSE, carboxyfluores-cein succinimidyl ester; FDR, false discovery rate.
crossmarkTHE JOURNAL OF BIOLOGICAL CHEMISTRY VOL. 291, NO. 25, pp. 12960 –12977, June 17, 2016
© 2016 by The American Society for Biochemistry and Molecular Biology, Inc. Published in the U.S.A.
12960 JOURNAL OF BIOLOGICAL CHEMISTRY VOLUME 291 • NUMBER 25 • JUNE 17, 2016
by guest on August 25, 2019
http://ww
w.jbc.org/
Dow
nloaded from
changes and possible functional differences in NK cells cul-tured under physiologically low oxygen, namely hypoxia, com-pared with the commonly used standard condition, i.e. nor-moxia, in response to IL-15 priming. Hypoxia and primingsynergistically drove glycolytic gene transcription, and unex-pectedly, hypoxia positively impacted on several NK cell intrin-sic activities as follows: secretion of certain cytokines, migra-tion through extracellular matrix (ECM), and progression oftarget cells to late apoptosis.
The obligatory role of glycolysis for cellular energy (ATP)production under hypoxia precludes interference with it, e.g. bychemical Hif inhibition or addition of glucose analogs, underconditions of low oxygen as a viable experimental strategy intests of cellular function. Nevertheless, our data emphasize theimportance of controlling oxygen levels during the in vitrostudy of NK cells and suggest that hypoxia can promote NK cellproperties desirable for adoptive transfer immunotherapy.
Experimental Procedures
NK Cell Purification and Cell Culture—Ethics approval forthis study was obtained from the medical faculty ethics com-mittee. NK cells were prepared from buffy coats obtainedthrough the local Red Cross Blood Donor Service or wholeblood of healthy donors after informed consent by negativeselection (NK-Cell Isolation Kit, Miltenyi Biotec). Preparationsstained �93% CD56�CD3� and �1% each CD3�, CD14�,CD15�, and CD19� as judged by flow cytometry. Freshly iso-lated NK cells were plated at 106/ml in RPMI 1640 medium(Sigma) supplemented with 10% fetal bovine serum (FBS) and 2mM L-glutamine and were maintained in a standard tissue cul-ture incubator with 5% CO2 resulting in 20% O2 (normoxia,standard condition) or in an oxygen-controlled Galaxy 48RCO2 incubator (New Brunswick) with a nitrogen gas line toestablish 1% O2 (hypoxia) at 5% CO2. Human recombinantIL-15 (PeproTech) was used for priming and an equal volume ofPBS as control. The Hif-1� inhibitor chetomin (CTM) was pre-pared as a 1 mM stock solution in dimethyl sulfoxide (DMSO).K562 cells (DSZM accession number 10) were cultured in thesame medium and under normoxic standard conditions. Atseeding and harvest, NK and K562 cell viabilities by trypan bluestaining under all conditions tested were �90% (Countess,Invitrogen).
Preparation of Total RNA—We combined use of the mir-Vana buffer system (Life Technologies, Inc.) and the smallerPure Link micro kit filter columns and collection tubes (Invit-rogen) to obtain higher final RNA concentrations than with the
regular mirVana kit procedure. Centrifuge settings wereadjusted (10,000 � g, 1 min), and RNA was eluted in 15 �l ofnuclease-free water preheated to 95 °C (14,000 � g, 1 min).DNase-treated samples (DNA-free kit, Ambion) were spectro-metrically quantified (Tecan Infinite M200 NanoQuant). RNAintegrity numbers were �8 (Agilent Bioanalyzer 2100).
Microarray and Gene Set Enrichment Analysis (GSEA)—Forgene expression profiling, we used Hugene-2_0-st-type arrays(Affymetrix) on an Affymetrix GeneChip platform (AffymetrixCore Facility, Medical Research Center Mannheim), and a Cus-tom CDF Version 17 with Entrez-based gene definitions forarray annotation (26). Raw fluorescence intensities were nor-malized applying quantile normalization and robust multiarrayaverage background correction. One-way analysis of variancewas performed to identify differentially expressed genes usingJMP10 Genomics version 6 (SAS Institute). A false-positive rateof � � 0.05 with false discovery rate (FDR) correction was con-sidered significant. We performed GSEA to determine whetherdefined gene sets exhibited statistically significant bias in theirdistribution within a ranked gene list (27). Gene sets for path-ways belonging to various cell functions were obtained fromKEGG.
RT-PCR—For relative mRNA quantitation, we reverse-tran-scribed total RNA using the high capacity cDNA reverse tran-scription kit and performed TaqMan RT-PCR gene expressionanalysis on a 7900HT Fast Real Time PCR instrument (LifeTechnologies, Inc.). Assay IDs are assembled in Table 1. �-Glu-curonidase (GUSB) was chosen as endogenous control gene inour experiments among the 16 candidate genes tested by theTaqMan Low Density Array Human Endogenous ControlPanel (Life Technologies, Inc.).
Protein Secretion—We screened 29 panel analytes selectedfrom MILLIPLEX map kits HCYTOMAG-60K, HCD8MAG-15K, HSP1MAG-63K, and HTH17MAG-14K (Merck Milli-pore) for secretion by NK cells. Conditioned culture superna-tants were stored at �80 °C until analysis on a MAGPIX system(Luminex). Duplicate determinations were averaged and eval-uated using MILLIPLEX Analyst software. Human Vegf wasdetermined by ELISA (Quantikine kit, R&D Systems).
Matrigel Invasion and Alamar Blue Assay—The ability of NKcells to migrate through ECM was assessed using BiocoatMatrigel invasion chambers with 8-�m pore size polycarbonatemembranes (Corning) based on a published protocol (28).Briefly, 5 � 105 NK cells in 0.3 ml of RPMI 1640 medium (10%FBS, 2 mM L-glutamine), supplemented with IL-15 at a final
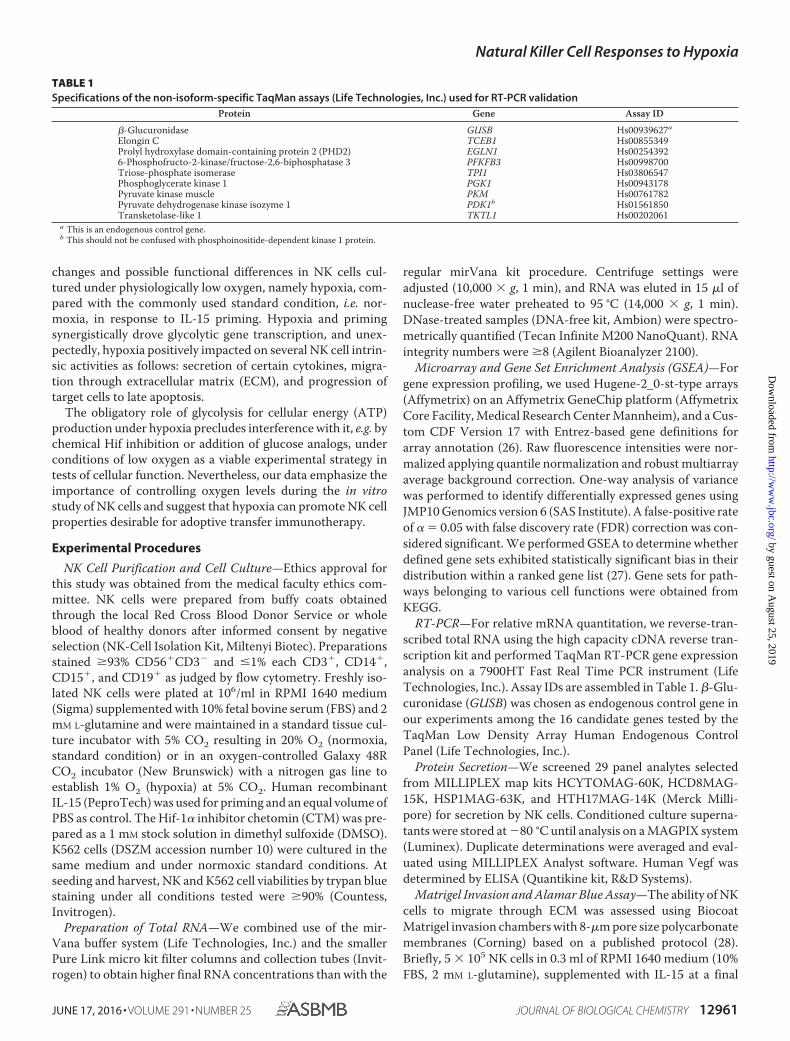
TABLE 1Specifications of the non-isoform-specific TaqMan assays (Life Technologies, Inc.) used for RT-PCR validation
Protein Gene Assay ID
�-Glucuronidase GUSB Hs00939627a
Elongin C TCEB1 Hs00855349Prolyl hydroxylase domain-containing protein 2 (PHD2) EGLN1 Hs002543926-Phosphofructo-2-kinase/fructose-2,6-biphosphatase 3 PFKFB3 Hs00998700Triose-phosphate isomerase TPI1 Hs03806547Phosphoglycerate kinase 1 PGK1 Hs00943178Pyruvate kinase muscle PKM Hs00761782Pyruvate dehydrogenase kinase isozyme 1 PDK1b Hs01561850Transketolase-like 1 TKTL1 Hs00202061
a This is an endogenous control gene.b This should not be confused with phosphoinositide-dependent kinase 1 protein.
Natural Killer Cell Responses to Hypoxia
JUNE 17, 2016 • VOLUME 291 • NUMBER 25 JOURNAL OF BIOLOGICAL CHEMISTRY 12961
by guest on August 25, 2019
http://ww
w.jbc.org/
Dow
nloaded from
concentration of 50 ng/ml or 5 �l/ml PBS, were loaded in trip-licate into the upper chambers of 24-well plate inserts. Lowerchambers were filled with 1.5 ml of likewise supplementedmedium, respectively. Assembled chambers were incubated for48 h at 37 °C and either 20 or 1% O2. From the same NK cellpreparation, we set up parallel NK cell cultures under these fourconditions for calibration purposes. Four hours before the endof the 48-h incubation period, we added 150 �l of Alamar Blueto the lower chambers. Cells from the parallel cultures werecounted, and five serial 1:1 dilutions starting at 5 � 105 cells infinal volumes of 1.5 ml were plated in duplicate into free wellson the same plate holding the inserts for the correspondingoxygen concentration, plus two background controls. As to thelower chambers, 150 �l of Alamar Blue was added to standardsand controls, and plates were returned to incubators at 20 and1% O2, correspondingly, for the remaining 4 h. At the end of the48-h period, inserts were removed. Fluorescence of reducedAlamar Blue was measured as described previously (28). Num-bers of migrated NK cells were calculated from calibrationcurves. The Alamar Blue assay was also applied to assess viabil-ities of NK cells conditioned for 22 h under normoxia orhypoxia with IL-15, varying concentrations of CTM, and thedye present during the final 6 h of this period. Cells were seededin 96-well plates at 105 cells in 100 �l per well. The Alamar Bluevolume added was 10 �l per well.
Flow Cytometry—NK cell protein expression was assessedusing fluorochrome-conjugated monoclonal antibodies (Table2). For intracellular staining, we used the BD Cytofix/CytopermFixation/Permeabilization Kit (BD Biosciences). A total of 105
stained cells were acquired on a FACSCanto II cytometer andanalyzed using FACSDiva software (BD Biosciences). Apopto-sis in CTM-treated NK cells was detected by staining withannexin V-APC and 7-amino-actinomycin D (7-AAD) (BDBiosciences) and gating on singlets in the forward scatter heightversus forward scatter area plot. Duplets were between 3 and6%.
To assess the ability of NK cells to induce apoptosis in targetcells, 2.5–5 � 106 K562 cells were labeled with carboxyfluores-cein succinimidyl ester (CFSE) (Molecular Probes) at a finalconcentration of 62.5 nM in 2 ml of PBS for 15 min at 37 °C.Cells were pelleted and resuspended in 4 ml of RPMI 1640medium (10% FBS, 2 mM L-glutamine), incubated for 30 min at37 °C, and then washed twice with PBS. Subsequently, CFSE-
labeled K562 target cells were resuspended in RPMI 1640medium (10% FBS, 2 mM L-glutamine) at a concentration of 105
cells/ml and co-incubated with 2.5 � 106 conditioned NK cellsin a final volume of 2 ml under standard culture conditions.After 4 h, the killing reaction was stopped by putting the cells onice and washing twice with PBS followed by addition of annexinV-APC and 7-AAD.
Cellular L-Lactate Dehydrogenase (Ldh) Release andContent—To quantify specific lysis of K562 target cells (T) byeffector NK cells (E), release and cellular contents of Ldh weredetermined enzymatically using the coupled CytoTox 96 non-radioactive cytotoxicity assay (Promega). Fixed numbers of 5 �104 K562 cells were mixed with conditioned NK cells in vol-umes of 200 �l at a final FBS concentration of 2% and indicatedE/T ratios in triplicate and maintained under standard condi-tions for 4 h. Ldh activities in lysates of K562 cells and culturesupernatants were derived from initial slopes of absorbanceversus time progress curves for dye reduction. Cellular Ldh con-tent of NK cells was assessed in lysates of 2 � 105 cells in 100 �lof culture medium using the same lysis procedure as for K562cells.
Extracellular Flux Analysis—Extracellular acidification rate(ECAR) was measured on a Seahorse XFp analyzer (SeahorseBioscience) using the Seahorse XF glycolysis stress test kit.Conditioned NK cells were washed twice and resuspended inserum-free unbuffered RPMI 1640 medium with 2 mM L-gluta-mine and without glucose (Sigma). For comparison of two orthree conditions, respectively, cells were plated in triplicate orduplicate into Seahorse miniplates at 2 � 105 cells per well.ECAR was recorded over time with sequential additions of glu-cose (10 mM), oligomycin (1 �M), and 2-deoxyglucose (50 mM)(Seahorse Bioscience). Data were evaluated using SeahorseWave software.
Glucose, Lactate, and ATP Measurements—Glucose and lac-tate levels in culture supernatants from conditioned NK cellswere measured enzymatically in single determinations on aCobas c 311 analyzer using the glucose HK (GLUC2) and lac-tate (LACT2) assay kits (Roche Applied Science/Hitachi), witha measuring range of 0.11– 41.60 and 0.2–15.5 mM, respec-tively. Cellular ATP levels were assessed in aliquots of 105 con-ditioned and CTM-treated cells in 100 �l of culture medium intriplicate using the CellTiter Glo� luminescent cell viabilityassay (Promega).
Statistical Analysis—Differences between experimentalgroups of paired samples were evaluated using the Wilcoxonsigned-rank test (SigmaPlot version 11). p values �0.05 wereconsidered statistically significant.
Results
Transcriptional Up-regulation of Hif-1 Signaling and Glyco-lytic Pathways by Hypoxia in NK Cells Is Dependent on IL-15Priming—NK cells conditioned by a 22-h culture under hypoxiaor normoxia with or without IL-15 priming for the final 6 hwere subjected to global transcriptome profiling. Abundancefor 23% of 23,786 genes on the microarray was changed signif-icantly by priming regardless of oxygen concentration. Hypoxiaalone only changed it for 1.79% with and for 1.70% withoutpriming. We focused on significantly regulated pathways
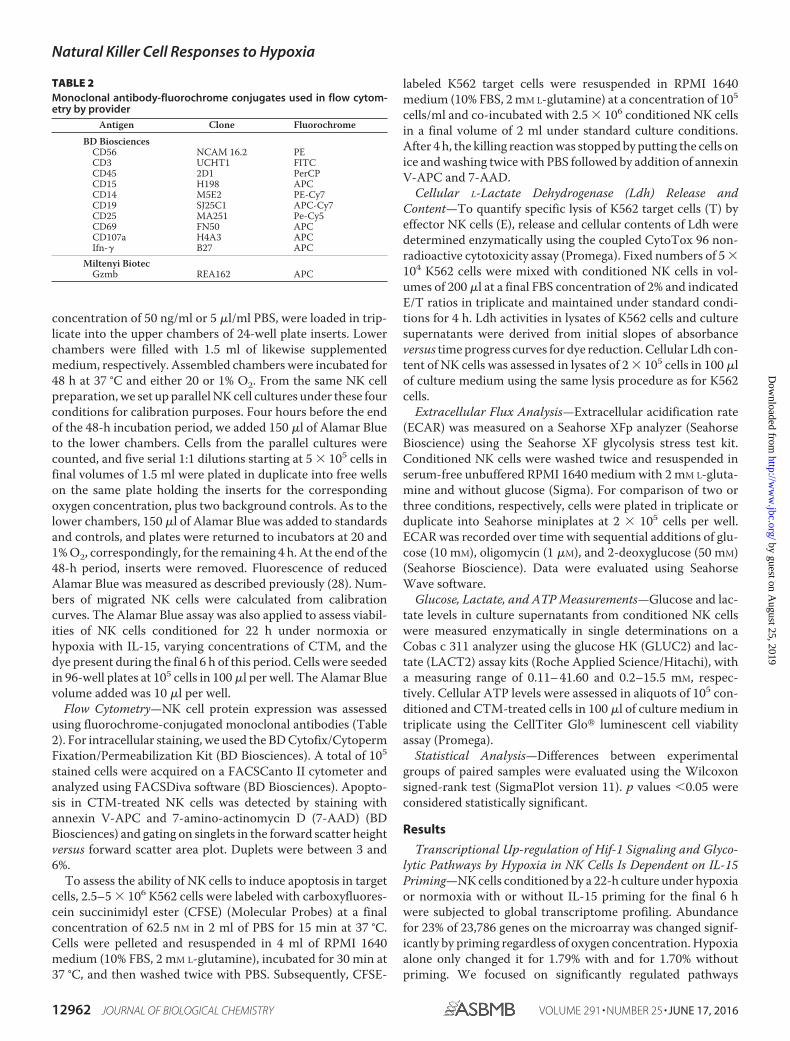
TABLE 2Monoclonal antibody-fluorochrome conjugates used in flow cytom-etry by provider
Antigen Clone Fluorochrome
BD BiosciencesCD56 NCAM 16.2 PECD3 UCHT1 FITCCD45 2D1 PerCPCD15 H198 APCCD14 M5E2 PE-Cy7CD19 SJ25C1 APC-Cy7CD25 MA251 Pe-Cy5CD69 FN50 APCCD107a H4A3 APCIfn-� B27 APC
Miltenyi BiotecGzmb REA162 APC
Natural Killer Cell Responses to Hypoxia
12962 JOURNAL OF BIOLOGICAL CHEMISTRY VOLUME 291 • NUMBER 25 • JUNE 17, 2016
by guest on August 25, 2019
http://ww
w.jbc.org/
Dow
nloaded from
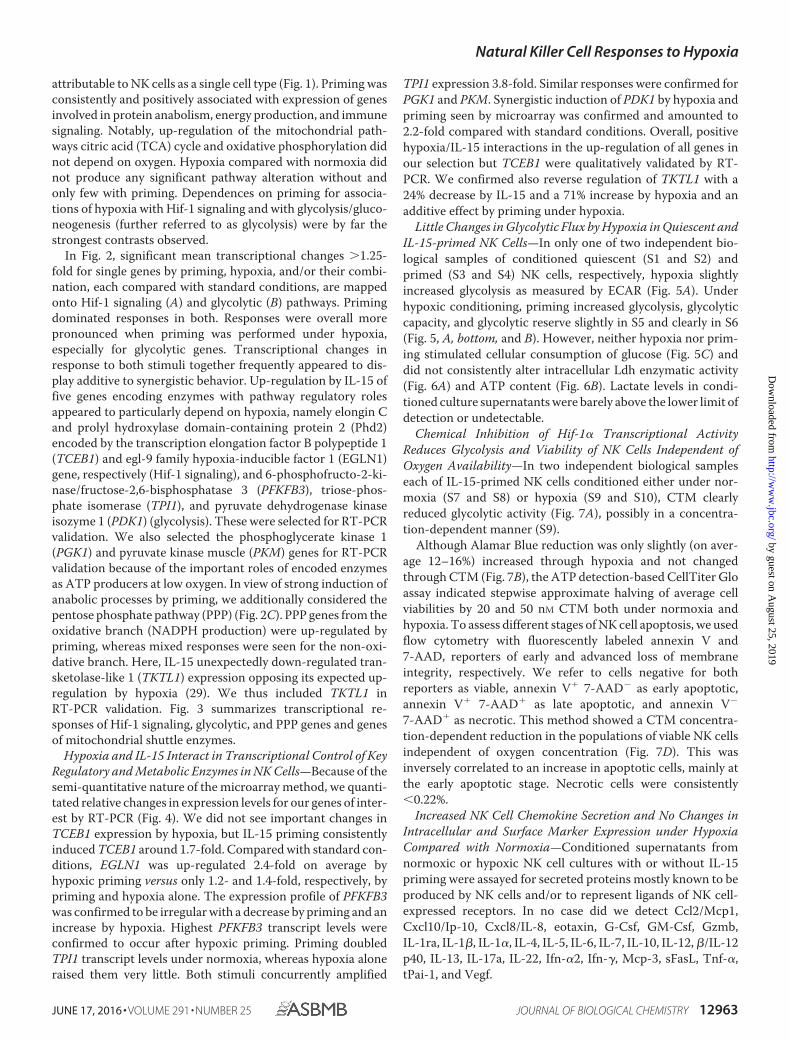
attributable to NK cells as a single cell type (Fig. 1). Priming wasconsistently and positively associated with expression of genesinvolved in protein anabolism, energy production, and immunesignaling. Notably, up-regulation of the mitochondrial path-ways citric acid (TCA) cycle and oxidative phosphorylation didnot depend on oxygen. Hypoxia compared with normoxia didnot produce any significant pathway alteration without andonly few with priming. Dependences on priming for associa-tions of hypoxia with Hif-1 signaling and with glycolysis/gluco-neogenesis (further referred to as glycolysis) were by far thestrongest contrasts observed.
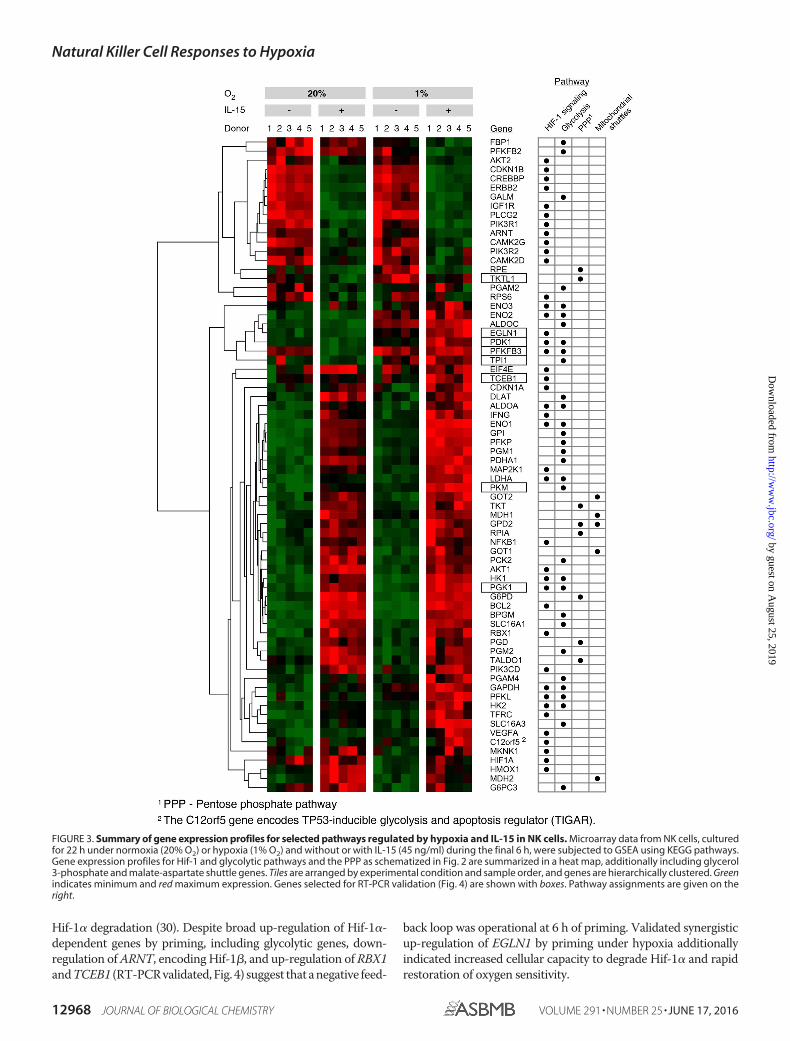
In Fig. 2, significant mean transcriptional changes �1.25-fold for single genes by priming, hypoxia, and/or their combi-nation, each compared with standard conditions, are mappedonto Hif-1 signaling (A) and glycolytic (B) pathways. Primingdominated responses in both. Responses were overall morepronounced when priming was performed under hypoxia,especially for glycolytic genes. Transcriptional changes inresponse to both stimuli together frequently appeared to dis-play additive to synergistic behavior. Up-regulation by IL-15 offive genes encoding enzymes with pathway regulatory rolesappeared to particularly depend on hypoxia, namely elongin Cand prolyl hydroxylase domain-containing protein 2 (Phd2)encoded by the transcription elongation factor B polypeptide 1(TCEB1) and egl-9 family hypoxia-inducible factor 1 (EGLN1)gene, respectively (Hif-1 signaling), and 6-phosphofructo-2-ki-nase/fructose-2,6-bisphosphatase 3 (PFKFB3), triose-phos-phate isomerase (TPI1), and pyruvate dehydrogenase kinaseisozyme 1 (PDK1) (glycolysis). These were selected for RT-PCRvalidation. We also selected the phosphoglycerate kinase 1(PGK1) and pyruvate kinase muscle (PKM) genes for RT-PCRvalidation because of the important roles of encoded enzymesas ATP producers at low oxygen. In view of strong induction ofanabolic processes by priming, we additionally considered thepentose phosphate pathway (PPP) (Fig. 2C). PPP genes from theoxidative branch (NADPH production) were up-regulated bypriming, whereas mixed responses were seen for the non-oxi-dative branch. Here, IL-15 unexpectedly down-regulated tran-sketolase-like 1 (TKTL1) expression opposing its expected up-regulation by hypoxia (29). We thus included TKTL1 inRT-PCR validation. Fig. 3 summarizes transcriptional re-sponses of Hif-1 signaling, glycolytic, and PPP genes and genesof mitochondrial shuttle enzymes.
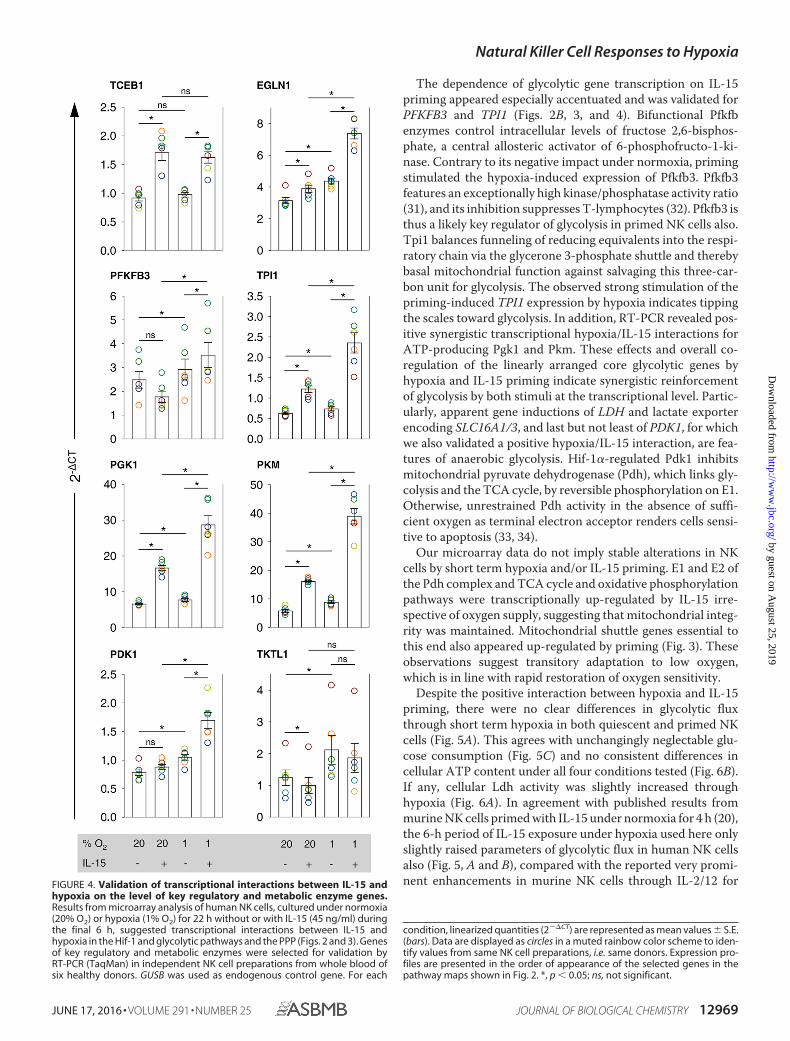
Hypoxia and IL-15 Interact in Transcriptional Control of KeyRegulatory and Metabolic Enzymes in NK Cells—Because of thesemi-quantitative nature of the microarray method, we quanti-tated relative changes in expression levels for our genes of inter-est by RT-PCR (Fig. 4). We did not see important changes inTCEB1 expression by hypoxia, but IL-15 priming consistentlyinduced TCEB1 around 1.7-fold. Compared with standard con-ditions, EGLN1 was up-regulated 2.4-fold on average byhypoxic priming versus only 1.2- and 1.4-fold, respectively, bypriming and hypoxia alone. The expression profile of PFKFB3was confirmed to be irregular with a decrease by priming and anincrease by hypoxia. Highest PFKFB3 transcript levels wereconfirmed to occur after hypoxic priming. Priming doubledTPI1 transcript levels under normoxia, whereas hypoxia aloneraised them very little. Both stimuli concurrently amplified
TPI1 expression 3.8-fold. Similar responses were confirmed forPGK1 and PKM. Synergistic induction of PDK1 by hypoxia andpriming seen by microarray was confirmed and amounted to2.2-fold compared with standard conditions. Overall, positivehypoxia/IL-15 interactions in the up-regulation of all genes inour selection but TCEB1 were qualitatively validated by RT-PCR. We confirmed also reverse regulation of TKTL1 with a24% decrease by IL-15 and a 71% increase by hypoxia and anadditive effect by priming under hypoxia.
Little Changes in Glycolytic Flux by Hypoxia in Quiescent andIL-15-primed NK Cells—In only one of two independent bio-logical samples of conditioned quiescent (S1 and S2) andprimed (S3 and S4) NK cells, respectively, hypoxia slightlyincreased glycolysis as measured by ECAR (Fig. 5A). Underhypoxic conditioning, priming increased glycolysis, glycolyticcapacity, and glycolytic reserve slightly in S5 and clearly in S6(Fig. 5, A, bottom, and B). However, neither hypoxia nor prim-ing stimulated cellular consumption of glucose (Fig. 5C) anddid not consistently alter intracellular Ldh enzymatic activity(Fig. 6A) and ATP content (Fig. 6B). Lactate levels in condi-tioned culture supernatants were barely above the lower limit ofdetection or undetectable.
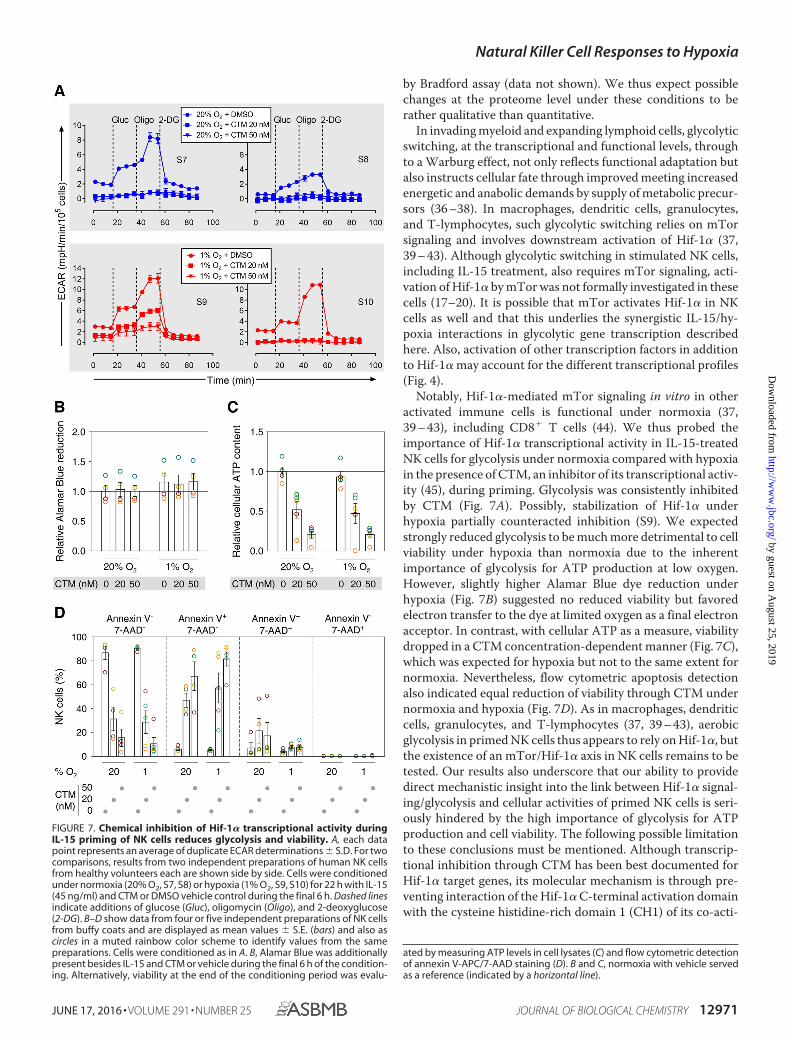
Chemical Inhibition of Hif-1� Transcriptional ActivityReduces Glycolysis and Viability of NK Cells Independent ofOxygen Availability—In two independent biological sampleseach of IL-15-primed NK cells conditioned either under nor-moxia (S7 and S8) or hypoxia (S9 and S10), CTM clearlyreduced glycolytic activity (Fig. 7A), possibly in a concentra-tion-dependent manner (S9).
Although Alamar Blue reduction was only slightly (on aver-age 12–16%) increased through hypoxia and not changedthrough CTM (Fig. 7B), the ATP detection-based CellTiter Gloassay indicated stepwise approximate halving of average cellviabilities by 20 and 50 nM CTM both under normoxia andhypoxia. To assess different stages of NK cell apoptosis, we usedflow cytometry with fluorescently labeled annexin V and7-AAD, reporters of early and advanced loss of membraneintegrity, respectively. We refer to cells negative for bothreporters as viable, annexin V� 7-AAD� as early apoptotic,annexin V� 7-AAD� as late apoptotic, and annexin V�
7-AAD� as necrotic. This method showed a CTM concentra-tion-dependent reduction in the populations of viable NK cellsindependent of oxygen concentration (Fig. 7D). This wasinversely correlated to an increase in apoptotic cells, mainly atthe early apoptotic stage. Necrotic cells were consistently�0.22%.
Increased NK Cell Chemokine Secretion and No Changes inIntracellular and Surface Marker Expression under HypoxiaCompared with Normoxia—Conditioned supernatants fromnormoxic or hypoxic NK cell cultures with or without IL-15priming were assayed for secreted proteins mostly known to beproduced by NK cells and/or to represent ligands of NK cell-expressed receptors. In no case did we detect Ccl2/Mcp1,Cxcl10/Ip-10, Cxcl8/IL-8, eotaxin, G-Csf, GM-Csf, Gzmb,IL-1ra, IL-1�, IL-1�, IL-4, IL-5, IL-6, IL-7, IL-10, IL-12, �/IL-12p40, IL-13, IL-17a, IL-22, Ifn-�2, Ifn-�, Mcp-3, sFasL, Tnf-�,tPai-1, and Vegf.
Natural Killer Cell Responses to Hypoxia
JUNE 17, 2016 • VOLUME 291 • NUMBER 25 JOURNAL OF BIOLOGICAL CHEMISTRY 12963
by guest on August 25, 2019
http://ww
w.jbc.org/
Dow
nloaded from
Natural Killer Cell Responses to Hypoxia
12964 JOURNAL OF BIOLOGICAL CHEMISTRY VOLUME 291 • NUMBER 25 • JUNE 17, 2016
by guest on August 25, 2019
http://ww
w.jbc.org/
Dow
nloaded from
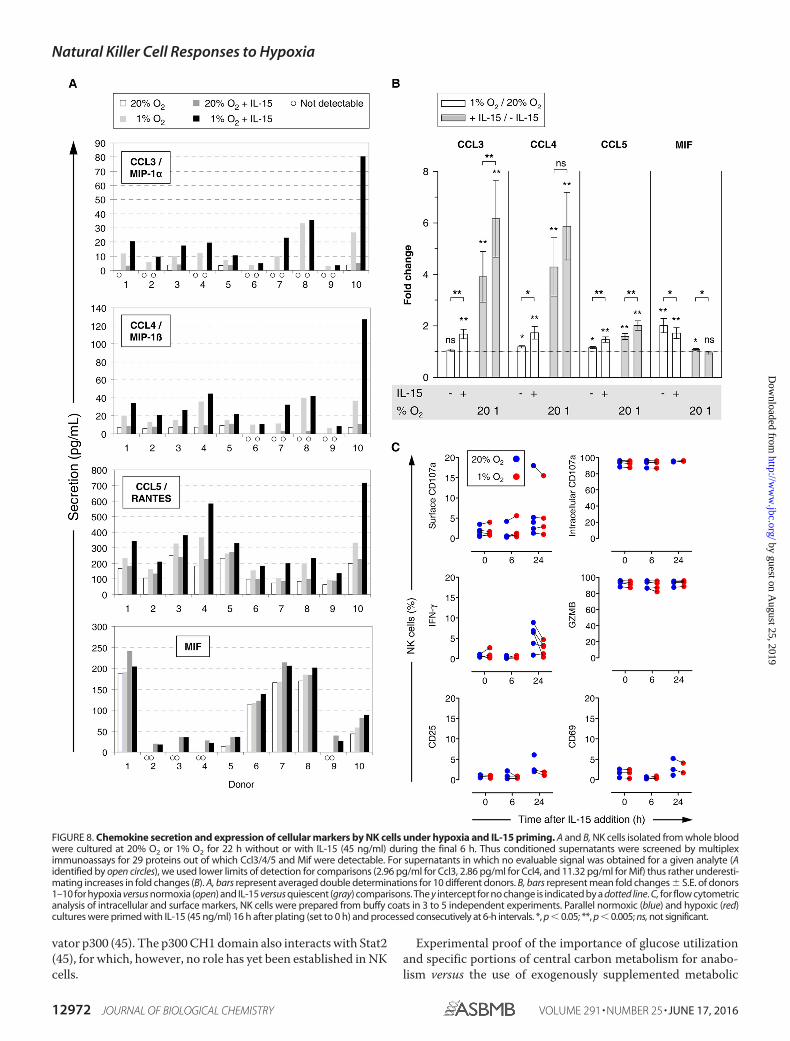
Ccl-5/Rantes (regulated on activation normal T cellexpressed and secreted) was consistently detected at 16 –715pg/ml (Fig. 8A). Ccl3/Mip-1� and Ccl4/Mip-1� required prim-ing to be measurable throughout. Overall mean levels for bothwere 1 order of magnitude lower than for Ccl5. Despite differ-ences in absolute concentrations between donors for a givencondition, respective profile shapes for Ccl3/4/5 were highlyconsistent. Hypoxia had little effect on secretion by resting NKcells but increased mean levels after priming 1.7-fold (Ccl3/4)and 1.5-fold (Ccl5) (Fig. 8B). Increases in Ccl3/4/5 throughpriming were stronger under hypoxia than normoxia.
Macrophage migration inhibitory factor (Mif) depended onhypoxia to be measurable throughout (Fig. 8A). The hypoxia-dependent average increase in Mif secretion by resting NK cellswas 2-fold (Fig. 8B). However, this number resulted from het-erogeneous profiles. All-or-nothing responses were observedwith four donors where the hypoxia levels of Mif did not exceed50 pg/ml, although increases were intermediate to small withthe other donors for whom Mif levels ranged from �50 to 240pg/ml. Hypoxia response profiles with priming were similar butslightly weaker (1.7-fold versus 2-fold increase). Priming hardlyaffected Mif concentrations.
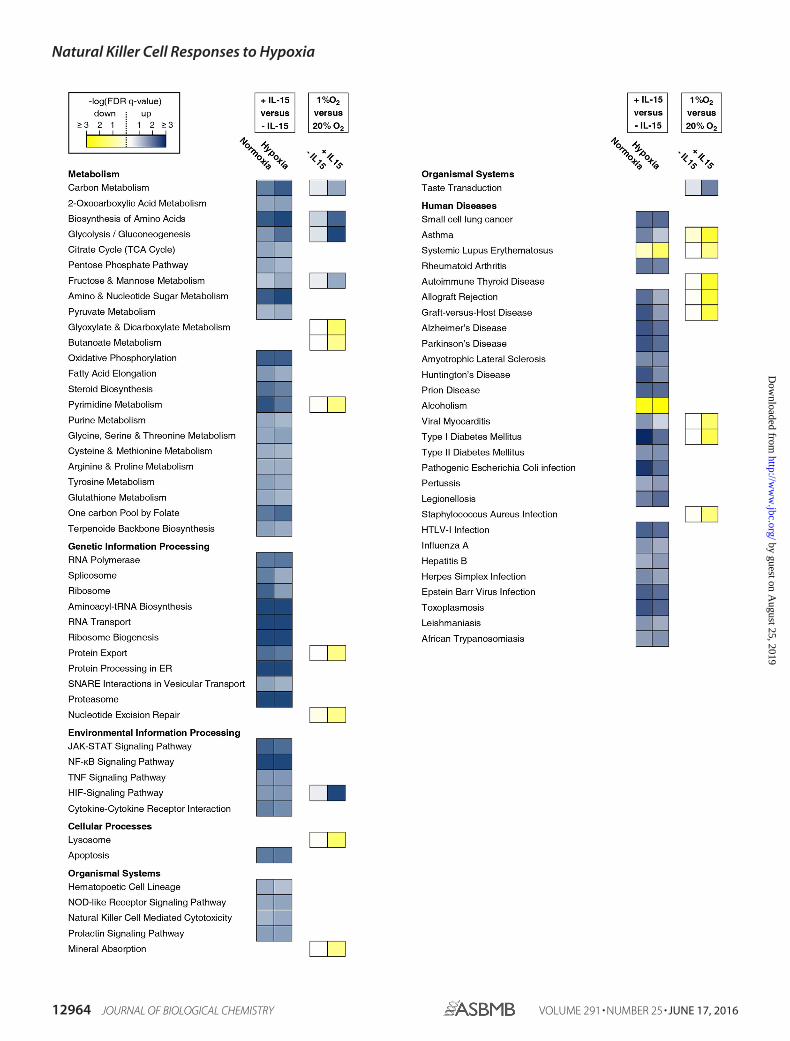
FIGURE 1. Canonical KEGG pathways altered by IL-15 priming and hypoxia. NK cells were isolated from whole blood of five healthy donors, cultured at20% or 1% O2 for 22 h without or with IL-15 (45 ng/ml) during the final 6 h, and subjected to microarray analysis (Human Gene 2.0 ST array, Affymetrix). GSEAwas applied to KEGG pathways. The �log10 of FDR-adjusted probabilities (FDR q-values) of the enrichment of pathways below a 0.05 threshold for at least oneof the four comparisons shown are displayed on a color scale with yellow denoting negative and blue positive association. Pathways attributable to NK cells assingle cell type are assembled on the left and those involving cells of varying type and tissue origin on the right.
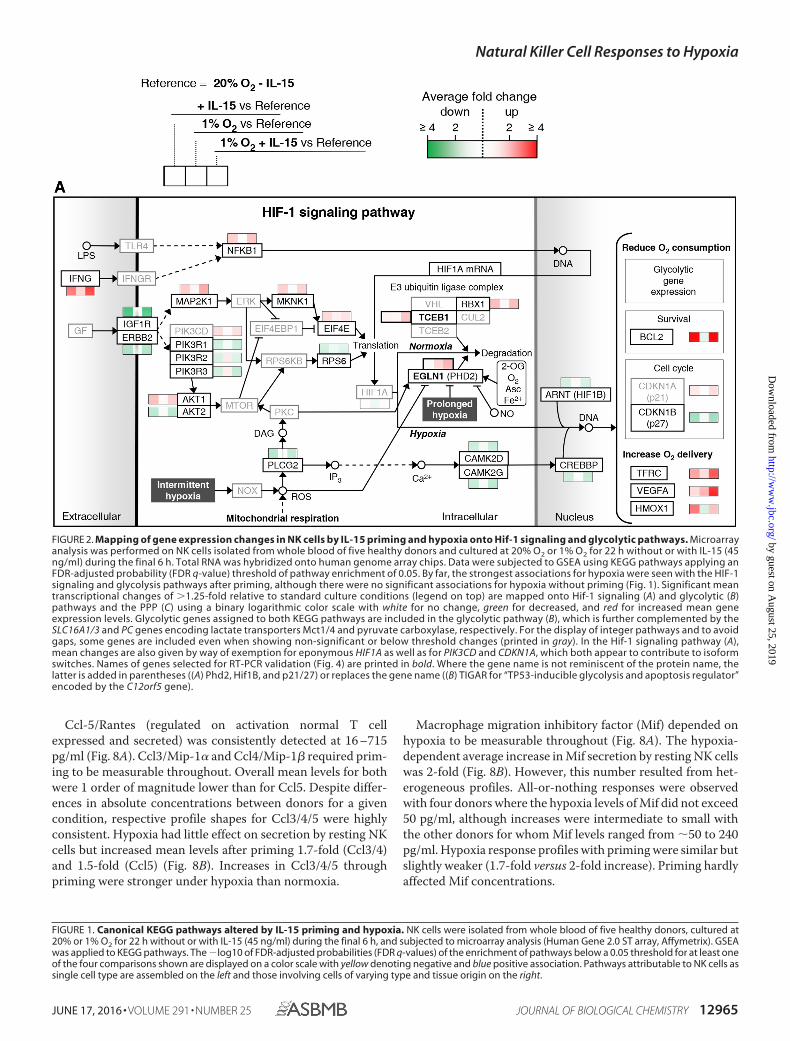
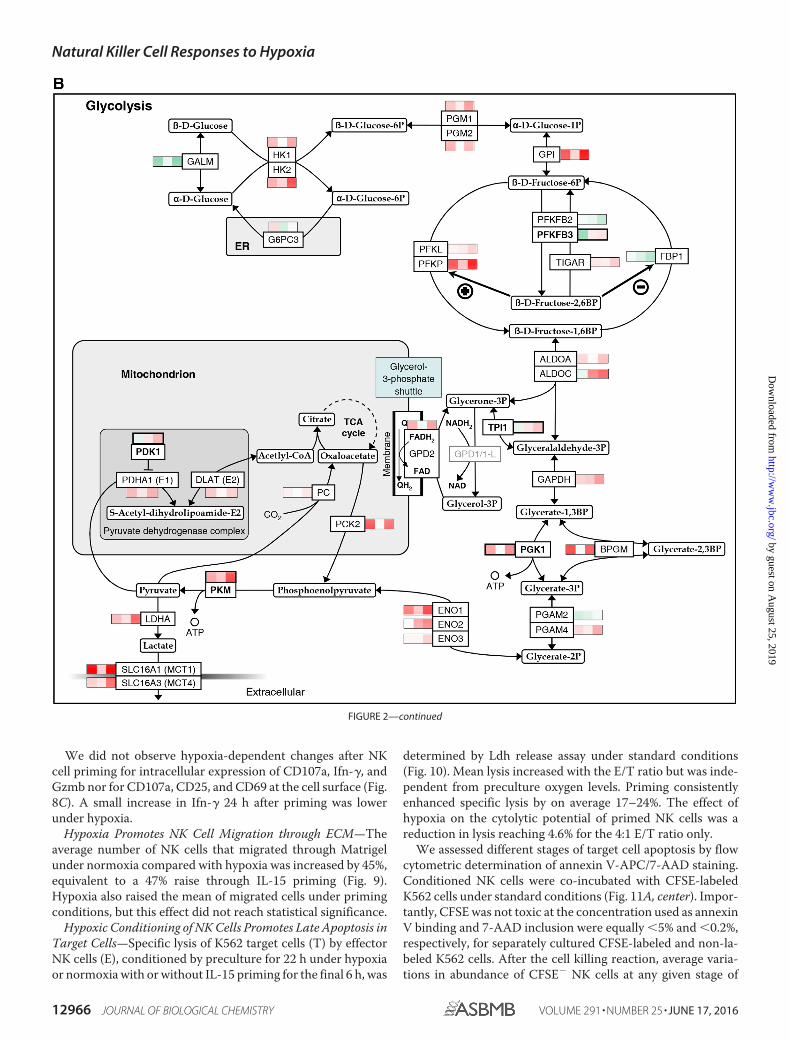
FIGURE 2. Mapping of gene expression changes in NK cells by IL-15 priming and hypoxia onto Hif-1 signaling and glycolytic pathways. Microarrayanalysis was performed on NK cells isolated from whole blood of five healthy donors and cultured at 20% O2 or 1% O2 for 22 h without or with IL-15 (45ng/ml) during the final 6 h. Total RNA was hybridized onto human genome array chips. Data were subjected to GSEA using KEGG pathways applying anFDR-adjusted probability (FDR q-value) threshold of pathway enrichment of 0.05. By far, the strongest associations for hypoxia were seen with the HIF-1signaling and glycolysis pathways after priming, although there were no significant associations for hypoxia without priming (Fig. 1). Significant meantranscriptional changes of �1.25-fold relative to standard culture conditions (legend on top) are mapped onto Hif-1 signaling (A) and glycolytic (B)pathways and the PPP (C) using a binary logarithmic color scale with white for no change, green for decreased, and red for increased mean geneexpression levels. Glycolytic genes assigned to both KEGG pathways are included in the glycolytic pathway (B), which is further complemented by theSLC16A1/3 and PC genes encoding lactate transporters Mct1/4 and pyruvate carboxylase, respectively. For the display of integer pathways and to avoidgaps, some genes are included even when showing non-significant or below threshold changes (printed in gray). In the Hif-1 signaling pathway (A),mean changes are also given by way of exemption for eponymous HIF1A as well as for PIK3CD and CDKN1A, which both appear to contribute to isoformswitches. Names of genes selected for RT-PCR validation (Fig. 4) are printed in bold. Where the gene name is not reminiscent of the protein name, thelatter is added in parentheses ((A) Phd2, Hif1B, and p21/27) or replaces the gene name ((B) TIGAR for “TP53-inducible glycolysis and apoptosis regulator”encoded by the C12orf5 gene).
Natural Killer Cell Responses to Hypoxia
JUNE 17, 2016 • VOLUME 291 • NUMBER 25 JOURNAL OF BIOLOGICAL CHEMISTRY 12965
by guest on August 25, 2019
http://ww
w.jbc.org/
Dow
nloaded from
We did not observe hypoxia-dependent changes after NKcell priming for intracellular expression of CD107a, Ifn-�, andGzmb nor for CD107a, CD25, and CD69 at the cell surface (Fig.8C). A small increase in Ifn-� 24 h after priming was lowerunder hypoxia.
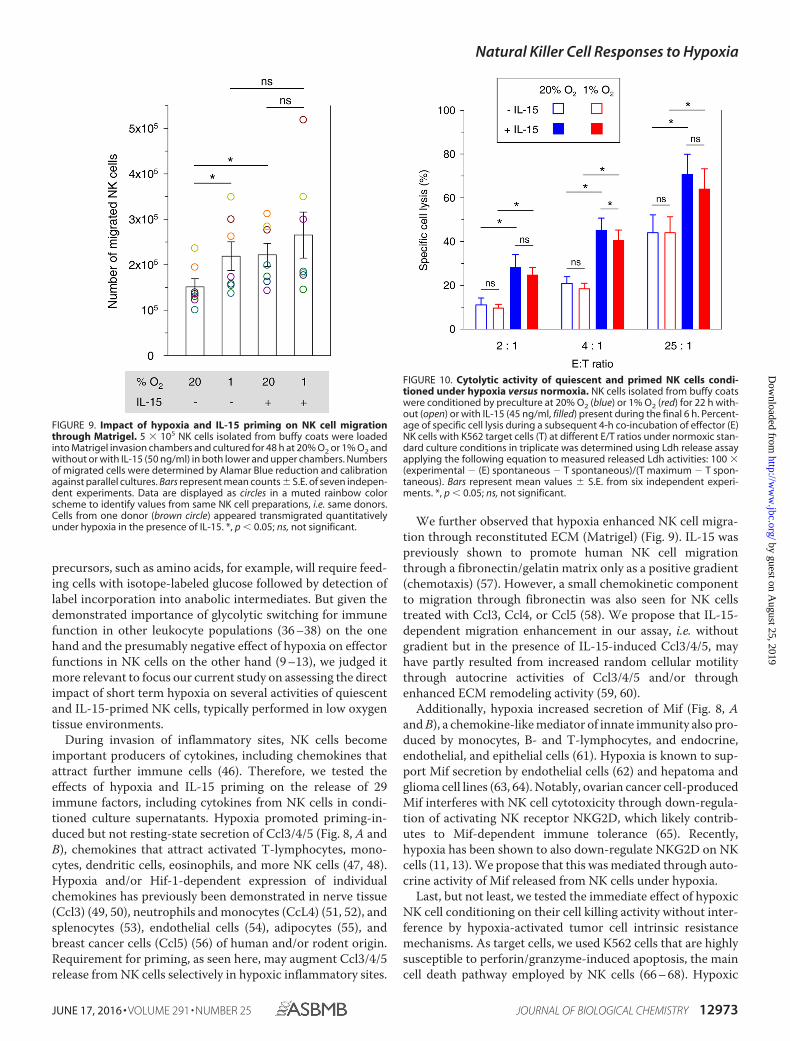
Hypoxia Promotes NK Cell Migration through ECM—Theaverage number of NK cells that migrated through Matrigelunder normoxia compared with hypoxia was increased by 45%,equivalent to a 47% raise through IL-15 priming (Fig. 9).Hypoxia also raised the mean of migrated cells under primingconditions, but this effect did not reach statistical significance.
Hypoxic Conditioning of NK Cells Promotes Late Apoptosis inTarget Cells—Specific lysis of K562 target cells (T) by effectorNK cells (E), conditioned by preculture for 22 h under hypoxiaor normoxia with or without IL-15 priming for the final 6 h, was
determined by Ldh release assay under standard conditions(Fig. 10). Mean lysis increased with the E/T ratio but was inde-pendent from preculture oxygen levels. Priming consistentlyenhanced specific lysis by on average 17–24%. The effect ofhypoxia on the cytolytic potential of primed NK cells was areduction in lysis reaching 4.6% for the 4:1 E/T ratio only.
We assessed different stages of target cell apoptosis by flowcytometric determination of annexin V-APC/7-AAD staining.Conditioned NK cells were co-incubated with CFSE-labeledK562 cells under standard conditions (Fig. 11A, center). Impor-tantly, CFSE was not toxic at the concentration used as annexinV binding and 7-AAD inclusion were equally �5% and �0.2%,respectively, for separately cultured CFSE-labeled and non-la-beled K562 cells. After the cell killing reaction, average varia-tions in abundance of CFSE� NK cells at any given stage of
FIGURE 2—continued
Natural Killer Cell Responses to Hypoxia
12966 JOURNAL OF BIOLOGICAL CHEMISTRY VOLUME 291 • NUMBER 25 • JUNE 17, 2016
by guest on August 25, 2019
http://ww
w.jbc.org/
Dow
nloaded from
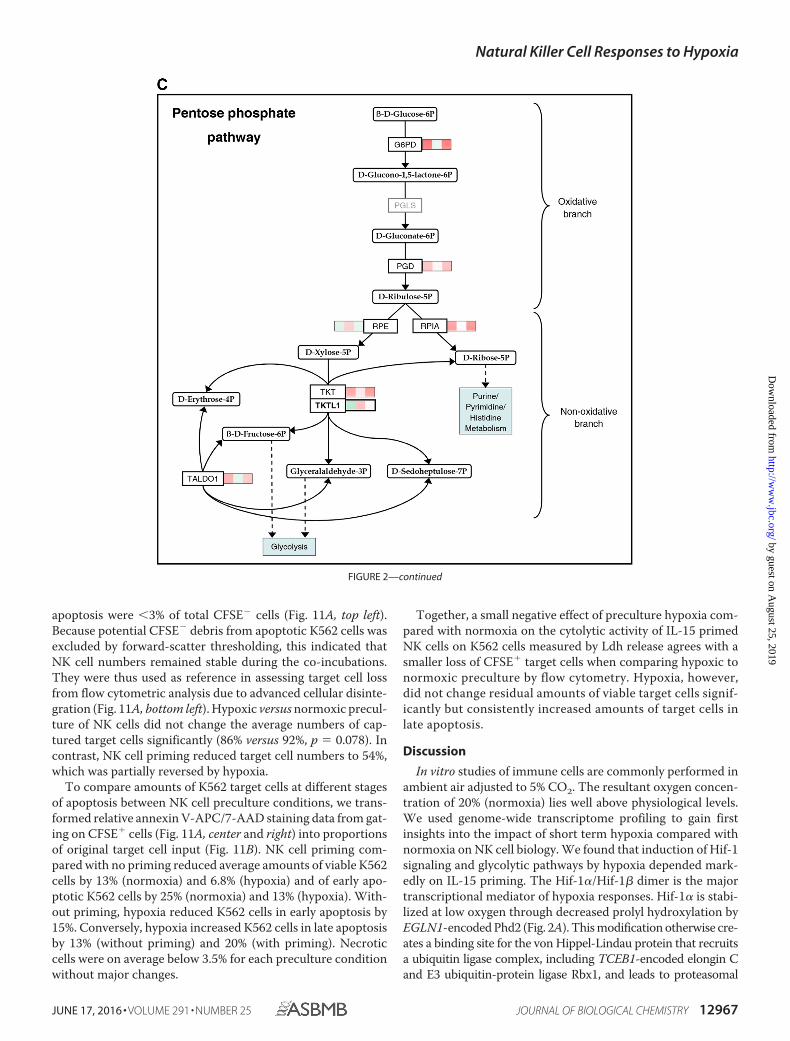
apoptosis were �3% of total CFSE� cells (Fig. 11A, top left).Because potential CFSE� debris from apoptotic K562 cells wasexcluded by forward-scatter thresholding, this indicated thatNK cell numbers remained stable during the co-incubations.They were thus used as reference in assessing target cell lossfrom flow cytometric analysis due to advanced cellular disinte-gration (Fig. 11A, bottom left). Hypoxic versus normoxic precul-ture of NK cells did not change the average numbers of cap-tured target cells significantly (86% versus 92%, p � 0.078). Incontrast, NK cell priming reduced target cell numbers to 54%,which was partially reversed by hypoxia.
To compare amounts of K562 target cells at different stagesof apoptosis between NK cell preculture conditions, we trans-formed relative annexin V-APC/7-AAD staining data from gat-ing on CFSE� cells (Fig. 11A, center and right) into proportionsof original target cell input (Fig. 11B). NK cell priming com-pared with no priming reduced average amounts of viable K562cells by 13% (normoxia) and 6.8% (hypoxia) and of early apo-ptotic K562 cells by 25% (normoxia) and 13% (hypoxia). With-out priming, hypoxia reduced K562 cells in early apoptosis by15%. Conversely, hypoxia increased K562 cells in late apoptosisby 13% (without priming) and 20% (with priming). Necroticcells were on average below 3.5% for each preculture conditionwithout major changes.
Together, a small negative effect of preculture hypoxia com-pared with normoxia on the cytolytic activity of IL-15 primedNK cells on K562 cells measured by Ldh release agrees with asmaller loss of CFSE� target cells when comparing hypoxic tonormoxic preculture by flow cytometry. Hypoxia, however,did not change residual amounts of viable target cells signif-icantly but consistently increased amounts of target cells inlate apoptosis.
Discussion
In vitro studies of immune cells are commonly performed inambient air adjusted to 5% CO2. The resultant oxygen concen-tration of 20% (normoxia) lies well above physiological levels.We used genome-wide transcriptome profiling to gain firstinsights into the impact of short term hypoxia compared withnormoxia on NK cell biology. We found that induction of Hif-1signaling and glycolytic pathways by hypoxia depended mark-edly on IL-15 priming. The Hif-1�/Hif-1� dimer is the majortranscriptional mediator of hypoxia responses. Hif-1� is stabi-lized at low oxygen through decreased prolyl hydroxylation byEGLN1-encoded Phd2 (Fig. 2A). This modification otherwise cre-ates a binding site for the von Hippel-Lindau protein that recruitsa ubiquitin ligase complex, including TCEB1-encoded elongin Cand E3 ubiquitin-protein ligase Rbx1, and leads to proteasomal
FIGURE 2—continued
Natural Killer Cell Responses to Hypoxia
JUNE 17, 2016 • VOLUME 291 • NUMBER 25 JOURNAL OF BIOLOGICAL CHEMISTRY 12967
by guest on August 25, 2019
http://ww
w.jbc.org/
Dow
nloaded from
Hif-1� degradation (30). Despite broad up-regulation of Hif-1�-dependent genes by priming, including glycolytic genes, down-regulation of ARNT, encoding Hif-1�, and up-regulation of RBX1and TCEB1 (RT-PCR validated, Fig. 4) suggest that a negative feed-
back loop was operational at 6 h of priming. Validated synergisticup-regulation of EGLN1 by priming under hypoxia additionallyindicated increased cellular capacity to degrade Hif-1� and rapidrestoration of oxygen sensitivity.
FIGURE 3. Summary of gene expression profiles for selected pathways regulated by hypoxia and IL-15 in NK cells. Microarray data from NK cells, culturedfor 22 h under normoxia (20% O2) or hypoxia (1% O2) and without or with IL-15 (45 ng/ml) during the final 6 h, were subjected to GSEA using KEGG pathways.Gene expression profiles for Hif-1 and glycolytic pathways and the PPP as schematized in Fig. 2 are summarized in a heat map, additionally including glycerol3-phosphate and malate-aspartate shuttle genes. Tiles are arranged by experimental condition and sample order, and genes are hierarchically clustered. Greenindicates minimum and red maximum expression. Genes selected for RT-PCR validation (Fig. 4) are shown with boxes. Pathway assignments are given on theright.
Natural Killer Cell Responses to Hypoxia
12968 JOURNAL OF BIOLOGICAL CHEMISTRY VOLUME 291 • NUMBER 25 • JUNE 17, 2016
by guest on August 25, 2019
http://ww
w.jbc.org/
Dow
nloaded from
The dependence of glycolytic gene transcription on IL-15priming appeared especially accentuated and was validated forPFKFB3 and TPI1 (Figs. 2B, 3, and 4). Bifunctional Pfkfbenzymes control intracellular levels of fructose 2,6-bisphos-phate, a central allosteric activator of 6-phosphofructo-1-ki-nase. Contrary to its negative impact under normoxia, primingstimulated the hypoxia-induced expression of Pfkfb3. Pfkfb3features an exceptionally high kinase/phosphatase activity ratio(31), and its inhibition suppresses T-lymphocytes (32). Pfkfb3 isthus a likely key regulator of glycolysis in primed NK cells also.Tpi1 balances funneling of reducing equivalents into the respi-ratory chain via the glycerone 3-phosphate shuttle and therebybasal mitochondrial function against salvaging this three-car-bon unit for glycolysis. The observed strong stimulation of thepriming-induced TPI1 expression by hypoxia indicates tippingthe scales toward glycolysis. In addition, RT-PCR revealed pos-itive synergistic transcriptional hypoxia/IL-15 interactions forATP-producing Pgk1 and Pkm. These effects and overall co-regulation of the linearly arranged core glycolytic genes byhypoxia and IL-15 priming indicate synergistic reinforcementof glycolysis by both stimuli at the transcriptional level. Partic-ularly, apparent gene inductions of LDH and lactate exporterencoding SLC16A1/3, and last but not least of PDK1, for whichwe also validated a positive hypoxia/IL-15 interaction, are fea-tures of anaerobic glycolysis. Hif-1�-regulated Pdk1 inhibitsmitochondrial pyruvate dehydrogenase (Pdh), which links gly-colysis and the TCA cycle, by reversible phosphorylation on E1.Otherwise, unrestrained Pdh activity in the absence of suffi-cient oxygen as terminal electron acceptor renders cells sensi-tive to apoptosis (33, 34).
Our microarray data do not imply stable alterations in NKcells by short term hypoxia and/or IL-15 priming. E1 and E2 ofthe Pdh complex and TCA cycle and oxidative phosphorylationpathways were transcriptionally up-regulated by IL-15 irre-spective of oxygen supply, suggesting that mitochondrial integ-rity was maintained. Mitochondrial shuttle genes essential tothis end also appeared up-regulated by priming (Fig. 3). Theseobservations suggest transitory adaptation to low oxygen,which is in line with rapid restoration of oxygen sensitivity.
Despite the positive interaction between hypoxia and IL-15priming, there were no clear differences in glycolytic fluxthrough short term hypoxia in both quiescent and primed NKcells (Fig. 5A). This agrees with unchangingly neglectable glu-cose consumption (Fig. 5C) and no consistent differences incellular ATP content under all four conditions tested (Fig. 6B).If any, cellular Ldh activity was slightly increased throughhypoxia (Fig. 6A). In agreement with published results frommurine NK cells primed with IL-15 under normoxia for 4 h (20),the 6-h period of IL-15 exposure under hypoxia used here onlyslightly raised parameters of glycolytic flux in human NK cellsalso (Fig. 5, A and B), compared with the reported very promi-nent enhancements in murine NK cells through IL-2/12 forFIGURE 4. Validation of transcriptional interactions between IL-15 and
hypoxia on the level of key regulatory and metabolic enzyme genes.Results from microarray analysis of human NK cells, cultured under normoxia(20% O2) or hypoxia (1% O2) for 22 h without or with IL-15 (45 ng/ml) duringthe final 6 h, suggested transcriptional interactions between IL-15 andhypoxia in the Hif-1 and glycolytic pathways and the PPP (Figs. 2 and 3). Genesof key regulatory and metabolic enzymes were selected for validation byRT-PCR (TaqMan) in independent NK cell preparations from whole blood ofsix healthy donors. GUSB was used as endogenous control gene. For each
condition, linearized quantities (2�CT) are represented as mean values S.E.(bars). Data are displayed as circles in a muted rainbow color scheme to iden-tify values from same NK cell preparations, i.e. same donors. Expression pro-files are presented in the order of appearance of the selected genes in thepathway maps shown in Fig. 2. *, p � 0.05; ns, not significant.
Natural Killer Cell Responses to Hypoxia
JUNE 17, 2016 • VOLUME 291 • NUMBER 25 JOURNAL OF BIOLOGICAL CHEMISTRY 12969
by guest on August 25, 2019
http://ww
w.jbc.org/
Dow
nloaded from
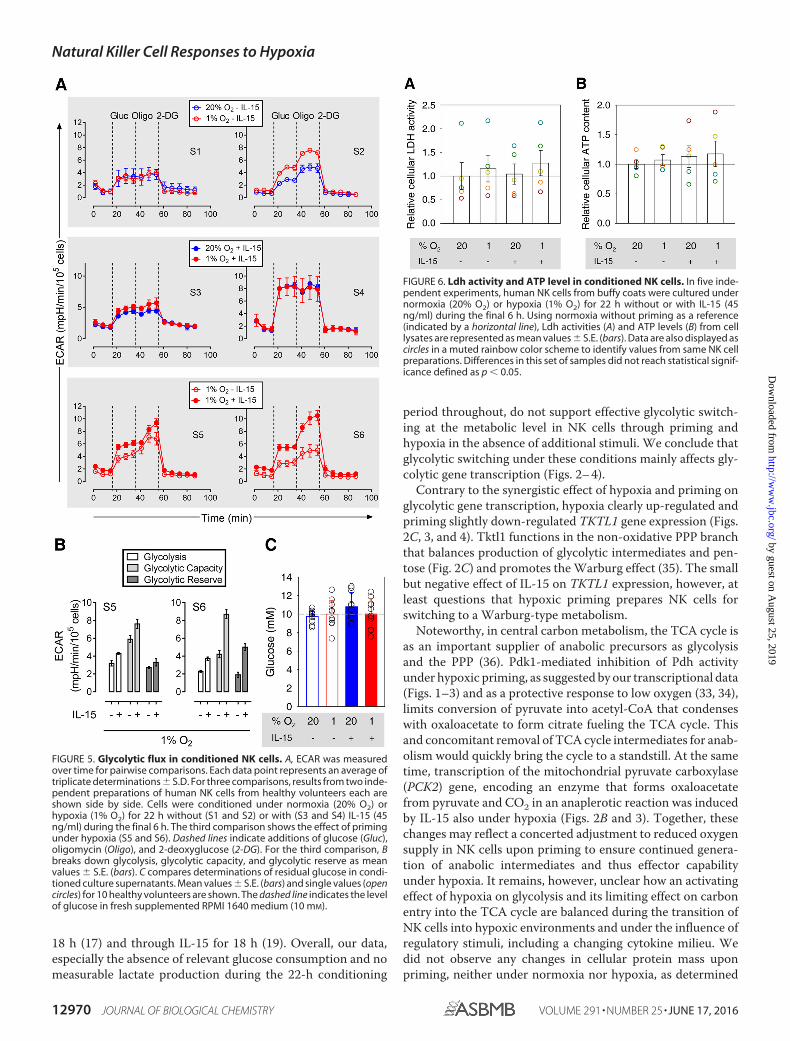
18 h (17) and through IL-15 for 18 h (19). Overall, our data,especially the absence of relevant glucose consumption and nomeasurable lactate production during the 22-h conditioning
period throughout, do not support effective glycolytic switch-ing at the metabolic level in NK cells through priming andhypoxia in the absence of additional stimuli. We conclude thatglycolytic switching under these conditions mainly affects gly-colytic gene transcription (Figs. 2– 4).
Contrary to the synergistic effect of hypoxia and priming onglycolytic gene transcription, hypoxia clearly up-regulated andpriming slightly down-regulated TKTL1 gene expression (Figs.2C, 3, and 4). Tktl1 functions in the non-oxidative PPP branchthat balances production of glycolytic intermediates and pen-tose (Fig. 2C) and promotes the Warburg effect (35). The smallbut negative effect of IL-15 on TKTL1 expression, however, atleast questions that hypoxic priming prepares NK cells forswitching to a Warburg-type metabolism.
Noteworthy, in central carbon metabolism, the TCA cycle isas an important supplier of anabolic precursors as glycolysisand the PPP (36). Pdk1-mediated inhibition of Pdh activityunder hypoxic priming, as suggested by our transcriptional data(Figs. 1–3) and as a protective response to low oxygen (33, 34),limits conversion of pyruvate into acetyl-CoA that condenseswith oxaloacetate to form citrate fueling the TCA cycle. Thisand concomitant removal of TCA cycle intermediates for anab-olism would quickly bring the cycle to a standstill. At the sametime, transcription of the mitochondrial pyruvate carboxylase(PCK2) gene, encoding an enzyme that forms oxaloacetatefrom pyruvate and CO2 in an anaplerotic reaction was inducedby IL-15 also under hypoxia (Figs. 2B and 3). Together, thesechanges may reflect a concerted adjustment to reduced oxygensupply in NK cells upon priming to ensure continued genera-tion of anabolic intermediates and thus effector capabilityunder hypoxia. It remains, however, unclear how an activatingeffect of hypoxia on glycolysis and its limiting effect on carbonentry into the TCA cycle are balanced during the transition ofNK cells into hypoxic environments and under the influence ofregulatory stimuli, including a changing cytokine milieu. Wedid not observe any changes in cellular protein mass uponpriming, neither under normoxia nor hypoxia, as determined
FIGURE 5. Glycolytic flux in conditioned NK cells. A, ECAR was measuredover time for pairwise comparisons. Each data point represents an average oftriplicate determinations S.D. For three comparisons, results from two inde-pendent preparations of human NK cells from healthy volunteers each areshown side by side. Cells were conditioned under normoxia (20% O2) orhypoxia (1% O2) for 22 h without (S1 and S2) or with (S3 and S4) IL-15 (45ng/ml) during the final 6 h. The third comparison shows the effect of primingunder hypoxia (S5 and S6). Dashed lines indicate additions of glucose (Gluc),oligomycin (Oligo), and 2-deoxyglucose (2-DG). For the third comparison, Bbreaks down glycolysis, glycolytic capacity, and glycolytic reserve as meanvalues S.E. (bars). C compares determinations of residual glucose in condi-tioned culture supernatants. Mean values S.E. (bars) and single values (opencircles) for 10 healthy volunteers are shown. The dashed line indicates the levelof glucose in fresh supplemented RPMI 1640 medium (10 mM).
FIGURE 6. Ldh activity and ATP level in conditioned NK cells. In five inde-pendent experiments, human NK cells from buffy coats were cultured undernormoxia (20% O2) or hypoxia (1% O2) for 22 h without or with IL-15 (45ng/ml) during the final 6 h. Using normoxia without priming as a reference(indicated by a horizontal line), Ldh activities (A) and ATP levels (B) from celllysates are represented as mean values S.E. (bars). Data are also displayed ascircles in a muted rainbow color scheme to identify values from same NK cellpreparations. Differences in this set of samples did not reach statistical signif-icance defined as p � 0.05.
Natural Killer Cell Responses to Hypoxia
12970 JOURNAL OF BIOLOGICAL CHEMISTRY VOLUME 291 • NUMBER 25 • JUNE 17, 2016
by guest on August 25, 2019
http://ww
w.jbc.org/
Dow
nloaded from
by Bradford assay (data not shown). We thus expect possiblechanges at the proteome level under these conditions to berather qualitative than quantitative.
In invading myeloid and expanding lymphoid cells, glycolyticswitching, at the transcriptional and functional levels, throughto a Warburg effect, not only reflects functional adaptation butalso instructs cellular fate through improved meeting increasedenergetic and anabolic demands by supply of metabolic precur-sors (36 –38). In macrophages, dendritic cells, granulocytes,and T-lymphocytes, such glycolytic switching relies on mTorsignaling and involves downstream activation of Hif-1� (37,39 – 43). Although glycolytic switching in stimulated NK cells,including IL-15 treatment, also requires mTor signaling, acti-vation of Hif-1� by mTor was not formally investigated in thesecells (17–20). It is possible that mTor activates Hif-1� in NKcells as well and that this underlies the synergistic IL-15/hy-poxia interactions in glycolytic gene transcription describedhere. Also, activation of other transcription factors in additionto Hif-1� may account for the different transcriptional profiles(Fig. 4).
Notably, Hif-1�-mediated mTor signaling in vitro in otheractivated immune cells is functional under normoxia (37,39 – 43), including CD8� T cells (44). We thus probed theimportance of Hif-1� transcriptional activity in IL-15-treatedNK cells for glycolysis under normoxia compared with hypoxiain the presence of CTM, an inhibitor of its transcriptional activ-ity (45), during priming. Glycolysis was consistently inhibitedby CTM (Fig. 7A). Possibly, stabilization of Hif-1� underhypoxia partially counteracted inhibition (S9). We expectedstrongly reduced glycolysis to be much more detrimental to cellviability under hypoxia than normoxia due to the inherentimportance of glycolysis for ATP production at low oxygen.However, slightly higher Alamar Blue dye reduction underhypoxia (Fig. 7B) suggested no reduced viability but favoredelectron transfer to the dye at limited oxygen as a final electronacceptor. In contrast, with cellular ATP as a measure, viabilitydropped in a CTM concentration-dependent manner (Fig. 7C),which was expected for hypoxia but not to the same extent fornormoxia. Nevertheless, flow cytometric apoptosis detectionalso indicated equal reduction of viability through CTM undernormoxia and hypoxia (Fig. 7D). As in macrophages, dendriticcells, granulocytes, and T-lymphocytes (37, 39 – 43), aerobicglycolysis in primed NK cells thus appears to rely on Hif-1�, butthe existence of an mTor/Hif-1� axis in NK cells remains to betested. Our results also underscore that our ability to providedirect mechanistic insight into the link between Hif-1� signal-ing/glycolysis and cellular activities of primed NK cells is seri-ously hindered by the high importance of glycolysis for ATPproduction and cell viability. The following possible limitationto these conclusions must be mentioned. Although transcrip-tional inhibition through CTM has been best documented forHif-1� target genes, its molecular mechanism is through pre-venting interaction of the Hif-1� C-terminal activation domainwith the cysteine histidine-rich domain 1 (CH1) of its co-acti-
FIGURE 7. Chemical inhibition of Hif-1� transcriptional activity duringIL-15 priming of NK cells reduces glycolysis and viability. A, each datapoint represents an average of duplicate ECAR determinations S.D. For twocomparisons, results from two independent preparations of human NK cellsfrom healthy volunteers each are shown side by side. Cells were conditionedunder normoxia (20% O2, S7, S8) or hypoxia (1% O2, S9, S10) for 22 h with IL-15(45 ng/ml) and CTM or DMSO vehicle control during the final 6 h. Dashed linesindicate additions of glucose (Gluc), oligomycin (Oligo), and 2-deoxyglucose(2-DG). B–D show data from four or five independent preparations of NK cellsfrom buffy coats and are displayed as mean values S.E. (bars) and also ascircles in a muted rainbow color scheme to identify values from the samepreparations. Cells were conditioned as in A. B, Alamar Blue was additionallypresent besides IL-15 and CTM or vehicle during the final 6 h of the condition-ing. Alternatively, viability at the end of the conditioning period was evalu-
ated by measuring ATP levels in cell lysates (C) and flow cytometric detectionof annexin V-APC/7-AAD staining (D). B and C, normoxia with vehicle servedas a reference (indicated by a horizontal line).
Natural Killer Cell Responses to Hypoxia
JUNE 17, 2016 • VOLUME 291 • NUMBER 25 JOURNAL OF BIOLOGICAL CHEMISTRY 12971
by guest on August 25, 2019
http://ww
w.jbc.org/
Dow
nloaded from
vator p300 (45). The p300 CH1 domain also interacts with Stat2(45), for which, however, no role has yet been established in NKcells.
Experimental proof of the importance of glucose utilizationand specific portions of central carbon metabolism for anabo-lism versus the use of exogenously supplemented metabolic
FIGURE 8. Chemokine secretion and expression of cellular markers by NK cells under hypoxia and IL-15 priming. A and B, NK cells isolated from whole bloodwere cultured at 20% O2 or 1% O2 for 22 h without or with IL-15 (45 ng/ml) during the final 6 h. Thus conditioned supernatants were screened by multipleximmunoassays for 29 proteins out of which Ccl3/4/5 and Mif were detectable. For supernatants in which no evaluable signal was obtained for a given analyte (Aidentified by open circles), we used lower limits of detection for comparisons (2.96 pg/ml for Ccl3, 2.86 pg/ml for Ccl4, and 11.32 pg/ml for Mif) thus rather underesti-mating increases in fold changes (B). A, bars represent averaged double determinations for 10 different donors. B, bars represent mean fold changes S.E. of donors1–10 for hypoxia versus normoxia (open) and IL-15 versus quiescent (gray) comparisons. The y intercept for no change is indicated by a dotted line. C, for flow cytometricanalysis of intracellular and surface markers, NK cells were prepared from buffy coats in 3 to 5 independent experiments. Parallel normoxic (blue) and hypoxic (red)cultures were primed with IL-15 (45 ng/ml) 16 h after plating (set to 0 h) and processed consecutively at 6-h intervals. *, p � 0.05; **, p � 0.005; ns, not significant.
Natural Killer Cell Responses to Hypoxia
12972 JOURNAL OF BIOLOGICAL CHEMISTRY VOLUME 291 • NUMBER 25 • JUNE 17, 2016
by guest on August 25, 2019
http://ww
w.jbc.org/
Dow
nloaded from
precursors, such as amino acids, for example, will require feed-ing cells with isotope-labeled glucose followed by detection oflabel incorporation into anabolic intermediates. But given thedemonstrated importance of glycolytic switching for immunefunction in other leukocyte populations (36 –38) on the onehand and the presumably negative effect of hypoxia on effectorfunctions in NK cells on the other hand (9 –13), we judged itmore relevant to focus our current study on assessing the directimpact of short term hypoxia on several activities of quiescentand IL-15-primed NK cells, typically performed in low oxygentissue environments.
During invasion of inflammatory sites, NK cells becomeimportant producers of cytokines, including chemokines thatattract further immune cells (46). Therefore, we tested theeffects of hypoxia and IL-15 priming on the release of 29immune factors, including cytokines from NK cells in condi-tioned culture supernatants. Hypoxia promoted priming-in-duced but not resting-state secretion of Ccl3/4/5 (Fig. 8, A andB), chemokines that attract activated T-lymphocytes, mono-cytes, dendritic cells, eosinophils, and more NK cells (47, 48).Hypoxia and/or Hif-1-dependent expression of individualchemokines has previously been demonstrated in nerve tissue(Ccl3) (49, 50), neutrophils and monocytes (CcL4) (51, 52), andsplenocytes (53), endothelial cells (54), adipocytes (55), andbreast cancer cells (Ccl5) (56) of human and/or rodent origin.Requirement for priming, as seen here, may augment Ccl3/4/5release from NK cells selectively in hypoxic inflammatory sites.
We further observed that hypoxia enhanced NK cell migra-tion through reconstituted ECM (Matrigel) (Fig. 9). IL-15 waspreviously shown to promote human NK cell migrationthrough a fibronectin/gelatin matrix only as a positive gradient(chemotaxis) (57). However, a small chemokinetic componentto migration through fibronectin was also seen for NK cellstreated with Ccl3, Ccl4, or Ccl5 (58). We propose that IL-15-dependent migration enhancement in our assay, i.e. withoutgradient but in the presence of IL-15-induced Ccl3/4/5, mayhave partly resulted from increased random cellular motilitythrough autocrine activities of Ccl3/4/5 and/or throughenhanced ECM remodeling activity (59, 60).
Additionally, hypoxia increased secretion of Mif (Fig. 8, Aand B), a chemokine-like mediator of innate immunity also pro-duced by monocytes, B- and T-lymphocytes, and endocrine,endothelial, and epithelial cells (61). Hypoxia is known to sup-port Mif secretion by endothelial cells (62) and hepatoma andglioma cell lines (63, 64). Notably, ovarian cancer cell-producedMif interferes with NK cell cytotoxicity through down-regula-tion of activating NK receptor NKG2D, which likely contrib-utes to Mif-dependent immune tolerance (65). Recently,hypoxia has been shown to also down-regulate NKG2D on NKcells (11, 13). We propose that this was mediated through auto-crine activity of Mif released from NK cells under hypoxia.
Last, but not least, we tested the immediate effect of hypoxicNK cell conditioning on their cell killing activity without inter-ference by hypoxia-activated tumor cell intrinsic resistancemechanisms. As target cells, we used K562 cells that are highlysusceptible to perforin/granzyme-induced apoptosis, the maincell death pathway employed by NK cells (66 – 68). Hypoxic
FIGURE 9. Impact of hypoxia and IL-15 priming on NK cell migrationthrough Matrigel. 5 � 105 NK cells isolated from buffy coats were loadedinto Matrigel invasion chambers and cultured for 48 h at 20% O2 or 1% O2 andwithout or with IL-15 (50 ng/ml) in both lower and upper chambers. Numbersof migrated cells were determined by Alamar Blue reduction and calibrationagainst parallel cultures. Bars represent mean counts S.E. of seven indepen-dent experiments. Data are displayed as circles in a muted rainbow colorscheme to identify values from same NK cell preparations, i.e. same donors.Cells from one donor (brown circle) appeared transmigrated quantitativelyunder hypoxia in the presence of IL-15. *, p � 0.05; ns, not significant.
FIGURE 10. Cytolytic activity of quiescent and primed NK cells condi-tioned under hypoxia versus normoxia. NK cells isolated from buffy coatswere conditioned by preculture at 20% O2 (blue) or 1% O2 (red) for 22 h with-out (open) or with IL-15 (45 ng/ml, filled) present during the final 6 h. Percent-age of specific cell lysis during a subsequent 4-h co-incubation of effector (E)NK cells with K562 target cells (T) at different E/T ratios under normoxic stan-dard culture conditions in triplicate was determined using Ldh release assayapplying the following equation to measured released Ldh activities: 100 �(experimental � (E) spontaneous � T spontaneous)/(T maximum � T spon-taneous). Bars represent mean values S.E. from six independent experi-ments. *, p � 0.05; ns, not significant.
Natural Killer Cell Responses to Hypoxia
JUNE 17, 2016 • VOLUME 291 • NUMBER 25 JOURNAL OF BIOLOGICAL CHEMISTRY 12973
by guest on August 25, 2019
http://ww
w.jbc.org/
Dow
nloaded from
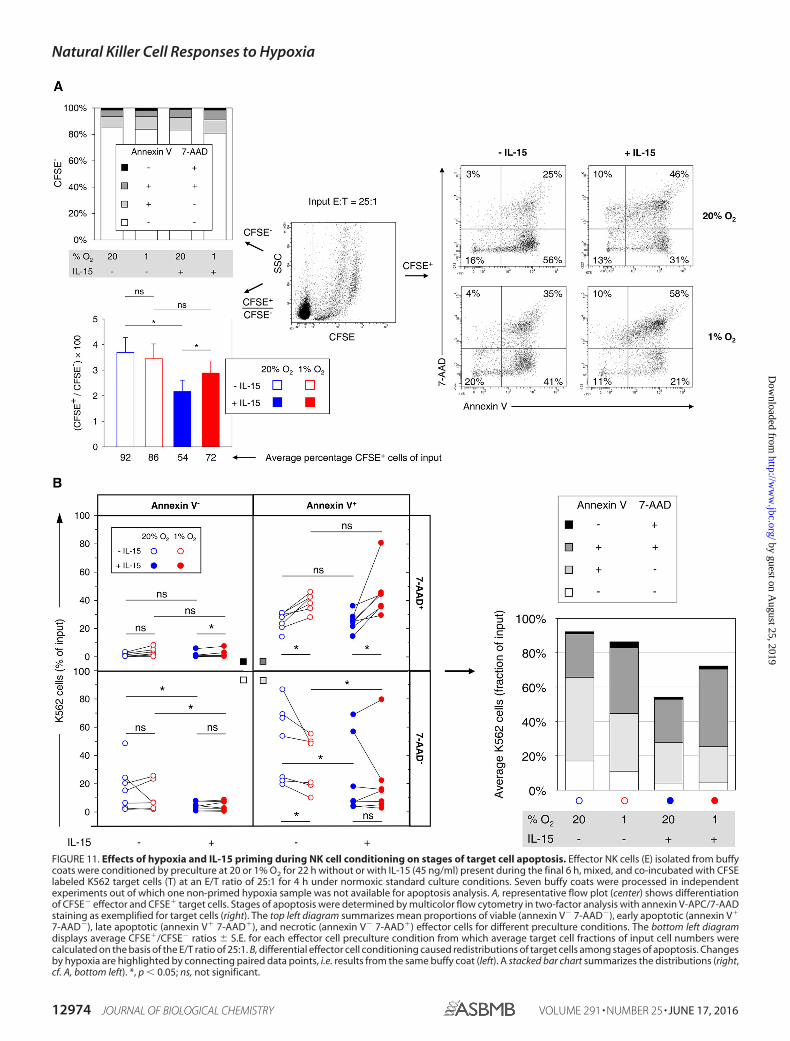
FIGURE 11. Effects of hypoxia and IL-15 priming during NK cell conditioning on stages of target cell apoptosis. Effector NK cells (E) isolated from buffycoats were conditioned by preculture at 20 or 1% O2 for 22 h without or with IL-15 (45 ng/ml) present during the final 6 h, mixed, and co-incubated with CFSElabeled K562 target cells (T) at an E/T ratio of 25:1 for 4 h under normoxic standard culture conditions. Seven buffy coats were processed in independentexperiments out of which one non-primed hypoxia sample was not available for apoptosis analysis. A, representative flow plot (center) shows differentiationof CFSE� effector and CFSE� target cells. Stages of apoptosis were determined by multicolor flow cytometry in two-factor analysis with annexin V-APC/7-AADstaining as exemplified for target cells (right). The top left diagram summarizes mean proportions of viable (annexin V� 7-AAD�), early apoptotic (annexin V�
7-AAD�), late apoptotic (annexin V� 7-AAD�), and necrotic (annexin V� 7-AAD�) effector cells for different preculture conditions. The bottom left diagramdisplays average CFSE�/CFSE� ratios S.E. for each effector cell preculture condition from which average target cell fractions of input cell numbers werecalculated on the basis of the E/T ratio of 25:1. B, differential effector cell conditioning caused redistributions of target cells among stages of apoptosis. Changesby hypoxia are highlighted by connecting paired data points, i.e. results from the same buffy coat (left). A stacked bar chart summarizes the distributions (right,cf. A, bottom left). *, p � 0.05; ns, not significant.
Natural Killer Cell Responses to Hypoxia
12974 JOURNAL OF BIOLOGICAL CHEMISTRY VOLUME 291 • NUMBER 25 • JUNE 17, 2016
by guest on August 25, 2019
http://ww
w.jbc.org/
Dow
nloaded from
preculture slightly reduced target cell lysis only by primed NKcells (Figs. 10 and 11A, bottom left). However, the amounts ofthe remaining viable, apoptotic, and necrotic target cells aremore informative yardsticks for cell killing activity than totalcell lysis. In fact, hypoxic NK cell preculture did not signifi-cantly affect the numbers of remaining viable target cells in ourcell killing assay (Fig. 11B), indicating unchanged apoptosistriggering, but notably it consistently increased the amounts oftarget cells in late apoptosis. It is known that interactionsbetween dying and phagocytic cells determine whether apopto-sis is tolerogenic or immunogenic, whatever is more beneficialto the host. Specifically, an adaptive immune response is elic-ited by coordinated exposure of damage-associated molecularpatterns by late apoptotic and necrotic cells (69 –71). It is notknown, however, whether NK cells differentially control thisprocess. Our observation of target cell shifting to late apoptosisthrough hypoxic NK cell preculture leads us to speculate thatoxygen availability during NK cell conditioning can modulatetarget cell death immunogenicity. This would not withstandhypoxia-mediated immunosuppression through tumor andstroma-derived factors (9, 10). In fact, respiratory hyperoxialeads to NK cell-dependent regression of MCA205 pulmonarytumors in mice (72).
In conclusion, we found that culturing NK cells underhypoxia compared with ambient air (normoxia) and IL-15priming synergistically augmented glycolytic gene expressionwithout major changes in glycolytic flux and glucose consump-tion. Hif-1� appeared to be equally important for glycolysis andATP production under normoxia and hypoxia. Hypoxia syner-gistically supported priming-induced release of Ccl3/4/5.Unexpectedly, hypoxia alone was able to promote secretion ofMif, migration through ECM, and progression to late apoptosisin target cells. The absence of major changes in glycolytic activ-ity argue against an important anabolic effect through priming.ECM/cell interactions during migration and stress moleculeson target cells, however, may provide independent signals forfunctional glycolytic switching that supported functionalchanges through improved cellular anabolism. The futureinvestigation of central carbon metabolism under hypoxia iswarranted to better understand how cellular anabolism is bal-anced at low oxygen and regulates NK cell priming and furtheractivation. This may lead to strategies for preparing NK cells foradoptive transfer therapy of cancer that overcome current lim-itations posed by poor tumor homing and by tumor immuneevasion (23, 24).
Author Contributions—S. Y. V., D. K., and H. A. L. conceived thestudy and designed experiments. S. Y. V., D. K., and J. S. performedexperimental work. S. Y. V., D. K., J. S., C. S., and H. A. L. analyzedthe data. S. Y. V., D. K., M. T., and H. A. L. interpreted the data.H. A. L. drafted the manuscript. M. T. edited the manuscript. Allauthors approved the final version of the manuscript.
Acknowledgment—We thank Maria Muciek (Affymetrix Core Facil-ity, Medical Research Center Mannheim) for technical support.
References1. Vivier, E., Raulet, D. H., Moretta, A., Caligiuri, M. A., Zitvogel, L., Lanier,
L. L., Yokoyama, W. M., and Ugolini, S. (2011) Innate or adaptive immu-nity? The example of natural killer cells. Science 331, 44 – 49
2. Smyth, M. J., Cretney, E., Kelly, J. M., Westwood, J. A., Street, S. E., Yagita,H., Takeda, K., van Dommelen, S. L., Degli-Esposti, M. A., and Hayakawa,Y. (2005) Activation of NK cell cytotoxicity. Mol. Immunol. 42, 501–510
3. Bosco, M. C., Puppo, M., Blengio, F., Fraone, T., Cappello, P., Giovarelli,M., and Varesio, L. (2008) Monocytes and dendritic cells in a hypoxicenvironment: Spotlights on chemotaxis and migration. Immunobiology213, 733–749
4. Ohta, A., Diwanji, R., Kini, R., Subramanian, M., Ohta, A., and Sitkovsky,M. (2011) In vivo T cell activation in lymphoid tissues is inhibited in theoxygen-poor microenvironment. Front. Immunol. 2, 27
5. Spencer, J. A., Ferraro, F., Roussakis, E., Klein, A., Wu, J., Runnels, J. M.,Zaher, W., Mortensen, L. J., Alt, C., Turcotte, R., Yusuf, R., Cote, D.,Vinogradov, S. A., Scadden, D. T., and Lin, C. P. (2014) Direct measure-ment of local oxygen concentration in the bone marrow of live animals.Nature 508, 269 –273
6. Carreau, A., El Hafny-Rahbi, B., Matejuk, A., Grillon, C., and Kieda, C.(2011) Why is the partial oxygen pressure of human tissues a crucial pa-rameter? Small molecules and hypoxia. J. Cell. Mol. Med. 15, 1239 –1253
7. Sitkovsky, M., and Lukashev, D. (2005) Regulation of immune cells bylocal-tissue oxygen tension: HIF1� and adenosine receptors. Nat. Rev.Immunol. 5, 712–721
8. Eltzschig, H. K., and Carmeliet, P. (2011) Hypoxia and inflammation.N. Engl. J. Med. 364, 656 – 665
9. Casazza, A., Di Conza, G., Wenes, M., Finisguerra, V., Deschoemaeker, S.,and Mazzone, M. (2014) Tumor stroma: a complexity dictated by thehypoxic tumor microenvironment. Oncogene 33, 1743–1754
10. Baginska, J., Viry, E., Paggetti, J., Medves, S., Berchem, G., Moussay, E., andJanji, B. (2013) The critical role of the tumor microenvironment in shapingnatural killer cell-mediated anti-tumor immunity. Front. Immunol. 4, 490
11. Balsamo, M., Manzini, C., Pietra, G., Raggi, F., Blengio, F., Mingari, M. C.,Varesio, L., Moretta, L., Bosco, M. C., and Vitale, M. (2013) Hypoxiadownregulates the expression of activating receptors involved in NK-cell-mediated target cell killing without affecting ADCC. Eur. J. Immunol. 43,2756 –2764
12. Fink, T., Ebbesen, P., Koppelhus, U., and Zachar, V. (2003) Natural killercell-mediated basal and interferon-enhanced cytotoxicity against livercancer cells is significantly impaired under in vivo oxygen conditions.Scand. J. Immunol. 58, 607– 612
13. Sarkar, S., Germeraad, W. T., Rouschop, K. M., Steeghs, E. M., van Gelder,M., Bos, G. M., and Wieten, L. (2013) Hypoxia induced impairment of NKcell cytotoxicity against multiple myeloma can be overcome by IL-2 acti-vation of the NK cells. PLoS ONE 8, e64835
14. Long, E. O., Kim, H. S., Liu, D., Peterson, M. E., and Rajagopalan, S. (2013)Controlling natural killer cell responses: integration of signals for activa-tion and inhibition. Annu. Rev. Immunol. 31, 227–258
15. Mishra, A., Sullivan, L., and Caligiuri, M. A. (2014) Molecular pathways:interleukin-15 signaling in health and in cancer. Clin. Cancer Res. 20,2044 –2050
16. Van den Bergh, J. M., Van Tendeloo, V. F., and Smits, E. L. (2015) Inter-leukin-15: new kid on the block for antitumor combination therapy. Cy-tokine Growth Factor Rev. 26, 15–24
17. Donnelly, R. P., Loftus, R. M., Keating, S. E., Liou, K. T., Biron, C. A.,Gardiner, C. M., and Finlay, D. K. (2014) mTORC1-dependent metabolicreprogramming is a prerequisite for NK cell effector function. J. Immunol.193, 4477– 4484
18. Nandagopal, N., Ali, A. K., Komal, A. K., and Lee, S. H. (2014) The criticalrole of IL-15-PI3K-mTOR pathway in natural killer cell effector functions.Front. Immunol. 5, 187
19. Marcais, A., Cherfils-Vicini, J., Viant, C., Degouve, S., Viel, S., Fenis, A.,Rabilloud, J., Mayol, K., Tavares, A., Bienvenu, J., Gangloff, Y. G., Gilson,E., Vivier, E., and Walzer, T. (2014) The metabolic checkpoint kinasemTOR is essential for IL-15 signaling during the development and activa-tion of NK cells. Nat. Immunol. 15, 749 –757
Natural Killer Cell Responses to Hypoxia
JUNE 17, 2016 • VOLUME 291 • NUMBER 25 JOURNAL OF BIOLOGICAL CHEMISTRY 12975
by guest on August 25, 2019
http://ww
w.jbc.org/
Dow
nloaded from
20. Keppel, M. P., Saucier, N., Mah, A. Y., Vogel, T. P., and Cooper, M. A.(2015) Activation-specific metabolic requirements for NK Cell IFN-� pro-duction. J. Immunol. 194, 1954 –1962
21. Knorr, D. A., Bachanova, V., Verneris, M. R., and Miller, J. S. (2014) Clin-ical utility of natural killer cells in cancer therapy and transplantation.Semin. Immunol. 26, 161–172
22. Yoon, S. R., Kim, T. D., and Choi, I. (2015) Understanding of molecularmechanisms in natural killer cell therapy. Exp. Mol. Med. 47, e141
23. Childs, R. W., and Carlsten, M. (2015) Therapeutic approaches to enhancenatural killer cell cytotoxicity against cancer: the force awakens. Nat. Rev.Drug Discov. 14, 487– 498
24. Domogala, A., Madrigal, J. A., and Saudemont, A. (2015) Natural killer cellimmunotherapy: from bench to bedside. Front. Immunol. 6, 264
25. Kim, T. D., Lee, S. U., Yun, S., Sun, H. N., Lee, S. H., Kim, J. W., Kim, H. M.,Park, S. K., Lee, C. W., Yoon, S. R., Greenberg, P. D., and Choi, I. (2011)Human microRNA-27a* targets Prf1 and GzmB expression to regulateNK-cell cytotoxicity. Blood 118, 5476 –5486
26. Dai, M., Wang, P., Boyd, A. D., Kostov, G., Athey, B., Jones, E. G., Bunney,W. E., Myers, R. M., Speed, T. P., Akil, H., Watson, S. J., and Meng, F.(2005) Evolving gene/transcript definitions significantly alter the interpre-tation of GeneChip data. Nucleic Acids Res. 33, e175
27. Subramanian, A., Tamayo, P., Mootha, V. K., Mukherjee, S., Ebert, B. L.,Gillette, M. A., Paulovich, A., Pomeroy, S. L., Golub, T. R., Lander, E. S.,and Mesirov, J. P. (2005) Gene set enrichment analysis: a knowledge-basedapproach for interpreting genome-wide expression profiles. Proc. Natl.Acad. Sci. U.S.A. 102, 15545–15550
28. Edsparr, K., Johansson, B. R., Goldfarb, R. H., Basse, P. H., Nannmark, U.,Speetjens, F. M., Kuppen, P. J., Lennernas, B., and Albertsson, P. (2009)Human NK cell lines migrate differentially in vitro related to matrix inter-action and MMP expression. Immunol. Cell Biol. 87, 489 – 495
29. Bentz, S., Cee, A., Endlicher, E., Wojtal, K. A., Naami, A., Pesch, T., Lang,S., Schubert, P., Fried, M., Weber, A., Coy, J. F., Goelder, S., Knuchel, R.,Hausmann, M., and Rogler, G. (2013) Hypoxia induces the expression oftransketolase-like 1 in human colorectal cancer. Digestion 88, 182–192
30. Semenza, G. L. (2009) Regulation of oxygen homeostasis by hypoxia-in-ducible factor 1. Physiology 24, 97–106
31. Yalcin, A., Telang, S., Clem, B., and Chesney, J. (2009) Regulation of glu-cose metabolism by 6-phosphofructo-2-kinase/fructose-2,6-bisphospha-tases in cancer. Exp. Mol. Pathol. 86, 174 –179
32. Telang, S., Clem, B. F., Klarer, A. C., Clem, A. L., Trent, J. O., Bucala, R.,and Chesney, J. (2012) Small molecule inhibition of 6-phosphofructo-2-kinase suppresses T cell activation. J. Transl. Med. 10, 95
33. Kim, J. W., Tchernyshyov, I., Semenza, G. L., and Dang, C. V. (2006)HIF-1-mediated expression of pyruvate dehydrogenase kinase: a meta-bolic switch required for cellular adaptation to hypoxia. Cell Metab. 3,177–185
34. Papandreou, I., Cairns, R. A., Fontana, L., Lim, A. L., and Denko, N. C.(2006) HIF-1 mediates adaptation to hypoxia by actively downregulatingmitochondrial oxygen consumption. Cell Metab. 3, 187–197
35. Grimm, M., Schmitt, S., Teriete, P., Biegner, T., Stenzl, A., Hennenlotter,J., Muhs, H. J., Munz, A., Nadtotschi, T., Konig, K., Sanger, J., Feyen, O.,Hofmann, H., Reinert, S., and Coy, J. F. (2013) A biomarker based detec-tion and characterization of carcinomas exploiting two fundamental bio-physical mechanisms in mammalian cells. BMC Cancer 13, 569
36. Buck, M. D., O’Sullivan, D., and Pearce, E. L. (2015) T cell metabolismdrives immunity. J. Exp. Med. 212, 1345–1360
37. Palazon, A., Goldrath, A. W., Nizet, V., and Johnson, R. S. (2014) HIFtranscription factors, inflammation, and immunity. Immunity 41,518 –528
38. Pearce, E. L., and Pearce, E. J. (2013) Metabolic pathways in immune cellactivation and quiescence. Immunity 38, 633– 643
39. Ganeshan, K., and Chawla, A. (2014) Metabolic regulation of immuneresponses. Annu. Rev. Immunol. 32, 609 – 634
40. Ghesquiere, B., Wong, B. W., Kuchnio, A., and Carmeliet, P. (2014) Me-tabolism of stromal and immune cells in health and disease. Nature 511,167–176
41. Roiniotis, J., Dinh, H., Masendycz, P., Turner, A., Elsegood, C. L., Scholz,G. M., and Hamilton, J. A. (2009) Hypoxia prolongs monocyte/macro-
phage survival and enhanced glycolysis is associated with their maturationunder aerobic conditions. J. Immunol. 182, 7974 –7981
42. Horng, T. (2015) mTOR trains heightened macrophage responses. TrendsImmunol. 36, 1–2
43. Pearce, E. J., and Everts, B. (2015) Dendritic cell metabolism. Nat. Rev.Immunol. 15, 18 –29
44. Finlay, D. K., Rosenzweig, E., Sinclair, L. V., Feijoo-Carnero, C., Hukel-mann, J. L., Rolf, J., Panteleyev, A. A., Okkenhaug, K., and Cantrell, D. A.(2012) PDK1 regulation of mTOR and hypoxia-inducible factor 1 inte-grate metabolism and migration of CD8� T cells. J. Exp. Med. 209,2441–2453
45. Kung, A. L., Zabludoff, S. D., France, D. S., Freedman, S. J., Tanner, E. A.,Vieira, A., Cornell-Kennon, S., Lee, J., Wang, B., Wang, J., Memmert, K.,Naegeli, H. U., Petersen, F., Eck, M. J., Bair, K. W., et al. (2004) Smallmolecule blockade of transcriptional coactivation of the hypoxia-induci-ble factor pathway. Cancer Cell. 6, 33– 43
46. Maghazachi, A. A. (2010) Role of chemokines in the biology of naturalkiller cells. Curr. Top. Microbiol. Immunol. 341, 37–58
47. Maurer, M., and von Stebut, E. (2004) Macrophage inflammatory pro-tein-1. Int. J. Biochem. Cell Biol. 36, 1882–1886
48. Grayson, M. H., and Holtzman, M. J. (2006) Chemokine complexity: thecase for CCL5. Am. J. Respir. Cell Mol. Biol. 35, 143–146
49. Cowell, R. M., Xu, H., Galasso, J. M., and Silverstein, F. S. (2002) Hypoxic-ischemic injury induces macrophage inflammatory protein-1� expressionin immature rat brain. Stroke 33, 795– 801
50. Yoshida, S., Yoshida, A., Ishibashi, T., Elner, S. G., and Elner, V. M. (2003)Role of MCP-1 and MIP-1� in retinal neovascularization during postisch-emic inflammation in a mouse model of retinal neovascularization. J. Leu-kocyte Biol. 73, 137–144
51. Gonsalves, C., and Kalra, V. K. (2010) Endothelin-1-induced macrophageinflammatory protein-1� expression in monocytic cells involves hypoxia-inducible factor-1� and AP-1 and is negatively regulated by microRNA-195. J. Immunol. 185, 6253– 6264
52. Walmsley, S. R., Print, C., Farahi, N., Peyssonnaux, C., Johnson, R. S.,Cramer, T., Sobolewski, A., Condliffe, A. M., Cowburn, A. S., Johnson, N.,and Chilvers, E. R. (2005) Hypoxia-induced neutrophil survival is medi-ated by HIF-1�-dependent NF-�B activity. J. Exp. Med. 201, 105–115
53. Arnaud, C., Beguin, P. C., Lantuejoul, S., Pepin, J. L., Guillermet, C., Pelli,G., Burger, F., Buatois, V., Ribuot, C., Baguet, J. P., Mach, F., Levy, P., andDematteis, M. (2011) The inflammatory preatherosclerotic remodelinginduced by intermittent hypoxia is attenuated by RANTES/CCL5 inhibi-tion. Am. J. Respir. Crit. Care Med. 184, 724 –731
54. Yeligar, S. M., Machida, K., Tsukamoto, H., and Kalra, V. K. (2009) Ethanolaugments RANTES/CCL5 expression in rat liver sinusoidal endothelialcells and human endothelial cells via activation of NF-�B, HIF-1�, andAP-1. J. Immunol. 183, 5964 –5976
55. Skurk, T., Mack, I., Kempf, K., Kolb, H., Hauner, H., and Herder, C. (2009)Expression and secretion of RANTES (CCL5) in human adipocytes inresponse to immunological stimuli and hypoxia. Horm. Metab. Res. 41,183–189
56. Lin, S., Wan, S., Sun, L., Hu, J., Fang, D., Zhao, R., Yuan, S., and Zhang, L.(2012) Chemokine C-C motif receptor 5 and C-C motif ligand 5 promotecancer cell migration under hypoxia. Cancer Sci. 103, 904 –912
57. Allavena, P., Giardina, G., Bianchi, G., and Mantovani, A. (1997) IL-15 ischemotactic for natural killer cells and stimulates their adhesion to vascu-lar endothelium. J. Leukocyte Biol. 61, 729 –735
58. Taub, D. D., Sayers, T. J., Carter, C. R., and Ortaldo, J. R. (1995) � and �
chemokines induce NK cell migration and enhance NK-mediated cytoly-sis. J. Immunol. 155, 3877–3888
59. Edsparr, K., Basse, P. H., Goldfarb, R. H., and Albertsson, P. (2011) Matrixmetalloproteinases in cytotoxic lymphocytes impact on tumour infiltra-tion and immunomodulation. Cancer Microenviron. 4, 351–360
60. Prakash, M. D., Munoz, M. A., Jain, R., Tong, P. L., Koskinen, A., Regner,M., Kleifeld, O., Ho, B., Olson, M., Turner, S. J., Mrass, P., Weninger, W.,and Bird, P. I. (2014) Granzyme B promotes cytotoxic lymphocyte trans-migration via basement membrane remodeling. Immunity 41, 960 –972
61. Grieb, G., Merk, M., Bernhagen, J., and Bucala, R. (2010) Macrophagemigration inhibitory factor (MIF): a promising biomarker. Drug News Per-
Natural Killer Cell Responses to Hypoxia
12976 JOURNAL OF BIOLOGICAL CHEMISTRY VOLUME 291 • NUMBER 25 • JUNE 17, 2016
by guest on August 25, 2019
http://ww
w.jbc.org/
Dow
nloaded from
spect. 23, 257–26462. Simons, D., Grieb, G., Hristov, M., Pallua, N., Weber, C., Bernhagen, J., and
Steffens, G. (2011) Hypoxia-induced endothelial secretion of macrophagemigration inhibitory factor and role in endothelial progenitor cell recruit-ment. J. Cell. Mol. Med. 15, 668 – 678
63. Hira, E., Ono, T., Dhar, D. K., El-Assal, O. N., Hishikawa, Y., Yamanoi, A.,and Nagasue, N. (2005) Overexpression of macrophage migration inhibi-tory factor induces angiogenesis and deteriorates prognosis after radicalresection for hepatocellular carcinoma. Cancer 103, 588 –598
64. Bacher, M., Schrader, J., Thompson, N., Kuschela, K., Gemsa, D., Waeber,G., and Schlegel, J. (2003) Up-regulation of macrophage migration inhib-itory factor gene and protein expression in glial tumor cells during hypoxicand hypoglycemic stress indicates a critical role for angiogenesis in glio-blastoma multiforme. Am. J. Pathol. 162, 11–17
65. Krockenberger, M., Dombrowski, Y., Weidler, C., Ossadnik, M., Honig,A., Hausler, S., Voigt, H., Becker, J. C., Leng, L., Steinle, A., Weller, M.,Bucala, R., Dietl, J., and Wischhusen, J. (2008) Macrophage migrationinhibitory factor contributes to the immune escape of ovarian cancer bydown-regulating NKG2D. J. Immunol. 180, 7338 –7348
66. Berthou, C., Bourge, J. F., Zhang, Y., Soulie, A., Geromin, D., Denizot, Y.,Sigaux, F., and Sasportes, M. (2000) Interferon-�-induced membranePAF-receptor expression confers tumor cell susceptibility to NK perforin-dependent lysis. Blood 95, 2329 –2336
67. Kurschus, F. C., Bruno, R., Fellows, E., Falk, C. S., and Jenne, D. E. (2005)Membrane receptors are not required to deliver granzyme B during killercell attack. Blood 105, 2049 –2058
68. Martinvalet, D., Zhu, P., and Lieberman, J. (2005) Granzyme A inducescaspase-independent mitochondrial damage, a required first step for apo-ptosis. Immunity 22, 355–370
69. Peter, C., Wesselborg, S., Herrmann, M., and Lauber, K. (2010) Dangerousattraction: phagocyte recruitment and danger signals of apoptotic andnecrotic cells. Apoptosis 15, 1007–1028
70. Kepp, O., Galluzzi, L., Martins, I., Schlemmer, F., Adjemian, S., Michaud,M., Sukkurwala, A. Q., Menger, L., Zitvogel, L., and Kroemer, G. (2011)Molecular determinants of immunogenic cell death elicited by anticancerchemotherapy. Cancer Metastasis Rev. 30, 61– 69
71. Bezu, L., Gomes-de-Silva, L. C., Dewitte, H., Breckpot, K., Fucikova, J.,Spisek, R., Galluzzi, L., Kepp, O., and Kroemer, G. (2015) Combinatorialstrategies for the induction of immunogenic cell death. Front. Immunol. 6,187
72. Hatfield, S. M., Kjaergaard, J., Lukashev, D., Schreiber, T. H., Belikoff, B.,Abbott, R., Sethumadhavan, S., Philbrook, P., Ko, K., Cannici, R., Thayer,M., Rodig, S., Kutok, J. L., Jackson, E. K., Karger, B., et al. (2015) Immuno-logical mechanisms of the antitumor effects of supplemental oxygenation.Sci. Transl. Med. 7, 277ra30
Natural Killer Cell Responses to Hypoxia
JUNE 17, 2016 • VOLUME 291 • NUMBER 25 JOURNAL OF BIOLOGICAL CHEMISTRY 12977
by guest on August 25, 2019
http://ww
w.jbc.org/
Dow
nloaded from
Holger A. LindnerSonia Y. Velásquez, Doreen Killian, Jutta Schulte, Carsten Sticht, Manfred Thiel and
Gene Transcription and Supports Human Natural Killer Cell ActivitiesShort Term Hypoxia Synergizes with Interleukin 15 Priming in Driving Glycolytic
doi: 10.1074/jbc.M116.721753 originally published online April 28, 20162016, 291:12960-12977.J. Biol. Chem.
10.1074/jbc.M116.721753Access the most updated version of this article at doi:
Alerts:
When a correction for this article is posted•
When this article is cited•
to choose from all of JBC's e-mail alertsClick here
http://www.jbc.org/content/291/25/12960.full.html#ref-list-1
This article cites 72 references, 19 of which can be accessed free at
by guest on August 25, 2019
http://ww
w.jbc.org/
Dow
nloaded from


![A Bioimaging Pipeline to Show Membrane Trafficking ...monensin (SigmaAldrich, catalog number: M5273), salinomycin (- Sigma-Aldrich, catalog number: S4526)] 5. Dimethyl sulfoxide (DMSO)](https://img.pdfslide.us/doc/110x75/606951f14493194cb1496d3e/a-bioimaging-pipeline-to-show-membrane-trafficking-monensin-sigmaaldrich-catalog.jpg)