Embed Size (px)
Citation preview
Carl von Ossietzky
Universität Oldenburg
Bachelorstudiengang Umweltwissenschaften (B.Sc.)
BACHELORARBEIT
Short-term dynamics of dissolved organic matter and bacterial
communities in the open North Sea off Helgoland Island
vorgelegt von: Irina Köster
Betreuender Gutachter: Prof. Dr. Thorsten Dittmar
Zweiter Gutachter: Dr. Gunnar Gerdts
Oldenburg, den 13.12.2013
1
INHALTSVERZEICHNIS
I. VORWORT 2
II. MANUSKRIPT 3
1 Abstract 4
2 Introduction 5
3 Materials and Methods 7
4 Results 13
5 Discussion 22
6 Conclusion and Outlook 25
7 References 26
III. DANKSAGUNG 31
2
I. VORWORT
Diese Arbeit wurde am Institut für Chemie und Biologie des Meeres der Carl von Ossietzky
Universität in der Max-Plack-Forschungsgruppe Marine Geochemie angefertigt. Der Umfang
dieses Projekts der Bachelorarbeit wurde durch die Kombination mit dem Kontaktpraktikum,
das während des Bachelorstudiums der Umweltwissenschaften erbracht werden muss,
erweitert. Das Praktikum wurde an der Biologischen Anstalt Helgoland des Alfred-Wegener-
Instituts Helmholtz-Zentrum für Polar- und Meeresforschung in der Arbeitsgruppe Mikrobielle
Ökologie absolviert.
Die Probenahme und ersten Schritte der Probenaufbereitung erfolgten im Sommer 2012 im
Rahmen des Kontaktpraktikums auf der Nordseeinsel Helgoland. Dort wurden außerdem die
molekularbiologischen Untersuchungen und die statistische Auswertung durchgeführt. Die
geochemischen Untersuchungen und das Verfassen der Arbeit erfolgten in Oldenburg.
In Absprache mit meinen Gutachtern Prof. Dr. Thorsten Dittmar und Dr. Gunnar Gerdts wurde
diese Arbeit in Form eines Manuskripts einer wissenschaftlichen Publikation angefertigt.
3
II. MANUSKRIPT
Short-term dynamics of dissolved organic matter and bacterial
communities in the open North Sea off Helgoland Island
IRINA KÖSTER1, 2*, GUNNAR GERDTS2 , JUDITH LUCAS2, ANTJE WICHELS2, THORSTEN DITTMAR1
AND JUTTA NIGGEMANN1
1Max Planck Research Group for Marine Geochemistry, Institute for Chemistry and Biology of
the Marine Environment (ICBM), University of Oldenburg, Carl-von-Ossietzky Straße 9-11,
26129 Oldenburg, Germany
2 Microbial Ecology Group, Alfred Wegener Institute for Polar and Marine Research,
Kurpromenade 201, 27498 Helgoland, Germany
*Corresponding Author
Key words: dissolved organic matter, bacterial communities, short-term, FT-ICR-MS, ARISA
4
1 Abstract
Dissolved organic matter (DOM) in the ocean is one of the largest active carbon pools on
earth, similar in size to atmospheric CO2 or all land plant biomass. Due to its richness in
energy and nutrients it is fundamental for microbial life and for marine food webs. The
microbial loop is an essential compartment in the global carbon cycle and is important for the
transformation and recycling of organic matter and nutrients in the oceans. Microbial
communities shape the molecular composition of DOM and vice versa. Earlier long-term
studies have shown that seasonal dynamics in DOM composition and microbial communities
exists. The aim of this study was to explore and characterize variations in composition of
bacterial communities and DOM over short periods of time, ranging from hours to days. We
hypothesize that variations in DOM composition are directly related to variations in the
bacterial community and/ or environmental conditions. To test these hypotheses, water
samples were taken daily over a time period of 20 days and hourly (over 24 hours) in the
open North Sea off Helgoland Island. Sea water was analyzed for environmental variables,
molecular DOM composition and the bacterial community structure. DOM was isolated from
seawater by solid phase extraction and analyzed via ultrahigh resolution mass spectrometry
(FT-ICR-MS, Fourier-Transform Ion Cyclotron Resonance Mass Spectrometry). To investigate
bacterial community structure, Automated Ribosomal Intergenic Spacer Analysis (ARISA)
fingerprinting was used. The current study did not reveal a direct relation between a bacterial
community structure changes and variation in the composition of DOM, neither within daily
sampling nor the 24 h time series. However both, bacterial community and DOM composition
undergo a characteristic shift during the daily sampling, mainly driven by salinity. The 24 h
sampling during this time captured much of the variation in salinity and the microbial
community, accordingly. High variations of salinity during the sampling period indicate the
presence of changes in different water masses that carry distinct molecular and microbial
signatures. For the first time, these changes have been documented in such high temporal
and analytical resolution.
5
2 Introduction
Dissolved organic matter (DOM) in the oceans represents one of the largest active carbon
pools on earth (700 Gt), containing as much carbon as the Earth´s atmosphere or carbon
stored in all land plant biomass (Hedges, 1992).
Hansell (2013) divided the marine DOM into two major classes with distinct reactivity and
different functions in the carbon cycle: labile DOM and recalcitrant DOM. Labile DOM has a
fleeting existence of minutes to days (Fuhrmann and Ferguson, 1986; Keil and Kirchmann,
1999), as it is rapidly consumed by heterotrophic bacteria. Hence, the freshly produced labile
DOM is crucial for the bacterial community and can vary over short timescales. Recalcitrant
DOM has turnover times of months to millennia (Bauer et al., 1992; Williams and Druffel,
1987) because it is resistant to rapid microbial degradation and therefore accumulates in the
ocean. It serves as a reservoir of carbon until it is mineralized or removed by other mostly
abiotic processes (e.g. Stubbins et al., 2012).
The microbial loop has been recognized as an essential part in the global carbon cycle (Azam,
1998). Most marine DOM originates from direct extracellular release during growth of
phytoplankton, release and excretion during predation by grazing organisms, release via viral
and bacterial cell lysis, solubilization of particles and bacterial transformation (Hansell and
Carlson, 2002). The major process for the removal of marine DOM is consumption and
remineralization by heterotrophic bacteria (Pomeroy, 1974). DOM that is assimilated into
bacterial biomass is channeled via the bacteria to protozoa and to higher organisms (Azam,
1998). Thereby, the microbial loop transfers energy and nutrients to higher trophic levels and
provides an important base for microbial life and marine food webs (Hansell et al., 2013).
In the frame of the ‘Microbial Interactions in Marine Systems’ project (MIMAS, http://mimas-
project.de) the diversity and function of marine bacterioplankton in a world of global climate
change is examined. In this context, a study on the island of Helgoland in the German Bight
monitored DOM and microbial community composition over several years. This long term
study revealed that changes in molecular composition of DOM and bacterial community exist
(Niggemann et al., unpublished). A central aim of this study is to explore and characterize
variations in composition of bacterial communities and DOM over much shorter periods of
time, ranging from hours to days. The sampling station Helgoland Roads is well suited for this
approach, as seasonal and long-term data for environmental variables (e.g. Raabe and
Wiltshire, 2008; Wiltshire et al., 2008; Wiltshire et al., 2009) and microbial parameters are
available (Gerdts et al., 2004; Sapp et al., 2007, Teeling et al., 2012).
So far, there are few time series studies available that focused on temporal dynamics of
bacterial communities and DOM. Sintes et al. (2010) investigated a seasonal shift of DOC
6
concentrations and bacterial activity over an annual cycle. Even changes of bacterial
community over one day could be shown in the experiment of McCarren et al. (2010) while
adding high-molecular-weight DOM. In a study of Chauhan et al. (2009) tidal dynamics of DOC
concentration and bacterial community was observed. But to our knowledge, there is a lack
of studies combining bacterial community fingerprinting and molecular DOM composition in
a time series, especially of short-terms observations. Short-term dynamics over days or hours
may show just small changes and to investigate such small changes in molecular composition
of DOM and bacterial community structure, ultrahigh resolution methods are necessary.
DOM has a highly complex composition consisting of millions of different molecules, most of
them in very low concentration (pico- to femtomolar; Dittmar and Paeng, 2009). This makes
the DOM composition a big challenge in analytical chemistry (Hedges et al., 2000) and
knowledge about its molecular characterization is still scarce. Ultrahigh resolution Fourier
transform ion cyclotron resonance mass spectrometry (FT-ICR-MS) is the only method so far
that enables the molecular characterization of DOM composition. Coupled with electrospray
ionization (ESI), intact polar molecules can be analyzed and the high mass accuracy allows
determining the exact molecular formulae and elemental composition (Stenson et al., 2003).
This technique has been successfully applied to marine DOM samples (e.g. Dittmar and
Paeng, 2009; Flerus et al., 2012; Koch et al., 2008).
The detection of small but nonetheless relevant changes in the bacterial community structure
is another analytical challenge. Automated Ribosomal Intergenic Spacer Analysis (ARISA)
fingerprinting enables high resolution investigation of bacterial community structure. It is
based on the length polymorphism of the intergenic spacer region. This species-specific
region is located between the 16S and 23S genes on the ribosomal operon and it has been
shown that it is appropriate for bacterial community fingerprinting (Barry et al., 1991). The
resolution of ARISA was found to exceed other common fingerprinting methods like
Denaturing Gradient Gel Electrophoresis (DGGE) or Terminal Restriction Fragment Length
Polymorphism (T-RFLP; Danovaro et al., 2006; Okubo and Sugiyama, 2009) and has been
successfully applied for samples from the marine environment (e.g. Krause et al., 2012;
Needham et al., 2013; Sperling et al., 2013)
This study investigates short-term dynamics in composition of DOM and bacterial community
over timescales of 20 days and 24 hours. We hypothesize that the bacterial community
shapes the DOM composition and vice versa. Additionally, the study investigates the effect of
environmental variables on the bacterial community and on the molecular composition of
DOM.
7
3 Materials and Methods
3.1 Sampling procedure and sample preparation
Sampling took place at the Ferry Box site at the time series station Helgoland (54°18’3120N,
7°88’9750E) on Helgoland Island, which is located in the German Bight in the North Sea.
Water samples were collected daily from August 6 to August 26, 2012, always at 13:00 h and
hourly over 24 hours on August 13-14, 2012. Surface water was collected with a carefully
rinsed bucket and transported in 1-liter glass bottles.
For dissolved organic carbon (DOC) and total dissolved nitrogen (TDN) analysis, 20 ml of
water was filtered through glass fiber filters (GMF and GFF with nominal pore size of 2.0 µm
and 0.7 µm, respectively; Whatman, United Kingdom). A syringe (20 ml NORM-JECT®, latex
free, Henke Sass Wolf, Germany) and polypropylene filter holder with a diameter of 47 mm
(PP-47, Advantec®, Toyo Roshi Kaisha, Ltd., Japan) were used. The collected DOC and TDN
samples were acidified to pH 2 (HCl 32% p.a., Roth, Germany) and stored at 4°C in the dark.
For solid phase extraction, two liters of seawater were collected by vacuum filtration through
GMF and GFF filters using bottle top filters holder (reusable, Ø 47 mm, Nalgene®, USA) and
transferred into 2 l Nalgene® bottles. All filtrates were adjusted to pH 2 with HCl (32% p.a.,
Roth, Germany) and stored at 4°C in the dark.
500 ml of seawater were vacuum filtered through 0.22 µm polycarbonate filters (GTTP,
Ø 47 mm, Merck Millipore, USA) for DNA extraction. Filters were transferred to autoclaved
Eppendorf caps (2 ml) and stored at -20°C.
All glassware and glass fiber filters used during sampling and sample treatment was pre-
combusted for 4 hours at 400°C. All other materials were cleaned with acidified ultrapure
water and rinsed with sample water before use.
For verification of possible contamination, procedural blanks were performed by repeating
the sample preparation with ultrapure water.
3.2 Extraction of DOM
To study the molecular composition of DOM via FT-ICR-MS analysis, a highly concentrated
salt-free organic sample is required. Therefore, the water samples were solid phase extracted
following the method published by Dittmar et al. (2008) as this procedure has been shown to
be the most efficient methods for extracting DOM for mass spectrometric analysis. For each
sample a 1 g Varian Bond Elut PPL cartridge (Styrene divinyl benzene polymer sorbent;
Agilent Technologies, USA) was used. These PPL cartridges have a pore size of 150 Å and
retain a wide spectrum of highly polar to non-polar compounds (Dittmar et al., 2008) but
8
colloidal material and small ionic compounds might be selectively lost during the procedure.
Before usage, the cartridges were rinsed with one cartridge volume of methanol (ULC/MS
grade, Biosolve, Netherland) and refilled with methanol for conditioning overnight.
Afterwards, the cartridges were rinsed with two cartridge volumes of ultrapure water, two
cartridge volumes of methanol and two cartridge volumes of ultrapure water at pH 2. For
extraction the filtered and acidified seawater (2 l) was gravity passed through each PPL
cartridge. Subsequently, remaining salt was removed with two cartridge volumes of pH 2
ultrapure water. After drying with inert pure argon gas, DOM was eluted with 6 ml methanol
(ULC/MS grade, Biosolve, Netherland) into 8 ml amber vials.
The extract volume was determined by weight. 100 µl of the methanol extracts were
evaporated overnight and re-dissolved in 10 ml ultrapure water at pH 2 for DOC analysis. The
extraction efficiency was calculated using the following equation:
(1) [ ]
3.3 DOC and TDN quantification
Dissolved organic carbon (DOC) and total dissolved nitrogen (TDN) analyses of water samples
and extracts were performed with a Shimadzu TOC-VCPH analyzer equipped with a TNM-1
add-on and an ASI-V autosampler using the high-temperature catalytic oxidation (HTCO)
method. By means of a platinum catalyst the sample was combusted at 720°C. The resulting
CO2 was measured quantitatively using a NDIR detector (non-dispersive infrared detector).
According to Stubbins and Dittmar (2012) a calibration covering the expected concentrations
range was applied. Thus the detection limit was 0.6-14.8 µm for DOC and 0.6-11.9 µm for
TDN (Stubbins and Dittmar, 2012).The Deep Sea Reference Standard (DSR; Batch 13, Lot# 05-
13, University of Miami) was used to determine the precision and accuracy of the measured
concentrations in each run. Every sample was measured in duplicates.
3.4 Ultrahigh resolution DOM characterization
All samples were analyzed with a 15 Tesla Solarix® Fourier transform ion cyclotron resonance
mass spectrometer (FT-ICR-MS; Bruker Daltonik GmbH, Germany) to obtain information
about the molecular composition of the DOM. For the FT-ICR-MS analysis, the methanol
extracts were mixed with ultrapure water in a ratio of 1:1 and were diluted to a DOC
concentration of 20 ppm. Electrospray ionization (ESI, Apollo II ion source; Bruker Daltonik
GmbH, Germany) in negative ion mode was used to ionize the samples softly and keep the
molecular ions intact (Dittmar and Koch, 2006; Koch et al., 2005). Samples were infused at
120 µl h-1, capillary voltage was 4000 V, and an ion accumulation in the hexapole of 0.25 s
9
prior to transfer into the ICR cell was applied. A total of 500 scans were accumulated per run
and mass spectra were evaluated in the range from m/z 150 to 2000 Da. The instrument was
externally calibrated with arginine clusters and each mass spectrum was internally calibrated
with a list of known molecular formulae mass peaks (Hawaii_DOM_20101029 (neg)). Exact
masses, peak intensities and resolution of each sample were exported using the software
DataAnalysis 4.0 SP 3 (Bruker Daltonik GmbH, Germany). Detected masses were matched
over all samples and formulae were assigned to the detected masses using the following
criteria: O ≥ 1; N ≤ 4; S ≤ 2; P ≤ 1; mass error<0.5 ppm. Detected masses were kept for
analysis if the signal to noise ratio exceeded 4 and when they were detected in more than
two samples. Masses that were present in less than 20% of the samples were allowed if the
S/N ratio was >20. Additionally, formulas were deleted that contained following
combinations: NSP, N2S, N3S, N4S, N2P, N3P, N4P, NS2, N2S2, N3S2, N4S2, PS2. 16 remaining
double assignments were removed. After assignment, intensities were normalized to the sum
of peak intensities of all masses with a S/N ratio >5. Original intensities were replaced by
ratios of measured intensity divided by the peak sum and multiplied by 10000. Masses which
are listed as known contaminations including their homologous series were eliminated and
13C peaks were removed.
For identifying various types of organic compounds, certain formulae were visualized
according to their H/C and O/C ratios in van Krevelen diagrams. The abundance of aromatic
and condensed molecules was assessed by the double bond equivalents (DBE, equation 2) as
a measure for the degree of unsaturation (Koch and Dittmar, 2006).
(2)
Based on its molecular formula the aromaticity of each assigned compound described by
applying the modified aromaticity index (AImod, equation 3), assessing the presence and
extent of aromatic structures (Koch and Dittmar, 2006).
(3)
Average of number of assigned formulae and intensity weighted averages of m/z of assigned
formulae, AImod, DBE, the number of the atoms C, H, O, and the heteroatoms N, S, P and the
molar ratios H/C and O/C were calculated.
3.5 Ferry Box data
Environmental data were obtained as part of the Helgoland Roads time series (Wiltshire et
al., 2008). These data were measured with a Ferry Box installed on Helgoland (54°18’3120N,
7°88’9750E; Wiltshire, 2013) and are accessible via the open database PANGEA 2004
10
(http://www.pangaea.de). The data set used in this study was kindly provided by Karen H.
Wiltshire (Biological Institute Helgoland; Alfred Wegener Institute, Helmholtz Centre for Polar
and Marine Research).
3.6 DNA extraction, agarose gel electrophoresis and DNA quantification
The DNA extraction was performed as described in Sapp et al. (2007). Lysozyme (1 mg ml-1)
and sodium dodecyl sulfate (1%) were used for cell lysis. Genomic DNA was extracted with
phenol-chloroform-isoamyl alcohol (25:24:1) and precipitated with isopropanol. The DNA
extracts were eluted in 30 µl autoclaved ultrapure water and stored at -20°C until further
processing.
Validation of extracted DNA was done by agarose gel electrophoresis, which was performed
in a Tris(hydroxymethyl)-aminomethane (TRIS) acetate buffer containing 2 M TRIS, 1 M acetic
acid, and 50 mM Ethylenediaminetetraacetic acid (EDTA; 0.5 M SL). Extracted DNA was
diluted with autoclaved ultrapure water (1:9) and stoppmix (0.25% bromocresol purple, 50%
glycerin (97%), 0.05 TRIS, pH 7.9) was added. Gels contained 0.8% agarose and
electrophoreses were performed at 80 V and 2.00 A for 40 min. Finally, agarose gels were
stained with GelRed (GelRed Nucleic Acid Stain 3x in water, Biotium, USA) for 30 min and
photographed with a UV Transilluminator (ChemiDOCTM XRS Firma, Biorad, USA).
The success of Polymerase chain reaction (PCR) was also verified with agarose gel
electrophoresis. First, amplified DNA was mixed with autoclaved ultrapure water in a ratio of
1:2. The diluted PCR products were mixed with the same volume ratio of stoppmix and were
applied as described previously, except that gels contained 1.4% agarose.
DNA concentration and purity were determined by photometry using an Infinite M200 (Tecan
Austria GmbH, Austria). DNA concentration was measured in duplicates.
3.7 Polymerase Chain Reaction
The intergenic spacer region in the rRNA operon was amplified in an Eppendorf MasterCycler
(Eppendorf, Germany) using the forward primer L-D-Bact-132-a-A-18 (5’-
CCGGGTTTCCCCATTCGG-3’) and reverse primer S-D-Bact-1522-b-S-20 (5’-
TGCGGCTGGATCCCCTCCTT-3’), the latter labeled with an infrared dye (Dy682; Ranjard et al.,
2000). PCRs were performed in volumes of 25 µl containing about 2 ng template DNA
(volume depends on DNA concentration). 2.5 µl Taq Buffer (10 x), 5 µl TaqMaster PCR
Enhancer (5 x), 0.7 µl of each primer (20 µM), 0.75 µl deoxyribonucleotide triphosphates
(dNTPs; 2.5 mM each) and 0.25 U Taq DNA polymerase (all reagents by 5 Prime, Germany).
The amplification protocol was as follows: preliminary denaturation at 95°C for 3 min; 30
cycles of denaturation at 95°C for 1 min; 1 min annealing at 50°C and 1 min elongation at
11
68°C; an extension step at 68°C for 5 min and final cooling to 4°C until abortion of the run.
Positive and negative controls were run as well.
3.8 Automated Ribosomal Intergenic Spacer Analysis (ARISA)
Depending on agarose gel band intensities, original or diluted PCR products were mixed with
an equal volume of loading buffer. Together with the size standard IRDye® 700 with 50 bp to
1500 bp (Li-Cor, Germany), the PCR products were denatured at 95°C in a MasterCycler
(Eppendorf, Germany) and subsequently cooled down on ice for 10 min. The PCR products
were separated in a 5.5% polyacrylamide gel prepared following the manufacturer’s protocol
(LI-COR Biosciences, USA). The acrylamide (ready to use matrix by Li-Cor Biosciences)
polymerized for 2 h after the addition of tetramethylethylendiamine (TEMED) and
ammonium persulfate (APS). At least every ninth pocket of the comb was loaded with 0.5 µl
of standard. ARISA was performed at 1500 V for 14 h on a LI-COR 4300 DNA Analyzer (LI-COR
Bioscience, USA). A pre-run of 15 min at 45°C was carried out to precondition the gel and
sequencer prior to loading the samples.
ARISA fingerprints were edited by BioNumerics Version 5.1 (Applied Maths NV, Belgium). The
image was normalized according to the reference size standard and auto assignment was
performed. Bands between 262 bp and 1500 bp length were analyzed. Binning to band
classes was performed according to Kovacs et al. (2010).
3.9 Statistical analysis
For multivariate statistical analyses the software package PRIMER v.6 and the add-on
PERMANOVA+ (both PRIMER-E, United Kingdom) were used. The analyses of molecular
composition were performed on Bray-Curtis matrices, generated from square root
transformed mass spectrometric data of each sample. The Jaccard index was applied to
calculate the resemblance matrix for the bacterial community. Environmental variables (DOC
and TDN concentrations, water level, water temperature, salinity, dissolved O2 and CO2
concentration, turbidity, pH, SiO2, PO4, NO2, NO3 and chlorophyll a) were log transformed
prior to the analyses. For principal coordinates analysis (PCO) the environmental variables
based on Euclidean distance were used. PCO analyses were performed to investigate inter-
point dissimilarities of the samples referring to bacterial community, molecular composition
of DOM, and environmental parameters discretely. The relationship between the molecular
composition or the bacterial community and the environmental variables was investigated by
distance-based linear models (DISTLM). The DISTLM model was built using stepwise selection,
adjusted R², and applying 999 permutations at a significance level of p<0.05. The results were
shown as marginal and sequential test. The marginal test revealed how much each variable
12
explains when taken alone, ignoring all other variables. Following the results of this test a
sequential test was performed which examines whether the addition of that particular
variable contributes significantly to the explained variation (Anderson et al., 2008). To
visualize the results distance-based redundancy analysis (dbRDA) was used.
The relationship between molecular composition of DOM and bacterial community, as
indicated by the respective Spearman rho-values was investigated with the RELATE
subroutine. 999 permutations were applied at a significance level of p<0.01.
To test significant differences of two selected groups of samples regarding their DOM
composition, bacterial community composition or environmental variables, permutational
multivariate analysis of variance (PERMANOVA) was applied according to Anderson (2001).
The PERMANOVA subroutine was performed with fixed factors, 999 permutations, and a
significance level of p<0.001.
Univariate correlations (Pearson) between environmental parameters and the molecular
DOM composition were calculated with Statistica 11 (StatSoft, USA) at a significance level of
p<0.05.
13
4 Results
4.1 Oceanographic setting during the sampling campaign
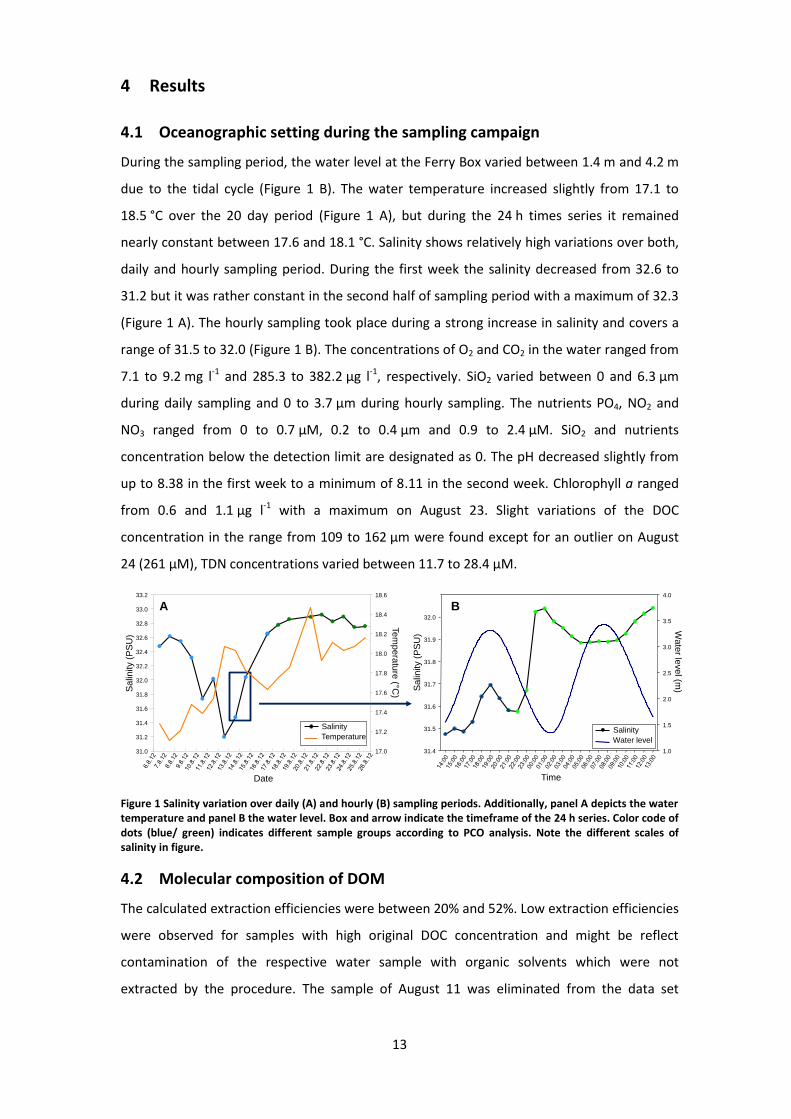
During the sampling period, the water level at the Ferry Box varied between 1.4 m and 4.2 m
due to the tidal cycle (Figure 1 B). The water temperature increased slightly from 17.1 to
18.5 °C over the 20 day period (Figure 1 A), but during the 24 h times series it remained
nearly constant between 17.6 and 18.1 °C. Salinity shows relatively high variations over both,
daily and hourly sampling period. During the first week the salinity decreased from 32.6 to
31.2 but it was rather constant in the second half of sampling period with a maximum of 32.3
(Figure 1 A). The hourly sampling took place during a strong increase in salinity and covers a
range of 31.5 to 32.0 (Figure 1 B). The concentrations of O2 and CO2 in the water ranged from
7.1 to 9.2 mg l-1 and 285.3 to 382.2 µg l-1, respectively. SiO2 varied between 0 and 6.3 µm
during daily sampling and 0 to 3.7 µm during hourly sampling. The nutrients PO4, NO2 and
NO3 ranged from 0 to 0.7 µM, 0.2 to 0.4 µm and 0.9 to 2.4 µM. SiO2 and nutrients
concentration below the detection limit are designated as 0. The pH decreased slightly from
up to 8.38 in the first week to a minimum of 8.11 in the second week. Chlorophyll a ranged
from 0.6 and 1.1 µg l-1 with a maximum on August 23. Slight variations of the DOC
concentration in the range from 109 to 162 µm were found except for an outlier on August
24 (261 µM), TDN concentrations varied between 11.7 to 28.4 µM.
Figure 1 Salinity variation over daily (A) and hourly (B) sampling periods. Additionally, panel A depicts the water temperature and panel B the water level. Box and arrow indicate the timeframe of the 24 h series. Color code of dots (blue/ green) indicates different sample groups according to PCO analysis. Note the different scales of salinity in figure.
4.2 Molecular composition of DOM
The calculated extraction efficiencies were between 20% and 52%. Low extraction efficiencies
were observed for samples with high original DOC concentration and might be reflect
contamination of the respective water sample with organic solvents which were not
extracted by the procedure. The sample of August 11 was eliminated from the data set
Time
Sa
linity (
PS
U)
31.4
31.5
31.6
31.7
31.8
31.9
32.0
Wa
ter le
ve
l (m)
1.0
1.5
2.0
2.5
3.0
3.5
4.0
Salinity
Water level
A B
Date
Sa
linity (
PS
U)
31.0
31.2
31.4
31.6
31.8
32.0
32.2
32.4
32.6
32.8
33.0
33.2
Te
mp
era
ture
( C)
17.0
17.2
17.4
17.6
17.8
18.0
18.2
18.4
18.6
Salinity
Temperature
14
because of low extraction efficiency and high DOC and TDN concentration, which indicate
contaminations.
To characterize the molecular composition of DOM, ultrahigh resolution mass spectrometry
via FT-ICR-MS was applied. After removal of uncertain masses, a total of 4039 molecular
formulae were assigned, ranging between 3662 and 3947 molecular formulae found per
sample (average of all samples: 3877, Table 1). The identified peaks covered a mass range
from 159 to 809 Da with weighted average masses between 363.6 and 385.4 Da (average of
all samples: 374.9, Table 1).
The indices and values in Table 1 summarize information on the general characteristics of
molecular structure of the DOM samples. From the low standard deviations, we infer that the
samples were quite similar with respect to the molecular DOM composition.
Table 1 General molecular information on DOM composition and bulk of elemental composition based on FT-ICR-MS analysis summarizing all samples (n=42). Averages and standard deviation are given. All averages are weighted according to normalized peak intensity.
General Elemental composition
Number of assigned formulae 3877 (±54) Average C 17.72 (±0.19)
Average m/z of assigned formulae 374.9 (±4.4) Average H 21.99 (±0.23)
Average O 8.32 (±0.14)
Average N 0.35 (±0.01)
Average S 0.10 (±0.02)
Molecular Indices Average P 0.00 (±0.00)
Average AImod 0.27 (±0.01) Average H/C 1.24 (±0.01)
Average DBE 7.90 (±0.12) Average O/C 0.47 (±0.00)
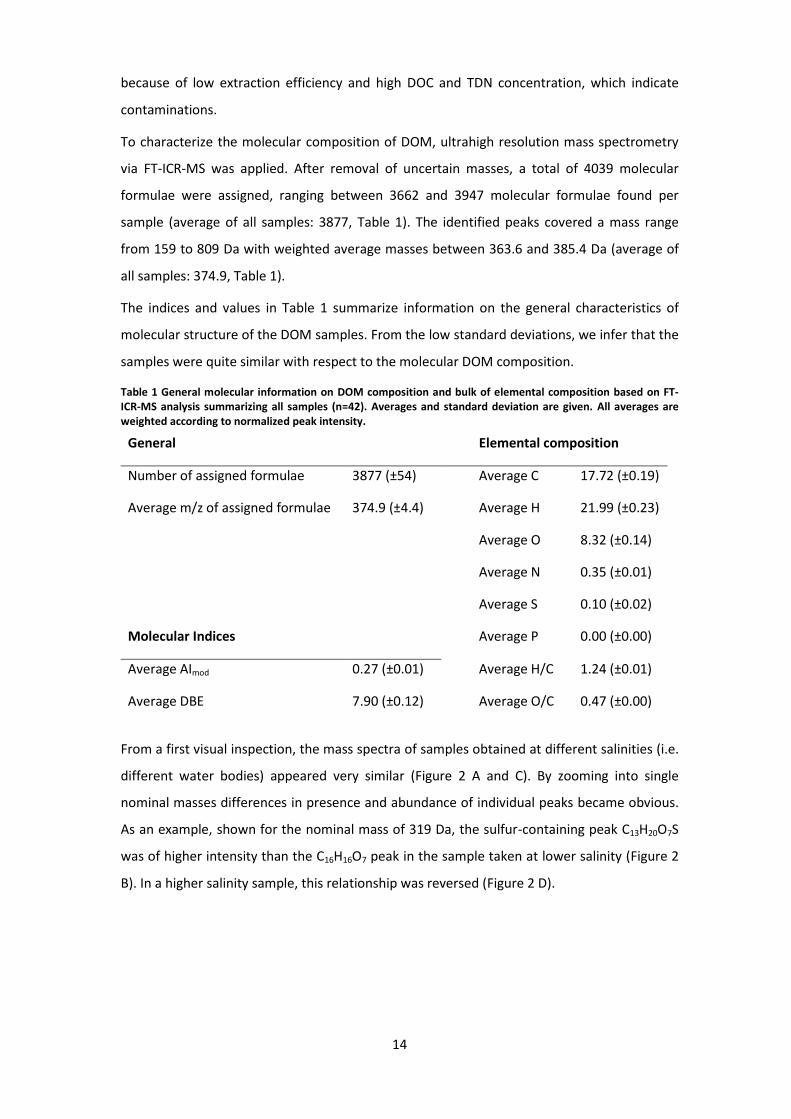
From a first visual inspection, the mass spectra of samples obtained at different salinities (i.e.
different water bodies) appeared very similar (Figure 2 A and C). By zooming into single
nominal masses differences in presence and abundance of individual peaks became obvious.
As an example, shown for the nominal mass of 319 Da, the sulfur-containing peak C13H20O7S
was of higher intensity than the C16H16O7 peak in the sample taken at lower salinity (Figure 2
B). In a higher salinity sample, this relationship was reversed (Figure 2 D).
15
Figure 2 Examples of FT-ICR mass spectra of a sample taken at lower salinity (31.5 PSU; August 13, 2012; A and B) and a sample taken at higher salinity (32.7 PSU; August 24, 2012; C and D). Panel A and C show a mass range from 150 to 650 Da and panel B and D depict an expanded section of the respective mass spectrum at 319 Da with identified molecular formulae. The highlighted area in grey shows different relative intensities of molecules.
4.3 Linking microbial community, DOM composition and environmental
variability
4.3.1 Environmental variables, bacterial community and DOM composition identify two
characteristic regimes
To investigate inter-point dissimilarities between the samples according to environmental
variables, bacterial community and DOM composition, PCO were applied.
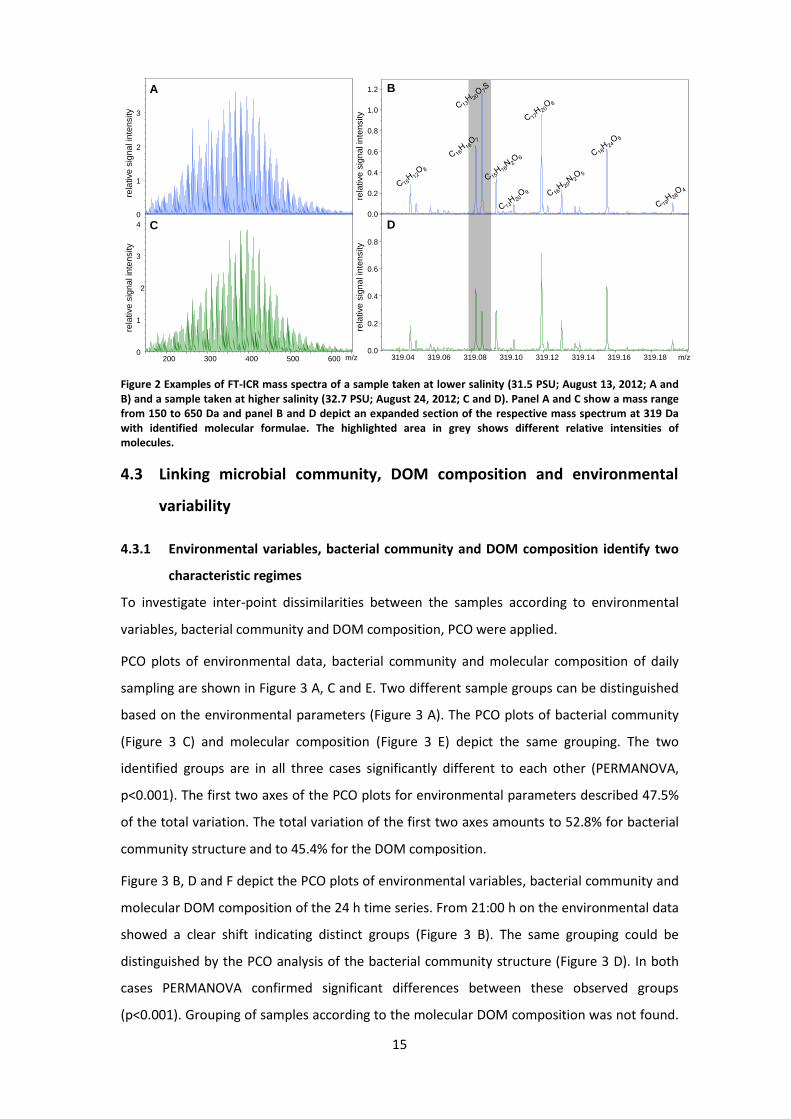
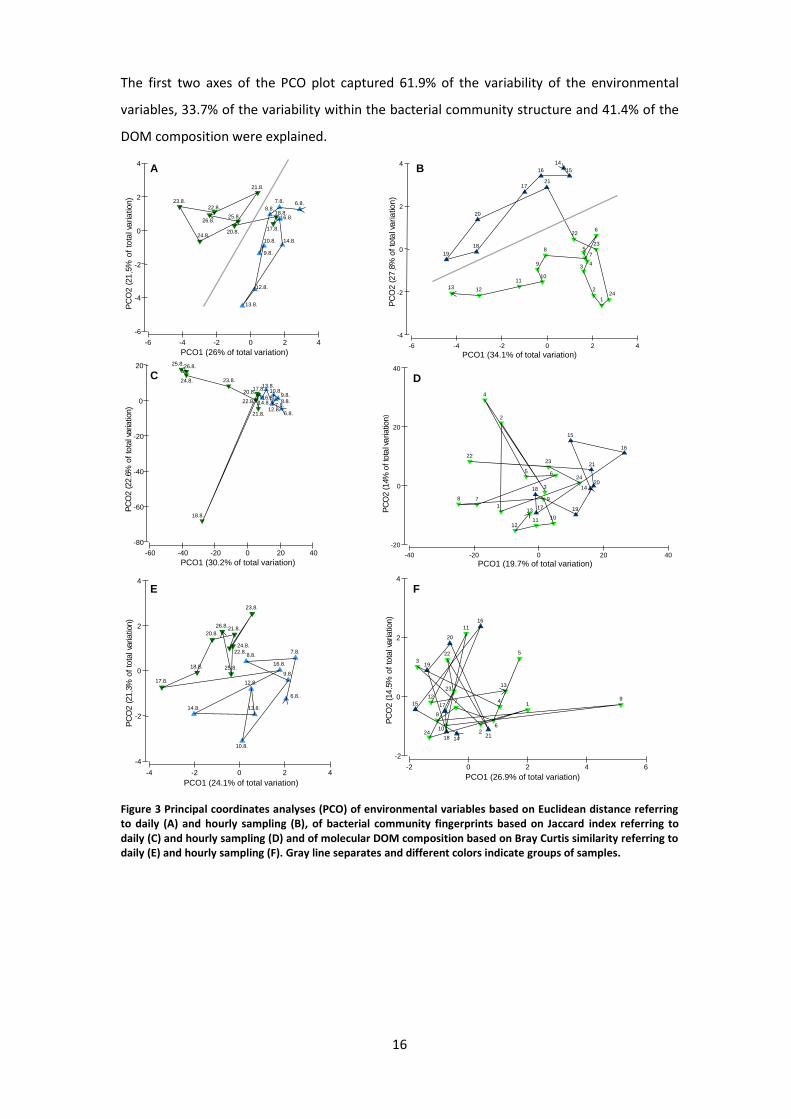
PCO plots of environmental data, bacterial community and molecular composition of daily
sampling are shown in Figure 3 A, C and E. Two different sample groups can be distinguished
based on the environmental parameters (Figure 3 A). The PCO plots of bacterial community
(Figure 3 C) and molecular composition (Figure 3 E) depict the same grouping. The two
identified groups are in all three cases significantly different to each other (PERMANOVA,
p<0.001). The first two axes of the PCO plots for environmental parameters described 47.5%
of the total variation. The total variation of the first two axes amounts to 52.8% for bacterial
community structure and to 45.4% for the DOM composition.
Figure 3 B, D and F depict the PCO plots of environmental variables, bacterial community and
molecular DOM composition of the 24 h time series. From 21:00 h on the environmental data
showed a clear shift indicating distinct groups (Figure 3 B). The same grouping could be
distinguished by the PCO analysis of the bacterial community structure (Figure 3 D). In both
cases PERMANOVA confirmed significant differences between these observed groups
(p<0.001). Grouping of samples according to the molecular DOM composition was not found.
0
1
2
3
rela
tive
sig
na
lin
ten
sity
0
1
2
3
4
200 300 400 500 600 m/z
rela
tive
sig
na
lin
ten
sity
A
C0.0
0.2
0.4
0.6
0.8
1.0
1.2
0.0
0.2
0.4
0.6
0.8
319.04 319.06 319.08 319.10 319.12 319.14 319.16 319.18 m/zre
lative
sig
na
lin
ten
sity
rela
tive
sig
na
lin
ten
sity
D
B
16
The first two axes of the PCO plot captured 61.9% of the variability of the environmental
variables, 33.7% of the variability within the bacterial community structure and 41.4% of the
DOM composition were explained.
Figure 3 Principal coordinates analyses (PCO) of environmental variables based on Euclidean distance referring to daily (A) and hourly sampling (B), of bacterial community fingerprints based on Jaccard index referring to daily (C) and hourly sampling (D) and of molecular DOM composition based on Bray Curtis similarity referring to daily (E) and hourly sampling (F). Gray line separates and different colors indicate groups of samples.
PC
O2
(22
.6%
of
t ota
lvariatio
n)
PC
O2
(21
.3%
of
tota
lva
riatio
n)
PC
O2
(27
.8%
ofto
talv
aria
tion
)P
CO
2(1
4%ofto
talv
ariatio
nP
CO
2( 1
4.5
%of
t ot a
lva
riati o
n)
PC
O2
(21
.5%
of
tota
lva
ria
tion)
-60 -40 -20 0 20 40
PCO1 (30.2% of total variation)
-80
-60
-40
-20
0
20
6.8.
7.8.8.8.9.8.
10.8.
12.8.
13.8.
14.8.16.8.
17.8.
18.8.
20.8.
21.8.
22.8.
23.8.24.8.
25.8.26.8.
-4 -2 0 2 4
PCO1 (24.1% of total variation)
-4
-2
0
2
4
6.8.
7.8.8.8.
9.8.
10.8.
12.8.
13.8.14.8.
16.8.
17.8.
18.8.
20.8.21.8.
22.8.
23.8.
24.8.
25.8.
26.8.
-6 -4 -2 0 2 4
PCO1 (34.1% of total variation)
-4
-2
0
2
4 14
1516
17
18
19
20
21
22
23
241
2
34
5
6
78
9
1011
1213
-40 -20 0 20 40
PCO1 (19.7% of total variation)
-20
0
20
40
)
14
15
16
17
18
19
20
21
2223
24
1
2
3
4
5 6
78 9
101112
13
-2 0 2 4 6
PCO1 (26.9% of total variation)
-2
0
2
4
14
15
16
17
18
19
20
21
22
23
24
1
2
3
4
5
6
7
8
9
10
11
12
13
-6 -4 -2 0 2 4
PCO1 (26% of total variation)
-6
-4
-2
0
2
4
6.8.7.8.
8.8.
9.8.
10.8.
12.8.
13.8.
14.8.
16.8.
17.8.
18.8.
20.8.
21.8.
22.8.23.8.
24.8.
25.8.26.8.
A B
C
E F
D
17
4.3.2 Bacterial community and relation with the molecular DOM composition
The diversity of the bacterial community was examined using the ARISA fingerprinting
technique. The number of ARISA band classes observed per sample ranged from 70 to 146
with an obvious outlier on August 18, 2012 which only showed 18 band classes.
To test the hypothesis that a relationship between bacterial community structure and DOM
composition exists, the RELATE subroutine was used. This analysis however revealed that the
bacterial community and molecular composition of DOM are not significantly related.
4.3.3 Relation of bacterial community or molecular DOM composition to environmental
data
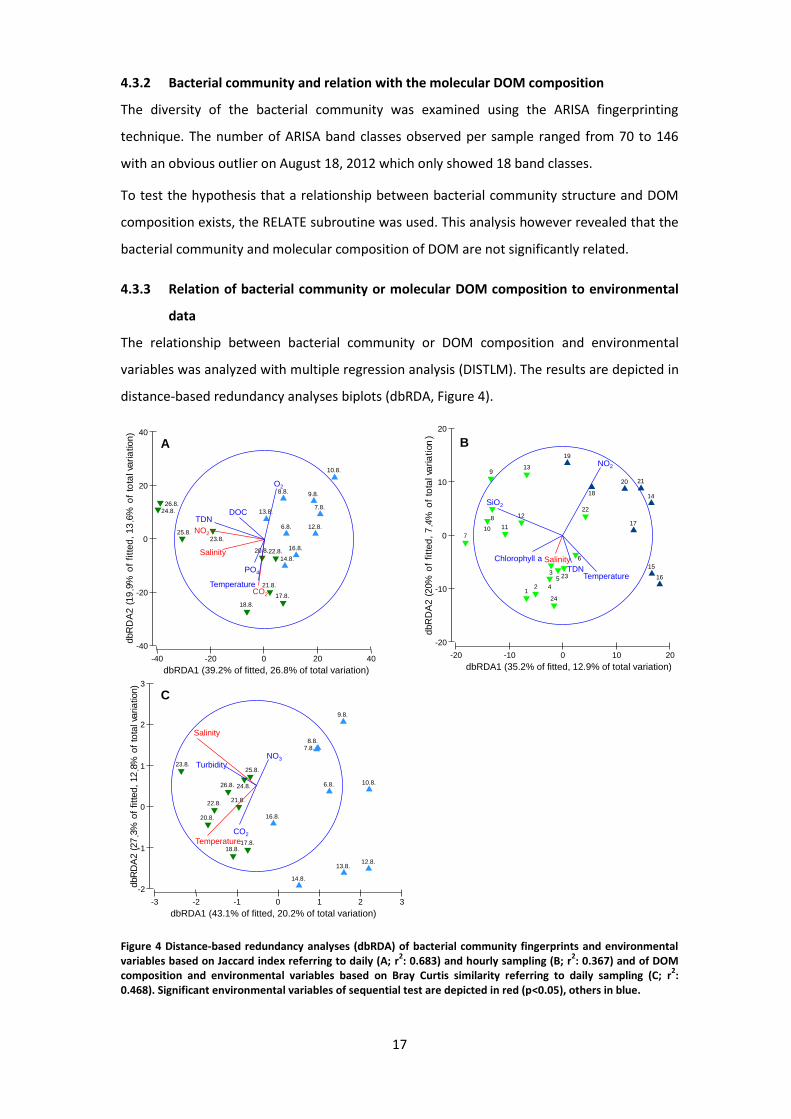
The relationship between bacterial community or DOM composition and environmental
variables was analyzed with multiple regression analysis (DISTLM). The results are depicted in
distance-based redundancy analyses biplots (dbRDA, Figure 4).
Figure 4 Distance-based redundancy analyses (dbRDA) of bacterial community fingerprints and environmental variables based on Jaccard index referring to daily (A; r
2: 0.683) and hourly sampling (B; r
2: 0.367) and of DOM
composition and environmental variables based on Bray Curtis similarity referring to daily sampling (C; r2:
0.468). Significant environmental variables of sequential test are depicted in red (p<0.05), others in blue.
dbR
DA
2(1
9.9
%o
ffitt
ed
,13
.6%
of
tota
lva
ria
tion
)dbR
DA
2(2
7.3
%o
ffitted
,12
.8%
of
tota
lva
ria
tion)
dbR
DA
2( 2
0%
of
fitt
ed
,7
.4%
of
t ot a
lva
ria
tion
-40 -20 0 20 40
dbRDA1 (39.2% of fitted, 26.8% of total variation)
-40
-20
0
20
40
6.8.
7.8.
8.8. 9.8.
10.8.
12.8.
13.8.
14.8.
16.8.
17.8.
18.8.
20.8.
21.8.
22.8.
23.8.
24.8.
25.8.
26.8.
NO2
Salinity
O2
CO2
DOC
PO4
Temperature
TDN
-3 -2 -1 0 1 2 3
dbRDA1 (43.1% of fitted, 20.2% of total variation)
-2
-1
0
1
2
3
6.8.
7.8.8.8.
9.8.
10.8.
12.8.13.8.
14.8.
16.8.
17.8.18.8.
20.8.
21.8.22.8.
23.8.
24.8.
25.8.
26.8.
Salinity
Temperature
CO2
TurbidityNO3
-20 -10 0 10 20
dbRDA1 (35.2% of fitted, 12.9% of total variation)
-20
-10
0
10
20)
14
15
16
17
18
19
20 21
22
23
24
12
3
4
5
6
7
8
9
10 11
12
13
Salinity
NO2
SiO2
Temperature
Chlorophyll a
TDN
A B
C
18
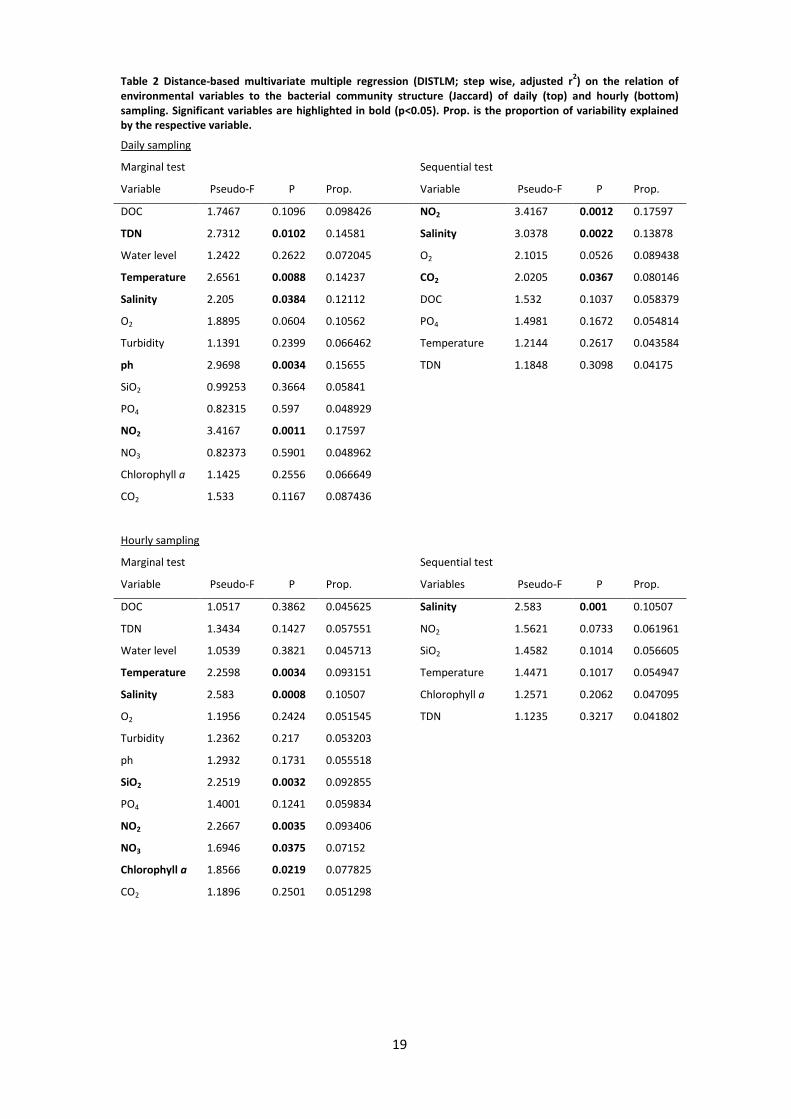
The first two axes of the dbRDA plot of bacterial community of daily sampling explained
40.4% of the total and 59.1% of fitted variation. This indicated that most of the salient
patterns in the fitted model are captured. The differences between bacterial communities
were influenced by several environmental factors (Figure 4 A, Table 2). Marginal tests
indicated TDN, temperature, salinity, pH and NO2 to have a significant effect on the bacterial
community structure. Among the investigated environmental variables, salinity CO2 and NO2
also exhibited a significant effect as revealed by a sequential test in the DISTLM model (Table
2). NO2 contributes alone with 17.60%, CO2 with 8.01% and salinity with 13.88% to the model
(Table 2).
In case of samples taken hourly, bacterial community structure was significantly influenced by
the individual effects of temperature, salinity, SiO2, NO2, NO3 and chlorophyll a (Table 2). In
sequential tests significant effects solely for salinity were confirmed, which contributes
10.51% to the model (Table 2). The first two axes of dbRDA explained 20.3% of the total and
55.2% of the fitted variation (Figure 4 B).
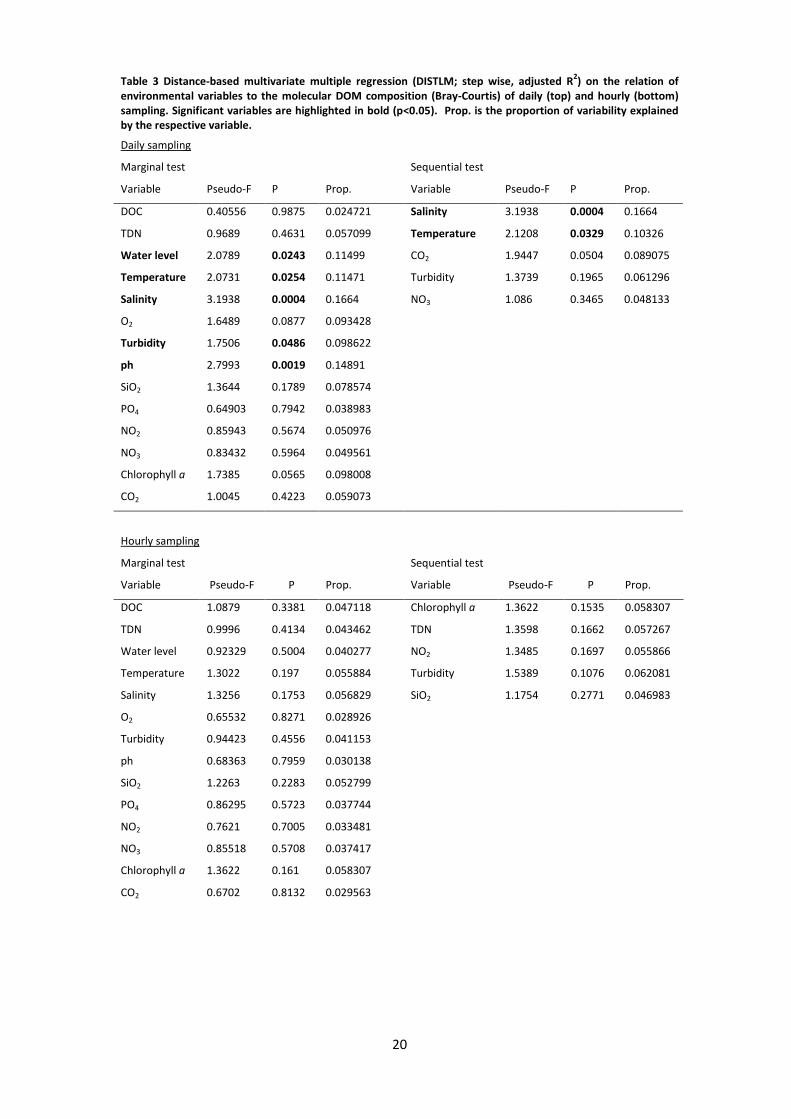
The results for the analysis of the DOM composition together with the environmental
variables of the daily sampling are displayed in Figure 4 C. Here, 33% of the total and 77% of
the fitted variation were covered. Temperature and salinity as well as water level, turbidity
and pH were significant parameters as revealed by a marginal test in the DISTLM model
(Table 3). Regarding the sequential tests solely salinity and temperature had significant
effects on the molecular composition of the DOM (Table 3). Salinity contributed 16.64% and
temperature 10.33% to the model.
In Table 3, the results of DISTLM of DOM composition referring to hourly sampling are listed.
Neither marginal nor sequential tests revealed a significant contribution of environmental
parameters (dbRDA not visualized).
All depicted dbRDAs showed the same grouping of samples consistent with the results from
PCO analyses.
19
Table 2 Distance-based multivariate multiple regression (DISTLM; step wise, adjusted r2) on the relation of
environmental variables to the bacterial community structure (Jaccard) of daily (top) and hourly (bottom) sampling. Significant variables are highlighted in bold (p<0.05). Prop. is the proportion of variability explained by the respective variable.
Daily sampling
Marginal test
Variable
Pseudo-F
P
Prop.
Sequential test
Variable
Pseudo-F
P
Prop.
DOC 1.7467 0.1096 0.098426 NO2 3.4167 0.0012 0.17597
TDN 2.7312 0.0102 0.14581 Salinity 3.0378 0.0022 0.13878
Water level 1.2422 0.2622 0.072045 O2 2.1015 0.0526 0.089438
Temperature 2.6561 0.0088 0.14237 CO2 2.0205 0.0367 0.080146
Salinity 2.205 0.0384 0.12112 DOC 1.532 0.1037 0.058379
O2 1.8895 0.0604 0.10562 PO4 1.4981 0.1672 0.054814
Turbidity 1.1391 0.2399 0.066462 Temperature 1.2144 0.2617 0.043584
ph 2.9698 0.0034 0.15655 TDN 1.1848 0.3098 0.04175
SiO2 0.99253 0.3664 0.05841
PO4 0.82315 0.597 0.048929
NO2 3.4167 0.0011 0.17597
NO3 0.82373 0.5901 0.048962
Chlorophyll a 1.1425 0.2556 0.066649
CO2 1.533 0.1167 0.087436
Hourly sampling
Marginal test
Variable
Pseudo-F
P
Prop.
Sequential test
Variables
Pseudo-F
P
Prop.
DOC 1.0517 0.3862 0.045625 Salinity 2.583 0.001 0.10507
TDN 1.3434 0.1427 0.057551 NO2 1.5621 0.0733 0.061961
Water level 1.0539 0.3821 0.045713 SiO2 1.4582 0.1014 0.056605
Temperature 2.2598 0.0034 0.093151 Temperature 1.4471 0.1017 0.054947
Salinity 2.583 0.0008 0.10507 Chlorophyll a 1.2571 0.2062 0.047095
O2 1.1956 0.2424 0.051545 TDN 1.1235 0.3217 0.041802
Turbidity 1.2362 0.217 0.053203
ph 1.2932 0.1731 0.055518
SiO2 2.2519 0.0032 0.092855
PO4 1.4001 0.1241 0.059834
NO2 2.2667 0.0035 0.093406
NO3 1.6946 0.0375 0.07152
Chlorophyll a 1.8566 0.0219 0.077825
CO2 1.1896 0.2501 0.051298
20
Table 3 Distance-based multivariate multiple regression (DISTLM; step wise, adjusted R2) on the relation of
environmental variables to the molecular DOM composition (Bray-Courtis) of daily (top) and hourly (bottom) sampling. Significant variables are highlighted in bold (p<0.05). Prop. is the proportion of variability explained by the respective variable.
Daily sampling
Marginal test
Variable
Pseudo-F
P
Prop.
Sequential test
Variable
Pseudo-F
P
Prop.
DOC 0.40556 0.9875 0.024721 Salinity 3.1938 0.0004 0.1664
TDN 0.9689 0.4631 0.057099 Temperature 2.1208 0.0329 0.10326
Water level 2.0789 0.0243 0.11499 CO2 1.9447 0.0504 0.089075
Temperature 2.0731 0.0254 0.11471 Turbidity 1.3739 0.1965 0.061296
Salinity 3.1938 0.0004 0.1664 NO3 1.086 0.3465 0.048133
O2 1.6489 0.0877 0.093428
Turbidity 1.7506 0.0486 0.098622
ph 2.7993 0.0019 0.14891
SiO2 1.3644 0.1789 0.078574
PO4 0.64903 0.7942 0.038983
NO2 0.85943 0.5674 0.050976
NO3 0.83432 0.5964 0.049561
Chlorophyll a 1.7385 0.0565 0.098008
CO2 1.0045 0.4223 0.059073
Hourly sampling
Marginal test
Variable
Pseudo-F
P
Prop.
Sequential test
Variable
Pseudo-F
P
Prop.
DOC 1.0879 0.3381 0.047118 Chlorophyll a 1.3622 0.1535 0.058307
TDN 0.9996 0.4134 0.043462 TDN 1.3598 0.1662 0.057267
Water level 0.92329 0.5004 0.040277 NO2 1.3485 0.1697 0.055866
Temperature 1.3022 0.197 0.055884 Turbidity 1.5389 0.1076 0.062081
Salinity 1.3256 0.1753 0.056829 SiO2 1.1754 0.2771 0.046983
O2 0.65532 0.8271 0.028926
Turbidity 0.94423 0.4556 0.041153
ph 0.68363 0.7959 0.030138
SiO2 1.2263 0.2283 0.052799
PO4 0.86295 0.5723 0.037744
NO2 0.7621 0.7005 0.033481
NO3 0.85518 0.5708 0.037417
Chlorophyll a 1.3622 0.161 0.058307
CO2 0.6702 0.8132 0.029563
21
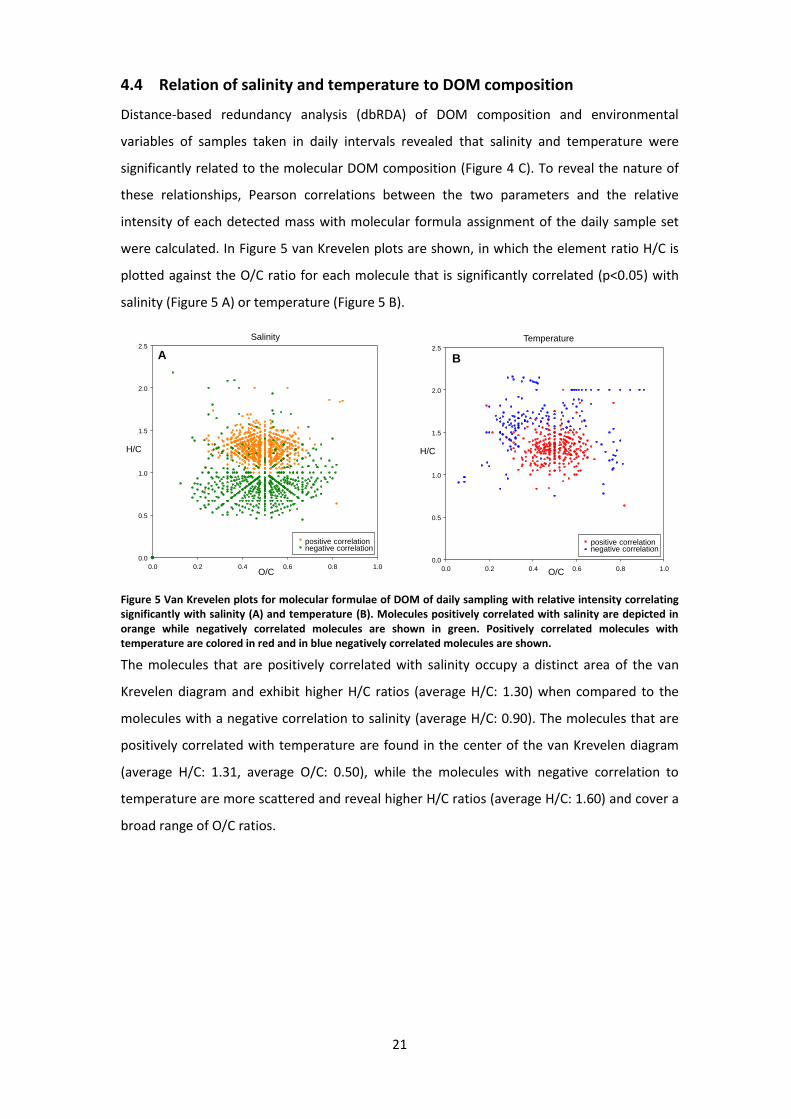
4.4 Relation of salinity and temperature to DOM composition
Distance-based redundancy analysis (dbRDA) of DOM composition and environmental
variables of samples taken in daily intervals revealed that salinity and temperature were
significantly related to the molecular DOM composition (Figure 4 C). To reveal the nature of
these relationships, Pearson correlations between the two parameters and the relative
intensity of each detected mass with molecular formula assignment of the daily sample set
were calculated. In Figure 5 van Krevelen plots are shown, in which the element ratio H/C is
plotted against the O/C ratio for each molecule that is significantly correlated (p<0.05) with
salinity (Figure 5 A) or temperature (Figure 5 B).
Figure 5 Van Krevelen plots for molecular formulae of DOM of daily sampling with relative intensity correlating significantly with salinity (A) and temperature (B). Molecules positively correlated with salinity are depicted in orange while negatively correlated molecules are shown in green. Positively correlated molecules with temperature are colored in red and in blue negatively correlated molecules are shown.
The molecules that are positively correlated with salinity occupy a distinct area of the van
Krevelen diagram and exhibit higher H/C ratios (average H/C: 1.30) when compared to the
molecules with a negative correlation to salinity (average H/C: 0.90). The molecules that are
positively correlated with temperature are found in the center of the van Krevelen diagram
(average H/C: 1.31, average O/C: 0.50), while the molecules with negative correlation to
temperature are more scattered and reveal higher H/C ratios (average H/C: 1.60) and cover a
broad range of O/C ratios.
Temperature
O/C0.0 0.2 0.4 0.6 0.8 1.0
H/C
0.0
0.5
1.0
1.5
2.0
2.5
positive correlationnegative correlation
Salinity
O/C0.0 0.2 0.4 0.6 0.8 1.0
H/C
0.0
0.5
1.0
1.5
2.0
2.5
positive correlationnegative correlation
A B
22
5 Discussion
5.1 Relation between bacterial community and molecular DOM
composition
The study revealed same variations in the bacterial community and the molecular DOM
composition. However, these variations are not interdependently related. The first
hypothesis that bacterial community and molecular composition of DOM affect each other on
short time scales could not be confirmed in this study. The applied RELATE subroutine could
not reveal a significant relationship between the bacterial community structure and the DOM
composition. This was the case for both, daily and hourly sampling.
It has to be considered that there are several ways in which an existing relationship could be
present but not be detected in this study. One possible explanation lies in the rapid
consumption of the reactive molecules. Bacteria can deplete these molecules directly after
their release by other organisms. Therefore it might be that no pool of labile DOM is available
for measurement. This explanation is consistent with Amon and Benner (1996), Weiss and
Simon (1999) and Kirchman et al. (1991) who found high turnover rates of labile DOM.
Another reason for the lack of evidence for a relation between the bacterial community
structure and the DOM composition could be because the chosen analytical window is
limited. During processing of FT-ICR-MS data for further analysis information on possibly
important masses might have been eliminated due to the rather conservative approach.
Furthermore data on masses that could not be assigned to formulae were ignored.
Furthermore a limitation of our method could be losses especially of freshly produced
material during the solid phase extraction (SPE). A previous study of Flerus et al. (2012) has
shown that SPE is a suitable method to distinguish between different ageing of marine
oceanic DOM, it compared very similar water samples like the current study. However,
colloidal material and low molecular weight DOM (< 250 Da) escape the analytical window
that might be explain why no relation between bacterial community structure and DOM
composition could be observed. Furthermore, it could also explain the low extraction
efficiencies calculated in our analysis. Although the efficiencies were within the range
described for marine samples by Dittmar et al. (2008), it is considerably lower than that of
more recent studies (Osterholz et al., in review; Rossel et al., 2013; Seidel et al., in review).
23
5.2 Influences of environmental variables on bacterial community and
molecular composition of DOM
The sampling period covered the range of typical summer conditions on Helgoland Roads
(http://www.pangaea.de). Longtime studies observed medians of salinities ranging between
31 and 33 (Raabe and Wiltshire et al., 2008; Wiltshire et al., 2009). The salinity values show
strong variation within few days. A shift in this order is exceptional for this observed
timeframe. Dynamics of salinities at Helgoland Roads are controlled by hydrological and
meteorological forces and by river discharges. Events with high salinity are mainly influenced
by the transport of central North Sea water. Coastal water influx is related to the lower
salinities (Wiltshire et al., 2009).
The daily sampling shows a distinct grouping of environmental variables, bacterial
community, and DOM composition. The distribution of the samples hereby strongly suggests
a relation of these two groups to salinity. For the environmental parameters and bacterial
communities the same is true even for the 24 h time series. Multivariate statistics confirmed
the hypothesis that variations in bacterial community and DOM composition are mainly
driven by these salinity changes. While the statistical analyses also reveal a significant link
between the variation of the bacterial community with CO2 and NO2, further examination is
needed to explain this relationship. Further investigation might also explain the significant
correlation of temperature and variation in DOM observed during the daily sampling.
However, realistic ecological conditions involve many strongly correlating parameters.
Therefore it has to be considered that the resulting significant parameters of the model could
result from the multicollinearity (Graham, 2003).
For the contribution to changes in the DOM composition, the 24 h time series revealed no
significant environmental parameters. The samples were too similar for observing any
grouping via PCO analysis. If the DOM composition changed during this timeframe, these
slight differences could not be discovered.
The frequent sampling in a narrow timeframe of only several days or 24 h was rarely applied
in the field of microbial ecology and geochemistry of DOM before. Hence, little is known
about the temporal dynamics on the short timescale this study focused on. Only few
published reports using molecular fingerprinting for shorter timescales are available.
Riemann and Middelboe (2002) as well as Hewson et al. (2006) showed that bacterial
community composition was relatively stable over days and weeks. Studies of 24 h time
series revealed also resilience or slight variation of bacterial communities (Fuhrmann et
al.,1985; Needham, 2013; Rink et al., 2008; Shiah, 1999). Also there is a lack of knowledge of
field studies focusing of FT-ICR-MS data over short timescales. Here we show that dynamics
24
in bacterial community and DOM composition can exist even over such comparably short
timescales. While these changes might merely represent different water masses, the high
resolution in time allows for a very detailed documentation of these fluctuations. Here the
24 h series is of special value as it increases the temporal resolution to more precisely analyze
the turning point in the system caused by salinity changes.
5.3 Relation of salinity and temperature to DOM composition
The van Krevelen plot (Figure 5) shows that molecules, which are positively correlated with
salinity, plot in the H/C and O/C range associated with marine DOM. Molecules negatively
correlated with salinity pattern in the van Krevelen diagram are associated with terrigenous
DOM (Kim et al., 2003; Koch et al., 2005; Sleighter and Hatcher, 2008). Marine DOM is more
aliphatic and is sourced mainly from carbohydrates, amino acids and lipids, whereas
terrestrial DOM is more aromatic and contains carboxyl and hydroxyl functionalities
(Sleighter and Hatcher, 2008). Therefore it can be concluded that water with high salinity
contained more of typical marine DOM and water with lower salinity contained more
molecules which are typical for terrigenous components. This is in accordance with the
expectations, as the high salinity represents marine water from the North Sea while the low
salinities are due to coastal or riverine influences.
There is a positive trend in temperature during the sampling period, but no correlation with
salinity existed (Pearson correlation coefficient, r=0.12, p>0.6). The van Krevelen plot of
molecules correlated with temperature (Figure 5) shows another grouping. Most of the
molecules that are negatively correlated with temperature have a higher H/C ratio than
positively correlated molecules. Higher H/C ratio means the molecules are more saturated
and might indicates recent production of labile DOM. Considering the temperature increased
slightly during the sampling period these molecules that are negatively correlated decreased.
A possible scenario could be that microbial activity had increased with the rising
temperature. Because of the enhanced metabolism, the microbial community may consume
more DOM (Pomeroy and Wiebe, 2001), especially the labile fraction of DOM. The increasing
abundance of positively correlated molecules could be explained by the consumption of the
labile DOM. As the labile molecules are being depleted the relative abundance of the
positively correlated molecules increases. That means the positively correlated molecules
increase in relative abundance.
25
6 Conclusion and Outlook
In this study, dynamics in microbial community and DOM composition over short time series
were revealed. Bacterial community structure and DOM composition showed similar changes
but a direct relation cannot be confirmed. The dynamics of bacterial community and
molecular DOM composition are mainly driven by influences of different water masses. For
the first time changes of microbial community and molecular DOM composition have been
documented in such high temporal and analytical resolution.
Several modifications to the analysis could provide the ability to reveal more molecules which
could have implications for our study. Modifying the criteria for molecular formulae
assignment, to a less conservative state, could help to observe more changes in the DOM
composition with increased sensitivity. Furthermore statistical analyses could include the
masses without assigned formulae. If this analysis were to reveal several molecules which
show significant correlations with the bacterial community the formulae could be assigned
manually.
Due to the striking observation of changes in microbial community in this study the data set
should be used for a deeper insight into the microbial ecology. Further information on
bacterial community structure will be available through sequencing of bacterial DNA. Based
on ARISA results samples will be selected for pyrosequencing of the bacterial 16S rDNA. The
specific identification of bacterial species will be realized by 454-sequencing. This sequencing
method offers new capabilities to investigate microbial community composition (Schuster,
2008) and may give some detailed indication of changes of bacterial community in our study
focusing on a short time interval. Such detailed informations could even provide new insights
in the relationship of bacterial community structure a molecular DOM composition.
26
7 References
Amon RMW, Benner R (1996) Bacterial utilization of different size classes of dissolved organic
matter. Limnol and Oceanogr 41: 41-51
Anderson MJ (2001) A new method for non-parametric multivariate analysis of variance.
Austral Ecol 26: 32–46
Anderson MJ, Gorley RN, Clarke KR (2008) PERMANOVA+ for PRIMER: Guide to Software and
Statistical Methods. PRIMER-E, Plymouth, UK
Azam F (1998) Microbial Control of Oceanic Carbon Flux: The Plot Thickens. Science 280: 694-
696
Barry T, Colleran G, Glennon M, Dunican LK, Gannonl F (1991) The 16s/23s Ribosomal Spacer
Region as a Target for DNA Probes to Identify Eubacteria. Genome Res 1: 51–56
Bauer JE, Williams PM, Druffel ERM (1992) 14C activity of dissolved organic carbon fractions in
the north-central Pacific and Sargasso Sea. Nature 357: 667-670
Chauhan A, Cherrier J, Williams HN (2009) Impact of sideways and bottom-up control factors
on bacterial community succession over tidal cycle. PNAS 106: 4301-4306
Danovaro R, Luna GM, Dell’Anno A, Pietrangeli B (2006) Comparison of Two Fingerprinting
Techniques, Terminal Restriction Fragment Length Polymorphism and Automated
Ribosomal Intergenic Spacer Analysis, for Determination of Bacterial Diversity in
Aquatic Environments. Appl Environ Microb 72: 5982–5989
Dittmar T, Koch BP (2006) Thermogenic organic matter dissolved in the abyssal ocean. Mar
Chem 102: 208-217
Dittmar T, Koch BP, Hertkorn N, Kattner G (2008) A simple and efficient method for the solid-
phase extraction of dissolved organic matter (SPE-DOM) from seawater. Limnol
Oceanogr: Methods 6: 230-235
Dittmar T, Paeng.J (2009) A heat-induced molecular signature in marine dissolved organic
matter. Nature Geoscience 2: 175-179
Flerus R, Lechtenfeld OJ, Koch BP, McCallister SL, Schmitt-Kopplin P, Benner R, Kaiser K,
Kattner G (2012) A molecular perspective on the ageing of marine dissolved organic
matter. Biogeosciences 9: 1935-1955
Fuhrman JA, Eppley RW, Hagstrom A, Azam F (1985) Diel variations in bacterioplankton,
phytoplankton, and related parameters in the Southern California Bight. Mar Ecol Prog
Ser 27: 9-20
27
Fuhrmann JA, Ferguson RL (1986) Nanomolecular concentration and rapid turnover of
dissolved free amino acids in seawater: Agreement between chemical and
microbiological measurements. Mar Ecol Prog Ser 33: 237-242
Gerdts G, Wichels A, Döpke H, Klings KW, Gunkel W, Schütt C (2004) 40-year long-term study
of microbial parameters near Helgoland (German Bight, North Sea): historical view and
future perspectives. Helgol Mar Res 58: 230-242
Graham MH (2003) Confronting multicollinearity in ecological multiple regression. Ecology
84: 2809-2815
Hansell DA (2013) Recalcitrant Dissolved organic carbon fractions. Annu Rev Marine Sci 5:
421-445
Hansell DA, Carlson CA (2002) Biogeochemistry of marine dissolved organic matter. Elsevier
Science
Hedges JI (1992) Global biogeochemical cycles - progress and problems. Mar Chem 39: 67-93
Hedges JI, Eglinton G, Hatcher PG, Kirchman DL, Arnosti C, Derenne S, Evershed RP, Kögel-
Knabner I, De Leeuw JW, Littke R, Michaelis W, Rullkötter J (2000) The molecularly‐
uncharacterized component of nonliving organic matter in natural environments. Org
Geochem 31: 945‐958
Hewson I, Steele JA, Capone DG, Fuhrman JA (2006) Temporal and spatial scales of variation
in bacterioplankton assemblages of oligotrophic surface waters. Mar Ecol Prog Ser 311:
67-77
Keil RG, Kirchman DL (1999) Utilization of dissolved protein and amino acids in the northern
Sargasso Sea. Aquat Microb Ecol 18: 293-300
Kim S, Kramer RW, Hatcher PG (2003) Graphical Method for Analysis of Ultrahigh-Resolution
Broadband Mass Spectra of Natural Organic Matter, the Van Krevelen Diagram. Anal
Chem 75: 5336-5344
Kirchman DL, Suzuki Y, Garside C, Ducklow HW (1991) High turnover rates of dissolved
organic carbon during a spring phytoplankton bloom. Nature 352: 612-614
Koch BP, Dittmar T (2006) From mass to structure: an aromaticity index for highresolution
mass data of natural organic matter. Rapid Commun in Mass Spectrom 20: 926–932
Koch BP, Ludwichowski K-U, Kattner G, Dittmar T and Witt M (2008) Advanced
characterization of marine dissolved organic matter by combining reversed-phase
liquid chromatography and FT-ICR-MS. Mar Chem 111: 233-241
28
Koch BP, Witt MR, Engbrodt R, Dittmar T, Kattner G (2005) Molecular formulae of marine and
terrigenous dissolved organic matter detected by electrospray ionization Fourier
transform ion cyclotron resonance mass spectrometry. Geochim Cosmochim Acta 69:
3299-3308
Kovacs A, Yacoby K, Gophna U (2010) A systematic assessment of automated ribosomal
intergenic spacer analysis (ARISA) as a tool for estimating bacterial richness. Res
Microbiol 161: 192-197
Krause EM, Wichels A, Giménez L, Lunau M, Schilhabel MB, Gerdts G (2012) Small Changes in
pH have effects on marine bacterial community composition: A microcosm approach.
Plos one 7 (10) e47035
McCarren J, Becker JW Repeta D, Shi Y, Young CR, Malmstrom R, Chisholm P, DeLong EF
(2010) Microbial community transcriptomes reveal microbes and metabolic pathways
associated with dissolved organic matter turnover in the sea. PNAS 107: 16420-16427
Needham DM, Chow CET, Cram JA, Sachdeva R, Parada A, Fuhrman JA (2013) Short-term
observations of marine bacterial and viral communities: patterns, connections and
resilience. ISME 7: 1274-1285
Niggemann J, Gerdts G, Dittmar T “Geo-metabolomics” – a novel concept for understanding
function and reactivity of dissolved organic matter. unpublished
Okubo A, Sugiyama S (2009) Comparison of molecular fingerprinting methods for analysis of
soil microbial community structure. Ecol Res 24: 1399-1405
Osterholz H, Niggemann J, Dittmar T Molecular evidence for rapid dissolved organic matter
turnover in Arctic fjords. in review
Pomeroy LR (1974) Oceans food web, a changing paradigm. Bioscience 24: 499-504
Pomeroy LR, Wiebe WJ (2001) Temperature and substrates as interactive limiting factors for
marine heterotrophic bacteria. Aquat Microb Ecol 23: 187-204
Raabe T, Wiltshire KH (2008) Quality control and analyses of the long-term nutrient data from
Helgoland Roads, North Sea. J Sea Res 61: 3–16
Ranjard L, Brothier E, Nazaret S (2000) Sequencing Bands of Ribosomal Intergenic Spacer
Analysis Fingerprints for Characterization and Microscale Distribution of Soil Bacterium
Populations Responding to Mercury Spiking. Appl Environ Microbiol 66: 5334-5339
Riemann L, Middelboe M (2002) Stability of bacterial and viral community compositions in
Danish coastal waters as depicted by DNA fingerprinting techniques. Aquat Microb Ecol
27: 219–232
29
Rink B, Martens T, Fischer D, Lemke A, Grossart HP, Simon M, Brinkhoff T (2008) Short-term
dynamics of bacterial communities in a tidally affected coastal ecosystem. FEMS
Microbial Ecol 66: 306-319
Rossel PE, Vähätalo AV, Witt M, Dittmar T (2013) Molecular composition of dissolved organic
matter from a wetland plant (Juncus effusus) after photochemical and microbial
decomposition (1.25 yr): Common features with deep sea dissolved organic matter.
Org Geochem 60: 62-71
Sapp M, Wichels A, Wiltshire KH, Gerdts G (2007) Bacterial community dynamics during the
winter-spring transition in the North Sea. FEMS Microbiol Ecol 59: 622-637
Schuster SC (2008) Next-generation sequencing transforms today's biology. Nature Methods
5: 16-18.
Seidel M, Beck M, Riedel T, Waska H, Suryaputra IGNA, Schnetger B, Niggemann J, Simon M,
Dittmar T Biogeochemistry of Dissolved Organic Matter in an anoxic intertidal creek
bank. in review
Shiah FK (1999) Diel cycles of heterotrophic bacterioplankton abundance and production in
the ocean surface waters. Aquat Microb Ecol 17: 239-246
Sintes E, Stoderegger K, Parada V, Herndl GJ (2010) Seasonal dynamics of dissolved organic
matter and microbial activity in the coastal North Sea. Aquat Microb Ecol 60: 85-95
Sleighter RL, Hatcher PG (2008) Molecular characterization of dissolved organic matter (DOM)
along a river to ocean transect of the lower Chesapeake Bay by ultrahigh resolution
electrospray ionization fourier transform ion cyclotron resonance mass spectrometry.
Mar Chem 110: 140–152
Sperling M, Piontek J, Gerdts G, Wichels A, Schunck H, Roy AS, La Roche J, Gilbert J, Nissimov
JI, Bittner L, Romac S, Riebesell U, Engel A (2013) Effect of elevated CO2 on the
dynamics of particle-attached and free-living bacterioplankton communities in an Artic
fjord. Biogeoscience 10: 181-191
Stenson AC, Marshall AG, Cooper WT (2003) Exact masses and chemical formulas of
individual Suwannee River fulvic acids from ultrahigh resolution electrospray ionization
Fourier transform ion cyclotron resonance mass spectra. Anal Chem 75: 1275-1284
Stubbins A, Dittmar T (2012) Low volume quantification of dissolved organic carbon and
dissolved nitrogen. Limnol Oceanogr: Methods 10: 347-352
Stubbins A, Niggemann J, Dittmar T (2012) Photo-lability of deep ocean dissolved black
carbon. Biogeoscience 9: 1661-1670
30
Teeling H, Fuchs BM, Becher D, Klockow C, Gardebrecht A, Bennke CM, Kassabgy M, Huang S,
Mann AJ, Waldmann J, Weber M, Klindworth A, Otto A, Lange J, Bernhardt J, Reinsch A,
Hecker M, Peplies J, Bockelmann FD, Callies U, Gerdts G, Wichels A, Wiltshire KH,
Glöckner FO, Schwender T, Ammann R (2012). Substrate-Controlled Succession of
Marine Bacterioplankton Populations Induced by a Phytoplankton Bloom. Science 336:
608-611
Weiss M, Simon M (1999) Consumption of labile dissolved organic matter by limnetic
bacterioplankton: the relative significance of amino acids and carbohydrates. Aquat
Microb Eceol 17: 1-12
Williams PJIEB, Druffel ERM (1987) Radiocarbon in dissolved organic matter in the central
North Pacific Ocean. Nature 330: 246-248
Wiltshire KH (2013) Hydrochemistry measured with a FerryBox system at time series station
Helgoland in 2011. Alfred Wegener Institute for Polar and Marine Research - Biological
Institute Helgoland, Unpublished dataset #820193
Wiltshire KH, Kraberg A, Bartsch I, Boersma M, Franke HD, Freund J, Gebühr C, Gerdts G,
Stockmann K, Wichels A (2009) Helgoland Roads, North Sea: 45 Years of Change.
Estuaries and Coasts 33: 295-310
Wiltshire KH, Malzahn AM, Wirtz K, Greve W, Janisch S, Mangelsdorf P, Manly BFJ, Boersma
M (2008) Resilience of North Sea phytoplankton spring bloom dynamics: An analysis of
long-term data at Helgoland Roads. Limnol Oceanogr 53: 1294–1302
31
III. DANKSAGUNG
An erster Stelle möchte ich mich bei Dr. Jutta Niggemann und Prof. Dr. Thorsten Dittmar der
Max-Planck-Forschungsgruppe Marine Geochemie am Institut für Chemie und Biologie des
Meeres und Dr. Gunnar Gerdts und Dr. Antje Wichels der Arbeitsgruppe Mikrobielle Ökologie
des Alfred-Wegener-Instituts für Polar- und Meeresforschung für die Möglichkeit zur
Durchführung dieses Projektes danken. Ich bedanke mich aufrichtig für das Vertrauen,
welches mir schon im frühen Stadium meiner Ausbildung entgegengebracht wurde. Ganz
besonders möchte ich mich bei Dr. Jutta Niggemann und Dr. Gunnar Gerdts für die gute
Betreuung und Herzlichkeit während jeder Arbeitsphasen danken.
Bei Prof. Dr. Karen H. Wiltshire bedanke ich mich hiermit für die Bereitstellung ihrer Daten,
ohne die eine Auswertung von Teilen dieser Arbeit nicht möglich gewesen wäre.
Besonderer Dank gilt Judith Lucas, die mich in die praktischen Arbeitsweisen der
Molekularbiologie eingewiesen hat und mir bis zum Schluss immer mit Rat und Tat zur Seite
stand.
Ein herzlicher Dank geht sowohl an alle MitarbeiterInnen der Max-Planck-Forschungsgruppe
Marine Geochemie, als auch der Arbeitsgruppe Mikrobielle Ökologie für ihr Hilfsbereitschaft
und die sehr nette Arbeitsatmosphäre. Danke, dass ihr immer ein offenes Ohr für mich
hattet. Matthias Friebe, Ina Ulber und Kathrin Klapproth danke ich für die technische
Unterstützung der analytischen Untersuchungen. Weiterhin danke ich Helena Osterholz, die
mir nicht nur mit Dr. Jutta Niggemann bei der 24-Stunden Beprobung geholfen hat, sondern
vor allem in der Endphase meiner Arbeit große Hilfe geleistet hat. Auch Markus Manecki
danke ich für die Hilfe bei zahlreichen Fragen.
Ich bedanke mich bei all den netten Menschen, die ich bei meinem Inselaufenthalt kennen
lernen durfte und die diese Zeit unvergesslich machten. Ein Weiterer Dank gilt all meinen
lieben Freunden in Oldenburg und in der Ferne für eine tolle Zeit während des bisherigen
Studiums.
Am Schluss möchte ich mich bei meiner Familie bedanken, die mich jederzeit auf zahlreiche
Art und weise unterstützt hat.
EIDESSTATTLICHE ERKLÄRUNG
Hiermit versichere ich, dass ich diese Arbeit selbstständig verfasst und keine anderen als die
angegebenen Quellen und Hilfsmittel benutzt habe. Außerdem versichere ich, dass ich die
allgemeinen Prinzipien wissenschaftlicher Arbeit und Veröffentlichung, wie sie in den
Leitlinien guter wissenschaftlicher Praxis der Carl von Ossietzky Universität Oldenburg
festgelegt sind, befolgt habe.
Irina Köster