Embed Size (px)
DESCRIPTION
CONN
Citation preview

7/18/2019 Short CONN for VIC With Tables
http://slidepdf.com/reader/full/short-conn-for-vic-with-tables 1/28
1
Short CONN at $76 – December 2013
SynopsisShort Conn’s (CONN US), “CONN”, at $76 with fair value around $30. Forward EBIT margin of 15% is not sustainable
long term. Real underlying EBIT is probably 8-10%. Margin compression combined with multiples derating will bring
about a sharp correction in the stock price. Note: stock is at all-time high after 19x rally from the bottom 3 years ago.
Short interest is c. 23%. It trades on average c. $40m a day.
Short business descriptionConn’s (CONN US) is a US retailer operating predominantly in Texas, Oklahoma and Louisiana:
It could be considered a “big box” retailer being active in those verticals where the typical competition would be the
likes of Target, Lowe’s, Costco, Wal-Mart, Sears and Wal-Mart. Sales breakdown as of FYE January 2014 (estimate)
below:

7/18/2019 Short CONN for VIC With Tables
http://slidepdf.com/reader/full/short-conn-for-vic-with-tables 2/28
2
From the company’s 10K, its main products include:
Home appliances - includes refrigerators, freezers, washers, dryers, dishwashers etc. Brands include Dyson,Electrolux, Eureka, Friedrich, General Electric, Haier, LG and Samsung
Furniture and mattresses - includes furniture and related accessories for the living room, dining room and
bedroom. Brands include Bello, Elements, Franklin, Home Stretch, Jackson, Catnapper, Klaussner, Sealy,
Serta, Steve Silver and Z-Line
Consumer electronic - includes LCD, LED, 3-D and plasma televisions, Blu-ray players, home theatre
and video game products. Brands include Bose, Canon, Haier, LG, Microsoft, Monster, Nikon, Nintendo,
Samsung, Sharp, Sony and Toshiba
Home office – include pc, tablets and accessories. Brands include Acer, Asus, Dell, Hewlett-Packard,
Microsoft, Samsung, Sony and Toshiba
As hopefully by now clear, this is not exactly a specialty retailer selling something that cannot be purchased
elsewhere. There is no Conn’s branded product and virtually every single product you can find at CONN can be
purchased at one of the competitors listed above. Moreover, one competitor we haven’t listed above is Amazon.
Virtually every item sold in a CONN store can be purchased online.
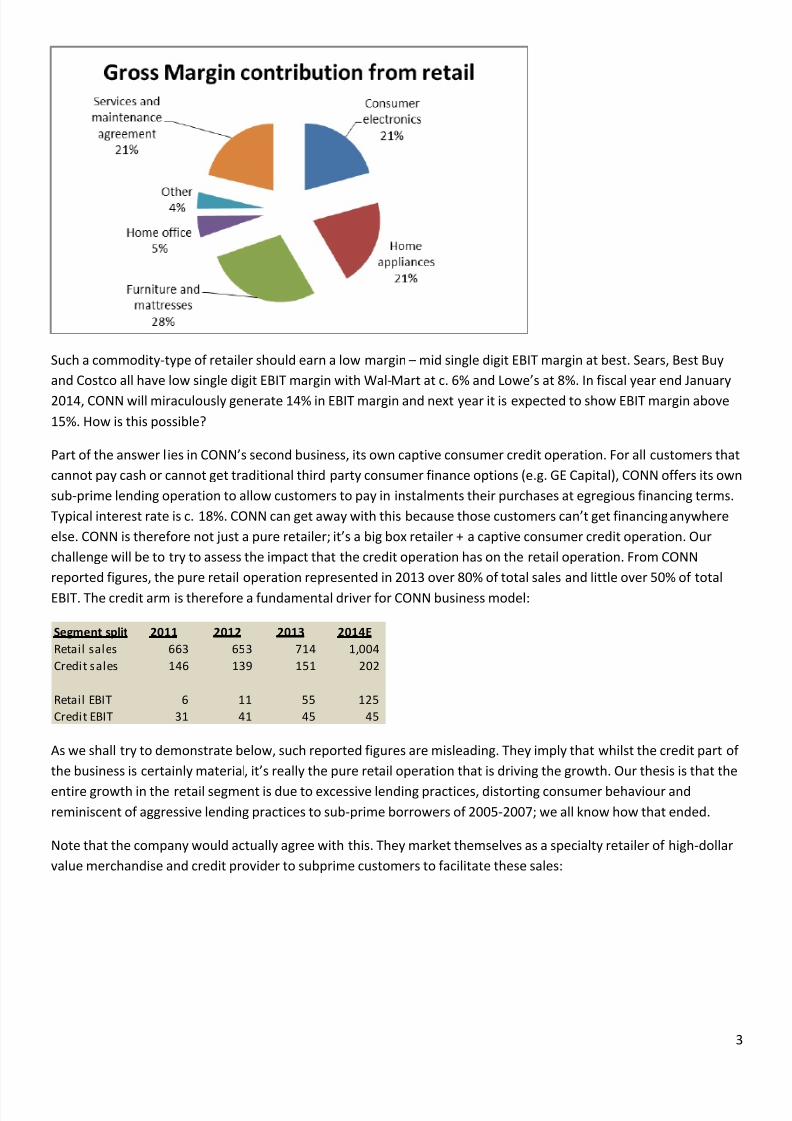
The gross margin split is slightly different, weighed towards furniture and mattresses having higher gross margin.
Services and maintenance agreement is also an important component of total gross margins (more than 20% of total
product sales). This is virtually 100% gross margin revenue stream as there are no real costs attached to it. CONN
sells repair service agreements to customers on behalf of third party providers and receives a commission on this
sale, which is recognised as revenue. In 2013, approximately 58% of sales of goods came also with the sale of a
service contract.
7/18/2019 Short CONN for VIC With Tables
http://slidepdf.com/reader/full/short-conn-for-vic-with-tables 3/28
3
Such a commodity-type of retailer should earn a low margin – mid single digit EBIT margin at best. Sears, Best Buy
and Costco all have low single digit EBIT margin with Wal-Mart at c. 6% and Lowe’s at 8%. In fiscal year end January
2014, CONN will miraculously generate 14% in EBIT margin and next year it is expected to show EBIT margin above
15%. How is this possible?
Part of the answer lies in CONN’s second business, its own captive consumer credit operation. For all customers that
cannot pay cash or cannot get traditional third party consumer finance options (e.g. GE Capital), CONN offers its own
sub-prime lending operation to allow customers to pay in instalments their purchases at egregious financing terms.
Typical interest rate is c. 18%. CONN can get away with this because those customers can’t get financing anywhere
else. CONN is therefore not just a pure retailer; it’s a big box retailer + a captive consumer credit operation. Our
challenge will be to try to assess the impact that the credit operation has on the retail operation. From CONN
reported figures, the pure retail operation represented in 2013 over 80% of total sales and little over 50% of total
EBIT. The credit arm is therefore a fundamental driver for CONN business model:
As we shall try to demonstrate below, such reported figures are misleading. They imply that whilst the credit part of
the business is certainly material, it’s really the pure retail operation that is driving the growth. Our thesis is that the
entire growth in the retail segment is due to excessive lending practices, distorting consumer behaviour and
reminiscent of aggressive lending practices to sub-prime borrowers of 2005-2007; we all know how that ended.
Note that the company would actually agree with this. They market themselves as a specialty retailer of high-dollar
value merchandise and credit provider to subprime customers to facilitate these sales:
Segment split 2011 2012 2013 2014E
Retail sales 663 653 714 1,004
Credit sales 146 139 151 202
Retail EBIT 6 11 55 125
Credit EBIT 31 41 45 45

7/18/2019 Short CONN for VIC With Tables
http://slidepdf.com/reader/full/short-conn-for-vic-with-tables 4/28
4
We see a disconnect though between the company’s reported margins and its real underlying profitability. This is
where the controversy starts.
CONN’s credit operations
CONN’s provides a proprietary, in-house credit program to its customers. As of Q3 2014, c. 80% of retail sales was
financed by a CONN’s proprietary credit program. Whilst the company likes to point out that “Our retail business and
credit business are operated independently from each other. The credit segment is dedicated to providing short and
medium-term financing for our customers. The retail segment is not involved in credit approval decisions” , the reality
is that the two are very much connected. Customers’ decisions on purchases of goods in a CONN’s store are based
on their credit availability. Nobody goes to CONN’s just to shop around – you have Amazon or Costco for that.
CONN’s typically targets customers with Fico score of between 550 and 650, i.e. subprime. As per company filings
“We have a well-defined core consumer base that is comprised of working class individuals who typically earn
between $25,000 to $60,000 in annual income”.

7/18/2019 Short CONN for VIC With Tables
http://slidepdf.com/reader/full/short-conn-for-vic-with-tables 5/28
5
Note chart below: default rate of 50% within the group identified with credit score of 550-60.
The company exhibited steady interest yield over time at around 18%, not too dissimilar from the 19.8% typically
charged by credit card companies for the 550-620 subprime group shown in table above.
7/18/2019 Short CONN for VIC With Tables
http://slidepdf.com/reader/full/short-conn-for-vic-with-tables 6/28
6
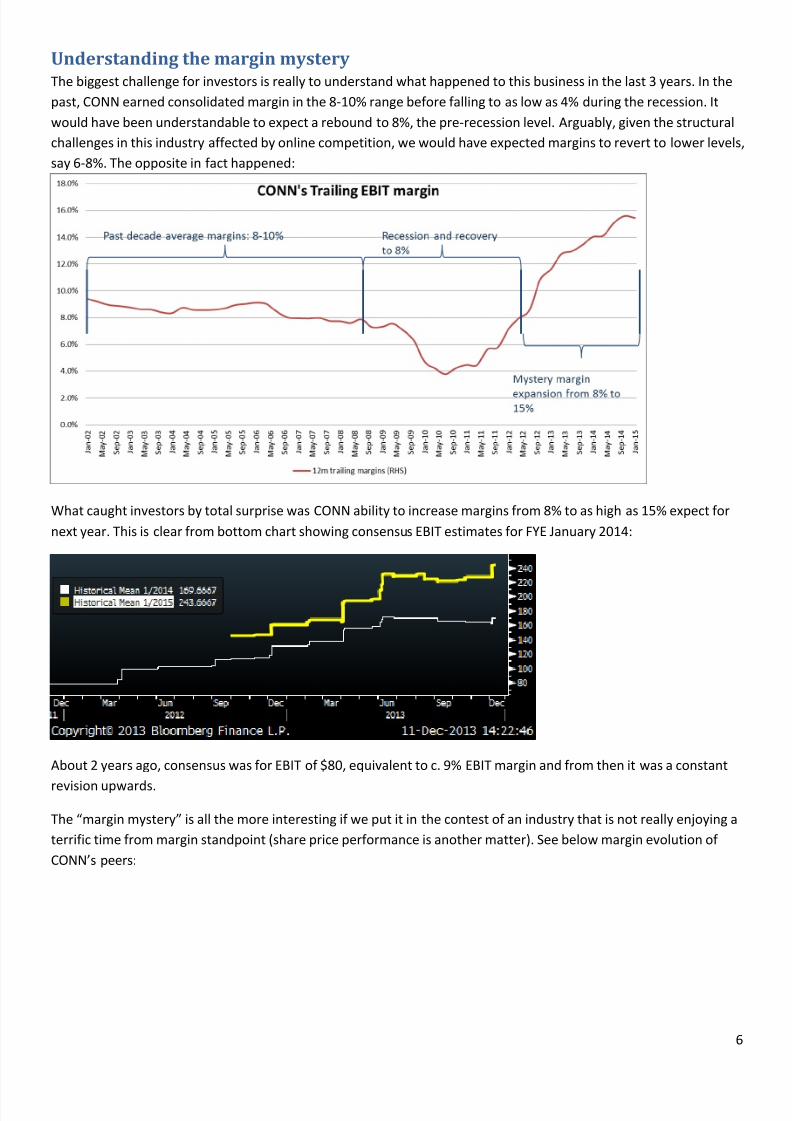
Understanding the margin mysteryThe biggest challenge for investors is really to understand what happened to this business in the last 3 years. In the
past, CONN earned consolidated margin in the 8-10% range before falling to as low as 4% during the recession. It
would have been understandable to expect a rebound to 8%, the pre-recession level. Arguably, given the structural
challenges in this industry affected by online competition, we would have expected margins to revert to lower levels,
say 6-8%. The opposite in fact happened:
What caught investors by total surprise was CONN ability to increase margins from 8% to as high as 15% expect for
next year. This is clear from bottom chart showing consensus EBIT estimates for FYE January 2014:
About 2 years ago, consensus was for EBIT of $80, equivalent to c. 9% EBIT margin and from then it was a constant
revision upwards.
The “margin mystery” is all the more interesting if we put it in the contest of an industry that is not really enjoying a
terrific time from margin standpoint (share price performance is another matter). See below margin evolution of
CONN’s peers:

7/18/2019 Short CONN for VIC With Tables
http://slidepdf.com/reader/full/short-conn-for-vic-with-tables 7/28
7
On average, over the last 2 years competitors showed 20bps EBIT margin expansion and 40bps gross margin
compression. CONN on the other hand showed incredible gross margin expansion – over 1,000 bps over 2 years:
It’s indicative that reported EBIT margin are up “only” 750bps over the last 2 years. The driver of CONN success was
higher gross margins, nothing to do with SG&A. In fact, if we look at retail operations alone, SG&A as percentage of
revenues increased over the last 2 years.
EBIT Margin 2 yrs ago LTM Delta Gross Margin 2 yrs ago LTM Delta
Home Depot 9.2% 11.7% 2.5% MFRM 52.4% 50.8% -1.6%
MFRM 8.5% 9.2% 0.7% Home Depot 34.4% 34.7% 0.3%
Target 7.8% 6.7% -1.1% Lowe's 34.8% 34.5% -0.3%
Lowe's 7.5% 7.9% 0.4% Target 29.9% 29.3% -0.6%
Wal-Mart 5.9% 5.9% 0.0% Sears 27.8% 27.8% 0.0%
Best Buy 4.3% 2.4% -1.9% Wal-Mart 25.1% 25.0% -0.1%
Costco 2.3% 2.9% 0.6% Best Buy 24.2% 23.0% -1.2%
Sears 2.2% 2.2% 0.0% Costco 12.5% 12.6% 0.1%
Average 6.0% 6.1% 0.2% Average 30.1% 29.7% -0.4%
CONN 6.6% 14.1% 7.5% CONN 29.2% 39.7% 10.5%

7/18/2019 Short CONN for VIC With Tables
http://slidepdf.com/reader/full/short-conn-for-vic-with-tables 8/28
8
The secret of CONN success is clearly to be found in its gross margins. CONN is not a cost-cutting, restructuring,
efficiency story. It’s a gross margin story. What is the driver of gross margin improvement? The answer to us is very
clear: higher prices. We can see it quite neatly from the company’s latest quarterly presentation:
Gross margin is up 480bps year on year. Average ASP is up c. 5.8%. Conn effectively internalised over 80% of the
increase in ASP over the last year. Not only were they able to push customers to spend more on average, but for
most of the sales, they were able to push customers to spend more for roughly the same products. A simple “trading
up” phenomenon where there is positive mix shift, simply cannot explain the full picture. One must assume CONN
increased prices on the same products internalising the incremental revenue. Otherwise, it would be mathematically
impossible to achieve such large gross margin improvements. Below we tried to prove the point with an illustrative
example.
We tried on the one hand to recreate exactly CONN’s quarterly gross margin improvement from Q3 2013 to Q4
2014. The numbers are as presented by CONN in the table above. On the other hand, we tried to simulate a mix shift
from low ASP product (say 32” LCD) to higher ASP / higher margin product (say a 55” LCD). We assumed (generously)
quite a gross margin differential (2,000bps), with the lower ASP product having a gross margin of 20% and the higher
ASP product with gross margin of 40%. Key to the exercise, we assume flat ASP and flat gross margins year on year
for the same product. Results are shown below:
Illustrative example Q3 2014 Q3 2013 (%) Actual numbers - as per company Q3 '14 table Q3 2014 Q3 2013 (%)
Product 1 (e.g. 32" LCD): Assumption of total sales growth in retail : 35.1%
Number of products sold 150 150 0% Of which: ASP 5.8%
Total illustrative revenue - $ $60,000 $60,000 Of which: number of articles 27.7%Total Product ASP $400 $400
Gross Margin -% 20.0% 20.0% 0% Actual CONN's figures
Gross Margin - $ $12,000 $12,000 Total number of products (SSS less ASP) - rebased 128% 100% 27.7%
Total i llustrative revenue - $ $605 $448 35.1%
Product 2 (e.g. 55" LCD): Total Product ASP $474 $448 5.8%
Number of products sold 169 100 69% Gross Margin -% 35.1% 30.3% 4.8%
Total illustrative revenue - $ $104,735 $61,900 Gross Margin - $ $212 $136 56.5%
Total Product ASP $619 $619
Gross Margin -% 40.0% 40.0% 0% Gross Margin on incremental dollar 49%
Gross Margin - $ $41,894 $24,760
Total - illustrative example (%) (%) - CONN's actual results for Q3 2014
Number of products sold 319 250 27.7% OK 27.7%
Total illustrative revenue - $ $164,735 $121,900 35.1% OK 35.1%
Total Product ASP $516 $488 5.8% OK 5.8%
Gross Margin -% 32.7% 30.2% 2.6% No! 4.8%
Gross Margin - $ $53,894 $36,760
Gross Margin on incremental dollar 40%
Product 1 share of total revenue 36% 49%
Product 2 share of total revenue 64% 51%

7/18/2019 Short CONN for VIC With Tables
http://slidepdf.com/reader/full/short-conn-for-vic-with-tables 9/28
9
The point of the exercise is to show that the illustrative model cannot recreate what actually happened at CONN. We
can re-engineer equivalent revenue, ASP growth and starting gross margin but we would end up with lower margins
in the last quarter. In our illustration, we would end up with Q3 2014 GM of 32.7% when it was 35.1%, and this is
assuming a mix shift that from a product with 20% to a product with 40% gross margin! In order to match what
actually happened, we had to assume higher gross margin (by 350bps) for the same product. It’s basically the same
thing as saying that CONN’s charged 3.5% more for exactly the same product. Only in this way can we explain the
gross margin expansion:
Of course there is an element of trading up with customers going for more expensive products. During Q3 2014
conference call for example the CEO said “On the electronics side, 65-inch and 75-inch televisions are becoming a
bigger piece of the business. We also benefited from 4K or Ultra HD becoming a meaningful part of our business
beginning this quarter“ . One must wonder about the sustainability of this – 75” television typically cost in excess of
$4,000 and the average income of CONN’s customers is $25 -60k. However, as shown above, the real secret of
CONN’s success lies in its ability to charge customers more for the same product. Shifting customers to higher ASPswhere gross margins are higher is a potentially sustainable strategy, simply charging customer more for the same
stuff isn’t. How are they able to do it?
Charging more for lessThis is effectively the declared strategy of CONN: overcharging customers for their products thanks to aggressive
lending practices. Whilst the company guarantees lowest prices, this is not strictly true:
Illustrative example Q3 2014 Q3 2013 (%) Actual numbers - as per company Q3 '14 table Q3 2014 Q3 2013 (%)
Product 1 (e.g. 32" LCD): Assumption of total sales growth in retail : 35.1%
Number of products sold 150 150 0% Of which: ASP 5.8%
Total illustrative revenue - $ $60,000 $60,000 Of which: number of articles 27.7%
Total Product ASP $400 $400
Gross Margin -% 20.0% 20.0% 0% Actual CONN's figures
Gross Margin - $ $12,000 $12,000 Total number of products (SSS less ASP) - rebased 128% 100% 27.7%
Total i llustrative revenue - $ $605 $448 35.1%
Product 2 (e.g. 55" LCD): Total Product ASP $474 $448 5.8%
Number of products sold 169 100 69% Gross Margin -% 35.1% 30.3% 4.8%
Total illustrative revenue - $ $104,735 $61,900 Gross Margin - $ $212 $136 56.5%
Total Product ASP $619 $619
Gross Margin -% 43.5% 40.0% 4% Gross Margin on incremental dollar 49%
Gross Margin - $ $45,560 $24,760
Total - illustrative example (%) (%) - CONN's actual results for Q3 2014
Number of products sold 319 250 27.7% OK 27.7%
Total illustrative revenue - $ $164,735 $121,900 35.1% OK 35.1%
Total Product ASP $516 $488 5.8% OK 5.8%
Gross Margin -% 34.9% 30.2% 4.8% OK 4.8%
Gross Margin - $ $57,560 $36,760
Gross Margin on incremental dollar 49%
Product 1 share of total revenue 36% 49%
Product 2 share of total revenue 64% 51%

7/18/2019 Short CONN for VIC With Tables
http://slidepdf.com/reader/full/short-conn-for-vic-with-tables 10/28
10
It’s impossible to compare the price of a 50” Sony TV that you can buy online on Amazon Vs the price at CONN. At
Amazon the price is clearly showed, say $599. At CONN, it would look more like: “pay over 24 month for just $33.99
a month”. Effectively, over 2 years, CONN will receive c. $816 from the customer, some 36% above Amazon price.It’s a little bit arbitrary how CONN allocates the purchase price. They can say it’s the same as Amazon and the rest is
interest. It therefore becomes impossible for customers to compare prices. The lack of transparency in pricing allows
CONN to push aspirational customers to buy something they wouldn’t normally be able to afford (hence higher
spending per customer) and are able to shift customers towards increasing ASPs. This is clear from the following
charts.
Transaction size and average outstanding balance growing
CONN’s ASP is far greater than competition.
ASP keeps on growing– below table is from September 2011. Above table is recent. Television ASP dropped in the
market from $601 to $411 (makes sense - strong price deflation) but in CONN’s case, it went from $716 to $1,001!

7/18/2019 Short CONN for VIC With Tables
http://slidepdf.com/reader/full/short-conn-for-vic-with-tables 11/28
11
CONN’s commentary in its latest 10-K (FYE January 2012)
“The average mattress selling price was up 53.9%, while unit volume declined 9.7% on a same store basis” . According
to ISPA, in its Bedding Barometer they estimated total ASP increase in the industry of c. 4% for 2012. It’s remarkable
that CONN achieved such higher ASP growth.
We have shown extensively how CONN’s ability to increase ASPs thanks to its opaque business practice allowed it in
recent years to expand margins phenomenally. What isn’t clear at all is why are they able to get away with it when in
the past (until 2 years ago) they were not. What changed 2 years ago and what enabled CONN’s to increase pricesdramatically?
Aggressive lending practices began with change in management
The major change that occurred 2 years ago was a change in management. In February 2011 Theo Wright became
interim CEO would and his permanent position was confirmed in November of the same year. Before him, Thomas
Frank Sr led the company for more than 15 years until June 2009. He was succeeded by Bill Nylin Junior that lasted
little over a year until he resigned in December 2010. Theo Wright decided to implement significant changes in
strategy from the past. The company highlights these changes. From 10k:
“Beginning late in fiscal year 2011, with the appointment of our current Chairman and Chief Executive Officer,
Theodore M. Wright, as our Chairman, our management and Board of Directors undertook an aggressive review of
our store level and credit portfolio performance. As a result, we closed a total of 11 stores during fiscal year 2012 and
two additional stores during fiscal year 2013. We continue to actively review the performance of our existing store
locations, customer demographics and retail sales opportunities to determine whether additional stores should be
closed or relocated or whether other operational changes should be pursued.
Beginning in the first quarter of fiscal year 2013, pursuant to our continuing strategic operational review, we
reinstated our new store growth strategy, emphasizing an increased selection of higher margin furniture and
mattresses in our stores. During fiscal year 2013, we opened five new stores and plan to open 10 to 12 new stores in
fiscal 2014. We also implemented an extensive store remodelling program in fiscal year 2012, pursuant to which 20
stores have been remodelled or relocated as of January 31, 2013, with approximately 15 more store
remodels and relocations scheduled for completion by January 31,2014.”
The strategy was effectively based on the following 2 steps:
1. Close underperforming stores in 2011-12 and boost organic growth
2. Reinstate growth with new stores opening in 2014-15
The company successfully implemented this strategy as planned:

7/18/2019 Short CONN for VIC With Tables
http://slidepdf.com/reader/full/short-conn-for-vic-with-tables 12/28
12
However, the simple opening and closing of stores does not explain the organic same-store growth experienced. The
closure of some stores would naturally bring a boost to growth, because a) positive selection (the underperformingstores get closed) and, b) CONN’s customers of a shop that closes typically move to another CONN store (60% of
repayments on credit sales take place in stores) thereby inflating like-for-like growth in the short term. However, the
closure of shops alone cannot explain the phenomenal growth in same store sales:
It’s certainly not the number of customer driving growth – the number of accounts started growing only in the last
quarter:

7/18/2019 Short CONN for VIC With Tables
http://slidepdf.com/reader/full/short-conn-for-vic-with-tables 13/28
13
Again, the real driver is higher spending per customer. This was achieved by very aggressive lending practices. This is
very clear from a number of indicators:
First and foremost, CONN aggressively pushed to finance customers that in the past the company regarded as non-
financeable:
Only 10 quarters ago, CONN financed c. 55% of customers and c. 35% were cash payers. As of last quarter, cash
payers represented only 6.5% of the total and CONN’s financed c. 80% of the total. In other words, CONN increased
sales only because they financed people than in the past were not able to purchase anything at CONN. The
distinction is not black or white – there are a number of customers that if given a cash only option would spend, say,
$300 for a TV but given the credit solution, would be happy to spend $600. The key point to highlight here is the
following: absent loose credit conditions provided by CONN’s, the customer would buy a lot less than is buying now.
It’s incorrect to think of CONN as a high growth retailer – it’s just a small retailer with a very aggressive lending
operation. Note that no one would finance these customers. GE was a traditional supplier of third party financing
and, as per chart below, their contribution to total financing continues to decline. If we were to look at CONN’s

7/18/2019 Short CONN for VIC With Tables
http://slidepdf.com/reader/full/short-conn-for-vic-with-tables 14/28
14
“pure retail” operation, i.e. excluding those sales that are financed by CONN’s own financing solutions, we’d find
what we should expect: a small and declining retail business:
Note that this was not CONN’s original strategy. In September 2011 the company showed a target for CONN’s credit
percentage of total of 55-60% and we are not at 80%!
The second compelling evidence that CONN’s is becoming increasingly aggressive in its lending practices is the fact
that provisions as percentage of average portfolio balance are increasing at a worrying pace:

7/18/2019 Short CONN for VIC With Tables
http://slidepdf.com/reader/full/short-conn-for-vic-with-tables 15/28
15
The third evidence of aggressive lending practices is the constant decrease in average down payment. Whilst only 2
years ago CONN would ask some minimum 6% down payment, customers today can get away with as little as 3%.Note that as per table above, the original target in 2011 for down payment was 5-10%, not 3%! No wonder shoppers
are so keen to spend at CONN’s:
Further (damning) evidence is the fact that on average, new credit customers have much lower FICO score than inthe past:

7/18/2019 Short CONN for VIC With Tables
http://slidepdf.com/reader/full/short-conn-for-vic-with-tables 16/28
16
CONN’s is knowingly and willingly extending credit to customers that have a lower likelihood to pay their debt and
whom in the past, under previous management, have been turned down by the company. These are facts that the
company wouldn’t contest. The move from a weighted average origination credit score of above 625 in Q2 2012 to
less than 600 as of latest quarter may appear insignificant but it’s really material. The CFPB published an analysis of
expected default rates against fico scores:
As per chart above, the FICO Score group 620-629 has an average default risk of c. 15-20%. The group 590-599,
which is where the average new CONN’s customer would be as of last quarter, has an average default risk of c. 25%.
The deterioration of customer quality in recent quarter is very material, even though we don’t see it yet in
delinquencies.

7/18/2019 Short CONN for VIC With Tables
http://slidepdf.com/reader/full/short-conn-for-vic-with-tables 17/28
17
The company would try to argue that the average credit score still looks reasonable (as average FICO score of the
portfolio doesn’t look too bad). The problem is that this is a lagging indicator. If one extends credit to lower credit
customers, the average credit score balance will ultimately go down over time.
There is a further very interesting aspect to the story that the market doesn’t seem to have picked up. Amongst
aggressive actions undertaken by CONN to boost customer spending, the company increasingly reverted to the use
of “promotional activity”. These activities create a separate class of receivables defined as “promotional
receivables”. These receivables are generated by sales generated under promotional programs that include “the use
of discounts, rebates, product bundling and no-interest financing plans”. These programs are obviously targeted by
that part of the population most sensitive to no-interest financing plans – those with lowest FICO scores and hence
with the highest risk of non-payment. The rise of receivables under promotional activity in our view is very
concerning:
Today, c. 1/3 of total outstanding receivables is represented by promotional receivables. Note that we are talking
about an actual balance, which is a lagging indicator of actual promotional sales. We believe promotional sales are
now close to 40% of total sales, up from 10% 2 years ago. This a further proof of the degree of aggressiveness from

7/18/2019 Short CONN for VIC With Tables
http://slidepdf.com/reader/full/short-conn-for-vic-with-tables 18/28
18
CONN’s management in pushing its sales with loose financing practices. Whilst from an accounting perspective there
is no difference between a normal sale and promotional sale, there is a significant cash flow difference. Sales
financed by the Company under interest-free, promotional credit programs are recognized at the time the customer
takes possession of the product. Considering the short-term nature of interest-free programs for terms less than one
year, sales are recorded at full value and are not discounted. Sales are fully recognised up-front but there is no cash
collection up-front. This will give rise to ballooning receivables and negative cash generation, as we shall see below.
Product support operationsThe company has 2 separate support operations, one to the retail segment and one to the credit segment. These 2
operations are relatively small but very important in terms of margin contribution.
The first support operation to the retail business is the sale of repair service agreements. In FYE 2013 customers
purchased repair service agreements that CONN’s sells for third-party insurers on products representing
approximately 58% of total products. This is virtually 100% margin business as CONN’s takes a commission on the
sale of the service agreement at the time of sale or when a service agreement is renewed / extended. Until March
2012, the company was the obligor of such contracts, so they were on the hook for costs of repairs. Since March
2012, the company started selling renewal programs through an unaffiliated third-party insurer and receives acommission on the sale of the contract, which is recognized in revenues during the period the contract is sold. The
proportion or service maintenance agreement sale of total retail sales has grown over time but its overall
contribution to margins remained stable at around 20%.
The second support operation is the sale of credit insurance and it’s directly related to the credit financing activity
that CONN’s offers its customers. The company offers basic payment protection insurance products including credit
life, credit disability, credit involuntary unemployment and credit property insurance. CONN’s receives sales
commissions from the unaffiliated insurance company at the time they sell the coverage, and then receives
retrospective commissions, which are additional commissions paid by the insurance carrier if insurance claims are
less than earned premiums. During fiscal 2013, approximately 84.8% of CONN’s credit customers purchased one or
more of the credit insurance offered, and approximately 21.6% purchased all of the insurance products offered. The
proportion of insurance sales commission of total credit sales increased dramatically over the last 2 years. Because
these sales carry virtually 100% margin (there are no costs associated because it’s a straight commission from third
party insurance provider and it’s attached to credit sales so there is no material additional workforce required), its

7/18/2019 Short CONN for VIC With Tables
http://slidepdf.com/reader/full/short-conn-for-vic-with-tables 19/28
19
proportion of overall credit margin increased dramatically in recent years and now accounts for almost half of the
profits generated in the credit segment.
Whilst there is nothing particularly sinister per se in the growth of these 2 credit support operations, it does suggest
the company stepped up its effort to cross-sell higher margin, non-core products above and beyond what it used to
do in the past. This could turn out to be a dangerous game. Regarding the sale of extended service warranties, CONN
got in trouble before. Back in 2009, CONN had to settle for $4.5m a long lasting claim against them with the Texas
Attorney General’s office that claimed CONN relied on aggressive and deceptive sales tactics to build its sales of
extended service warranties for its products. CONN back then agreed to provide greater disclosure of warranty
conditions but it appears under new management, CONN is going back to its old ways. Regarding the sale ofinsurance products, this is a very hot topic in the US and we expect a major regulatory step up on the scrutiny of
these practices. The Consumer Financial Protection Bureau is closely monitoring these activities and already inflicted
numerous fines to operators that abused consumers ignorance to “stuff them” with useless, over-priced insurance
products. Whilst the short thesis does not rely on any type of regulatory action in the industry, we would simply
point out that these support operations represent well over 50% of group EBIT under a number of assumptions we
shall outline below. This is has a very important implication: because of the nature of these activities and the risks
associated, even assuming no regulatory action, one should apply a completely different valuation to such business
compared to a traditional high growth retailer.
Room for expansion
Part of the bull case lies in the idea that CONN’s model can be replicated across America. At the moment, the vast
majority of CONN’s operation takes place in Texas and Louisiana. Short term plans are focused on expansion in
adjacent states. Long term, the company targets a total of 200 shops across the US, i.e. more than doubling from
current count:

7/18/2019 Short CONN for VIC With Tables
http://slidepdf.com/reader/full/short-conn-for-vic-with-tables 20/28
20
We see this as highly unlikely for a simple reason. Texas was historically the best market for CONN’s because it has
the worst credit score in the US. CONN’s only competitive advantage today is the fact they are extending credit to
people that shouldn’t be buying those goods in the first place. In richer states, they cannot compete with large big
box retailers or with Amazon. As per chart below, Texas and Louisiana are the 2 perfect states for CONN’s. It would
be very hard to see them penetrating in states with higher credit score:
Store economicsThe other reason we don’t believe CONN’s will be successful in aggressively expanding its footprint is because we
don’t believe their store economics. The company assumes “average unit revenue of approximately $14.0 million in
the first 12 months and an average net initial cash investment of approximately $1.0 million which includes$850,000 of average build-out costs, including equipment and fixtures (net of landlord contributions), and

7/18/2019 Short CONN for VIC With Tables
http://slidepdf.com/reader/full/short-conn-for-vic-with-tables 21/28
21
$150,000 of initial inventory (net of payables)” . Such assumptions would lead to a “cash on cash” return of 200%
and 6 months payback. This makes little sense to us. First and foremost, does it make sense to have a store
economics that would allow a 6 months payback on $1m investment? Why wouldn’t anyone else try to replicate this
model? Note that CONN’s has no identifiable competitive advantages (brand, product exclusivity, scale) other than
extending very cheap credit to its customers. CONN’s current valuation implies an Enterprise Value per store of
approximately $45m. Does it make sense to assign a value of $45m per shop when the capital invested to open it is
just $1m?
See below company-assumed store economics:
The other obvious issue here is that such illustrative store economics doesn’t take into account the fact that the
company has to finance its customers. The “Average Total Sales” reported above is non cash as most customers
purchase their goods with CONN’s own credit solutions. The result is a “cash on cash” actual return that looks a lot
different from the picture above. In fact, if one includes financing of customer receivables, the “cash on cash” return
may well be negative.
Cash flow issues and debtAs every retail investor would know, retail is a very capital intensive business – growth comes at a cost. Whilst true
for any retailer, for CONN’s this issue is amplified exponentially by the fact that CONN finances its own customers. If
we add to this issue the fact that CONN dramatically changed its lending practices in recent years and increased the
proportion of credit-financed sales as percentage of total retail sales, we understand why reported profitability and
cash generation started diverging considerably 2-3 years ago.

7/18/2019 Short CONN for VIC With Tables
http://slidepdf.com/reader/full/short-conn-for-vic-with-tables 22/28
22
This is not just an academic consideration on the nature of the retail industry. This is a real problem for CONN’s
going forward. From Q3 2012 to Q3 2014 generated c. $191m in negative free cash flow and this occurred whilstnumber of stores went from 71 2 years ago to 72 as of last quarter. Even without store expansion, the company
burned almost $200m in cash. If we factor in the ambitious growth plan of CONN’s for FYE Jan 2015, the situation
would look a lot worse. In fact, we think that Net Debt at the end of next financial year will exceed $700m.
CONN seems to have noticed this and was quick to renegotiate its credit agreement with Bank of America on
November 25th by increasing its available borrowing capacity by $265m to $800m. As per chart above, CONN will
need virtually all of it in order to achieve its short term growth ambitions. It’s also interesting to note the sharp
deterioration of credit book and collection statistics, which are related to the credit agreement renegotiation. 1
quarter ago, the cash recovery percentage (which is calculated monthly on a training 3 months basis as payments
received on customer receivables over outstanding balance) was 6.19%. As of last quarter, it fell to 5.24%. CONN
always had a minimum cash recovery monthly covenant of at least 4.74%. With this new agreement, it was lowered
to 4.50%. It seems clear CONN felt the need of more breathing room as the collection statistics are deteriorating. We
would note that even though EBITDA growth is accelerating, leverage expressed as Net Debt / EBITDA is not really
going down and we expect it to be above 2.5x by the end of next year. This is something investors should be veryweary of as any deterioration of the business will cause a massive correction in the stock price given the leverage.

7/18/2019 Short CONN for VIC With Tables
http://slidepdf.com/reader/full/short-conn-for-vic-with-tables 23/28
23
This is particularly true for a retailer that has no hard assets whatsoever – all of its shops are leased. If anything, the
business model is inherently operationally leveraged given its long term lease commitments. The average monthly
rent according to company filings is c. $23,500. This implies c. $22m of annual rent commitment that the company
can’t get away from cheaply if things deteriorate.
Insiders selling
Both company and insiders are selling shares. The Stephen’s family, the largest shareholder, in the last year alonedisposed of almost half of their holdings in the company (realising c. $175m) and so did a number of other insiders.
Interestingly though, nobody sold any shares in the last 6 months.
The company itself (the biggest insider of all) is a serial issuer of shares:
Slicing and dicing CONN’s We tried to step back and think about the best way to look at CONN. Is it a specialty retailer? Is it a commoditised big
box retailer? Is it a subprime lender? In order to answer these questions, we tried to attribute CONN’s reported
profitability to its various segments. The company reports under “Retail” and “Credit” segments. We think there are
further classifications which would be helpful for an investor.
Within “retail”, we distinguish 3 different businesses:
1.
A traditional retailer – very similar to the Lowe’s, Sears of this world 2. A specialty retailer that has as its unique distinguishing characteristics the fact that it lends its own
customers money to purchase goods in its stores and takes over the credit risk on the customer
3. An agent that acts on behalf of 3rd parties in selling service agreements, taking a commission from these
sales
Within “credit”, CONN’s has effectively 2 separate businesses:
1. A traditional subprime lender – very similar to Credit Acceptance Corp or World Acceptance Corp
2. A distributor of payment protection and other insurance policies

7/18/2019 Short CONN for VIC With Tables
http://slidepdf.com/reader/full/short-conn-for-vic-with-tables 24/28
24
In allocating profitability to these 5 different we had to make a few assumptions. The key assumption was that gross
margin on financed sales would be higher than on traditional cash / GE financed sales. This seems to be a reasonable
assumption.
As for SG&A costs, we allocated them in proportion to revenue contribution. We did same type of allocation in the
credit segment.
The results are telling: CONN is first and foremost an insurance / repair guarantees distributor. They derive over 50%
of their EBIT from these operations. Its retail operation is viable only because of aggressive lending practices. We
estimate that the traditional retail activity (i.e. the one that doesn’t require CONN’s own financing) is actually loss
making:
Valuation Considerations
Valuing CONN’s is extremely difficult because a) as highlighted above, it’s more a subprime lender than a retailer
(think of WLRD or CACC) and hence should attract similar multiples (WRLD and CACC trade on 10-12x P/E Vs CONN
20x forward) and, b) current reported numbers are inflated by CONN’s loose lending practices that cannot continue
forever. Moreover, CONN is becoming a much leveraged company and if retail sales start going down, earnings will
fall rapidly and multiple valuation would quickly contract. To attribute different multiples to each segment is also a
bit of an academic exercise as the operations are very much interconnected. We therefore took a very simple
approach and looked at 3 valuation metrics:
Pro forma EBIT split 2014E (%) MarginRetail operations: 125 73% 12%
Of which: CONN's financed sales pure retail 70 41% 21%
Of which: cash / 3rd party financed sales pure retail (8) -5% -12%
Of which: service agreements 63 37% 75%
Credit operations 45 26% 22%
Of which: traditional credit sales 16 9% 10%
Of which: credit insurance sales 29 17% 63%
Total EBIT 171 100% 14%
of which: "support operations" 93 54%

7/18/2019 Short CONN for VIC With Tables
http://slidepdf.com/reader/full/short-conn-for-vic-with-tables 25/28
25
1. EV / Sales – Because of the extraordinary margin volatility and the excess margin that CONN is currently
earning, we look at what was the average EV / sales over time and apply it to CONN’s forward sales
estimate. As per chart below, in the last decade, EV / sales fluctuated between 0.5x and 1.0x before shooting
up in the last 2 years. We therefore assumed a fair multiple of 1.0x sales at the high end of the range
2. Price to book - we think it’s a relevant metrics because most banks / payday lenders get valued on P/Book
basis. It’s very hard to come up with a precise figure also because CONN’s current book value may well be
inflated. Until December 2007, CONN traded on a P/Book multiple of c. 2x. During the recession it fell to as
low as 0.5x. We think 2-3x is a generous valuation for this kind of business. For our valuation purposes we
assumed 2.5x.
3. Forward P/E – this valuation metric is very tricky because we need to “normalise” earnings to reflect normal
earning power of this business. We don’t believe the 15% EBIT margin assumed for 2015 is sustainable.
Looking at CONN’s 10 year history, ignoring the recession period, EBIT margin moved in a narrow 7-10%
range. Let’s assume a “normalised” 9% EBIT margin which we think is generous. On the net income resulting

7/18/2019 Short CONN for VIC With Tables
http://slidepdf.com/reader/full/short-conn-for-vic-with-tables 26/28
26
from such margin, we apply what we consider a generous 15x forward P/E multiple. From a historical
perspective it appears quite generous as CONN’s rarely traded above 15x forward except for in the last year:
Our findings are summarised below. On average, we come out with a fair share price of around $30, or c. 60% below
current levels:
Timing and triggers
As with many other shorts, timing is probably the key issue with CONN. The thesis highlighted above was probably
just as valid a year ago and the stock rallied 150%. It can be very expensive being too early on this one. The long
thesis at this point is pretty simple: CONN is shifting from no-growth, low-margin retailer to a growing, specialised
retailer exhibiting explosive margin growth. I doubt even the most bullish investors currently see a share price above
$100, or on 25x forward earning. The risk for the shorts is that over time EPS growth will continue at 20%+ pace
beyond 2015 without any multiple compression, with the stock price appreciating annually in line with its earnings
growth.
We believe it will be very hard for CONN’s to sustain such same store growth, which is driving the margin expansion,
as well as continue its ambitious stores rollout plan. This is based on the following considerations:
1.
From a purely mathematical standpoint, there is little room for CONN’s credit to expand further. Theyalready represent 80% of total retail sales and we think they are reaching a ceiling. Cash payers now only
2015E Target 2015E Target
1. EV / Sales multiple 3. Forward P/E
Sales 1,696 1,696 Sales 1,696 1,696
EV / sales 2.1x 1.0x EBIT margin 15.3% 9.0%
EV 3,605 1,696 EBIT 260 153
Less: Net Debt (719) (719) Less: interest (24) (24)
Equity value 2,886 976 PBT 236 129
Number of shares 37 37 PAT 151 82
Equity value - per share $78 $26 Number of shares 37 37
Downside (%) -66% EPS $4.1 $2.2
P/E 19x 15x2. P / BOOK Equity value - per share $78 $33
Book value 2014 592 592 Downside (%) -57%
P / Book 4.8x 2.5x
Fair equity value 2,862 1,480 Total Average of 3
Number of shares 37 37 Equity value - per share $78 $33
Per share $78 $40 Downside (%) -57%
Downside (%) -49%

7/18/2019 Short CONN for VIC With Tables
http://slidepdf.com/reader/full/short-conn-for-vic-with-tables 27/28
27
represent 6.5% of total from 31% in 2011. We are almost at the absolute minimum. As we’ll anniversary
similar YoY comparison in terms of CONN’s credit percentage of payment option, we expect same store sales
to flatten out. We believe the company started to realise this and signalled it to investors when they gave
guidance for 7-12% same store growth in 2015 down from 25%+ in 2014
2. At the end of next financial year (January 2015) the company will have, according to our estimates, Gross
Debt in Excess of $700m. Current renegotiated credit facility has an absolute maximum of $800m. We expect
the company to have negative free cash flow in excess of $200m. At this pace, in little over a year, the
company will run out of money and may have to do a large rights issue
3. At the moment the company managed to keep bad debt provisions down but as the average quality of the
credit portfolio decreases, it’s going to start impacting reported earnings. Q2 2013 results were a tad below
expectations because of a glitch in the systems behind their debt collection programme. Even though the
issue was clearly temporary, the stock was down almost 25% in the following 2 days. Investors do pay
attention to this
4. While we don’t count on them, regulatory actions by the likes of CFPB on payment protection insurance and
other misleading practices are more than a remote possibility and would have a massive negative impact on
CONN’s operations
5. We believe we are very close to a ceiling in terms of gross margins, even assuming CONN’s aggressive
lending practices will continue in the short term. The company signalled this rather explicitly in its most
recent Q3 conference call: “The company set a longer term goal of 40% retail segment gross margins” , which
is already baked in its FYE Jan 2015 guidance, implying that 2016 over 2015 we shouldn’t expect further
gross margin expansion
6. We think the company reched a ceiling in terms of promotional activity, which has been an important driver
of growth to date. As per latest conference call: “We do not expect the relative mix of promotional
receivables to increase substantially in future periods”
7. Market becoming more rational on the name – not counting on that!

7/18/2019 Short CONN for VIC With Tables
http://slidepdf.com/reader/full/short-conn-for-vic-with-tables 28/28
Summary financials
FYE January 2009 2010 2011 2012 2013 2014E 2015E
Share price $78.00 $78.00 $78.00 $78.00 $78.00 $78.00 $78.00
Number of shares 22.9 25.1 26.1 32.4 33.2 36.7 37.0
Market Cap 1,783.0 1,956.3 2,034.9 2,530.5 2,585.8 2,861.9 2,886.0
Net Debt 51.1 440.1 362.8 314.7 291.2 510.7 719.4
Shareholders equity 334.2 333.5 352.9 353.4 474.5 592.0 743.0
EV 1,834.1 2,396.4 2,397.6 2,845.2 2,877.0 3,372.6 3,605.4
Revenues 915.3 887.1 808.9 792.0 865.1 1,205.7 1,695.6
Growth (%) -3.1% -8.8% -2.1% 9.2% 39.4% 40.6%
EBITDA 81.6 59.1 54.2 70.1 114.1 185.3 275.8
EBIT 69.0 44.2 36.7 52.2 100.2 170.3 260.0
EBIT Margin (%) 7.5% 5.0% 4.5% 6.6% 11.6% 14.1% 15.3%
PBT 66.9 22.3 8.3 29.7 83.2 155.9 236.0
Net income 42.4 13.2 4.3 16.3 52.9 99.7 151.0
EPS adjusted $1.16 $0.17 $0.16 $0.50 $1.60 $2.72 $4.08
EPS annual growth (%) -85.2% -4.2% 206.3% 217.0% 70.3% 50.3%
Consensus EPS $2.77 $3.96
Net Debt / EBITDA 0.6x 7.5x 6.7x 4.5x 2.6x 2.8x 2.6x
FCF (60.3) (42.1) 151.4 60.1 (32.3) (238.5) (208.7)
P/Book 5.3x 5.9x 5.8x 7.2x 5.5x 4.8x 3.9x
EV / sales 2.0x 2.7x 3.0x 3.6x 3.3x 2.8x 2.1x
EV / EBIT 26.6x 54.2x 65.3x 54.5x 28.7x 19.8x 13.9x
P/E 67.2x 454.5x 474.6x 155.0x 48.9x 28.7x 19.1x
FCF yield -3.4% -2.2% 7.4% 2.4% -1.2% -8.3% -7.2%