Embed Size (px)
Citation preview
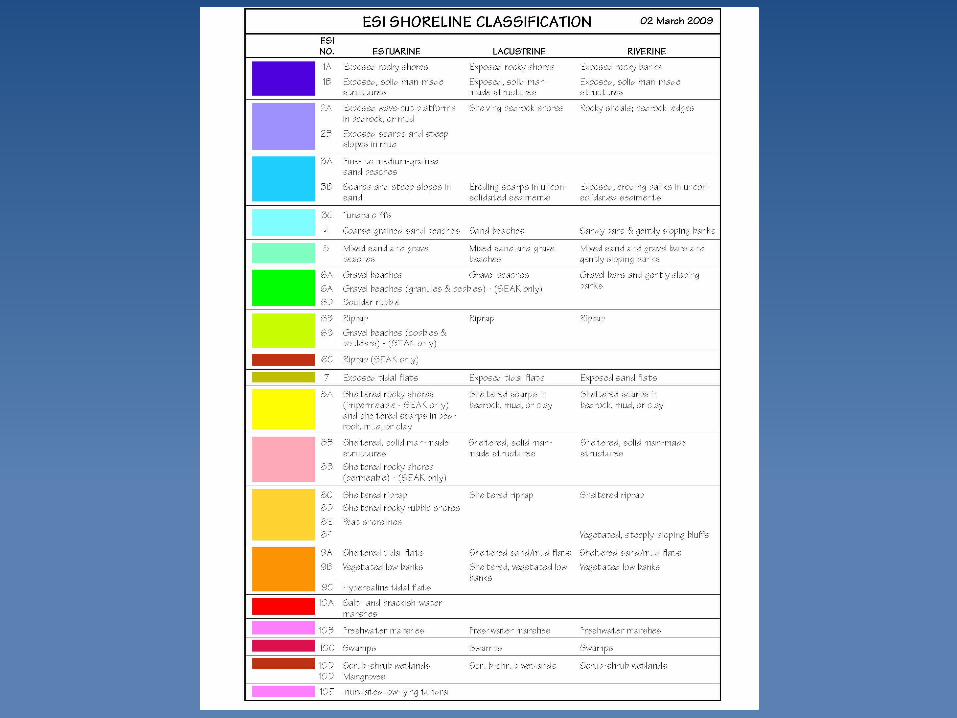
Shoreline Classification
Research Planning, IncMay 1, 2012
ESI workshop, Mobile Alabama
Outline
• ESI concept
• Current production process
• Challenges
• Relevant programs and standards
Core Concepts
• A consistent classification of shoreline morphology / habitat
• Focus on oil spill response
• National standard (arctic to tropical) with ~35 year history
• Primarily linear shoreline segments, with limited polygonal features
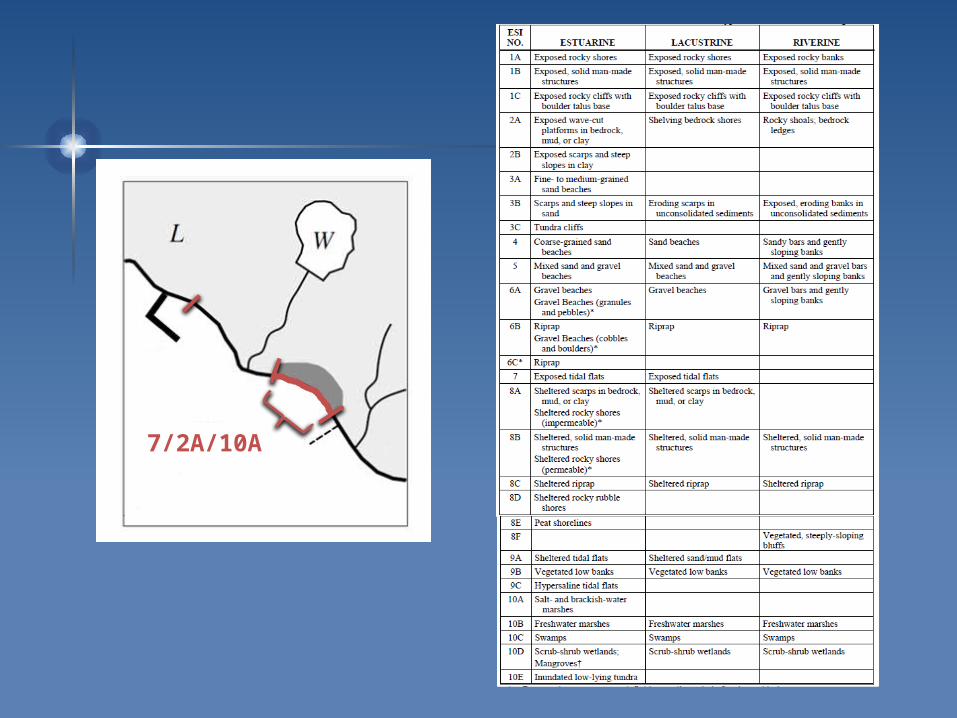
7/2A/10A
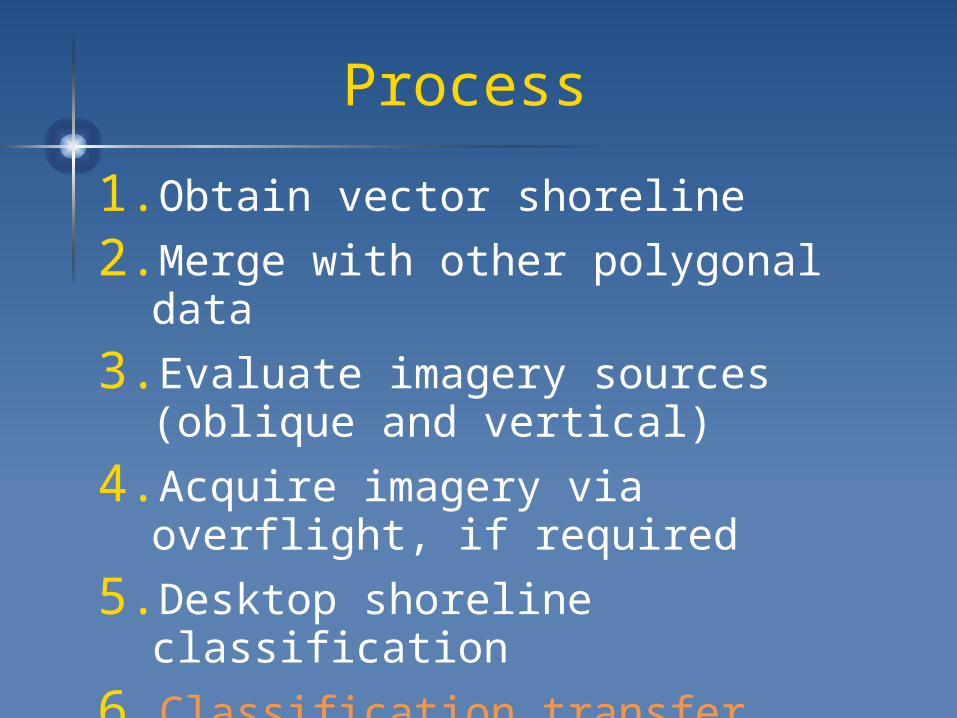
Process
1. Obtain vector shoreline
2. Merge with other polygonal data
3. Evaluate imagery sources (oblique and vertical)
4. Acquire imagery via overflight, if required
5. Desktop shoreline classification
6. Classification transfer
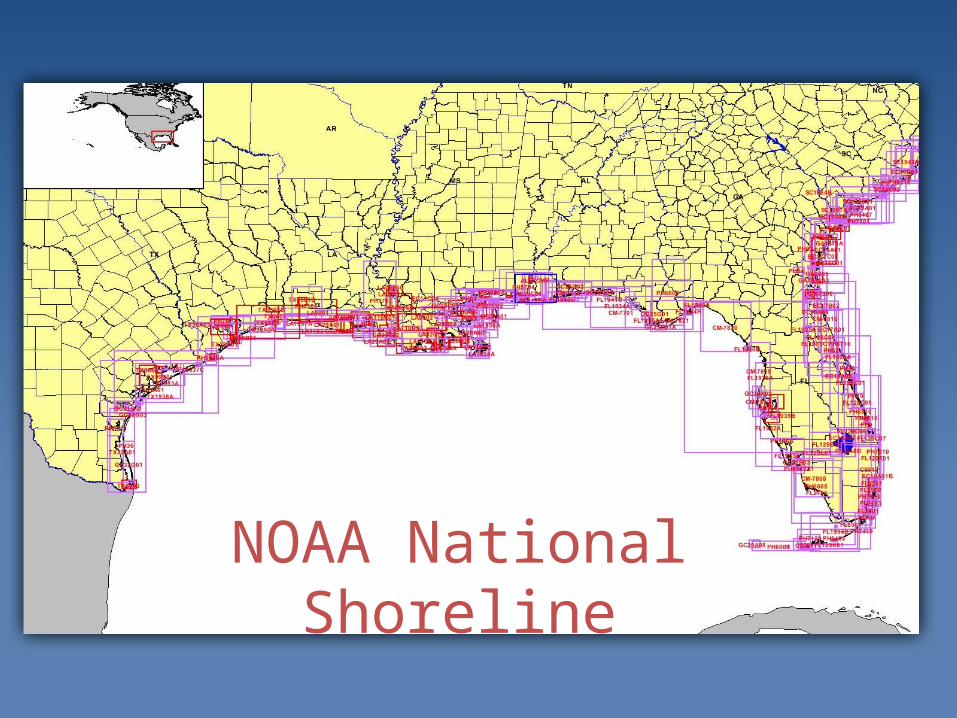
NOAA National Shoreline
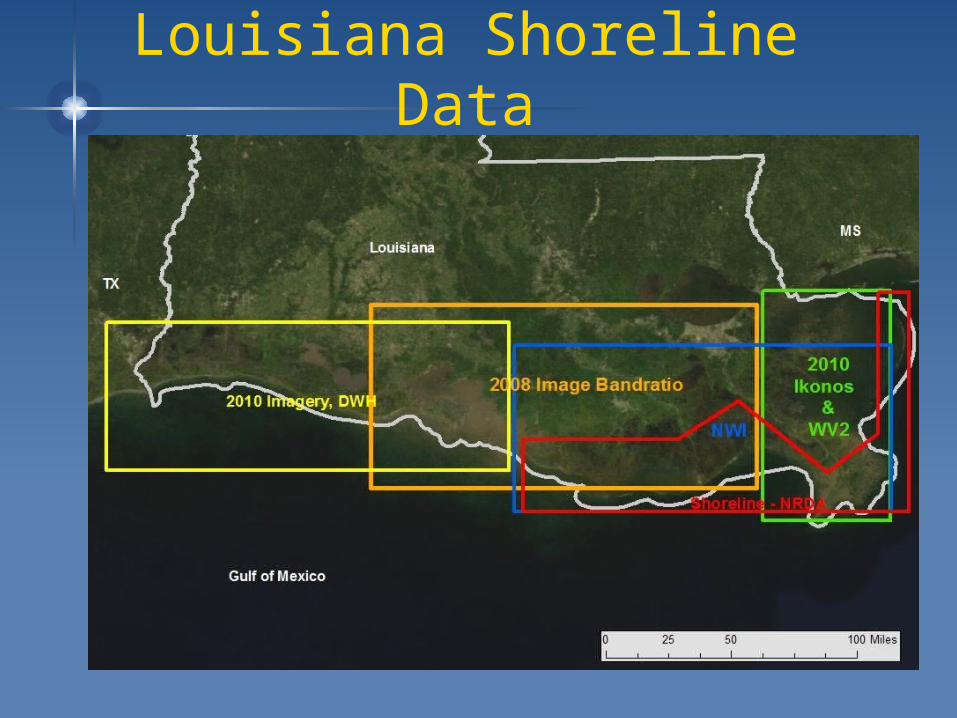
Louisiana Shoreline Data
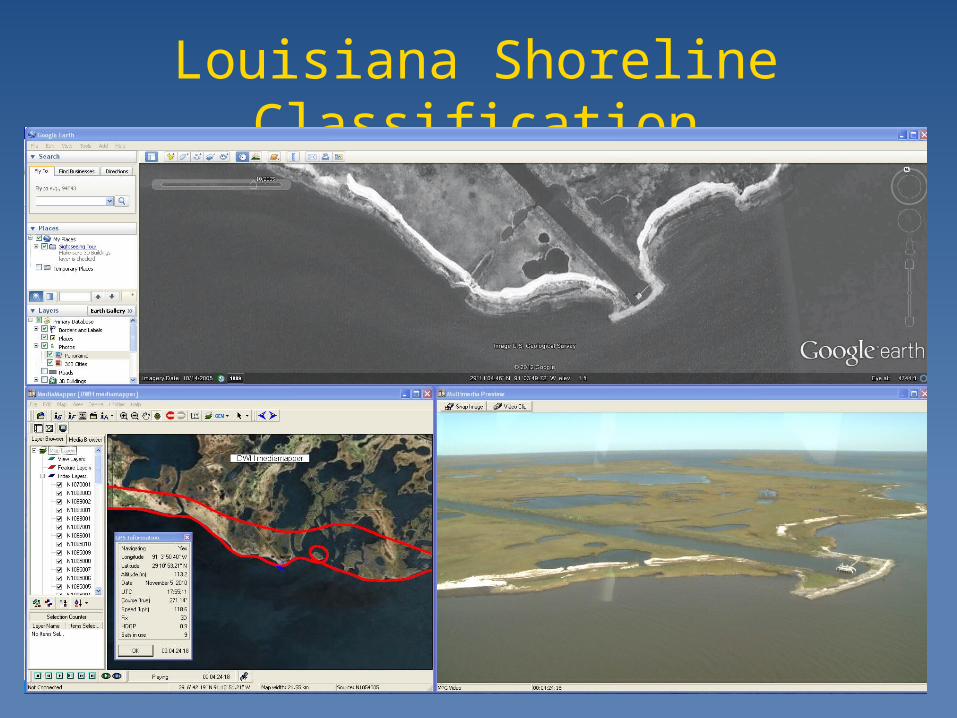
Louisiana Shoreline Classification
Adjacent Habitats
• Polygonal habitats that are included as part of the maps and integrated with the shoreline classification
• Intertidal and Benthic : wetlands, tidal flats, reefs, SAV beds
• Sources: many, primarily NWI, or other more recent, state or regional datasets
Imagery Sources
Vertical• State/county provided
image web services (e.g. FWC Image Server)
• Google Earth/Maps
• USGS/NAIP
Oblique• Bing Imagery
• Licensed Pictometry
• NGOs
• Acquired for project
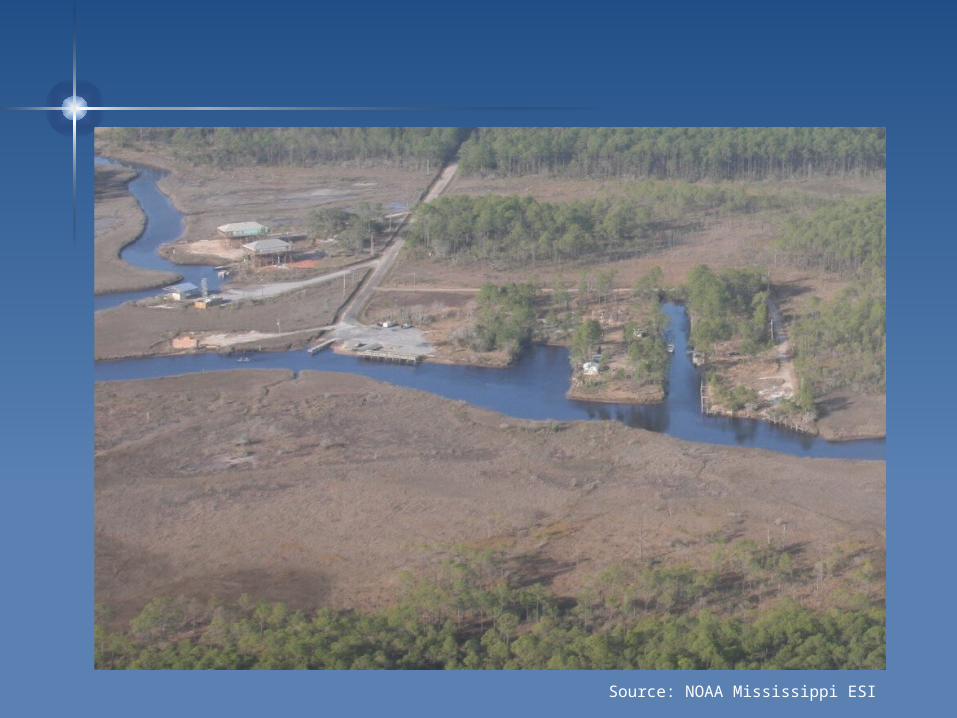
Source: NOAA Mississippi ESI
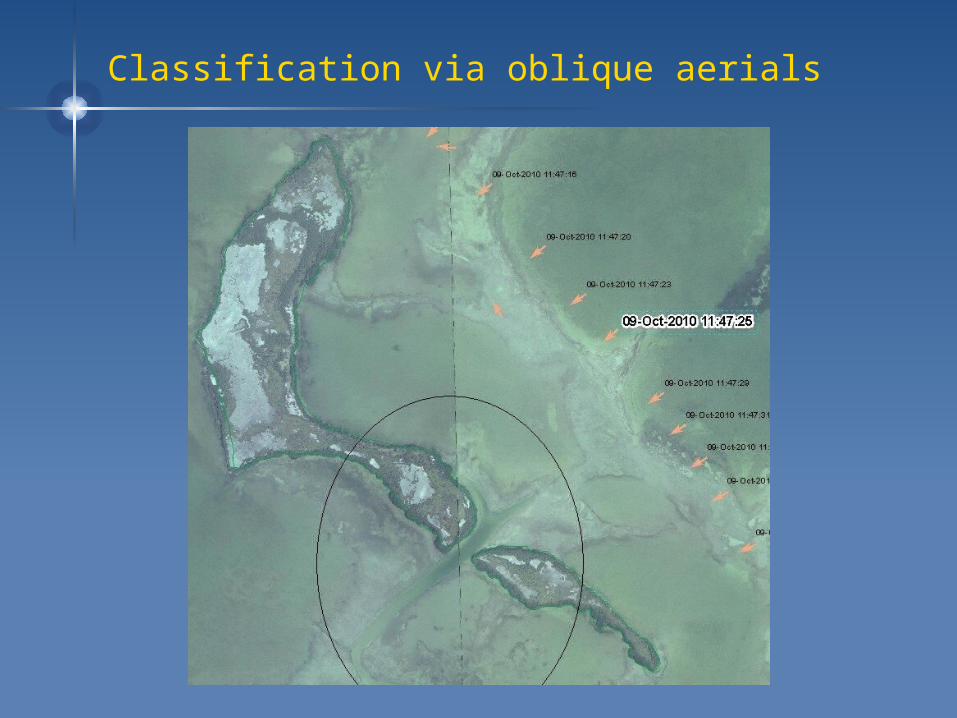
Classification via oblique aerials
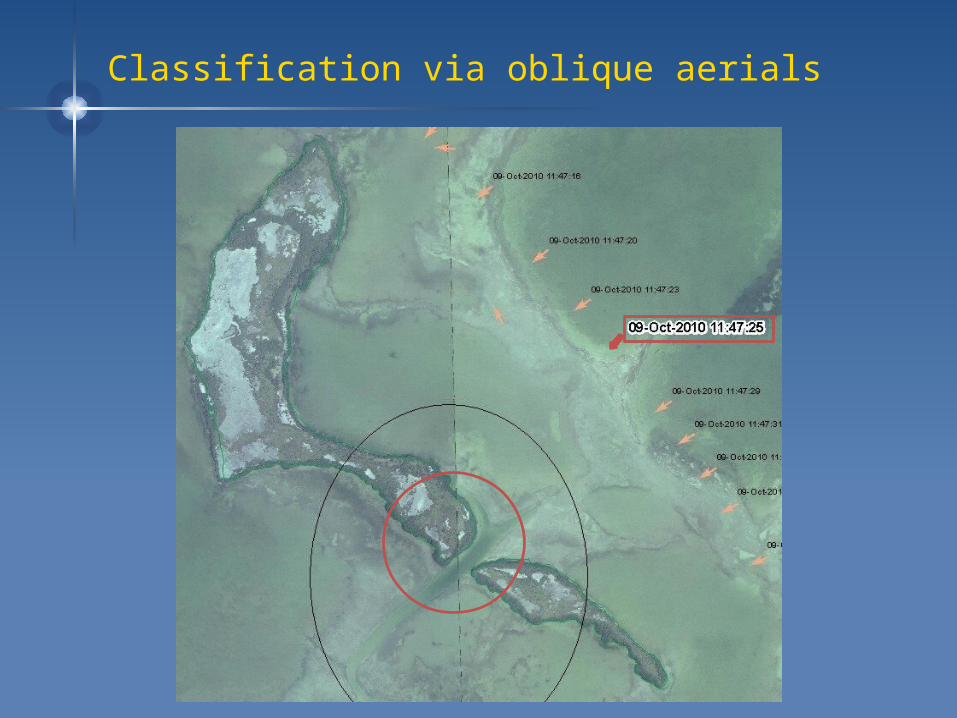
Classification via oblique aerials
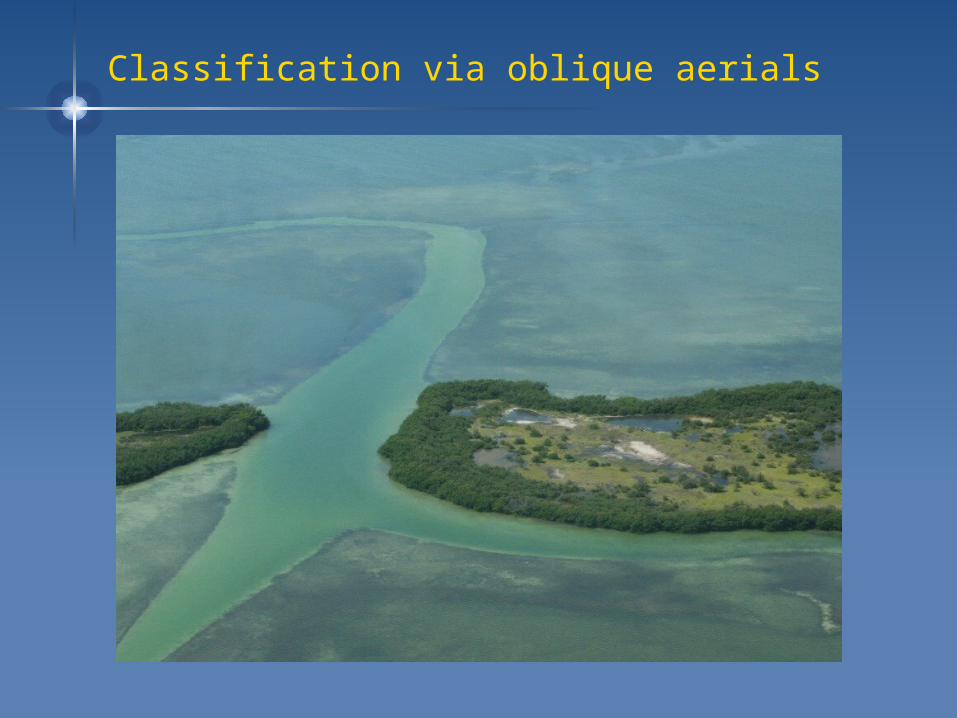
Classification via oblique aerials
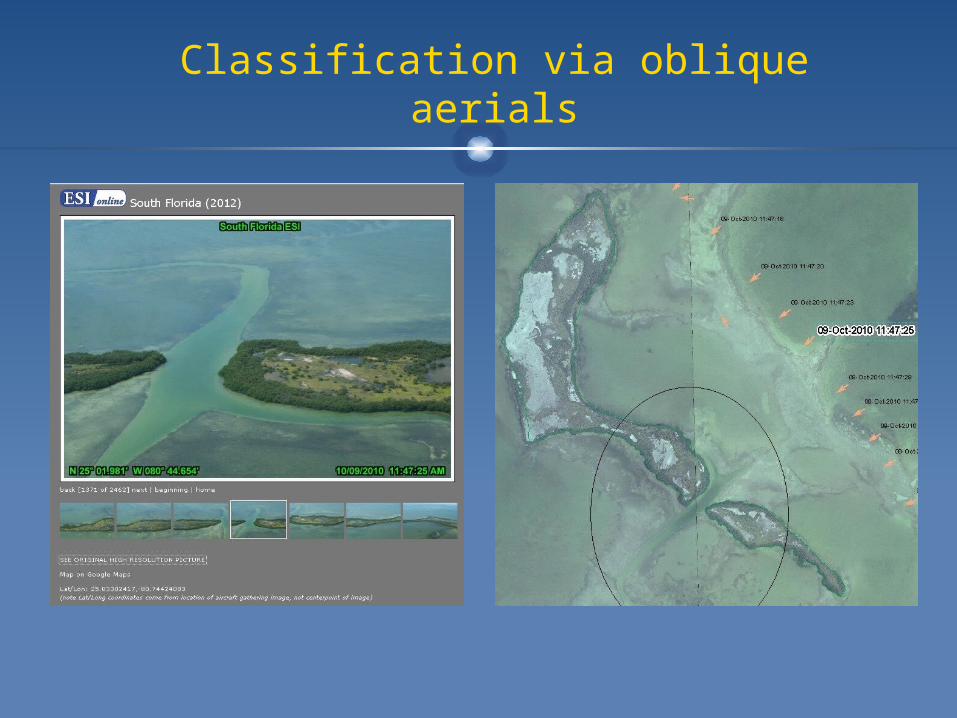
Classification via oblique aerials
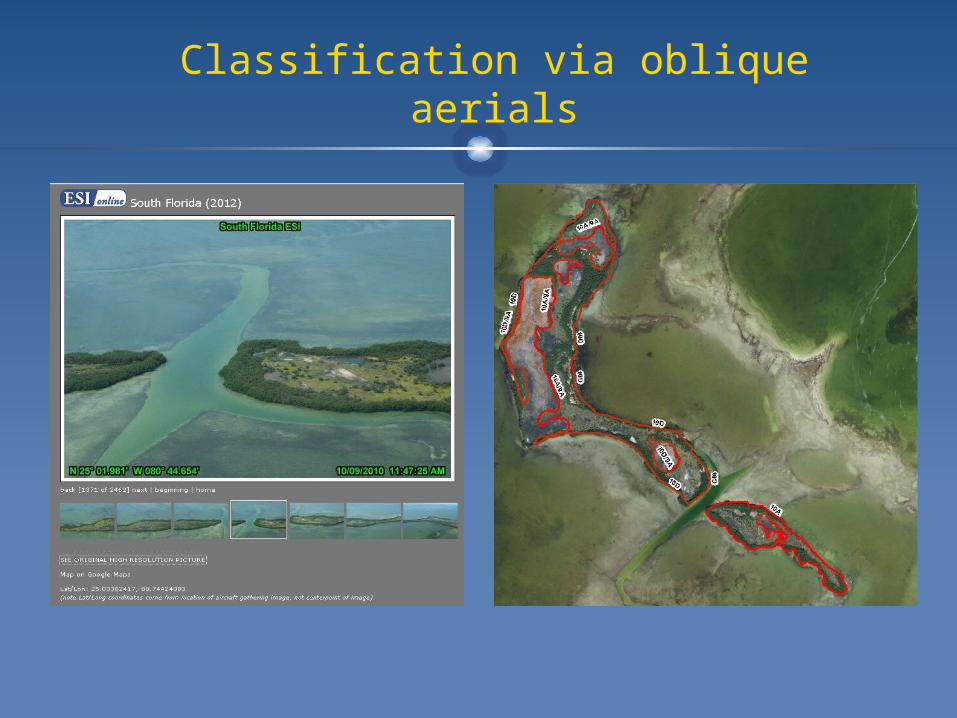
Classification via oblique aerials
Challenges
• Shoreline geometry / integration
• Classification flexibility
• Minimum mapping unit (MMU)
• Regional differences
• Sensitivity vs. Morphology

Challenges – Geometry Matching

Challenges – Classification Flexibility
• Three releases of the NOAA ESI Guidelines: 1992, 1997, and 2002.
• Limited opportunities for updating or changing standard
• Sensitivity and morphology are inseparable
Challenges – Minimum Mapping Unit
• Minimum Mapping Unit (MMU) is the smallest alongshore length of shoreline mapped as separate segment
• In the past, driven by hardcopy map scale
• Use of digital data in multi-scale environments and increasing urbanization/fragmentation of shoreline environments
Challenges – Regional Differences
• Atlases compiled by states or region, but using a national classification standard.
• Exposure: Are “Exposed” and “Sheltered” defined in the same way across atlases?
• Does sensitivity of a given morphology change from region to region?
Relevant Programs and Standards
• ShoreZone
• Coastal and Marine Ecological Classification System (CMECS)
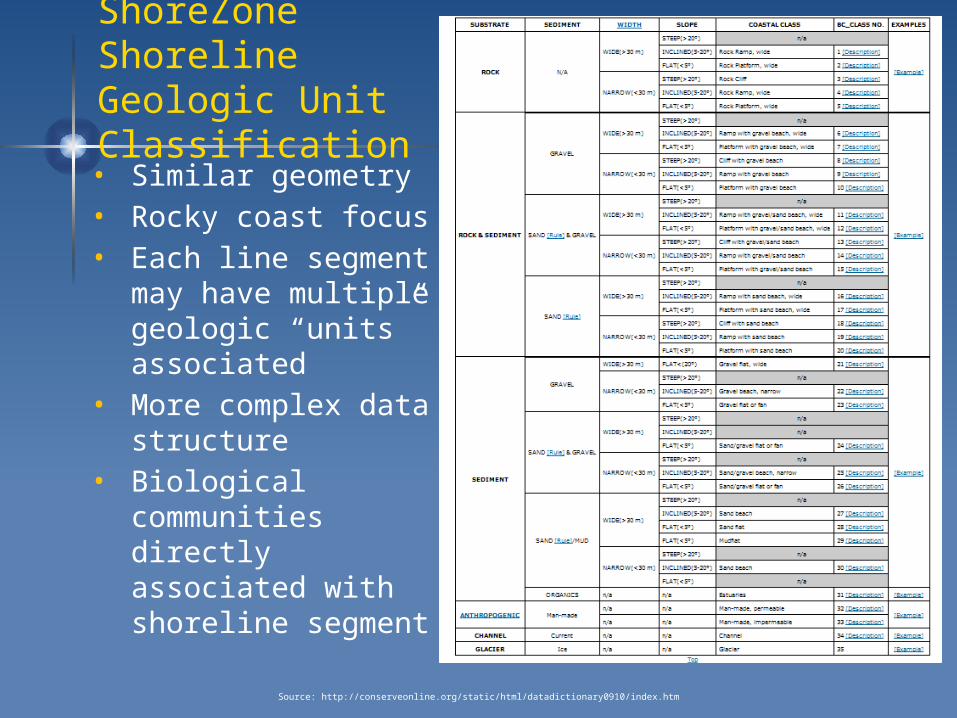
• Similar geometry• Rocky coast focus• Each line segment
may have multiple geologic “units” associated
• More complex data structure
• Biological communities directly associated with shoreline segment
ShoreZone Shoreline Geologic Unit Classification
Source: http://conserveonline.org/static/html/datadictionary0910/index.htm
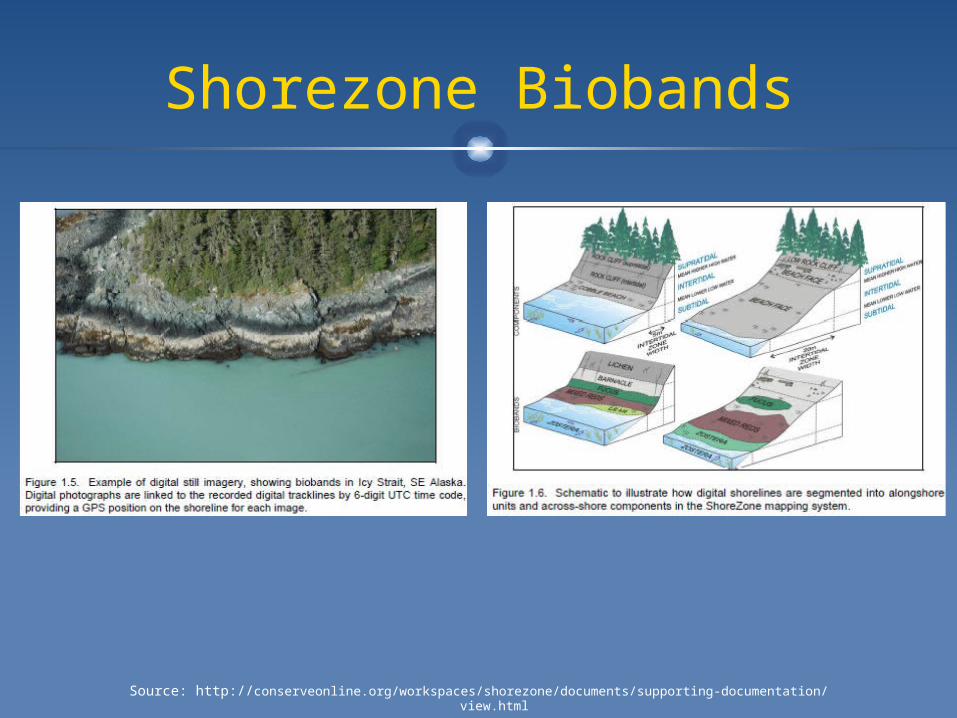
Shorezone Biobands
Source: http://conserveonline.org/workspaces/shorezone/documents/supporting-documentation/view.html
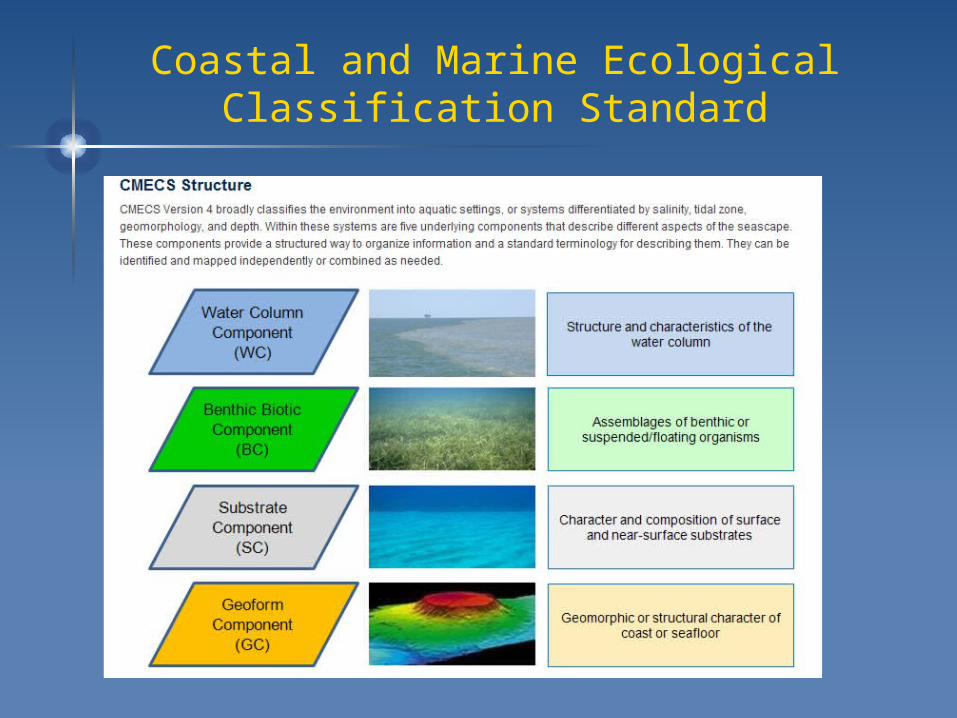
Coastal and Marine Ecological Classification Standard
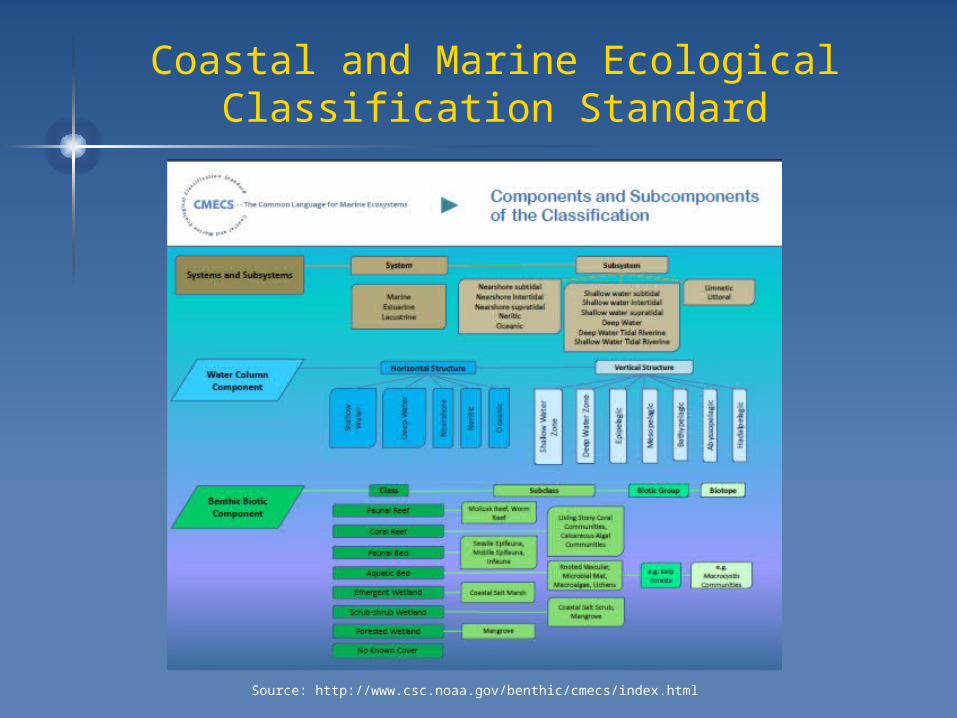
Coastal and Marine Ecological Classification Standard
Source: http://www.csc.noaa.gov/benthic/cmecs/index.html
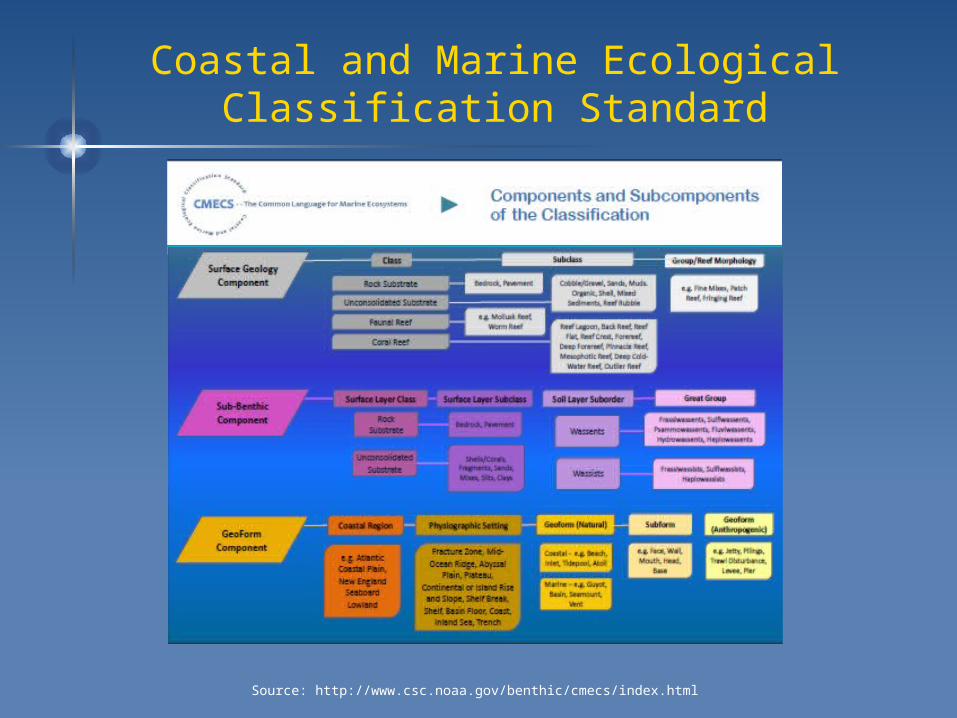
Coastal and Marine Ecological Classification Standard
Source: http://www.csc.noaa.gov/benthic/cmecs/index.html
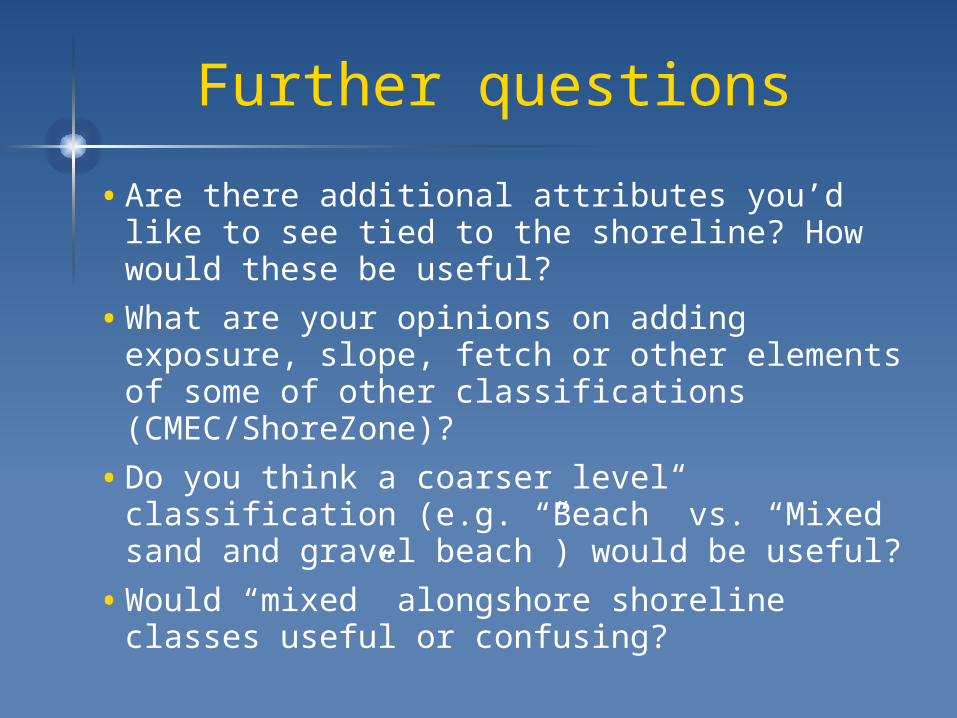
Further questions
• Are there additional attributes you’d like to see tied to the shoreline? How would these be useful?
• What are your opinions on adding exposure, slope, fetch or other elements of some of other classifications (CMEC/ShoreZone)?
• Do you think a coarser level classification (e.g. “Beach” vs. “Mixed sand and gravel beach”) would be useful?
• Would “mixed” alongshore shoreline classes useful or confusing?
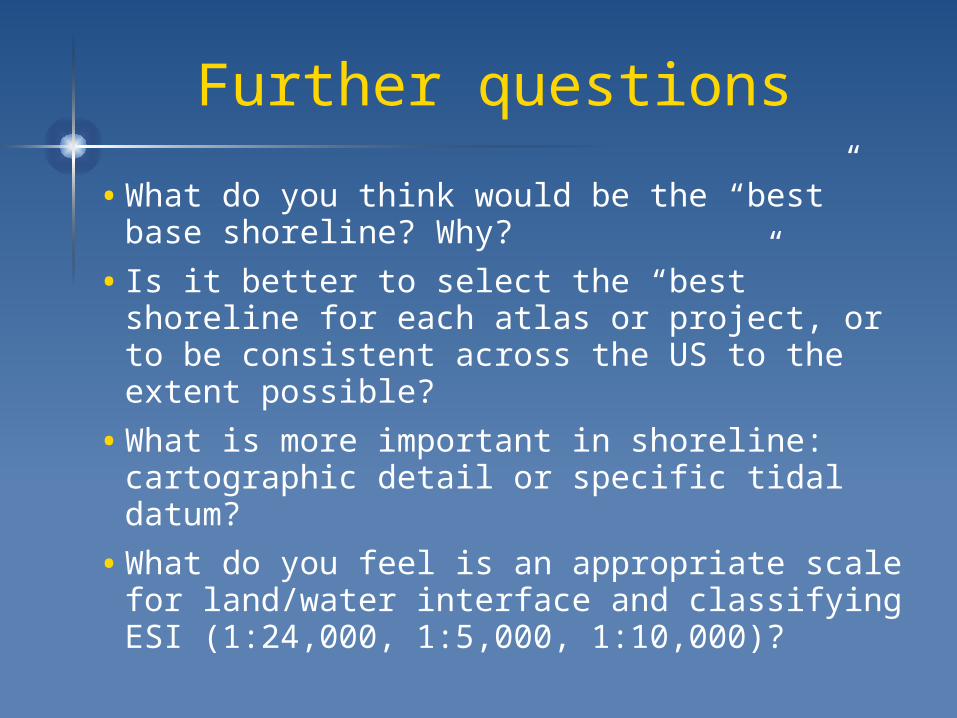
Further questions
• What do you think would be the “best” base shoreline? Why?
• Is it better to select the “best” shoreline for each atlas or project, or to be consistent across the US to the extent possible?
• What is more important in shoreline: cartographic detail or specific tidal datum?
• What do you feel is an appropriate scale for land/water interface and classifying ESI (1:24,000, 1:5,000, 1:10,000)?
Further questions
• Would you use oblique still imagery for other projects/applications?
• How important is image quality (weather, lighting distance) vs. coverage and cost?
• Would video or video stills be more useful for other applications?
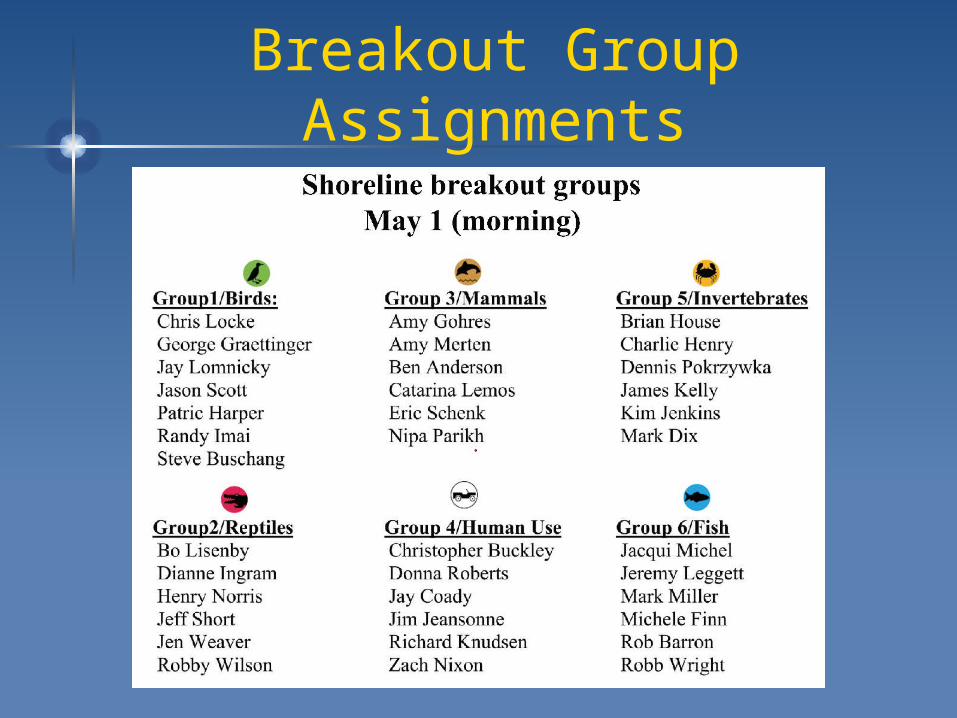
Breakout Group Assignments