Embed Size (px)
DESCRIPTION
Current Status of Acute Myeloid Leukemia in China Jianxiang Wang Institute of Hematology Hospital of Blood Disease Chinese Academy of Medical Sciences. AML Prognosis Factors (Shang Hai/Zhe Jiang Institute of Hematology ). Shen Y et al. Blood 2011;118:5593-5603. - PowerPoint PPT Presentation
Citation preview
Current Status of Acute Myeloid Leukemia in China
Jianxiang WangInstitute of Hematology Hospital of Blood Disease
Chinese Academy of Medical Sciences
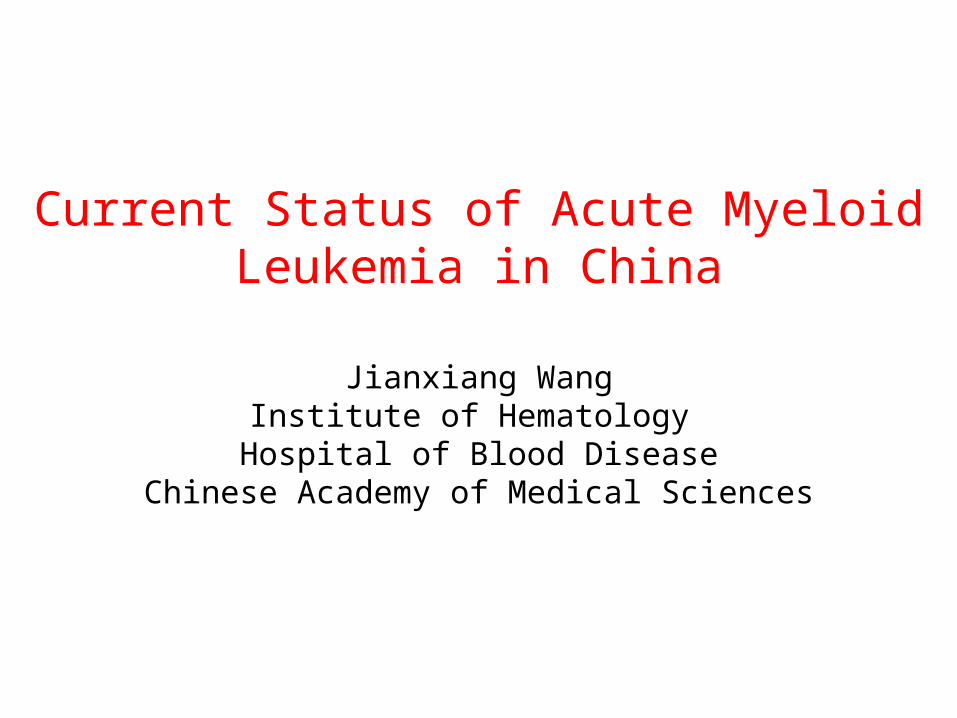
Shen Y et al. Blood 2011;118:5593-5603
Characteristics AML without prognostic cytogenetic markers
(group)
CBF leukemias
APL
Sex.no.of patients(%)
Male 348(29.4) 104(8.8) 199(16.8)
Female 257(21.7) 72(6.1) 189(15.9)
Mean age, y 43.2+18.9 31.4+19.5 34.7+17.1
Range 18-86 18-75 18-80
N0.of the patients<60
481 160 354
Median WBC count,109/L
13.35(0.5-453) 10.05(0.8-177.9)
2.9(0.3-205.7)
Median BM blasts,%
69(22.5-97) 60(23.5-91) 64(22.5-91.0)
AML Prognosis Factors(Shang Hai/Zhe Jiang Institute of Hematology )

Shen Y et al. Blood 2011;118:5593-5603
CR OS EFS
variables P OR(95%CI) P OR(95%CI) P OR(95%CI)
Age <.001 0.976(0.966-0.987)
<.001
1.018(1.011-1.027)
<.001 1.013(1.006-1.02)
WBC count
.02 0.996(0.992-0.999)
.022 1.002(1.000-1.004)
.044
BM balsts NS. NS. NS.
FLT ITD/TKD
NS. NS. NS.
C-KIT NS. NS. NS.
N-RAS NS. NS. NS.
NPM1+/DNMT3A-
.001 2,533(1.43-4.488)
.014 0.626(0.431-0.91)
.012 0.638(0.45-0.906)
Bi-CEBPA 0.005 2.45(1.319-4.553)
<.001
0.396(0.214-0.65)
.001 0.488(0.319-0.746)
WT1 NS. NS. NS.
ASXL1 NS. NS. NS.
DNMT3A .036 0.486(0.248-0.953)
.005 1.753(1.189-2.583)
.010 1.638(1.123-2.388)
MLL NS. .002 1.803(1.240-2.623)
.004 1.642(1.167-2.311)
IDH1 NS. NS. NS.
TET2 NS. NS. NS.
CR, OS and EFS- Multivariate Analysis

OS and EFS According to Genotypes -Multivariate Analysis.
Shen Y et al. Blood 2011;118:5593-5603

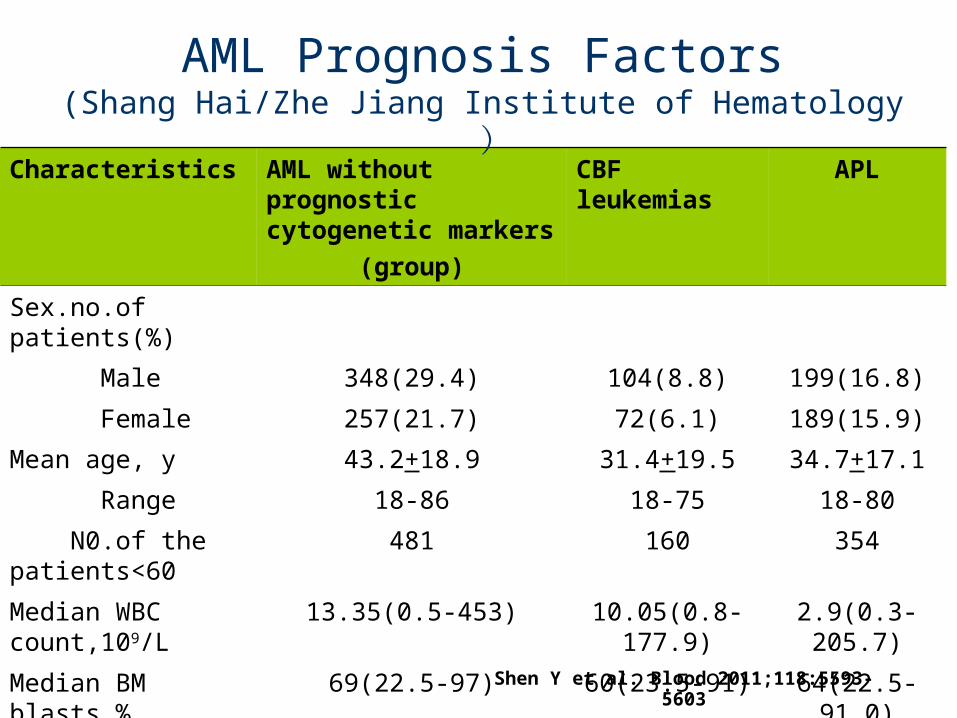
Homoharringtonine(HHT)- based induction therapy

Induction therapyHAA HHT 2mg/ m2/d d1-7 Acla 20mg /d d1-7 Ara-C 100mg/ m2/d d1-7HAD: HHT 2mg/ m2 /d d1-5/7 DNR 40 mg/ m2 /d d1-3 Ara-C 100 mg/ m2 /d d1-7 DA: DNR 40/45mg/ m2 /d d1-3 Ara-C 100mg/m2/d d1-7
HHT -based induction therapy for patients of de novo AML( from multicenter randomized controlled trial )
ID-Ara-C*2
DA/HA , MA , DA/HA , AA
CR PR/(reduced blast cells≥60 % )
NR/(reduced blast cells<60 % )
Continued previous regimen
Salvage therapyPR/NR
Withdraw from the study
CR
Observed for 3-year
Patients were randomly assigned to HAA , HAD or DA treatment groups

Number(%) P-value
DA(N=202) HAA(N=200) HAD(N=194) HAA:DA HAD:DA
1-cycle 109(54.0%) 135(67.5%) 126(64.9%) 0.005 0.026
2-cycle 125(61.9%) 150(75%) 133(68.6%) 0.005 0.163
CR rate i n i nducti on therapy
00. 10. 20. 30. 40. 50. 60. 70. 8
DA HAA HAD
perc
enta
ge
cycl e-1cycl e-2
CR Rate

Group median range Group median range Group median range
HAA 26.0 (16.3-35.7)M HAA 11.7 (8.6-14.8) M HAA 31.3 not reach M
HAD 22.6 (12.3-32.9) M HAD 8.6 (5.4-11.8)M HAD 21.7 not reach M
DA 21.1 (15.1-27.1)M DA 6.9 (4.0-9.8) M DA 15.5 ( 10.8-20.2)M
OS EFS
HAA:DA P=0.584
HAD:DA P=0.979
HAA:DA P=0.003
HAD:DA P=0.091
HAA:DA P=0.115
HAD:DA p=0.220
RFS
Survival
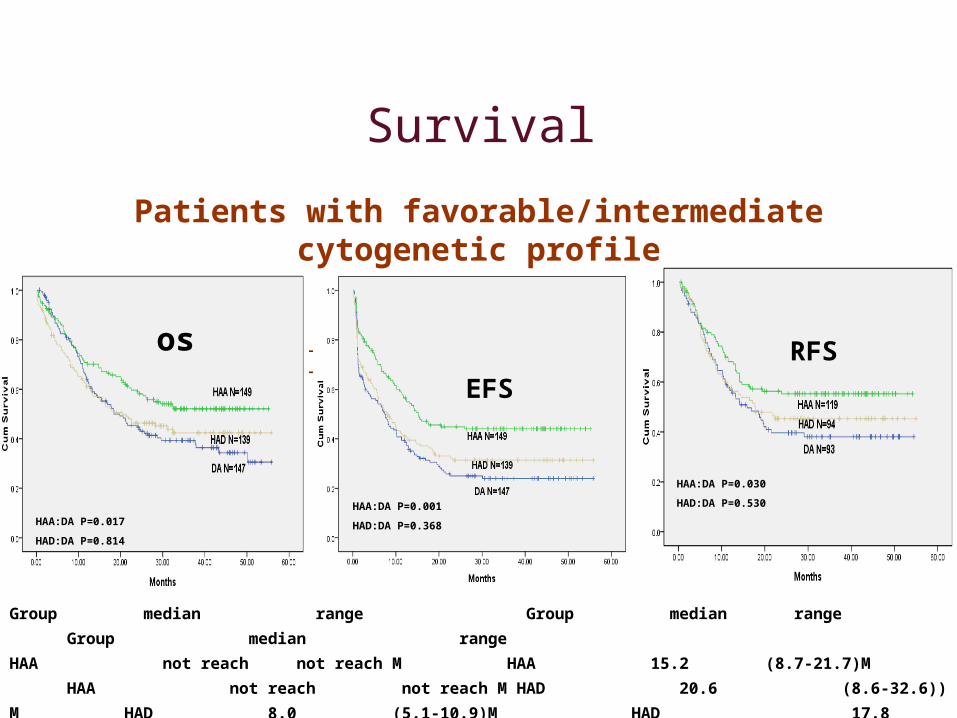
诱导方案对低 / 中危险组的影响
EFS
os
HAA:DA P=0.017
HAD:DA P=0.814
HAA:DA P=0.001
HAD:DA P=0.368
HAA:DA P=0.030
HAD:DA P=0.530
RFS
Group median range Group median range Group median range
HAA not reach not reach M HAA 15.2 (8.7-21.7)M HAA not reach not reach M
HAD 20.6 (8.6-32.6)) M HAD 8.0 (5.1-10.9)M HAD 17.8 not reach M
DA 18.4 (11.7-25.1) M DA 7.5 (5.0-9.8)M DA 15.9 ( 9.5-22.3) M
Survival
Patients with favorable/intermediate cytogenetic profile

os EFS
HAA:DA P=0.059
HAD:DA P=0.760 HAA:DA P=0.424
HAD:DA P=0.973
RFS
HAA:DA P=0.058
HAD:DA P=0.421
Group median range Group median range Group median range
HAA 7.6 (0-15.8) M HAA 2.2 (0.2-4.2) M HAA 3.8 (0.0-13.9) M
HAD 17.1 (0-34.5) M HAD 2.1 (0-12.3) M HAD 11.9 not reachM
DA 10.9 (4.9-17.0) M DA 1.1 (0.2-2.0) M DA not reach not reach M
Patients with poor cytogenetic profile

DA (n=205) HAA (n=206) HAD (n=198)
No.(%) No.(%) P ( vs.DA )
No.(%) P ( vs.DA )
Hemorrhage 13/193(6.7%) 10/191(5.2%) 0.536 15/186(8.1%) 0.621
Hepatic 3/192(1.6%) 5/189(2.6%) 0.500 4/185(2.2%) 0.719
Renal 0/193(0) 0/187(0) - 0/183(0) -
Cardiac 0/193(0) 3/188(1.6%) 0.119 3/185(1.6%) 0.116
Gastrointestinal 9/184(4.9%) 12/182(6.6%) 0.484 11/172(6.4%) 0.538
Infection (0-4) 144/186(77.4%) 156/188(83.0%) 0.177 141/178(79.2%) 0.678
Adverse Events

ID-Ara-C 、 Homoharringtonine (HHT)- based induction therapy

ID-Ara-C-based induction therapy
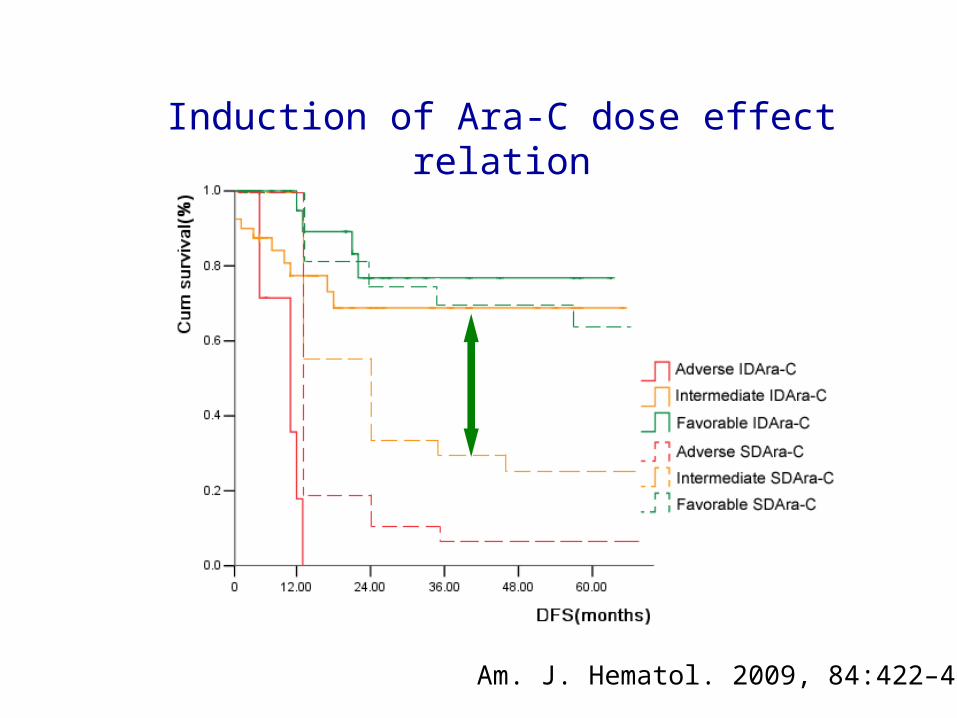
Induction of Ara-C dose effect relation
Am. J. Hematol. 2009, 84:422–427.

2010.9.1-
201 de novo<55, AML patients were enrolled follow up to
2012.12.31 , The median follow-up 8.85 ( 0.33-
27.67 ) months
Male 105 , Famale 96
Median age 37 ( 15-54 )
At diagnosis median WBC count 12.7(0.81-275.4) ×109/L,
median HGB 81(36-162)g/l , median PLT 35(3-415)×109/L
HHT/ID-Ara-C-based inductin therapy for the patients of de novo AML
( the data of Chinese Academy of Medical Sciences Institute of Hematology)

Induction therapy HAD group HHT 2mg/HHT 2mg/ ㎡㎡ /d d1-7/d d1-7
Ara-c 100mg/Ara-c 100mg/ ㎡㎡ /d d1-7/d d1-7 DNR 40mg/DNR 40mg/ ㎡㎡ /d d1-3/d d1-3
ID-HAD groupID-HAD group HHT 2mg/HHT 2mg/ ㎡㎡ /d d1-7/d d1-7
Ara-c 100mg/Ara-c 100mg/ ㎡㎡ /d d1-4/d d1-4 , , 1g/1g/ ㎡㎡ /q12h d5-7/q12h d5-7 DNR 40mg/DNR 40mg/ ㎡㎡ /d d1-3/d d1-3
Early consolidation therapyEarly consolidation therapy HD-Ara-C group Ara-c 3.0g/Ara-c 3.0g/ ㎡㎡ /q12h d1-3 3/q12h d1-3 3 cycle cycless
ID-Ara-C groupID-Ara-C group DNR DNR 40mg/40mg/ ㎡㎡ /d d1-3/d d1-3 Ara-cAra-c 1.5g/ 1.5g/ ㎡㎡ /q12h d1-3/q12h d1-3
MTZ MTZ 8mg/8mg/ ㎡㎡ /d d1-3/d d1-3 Ara-cAra-c 1.5g/ 1.5g/ ㎡㎡ /q12h d1-3/q12h d1-3
Late consolidation therapyLate consolidation therapy HA HHT HHT 2.5mg/2.5mg/ ㎡㎡ /d/d d1-6 1-6 Ara-c Ara-c 100mg/ ㎡ /d d1-61-6
continuous 2 cyclescontinuous 2 cycles MA MA MTZ MTZ 8mg/8mg/ ㎡㎡ /d d1-3/d d1-3 Ara-c 100mg/ 100mg/ ㎡㎡ /d/d d1-6d1-6
continuous 1-2 cyclescontinuous 1-2 cycles
R
R
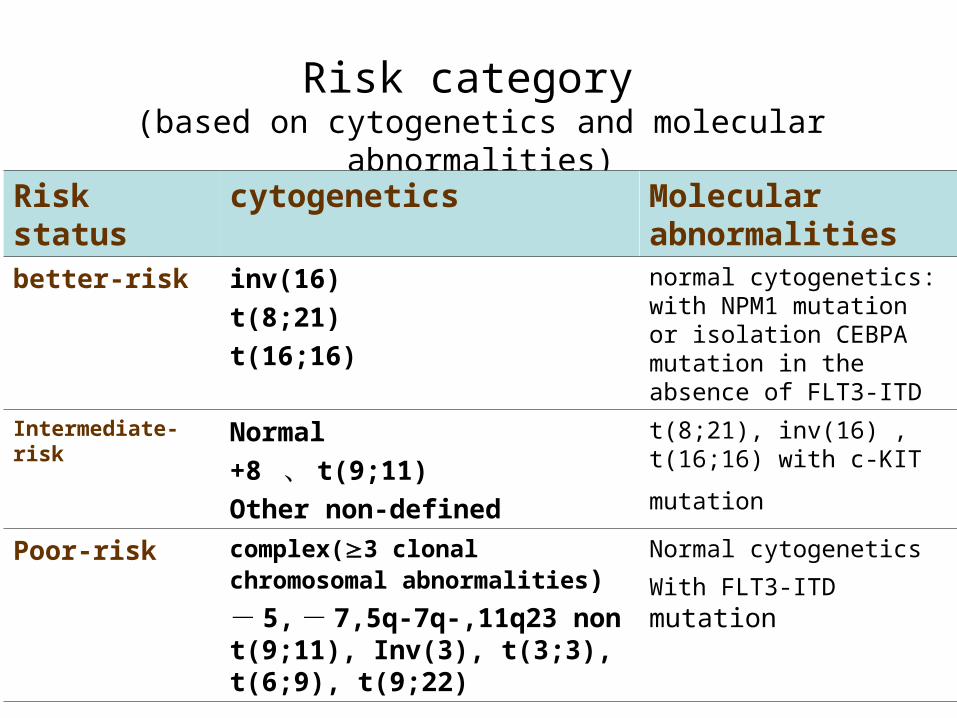
Risk category (based on cytogenetics and molecular abnormalities)
Risk status
cytogenetics Molecular abnormalities
better-risk inv(16)
t(8;21)
t(16;16)
normal cytogenetics: with NPM1 mutation or isolation CEBPA mutation in the absence of FLT3-ITD
Intermediate-risk
Normal
+8 、 t(9;11)
Other non-defined
t(8;21), inv(16) , t(16;16)
with c-KIT mutation
Poor-risk complex(3 clonal chromosomal abnormalities)
- 5, - 7,5q-7q-,11q23 non t(9;11), Inv(3), t(3;3), t(6;9), t(9;22)
Normal cytogenetics
With FLT3-ITD mutation

NR n=26(25.2%)
death n=1 (0.97%)
no evalution n=2
NR n=6 (6.1%)
death n=6 (6.1%)
no evalution n=2
CR n=74
( 71.8% ) Discontinue
n=5 (6.7%)
CR n=84
( 85.7% )Discontinue
n=8 ( 9.5% )
201 AML patients(≤ 55 years )
SD-Ara-C induction
( n=103 )
ID-Ara-C induction
( n=98 )
HD-Ara-C
( n=75 )
ID-Ara-C
( n=70 )

低危组
Poor
Induction therapy for risk stratificationfavorable
induction therapy
SD-Ara-C group ID-Ara-C group
97.4% 94.3%
( 38/39 ) ( 33/35 )
P>0.05 induction therapy
SD-Ara-C group ID-Ara-C group
70.3% 82.1%
( 26/37 ) ( 32/39 )
P<0.05
intermediate
induction therapy
SD-Ara-C group ID-Ara-C group
40.0% 86.4%
( 10/25 ) ( 19/22 )
P<0.05

D. Description of the contents
2 years OS rate 62% 2 years RFS rate70%
Follow up to 2012.12.31, 42patients died.7 patients died during induction therapy,19 patients died because of relapse,16 patients died after NR
Follow up to 2012.12.3124 patients relapse
Survival

Poor
intermediate
低危组 favorable
P=0.0 P=0.015
favorable intermediate PoorDeath(N.) 6/74 18/76 17/47 2 yearsOSrate 80% 58% 43%
favorable intermediate Poor
Relapse(N.) 6/70 10/58 8/29
2 yearsDFS rate 76% 71% 52%
Survival
Risk groups
Cu
m s
urv
iva
l
OS(months )
favorable
intermediate
PoorC
um
su
rviv
al
RFS(months )

D. Description of the contents SD-Ara-c group ID-Ara-c group
Death(N.) 21/101 20/96
2 years OS rate 55% 67%
SD-Ara-c group ID-Ara-c group
Relapse(N.) 11/73 13/84
2 years RFS rate 62% 76%
Cu
m s
urv
iva
l
OS(months )
ID-Ara-c induction group
SD-Ara-c induction group
P=0.491 P=0.773
ID-Ara-c induction group
SD-Ara-c induction group
Cu
m s
urv
iva
l
RFS(months )
Induction therapy
Survival

C. Description of the contents
D. Description of the contents
SurvivalInduction therapy
Better-risk Intermediate-risk Poor-risk
ID-Ara-C induction group
P=0.815
SD-Ara-C induction group
ID-Ara-C
induction group
SD-Ara-C induction group
Cu
m s
urv
iva
l
Os (months)
Cu
m s
urv
iva
l
P=0.75
Cu
m s
urv
iva
l
Os (months)
ID-Ara-C
induction group
SD-Ara-C induction group
P=0.11
Os (months)
D. Description of the contents
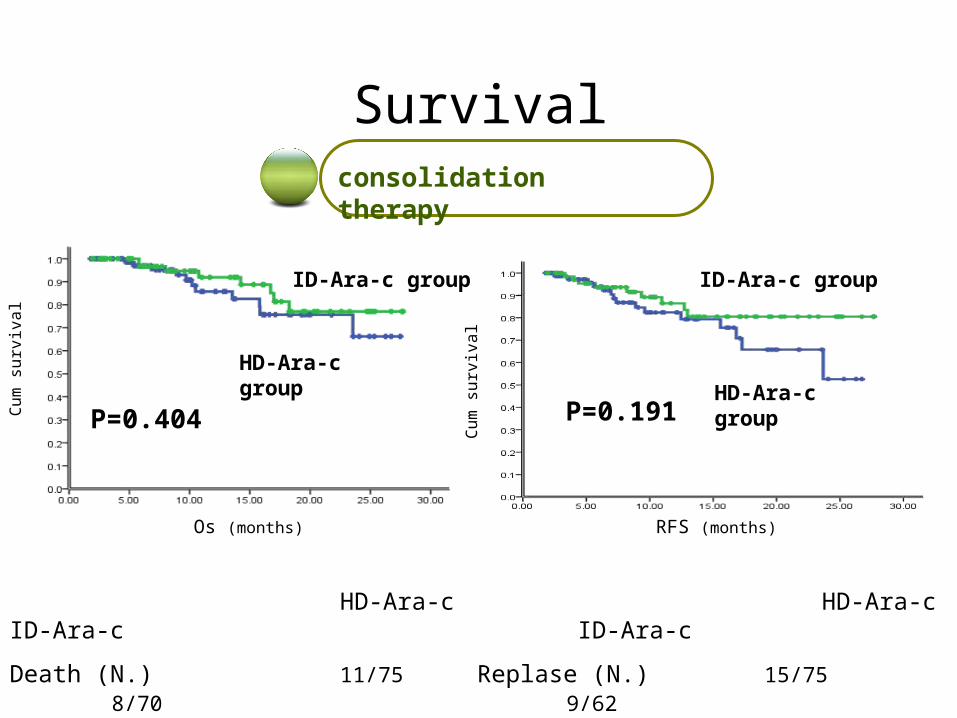
Survival
HD-Ara-c group
ID-Ara-c group
HD-Ara-c ID-Ara-c
Death (N.) 11/75 8/70
2 years OS rate 71% 76%
HD-Ara-c ID-Ara-c
Replase (N.) 15/75 9/62
2 years DFS rate 61% 78%
consolidation therapy
P=0.404
ID-Ara-c group
HD-Ara-c groupCu
m s
urv
iva
l
Os (months)
P=0.191Cu
m s
urv
iva
l
RFS (months)

Survival
Better-risk Intermediate-risk Poor-risk
P=0.082 P=0.885P=0.358
consolidation therapy
ID-Ara-c group
HD-Ara-c group
ID-Ara-c group
HD-Ara-c group
HD-Ara-c group
ID-Ara-c group
Cu
m s
urv
iva
l
Os (months)
Cu
m s
urv
iva
l
Cu
m s
urv
iva
lOs (months) Os (months)

Survival
P=0.108P=0.014
Better-risk Intermediate-risk Poor-risk
P=0.83
Induction, consolidation therapy
ID-Ara-C /ID-Ara-C group
ID-Ara-c / HD-Ara-C group
SD-Ara-C / ID-Ara-C group
SD-Ara-C / HD-Ara-C group
Os (months)
Cu
m s
urv
iva
l
Cu
m s
urv
iva
l
SD-Ara-C / ID-Ara-C group
ID-Ara-c / HD-Ara-C group
SD-Ara-C/ HD-Ara-C group
ID-Ara-C /ID-Ara-C group
Os (months)
Cu
m s
urv
iva
l
SD-Ara-C/ HD-Ara-C group
ID-Ara-C /ID-Ara-C group
SD-Ara-C / ID-Ara-C group
ID-Ara-c / HD-Ara-C group
Os (months)
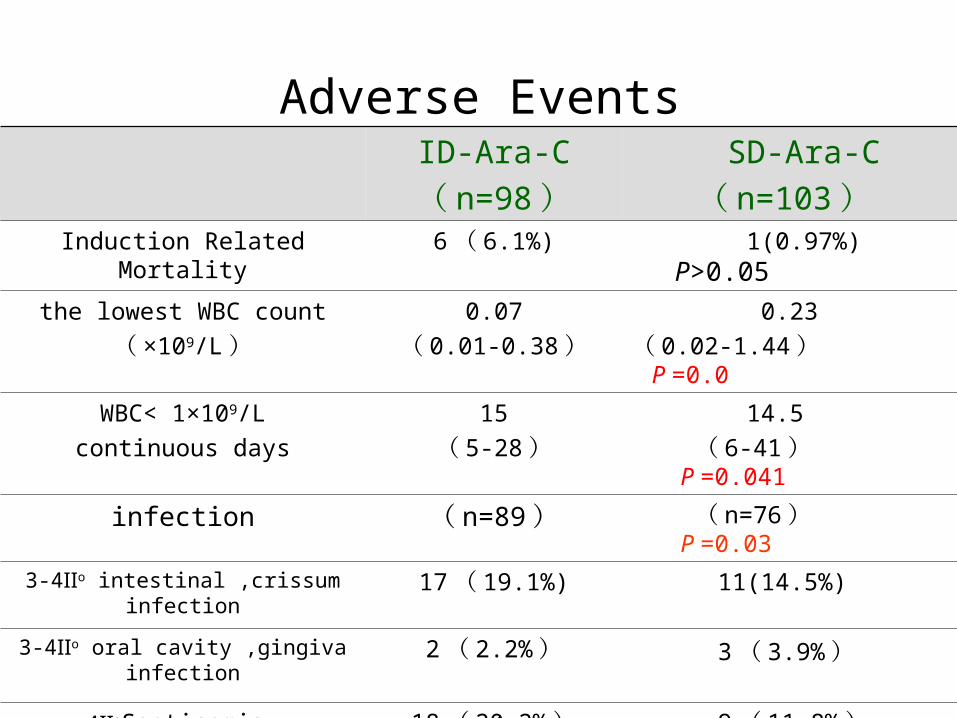
ID-Ara-C( n=98 )
SD-Ara-C ( n=103 )
Induction Related Mortality 6 ( 6.1%) 1(0.97%) P>0.05
the lowest WBC count( ×109/L )
0.07( 0.01-0.38 )
0.23( 0.02-1.44 ) P =0.0
WBC< 1×10⁹/Lcontinuous days
15( 5-28 )
14.5 ( 6-41 ) P =0.041
infection ( n=89 ) ( n=76 ) P =0.03
3-4Ⅱo intestinal ,crissum infection
17 ( 19.1%) 11(14.5%)
3-4Ⅱo oral cavity ,gingiva infection
2 ( 2.2% ) 3 ( 3.9% )
4ⅡoSepticemia 18 ( 20.2% ) 9 ( 11.8% ) Liver infection 3 ( 3.3% ) 1(1.3%)
3-4Ⅱolung infection 25(28.1%) 26(34.2%)
Adverse Events

Summary Currently, major hematological centers in China
has been established diagnosis and
classification system of AL based cytogenetics
and molecular genetics.
The therapy of AML in China has achieved
dramatic progress, improved long -term survival
of AML patients substantially.
Cooperative groups are required for clinical
trials.

Thank you


![5603 Traveller - [Alien Module #8] Darrians](https://img.pdfslide.us/doc/110x75/577c7e771a28abe054a14249/5603-traveller-alien-module-8-darrians.jpg)
![5603 Traveller - [Alien Module #6] Solomani](https://img.pdfslide.us/doc/110x75/577c7e771a28abe054a14250/5603-traveller-alien-module-6-solomani.jpg)

![5603 Traveller - [Alien Module #2] K'Kree](https://img.pdfslide.us/doc/110x75/577c7e9c1a28abe054a1d59b/5603-traveller-alien-module-2-kkree.jpg)


![Mitchell P Et Al. Ophthalmology 2011;118(4);615-25 [RESTORE]](https://img.pdfslide.us/doc/110x75/55cf984f550346d03396e527/mitchell-p-et-al-ophthalmology-20111184615-25-restore.jpg)