Embed Size (px)
Citation preview
Songklanakarin J. Sci. Technol. 41 (3), 669-678, May - Jun. 2019
Original Article
Shear strengths of fractures in Tak granite under orthotropic stresses
Pajeeraporn Weingchanda, Supattra Khamrat, Thanitta Thongprapa,
and Kittitep Fuenkajorn*
Geomechanics Research Unit, Institute of Engineering,
Suranaree University of Technology, Mueang, Nakhon Ratchasima, 30000 Thailand
Received: 25 December 2017; Revised: 9 February 2018; Accepted: 17 February 2018
Abstract
The objective of this study is to determine the shearing resistance of fractures in Tak granite as affected by orthotropic
stress states where 123. Triaxial shear tests are performed to obtain the strengths and dilations of tension-induced fractures
and smooth saw-cut surfaces under confining pressures up to 18 MPa. The ratios of the lateral stresses vary from 0 to 4. The
shearing resistance, dilation and areas of sheared-off asperities of the rough fractures decrease when the lateral stress ratios increase.
The shear strengths of smooth saw-cut surfaces tend to be independent of the stress ratios. The distortional strain energy (Wd)
required to displace the fractures under various stress states increases linearly with the mean strain energy (Wm). The energy ratio
(Wd/Wm) in terms of the strains and dilation can be used as a predictive tool for the movements of faults or fractures in Tak granite.
Keywords: dilation, strain energy, orthotropic stress, fault
1. Introduction
Frictional behavior of rock fractures has normally
been determined by the direct shear test method (ASTM
D5607-08). The results have been applied to determine the
stability of rock slope embankments, shallows rock founda-
tions and underground openings. The test configurations how-
ever have some disadvantages. The magnitudes of the applied
normal stress are limited by the uniaxial compressive strength
of the rock, and the fractures are sheared under unconfined
conditions. The results can not describe the friction behavior
and movement of the fractures or faults at great depth where
they are under high confinements. The triaxial shear test
method (Barton, 1976; Brady & Brown, 2006; Jaeger et al.,
2007; Li et al., 2012a, 2012b) has therefore been developed to
simulate the frictional resistance of rock fractures under
confining pressures. The normal stress at which the shear
strengths are measured can be controlled by the applied axial
stress and confining pressures (Lane & Heck, 1964; Rosso,
1976). The test provides the shear strengths of rock fractures
under uniform lateral confining stresses (12=3), which
may also not truly represent their actual in-situ conditions,
where 123. It has long been recognized that the inter-
mediate principal stress or the true triaxial stress condition can
notably affect the intact rock strengths and deformability
(Alexeev et al., 2008; Cai, 2008; Colmenares & Zoback, 2002;
Haimson, 2006; Haimson & Chang, 2000; Haimson &
Rudnicki, 2010). Rare attempt has however been made at
determining the shear strengths of rock fractures under true
triaxial stress states (Kapang et al., 2013; Morris & Ferrill,
2009). A shear strength criterion for rock fractures that can
incorporate the effect of the three-dimensional stresses has
never been developed. Such knowledge could improve an
understanding of the friction of rock fractures around deep
underground structures and of the fault movements at great
depth.
The objective of this study is to determine the
shearing resistance of fractures in Tak granite as affected by
orthotropic stresses when the three principal stresses are un-
equal. True triaxial shear tests are performed on tension-
induced fractures and smooth saw-cut surfaces in Tak granite
specimens. A polyaxial load frame is used to obtain the
strengths and dilations of the fractures under confining pres-
*Corresponding author
Email address: [email protected]
670 P. Weingchanda et al. / Songklanakarin J. Sci. Technol. 41 (3), 669-678, 2019
sures from 1 to 18 MPa. The lateral stress ratios are also varied
from 0 to 4. The joint roughness coefficients (JRC) are
determined prior to and after shearing. The strain energy
principle is applied to describe the peak shear strengths and
confinements under varied stress conditions.
2. Sample Preparation
The specimens used for the triaxial shear tests are
prepared from the Tak granite. The granite batholith is ex-posed
in the northwest of Thailand where there are several active
faults and seismic activities (Fenton et al., 2003). The tested
granite is felsic phaneritic, and fine grained with average sizes
of 4-5 mm. It comprises 40% plagioclase (with grain sizes of
0.5-1 mm), 30% quartz (2-5 mm), 5% ortho-clase (3-5 mm),
3% amphibole (1-2 mm), and 2% biotite (1-2 mm) (Kemthong
& Fuenkajorn, 2007). The average density of the specimens is
2.67 g/cc. Rodklang et al. (2015) determine the mechanical
properties of the Tak granite as: uniaxial compressive strength
= 118 ± 5.2 MPa, elastic modulus = 13.8 GPa, Poisson’s ratio
= 0.28, cohesion = 17.6 MPa, and inter-nal friction angle = 58.
The specimens are cut to obtain rec-tangular blocks with
nominal dimensions of 50×50×87 mm3. The fractures are
artificially made to obtain tension-inducing fracture and saw-
cut surface. A line load is applied to obtain a tension-induced
fracture diagonally across the rock block. The fracture area is
50×100 mm2. The normal to the fracture plane makes an angle
() of 59.1° with the major axis of the speci-men. The fractures
are clean and well mated. The asperity amplitudes are measured
from the laser-scanned profiles along the shearing direction.
The readings are made to the nearest 0.01 mm. The maximum
amplitudes of the profiles are used to determine the joint
roughness coefficients (JRC) of each frac-ture based on the
Barton’s chart (Barton, 1982). The joint roughness coefficients
are averaged as 12±1.0. All fractures show both first and second
order asperities.
3. Test Apparatus and Method
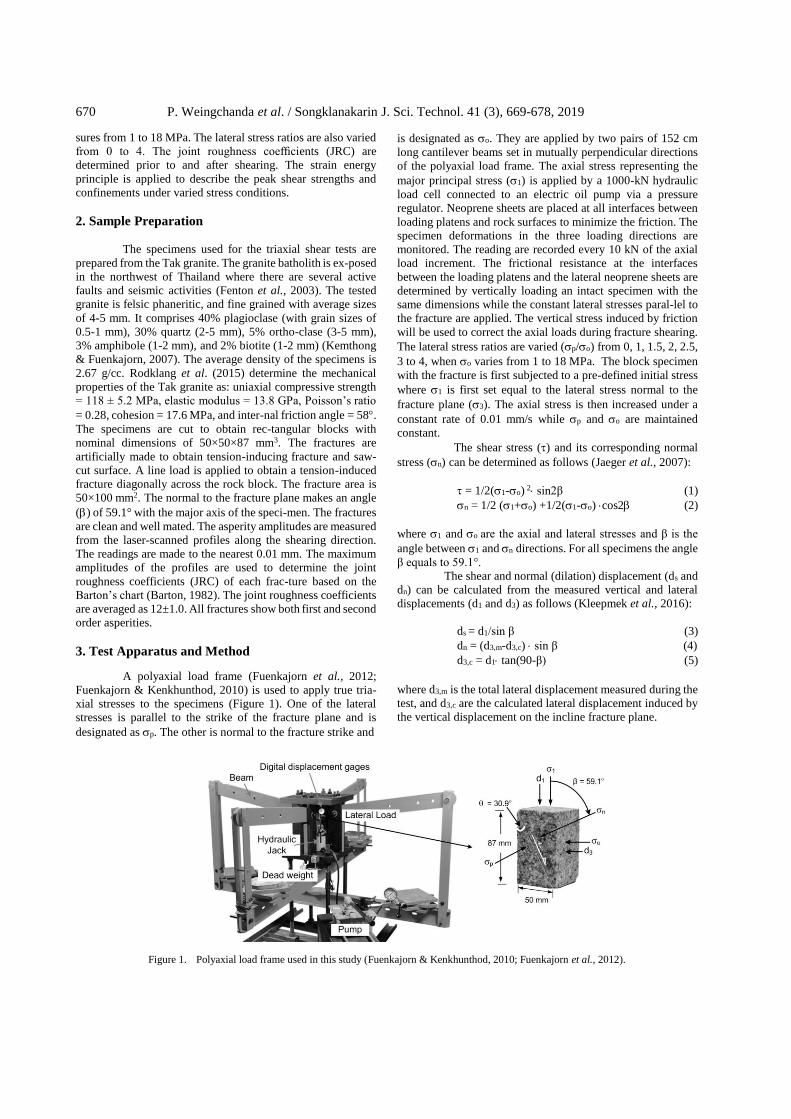
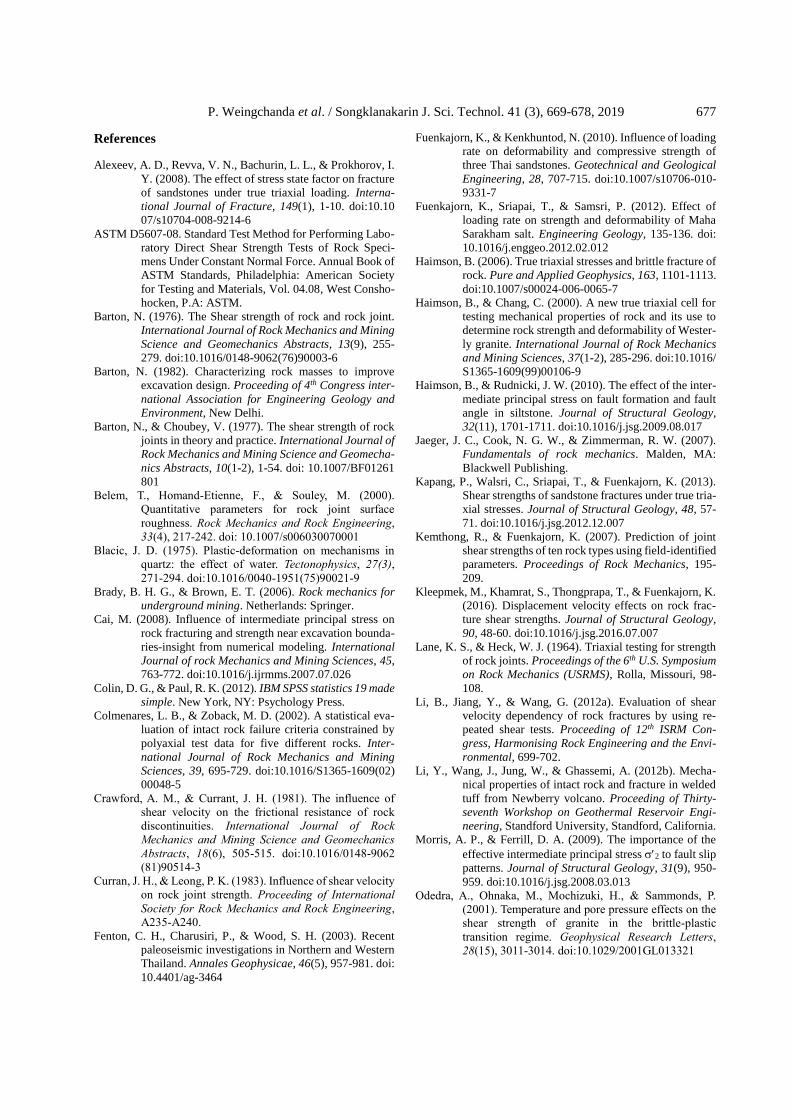
A polyaxial load frame (Fuenkajorn et al., 2012;
Fuenkajorn & Kenkhunthod, 2010) is used to apply true tria-
xial stresses to the specimens (Figure 1). One of the lateral
stresses is parallel to the strike of the fracture plane and is
designated as p. The other is normal to the fracture strike and
is designated as o. They are applied by two pairs of 152 cm
long cantilever beams set in mutually perpendicular directions
of the polyaxial load frame. The axial stress representing the
major principal stress (1) is applied by a 1000-kN hydraulic
load cell connected to an electric oil pump via a pressure
regulator. Neoprene sheets are placed at all interfaces between
loading platens and rock surfaces to minimize the friction. The
specimen deformations in the three loading directions are
monitored. The reading are recorded every 10 kN of the axial
load increment. The frictional resistance at the interfaces
between the loading platens and the lateral neoprene sheets are
determined by vertically loading an intact specimen with the
same dimensions while the constant lateral stresses paral-lel to
the fracture are applied. The vertical stress induced by friction
will be used to correct the axial loads during fracture shearing.
The lateral stress ratios are varied (p/o) from 0, 1, 1.5, 2, 2.5,
3 to 4, when o varies from 1 to 18 MPa. The block specimen
with the fracture is first subjected to a pre-defined initial stress
where 1 is first set equal to the lateral stress normal to the
fracture plane (3). The axial stress is then increased under a
constant rate of 0.01 mm/s while p and o are maintained
constant.
The shear stress () and its corresponding normal
stress (n) can be determined as follows (Jaeger et al., 2007):
= 1/2(1-o) 2 sin2β (1)
n = 1/2 (1+o) +1/2(1-o) cos2 (2)
where 1 and o are the axial and lateral stresses and β is the
angle between 1 and n directions. For all specimens the angle
β equals to 59.1°.
The shear and normal (dilation) displacement (ds and
dn) can be calculated from the measured vertical and lateral
displacements (d1 and d3) as follows (Kleepmek et al., 2016):
ds = d1/sin β (3)
dn = (d3,m-d3,c) sin β (4)
d3,c = d1 tan(90-β) (5)
where d3,m is the total lateral displacement measured during the
test, and d3,c are the calculated lateral displacement induced by
the vertical displacement on the incline fracture plane.
Figure 1. Polyaxial load frame used in this study (Fuenkajorn & Kenkhunthod, 2010; Fuenkajorn et al., 2012).
P. Weingchanda et al. / Songklanakarin J. Sci. Technol. 41 (3), 669-678, 2019 671
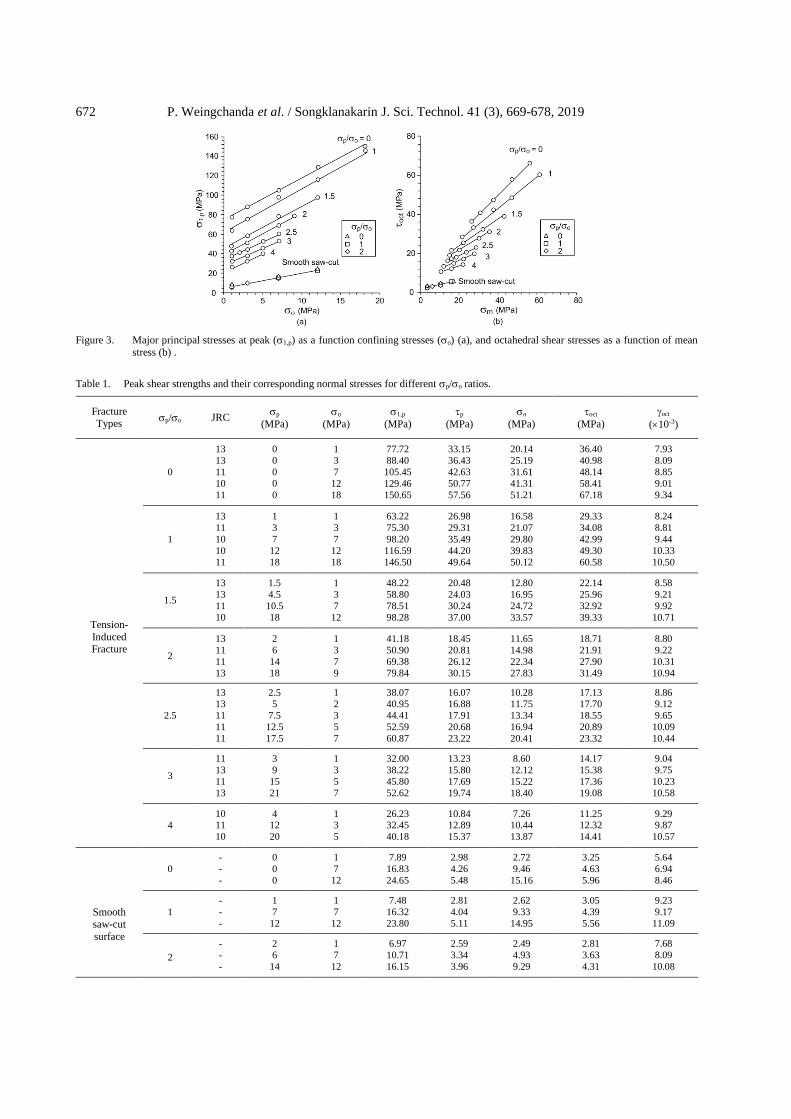
4. Test Results
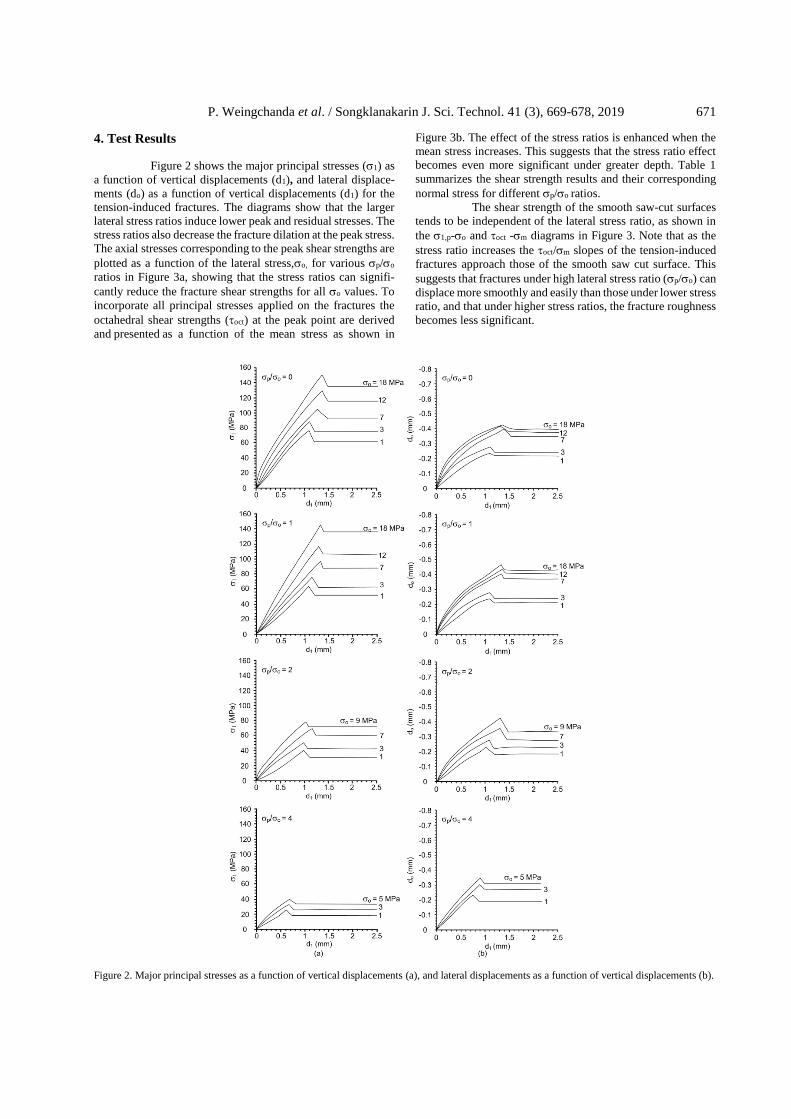
Figure 2 shows the major principal stresses (1) as
a function of vertical displacements (d1), and lateral displace-
ments (do) as a function of vertical displacements (d1) for the
tension-induced fractures. The diagrams show that the larger
lateral stress ratios induce lower peak and residual stresses. The
stress ratios also decrease the fracture dilation at the peak stress.
The axial stresses corresponding to the peak shear strengths are
plotted as a function of the lateral stress,o, for various p/o
ratios in Figure 3a, showing that the stress ratios can signifi-
cantly reduce the fracture shear strengths for all o values. To
incorporate all principal stresses applied on the fractures the
octahedral shear strengths (oct) at the peak point are derived
and presented as a function of the mean stress as shown in
Figure 3b. The effect of the stress ratios is enhanced when the
mean stress increases. This suggests that the stress ratio effect
becomes even more significant under greater depth. Table 1
summarizes the shear strength results and their corresponding
normal stress for different p/o ratios.
The shear strength of the smooth saw-cut surfaces
tends to be independent of the lateral stress ratio, as shown in
the 1,p-o and oct -m diagrams in Figure 3. Note that as the
stress ratio increases the oct/m slopes of the tension-induced
fractures approach those of the smooth saw cut surface. This
suggests that fractures under high lateral stress ratio (p/o) can
displace more smoothly and easily than those under lower stress
ratio, and that under higher stress ratios, the fracture roughness
becomes less significant.
Figure 2. Major principal stresses as a function of vertical displacements (a), and lateral displacements as a function of vertical displacements (b).
672 P. Weingchanda et al. / Songklanakarin J. Sci. Technol. 41 (3), 669-678, 2019
Figure 3. Major principal stresses at peak (1,p) as a function confining stresses (o) (a), and octahedral shear stresses as a function of mean
stress (b) .
Table 1. Peak shear strengths and their corresponding normal stresses for different p/o ratios.
Fracture Types
p/o JRC p
(MPa)
o
(MPa)
1,p
(MPa)
p
(MPa)
n
(MPa)
oct
(MPa)
oct
(10-3)
Tension-
Induced Fracture
0
13 0 1 77.72 33.15 20.14 36.40 7.93
13 0 3 88.40 36.43 25.19 40.98 8.09
11 0 7 105.45 42.63 31.61 48.14 8.85
10 0 12 129.46 50.77 41.31 58.41 9.01
11 0 18 150.65 57.56 51.21 67.18 9.34
1
13 1 1 63.22 26.98 16.58 29.33 8.24
11 3 3 75.30 29.31 21.07 34.08 8.81
10 7 7 98.20 35.49 29.80 42.99 9.44
10 12 12 116.59 44.20 39.83 49.30 10.33
11 18 18 146.50 49.64 50.12 60.58 10.50
1.5
13 1.5 1 48.22 20.48 12.80 22.14 8.58
13 4.5 3 58.80 24.03 16.95 25.96 9.21
11 10.5 7 78.51 30.24 24.72 32.92 9.92
10 18 12 98.28 37.00 33.57 39.33 10.71
2
13 2 1 41.18 18.45 11.65 18.71 8.80
11 6 3 50.90 20.81 14.98 21.91 9.22
11 14 7 69.38 26.12 22.34 27.90 10.31
13 18 9 79.84 30.15 27.83 31.49 10.94
2.5
13 2.5 1 38.07 16.07 10.28 17.13 8.86 13 5 2 40.95 16.88 11.75 17.70 9.12
11 7.5 3 44.41 17.91 13.34 18.55 9.65
11 12.5 5 52.59 20.68 16.94 20.89 10.09
11 17.5 7 60.87 23.22 20.41 23.32 10.44
3
11 3 1 32.00 13.23 8.60 14.17 9.04
13 9 3 38.22 15.80 12.12 15.38 9.75
11 15 5 45.80 17.69 15.22 17.36 10.23
13 21 7 52.62 19.74 18.40 19.08 10.58
4 10 4 1 26.23 10.84 7.26 11.25 9.29 11 12 3 32.45 12.89 10.44 12.32 9.87
10 20 5 40.18 15.37 13.87 14.41 10.57
Smooth saw-cut
surface
- 0 1 7.89 2.98 2.72 3.25 5.64
0 - 0 7 16.83 4.26 9.46 4.63 6.94
- 0 12 24.65 5.48 15.16 5.96 8.46
- 1 1 7.48 2.81 2.62 3.05 9.23
1 - 7 7 16.32 4.04 9.33 4.39 9.17
- 12 12 23.80 5.11 14.95 5.56 11.09
2
- 2 1 6.97 2.59 2.49 2.81 7.68
- 6 7 10.71 3.34 4.93 3.63 8.09
- 14 12 16.15 3.96 9.29 4.31 10.08
P. Weingchanda et al. / Songklanakarin J. Sci. Technol. 41 (3), 669-678, 2019 673
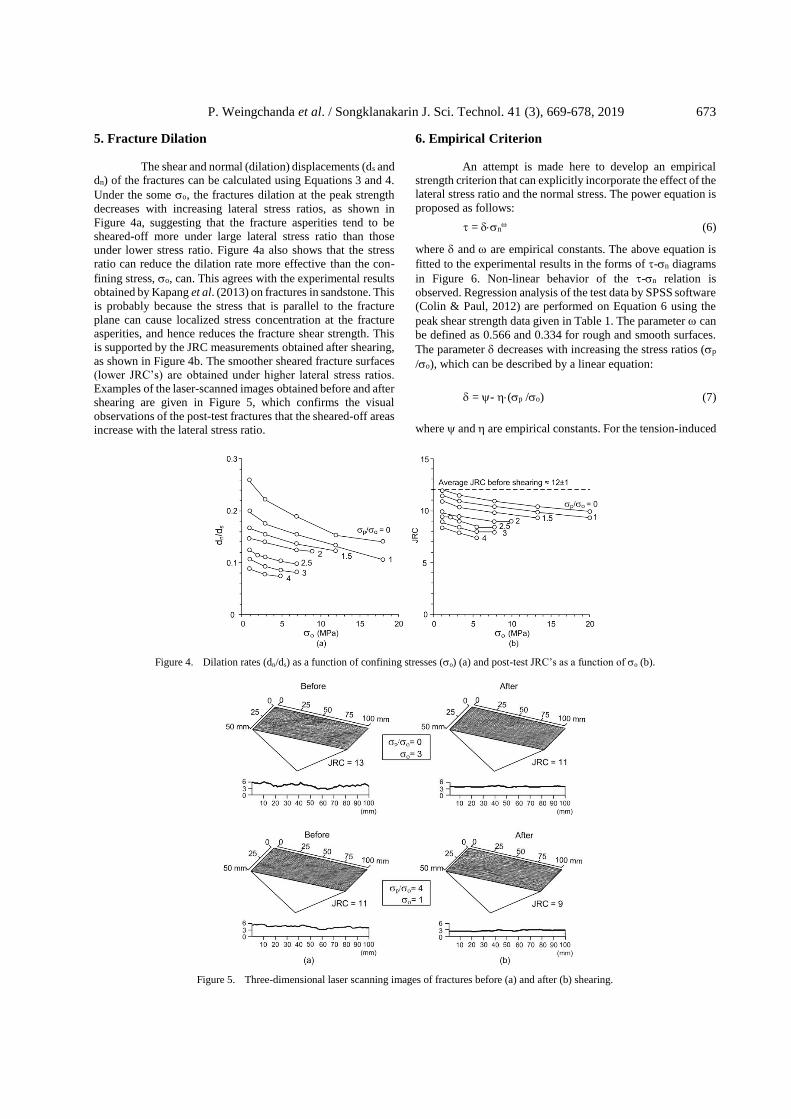
5. Fracture Dilation
The shear and normal (dilation) displacements (ds and
dn) of the fractures can be calculated using Equations 3 and 4.
Under the some o, the fractures dilation at the peak strength
decreases with increasing lateral stress ratios, as shown in
Figure 4a, suggesting that the fracture asperities tend to be
sheared-off more under large lateral stress ratio than those
under lower stress ratio. Figure 4a also shows that the stress
ratio can reduce the dilation rate more effective than the con-
fining stress, o, can. This agrees with the experimental results
obtained by Kapang et al. (2013) on fractures in sandstone. This
is probably because the stress that is parallel to the fracture
plane can cause localized stress concentration at the fracture
asperities, and hence reduces the fracture shear strength. This
is supported by the JRC measurements obtained after shearing,
as shown in Figure 4b. The smoother sheared fracture surfaces
(lower JRC’s) are obtained under higher lateral stress ratios.
Examples of the laser-scanned images obtained before and after
shearing are given in Figure 5, which confirms the visual
observations of the post-test fractures that the sheared-off areas
increase with the lateral stress ratio.
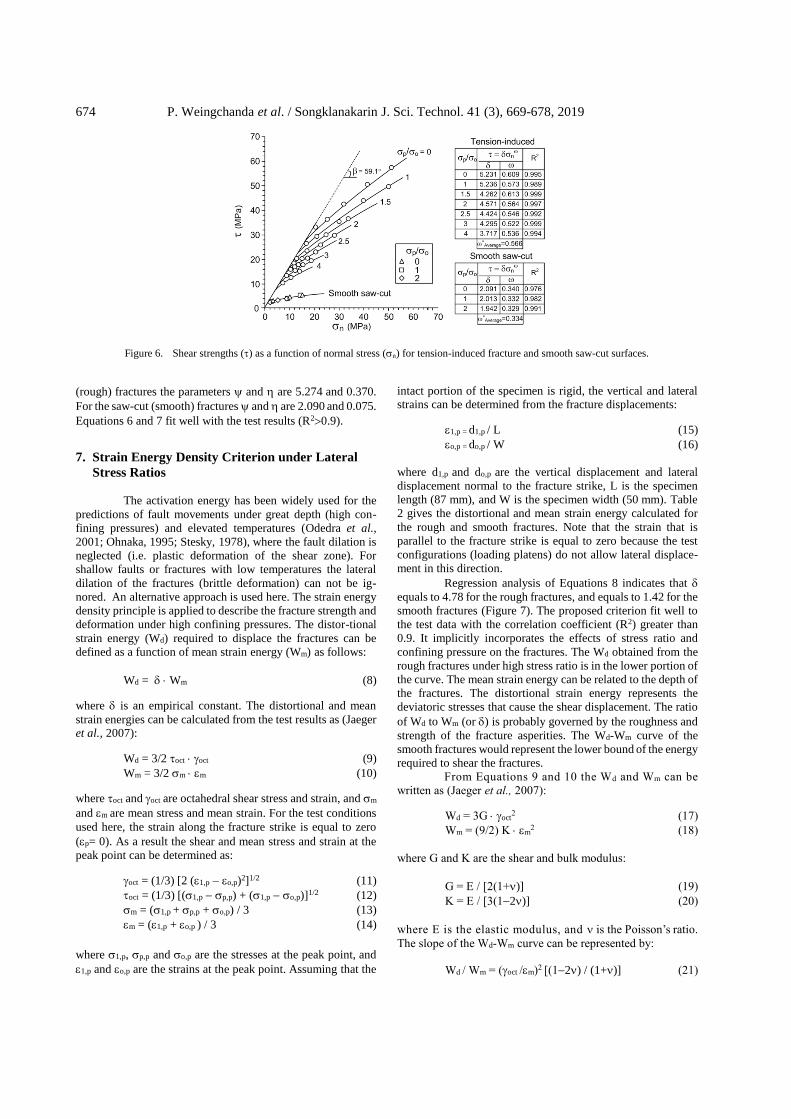
6. Empirical Criterion
An attempt is made here to develop an empirical
strength criterion that can explicitly incorporate the effect of the
lateral stress ratio and the normal stress. The power equation is
proposed as follows:
= n (6)
where and are empirical constants. The above equation is
fitted to the experimental results in the forms of -n diagrams
in Figure 6. Non-linear behavior of the -n relation is
observed. Regression analysis of the test data by SPSS software
(Colin & Paul, 2012) are performed on Equation 6 using the
peak shear strength data given in Table 1. The parameter can
be defined as 0.566 and 0.334 for rough and smooth surfaces.
The parameter decreases with increasing the stress ratios (p
/o), which can be described by a linear equation:
= - (p /o) (7)
where and are empirical constants. For the tension-induced
Figure 4. Dilation rates (dn/ds) as a function of confining stresses (o) (a) and post-test JRC’s as a function of o (b).
Figure 5. Three-dimensional laser scanning images of fractures before (a) and after (b) shearing.
674 P. Weingchanda et al. / Songklanakarin J. Sci. Technol. 41 (3), 669-678, 2019
Figure 6. Shear strengths () as a function of normal stress (n) for tension-induced fracture and smooth saw-cut surfaces.
(rough) fractures the parameters and are 5.274 and 0.370.
For the saw-cut (smooth) fractures and are 2.090 and 0.075.
Equations 6 and 7 fit well with the test results (R20.9).
7. Strain Energy Density Criterion under Lateral
Stress Ratios
The activation energy has been widely used for the
predictions of fault movements under great depth (high con-
fining pressures) and elevated temperatures (Odedra et al.,
2001; Ohnaka, 1995; Stesky, 1978), where the fault dilation is
neglected (i.e. plastic deformation of the shear zone). For
shallow faults or fractures with low temperatures the lateral
dilation of the fractures (brittle deformation) can not be ig-
nored. An alternative approach is used here. The strain energy
density principle is applied to describe the fracture strength and
deformation under high confining pressures. The distor-tional
strain energy (Wd) required to displace the fractures can be
defined as a function of mean strain energy (Wm) as follows:
Wd = Wm (8)
where is an empirical constant. The distortional and mean
strain energies can be calculated from the test results as (Jaeger et al., 2007):
Wd = 3/2 oct oct (9)
Wm = 3/2 m m (10)
where oct and oct are octahedral shear stress and strain, and m
and m are mean stress and mean strain. For the test conditions
used here, the strain along the fracture strike is equal to zero
(p= 0). As a result the shear and mean stress and strain at the
peak point can be determined as:
oct = (1/3) [2 (1,p o,p)2]1/2 (11)
oct = (1/3) [(1,p p,p) + (1,p o,p)]1/2 (12)
m = (1,p + p,p + o,p) / 3 (13)
m = (1,p + o,p ) / 3 (14)
where 1,p, p,p and o,p are the stresses at the peak point, and
1,p and o,p are the strains at the peak point. Assuming that the
intact portion of the specimen is rigid, the vertical and lateral strains can be determined from the fracture displacements:
1,p = d1,p / L (15)
o,p = do,p / W (16)
where d1,p and do,p are the vertical displacement and lateral
displacement normal to the fracture strike, L is the specimen
length (87 mm), and W is the specimen width (50 mm). Table
2 gives the distortional and mean strain energy calculated for
the rough and smooth fractures. Note that the strain that is
parallel to the fracture strike is equal to zero because the test
configurations (loading platens) do not allow lateral displace-
ment in this direction.
Regression analysis of Equations 8 indicates that
equals to 4.78 for the rough fractures, and equals to 1.42 for the
smooth fractures (Figure 7). The proposed criterion fit well to
the test data with the correlation coefficient (R2) greater than
0.9. It implicitly incorporates the effects of stress ratio and
confining pressure on the fractures. The Wd obtained from the
rough fractures under high stress ratio is in the lower portion of
the curve. The mean strain energy can be related to the depth of
the fractures. The distortional strain energy represents the
deviatoric stresses that cause the shear displacement. The ratio
of Wd to Wm (or ) is probably governed by the roughness and
strength of the fracture asperities. The Wd-Wm curve of the
smooth fractures would represent the lower bound of the energy
required to shear the fractures.
From Equations 9 and 10 the Wd and Wm can be
written as (Jaeger et al., 2007):
Wd = 3G oct2 (17)
Wm = (9/2) K m2 (18)
where G and K are the shear and bulk modulus:
G = E / [2(1+)] (19)
K = E / [3(12)] (20)
where E is the elastic modulus, and is the Poisson’s ratio.
The slope of the Wd-Wm curve can be represented by:
Wd / Wm = (oct /m)2 [(12) / (1+)] (21)
P. Weingchanda et al. / Songklanakarin J. Sci. Technol. 41 (3), 669-678, 2019 675
Table 2. Distortional and mean strain energy densities for different p/o ratios.
Fracture
Types p/o
p (MPa)
o
(MPa)
d1,p
(mm)
do,p
(mm) 1,p
(milli-strain) o,p
(milli-strain)
Wd
(kPa)
Wm
(kPa)
Tension-Induced
Fracture
0
0 1 1.09 -0.33 12.53 -6.58 405.53 78.05
0 3 1.11 -0.34 12.76 -6.74 470.88 91.68
0 7 1.20 -0.38 13.79 -7.58 613.22 116.44
0 12 1.22 -0.39 14.02 -7.76 767.65 147.66
0 18 1.26 -0.41 14.48 -8.10 925.54 179.41
1
1 1 1.11 -0.36 12.76 -7.16 338.86 60.86
3 3 1.18 -0.39 13.54 -7.78 420.07 78.05
7 7 1.25 -0.43 14.37 -8.50 565.98 109.73
12 12 1.35 -0.48 15.52 -9.56 707.63 139.59
18 18 1.37 -0.49 15.75 -9.74 883.10 182.72
1.5
1.5 1 1.13 -0.39 12.99 -7.82 263.17 43.69
4.5 3 1.20 -0.43 13.79 -8.56 327.12 57.83
10.5 7 1.28 -0.47 14.71 -9.38 439.86 85.33
18 12 1.37 -0.52 15.75 -10.30 559.21 116.46
2
2 1 1.15 -0.41 13.23 -8.12 235.62 37.63
6 3 1.20 -0.43 13.79 -8.60 301.78 51.84
14 7 1.32 -0.49 15.17 -9.90 453.05 79.42
18 9 1.39 -0.53 16.02 -10.60 551.19 96.57
2.5
2.5 1 1.15 -0.42 13.22 -8.30 218.35 34.08
5 2 1.18 -0.43 13.56 -8.60 239.69 39.66
7.5 3 1.24 -0.46 14.25 -9.20 272.76 46.24
12.5 5 1.29 -0.49 14.83 -9.70 334.25 59.90
17.5 7 1.33 -0.51 15.29 -10.10 397.50 73.81
3
3 1 1.16 -0.43 13.38 -8.58 186.06 28.80
9 3 1.25 -0.47 14.31 -9.40 234.82 41.10
15 5 1.30 -0.49 14.94 -9.94 291.48 54.86
21 7 1.34 -0.52 15.40 -10.36 343.35 67.75
4
4 1 1.19 -0.45 13.68 -8.92 155.42 24.77
12 3 1.26 -0.48 14.43 -9.60 198.30 38.16
20 5 1.34 -0.52 15.34 -10.40 258.68 53.72
Smooth saw-cut surface
0
0 1 1.00 -0.05 11.49 -0.90 27.42 17.50
0 7 1.02 -0.24 11.72 -4.80 46.28 35.58
0 12 1.15 -0.36 13.22 -7.20 70.92 48.80
1
1 1 1.27 -0.13 18.14 -2.60 42.00 24.56
7 7 1.29 -0.36 14.83 -7.20 57.25 38.54
12 12 1.37 -0.51 16.71 -10.20 85.78 51.84
2
2 1 1.28 -0.14 14.71 -2.80 32.06 17.81
6 3 1.30 -0.19 14.94 -3.80 43.29 31.03
14 7 1.44 -0.38 16.55 -7.60 62.07 44.98
Equations 17 through 21 are based on the linear
elastic theory. From the assumption posed in the previous
section that the intact portion of the specimen is rigid. All
deformations measured during shearing can be taken as the
axial displacement (d1) and the lateral displacement (do) of the
fractures. The do/d1 is defined here as the lateral displacement
rate. The energy ratio (Wd/Wm) of the tested specimens can
therefore be approximated from the do/d1 as:
Wd / Wm = (oct
/m)2 [(1+2 do/d1) / (1 do/d1)] (22)
The (oct /m)2 function relates to the induced strains
required to reach the peak strength of the fractures. The [(1+2
do/d1) / (1 do/d1)] function, called here as displacement
function, relates to the fracture displacements. The octahedral
shear strain-to-mean strain ratio is plotted as a function of the
mean stress for all stress ratios in Figure 8a. The ratios increase
with the mean stress (or depth). A higher stress ratio leads to a
more plastic deformation of the fractures or less brittle
movement. The displacement functions are plotted as a
function of mean stress in Figure 8b. The diagram suggests that
the functions decrease when the confining pressures and the
stress ratios increase.

676 P. Weingchanda et al. / Songklanakarin J. Sci. Technol. 41 (3), 669-678, 2019
Figure 7. Distortional strain energy (Wd) at peak shears strength as
a function of mean strain energy (Wm).
Figure 8. Octahedral shear strain-to-mean strain ratio as a function of
mean stress (a), and displacement function as a function of
mean stress (b).
8. Discussion and Conclusions
Triaxial shear tests have been performed on rough
(tension-induced) and smooth (saw-cut) fractures in Tak granite
under confining pressures between 1 and 18 MPa with varying
lateral stress ratios from 0 to 4. The results indicate that the
rough fracture shear strengths decrease when the stress ratios
increase. The areas of the sheared-off asperities increase with
the confining pressure, as evidenced by the lower JRC values
measured from the post-test fractures. This results in the lower
dilation rates at the peak strength (Figure 4). The effects of the
stress ratio and confining pressure on the shear strengths of the
rough fractures can be well described by a power equation
(Equation 6). The equation can be used as a strength criterion
to determine the stability of engineering structures near ground
surface (e.g., foundations, slope embankments and tunnels)
where the applied shear and normal stresses and stress ratio are
known. It may not be appropriate for use as a predictive tool for
the fault movements where the needed stress components can
not be monitored accurately at depths.
An attempt has been made at deriving a criterion that
can be used to predict a shallow fault movement in the Tak
granite batholith. The distortional and mean strain energy
densities are calculated from the test results. Their linear
relation has implicitly incorporated the effects of lateral stress
ratio and confining pressure (Figure 7). The slope (δ) of the Wd-
Wm ratio is dependent of the fracture roughness and strength of
the asperities. Assuming that the rock adjacent to a fault is a
rigid body, and that all deformations are from the shear and
dilation within the fault. The energy ratio can be derived here
in terms of the shear strain-to-mean strain ratio and the
displacement function. The strain ratios increase with confining
pressure and stress ratio. The displacement functions decrease
as the pressure and lateral stress ratio increase. Their
components can be obtained from the on- or near- surface
measurements. This may allow estimating the strength of the
shallow faults in the Tak batholith by calculating the changes
of the energy ratios (or ) from the displacements monitored
along the fault line. In principle the measured energy ratios
along a fault line would slowly increase with time due to the
tectonic forces. The earthquake or seismic events will occur
when the energy ratio () reaches the criterion defined in Figure
7.
It is recognized that there are other factors governing
the fault strengths that are not studied here, for example pore
pressures, displacement rates, temperature and fracture/fault
roughness (Barton & Choubey, 1977; Belem et al., 2000;
Blacic, 1975; Crawford & Currant, 1981; Curran & Leong,
1983; Yeo et al., 1998). The effects of these factors may alter
the accuracy of the proposed equation, but they would not
change the main conclusions drawn here. The proposed strain
energy concept nevertheless is a precursory step toward the
prediction of the seismic activities caused by the movement of
shallow fault zones.
Acknowledgements
This research is funded by Suranaree University of
Technology and by the Higher Education Promotion and
National Research University of Thailand. Permission to
publish this paper is gratefully acknowledged.
P. Weingchanda et al. / Songklanakarin J. Sci. Technol. 41 (3), 669-678, 2019 677
References
Alexeev, A. D., Revva, V. N., Bachurin, L. L., & Prokhorov, I.
Y. (2008). The effect of stress state factor on fracture
of sandstones under true triaxial loading. Interna-
tional Journal of Fracture, 149(1), 1-10. doi:10.10
07/s10704-008-9214-6
ASTM D5607-08. Standard Test Method for Performing Labo-
ratory Direct Shear Strength Tests of Rock Speci-
mens Under Constant Normal Force. Annual Book of
ASTM Standards, Philadelphia: American Society
for Testing and Materials, Vol. 04.08, West Consho-
hocken, P.A: ASTM.
Barton, N. (1976). The Shear strength of rock and rock joint.
International Journal of Rock Mechanics and Mining
Science and Geomechanics Abstracts, 13(9), 255-
279. doi:10.1016/0148-9062(76)90003-6
Barton, N. (1982). Characterizing rock masses to improve
excavation design. Proceeding of 4th Congress inter-
national Association for Engineering Geology and
Environment, New Delhi.
Barton, N., & Choubey, V. (1977). The shear strength of rock
joints in theory and practice. International Journal of
Rock Mechanics and Mining Science and Geomecha-
nics Abstracts, 10(1-2), 1-54. doi: 10.1007/BF01261
801
Belem, T., Homand-Etienne, F., & Souley, M. (2000).
Quantitative parameters for rock joint surface
roughness. Rock Mechanics and Rock Engineering,
33(4), 217-242. doi: 10.1007/s006030070001
Blacic, J. D. (1975). Plastic-deformation on mechanisms in
quartz: the effect of water. Tectonophysics, 27(3),
271-294. doi:10.1016/0040-1951(75)90021-9
Brady, B. H. G., & Brown, E. T. (2006). Rock mechanics for
underground mining. Netherlands: Springer.
Cai, M. (2008). Influence of intermediate principal stress on
rock fracturing and strength near excavation bounda-
ries-insight from numerical modeling. International
Journal of rock Mechanics and Mining Sciences, 45,
763-772. doi:10.1016/j.ijrmms.2007.07.026
Colin, D. G., & Paul, R. K. (2012). IBM SPSS statistics 19 made
simple. New York, NY: Psychology Press.
Colmenares, L. B., & Zoback, M. D. (2002). A statistical eva-
luation of intact rock failure criteria constrained by
polyaxial test data for five different rocks. Inter-
national Journal of Rock Mechanics and Mining
Sciences, 39, 695-729. doi:10.1016/S1365-1609(02)
00048-5
Crawford, A. M., & Currant, J. H. (1981). The influence of
shear velocity on the frictional resistance of rock
discontinuities. International Journal of Rock
Mechanics and Mining Science and Geomechanics
Abstracts, 18(6), 505-515. doi:10.1016/0148-9062
(81)90514-3
Curran, J. H., & Leong, P. K. (1983). Influence of shear velocity
on rock joint strength. Proceeding of International
Society for Rock Mechanics and Rock Engineering,
A235-A240.
Fenton, C. H., Charusiri, P., & Wood, S. H. (2003). Recent
paleoseismic investigations in Northern and Western
Thailand. Annales Geophysicae, 46(5), 957-981. doi:
10.4401/ag-3464
Fuenkajorn, K., & Kenkhuntod, N. (2010). Influence of loading
rate on deformability and compressive strength of
three Thai sandstones. Geotechnical and Geological
Engineering, 28, 707-715. doi:10.1007/s10706-010-
9331-7
Fuenkajorn, K., Sriapai, T., & Samsri, P. (2012). Effect of
loading rate on strength and deformability of Maha
Sarakham salt. Engineering Geology, 135-136. doi:
10.1016/j.enggeo.2012.02.012
Haimson, B. (2006). True triaxial stresses and brittle fracture of
rock. Pure and Applied Geophysics, 163, 1101-1113.
doi:10.1007/s00024-006-0065-7
Haimson, B., & Chang, C. (2000). A new true triaxial cell for
testing mechanical properties of rock and its use to
determine rock strength and deformability of Wester-
ly granite. International Journal of Rock Mechanics
and Mining Sciences, 37(1-2), 285-296. doi:10.1016/
S1365-1609(99)00106-9
Haimson, B., & Rudnicki, J. W. (2010). The effect of the inter-
mediate principal stress on fault formation and fault
angle in siltstone. Journal of Structural Geology,
32(11), 1701-1711. doi:10.1016/j.jsg.2009.08.017
Jaeger, J. C., Cook, N. G. W., & Zimmerman, R. W. (2007).
Fundamentals of rock mechanics. Malden, MA:
Blackwell Publishing.
Kapang, P., Walsri, C., Sriapai, T., & Fuenkajorn, K. (2013).
Shear strengths of sandstone fractures under true tria-
xial stresses. Journal of Structural Geology, 48, 57-
71. doi:10.1016/j.jsg.2012.12.007
Kemthong, R., & Fuenkajorn, K. (2007). Prediction of joint
shear strengths of ten rock types using field-identified
parameters. Proceedings of Rock Mechanics, 195-
209.
Kleepmek, M., Khamrat, S., Thongprapa, T., & Fuenkajorn, K.
(2016). Displacement velocity effects on rock frac-
ture shear strengths. Journal of Structural Geology,
90, 48-60. doi:10.1016/j.jsg.2016.07.007
Lane, K. S., & Heck, W. J. (1964). Triaxial testing for strength
of rock joints. Proceedings of the 6th U.S. Symposium
on Rock Mechanics (USRMS), Rolla, Missouri, 98-
108.
Li, B., Jiang, Y., & Wang, G. (2012a). Evaluation of shear
velocity dependency of rock fractures by using re-
peated shear tests. Proceeding of 12th ISRM Con-
gress, Harmonising Rock Engineering and the Envi-
ronmental, 699-702.
Li, Y., Wang, J., Jung, W., & Ghassemi, A. (2012b). Mecha-
nical properties of intact rock and fracture in welded
tuff from Newberry volcano. Proceeding of Thirty-
seventh Workshop on Geothermal Reservoir Engi-
neering, Standford University, Standford, California.
Morris, A. P., & Ferrill, D. A. (2009). The importance of the
effective intermediate principal stress 2 to fault slip
patterns. Journal of Structural Geology, 31(9), 950-
959. doi:10.1016/j.jsg.2008.03.013
Odedra, A., Ohnaka, M., Mochizuki, H., & Sammonds, P.
(2001). Temperature and pore pressure effects on the
shear strength of granite in the brittle-plastic
transition regime. Geophysical Research Letters,
28(15), 3011-3014. doi:10.1029/2001GL013321
678 P. Weingchanda et al. / Songklanakarin J. Sci. Technol. 41 (3), 669-678, 2019
Ohnaka, M. (1995). A shear failure strength law of rock in the
brittle-plastic transition regime. Geophysical
Research Letters, 22(1), 25-28. doi:10.1029/94
GL02791
Rodklang, K., Khamrat, S., & Fuenkajorn, K. (2015). Effects
of temperatures on strength and deformability of Tak
granite. KKU Research Journal, 20(3), 272-284.
Rosso, R. S. (1976). A comparison of joint stiffness measure-
ment in direct shear, triaxial compression, and in situ.
International Journal of Rock Mechanics and Mining
Sciences and Geomechanics Abstracts, 13(6), 167-
172. doi:10.1016/0148-9062(76)91282-1
Stesky, R. M. (1978). Rock friction-effect of confining
pressure, temperature, and pore pressure. Pure and
Applied Geophysics, 116(4), 690-704. doi:10.
1007/BF00876532
Yeo, I. W., De Freitas, M. H., & Zimmerman, R. W. (1998).
Effect of shear displacement on the aperture and
permeability of a rock fracture. International Journal
of Rock Mechanics and Mining Sciences, 35(8),
1051-1070. doi:10.1016/S0148-9062(98)00165-X


![PROGRAMME OF ACTIVITIES - Malaysian … Edwin Jerd T. Siatan & Jose Fernando C. Syquia 9:00 Orthogeriatrics: Is this a Different Ballgame? [Tak-Wing Lau] 9:20 Common Acetabular Fractures:](https://img.pdfslide.us/doc/110x75/5aa487f37f8b9ae7438c398a/programme-of-activities-malaysian-edwin-jerd-t-siatan-jose-fernando-c-syquia.jpg)